Submitted:
16 November 2024
Posted:
19 November 2024
You are already at the latest version
Abstract
What are the shapes of diversity with respect the shapes of the city? How those shapes can inform about the ecological fitness and guide the enhancement of a city? Can we detect sentinels for the ''wing of change''? Eco-climatically sensitive species carry information of envionmental change in their distribution, fitness, and preferential gradients of the habitat suitability that is largely linked to the hydrological stress. Conversely, environmental features outside of these species' niche convey information of potential extreme climate to mitigate.
Here we propose a model, as a proof of concept and paradigm, to extract the multivariable functional networks and their attraction basins carrying the signature of compounding hydroclimatic pressure on species fitness. Specifically, we consider butterflies and their habitat suitability (HS) to infer maximum suitability gradients that are meaningful of potential species flows with the least resistance within an ecosystem and sentinels of climate stress. These flows are compared to the distribution of urban parks to identify their ecological attractiveness for species, observed and potential connectivity, and park potential to reduce hydroclimatic impacts. Results are shown for the city of Shenzhen that is one the most quickly developing and green cities per population size worldwide. Ecoflow networks are much more extended, scale-free, and clustering for low HS gradient areas populated by large reservoirs that act as sources of ecological corridors ''draining'' into urban parks. Parks have higher HS and gradients, and small-world connectivity that does not overlap with hydrological networks.
We find diverging patterns of abundance and diversity increasing and decreasing with HS where the latter is largely determined by temperature and precipitation of the coldest quarter, and seasonality, which are critical fetaures of the hydrologic cycle that is worrisomely changing worldwide. Interestingly a U-shape pattern is found between abudance and diversity, similarly to the one in natural ecosystems. Additionally, both abundance and diversity are mildly associated with park area according to a power function, unrelated to longitude but related to the degree of urbanization/park centrality (due to isolation in rich parks) counterintuitively.
Ecological patterns such as the Preston plot and abundance rank can reflect the stationarity of ecological communities (and their divergence) but cannot be informative about the community connectivity and fitness. The maximum HS gradients are meaningful of potential species flows and eco-change. Those, within their attraction basins, can inform about the collective function of ecological communities, like parks in cities. More importantly, flows as distributed stress-response of species are the blueprint for the design of ecotone networks along hydrologic corridors, regulating temperature and evapotranspiration, connecting communities and mitigating climate-driven eco-shifts locally and butterfly effects at larger scales.

Keywords:
butterflies
; urban ecosystems
; habitat suitability
; ecological flows
; attraction basins
1. Introduction
1.1. Butterflies as Indicators of Urban Ecosystem Fitness Forced by Climate Stress
Can we use ecological patterns to assess the ecosystemic fitness of a city? Can we use sensitive species to human-driven ecohydrological change for evaluating the performance of the natural and built environment such as urban parks? Can we infer these species eco-flows and their convergence with ecohydrological corridors for optimizing the ecosystem design? Are these flows early sentinels of climate stress? Shapes of ecological patterns are a reflection of climate stressors. In this perspective, we aim to propose a conceptual model to untangle the key network features of ecological patterns (eco-flow topology and motifs) and attribute their variability ot the underlying environmental determinants (climatic) contrained to ecohydrological corridors in cities.
Minimum resistance networks (or maximum informaiton flow in the Optimal Infomation Network model of Servadio and Convertino [1] and Li and Convertino [2]) along the maximum gradient of a multicriteria function (defining habitat suitability) allow ones to identify networks where species can spread (as ”waves”) in a comfortable climate range. The flow on these networks is related to the accumulation of the minimum resistance and can inform about an area attractiveness for species. We seek for a temperature range that is very similar to the one for humans [3] and the question is whether species-related multicriteria climate waves (or of any other climate sensitive species) coincide with ecohydrological corridors. Based on the questions, and the idea of using species as eco-environmental indicator of suitable habitats for humans, we analyze the situation in Shenzhen, that is one of the largest and rapidly changing megalopolis worldwide. Specifically, we consider butterflies as optimal eco-indicators of ecological community fitness and optimal temperature range. In addition to ecological flows, we analyze how macroecological features – such as abundance and diversity (intended as species richness in this paper) – arise from the distribution of ecological flows and corridors (including longitudinal gradients reflecting urbanization trends and enviornmental protection) and how this information can be used for the assessment and design of urban parks or similar ”green/nature-based solutions” (e.g., green buildings, constructed wetlands, etc.). The assessment of urban parks is done via predicting the potential robust association between butterflies and climate features and analyzing that association conditional to urban parks.
Butterflies are potentially excellent eco-indicators for terrestrial ecosystems although they are largely under-reported, and not well considered through their dependencies with ecotones in between waterbodies and hillslopes or urban areas. This is in a broader ecohydrological view [4,5] where water networks is everywhere under different water compartments (such as soil moisture in drier habitats) and under different water stress due to climate and water use. Therefore, butterflies are extremely sensitive indicators of both hydroclimatic variability (conditional to park structure) and associated species populations. Yet, butterflies are a fingerprint of ecosytsem function (or dysbiosis vice versa) driven by the balanced species-climate interactions structured by ecohydrological proportions. As for species reporting, it is well known that biodiversity time series (of any species) are biased towards increasing species richness in changing environment [6]. This is both related to density-dependent effects (more species are found in decreasing areas), or more reporting is occuring whenever natural areas become closer to developed areas. Yet, absence of richness trends over time, can actually reflect a negative deviation from the positive biodiversity trend. Regardless of the limitation of data, species information, such as of butterflies, are useful in a broad predictive purpose. Pre-diction (literally meaning ”to mention beforehand” in Latin) are also useful for the potential identification of other new species, such as plants, and novel species interactions making up the habitat where butterflies exist. This is particularly important for urban parks that are made with exotic species which can potentially establish novel ecological niches for endemic butterflies.
1.2. A Structural Ecological Framework for Ecosystem Assessment and Design
Previous efforts have looked into butterflies and how theese species can cope with climate change [7], how they are affected by urbanization [8], or how species are perceived by people to guide conservation efforts [9,10,11,12,13]We provide a template for a model of eco-assessment and design based on Relative Species Abundance (RSA) data over space and time to infer ecological corridors and flows defining ecotones of ecosystems. The inference of ecological ties (corridors and flows) is based on assessing a multicriteria flow resistance (or habitat suitability vice versa) whose minimum gradient defines the preferential directions and flows of species. Specifically, firstly we use a MaxEnt model for predicting the species Habitat Suitability (HS) that is the opposite of the resistance surface. The retained environmental features, predicting butterfly climatic niche, are selected on their non-linear functional interactions. From there and ecohydro-based inferece of ecological ties (corridors and flows, their area of influence and convergence as ecotones) is done considering the maximum HS gradient underpinning patterns of HS, with particular attention to invariant and extreme changes.
The model of ecotie extraction is based on a more generic minimum sysyemic entropy/Transfer Entropy model (TE) developed by Servadio and Convertino [1] (later expanded into a broader ecological context by Li and Convertino [2]) that explored how species interaction networks sculpts biodiversity for the microbiome [9]. Maximum HS gradients are those with the largest TE representing the predictable extremes of HS patterns; these extremes are converging (as information) toward main pathways of ecological flows channeling collective behavior. Here, we propose a preliminary attemp to look into how these interactions play a role in shaping key species diversity and abudance in large scale urban ecosystems for their fitness assessment. Ecological flows are the fabric of species interactions mediated by their sensing of the environment where the distribution of the latter is defining how climate stress is distributed. Therefore, it is essential to consider ecoflows for engineering critical transitions via environmental determinants given the information of interconnected stress-response functions of species to climate pressure.
2. Materials and Methods: Digital Ecological Models
2.1. Data
The WorldClim data (https://www.worldclim.org/data/worldclim21.html) used in this study has a spatial resolution of 2.5 minutes (approximately 4.625 km). To calculate abundance and diversity, we utilized data from the Shenzhen City Butterflies Project (Project Code: SCBP; https://v4.boldsystems.org/index.php/Public_SearchTerms), which includes 1,933 butterfly records collected from 10 parks.
2.2. MaxEnt and Multiplex Resistance Landscape
MaxEnt was used as a multiplexing model to predict the habitat suitability of butterflies considering a set of Worldclim environmental layers. We applied the MaxEnt model (version 3.4.4) [10] – a neuro-inspired model of information selection and inference – to predict the distribution of butterflies (habitats) and their relationships with environmental factors on the basis of butterfly distribution data. This is the first time to our knowledge that MaxEnt is used to predict habitat distributions (assumed as butterfly communities) rather than species distributions; some species-specific applications were done in the past (e.g., see Chowdhury et al. [11]). MaxEnt identifies the main environmental factors affecting the distribution of butterflies and predicts their potential distribution under any climate scenarios. In doing so, MaxEnt begins with the ”neutral” hypothesis of fitting distributions as uninformed unform distributions and updates the predictions by selecting those non-uniform distributions with the largest information power. The environmental covariates are WorldClim variables for the current climate scenario as listed in Table 2.

Table 1.
Abundance and diversity of butterfly species in monitored parks in Shenzhen. Abundance is here considered as the number of butterfly of observations across all species. Park details are also about area, average habitat suitability, and center-mass coordinates.
Table 1.
Abundance and diversity of butterfly species in monitored parks in Shenzhen. Abundance is here considered as the number of butterfly of observations across all species. Park details are also about area, average habitat suitability, and center-mass coordinates.
| Park Name | Abundance | Diversity | Park Area | Average HS | GPS Coordinates |
|---|---|---|---|---|---|
| Donghu Park | 120 | 24 | 0.81 | 0.568403 | N22.588, E114.147 |
| Honghu Park | 167 | 15 | 0.59 | 0.759038 | N22.569, E114.12 |
| Huanggaong Shuangyong Park | 170 | 10 | 0.54 | 0.632936167 | N22.552, E114.059 |
| Lianhuashan Park | 285 | 25 | 1.28 | 0.632936167 | N22.577, E114.058 |
| Litchi Park | 172 | 19 | 0.28 | 0.8147355 | N22.546, E114.102 |
| Meilin Park | 181 | 33 | 0.12 | 0.3376485 | N22.573, E114.036 |
| Shenzhen Bay Leisure Greenway | 162 | 15 | 1.04 | 0.579639833 | N22.522, E114.021 |
| Shenzhen Central Park | 263 | 15 | 0.70 | 0.776961 | N22.551, E114.074 |
| Shenzhen University Park | 255 | 22 | 0.02 | 0.431 | N22.537, E113.931 |
| Tanglangshan Suburb Park | 158 | 36 | 41.09 | 0.168 | N22.574, E114.01 |
Table 2.
Hydroclimatological determinants of butterfly Habitat Suitability. The features of precipitation and temperature for the HS in Shenzhen, China, are listed considering their first order importance and interaction importance (considering all other variables as fixed and changing, i.e. Sobol total effect).
| Variable | Percent contribution | Permutation importance |
|---|---|---|
| BIO19: Precipitation of Coldest Quarter | 79.1 | 32.5 |
| BIO4: Temperature Seasonality (standard deviation ×100) | 6.5 | 18.6 |
| BIO11: Mean Temperature of Coldest Quarter | 5.2 | 37.2 |
| BIO6: Min Temperature of Coldest Month | 3.8 | 0.1 |
| BIO13: Precipitation of Wettest Month | 1.5 | 0 |
| BIO3: Isothermality (BIO2/BIO7) (×100) | 1 | 0.6 |
| BIO17: Precipitation of Driest Quarter | 0.8 | 0 |
| BIO9: Mean Temperature of Driest Quarter | 0.7 | 0 |
| BIO1: Annual Mean Temperature | 0.4 | 0 |
| BIO8: Mean Temperature of Wettest Quarter | 0.4 | 0 |
| BIO15: Precipitation Seasonality (Coefficient of Variation) | 0.3 | 0.5 |
| BIO5: Max Temperature of Warmest Month | 0.1 | 8.5 |
| BIO14: Precipitation of Driest Month | 0.1 | 0 |
| BIO7: Temperature Annual Range (BIO5 - BIO6) | 0.1 | 0 |
| BIO10: Mean Temperature of Warmest Quarter | 0 | 1.9 |
| BIO18: Precipitation of Warmest Quarter | 0 | 0 |
| BIO16: Precipitation of Wettest Quarter | 0 | 0 |
| BIO12: Annual Precipitation | 0 | 0 |
| BIO2: Mean Diurnal Range (Mean of monthly (max temp - min temp)) | 0 | 0 |
The habitat suitabilty (HS) (note that here we adopt a macroecological characterization of the probability [12], i.e. the average suitabilty of a community to host butterflies) is calculated as:
where is the probability density of covariates , and . is a normalizing constant that ensures that integrates to one ( being the probability density function (pdf) of the reef occurrences), and is the constant (Lagrangian multiplier) of the MaxEnt features [13,14,15,16]. The Lagrangian multiplier that multiplies all environmental features finds the optimal trade-off between model complexity (defined as the number of environmental variables used as predictors) and model accuracy (that is the distance between predictions and data) [12,16]. The set of parameters is identified by minimizing the prediction error between the observed and modeled floods. Features are transformations of the covariates in the covariate space and this allows a faster and more precise computation rather than operating in the geographical space [12,15].
To reduce model complexity without compromising performance, we built several models by varying the feature classes (FC) and regularization multipliers (RM) [17], using R 4.2.1 and the ”ENMeval” version 0.3.0 package[18]. FC determines the flexibility of the modeled response to predictor variables, while RM penalizes model complexity [19]. This model design is done to identify the most salient eco-environmental variables that have the highest value of information for the predicted patterns [20] constrained on reef occurrence and the imposed feature classes that establish the distribution of suitability around occurrences. We randomly divided occurrence records into 70% for the model selection (i.e., feature selection). ENMeval partitions the localities internally to test each combination of settings, so we used the random k-fold method to divide localities into four bins. We built models with three FC combinations (LQ, LH,and LQHP, where features are linear (L), quadratic (Q), hinge (H), and product (P)) and varied regularization multipliers (RM) values from 1.0 to 5.0 in increments of 1.0. The optimal models were selected using Akaike’s Information Criterion, which was corrected for small sample sizes (AICc = 0), this approach penalizes excessive model complexity and facilitates the selection of models with an optimal number of parameters[21].
2.3. Inference of Ecological Flow and Attraction Basins
In an ecohydrological perspective the preferential flow directions are defined by the steepest gradient of HS, that is the minimum resistance in the movement of species for any pixel. The model of ecotie extraction is based on a more generic Transfer Entropy model (TE) developed by Li and Convertino [2] and later expanded by Wang and Convertino [22] for scape-time forecasts. Maximum HS gradients are those with the largest TE because they have the largest divergence in habitat suitability along and acrosss the pathways in HS patterns. These pathways of HS converge as information to form ecological flows channeling collective behavior of the vast majority of species. Yet, maximum gradient pathways that are preferential pathways are defined as:
where is the pixel-defined distance, i.e. five arc minutes (about 9.2 km at the equator). The maximum gradient in HS, over HS as Digital Ecological Model (DEM), defines the minimum resistance pathways where species moves with the minimum metabolic consumption [23]. These flows, defined everywhere, are in principle bidirectional and with loops but flows of species are likely from low to high HS areas due to the search for higher quality habitats, and wearkly looping for the minimum energy principle [24]. The cumulated flow, similarly to the cumulated drainage area in hydrogeomorphology, is defined by the sum of all links upstream a point, as:
where are the upstream ecological fluxes beginning from for the source fluxes (i.e., one unit of species) and increasing downstream following the maximum gradient in Eq. 2. for communities/pixels that belong to OEN, otherwise . Here, we consider the top 80 and 20% (lower and upper thresholds) of ecological flows determined by Eq. 3 representing uncommon and preferential/extreme flows. Yet, Optimal Ecological Networks (OEN) can be defined as thresholded maximum gradient pathways as:
where is the threshold of significance for common and rare species flow. In an ecohydrological analogy the threshold is equivalent to the one that separate channalized and unchannalized (hillslope) flows in river basins. Note that here the fluxes can be calculated considering both directions, upstream and downstream along the maximum gradient pathways, due to the possibility species move in both directions but more likely from low to high suitability habitat, de facto establishing a movement bias where ecological sinks or attraction basins (like parks) act as attractors. The meaning of cumulated flow is reflecting the total relative magnitude of species flow in one location across the ecosystem considered. The precise information of RSA over time can be used by Transfer Entropy model to assess estimations of ecological flows that are not anchored into the maximum gradient assumption as in Li and Convertino [2].
The detection of eco-basin boundaries (defining basins or sinks, across basin divides, that attract species to similar climate variables), related to ecological flows are defined by the maximum divergence between flows diverging in opposite directions (in two or more basins) independently of the magnitude of the gradient of HS, where
where is the Kullback-Leibler divergence over and that are the flows defined by Eq. 3 with opposite directions, yet not belonging to the same networks. Equivalently, in a simpler geometrical definition basin divides are defined by the curvature of the HS (or first derivative of the gradient in Eq. 2) that is positive as:
The curvature of a drainage ridge is positive, meaning that flow diverges at the ridge into two different basins. Roughly speaking, the convex zones are hillslope-like zones. Instead, the curvature of a valley is negative, meaning that flow converges at the valley and eventually forms flows. These eco-basins are equivalent to subbasins in hydrology and compartmentalize flows into independent areas (eco-sinks), potentially. Eco-basin boundaries are then equivalent to drainage divides in river basins.
3. Results and Discussion
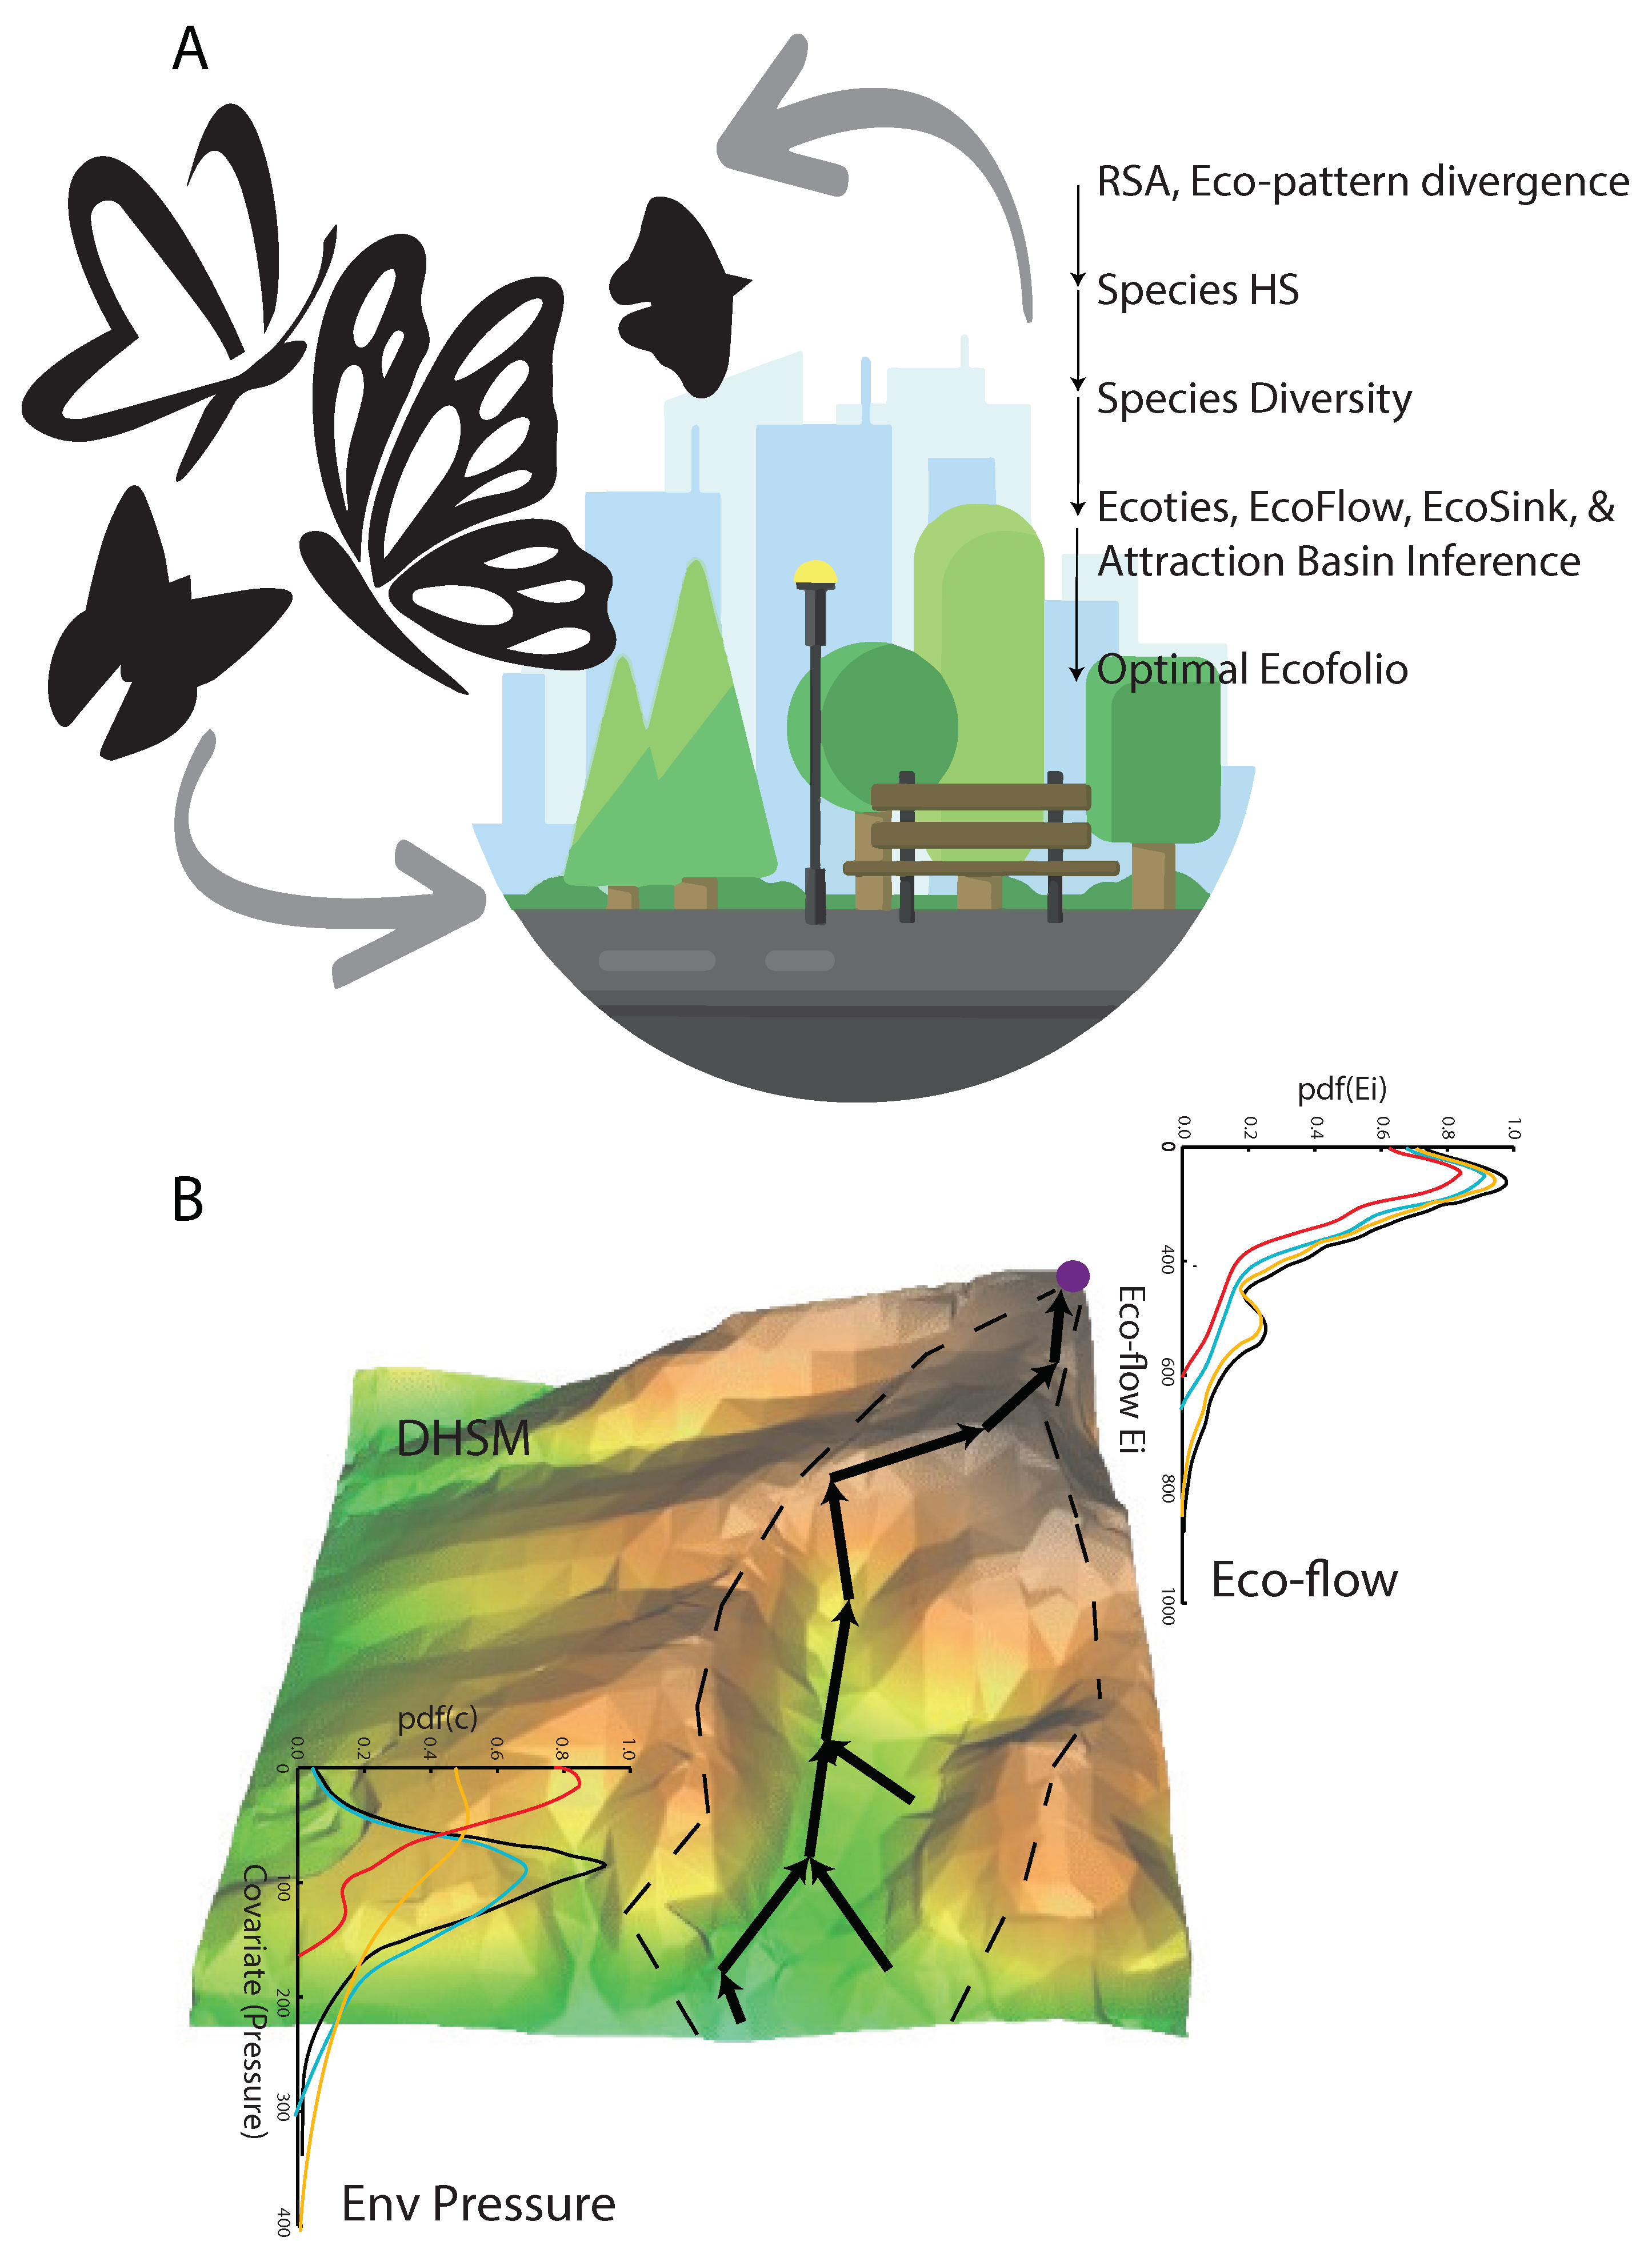
Butterfly phenomena are those where little shifts in one variable can lead to anomalous or extreme change (yet being informative) of another variable. In this framework we assume butterflies to change much more than the underlying environmental determinant such as climate and park variability. Yet, butterflies are a fingerprint of park fitness and response to climate pressure as well as, in a reverse causality perspective, very sensitive species to explore the impact of climate extremes to ecological communities in urban ecosystems. In Figure 1 we show the main ideas about how eco-information, in this case of butterflies, can act as a barometer of ecosystem fitness such as of urban parks, and then address ecosystem design. Diversity is here intended as species richness, that is the number of species in a given area, vs. diversity accounting for abundance which is a disputed indicator defining maximum diversity for evenly distributed species. Figure 1B shows the preferential pathways (as maximum gradients defined in Eq. 2) representing the convolution of compouding climate features onto species occurrence. Preferential flows (Eq. 3) are those with the highest predictability of HS across the ecosystems, yet the most important features species are sensitive to when moving in the landscape. The attraction basin of the network is identified by the positive curvature of HS areas. This framework can be used to define and assess ecological stress as a function of HS, gradient and accelleration.
The predicted HS and ecological flows are shown in Fig. 2A HS shows that the spatial predictability is very low, due to the extremely limited data over space, and concentrated in the historical core of the city, surprisingly. However, this is largely related also the monitoring bias that is highly concentrated into the core areas of the city where a variety of parks have been built. Another high HS area is in the East Dapeng area (red spot on the East side along the coastline) which is a natural area well maintained with very low development. The ecological flows in Fig. 2B, calculated as in Eq. 4 define five preferential pathways (with top 20% cumulated flows) that are relevant for butterflies and potentially other species, from low to high HS areas and pointing to major parks as attractors. The size of the cumulated flows is a measure of the importance/attractiveness of parks and it shows the speed of attractiveness based on the magnitude and rate of change of the HS gradient toward a point (that is the second derivative of HS over space). The purple points in Fig. 2B are connection points or final point of convergence of the prefential flows where the direction is from low to high HS along maxim gradients. The convergence of some of these purple points toward parks is a good indicator that parks act as connected ecological attractors; vice versa lack of convergence indicate a missing park or a corridor in the urban landscape considering the potential suitability driven by climate features. HS downscales climate pressure to the landscape where species are transformation functions. Then, HS is a Digital Ecological Model creating distributed maps of species from discrete occurrences, and flows allows us to trace routes of movement. Ranges of HS gradients identify areas of common dynamics, such the red and green high and low HS gradient in Fig. 2B. The former coincidens with high HS areas where parks are located, manifesting a high attractiveness for species and a confined existance of suitable communities. Outside of these areas a much lower suitability exists with likely minimum flow.
Attraction basins (eco-sinks or species basins) shown in Fig. 2C, defined by Eq. 5, are independent areas with similar eco-climatic niche including potential species movement. Inside each bains flows are converging and are independent as one network reflecting the accumlation of flows and divergence from other flows. The definition of these basins is really important for targeting areas of control and restoration. Figure 2C also shows that the clustering of ecoflows (black lines) is quite high for a varity of standing waterbodies (reservoir and lakes) but few flows are coinciding with the hydrologic network (streams and rivers of different orders). Interestingly, for Shenzhen, the ecoflow network has much more extended scale-free connectivity and clustering for low HS gradient areas (green areas), populated by large reservoirs, that act as sources of ecological corridors ”draining” into urban parks with higher HS, higher HS gradients, and small-world connectivity that is not overlapping with hydrologic networks. This may signify an ecological opportunity to connect these areas via vegetated ecological corridors along water courses in the city; an effort that is undergoing in the city of Shenzhen [25,26]. In Fig. 2C it is also possible to note that the hydrologic network does not overlap much with urban parks, and that is a suboptimal condition and a potential cause for the anomaly of patterns like the Preston plot in centrally located parks. Ecology cannot exist properly without hydrology, therefore it is ideal to have a substantial overlap of eco- and hydro-flows. According to the Clapeyron’s law, a 1 degree Celsius increase in temperature results in approximately a 7% increase in the amount of evapotranspiration/water vapor the air can hold. Therefore, even just an increase of 1.5 degree Celsius could result in ∼ 9% more water in the atmosphere, which could have a major impact on local storm systems and subsequent rainfall. That is why restoring vegetated ecotones is critical not only for butterflies but for climate regulation about which butterflies can be excellent sentinels of change (e.g. of evapotranspiration).
Figure 3 shows the response functions that are the HS probability conditional to hydroclimatological variables in isolation. We show the top five most important features whose non-linear interactions (as permutation importance in Table 2) predict the largest variability of HS. The response cuves values shaded in red are the tipping point of HS for the top five environmental determinants. Yet, those values lead to the largest changes in HS, where all transitions are of the second order, meaning they are gradual and not sudden. The most important variables, the Mean Temperature of Coldest Quarter (BIO11), and Precipitation of Coldest Quarter (BIO19) are increasing and decreasing HS gradually but quickly and determine the largest change in probability for HS. The importance of these climate variables is a reflection that butterflies are good sentinels of evapotranspiration. The associated response curves help to identify critical tipping points of temperature and precipitation that lead to major critical transitions, such as to .
The permutation importance of MaxEnt (Table 2) is based on directly disrupting the relationship between a feature and the target variable by randomly shuffling its values, while percentage contribution can be influenced by the optimization path taken during model training, making it potentially less consistent across different runs. permutation importance. This permutation importance depends only on the final MaxEnt model, not the path used to obtain it. The contribution for each variable is determined by randomly permuting the values of that variable among the training points (both presence and background) and measuring the resulting decrease in training AUC. A large decrease indicates that the model depends heavily on that variable. Values are normalized to give percentages. The percentage contribution depends on the path of the MaxEnt model and for highly correlated environmental variables, the percent contributions should be interpreted with caution. In order of importance considering permutation importance as high-order interactions, the key hydroclimatic factors in shaping HS are in order of importance: BIO11 = Mean Temperature of Coldest Quarter; BIO19 = Precipitation of Coldest Quarter; BIO4 = Temperature Seasonality (standard deviation ×100); BIO5 = Max Temperature of Warmest Month; and BIO10 = Mean Temperature of Warmest Quarter. Temperature and precipitation of the coldest quarter, and seasonality are the most important variables, underpinning the importance of critical features of the hydrologic cycle and its seasonal regularity. All these features are dramatically changing across the globe and yet compromising habitats and key species they support.
The relationship between abundance, diversity, and HS are shown in Fig. 4. Both abundance and diversity are mildy associated with park area according to a power function, unrelated to longitude but related to the degree of urbanization/park centrality (due to isolation in rich parks) counterintuitively. These two patterns are also showing trends that are not common in natural ecosystems where the species-are and abundance-area relationships are increasing non-linear functions. We also find: (i) a U-shape abundance-diversity pattern reflecting species heterogeneity and rarity of high diversity; (ii) and abundance and diversity increasing and decreasing as a power-law function with HS.
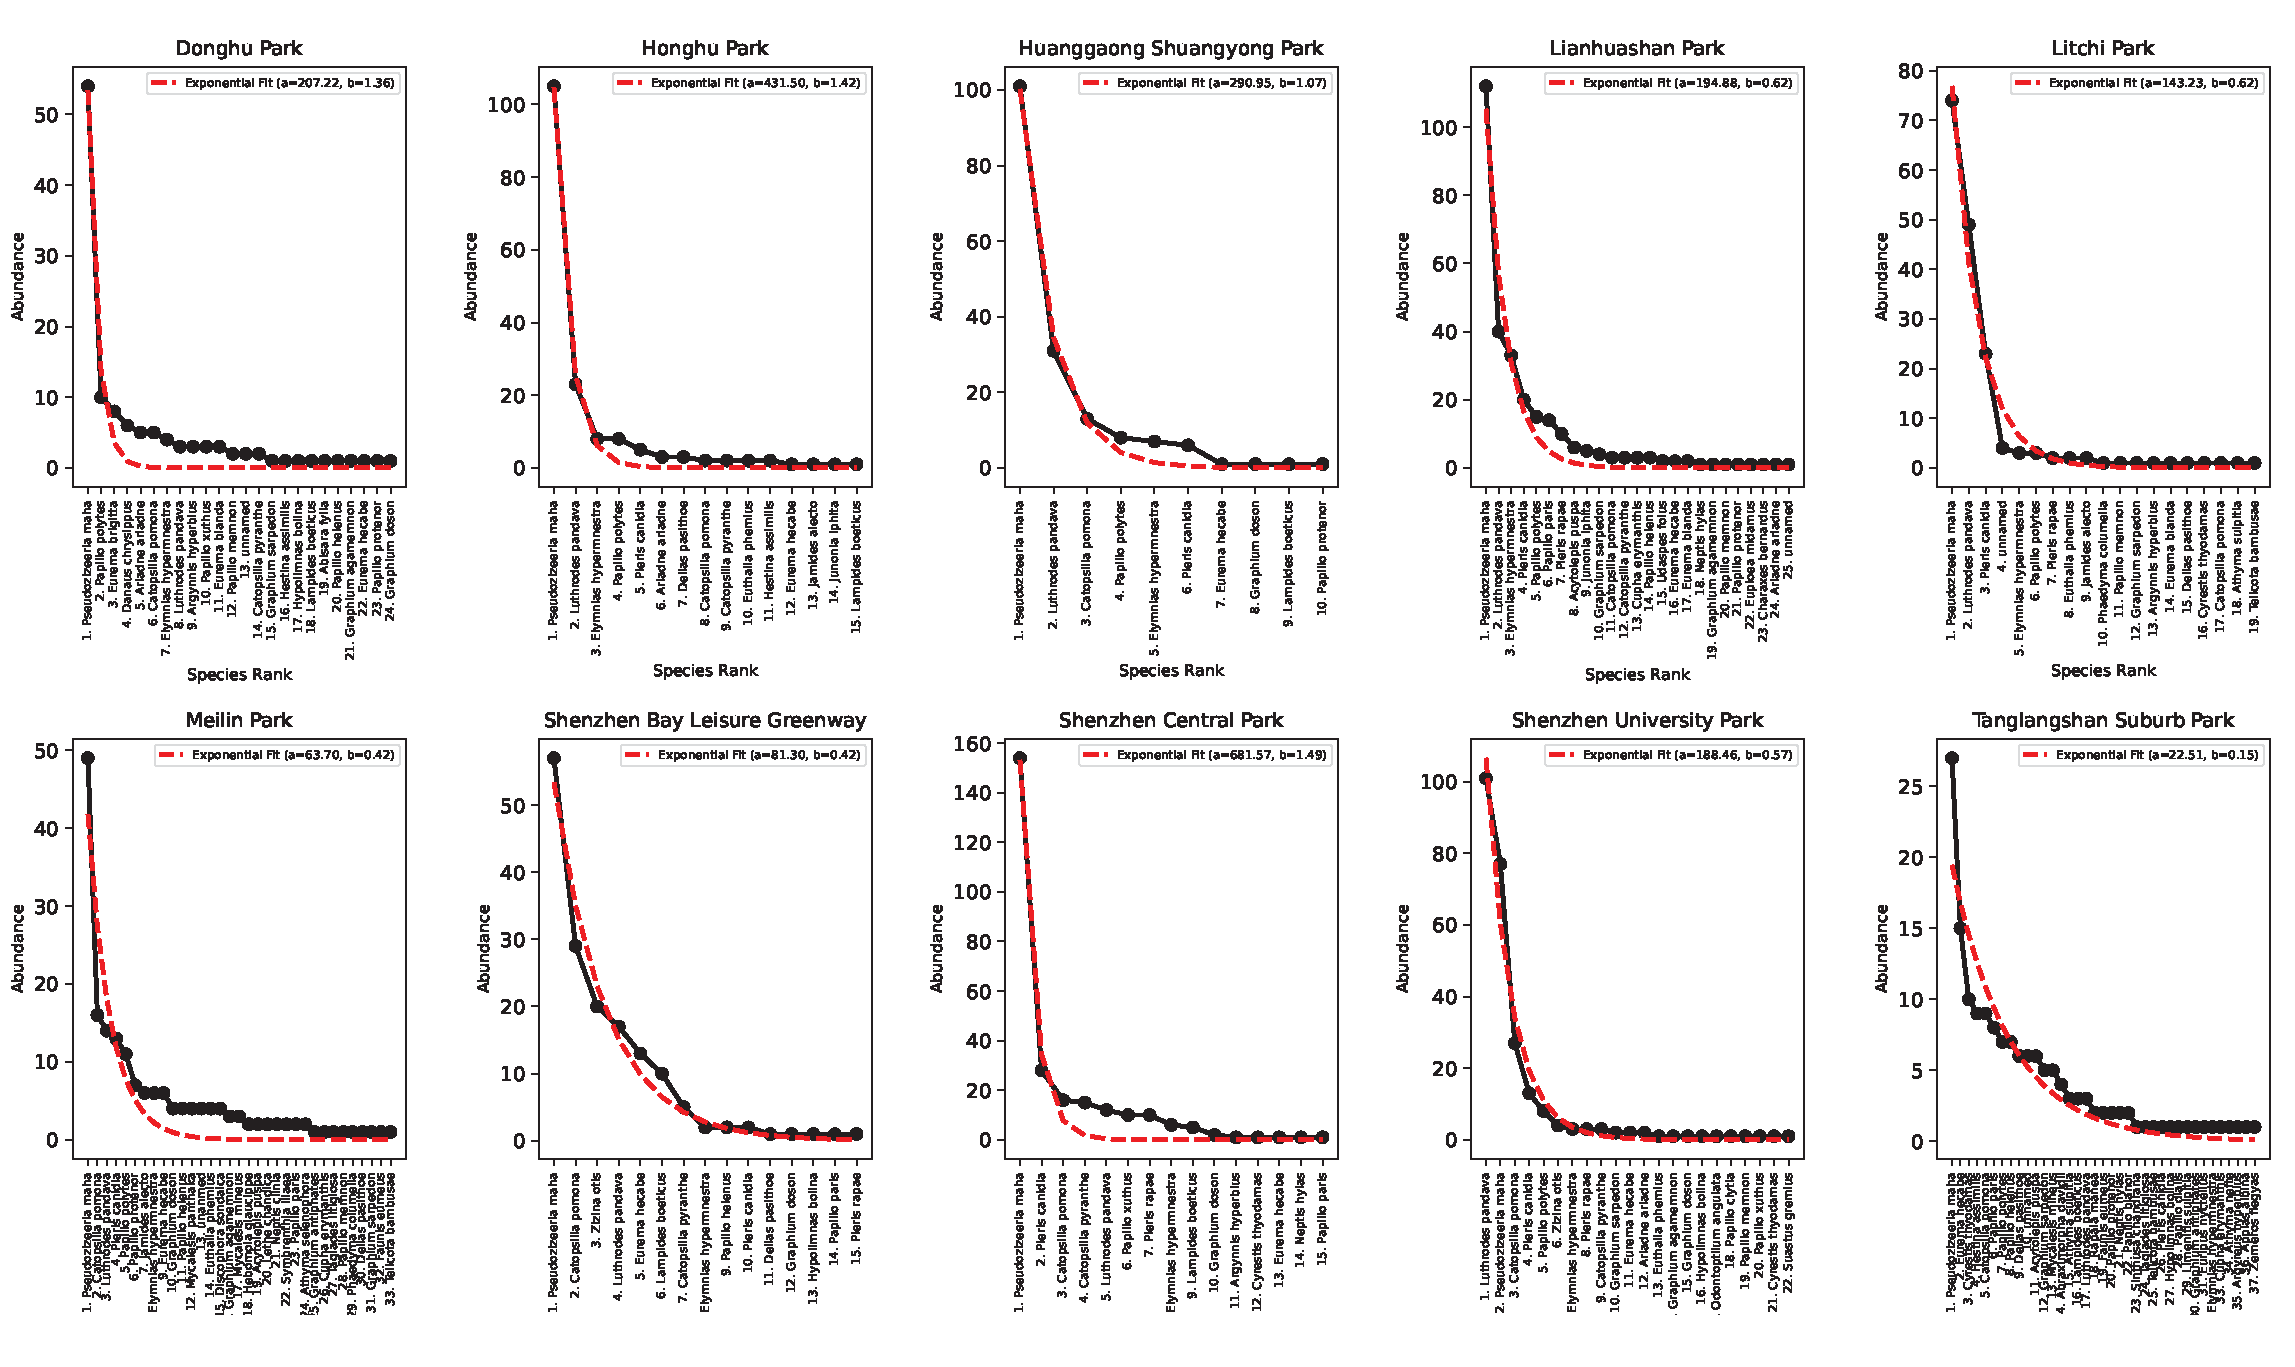
Figures 5 and 6 show the species-abundance Preston plots and the abundance-rank relationship for each park in Shenzhen. Ecological patterns such as the Preston plot and abundance rank can reflect the stationarity of ecological communities when they are lognormally or exponentially distributed per theoretical expectation reflecting an ideal distribution of species and abundance. However, the optimality of these patterns cannot be informative about the level of endemicity of parks, park proximity to change, and their relative connectivity.
Figure 2.
Butterfly habitat suitability, maximum gradient flows, and attraction basins. A. Habitat Suitability. B. Optimal Ecological Networks as stepeest gradients of HS after a threshold on the minimum flow. C. Attraction basins (eco-sinks) of converging flows with similar eco-climatic niche including potential species movement. Purple nodes are points where multiple connections exist and end points. Subbasins are nested areas with the whole ecosystems where one or more flows are jointly draining into one common point and any other flow cannot enter the subbasin.
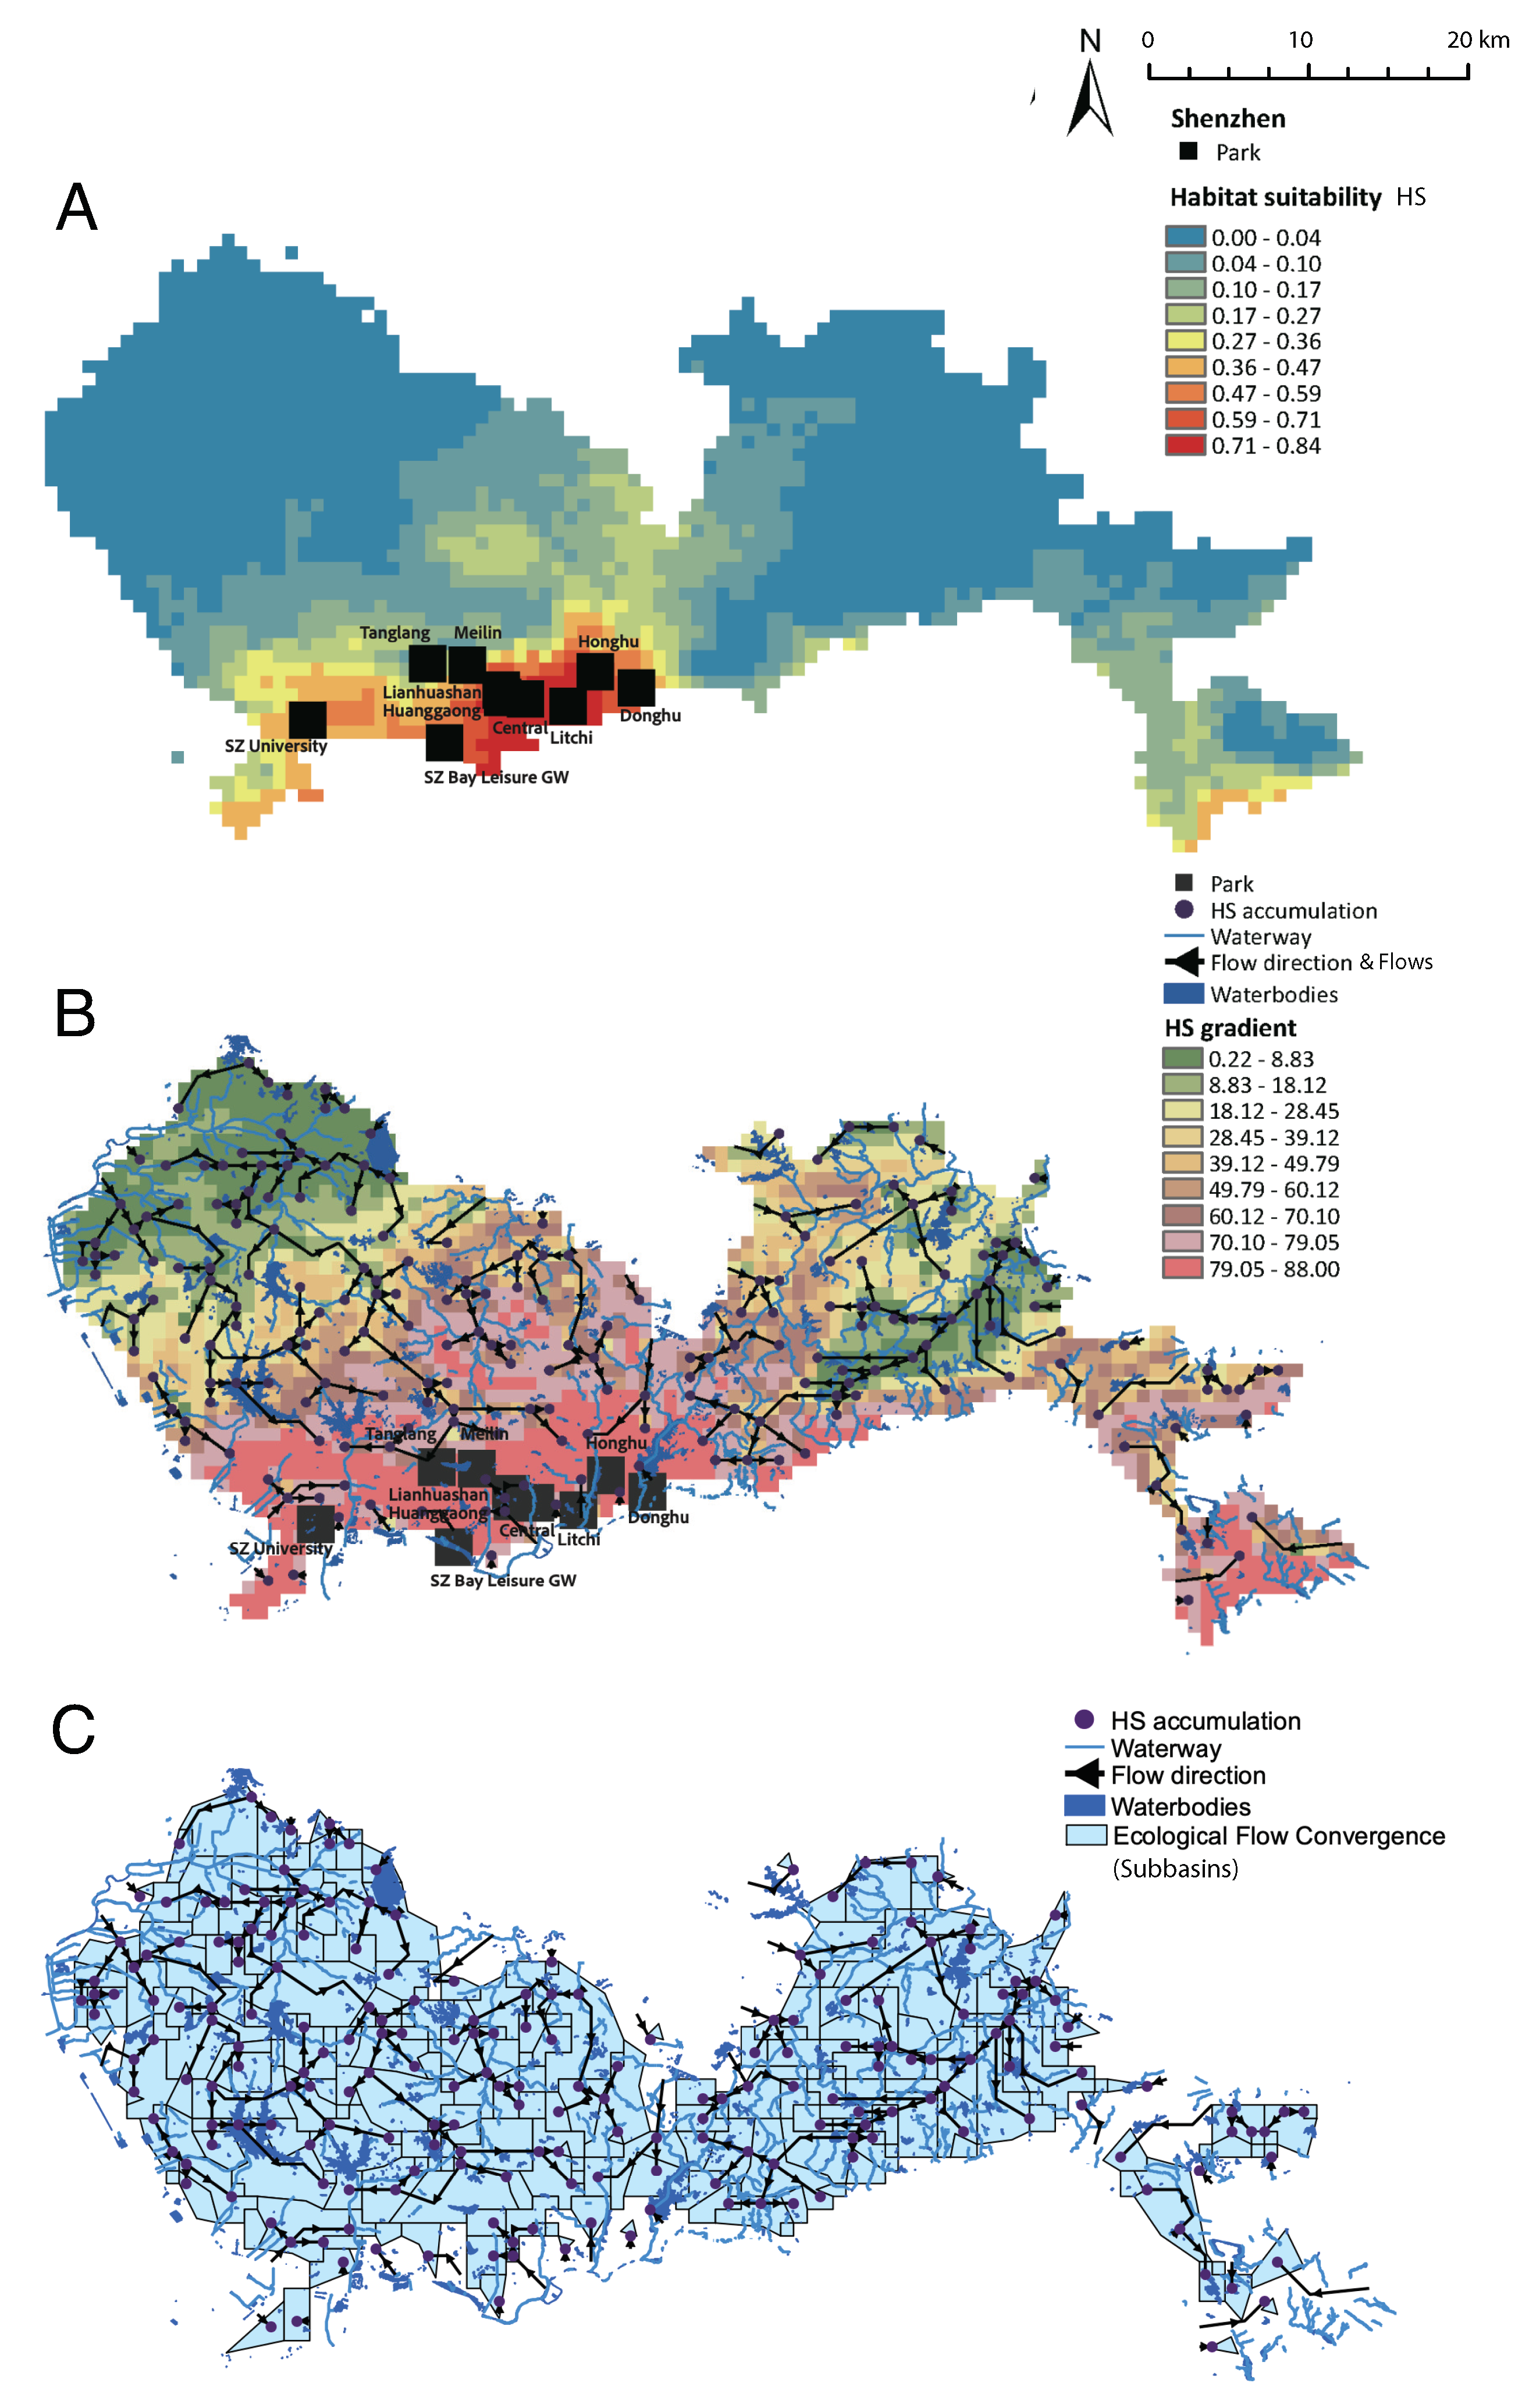
Figure 3.
Response curves as environment-ecology patterns of top 5 climatic features. The response curves are the conditional probability of HS as a function of WorldClim hydroclimatological variables in Table 2. The response cuves shaded in red are for the top five environmental determinants for butterfly HS (as permutation importance in Table 2). BIO11 = Mean Temperature of Coldest Quarter; BIO19 = Precipitation of Coldest Quarter; BIO4 = Temperature Seasonality (standard deviation ×100); BIO5 = Max Temperature of Warmest Month; and BIO10 = Mean Temperature of Warmest Quarter. In red the critical tipping points for each climatic features are highlighted. The blue areas are related to variability of predicted HS when sampling the climatic features.
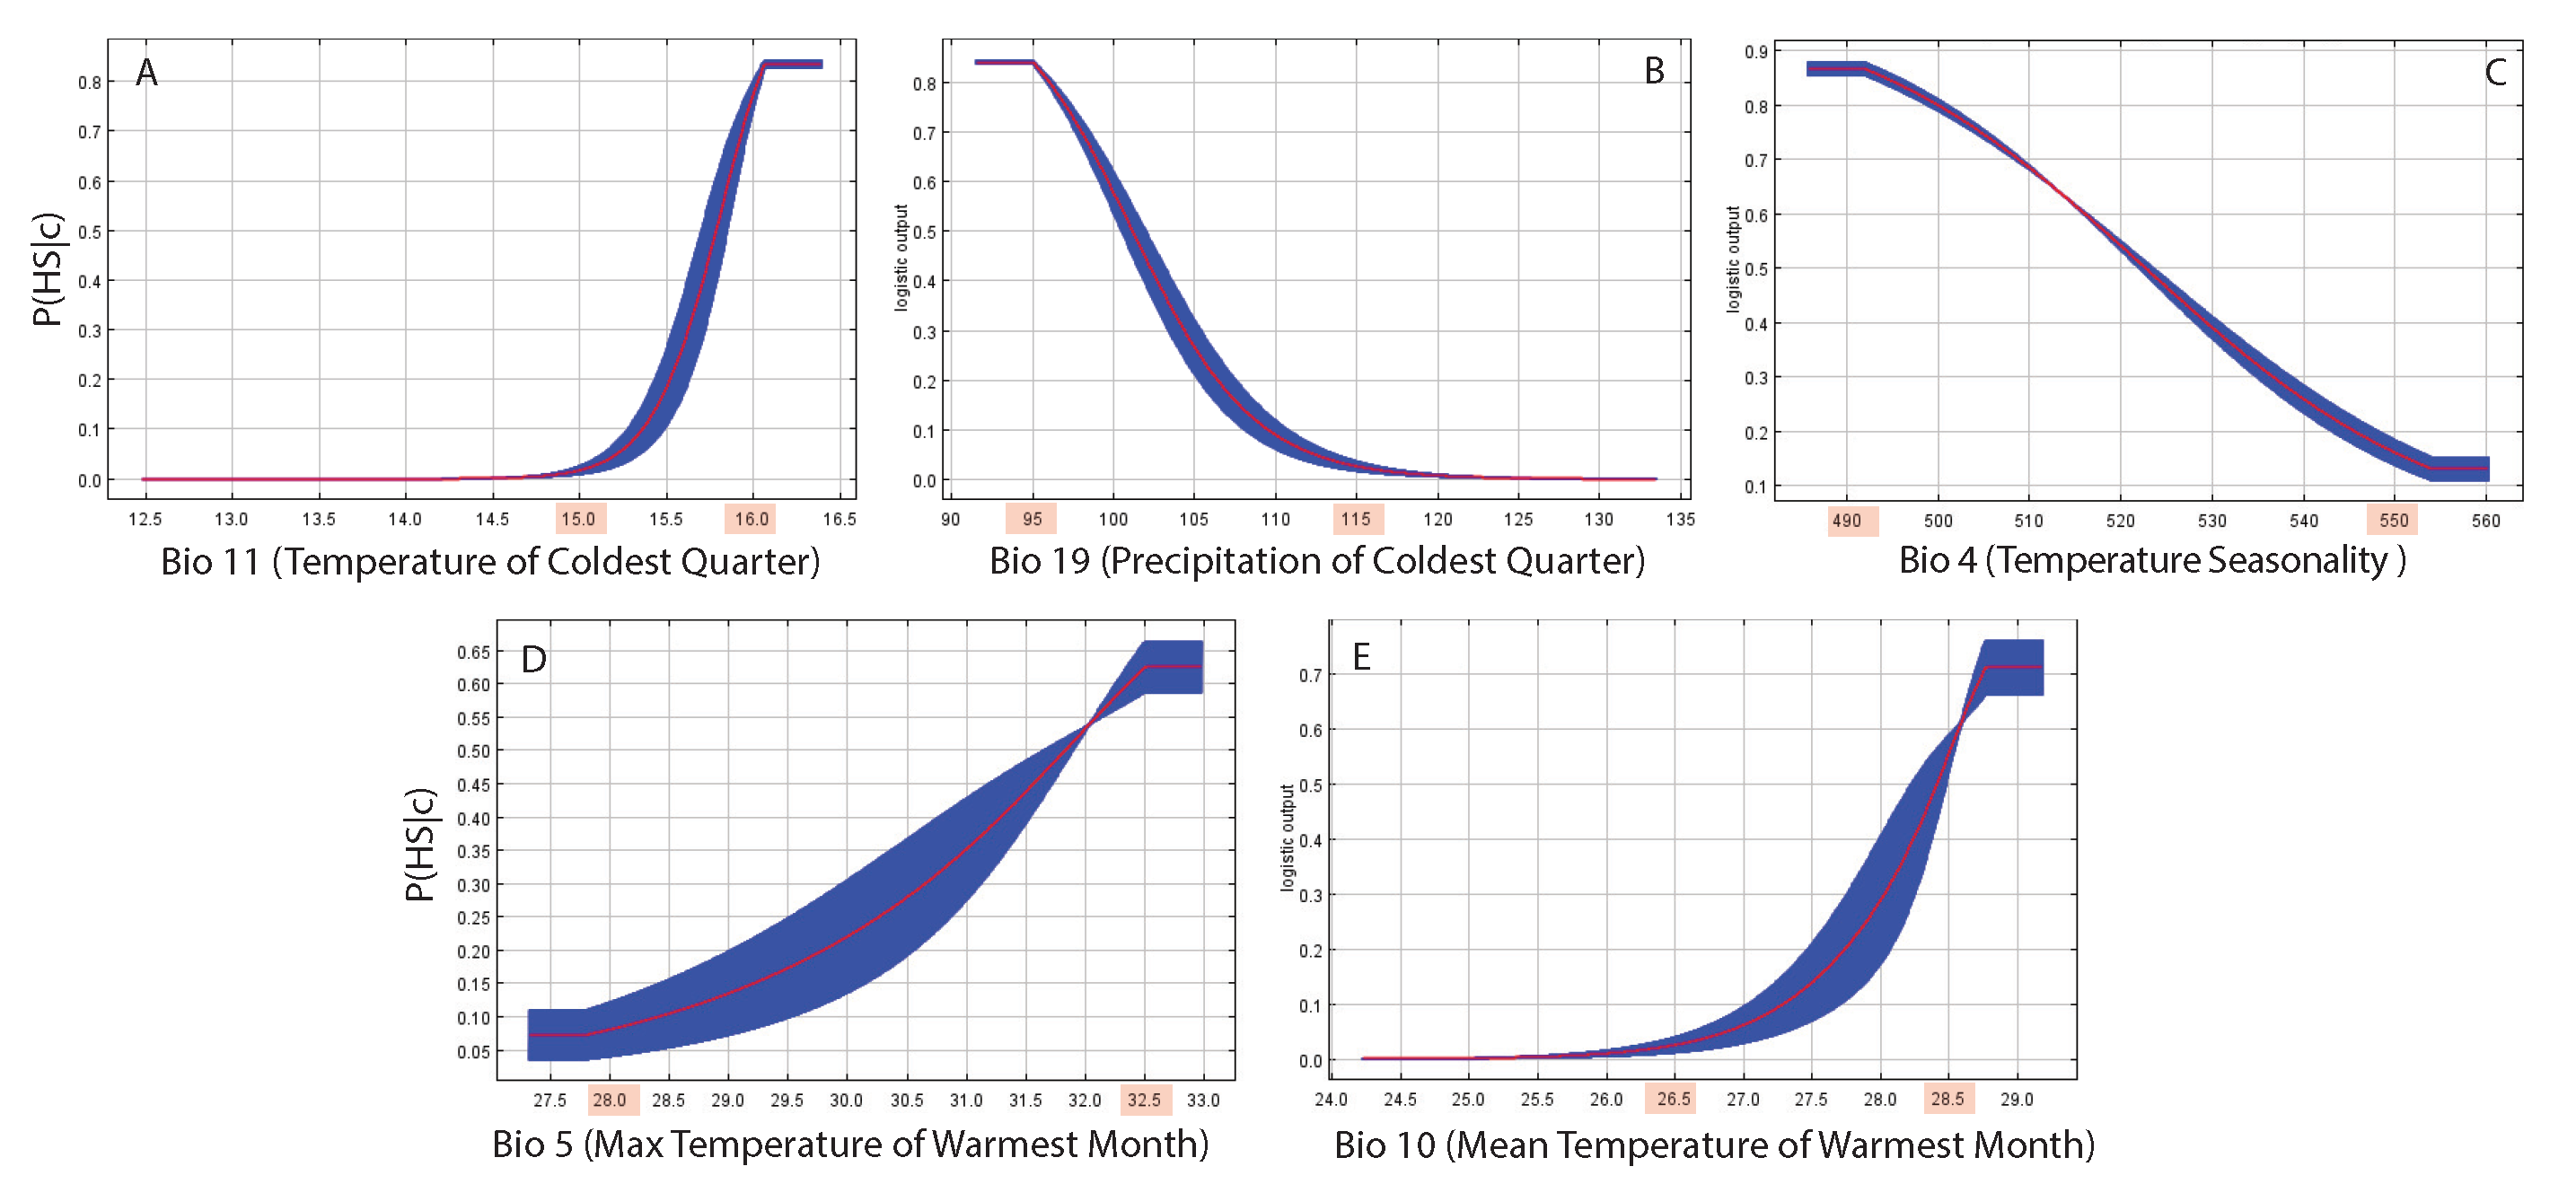
Figure 4.
Butterfly abundance and diversity patterns as a function of habitat suitability and area. A, B and C are abundance-diversity, abudance-HS and diversity-area patterns. D and E are abundance- and diversity-area patterns.
Figure 4.
Butterfly abundance and diversity patterns as a function of habitat suitability and area. A, B and C are abundance-diversity, abudance-HS and diversity-area patterns. D and E are abundance- and diversity-area patterns.
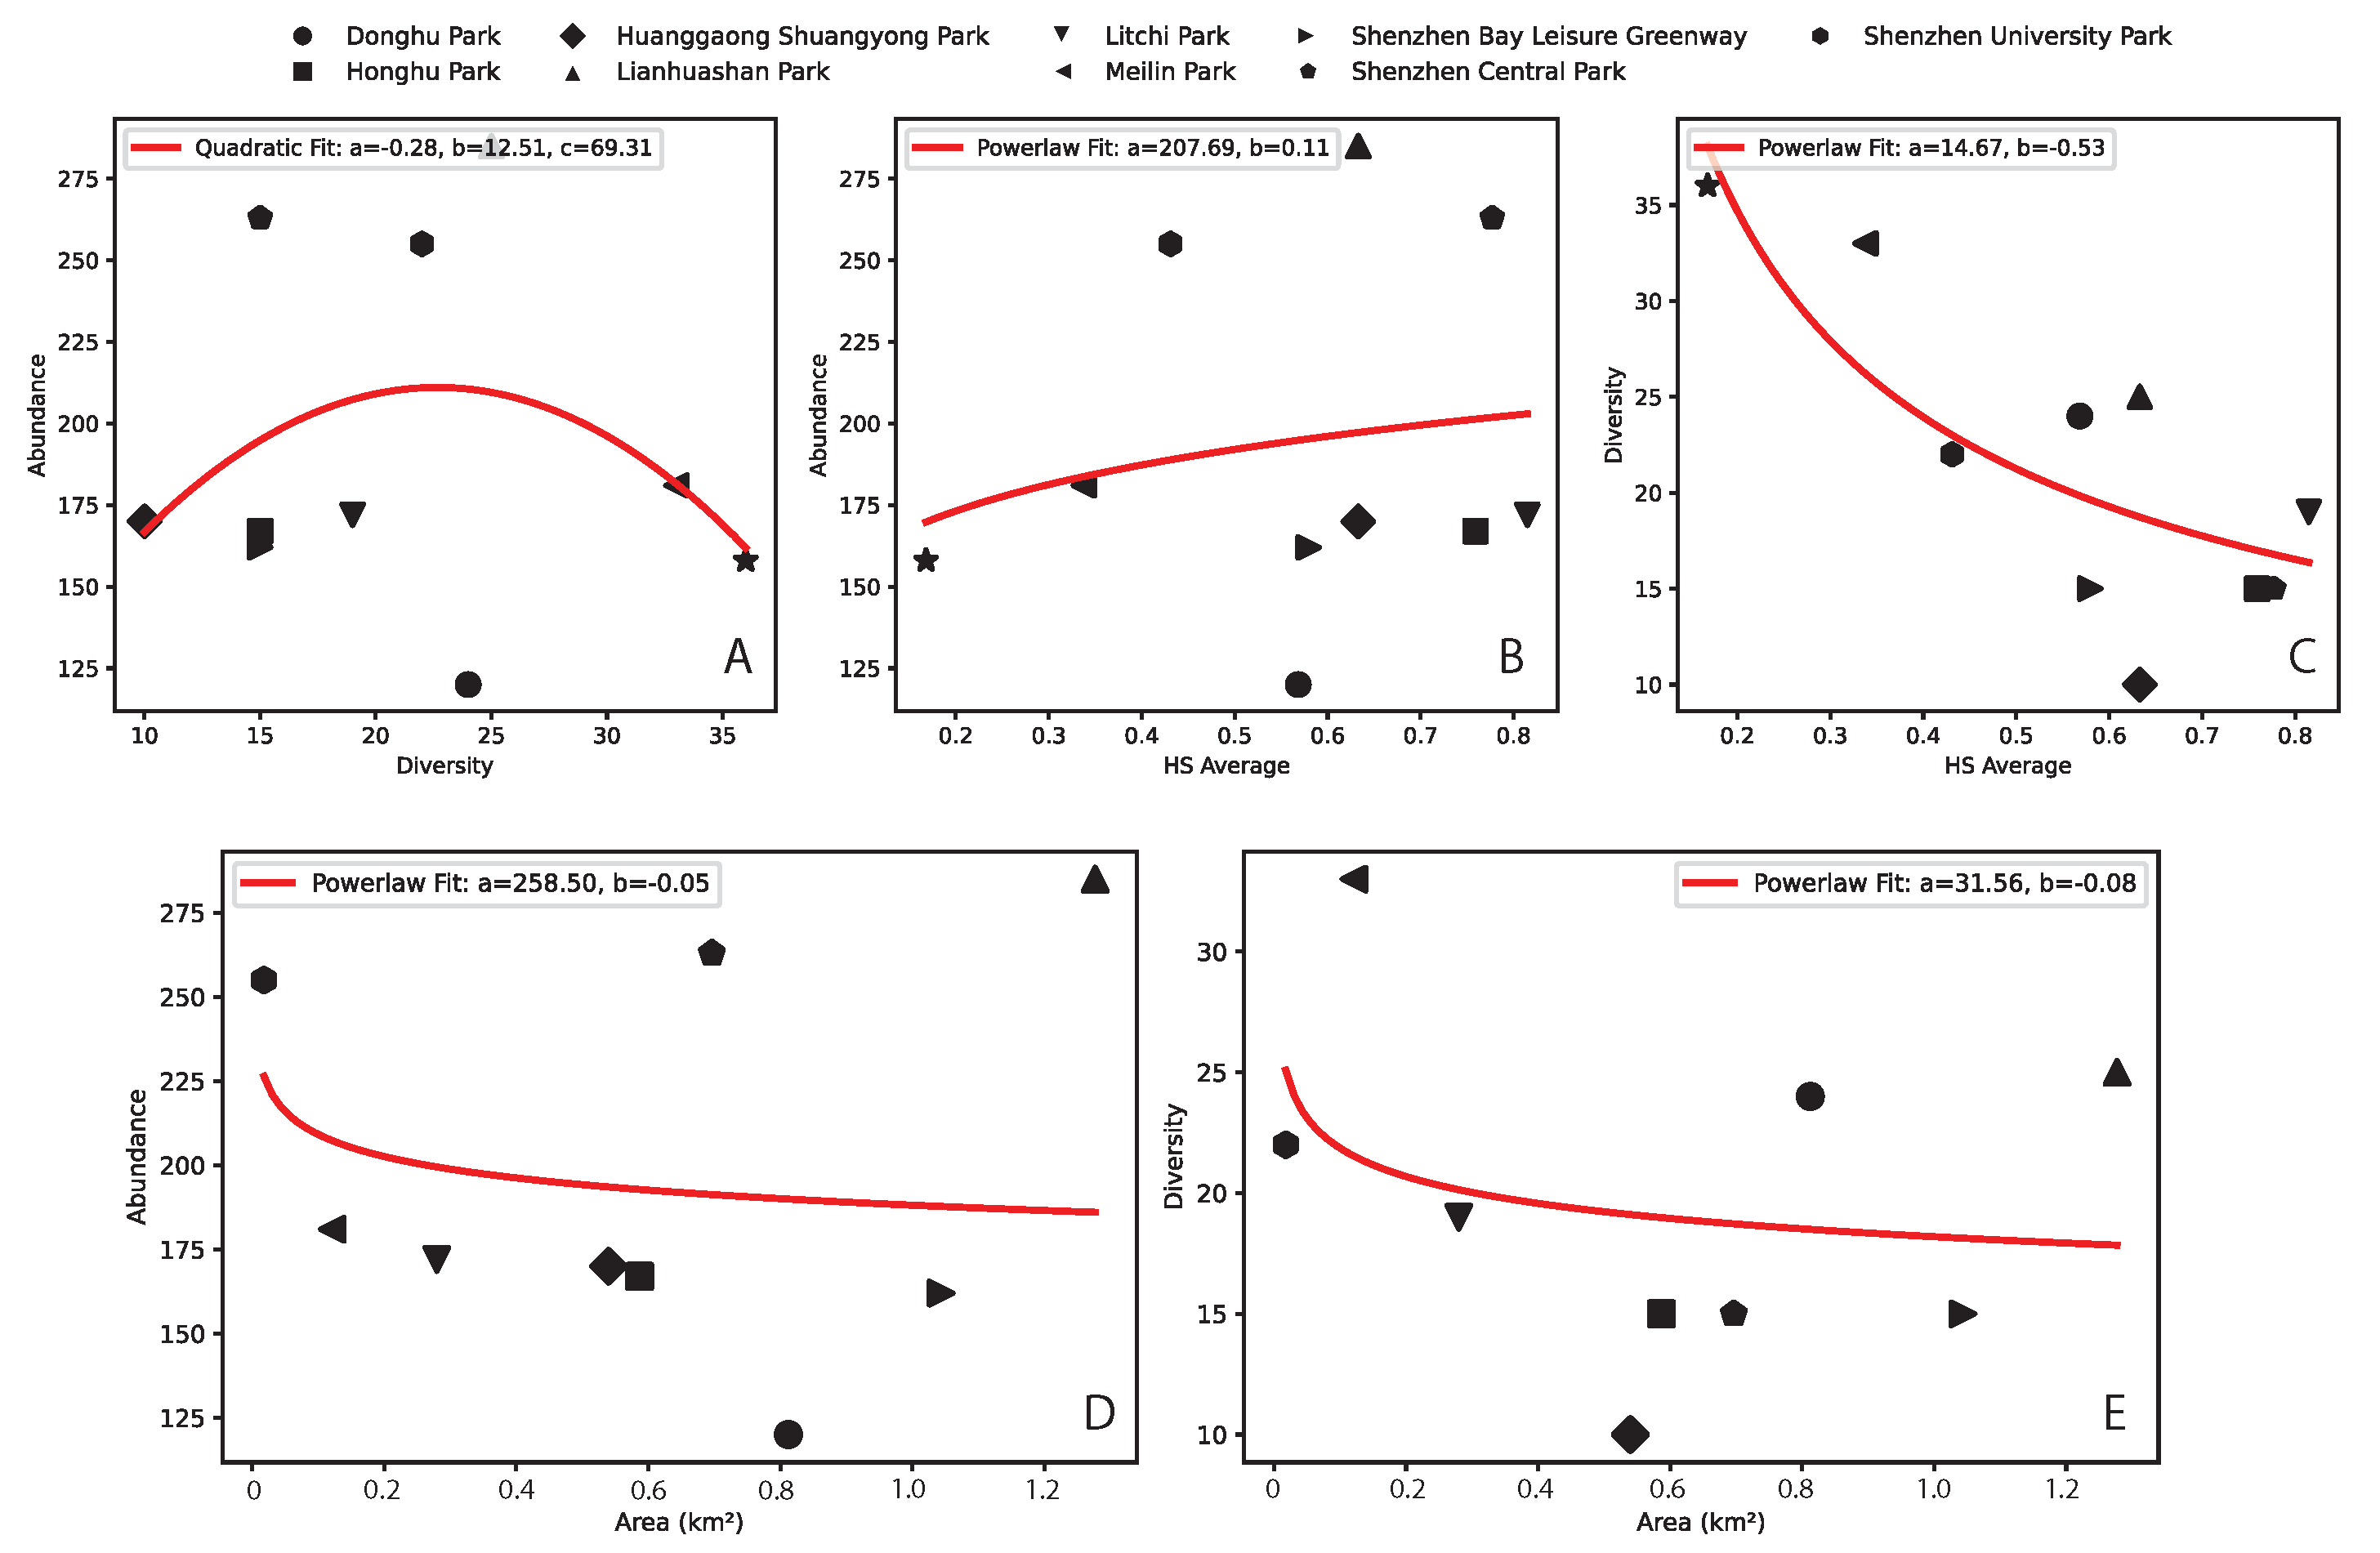
Figure 5.
Butterfly Preston plots for Shenzhen parks. In black the raw-data histograms are shown and in red the interpolating function connecting the maximum values for each abundance class. Honghu, Huanggaong, Shenzhen Central, and Shenzhen Bay Parks show an anomalous bimodal species-abundance pattern reflecting the non-stationarity of butterfly communities (potentially indicative of all ecological communities).
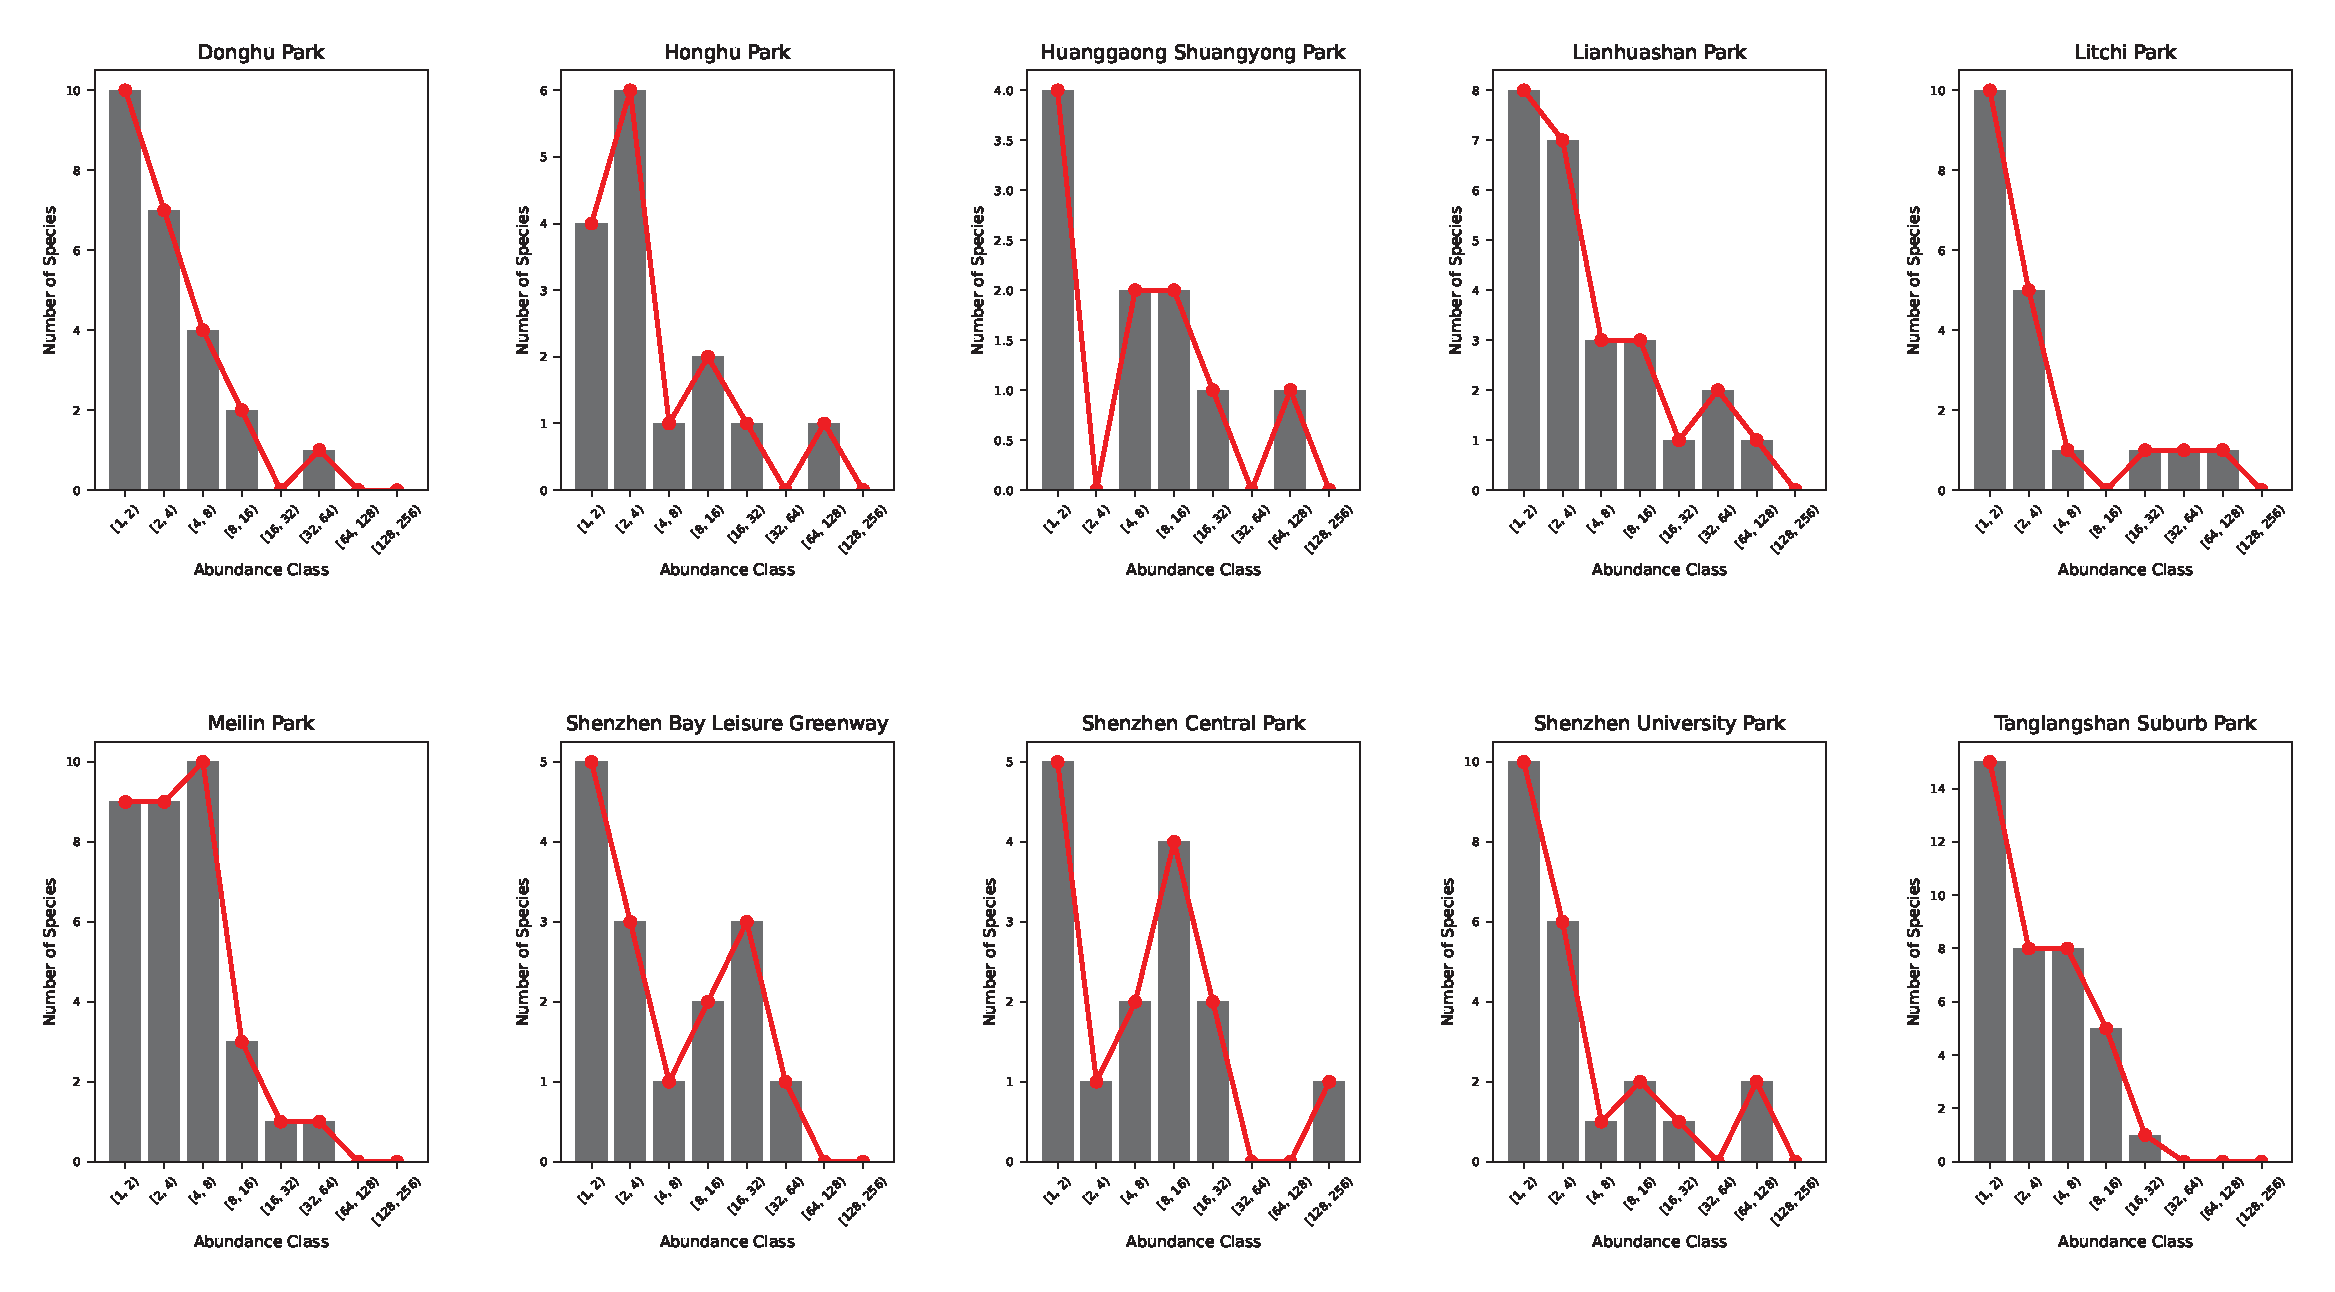
Figure 6.
Species-abundance rank patterns for Shenzhen parks. Pseudozizeeria maha is the most abundant species for all parks (except for Shenzhen University Park). Papilio polytes and Luthrodes pandava are also very abundant but diversity of butterflies is quite distinct for each park.
Figure 6.
Species-abundance rank patterns for Shenzhen parks. Pseudozizeeria maha is the most abundant species for all parks (except for Shenzhen University Park). Papilio polytes and Luthrodes pandava are also very abundant but diversity of butterflies is quite distinct for each park.
4. Conclusions
The analysis of species distribution and diversity in urban ecosystems (i.e., cities considering all assets) should be a top priority for ecosystem fitness assessment and decision-making about management, restoration, and development. This is particularly important for planning the future under extreme changes. The consideration of ecological networks reflecting the collective dynamics of key species is a non-neglectable factor for assessing community function in relation to the physical environment. In particular, accounting for hydrosphere-related ecological flows defines how much modifications of water (in its multifaceted aspects) affect species, communities, and climate in an interconnected way as ecoties (species interactions, habitat interactions, and teleconnections) as an ecological portfolio [22,27]. Given this information a proactive ”bioterraforming” approach, that is eco-hydro-geomorphological engineering, should follow.
In this study we assessed how much HS affects population and community features such as abundance and diversity of butterfly populations taken as a potential barometer of ecosystem health. The case study has been done for Shenzhen, that is the fastest growing megalopoli in the world. In particular we found: (i) a U-shape abundance-diversity pattern reflecting species heterogeneity and rarity of high diversity; (ii) and abundance and diversity increasing and decreasing as a power-law function with HS. Diversity appears to be related to park area but abudance more to the degree of urbanization or park centrality due to the likely isolation of some species in these areas with higher species reporting. However, these central parks are characterized by bimodal Preston plots (richness-abundance patterns) that underlie some non-stationary and/or suboptimal conditions in species assemblage.
An important element is related to species richness that should not be used as a systemic indicator of ecosystem health nor of ecosystem conservation of natural conditions. This is observable very clearly in Shenzhen where the highest diversity and abundance, considering the butterfly data, is observed for urban parks that are quite central in the city; these parks have the largest urbanization pressure considering the evolution of the city: the oldest park are in the oldest parts of the city. Thus, other elements, such as the presence of exotic plants or ecological isolation may contribute to these high value of diversity. Ecosystem fitness then should be based on the topology of species interaction networks from relative Relative Species Abundance that can be easily assessed over space and time and should be structured along ecological corridors [4,27,28]. A simpler alternative for baselining ecosystem fitness is to use HS of species like butterflies that are sensitive and sentinels (in the sense of vulnerability and early-warning signal) to the environmental footprint and representative of other species. Specifically, HS flows (OEN) are sentinels of changes due their strong dependencies with temperature and precipitation flows along hydrological corridors connecting land and atmosphere. Ecoflows incorporate species and species-tranformed climate pressure into a distribution reflecting compouding and distributed stress responses. Thus, flow distribution more than RSA is a sentinel of change manifesting the balance between climate forcing and species response. This perspective should be seen in an information sense where ecological information becomes intelligence for decision making on ecosystem management and design [2,22,29]. Ecological information can support Digital Ecological Models providing community fitness, corridors, flows, areas of influence and environnmental determinants to manage or control.
As climate variability increases and global temperatures rise, communities face more frequent and severe events, such as hurricanes, heat waves, floods and droughts as compounding risks linked to the same ecohydrological dysbiosis [29]. The need for ecosystem predictions, anchored into species infomation, allows stakeholders to support ecosystem planning, design and engineering that is critical for communities, ecosystems (natural and built environments together) and economies. Tracking species allow us to determine the signature of the hydrologic cycle that may be shifting, and yet to diagnose and plan ecosystems more properly than a non eco-informed scenario. Butterflies and other critically sensitive species act as fingerprints of ecosytsem function (or dysbiosis vice versa) driven by the balanced species-climate interactions structured by ecohydrological proportions.
Supplementary Materials
The following supporting information can be downloaded at the website of this paper posted on Preprints.org
Author Contributions
M.C. designed and guided the study, and wrote the manuscript. Y.W. performed all calculations and created the figures. H.D. contributed to preliminary discussions of the work.
Acknowledgments
M.Convertino acknowledges the Shenzhen Pengcheng Peacock Pengcheng Talents funding (B class, 0020210320), "ECOgeomorphic and Hydroclimatic ImpactS on Biodiversity and Ecosystem FuNction: Mapping Critical Shifts and ConnEctions" (ECOSENSE); and the Shenzhen Stability Support Grant (WDZC20231128160214001), ”Optimizing Deltas’ Natural Engineers: Systemic Restoration to Counter EcoHydroClimate Extremes”; and funding from the Shenzhen Science and Technology Program (ZDSYS20220606100806014) for the Shenzhen Key Laboratory of Ecological Remediation and Carbon Sequestration at Tsinghua SIGS. M. Convertino also acknowledges the funding from the Cross-disciplinary program at Tsinghua SIGS (JC2024011) for the project ”The Fibers of Nature: Ecohydrological Flows Assessment via Distributed Fiber-optic Sensing Networks”. M. Convertino also acknowledges previous supports from the Microsoft AI for Earth Program grant “Bio-Hydro-Geo Dynamics: Mapping Systemic Earth Risk” https://www.microsoft.com/en-us/ai/ai-for-earth-grantsg, and the NSF SRN project (“Sustainable Research Network: Integrated Urban Infrastructure Solutions for Environmentally Sustainable, Healthy, and Livable Cities”) http://www.sustainablehealthycities.org for which he was the PI and co-PI at Hokkaido University (JP) and the University of Minnesota Twin-Cities (USA).
References
- Servadio, J.L.; Convertino, M. Optimal information networks: Application for data-driven integrated health in populations. Science Advances 2018, 4, e1701088. [Google Scholar] [CrossRef] [PubMed]
- Li, J.; Convertino, M. Inferring ecosystem networks as information flows. Scientific reports 2021, 11, 7094. [Google Scholar] [CrossRef] [PubMed]
- Liu, Y.; Hoppe, B.O.; Convertino, M. Threshold evaluation of emergency risk communication for health risks related to hazardous ambient temperature. Risk analysis 2018, 38, 2208–2221. [Google Scholar] [CrossRef]
- Rodriguez-Iturbe, I.; Muneepeerakul, R.; Bertuzzo, E.; Levin, S.A.; Rinaldo, A. River networks as ecological corridors: A complex systems perspective for integrating hydrologic, geomorphologic, and ecologic dynamics. Water Resources Research 2009, 45. [Google Scholar] [CrossRef]
- Pekel, J.F.; Cottam, A.; Gorelick, N.; Belward, A.S. High-resolution mapping of global surface water and its long-term changes. Nature 2016, 540, 418–422. [Google Scholar] [CrossRef]
- Kuczynski, L.; Ontiveros, V.J.; Hillebrand, H. Biodiversity time series are biased towards increasing species richness in changing environments. Nature Ecology & Evolution 2023, 7, 994–1001. [Google Scholar]
- Sing, K.W.; Dong, H.; Wang, W.Z.; Wilson, J.J. Can butterflies cope with city life? Butterfly diversity in a young megacity in southern China. Genome 2016, 59, 751–761. [Google Scholar] [CrossRef]
- Sing, K.W.; Luo, J.; Wang, W.; Jaturas, N.; Soga, M.; Yang, X.; Dong, H.; Wilson, J.J. Ring roads and urban biodiversity: distribution of butterflies in urban parks in Beijing city and correlations with other indicator species. Scientific reports 2019, 9, 7653. [Google Scholar] [CrossRef]
- Li, J.; Convertino, M. Optimal microbiome networks: macroecology and criticality. Entropy 2019, 21, 506. [Google Scholar] [CrossRef]
- Phillips, S.J.; Anderson, R.P.; Dudík, M.; Schapire, R.E.; Blair, M.E. Opening the black box: An open-source release of Maxent. Ecography 2017, 40, 887–893. [Google Scholar] [CrossRef]
- Chowdhury, M.S.N.; Wijsman, J.W.; Hossain, M.S.; Ysebaert, T.; Smaal, A.C. A verified habitat suitability model for the intertidal rock oyster, Saccostrea cucullata. PloS one 2019, 14, e0217688. [Google Scholar] [CrossRef] [PubMed]
- Convertino, M.; Troccoli, A.; Catani, F. Detecting fingerprints of landslide drivers: A MaxEnt model. Journal of Geophysical Research: Solid Earth 2013, 118, 1367–1386. [Google Scholar] [CrossRef]
- Phillips, S.; Anderson, R.; Schapire, R. Maximum entropy modeling of species geographic distributions. Ecological Modelling 2006, 190, 231–259. [Google Scholar] [CrossRef]
- Phillips, S.J.; Miroslav, D. Modeling of species distributions with Maxent: new extensions and a comprehensive evaluation. Ecography 2008, 31, 161–175. [Google Scholar] [CrossRef]
- Elith, J.; Phillips, S.; Hastie, T.; Dudík, M.; Chee, Y.; Yates, C. A statistical explanation of MaxEnt for ecologists. Diversity and Distributions 2010. [Google Scholar] [CrossRef]
- Merow, C.; Smith, M.J.; Silander Jr, J.A. A practical guide to MaxEnt for modeling species’ distributions: what it does, and why inputs and settings matter. Ecography 2013, 36, 1058–1069. [Google Scholar] [CrossRef]
- Radosavljevic, A.; Anderson, R.P. Making better Maxent models of species distributions: complexity, overfitting and evaluation. Journal of biogeography 2014, 41, 629–643. [Google Scholar] [CrossRef]
- Muscarella, R.; Galante, P.J.; Soley-Guardia, M.; Boria, R.A.; Kass, J.M.; Uriarte, M.; Anderson, R.P. ENM eval: An R package for conducting spatially independent evaluations and estimating optimal model complexity for Maxent ecological niche models. Methods in ecology and evolution 2014, 5, 1198–1205. [Google Scholar] [CrossRef]
- Phillips, S.J.; Dudík, M. Modeling of species distributions with Maxent: new extensions and a comprehensive evaluation. Ecography 2008, 31, 161–175. [Google Scholar] [CrossRef]
- Convertino, M.; Muñoz-Carpena, R.; Chu-Agor, M.L.; Kiker, G.A.; Linkov, I. Untangling drivers of species distributions: Global sensitivity and uncertainty analyses of MaxEnt. Environmental Modelling & Software 2014, 51, 296–309. [Google Scholar]
- Tobón-Niedfeldt, W.; Mastretta-Yanes, A.; Urquiza-Haas, T.; Goettsch, B.; Cuervo-Robayo, A.P.; Urquiza-Haas, E.; Orjuela-R, M.A.; Acevedo Gasman, F.; Oliveros-Galindo, O.; Burgeff, C.; others. Incorporating evolutionary and threat processes into crop wild relatives conservation. Nature communications 2022, 13, 6254. [Google Scholar] [CrossRef] [PubMed]
- Wang, H.; Convertino, M. Algal bloom ties: Systemic biogeochemical stress and Chlorophyll-a shift forecasting. Ecological Indicators 2023, 154, 110760. [Google Scholar] [CrossRef]
- Banavar, J.R.; Colaiori, F.; Flammini, A.; Maritan, A.; Rinaldo, A. Scaling, optimality, and landscape evolution. Journal of Statistical Physics 2001, 104, 1–48. [Google Scholar] [CrossRef]
- Banavar, J.R.; Cooke, T.J.; Rinaldo, A.; Maritan, A. Form, function, and evolution of living organisms. Proceedings of the National Academy of Sciences 2014, 111, 3332–3337. [Google Scholar] [CrossRef] [PubMed]
- Liu, X.; Su, Y.; Li, Z.; Zhang, S. Constructing ecological security patterns based on ecosystem services trade-offs and ecological sensitivity: A case study of Shenzhen metropolitan area, China. Ecological Indicators 2023, 154, 110626. [Google Scholar] [CrossRef]
- Zhang, S.; Zhang, Z.; Wang, J.; Zhang, Y.; Wu, J.; Zhang, X. Effects of ecological control line on habitat connectivity: A case study of Shenzhen, China. Ecological Indicators 2024, 167, 112583. [Google Scholar] [CrossRef]
- Wu, L.; Convertino, M. Ecological Corridor Design for Ecoclimatic Regulation: The South China Tiger. Available at SSRN 484 8331.
- Rinaldo, A.; Gatto, M.; Rodríguez-Iturbe, I. River networks as ecological corridors: Species, populations, pathogens; Cambridge University Press, 2020.
- Convertino, M.; Valverde Jr, L.J. Toward a pluralistic conception of resilience. Ecological Indicators 2019, 107, 105510. [Google Scholar] [CrossRef]
Figure 1.
Conceptual diagram of the inferred butterfly-based habitat fitness of urban ecosystems and flows for ecosystem design. A. Butterflies are a fingerprint of park fitness and response to climate pressure as well as, in a reverse causality perspective, very sensitive species to explore the impact of climate extremes to ecological communities in urban ecosystems. The ecosystem diagnostic framework based on RSA is show on the right. B. Graphical representation of the digitally derived HS (Digital HS Model) and inferred preferential flows (as maximum gradients).
Disclaimer/Publisher’s Note: The statements, opinions and data contained in all publications are solely those of the individual author(s) and contributor(s) and not of MDPI and/or the editor(s). MDPI and/or the editor(s) disclaim responsibility for any injury to people or property resulting from any ideas, methods, instructions or products referred to in the content. |
© 2024 by the authors. Licensee MDPI, Basel, Switzerland. This article is an open access article distributed under the terms and conditions of the Creative Commons Attribution (CC BY) license (http://creativecommons.org/licenses/by/4.0/).
Copyright: This open access article is published under a Creative Commons CC BY 4.0 license, which permit the free download, distribution, and reuse, provided that the author and preprint are cited in any reuse.


