
Submitted:
18 November 2024
Posted:
19 November 2024
You are already at the latest version
Preprints on COVID-19 and SARS-CoV-2
Abstract
Background/Objectives: Understanding the behavior of B cells during infection and vaccination is important for determining protective humoral immunity. We evaluated the profile of humoral immunity and B cell pool in individuals who were acutely infected with SARS-CoV-2, recovered from COVID-19, or received two doses of the AZD1222 vaccine. Methods: Peripheral blood mononuclear cells (PBMCs) from these individuals were subjected to in vitro stimulation to promote differentiation of B cells into antibody-secreting cells (ASC), and the ELISpot evaluated the abundance of pan and SARS-CoV-2 Spike S1-reactive IgG+ ASC. Stimulated PBMCs were characterized using flow cytometry. Culture supernatants were assessed for soluble B cell-activating factors. The IgA and IgG for the S1 were evaluated by ELISA. Results: The recovered individuals displayed a robust S1 ASC compared to acute and vaccinated. Although the frequency of total B cells or B-cell subsets did not vary among the groups, plasma cells were increased in naïve and double-negative B cells in the acute, recovered, and vaccinated. Similar IgA and IgG production appeared to be present in the acute and recovered. During vaccination, more IgG is produced than IgA. In acute patients, BAFF levels were positively correlated with total B cells and IgG+ plasma cells, but negatively correlated with IgA+ plasma cells. Conclusions: The vaccination and natural infection with COVID-19 induce a differential profile and functionality of B cells. We suggest that new vaccines against COVID-19 incorporate molecular adjuvants that regulate B lymphocyte functionality and consider the beneficial aspects of the IgA response in addition to IgG.
Keywords:
COVID-19
; AZD1222 (ChAdOx nCoV-19) vaccine
; humoral response
; B cell subsets
1. Introduction
Protective immunity is expected to occur after a natural infection, especially in those who recover from the disease before vaccination or when individuals are vaccinated against certain pathogens. Immunological memories are generated in all situations. The principle of immunological memory is to help an individual to be protected from disease. CD4 + and CD8 + T cells, B cells, and long-lasting antibody responses are the multiple branches of the adaptive immune system that develop from immunological memory. Substantial advancements have been made in understanding the memory of SARS-CoV-2 infection and COVID-19 vaccines [1]. Despite advances in understanding COVID-19, it is highly dynamic, and new virus variants have frequently emerged. Therefore, vaccine efficiency must be constantly evaluated. Furthermore, there is still a lack of information on which essential immunological elements are induced in recovered symptomatic infections, or even in vaccinated people who are effectively protected.
Recently, participants who received one to three doses of inactivated vaccine 1–2 years after infection were compared with those who recovered from SARS-CoV-2 prototype strain infection without re-infection. The study's major findings were that antibodies, memory B-cells, and T-cell immunity against the SARS-CoV-2 prototype were present in recovered patients 2 years after natural infection. In addition, total SARS-CoV-2 T cell responses are able to recognize SARS-CoV-2 variants. An inactivated vaccine improved antibody titers and frequencies of memory B cells, but not memory T cells. The study reinforces the need for ongoing surveillance of the duration of infection-induced adaptive immunity and adaptive immunity against viral variants [2].
Activating the humoral immune response can result in two major outcomes: production of antibodies by antibody-secreting plasma cells that provide rapid serological immunity, and generation of long-lived memory B cells capable of mounting recall responses [3,4]. Newly generated plasma cells either die within days or reside in tissues, such as the bone marrow (BM) or lamina propria of the small intestine, where they can indefinitely persist as high-output antibody-secreting cells [5,6,7,8]. The induction and maintenance of IgG-secreting cells in the BM have been extensively studied [9], but little is known about IgA-secreting plasma cells in the gut or other tissues [10]. SARS-CoV-2 spike antigen-specific IgG and IgA in patients with COVID-19 mediate viral neutralization. Despite a recent study suggesting that IgA dominates the early neutralizing response to SARS-CoV-2, serum IgA is seven-fold more potent than serum IgG. These data indicate that several types of protective antibodies defend against reinfection and that vaccination regimens should aim for a potent, but potentially short-lived IgA response [11].
Different B cell-activating molecules, such as CD40L, proliferation-inducing ligand A (APRIL), and B cell-activating factor (BAFF), play important roles in B cell maturation, activation, and differentiation. BAFF is usually expressed in cell membranes, but can be cleaved, maintaining its functions even in its soluble form. Unlike BAFF, APRIL is intracellularly cleaved and secreted. APRIL is involved in B cell survival, proliferation, antigen presentation, and antibody class switching. Another important member of the TNF family of B cells is CD40 ligand (CD40L). CD40-CD40L interaction on B cells is required to develop germinal centers, induce antibody class switching, and generate B cell memory. CD40L can be cleaved into soluble CD40L (sCD40L), which maintains its ability to bind to the CD40 receptor and exerts biological activity [12,13,14,15].
A related issue is that if the primary immune response to SARS-CoV-2 in the natural infection of patients who develop mild/moderate clinical symptoms is the best-case scenario for an immunoprotective response, the COVID-19 vaccine should induce the same immune response profile. Furthermore, the anamnestic humoral response of the recovered individuals may be the most efficient. Therefore, we hypothesized that patients with mild/moderate COVID-19 and individuals who have recovered from COVID-19 develop a humoral immune response and pool of B cells similar to those vaccinated with AZD1222. These questions are particularly relevant in the search for new vaccines, considering the emergence of many viral variants, limited vaccine supply, and the inequitable distribution of vaccines worldwide [16].
In this study, we evaluated individuals infected with SARS-CoV-2, those who recovered from COVID-19, and those who received two doses of the AZD1222 vaccine. Their peripheral blood mononuclear cells (PBMCs) were stimulated in vitro to promote terminal differentiation of B cells into antibody-secreting cells (ASC), followed by detection of Spike S1-reactive IgG + or "pan" IgG ASCs (regardless of antigen specificity) using the enzyme-linked immunospot (ELISpot). PBMC recovered from ELISpot was used to characterize B cells by multiparametric flow cytometry. Soluble B-cell activation factors (BAFF, APRIL, and CD40L) were quantified in ELISpot supernatants. Finally, a commercial enzyme-linked immunosorbent assay (ELISA) was used to evaluate the abundance of IgA and IgG in plasma with specificity for the Spike 1 domain. Despite extensive knowledge on COVID-19 and vaccination, few studies have compared the humoral immune response to acute infection in recovered and vaccinated individuals. Our findings offer additional insights into the response of B cells to natural infections and vaccination.
2. Materials and Methods
2.1. Study Design and Blood Sample Collection
A cross-sectional study was conducted in patients infected with SARS-CoV-2 and healthy individuals vaccinated with AZD1222 (ChAdOx nCoV-19; AstraZeneca) (Table 1). Two groups of patients with COVID-19 were chosen: those with COVID-19 treated at Hospital Rede-Casa, Rio de Janeiro, Brazil, between March and June 2020 [17], and the recovered group of those who no longer presented with clinical symptoms [18]. Eleven recipients received the ChAdOx1 nCoV-19 vaccine (AZD1222). Plasma was analyzed the day before vaccination (d0) or 14 and 35 days after the booster dose (T1 and T2). Four of the 11 recipients (36 %) reported a previous SARS-CoV-2 infection before vaccination (2020 or 2021). None of the patients will report SARS-CoV-2 infection between the two doses in 2021. Nine of the 11 (82%) recipients reported an episode of SARS-CoV-2 infection in 2022 after two doses. Notably, all vaccines caused asymptomatic infections or mild illnesses, even before or after both doses [19]. Plasma from healthy non-COVID-19 donors was obtained from individuals with no history of infection or clinical symptoms three months before blood collection, which occurred in 2018 and 2019, years before the pandemic.
2.2. PBMC and Plasma Isolation
Approximately 20 mL of peripheral blood was collected in BD Vacutainer tubes containing acid-citrate-dextrose (Becton, Dickinson and Company, Franklin Lakes, NJ, USA). PBMCs and plasma were isolated using Ficoll-PaquePLUS density gradient centrifugation (GE HealthCare, Chicago, Illinois, USA) and frozen in fetal bovine serum (FBS, Thermo Fisher Scientific, Waltham, MA USA) containing 10% (v/v) dimethyl sulfoxide (Sigma-Aldrich, Burlington, MA, USA). The cells were thawed on the day of the experiment and used directly for in vitro assays.
2.3. IgG ELISPOT Assay
The Human IgG ELISpotBASIC kit (Mabtech, Cincinnati, OH, USA) was used according to the manufacturer's instructions. PBMCs were pre-stimulated in a 96-well culture plate with a mixture of 1 ug/mL R848 and 10 ng/mL recombinant human IL-2 (both provided by the ELISpot Kit, Mabtech) in RPMI 1640 medium (Thermo Fisher Scientific) supplemented (10% heat-inactivated FBS, 1% glutamine and 1% HEPES, Thermo Fisher Scientific) for 48 h at 5% CO2. The stimulated cells were washed with RPMI-1640 medium before plating. Sterile ELISpot plates (96-well Filtration Plate Multiscreen® HTS, Millipore, Burlington, MA, USA) were coated with anti-human IgG capture antibody (provided by the ELISpot Kit, Mabtech) or SARS-CoV-2 Spike 1 antigen (1 μg/mL, Sino Biological, Beijing, China) overnight at 4 °C. The number of total IgG+-secreting and S1-specific B cells was determined in wells coated with anti-human IgG or S1, respectively. The plates were washed with sterile PBS and blocked with RPMI-1640 medium/10% FBS) for 2 h at room temperature (25°C to 27°C). Pre-activated cells (5 × 10⁴ or 5 × 10⁵) were added to IgG- or S1-coated wells in triplicates, respectively, and incubated at 37 °C, 5% CO2 for 20 h. After the incubation period, the PBMC were collected and used for extracellular staining using flow cytometry [20,21,22]. After washing the plates, 1 µg/mL of biotinylated anti-IgG antibody (provided by ELISpot kit, Mabtech) was added with incubation for 2 h at room temperature followed by 0.1% streptavidin-alkaline phosphatase substrate (supplied by the ELISpot kit, Mabtech) was added with incubation for 1 h at room temperature. The plates were washed and 5-bromo-4-chloro-3-indolyl-phosphate/nitro blue tetrazolium chloride alkaline phosphatase substrate (BCIP-NBT, Sigma-Aldrich) was added. The spots were counted using an ImmunoSpot1S6UV Ultra (Cleveland, Ohi, USA). The number of antigen-specific IgG-producing cells is expressed as ASC relative to 106 PBMCs. The respondents were those with spots greater than the mean number plus 2× standard deviation of spots from healthy donors, which was greater than or equal to 10.
2.4. B Cell Profile Assessment with Extracellular Staining Using Flow Cytometry
The PMBCs recovered using the ELISpot assay were used. Initially, a blocking solution was added to PBMC for 30 min at 4°C. After incubation, cells were washed, and a mix of monoclonal antibodies for surface markers was added (anti-CD16, anti-CD3, anti-CD56, anti-CD14 all FITC, anti-IgA-PE [Miltenyi Biotec, Gladbach, Germany], anti-IgM-APC, anti-IgD-PECy7, anti-IgG-APCH7, anti-CD27-PerCP CY5.5, anti-CD19-V500, and anti-CD38-PE-CF594 [Becton, Dickinson and Company]) and, LIVE/DEAD™ Fixable Violet Dead Cell Stain Kit (Thermo Fisher Scientific). After 30 min, the cells were washed, fixed with 4% paraformaldehyde (Millipore Sigma) for 15 min, washed again, and resuspended in PBS. Data were acquired from a Cytoflex S flow cytometer (Beckman Coulter, Brea, CA, USA) and analyzed using FlowJo 10 software (Tree Star®, Oakland, CA, USA).
2.5. BAFF, APRIL, and sCD40L Quantification
Supernatants from PBMC cultures were recovered using an ELISPOT assay. A LEGENDplex Human B Cell Activator Panel 3-plex kit (BioLegend, San Diego, CA, USA) was used to detect soluble BAFF, APRIL, and CD40L. Undiluted culture supernatants were placed in a 96-well assay plate and mixed with beads for 2 h at room temperature on a shaker (at approximately 500 rpm). Antibodies were added to the wells and incubated for 1 h on a shaker. Streptavidin-PE solution was added to each well. After a 30-min incubation on the shaker, the beads were washed and resuspended in wash buffer. Samples were acquired on a CytoFLEX flow cytometer (Beckman Coulter, Brea, CA, USA), and initial data analysis was performed using the Legendplex software (BioLegend).
2.6. SARS-CoV-2 Serology
According to the manufacturer's instructions, plasma samples were tested using ELISA to detect IgG and IgA antibodies specifically binding to the SARS-CoV-2 Spike 1 protein (Euroimmun, Waltham, MA, USA). Optical density was measured using a spectrophotometer (Biochrom EZ Read 400, Holliston, MA, USA). Semi-quantitative results were also obtained.
2.7. Statistical Analysis
The Kruskal–Wallis test, followed by Dunn's multiple comparison test, was used for group comparisons. The paired Wilcoxon test was used when data followed a normal distribution. The Mann–Whitney U test was used to compare the frequency between the two groups. The response to kinetic vaccination was analyzed using the Friedman test, followed by Dunn's multiple comparison test. Differences in variables among groups were considered significant at p < 0.05. GraphPad PRISM version 9.01 (GraphPad Software) was used for the analysis.
3. Results
3.1. Recovered Individuals Exhibit a Robust Spike 1-Specific ASC Response
The ELISpot technique was used to detect the presence and abundance of memory B cells reactive to the SARS-CoV-2 Spike 1 antigen regarding the secretion of IgG+ antibodies (ASCs). As controls, cells from the same individuals are evaluated for their ability to produce "pan" IgG regardless of antigen specificity. The secreted IgG was captured with high affinity in both cases using an anti-IgG capture reagent. Representative colored spots of pan IgG+ and Spike 1-specific ASCs were observed in healthy donors (HD), naturally infected patients with acute COVID-19 (acute), non-vaccinated recovered COVID-19 individuals (recovered), and vaccinated individuals after the second dose of AZD1222 (vaccinated) (Figure 1A). B-cell ELISpot analysis revealed the ability of cells from all individuals to produce "pan" IgG (Figure 1B). Variable presence and abundance of memory B cells reactive to the SARS-CoV-2 Spike 1 antigen were observed among the acute, recovered, and vaccinated groups, resulting in a difference when the recovered and vaccinated groups were compared (Figure 1C). After analysis, we calculated the frequency of responders, considering people who had detected Spike 1 antigen-specific ASC above or equal to 10 (calculated as mean + 2× standard deviation of HD). Respondents among the acute, recovered, and vaccinated individuals comprised 26.3%, 72.7%, and 18.2%, respectively. This indicated a statistical difference among the groups, in which recovered individuals constituted the majority of the Spike 1 antigen responders (Figure 1D).
3.2. Plasma Cells Are Commonly Increased in the Acute, Recovered, and Vaccinated Groups, Although the Frequency of Total B Cells or B-Cell Subsets Did Not Vary When Comparing the Four Groups
The frequency of B cells after stimulation with the spike 1 antigen was based on the classical biomarker, CD19, previously excluding those expressing CD3, CD16, CD56, and CD14, as shown in the representative analysis strategy of a patient with acute COVID-19 (Figure 2A). The total B-cell frequency was similar among the groups (Figure 2A). In addition to the classical biomarkers that define total B cells, CD27, CD38, IgM, and IgD help differentiate the status of B cell subsets, that is, naïve, double-negative, plasma cells, and memory cells (Figure 2B–E) as shown by a representative dot plot of each B cell subset. No statistical differences were observed when evaluating B cell subsets among the groups (Figure 2B–E). In contrast, the frequency of the subpopulations in each group evaluated individually indicated that in patients with acute COVID-19, an increased frequency of the plasmablast subset was observed compared with that in naive and double-negative B cells. An increased frequency of the plasmablast subset was observed in recovered B cells compared with that in naive B cells. Vaccinated individuals showed increased plasma cells compared with that in naïve and double-negative B cells, similar to the acute patients (Figure 2F).
3.3. Soluble BAFF Appears to Regulate Total B Cells in Patients with Acute COVID19
After stimulation with the Spike 1 antigen, the PBMC supernatant was recovered and the B cell-activating molecules APRIL, BAFF, and CD40L were measured. As shown in Figure 3, no significant differences were observed in these measures between the groups of individuals. Spearman's correlation statistical test showed that the amount of soluble BAFF was positively correlated with the total B cells in patients with acute COVID-19 (Figure 3B). No other correlations were observed.
3.4. Differential Profile of IgA and IgG
Figure 4A shows the ratio of IgA/IgG antibodies directed against the Spike 1 protein SARS-CoV2 in all groups. Interestingly, patients with acute and recovered COVID-19 had an IgA/IgG ratio close to 1.0, indicating that the production of IgA and IgG is similar in natural infections. However, these proportions were < 0.3 for those vaccinated, suggesting that more IgG than IgA was produced during vaccination. Regarding the kinetics of immunization after the second dose of ChAdOx1 nCoV-19 (AZD1222), it is clear that similar to IgG, IgA was also induced upon vaccination (Figure 4B).
The inclusion of anti-IgA and anti-IgG antibodies in the analysis allowed us to define subpopulations of IgA- or IgG-secreting plasma cells (IgA+ or IgG+ / CD27+CD38+) and IgA- or IgG-secreting memory B cells (IgA+ or IgG+ /CD27+IgD-) (Figure 4C). This analysis established data from cells recovered after stimulation with the Spike 1 antigen. Patients with acute and recovered COVID-19, but who were not vaccinated, showed an increase in IgG+ memory B cells compared to IgA+ memory B cells (Figure 4D). Spearman's statistical correlation test showed that the amount of soluble BAFF negatively correlated with the frequency of IgA+ plasma cells and positively correlated with IgG+ plasma cells only in patients with patients with acute COVID-19 (Figure 4E). No other correlations were observed.
4. Discussion
This study focused on the role of B cells in COVID-19 outcomes and the development of more effective vaccines. It evaluated patients with COVID-19, recovered individuals, and those vaccinated with ChAdOx1 nCoV-19. Over 70% of the recovered individuals showed a specific ASC response to Spike 1. Plasmablast frequency increased across all groups. IgA and IgG levels were similar in the acute and recovered individuals, whereas vaccinated individuals had higher IgG levels. BAFF levels were positively correlated with total B and IgG+ plasma cells in acute patients, but negatively correlated with IgA+ plasma cells.
Several studies have compared immune responses to COVID-19 vaccines and natural SARS-CoV-2 infection. Wang et al. used single-cell RNA sequencing to analyze immune cells from individuals immunized with the coronavirus vaccine and those with COVID-19. Both vaccination and infection changed the immune cell frequencies, but the effect was stronger during infection. CoronaVac immunization increases HLA class II and IL21R expression in naïve B cells, whereas these markers are downregulated in severe COVID-19 cases [23]. Tartaro et al. found that vaccinated individuals had more antigen-specific memory B cells and polyfunctional CD4 + T cells than recovered patients, indicating differences in adaptive immunity [24].
Humoral immunity is a function of memory B cells and plasma cells, and is a prerequisite for generating humoral immune memory [25]. Natural infection with SARS-CoV-2 induces a robust population of circulating memory B cells that remain stable for at least eight months despite the contraction of antibody levels after one month. [26]. Byazrova et al. demonstrated that circulating RBD-specific ASC frequencies in patients with COVID-19 ranged from 200 to 4000 ASC per 106 PBMCs. This matches the virus-specific ASC levels observed during other viral infections in order of magnitude and indicates that specific ASCs are generated during the acute phase of COVID-19 [27]. Here, we showed that most recovered individuals displayed a robust spike 1-specific ASC response (ranging from 2 to 44 ASC per 106 PBMCs) compared with that in acute COVID-19 (ranging from 1 to 103 ASC per 106 PBMCs) and vaccinated individuals (ranging from 1 to 30 ASC per 106 PBMCs). Although detectable, the ASCs obtained in our study were much lower than those of Byazrova et al., which may indicate that the 1µg/mL antigen coating was suboptimal and detection only occurred with the highest affinity ASC. However, the ASCs comprise <1% of primary and secondary lymphoid organs and blood cellularity, and they can be classified as plasma cells, plasma cells, or memory B-cells. They represent the final stage of B-cell differentiation and are widely distributed throughout the body (secondary lymphoid organs, mucosa, and gastrointestinal tract) [28]. Furthermore, Byazrova et al. confirmed that the acute phase of COVID-19 was characterized by the transient appearance of the total and RBD-binding plasma cells [27], indicating that a longitudinal study could better clarify our data. Notably, our ELISpot data showed an increased frequency of IgG+ plasma cells and IgG+ memory B cells in acute cases after spike 1 stimulation. Byazrova et al. demonstrated a lack of correlation between the frequency of memory B cells and ASCs, which could explain the low magnitude of our ASCs [27].
Lee et al. studied acute COVID-19 cases and found that B cells in severe cases differentiated into plasma cells more significantly than those in moderate cases. This was associated with increased B cell receptor diversity and higher levels of anti-spike 1 antibodies. In severe cases, two B cell subsets, atypical memory B cells and an aberrant plasma cell subset, showed inflammatory features, such as elevated cytokine expression and enhanced humoral function, unlike those in moderate cases [29]. These subsets may contribute to disease severity. This study only evaluated mild/moderate, severe, and fatal cases, limiting the ability to categorize patients and analyze their clinical outcomes. More serious cases might have altered the results.
Pušnik et al. found that although spike 1-specific memory B cells were less frequent in individuals who recovered from mild COVID-19, these cells were functionally superior to those with severe disease. Their ability to generate and affinity-mature these cells was linked to IL-21+CD4+ T cells in mild cases and to CD40L+CD4+ T cells in severe cases [30]. In this study, most recovered individuals had mild COVID-19, which could explain why over 72% were Spike 1 antigen responders, as indicated by detecting ASCs ≥ 10.
The mRNA vaccines, BNT162b2 (Pfizer-BioNTech) and mRNA-1273 (Moderna), generated significantly higher levels of IgG and neutralizing antibodies than the adenoviral vector vaccines ChAdOx1 (AstraZeneca) and Ad26.COV2.S (Janssen). However, all vaccines trigger spikes and RBD-specific memory B cells, which are essential for long-term protection through rapid immune responses against future infections [31]. In this study, more than 70% of the vaccinated individuals showed an increased frequency of IgG+ memory B cells compared to IgA+ memory B cells after Spike 1 stimulation. However, only 18.2% had ASCs ≥ 10, indicating that immune cell functionality should be assessed using various methodological approaches.
B cell activation, differentiation, and maturation occur in secondary lymphoid organs, which provide signals via cell contact and secretion of cytokines, chemokines, and soluble factors, such as BAFF, APRIL, and CD40L [32,33]. Studies on BAFF, APRIL, and sCD40L levels in patients with COVID-19 have been inconsistent. Some studies have found increased APRIL and sCD40L levels in recovered patients compared with those with acute COVID-19, whereas others have observed elevated BAFF levels in severe acute cases. Conflicting studies have also shown higher APRIL in severe cases, but higher BAFF in mild/moderate cases [34,35,36]. This study found no differences in BAFF, APRIL, or sCD40L levels across the groups. However, in acute patients, BAFF levels were positively correlated with total B cells and IgG+ plasma cells and negatively correlated with IgA+ plasma cells.
A study focused on developing a DNA vaccine against HIV, utilizing the molecular adjuvants BAFF and APRIL to enhance polyreactive B cell maturation and improve the affinity of neutralizing antibodies. Mice immunized with vaccines encoding BAFF or APRIL multitrimers showed germinal center activation, increased secretion of anti-gp120 antibodies, and improved antibody avidity. The authors suggested that the BAFF and APRIL multitrimers are promising adjuvants for vaccines aimed at inducing neutralizing antibodies against HIV-1, making them valuable tools for vaccinology [37].
The ability of the AZD1222 vaccine to induce neutralizing antibody production has been previously demonstrated [38], although this study did not present neutralizing antibody data. A previous study by our group found a positive correlation between IgG antibodies detected using a commercial ELISA kit and neutralizing antibody titers measured by the plaque reduction neutralization test, suggesting that most antibodies detected in patients were neutralizing [17]. Given the benefits of BAFF in enhancing humoral response during infection, incorporating BAFF molecular adjuvants into COVID-19 vaccines could improve protection by fostering a stronger humoral response.
Sterlin et al. found that the initial SARS-CoV-2-specific humoral responses in patients with COVID-19 are predominantly IgA [11]. This is due to the higher production and secretion of IgA in the mucosal tract, which helps control viral spread and lung damage [39]. Although the AZD1222 vaccine induced both IgA and IgG antibodies, the IgG response was more prominent. In contrast, natural SARS-CoV-2 infection leads to similar levels of IgA and IgG production in acute and recovered individuals. A recent study has suggested that IgA plays a crucial role in the early neutralizing response to SARS-CoV-2, with serum IgA being seven times more effective than serum IgG. Therefore, vaccination strategies should stimulate various antibody types, including IgA, to enhance the effectiveness of vaccines in preventing reinfection [11].
This study had some limitations. The sample sizes of the patients and vaccinated individuals were small. Nevertheless, we aimed to explore the trials better understand the qualitative and functional profiles of the B cells. Additionally, we only evaluated individuals vaccinated with the second dose at two time points, with one being just 35 days after the second dose. Analyzing those vaccinated after a longer interval would be valuable. Furthermore, we focused solely on the ChAdOx1 nCoV-19 (AZD1222) vaccine profile; assessing the B cell profiles of other available vaccines would also be beneficial. Finally, we did not consider the response of B cells to the variants.
5. Conclusions
Based on our findings, we propose several strategies for enhancing future COVID-19 vaccines. One recommendation is to incorporate molecular adjuvants that enhance B lymphocyte functionality, such as BAFF, to make vaccination with AZD1222 more effective in inducing an IgG+ response specific to SARS-CoV-2 antigens, similar to that observed in individuals who have recovered from a natural infection. Additionally, it is important to consider the beneficial aspects of the IgA-producing B cell response in disease control, alongside IgG class antibodies.
Author Contributions
Conceptualization, P.V.D., E.R.S.d.L., E.L.d.A., L.M.d-O-P.; formal analysis, D.F-M., and L.M.d-O-P.; funding acquisition, E.L.d.A. and L.M.d-O-P. and investigation, D.F-M., E.L.d.A. and L.M.d-O-P.; methodology, D.F-M.; project administration, L.M.d-O-P.; resources, L.M.d-O-P.; supervision, L.M.d-O-P.; validation, D.F-M., E.L.d.A. and L.M.d-O-P.; writing—review and editing, D.F-M and L.M.d-O-P. All authors have read and agreed to the published version of the manuscript.
Funding
Funding was obtained from the Programa de Ações Estratégicas para o Desenvolvimento e Fortalecimento dos Laboratórios Credenciados e das Áreas de Apoio À Pesquisa (PAEF), Institute Oswaldo Cruz; Edital de Geração de Conhecimento: COVID-19, Programa Inova Fiocruz, grant number VPPCB-005-FIO20-2-58, Fundação Oswaldo Cruz; Fundação de Amparo à Pesquisa do Estado do Rio de Janeiro (FAPERJ), grant number E-26/210.268/2019 and E-26/201.244/2021; Conselho Nacional de Desenvolvimento Científico e Tecnológico (CNPq) for the student’ fellowship. L.M.d-O-P. and E.L.d.A. are productivity scholarship recipients from CNPq.
Institutional Review Board Statement
This study was approved by the National Commission for Research Ethics (no. 57221416.0.1001.5248. version 6) and the Ethics Research Committee of the Hospital Rede Casa (number 47885515.8.0000.5279). This study was conducted in accordance with the guidelines of the Declaration of Helsinki. All data were treated confidentially and anonymously. Written informed consent was obtained from all the adult participants.
Informed Consent Statement
Informed consent was obtained from all subjects involved in the study. Written informed consent has been obtained from the patient(s) to publish this paper.
Data Availability Statement
The authors will make raw data supporting the conclusions of this article without reservation.
Acknowledgments
We thank everyone who participated in this study, especially the families of sick and deceased patients, who contributed significantly to this research. The authors thank the Multi-user Research Facility of Cytometry and ELISPOT, Instituto Oswaldo Cruz, Fundação Oswaldo Cruz, Rio de Janeiro, Brazil.
Conflicts of Interest
The authors declare no conflicts of interest.
References
- Sette A, Crotty S. Immunological memory to SARS-CoV-2 infection and COVID-19 vaccines. Immunol Rev. 2022, 310, 27–46. [CrossRef]
- Guo L, Zhang Q, Gu X, Ren L, Huang T, Li Y, Zhang H, Liu Y, Zhong J, Wang X, Chen L, Zhang Y, Li D, Fang M, Xu L, Li H, Wang Z, Li H, Bai T, Liu W, Peng Y, Dong T, Cao B, Wang J. Durability and cross-reactive immune memory to SARS-CoV-2 in individuals 2 years after recovery from COVID-19: a longitudinal cohort study. Lancet Microbe. 2024, 5, e24–e33. [CrossRef]
- Kurosaki T, Kometani K, Ise W. Memory B cells. Nat Rev Immunol. 2015, 15, 149–59. [CrossRef]
- Akkaya M, Kwak K, Pierce SK. B cell memory: building two walls of protection against pathogens. Nat Rev Immunol. 2020, 20, 229–238. [CrossRef] [PubMed]
- Amanna IJ, Carlson NE, Slifka MK. Duration of humoral immunity to common viral and vaccine antigens. N Engl J Med. 2007, 357, 1903–15. [CrossRef]
- Bortnick A, Chernova I, Quinn WJ 3rd, Mugnier M, Cancro MP, Allman D. Long-lived bone marrow plasma cells are induced early in response to T cell-independent or T cell-dependent antigens. J Immunol. 2012, 188, 5389–96. [CrossRef]
- Landsverk OJ, Snir O, Casado RB, Richter L, Mold JE, Réu P, Horneland R, Paulsen V, Yaqub S, Aandahl EM, Øyen OM, Thorarensen HS, Salehpour M, Possnert G, Frisén J, Sollid LM, Baekkevold ES, Jahnsen FL. Antibody-secreting plasma cells persist for decades in human intestine. J Exp Med. 2017, 214, 309–317. [CrossRef]
- Slifka MK, Antia R, Whitmire JK, Ahmed R. Humoral immunity due to long-lived plasma cells. Immunity 1998, 8, 363–72. [CrossRef] [PubMed]
- Wilmore JR, Allman D. Here, There, and Anywhere? Arguments for and against the Physical Plasma Cell Survival Niche. J Immunol. 2017, 199, 839–845. [CrossRef]
- Macpherson AJ, Yilmaz B, Limenitakis JP, Ganal-Vonarburg SC, IgA Function in Relation to the Intestinal Microbiota. Annu Rev Immunol. 2018, 36, 359–381. [CrossRef]
- Sterlin D, Mathian A, Miyara M, Mohr A, Anna F, Claër L, Quentric P, Fadlallah J, Devilliers H, Ghillani P, Gunn C, Hockett R, Mudumba S, Guihot A, Luyt CE, Mayaux J, Beurton A, Fourati S, Bruel T, Schwartz O, Lacorte JM, Yssel H, Parizot C, Dorgham K, Charneau P, Amoura Z, Gorochov G. IgA dominates the early neutralizing antibody response to SARS-CoV-2. Sci Transl Med. 2021, 13, eabd2223. [CrossRef]
- Bossen C, Schneider P. BAFF, APRIL and their receptors: structure, function and signaling. Semin Immunol. 2006, 18, 263–75. [CrossRef] [PubMed]
- Smulski CR, Eibel H. BAFF and BAFF-Receptor in B Cell Selection and Survival. Front Immunol. 2018, 9, 2285. [CrossRef]
- Brink, R. Regulation of B cell self-tolerance by BAFF. Semin Immunol. 2006, 18, 276–83. [Google Scholar] [CrossRef]
- Elgueta R, Benson MJ, de Vries VC, Wasiuk A, Guo Y, Noelle RJ. Molecular mechanism and function of CD40/CD40L engagement in the immune system. Immunol Rev. 2009, 229, 152–72. [CrossRef]
- Bubar KM, Reinholt K, Kissler SM, Lipsitch M, Cobey S, Grad YH, Larremore DB. Model-informed COVID-19 vaccine prioritization strategies by age and serostatus. Science. 2021, 371, 916–921. [CrossRef]
- de-Oliveira-Pinto LM, Fiestas Solórzano VE, de Lourdes Martins M, Fernandes-Santos C, Damasco PH, de Siqueira MAMT, Dias HG, Pauvolid-Corrêa A, Damasco PV, de Azeredo EL. Comparative Analysis of Circulating Levels of SARS-CoV-2 Antibodies and Inflammatory Mediators in Healthcare Workers and COVID-19 Patients. Viruses 2022, 14, 455. [CrossRef]
- Ministério da Saúde. Guia de Vigilância Epidemiológica Emergência de Saúde Pública de Importância Nacional Pela Doença Pelo Coronavirus. Ministério da Saúde; Brasília, Brasil, 2022.
- Familiar-Macedo D, Vieira Damasco P, Fiestas Solórzano VE, Carnevale Rodrigues J, Sampaio de Lemos ER, Barreto Dos Santos F, Agudo Mendonça Teixeira de Siqueira M, Leal de Azeredo E, de-Oliveira-Pinto LM. Inflammatory and cytotoxic mediators in COVID-19 patients and in ChAdOx1 nCoV-19 (AZD1222) vaccine recipients. Cytokine 2023, 171, 156350.
- Badolato-Corrêa J, Carvalho FR, Paiva IA, Familiar-Macedo D, Dias HG, Pauvolid-Corrêa A, Fernandes-Santos C, Lima MDRQ, Gandini M, Silva AA, Baeta Cavalcanti SM, de Oliveira SA, de Oliveira Vianna RA, de Azeredo EL, Cardoso CAA, Grifoni A, Sette A, Weiskopf D, de-Oliveira-Pinto LM. Differential Longevity of Memory CD4 and CD8 T Cells in a Cohort of the Mothers With a History of ZIKV Infection and Their Children. Front Immunol. 2021, 12, 610456. [CrossRef]
- Familiar-Macedo D, Amancio Paiva I, Badolato-Corrêa da Silva J, de Carvalho FR, Dias HG, Pauvolid-Corrêa A, Dos Santos CF, Gandini M, Silva AA, Baeta Cavalcanti SM, Artimos de Oliveira S, Artimos de Oliveira Vianna R, Leal de Azeredo E, Grifoni A, Sette A, Weiskopf D, Araújo Cardoso CA, de-Oliveira-Pinto LM. Evaluation of the Expression of CCR5 and CX3CR1 Receptors and Correlation with the Functionality of T Cells in Women infected with ZIKV during Pregnancy. Viruses 2021, 13, 191. [CrossRef]
- Paiva IA, Familiar-Macedo D, Badolato-Corrêa J, Carvalho FR, Dias HG, Pauvolid-Corrêa A, Santos CFD, Silva AA, Azeredo EL, Vianna RAO, Cardoso CAA, Grifoni A, Sette A, Weiskopf D, de-Oliveira-Pinto LM. Involvement of Th1Th17 Cell Subpopulations in the Immune Responses of Mothers Who Gave Birth to Children with Congenital Zika Syndrome (CZS). Viruses 2022, 14, 250. [CrossRef]
- Wang Y, Wang X, Luu LDW, Li J, Cui X, Yao H, Chen S, Fu J, Wang L, Wang C, Yuan R, Cai Q, Huang X, Huang J, Li Z, Li S, Zhu X, Tai J.Single-cell transcriptomic atlas reveals distinct immunological responses between COVID-19 vaccine and natural SARS-CoV-2 infection. J Med Virol. 2022, 94, 5304–5324.
- Lo Tartaro D, Paolini A, Mattioli M, Swatler J, Neroni A, Borella R, Santacroce E, Di Nella A, Gozzi L, Busani S, Cuccorese M, Trenti T, Meschiari M, Guaraldi G, Girardis M, Mussini C, Piwocka K, Gibellini L, Cossarizza A, De Biasi S. Detailed characterization of SARS-CoV-2-specific T and B cells after infection or heterologous vaccination. Front Immunol. 2023, 14, 1123724. [CrossRef]
- Inoue T, Kurosaki T. Memory B cells. Nat Rev Immunol. 2024, 24, 5–17. [CrossRef] [PubMed]
- Jagannathan P, Wang TT. Immunity after SARS-CoV-2 infections. Nat Immunol. 2021, 22, 539–540. [CrossRef] [PubMed]
- Byazrova M, Yusubalieva G, Spiridonova A, et al. Pattern of circulating SARS-CoV-2-specific antibody-secreting and memory B-cell generation in patients with acute COVID-19. Clin Transl Immunology. 2021;10, e1245. Published 2021 Jan 31. [CrossRef]
- Nutt SL, Hodgkin PD, Tarlinton DM, Corcoran LM. The generation of antibody-secreting plasma cells. Nat Rev Immunol. 2015;15, 160-171. [CrossRef]
- Lee T, Kim Y, Kim HJ, Ha NY, Lee S, Chin B, Cho NH. Acute Surge of Atypical Memory and Plasma B-Cell Subsets Driven by an Extrafollicular Response in Severe COVID-19. Front Cell Infect Microbiol. 2022, 12, 909218, Erratum in: Front Cell Infect Microbiol. 2023, 13, 1178630. [CrossRef]
- Pušnik J, Richter E, Schulte B, Dolscheid-Pommerich R, Bode C, Putensen C, Hartmann G, Alter G, Streeck H. Memory B cells targeting SARS-CoV-2 spike protein and their dependence on CD4+ T cell help. Cell Rep. 2021, 35, 109320. [CrossRef]
- Fryer HA, Hartley GE, Edwards ESJ, O'Hehir RE, van Zelm MC. Humoral immunity and B-cell memory in response to SARS-CoV-2 infection and vaccination. Biochem Soc Trans. 2022, 50, 1643–1658. [CrossRef] [PubMed]
- Radbruch A, Muehlinghaus G, Luger EO, et al. Competence and competition: the challenge of becoming a long-lived plasma cell. Nat Rev Immunol. 2006;6, 741-750. [CrossRef]
- Brieva JA, Roldán E, Rodríguez C, Navas G. Human tonsil, blood and bone marrow in vivo-induced B cells capable of spontaneous and high-rate immunoglobulin secretion in vitro: differences in the requirements for factors and for adherent and bone marrow stromal cells, as well as distinctive adhesion molecule expression. Eur J Immunol. 1994;24, 362-366. [CrossRef]
- Schultheiß C, Paschold L, Simnica D, Mohme M, Willscher E, von Wenserski L, Scholz R, Wieters I, Dahlke C, Tolosa E, Sedding DG, Ciesek S, Addo M, Binder M. Next-Generation Sequencing of T and B Cell Receptor Repertoires from COVID-19 Patients Showed Signatures Associated with Severity of Disease. Immunity 2020, 53, 442–455e4. [CrossRef]
- Wang H, Yan D, Li Y, et al. Clinical and antibody characteristics reveal diverse signatures of severe and non-severe SARS-CoV-2 patients. Infect Dis Poverty. 2022;11, 15. Published 2022 Feb 2. [CrossRef]
- Alturaiki W, Alkadi H, Alamri S, et al. Association between the expression of toll-like receptors, cytokines, and homeostatic chemokines in SARS-CoV-2 infection and COVID-19 severity. Heliyon. 2023;9, e12653. [CrossRef]
- Gupta S, Clark ES, Termini JM, Boucher J, Kanagavelu S, LeBranche CC, Abraham S, Montefiori DC, Khan WN, Stone GW. DNA vaccine molecular adjuvants SP-D-BAFF and SP-D-APRIL enhance anti-gp120 immune response and increase HIV-1 neutralizing antibody titers. J Virol. 2015, 89, 4158–69. [CrossRef]
- Folegatti PM, Ewer KJ, Aley PK, Angus B, Becker S, Belij-Rammerstorfer S, Bellamy D, Bibi S, Bittaye M, Clutterbuck EA, Dold C, Faust SN, Finn A, Flaxman AL, Hallis B, Heath P, Jenkin D, Lazarus R, Makinson R, Minassian AM, Pollock KM, Ramasamy M, Robinson H, Snape M, Tarrant R, Voysey M, Green C, Douglas AD, Hill AVS, Lambe T, Gilbert SC, Pollard AJ; Oxford COVID Vaccine Trial Group. Safety and immunogenicity of the ChAdOx1 nCoV-19 vaccine against SARS-CoV-2: a preliminary report of a phase 1/2, single-blind, randomised controlled trial. Lancet 2020, 396, 467–478, Epub 2020 Jul 20. Erratum in: Lancet. 2020, 396, 466. Erratum in: Lancet. 2020, 396, 1884. [CrossRef]
- Bidgood SR, Tam JC, McEwan WA, Mallery DL, James LC. Translocalized IgA mediates neutralization and stimulates innate immunity inside infected cells. Proc Natl Acad Sci U S A.
Figure 1.
Spike 1-specific antibody-secreting cells (ASCs) in patients with COVID-19 and vaccinated individuals. (A) Representative colored spots of pan IgG+ and Spike 1-specific ASCs were demonstrated in healthy donors (HD), patients with acute COVID-19 (acute), recovered individuals (recovered), and vaccinated individuals (vaccinated). HD (n=11) are shown in black, patients with acute COVID-19 (n=19) are shown in blue, unvaccinated recovered individuals (n=11) are shown in green, and vaccinated individuals (n = 11) after 35 days of the second dose of AZD1222 are marked in orange. (B) The frequencies of “pan” IgG+ ASCs and (C) of Spike 1-specific ASCs relative to 106 peripheral blood mononuclear cells (PBMCs) are demonstrated. Red dots indicate five acute fatal cases. Violin plots show the median (middle line) and describe numerical data distributions using density curves. In (D), the frequency of responders, considering people who detected Spike 1 antigen-specific ASCs above or equal to 10, is represented in bars. P values were calculated using the Kruskal–Wallis test, Dunn's multiple comparisons test (B to C), and the Chi-square test t (D). *P < 0.01.
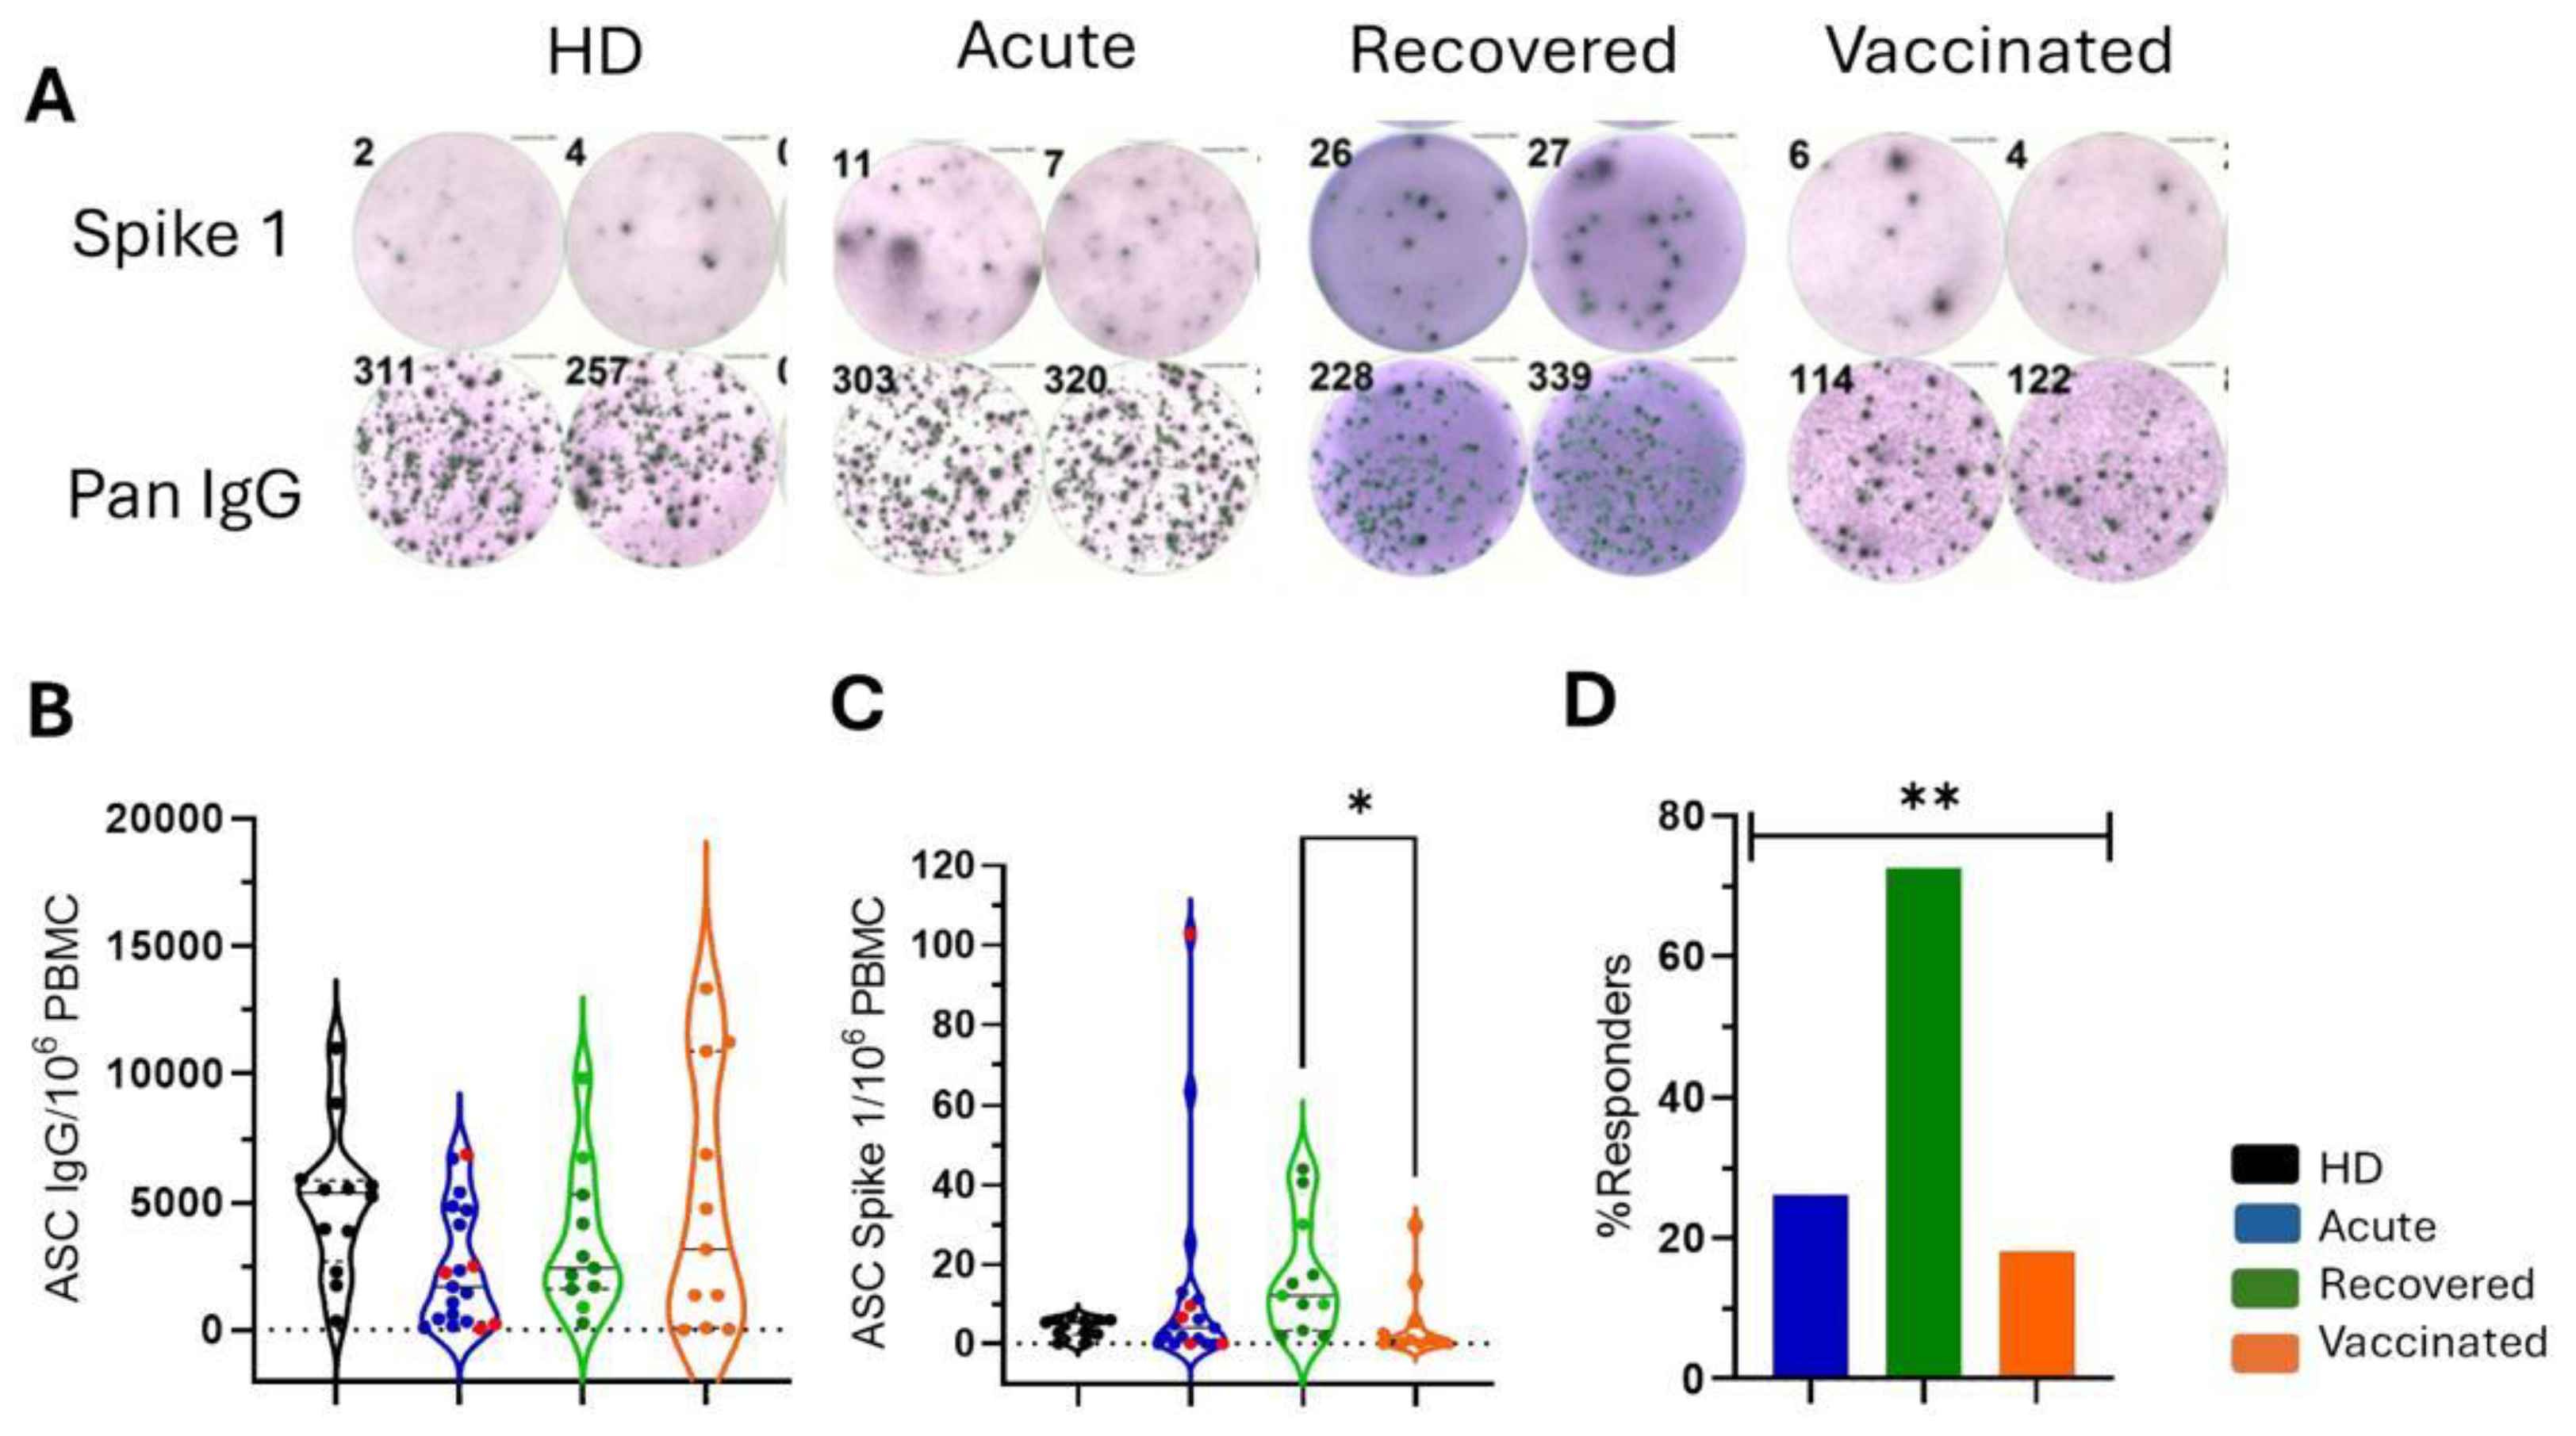
Figure 2.
Frequencies of total B cells and B cell subpopulations in all groups of individuals. The gating strategy is displayed with arrows pointing to the next gating level. After selecting the morphological gate (FSC-A x SSC-A), a gate with only viable cells was selected, considering those whose dye reactivity is restricted to cell surface amines, resulting in less intense fluorescence. The frequencies of (A) total B cells (CD19+) and about total B cells are shown: (B) naive B cells (CD27-IgD+), (C) double negative B cells (CD27-IgD-), (D) plasma cells (CD27+CD38+), and (E) memory B cells (CD27+IgD-). Healthy donors (HD; n=4) are shown in black, patients with acute COVID-19 (acute; n=13) are shown in blue, unvaccinated recovered individuals (recovered; n=8) are shown in green, and vaccinated individuals (vaccinated; n = 11) after 35 days of the second dose of AZD1222 were marked in orange. Red dots indicate three acute fatal cases. Violin plots show the median (middle line) and describe numerical data distributions using density curves. P values were calculated using the Kruskal-Wallis test, Dunn's multiple comparisons test (A to E), and the Wilcoxon matched-pairs signed rank test t (F). *P < 0.05, **P < 0.01. HD, healthy donors.
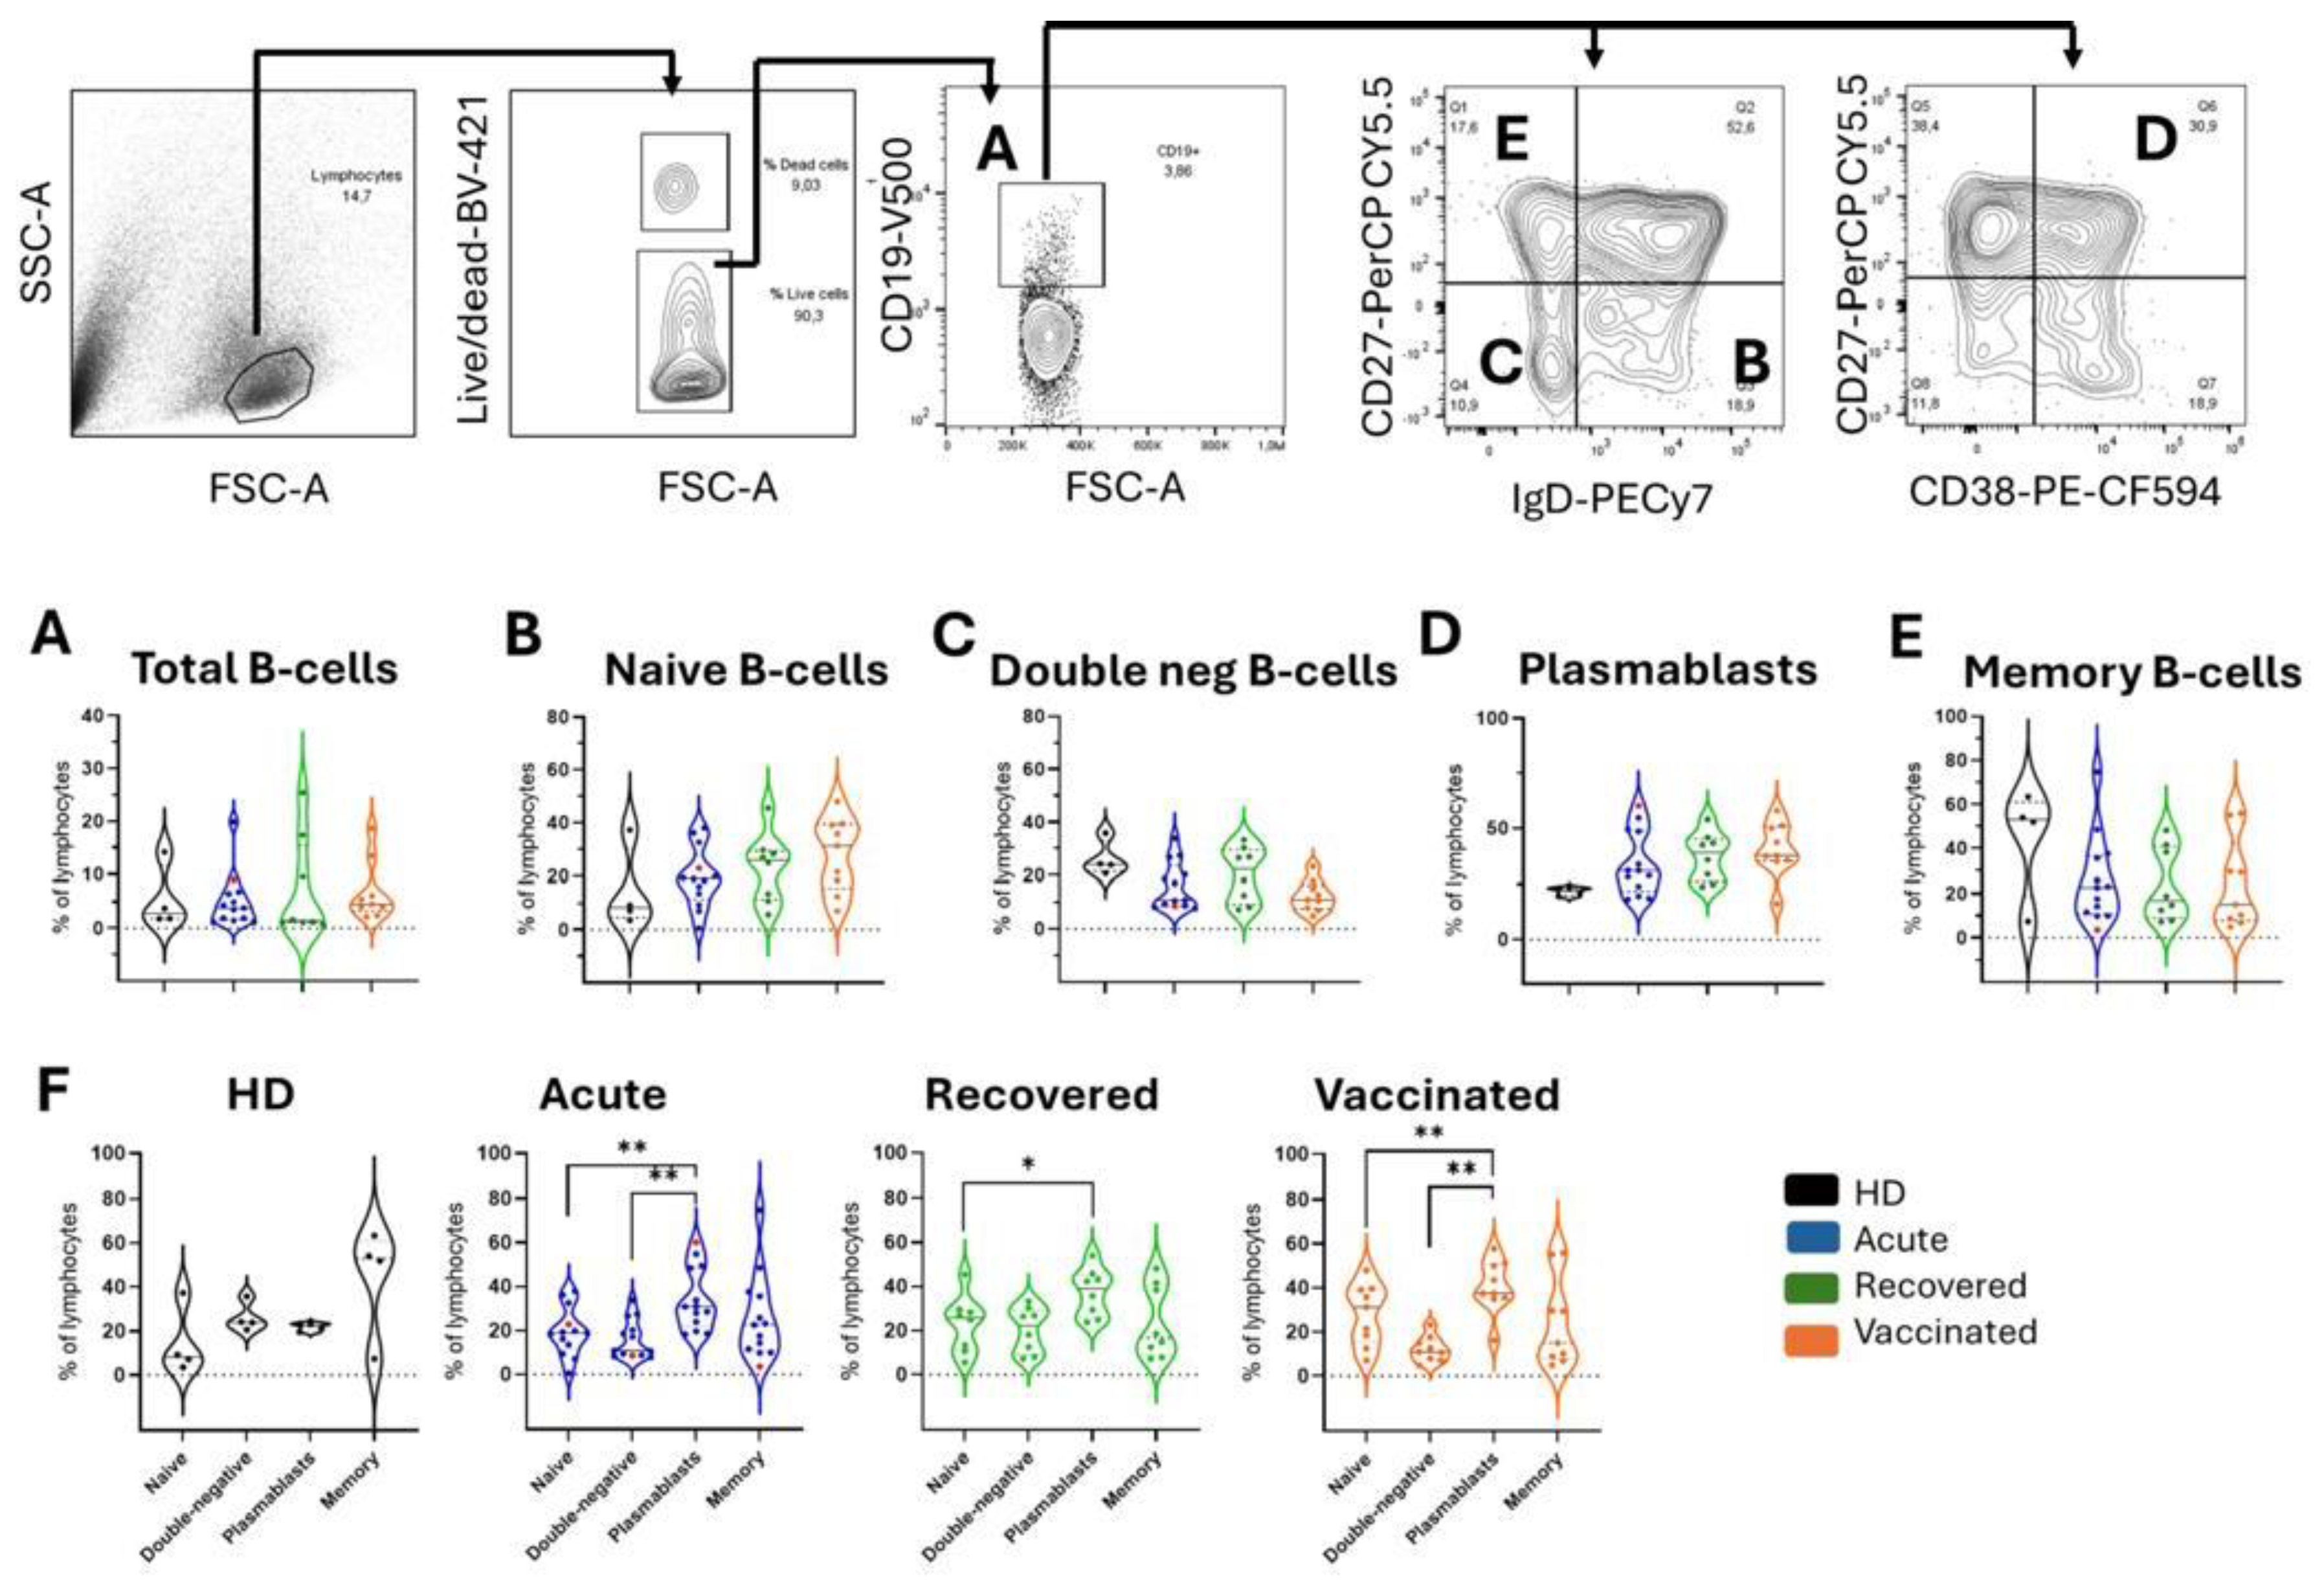
Figure 3.
Quantification of soluble APRIL, BAFF, and CD40L in all groups of individuals. In (A) APRIL, (B) BAFF, and (C) CD40L quantification in Healthy donors (HD; n=4 in black), patients with acute COVID-19 (acute; n=18 in blue), unvaccinated recovered COVID-19 individuals (recovered; n=10 in green), and vaccinated individuals (vaccinated; n = 11 in orange) after 35 days of the second dose of AZD1222. Red dots indicate five acute fatal cases. Violin plots show the median (middle line) and describe numerical data distributions using density curves. P values were calculated using the Kruskal-Wallis test, followed by Dunn's multiple comparisons test. In (D), a statistically significant correlation was demonstrated between the total number of B cells and soluble BAFF levels in patients with acute COVID-19. The Spearman correlation test was used.

Figure 4.
Differential profile of IgA and IgG plasma cells and memory B-cells. (A) The circulating IgA/IgG ratio against the SARS-CoV2 Spike 1 protein in patients with acute COVID-19 (acute; n=28 in blue), unvaccinated recovered individuals (recovered; n=15 in green), and vaccinated individuals (vaccinated; n = 11 in orange) after the second dose of AZD1222. Red dots indicate eight acute fatal cases. Violin plots show the median (middle line) and describe numerical data distributions using density curves. P values were calculated using Kruskal–Wallis and Dunn's multiple comparison test. Longitudinal (B) Spike 1 IgA and Spike 1 IgG are demonstrated before vaccination (T0) and over two doses (T1 = 14 days, and T2 = 35 days) in 11 vaccinees. The Friedman test, followed by Dunn's multiple comparison test, was used. (C) The gating strategy is displayed with arrows pointing to the next gating level. Frequencies of IgA+ or IgG+ are shown in plasma cells (CD27+CD38+) and memory B cells (CD27+IgD-) in vaccinated individuals. (D) Data with statistical differences from the Wilcoxon matched-pairs signed-rank test in the acute, recovered, and vaccinated groups were presented. In (E), a statistically significant correlation was demonstrated between the IgA+ or IgG+ plasma cells and soluble BAFF levels in patients with acute COVID-19. The Spearman correlation test was used.
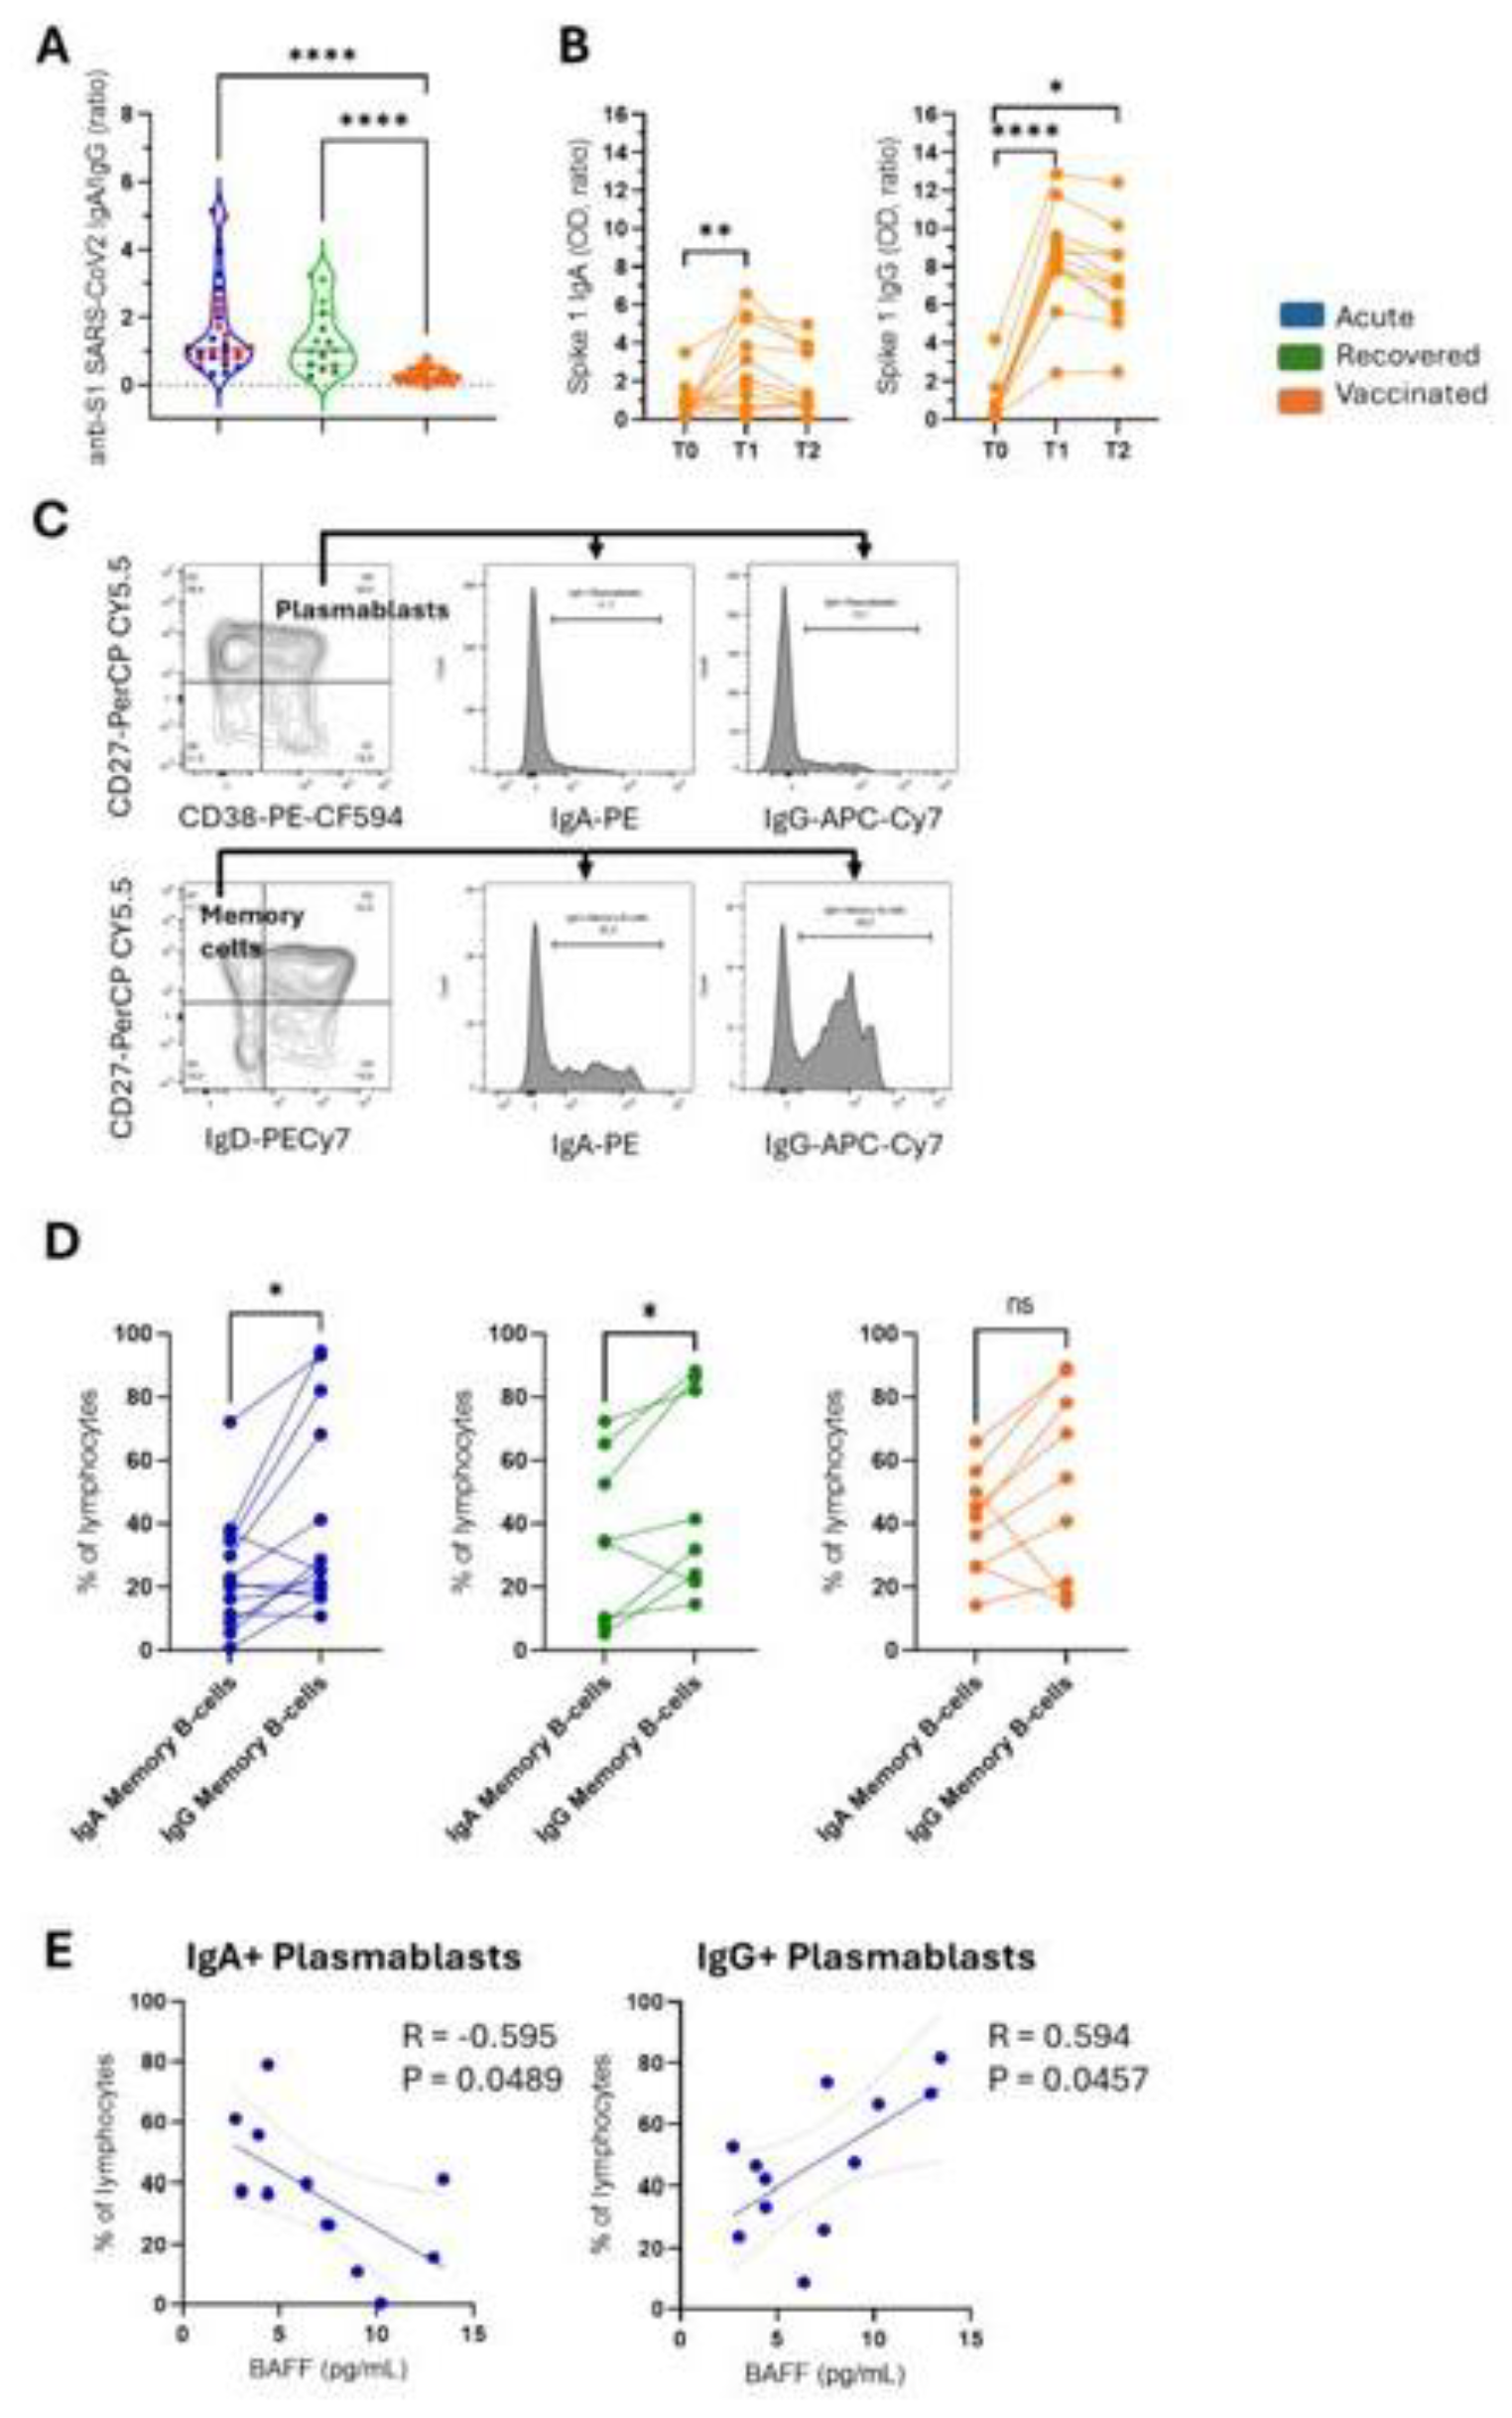

Table 1.
Demographic and clinical characteristics of patients with COVID-19 and vaccine recipients.
| HD | COVID-19 | ADZ1222 | |||
|---|---|---|---|---|---|
| Acute | Recovered | Vaccinated | |||
| Total | 11 | 28 | 15 | 11 | p |
| Female (%) | 64.7 | 50 | 87.5 | 63.6 | |
| Age (years)a | 32 (25–61) |
55 (24–97) |
35 (23–51) |
33 (25–61) |
HD x acute* acute x vaccinated* |
| Days after symptom onset b | NA | 7 (2–19) | 23 (17–38) | NA | |
| Hospitalization (%) | NA | 32 | 0 | NA | |
| Death (%) | NA | 28.6 | 0 | NA | |
aData are expressed as median (minimum-maximum); b Acute symptoms reported by participants; NA: not applicable; NI: not informed; (*) Bold values denote statistical significance (p < 0.05). The non-parametric Kruskal–Wallis test was used for quantitative variables (age and number of days after symptom onset). The appropriate chi-square or Fisher’s exact test was used for categorical variables. HD, healthy donor.
Disclaimer/Publisher’s Note: The statements, opinions and data contained in all publications are solely those of the individual author(s) and contributor(s) and not of MDPI and/or the editor(s). MDPI and/or the editor(s) disclaim responsibility for any injury to people or property resulting from any ideas, methods, instructions or products referred to in the content. |
© 2024 by the authors. Licensee MDPI, Basel, Switzerland. This article is an open access article distributed under the terms and conditions of the Creative Commons Attribution (CC BY) license (http://creativecommons.org/licenses/by/4.0/).
Copyright: This open access article is published under a Creative Commons CC BY 4.0 license, which permit the free download, distribution, and reuse, provided that the author and preprint are cited in any reuse.


