Preprint
Article

This version is not peer-reviewed.

An Omega-K 3D SAR Imaging Algorithm Based on Fractional-Order OAM

A peer-reviewed article of this preprint also exists.

Submitted:

19 November 2024

Posted:

20 November 2024

You are already at the latest version

Abstract

Electromagnetic vortex radar, with its characteristics of carrying orbital angular momentum and spiral phase wavefront, provides a new method for achieving super-resolution radar imaging. This paper combines the characteristics of vortex electromagnetic waves with the downward-looking electromagnetic vortex SAR imaging model to conduct in-depth research and analysis of SAR imaging technology based on vortex electromagnetic waves. We design corresponding imaging models, derive the imaging echo formula, and propose a novel three-dimensional ω K imaging algorithm based on fractional orbital angular momentum (OAM), specifically targeting multiple scattering targets. The three-dimensional Omega-K imaging algorithm compresses the distance by exploiting the relationship between azimuth terms in the slow time domain to obtain the azimuth information of the target; then, by combining the two-dimensional azimuth-range imaging information, the two-dimensional azimuth-range-elevation imaging information, and the elevation information of the target, the height information of the target is determined; finally, the three-dimensional imaging of the target is completed based on the Cartesian coordinate relationship. Through experimental simulation, this paper verifies the effectiveness of the proposed imaging algorithm and successfully achieves three-dimensional imaging of point targets.

Keywords: 
;  ;  ;  

1. Introduction

SAR technology is capable of obtaining high-resolution images of the ground through clouds and fog through radar waves in various weather conditions. With the in-depth development and improvement of vortex antenna theory, the vortex Synthetic Aperture Radar (SAR) imaging algorithm is expected to become the mainstream method in SAR imaging technology. The advantage of this algorithm is that it can provide higher resolution and richer target feature information, which is essential to improve the accuracy and reliability of radar imaging. Therefore, the development of vortex SAR imaging technology will not only promote the progress of radar imaging technology, but also may bring revolutionary changes to the field of communication and remote sensing in the future.
In [1], a research team at Peking University applied vortex electromagnetic waves to traditional tomography, using vortex electromagnetic waves in different OAM modes to irradiate targets, and obtained high-resolution results with super Rayleigh resolution through echo signal processing . In [2], Academician Guo et al. proposed for the first time the application of vortex electromagnetic waves to radar imaging, combined with the spectral characteristics of the Bessel function, analyzed the approximate duality relationship between the topological charge of orbital angular momentum and the azimuth variable, and used the inverse projection and filtering-Fourier transform method to verify the potential of vortex electromagnetic waves for azimuth imaging of radar targets. In [3], Fang et al. studied the application potential of electromagnetic vortex waves in the field of Synthetic Aperture Radar (SAR), verified the feasibility of electromagnetic vortex SAR imaging, gave a geometric model and echo signal model of SAR based on electromagnetic vortex, and proposed an improved chirp-scaling (CS) imaging algorithm for electromagnetic vortex SAR. In [4], Chen et al. from the Institute of Electronics of the Chinese Academy of Sciences combined a traditional SAR radar system with vortex electromagnetic waves to achieve a two-dimensional imaging simulation of the target through an algorithm. In [5], Wang et al. proposed a new three-dimensional imaging method based on vortex electromagnetic waves and strip synthetic aperture radar, which uses the range-Doppler (RD) algorithm to achieve the range profile and the cross-distance profile in the fast time domain and the slow time domain, and finally obtains the three-dimensional image of the target in the Cartesian coordinate system according to the spatial geometric relationship. In [6], Liu, Wang, et al. from the National University of Defense Technology deduced the RD algorithm for vortex SAR imaging, and designed a new azimuth matching filter in the azimuth direction according to the characteristics of the vortex electromagnetic wave, which realized the vortex side-view strip SAR imaging. In [7], Guo et al. proposed the equivalent fractional OAM mode for the first time to solve the aliasing problem in MIMO schemes, so as to achieve high resolution of EM vortex snow imaging. The OAM mode for transmitting and receiving is set to two adjacent integers to achieve an equivalent fractional pattern. In [8], Liu et al. proposed an electromagnetic vortex-enhanced imaging method based on the anti-noise effect of fractional OAM beams, which is robust to noise and can obtain better imaging performance in low signal-to-noise environments. In [9], Liang et al. proposed a vortex 3D imaging method for integer and fractional OAM modes. In [10], Han et al. from Inner Mongolia University of Science and Technology proposed an OAM-ωK imaging algorithm to compensate for the Bessel term and the remaining azimuth term in the echo signal, and to achieve high-resolution imaging by fusing the azimuth term and azimuth term into a new azimuth term, broadening the Doppler bandwidth and achieving high-resolution imaging.
In this paper, the latest research progress of electromagnetic vortex in the field of information modulation is discussed, and its potential application value in radar information acquisition is evaluated. By deriving the basic principles of electromagnetic vortex radar imaging detection, this paper reveals the application potential of microwave orbital angular momentum in SAR imaging. In particular, this paper proposes an innovative 3D imaging algorithm, which is based on fractional-order OAM, which can effectively deal with multi-scattering point targets and achieve accurate 3D imaging of targets. This achievement not only provides a theoretical basis for the application of electromagnetic vortex in SAR imaging, but also opens up a new path for the subsequent research of vortex SAR 3D imaging technology.

2. Imaging Model

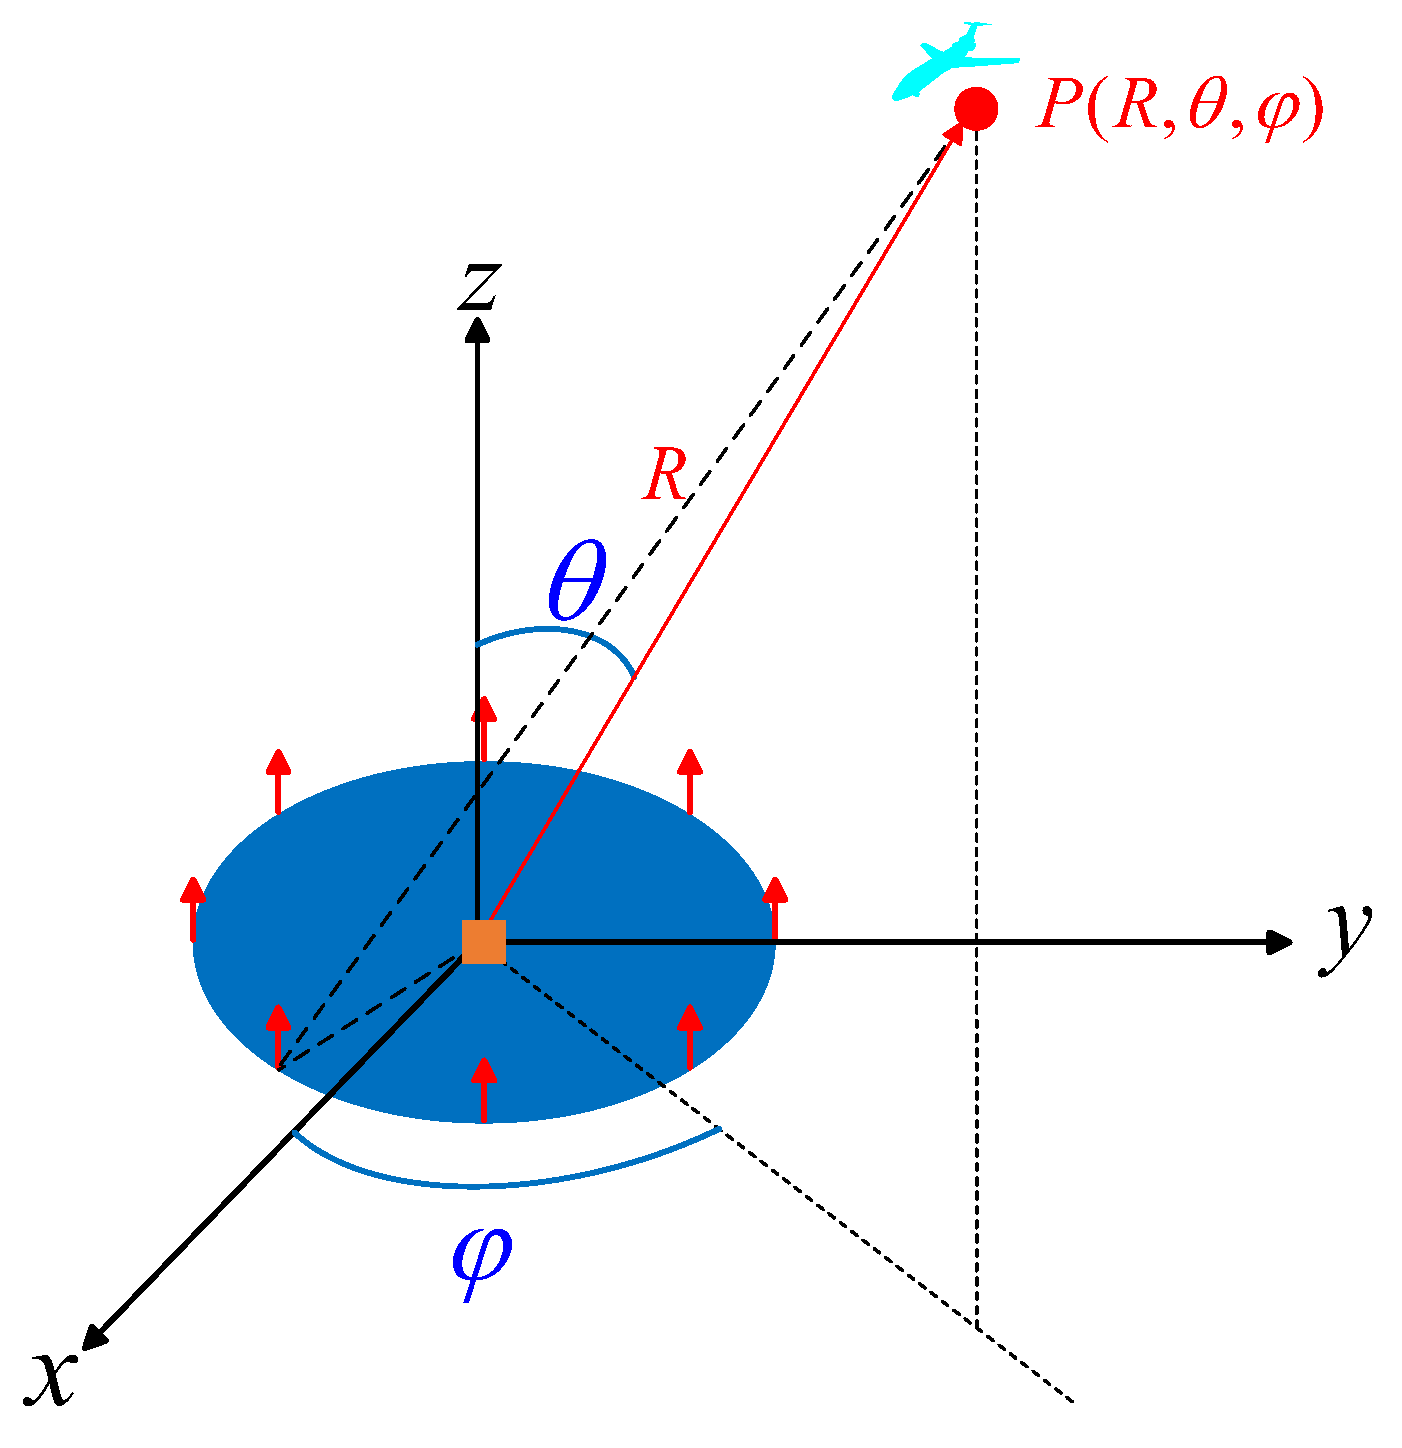
2.1. Radar-Target Imaging Model

There are many studies on the generation methods of vortex electromagnetic waves, and the Uniform Circular Array (UCA) in the microwave band has the advantage of generating multiple OAM modes [11], so the UCA as shown in Figure 1 is used to generate the vortex electromagnetic field. UCA antennas can flexibly adjust the amplitude and phase of each element and can generate vortex electromagnetic waves carrying different OAM modes, which are widely used in radar imaging. N antenna elements are arranged in a circumference, and the radius of the circumferential array is a. The coordinate system is established with the center of the circle as the origin 0 and the circumferential normal as the z-axis. The point target at any position in space is  P ( R , θ , φ ) , where  R  the slant distance from the target to the center O of the ring is in the x0y coordinate system; R  is the pitch angle, that is, the angle between the direction of the target slope and the direction of the z-axis; φ  is the azimuth angle, which is the angle between the projection of the target in the x0y plane and the direction of the x-axis.
S e ( α ) = j μ 0 ω 4 π n = 0 N 1 e j α ϕ n e j k r r n r r n d V ˜ n = j μ 0 ω d 4 π n = 0 N 1 e j k r r n r r n e j α ϕ n j μ 0 ω d N 4 π e j k r r j α J α ( k a sin ( θ ) ) e j α φ
where  μ 0  is the permeability constant in vacuum; ω is the electromagnetic wave angle frequency; k=ω/c is the wave number; j is the current density at each element of the array; d is the oscillator length of the array element; The last line of expression in Equation (1) is an approximation when the number of elements N is sufficiently large.
The fractional phase term can be expressed by summing the orthogonal integral states superposition in the form of a Fourier series. Thus, fractional-order orbital angular momentum (OAM) can be approximately composed of a series of finitely proportioned integral OAM. Specifically, the phase term carrying the angular momentum of the fractional orbit satisfies the following relation [12]:
e j l ϕ n = e j l π sin l π π ( l α ) e j α ϕ n s l = e j l π sin l π π α = α min α max j α e j α ϕ n J α ( k a sin ( θ ) ) ( l α )
where l is the resulting fractional order, α min α max is the minimum and maximum modes of the integrated OAM beam can be generated by UCA. The first type of Bessel function can be expressed as:
J α ( k a sin ( θ ) ) = j α 2 π 0 2 π e j k a sin ( θ ) cos ϕ α ϕ d φ
The transmitted signal takes the form of a fractional pattern:
S e ( l ) = j μ 0 ω 4 π n = 0 N 1 e j l ϕ n e j k r r n r r n d V ˜ n = j μ 0 ω d 4 π n = 0 N 1 e j k r r n r r n e j l π sin l π π α = α min α = α max j α e j α ϕ n J α ( k a sin ( θ ) ) ( l α ) = j μ 0 ω d 4 π e j l π sin l π π n = 0 N 1 e j k r r n r r n α = α min α = α max j α e j α ϕ n J α ( k a sin ( θ ) ) ( l α ) j μ 0 ω d N 4 π e j k r r e j l π sin l π π α = α min α = α max e j α φ ( l α ) j μ 0 ω d N 4 π e j k r r e j l φ
The received signals become:
S r ( l ) = j μ 0 ω d N 4 π e j k r r e j l φ σ e j k r r n r r n d V ˜ n j μ 0 ω d 2 N 4 π σ e j 2 k r r 2 e j l φ
Normalization of the execution range [13]:
S ( l ) σ e j 2 k r r 2 e j l φ

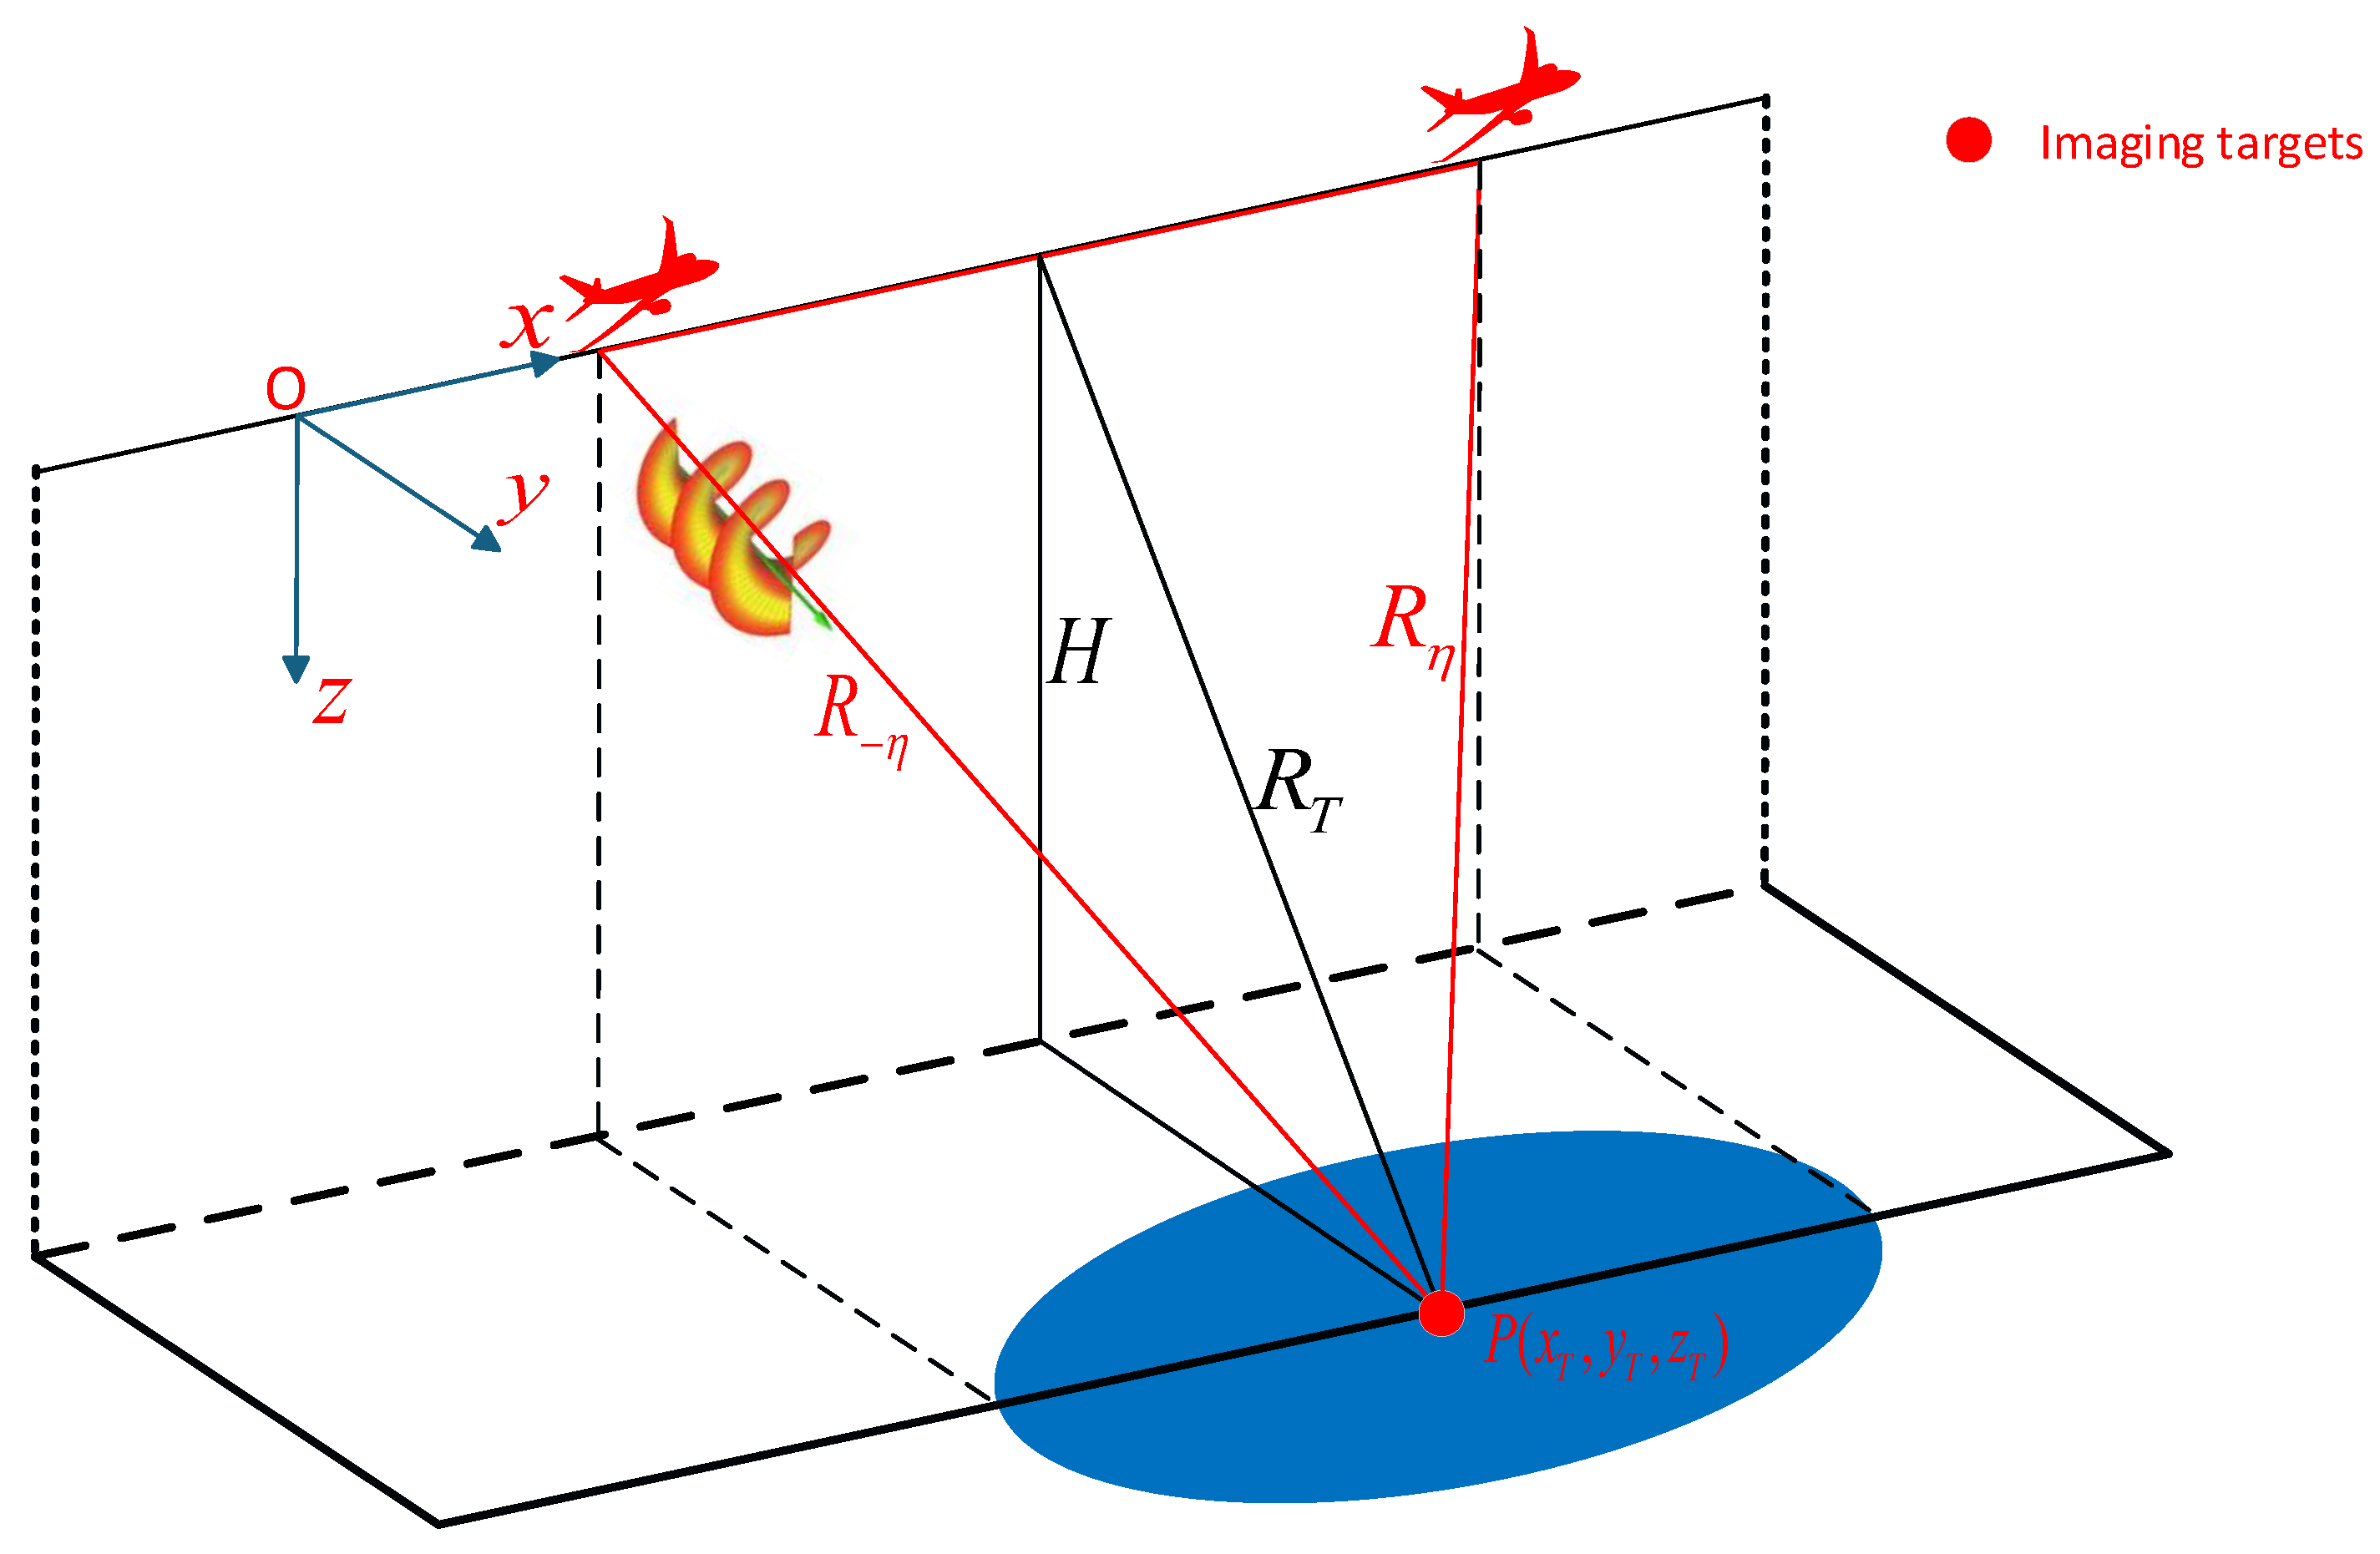
2.2. SAR Imaging Model

As shown in the figure, the radar flies at velocity v along the azimuth direction (heading), and uses the UCA antenna that can generate eddy electromagnetic waves in different OAM modes to irradiate the imaging area from the side. The position of the receiving element is the center of the ring, which changes with the position of the radar, the height from the ground is H, the number of elements is N, and the radius of the array is a. The x-axis direction is called the slow-time direction, the y-axis direction is called the fast-time direction, and the z-axis direction is called the height direction. Radar position:  P R ( x , 0 , 0 ) , where x = vηT, point target location in the imaging scene:  P T ( x T , y T , z T ) . The instantaneous distance between the radar and the target is  R ( η η T ) , and the shortest distance between the radar and the target is  R T . For the imaging imaging central axis Y c , the SAR imaging model is shown in Figure 2.
R T = H 2 + Y c 2 R ( η η T ) = v 2 ( η η T ) 2 + R T 2
The instantaneous pitch angle between the radar and the target is  θ ( η η T ) , and the instantaneous azimuth angle between the radar and the target is  φ ( η η T ) . The instantaneous azimuth angle and the instantaneous pitch angle satisfy the following relationship.
θ ( η η T ) = arcsin ( v 2 ( η η T ) 2 + y T 2 v 2 ( η η T ) 2 + R T 2 )
φ ( η η T ) = arccos ( v ( η η T ) v 2 ( η η T ) 2 + y T 2 ) = arccos ( v ( η η T ) R ( η η T ) sin ( θ ( η η T ) ) )
UCA uses the emission form of LFM signal to generate vortex electromagnetic waves in different OAM modes. Under the staring condition, the expression of the received signal after orthogonal demodulation is:
S r ( η , t , l ) = σ exp ( j l φ ( η η T ) ) ω r ( t 2 R ( η η T ) c ) exp ( j π K r ( t 2 R ( η η T ) c ) 2 ) ω a ( η η T ) exp ( j 4 π R ( η η T ) λ )
Taylor expansion is performed on the instantaneous azimuth φ ( η η T ) , and the target azimuth can obtain the following relationship [14]:
φ ( η η T ) = φ ( η T ) + φ ( η η T ) ( η η T ) ( η η T ) φ ( η T ) + v ( η η T ) y T
When evaluating the azimuth resolution of a target, the Point Spread Function (PSF) of the point target is commonly used as a measure [15]:
P S F = l min l max e j l φ d l = e j l max φ e j l min φ j φ = 2 l max sin c ( l max φ )

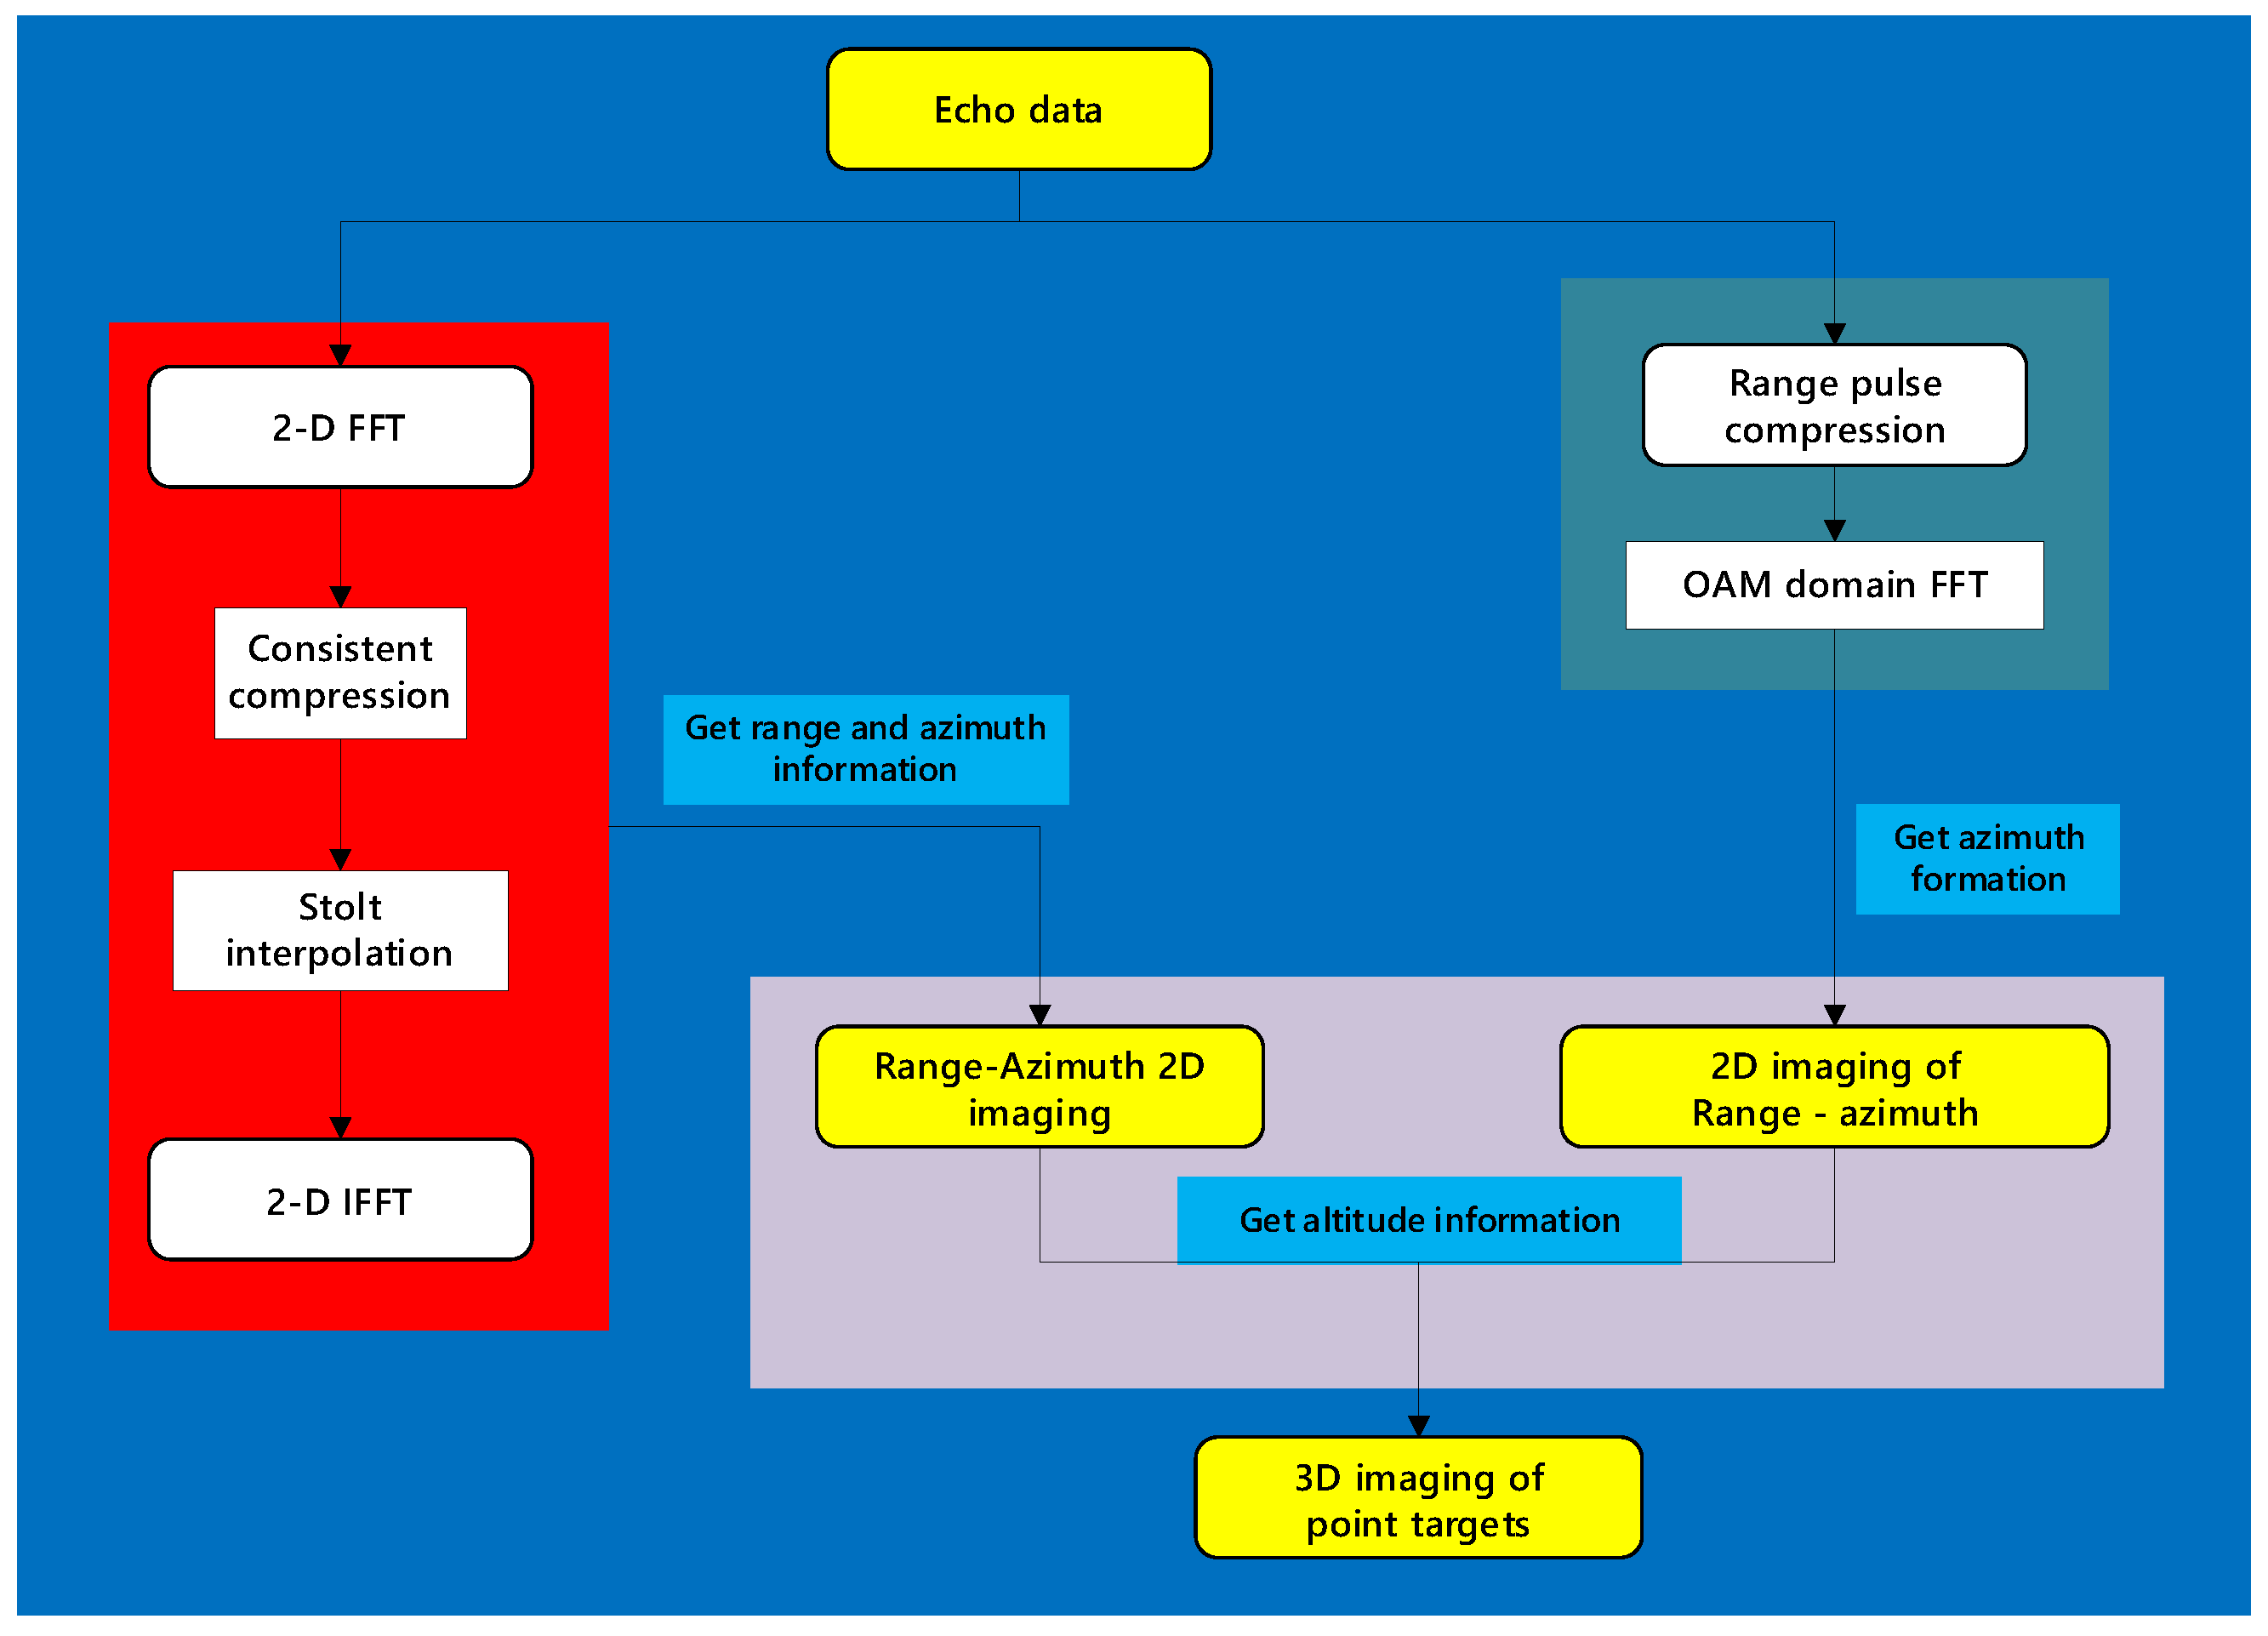
3. Omega-K 3D Imaging Algorithm

The super-resolution properties of vortex electromagnetic waves are not limited to conventional gaze imaging systems. When there is a relative motion between the radar and the target, the target azimuth introduced by the vortex electromagnetic wave in the echo is no longer a fixed value, but the tangential track information of the target is encoded into the change of azimuth through the geometric relationship of the motion. By using the super-resolution characteristics of vortex electromagnetic waves at each instantaneous track position, the third-dimensional information of the target can be obtained and resolved. The Omega-K algorithm imaging workflow can be found in Figure 3.

3.1. Range-Azimuth 2D Imaging

Using the stationary phase theorem, the integration result of the Fourier transform of range is:
S r ( η , f r , l ) = A 1 σ W r ( f r ) ω a ( η η T ) exp ( j π f r 2 K r ) exp ( j 4 π ( f 0 + f r ) R ( η η T ) c ) exp ( j l φ ( η η T ) )
Similarly, the integration result of the azimuth Fourier transform is:
S r ( f a , f r , l ) = A 1 A 2 σ W r ( f r ) W a ( η η c ) exp ( j π f r 2 K r ) exp ( 4 π R T c ( f 0 + f r ) 2 c 2 ( f a l v 2 π y ) 2 4 v 2 ) exp ( j l φ ( η T ) )
The signal is uniformly compressed using a matched filter, and the matched filter function can be written as:
H ( f a , f r ) = π f r 2 K r + 4 π R T c ( f 0 + f r ) 2 c 2 ( f a l v 2 π y ) 2 4 v 2
After consistent compression, the residual distance migration is compensated through Stolt interpolation. is Move for residual distance.
Δ f = ( f 0 + f r ) 2 c 2 ( f a l v 2 π y ) 2 4 v 2 ( f 0 + f r )
After stolt interpolation, the signal is subjected to a two-dimensional inverse Fourier transform to obtain:
S r ( η , t , l ) = A 1 A 2 σ p r ( t ) p a ( η η T ) exp ( j l φ ( η T ) )
The echo in both the fast and slow time domains appears in the form of compressed "sinc" pulses, which represent their respective PSF functions and specific expressions.
p r = K r T r sin c ( K r T r t ) p a = K a T a sin c ( K a T a η )

3.2. Range-Azimuth Two-Dimensional Imaging

Firstly, range compression is performed through fast convolution, and the time-domain result of pulse compression obtained through matched filtering is:
S r ( t , l ) = σ exp ( j l φ ( η T ) ) p r ( t 2 R c ) exp ( j 4 π R ( η η T ) λ )
By utilizing the dual relationship between OAM mode number and azimuth angle, Fourier transform is applied to the OAM domain to convert the echo into the OAM frequency domain, achieving the acquisition and resolution of target azimuth information.
The OAM domain Fourier transform can be written as:
S r ( t , f l ) = l max l max S r ( t , α ) exp ( 2 π f l l ) d l
Similarly, the integration result of Fourier transform in OAM domain is:
S r ( t , η , f l ) = σ p r ( t ) p a ( η η T ) p l ( f l φ ( η T ) 2 π )
The echo appears in the form of compressed " sinc " pulses in both the fast time domain and OAM domain, representing their respective PSF functions and specific expressions as follows:
p r = K r T r sin c ( K r T r t ) p l = 2 l max sin c ( l max φ )

3.3. Obtain Altitude Information

By transforming the coordinate system and establishing angular relationships, the elevation information of the target can be obtained.
h = R ( η η T ) cos ( θ ( η η T ) )
Thus, the target 3D SAR imaging results of fractional order OAM have been achieved.

4. Imaging Simulation

Table 1. Experimental Parameters.
Parameters value Unit
Frequency f c 10 G Hz
Radar flight speed v 150 m / s
Radar flight altitude H 2 Km
Antenna center angle β 53 °
Scope of OAM mode l [-30,30] -
Width of pulse T r 1 μ s
Bandwidth B r 300 M Hz
Synthetic aperture length 25.5 m

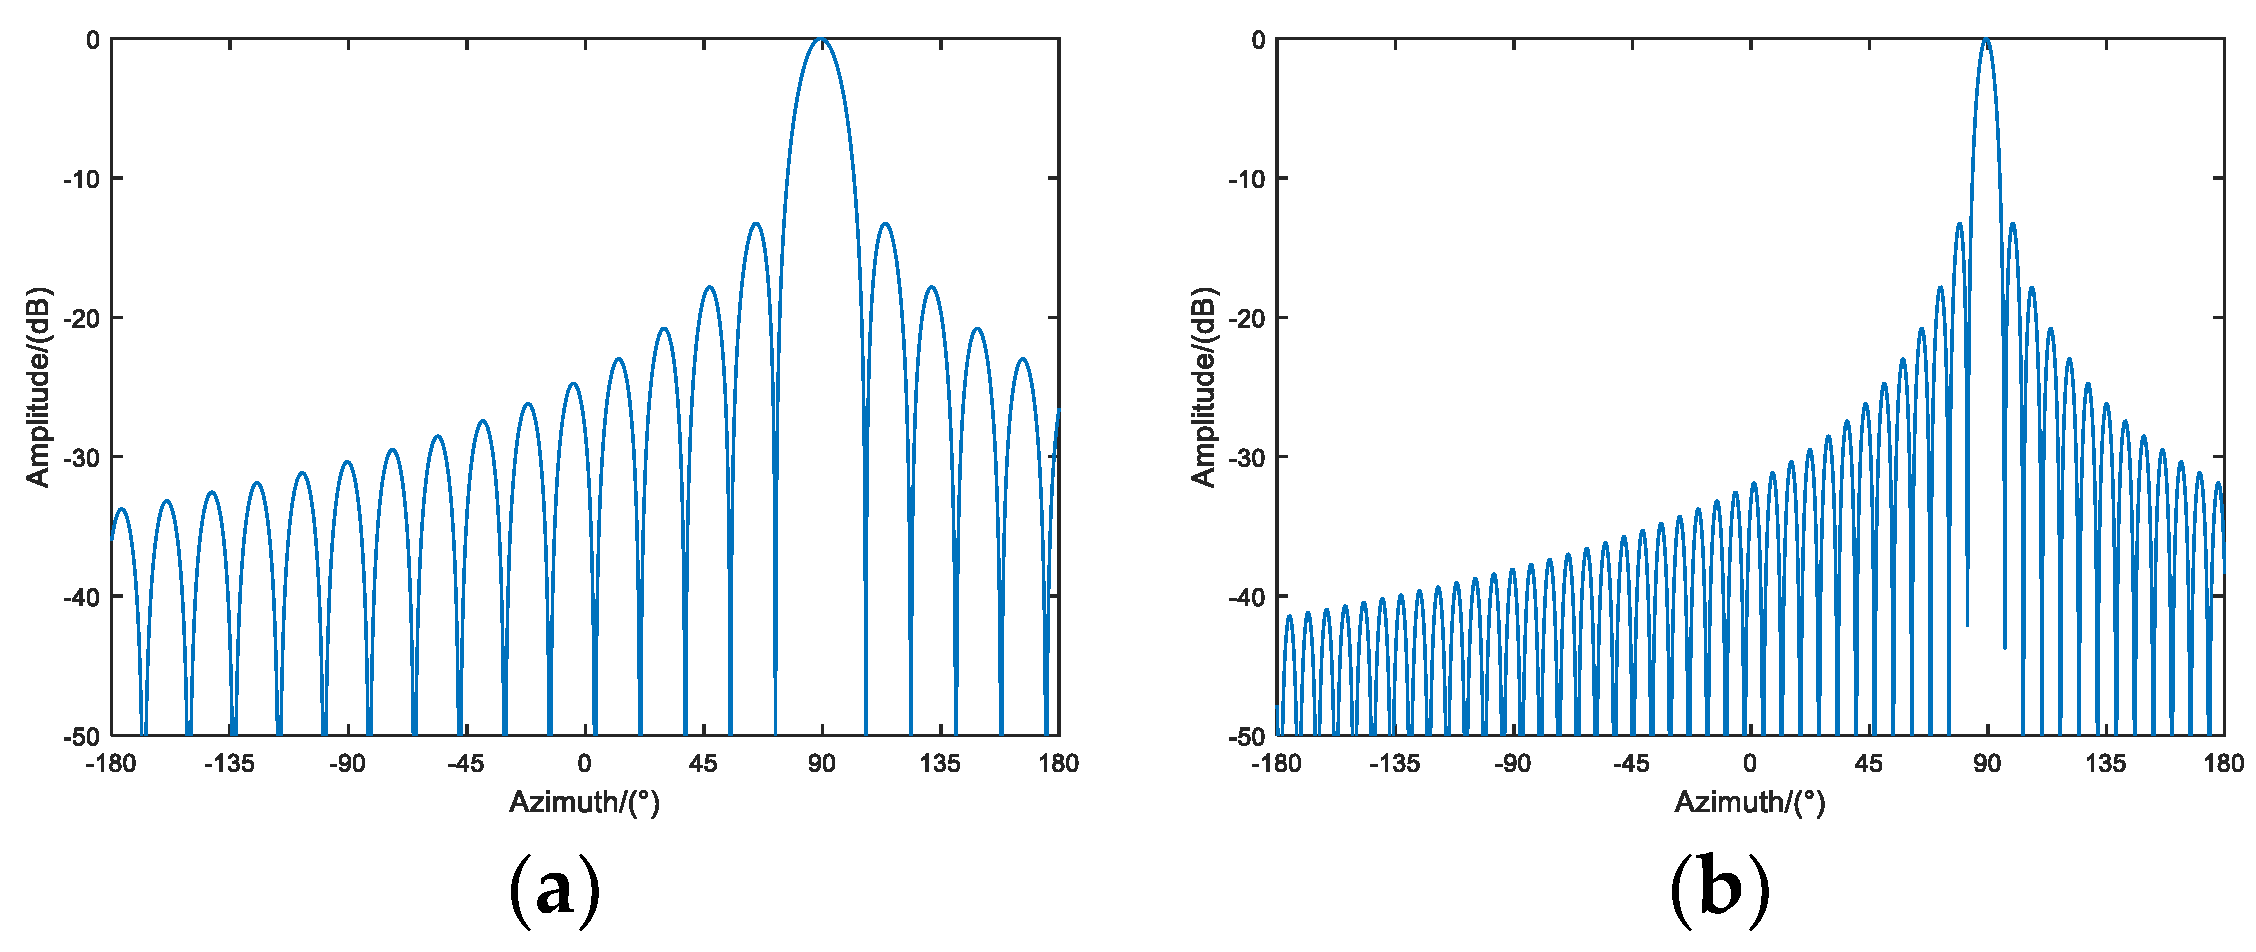
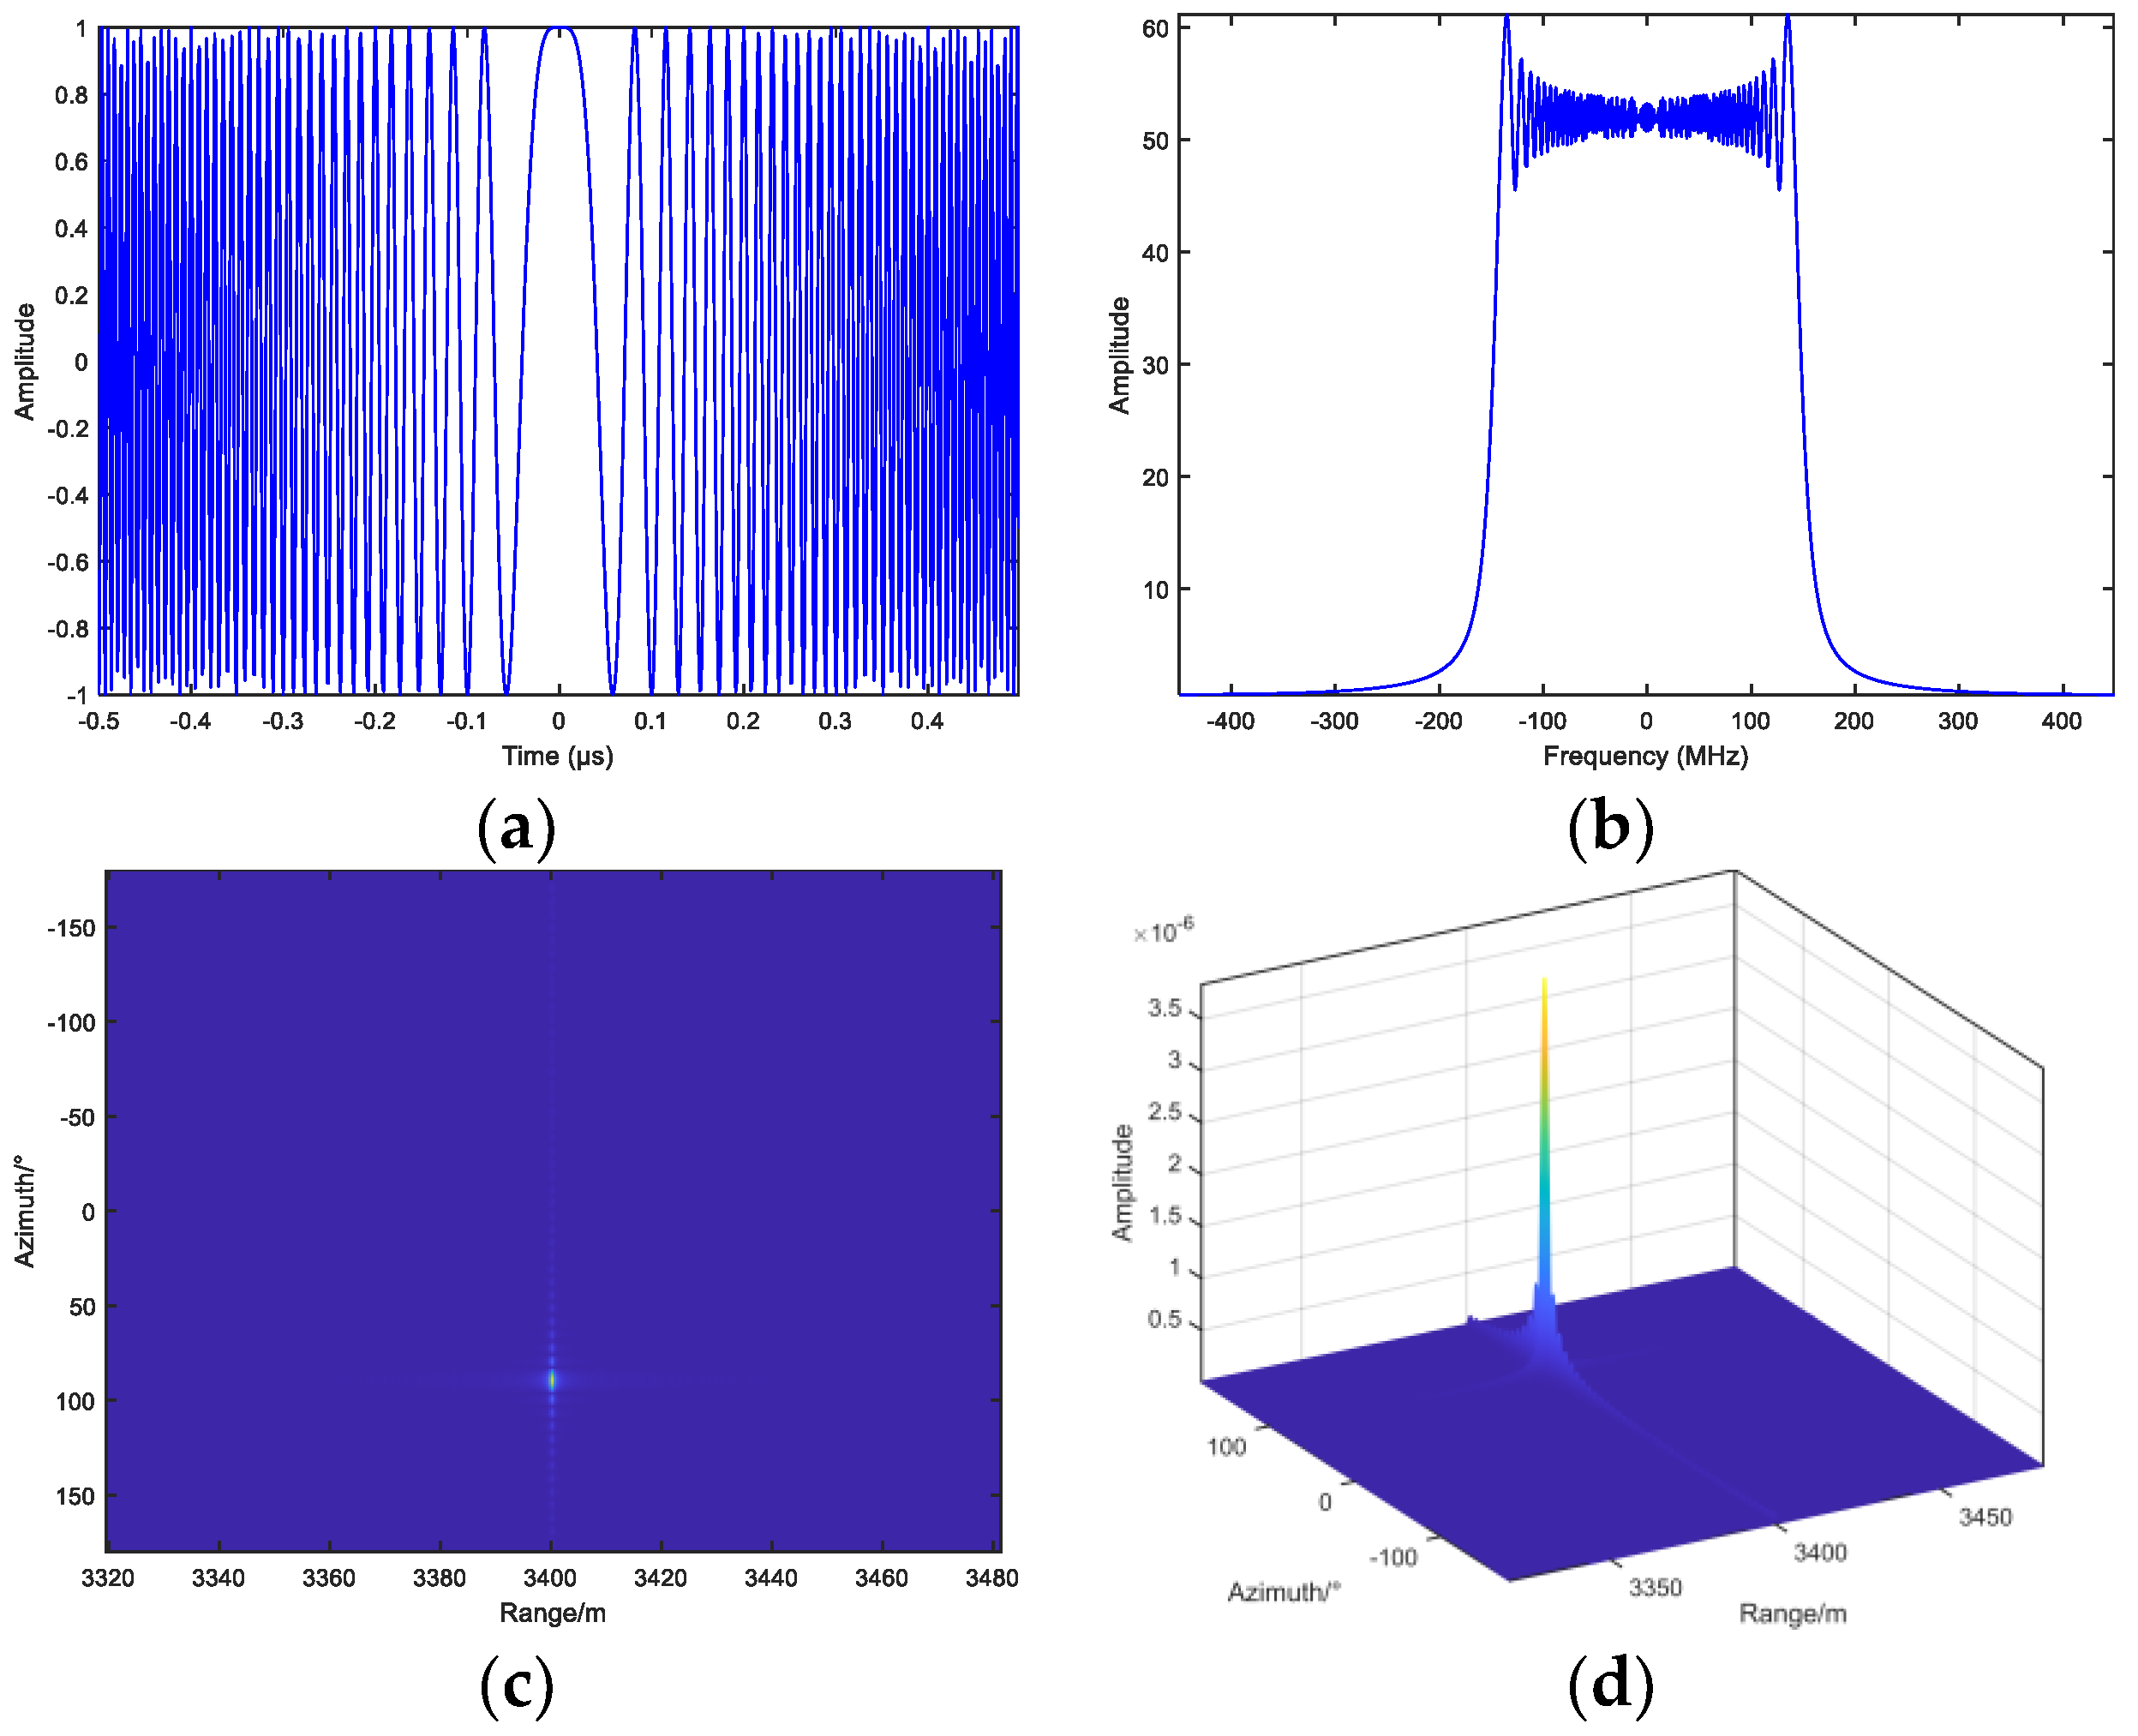
4.1. One Dimensional Imaging of Target Azimuth Angle

Based on the advantages of radar target imaging, we conducted one-dimensional imaging of target azimuth and studied the influence of different modalities on imaging resolution. This experiment is divided into two groups, one group is for the [-10.5, 10.5] modes, and the other group is for the [-25.5, 25.5] modes. Imaging point target position: P ( 30 , Y c , H ) . From the imaging results, we can see that as the increases, the azimuth imaging ability of point targets is gradually improving, and the resolution ability of point targets is gradually enhancing. The target imaging result is shown in Figure 4.

4.2. Range Heading Two-Dimensional Imaging

Based on existing imaging algorithms, we chose the Omega-K algorithm to conduct two-dimensional imaging experiments on targets in the imaging area. Imaging point target position: P ( 30 , Y c , H ) . This experiment mainly focuses on theoretical imaging simulation of single point targets. Single point experiment is the imaging of a single target. Firstly, the target is subjected to two-dimensional FFT. Secondly, the target in the two-dimensional frequency domain is uniformly compressed and stolt interpolated. Finally, the target is subjected to two-dimensional IFFT to obtain a clear two-dimensional imaging result of a point target. The two-dimensional imaging results of the point target are shown in Figure 5.
Among them, the range-to-point integrated side lobe ratio of the point target is -9.8dB and the range-to-peak side lobe ratio is -12.8dB, and the azimuth integral side lobe ratio of the point target is -10.2dB and the azimuth peak side lobe ratio is -13.0dB.

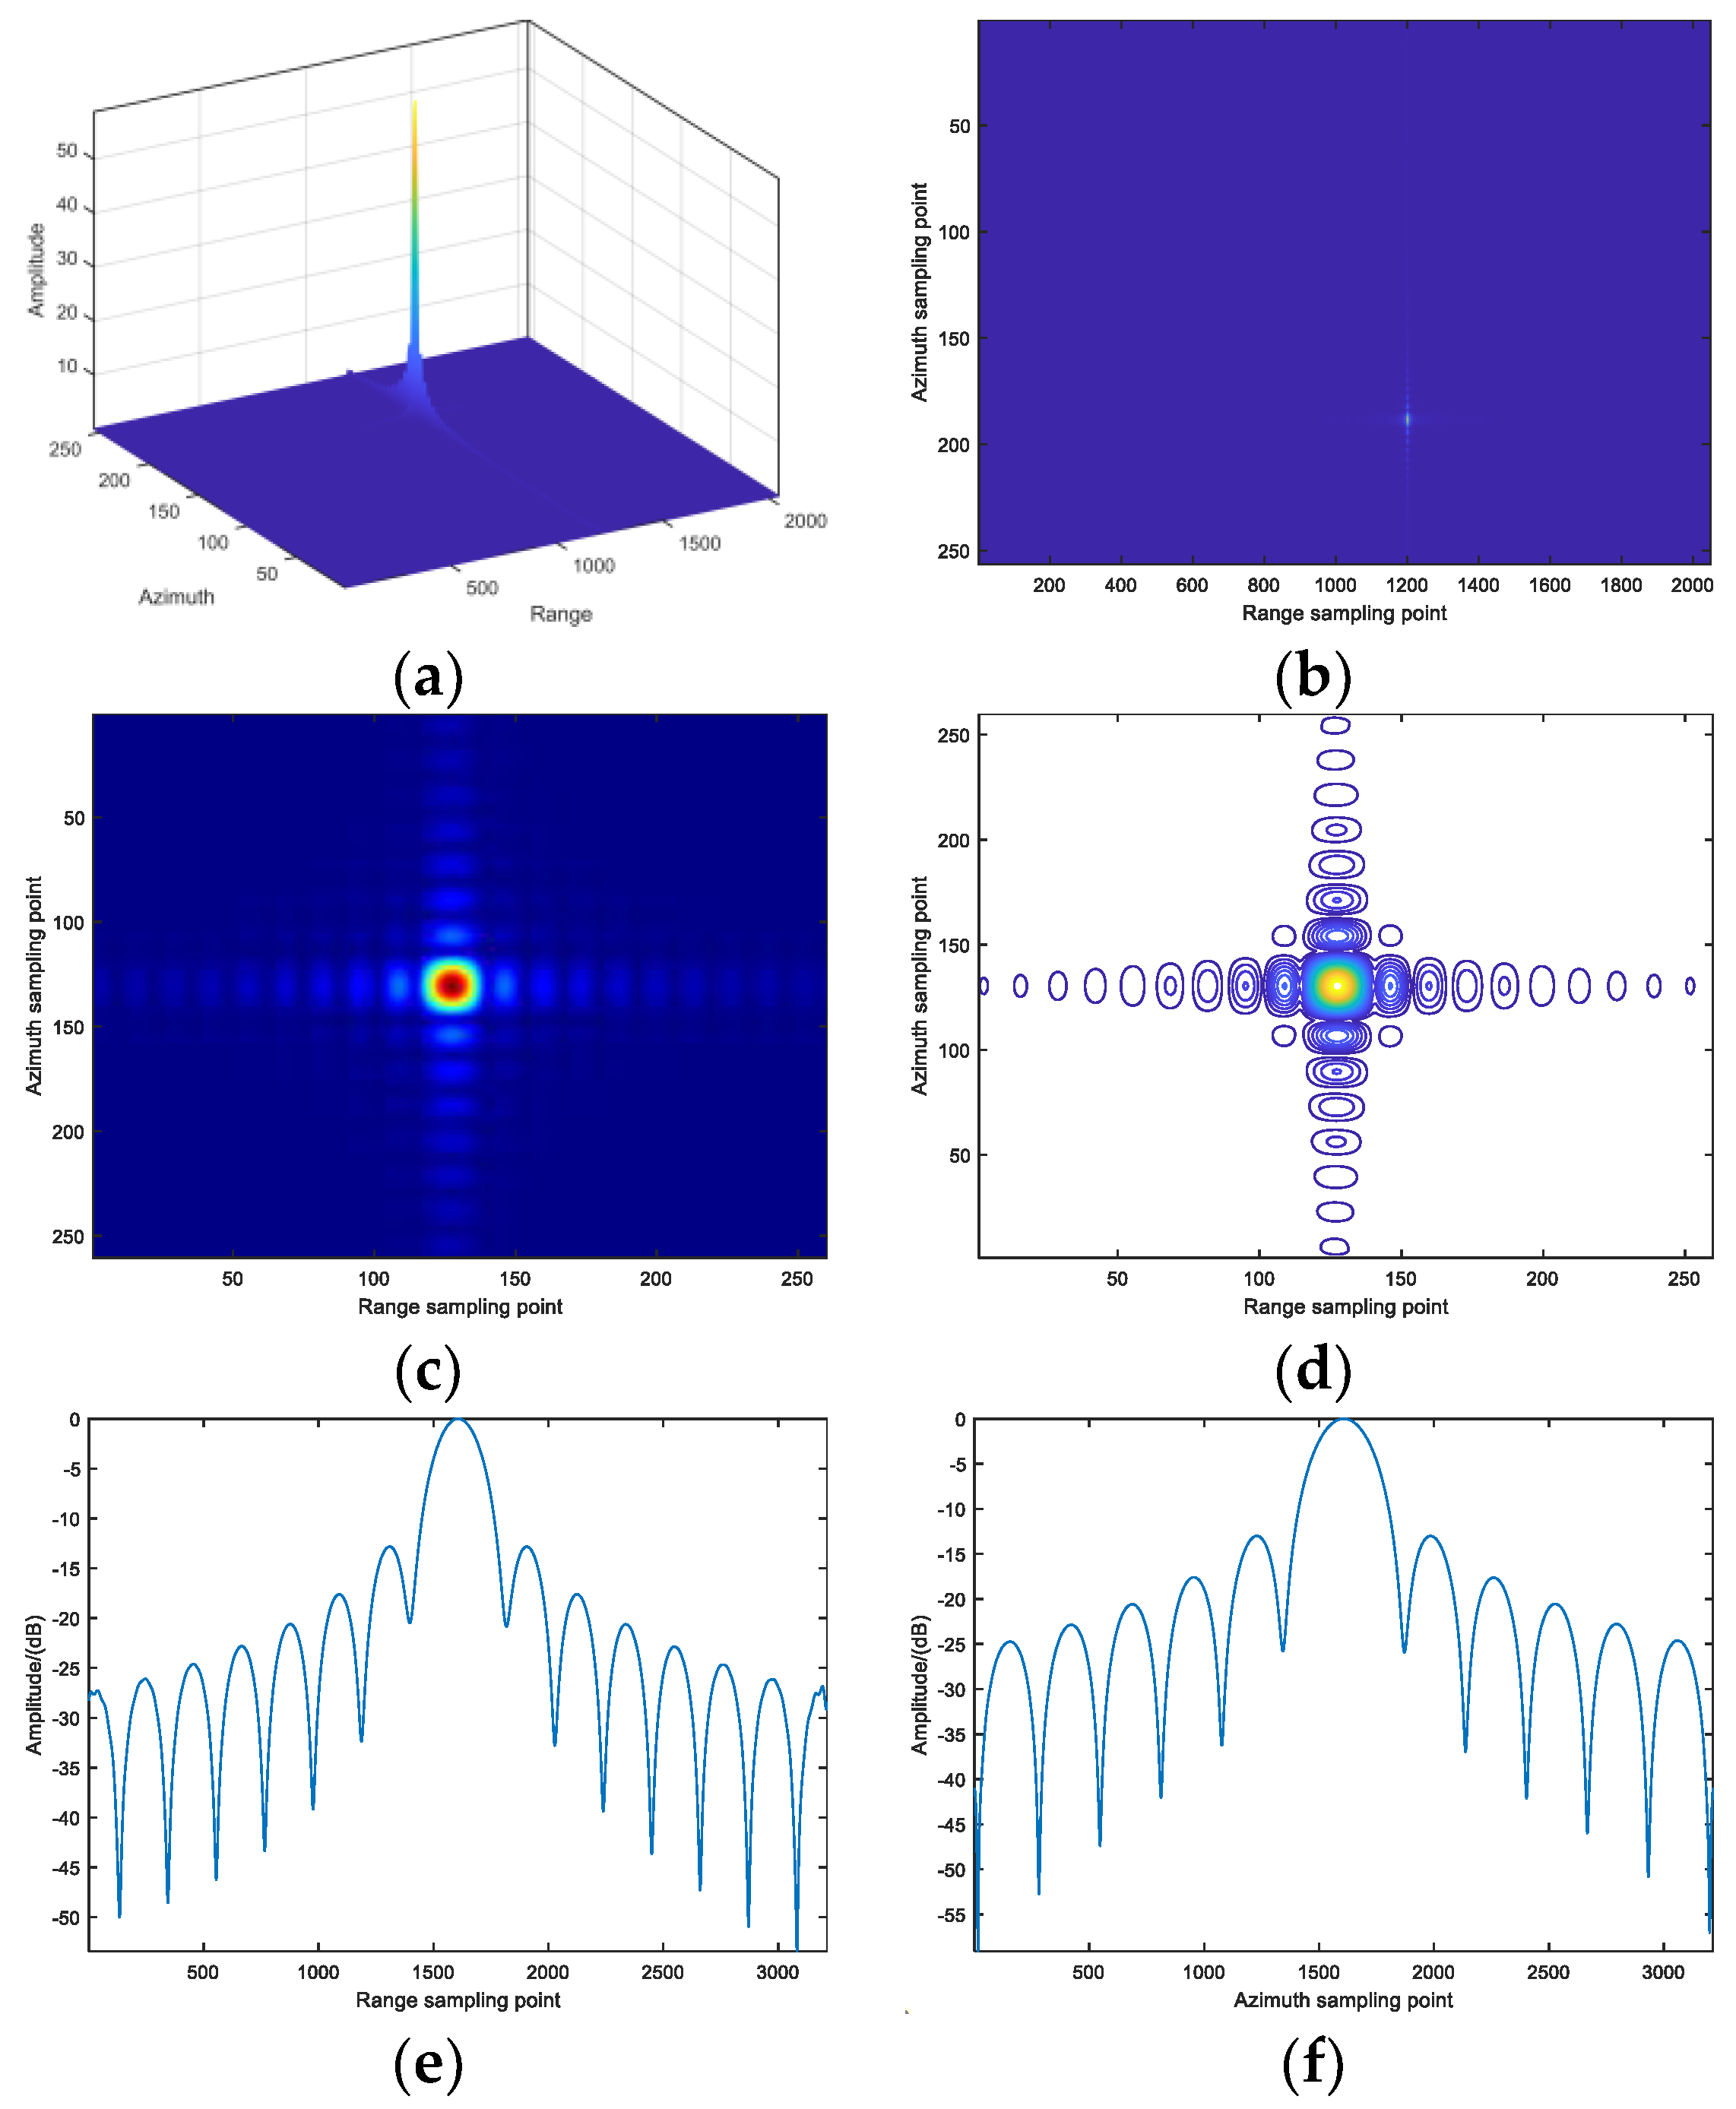
4.3. Two Dimensional Imaging Results of Target Distance and Azimuth Angle

Imaging point target position: P ( 30 , Y c , H ) . Firstly, we compress the distance direction, and the resulting compression is shown in Figure 6. Then perform OAM domain FFT operation on the azimuth term to obtain a clear two-dimensional range azimuth target imaging result. The imaging results of target distance azimuth imaging are shown in Figure 6.

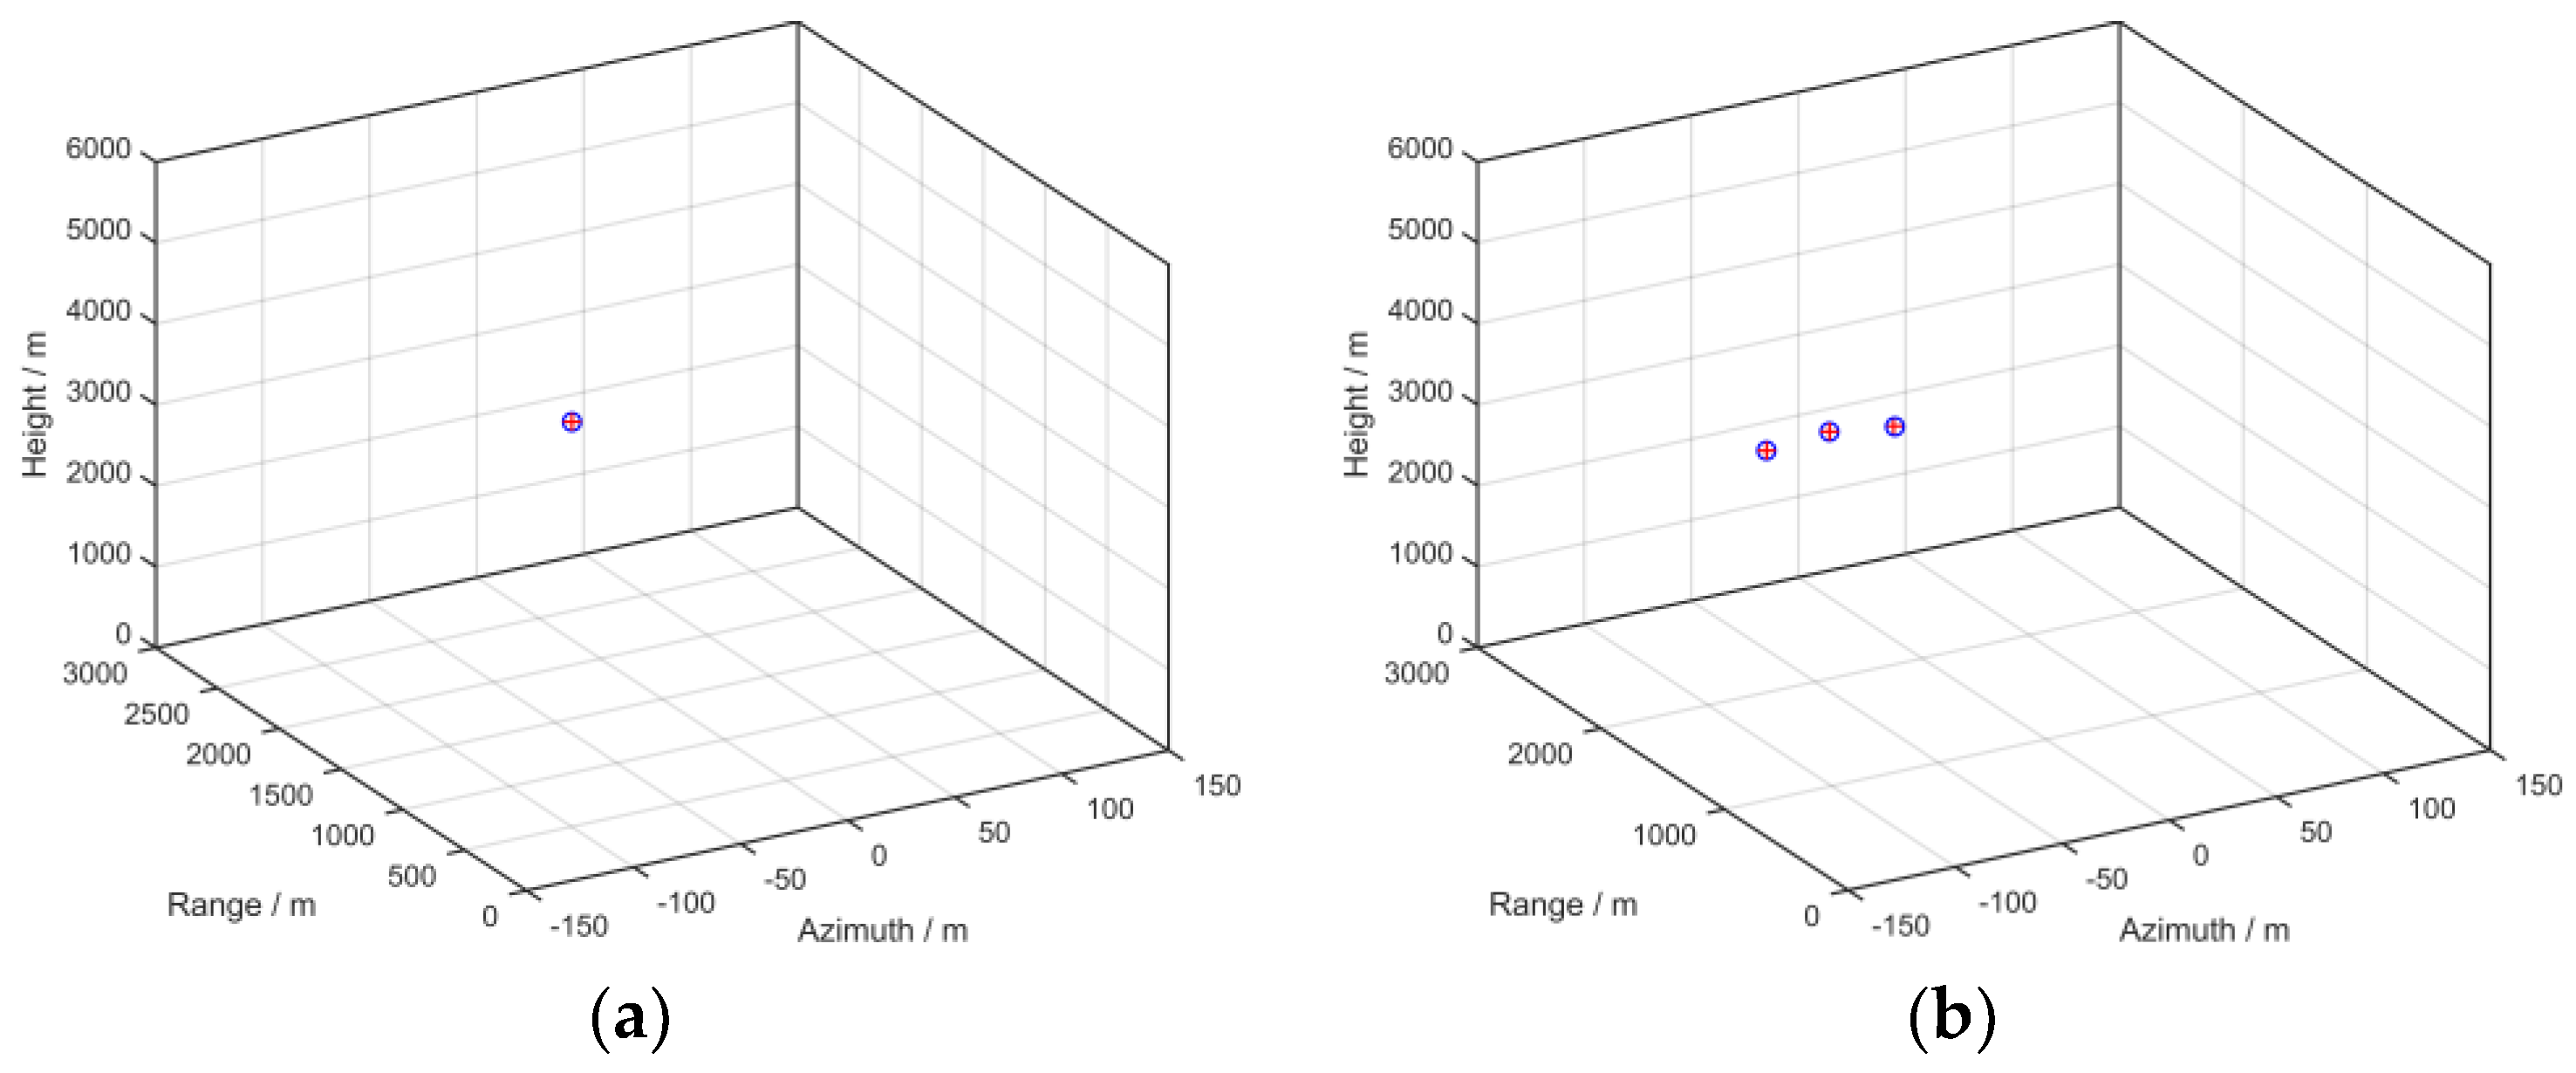
4.4. Three Dimensional Imaging Results of Point Targets

Based on the two-dimensional imaging results of target distance and azimuth, as well as the geometric relationship of azimuth, we can obtain the height of the target and achieve three-dimensional imaging of the target. The imaging result of the target position of the imaging point P ( 30 , Y c , H ) is shown in Figure 7a. The diagram shows the imaging information of three point targets: P ( 30 , Y c 10 , 1950 ) P ( 30 , Y c 10 , 2000 ) P ( 0 , Y c , 2050 ) . The blue circle represents the allowable error range for simulation, and the red plus sign represents the actual imaging position.
The imaging results of the three point targets are shown in Figure 7b. Through comparison, it was found that the imaging positions of the targets were all within the allowable error range of the simulation, thus achieving three-dimensional imaging of the point targets.

5. Conclusions

Electromagnetic Vortex Synthetic Aperture Radar (SAR) exhibits superior performance in azimuth imaging, surpassing the limitations of traditional antenna apertures and achieving super-resolution imaging. This study proposes an innovative 3D ω K imaging algorithm based on fractional order orbital angular momentum (OAM). By utilizing the mutual relationship of azimuth terms in the slow time domain, this algorithm effectively compresses distance data, which helps to accurately extract and detect the azimuth direction information of targets. By applying complex mathematical transformations and signal processing techniques, this method significantly improves the accuracy of target localization. Next, we use the two-dimensional azimuth distance imaging information obtained from the initial scan to calculate the elevation angle information and corresponding height parameters of each target. By precisely applying Cartesian coordinate transformation, we can achieve comprehensive 3D reconstruction of the target in specific environments. This study not only highlights the potential advantages of integrating fractional order orbital angular momentum technology into existing radar systems, aiming to improve imaging quality and resolution in complex environments, which are difficult to achieve with traditional methods, but also provides valuable reference and inspiration for the development of vortex SAR 3D imaging technology.

Funding

This work was supported by the National Natural Science Foundation of China (Grant No. 61961033) and the Key Project of the Inner Mongolia Natural Science Foundation (Grant No. 2021MS06021).

Acknowledgments

The authors would like to thank the handling editor and the anonymous reviewers for their valuable comments and suggestions for this paper.

Conflicts of Interest

The authors declare no conflict of interest.

References

  1. Li, L.; Li, F. Beating the Rayleigh limit: Orbital-angular-momentum-based super-resolution diffraction tomography. Physical Review E—Statistical, Nonlinear, and Soft Matter Physics, 2013, 88, 033205. [Google Scholar] [CrossRef] [PubMed]
  2. Guo, G.; Hu, W.; Du, X. Electromagnetic vortex based radar target imaging. J. Nat. Univ. Defense Technol, 2013, 35, 71–76. [Google Scholar]
  3. Fang, Y.; Wang, P.; Chen, J. A Novel Imaging Formation Method for Electromagnetic Vortex SAR Based on Orbital-Angular-Momentum. 2018 China International SAR Symposium (CISS); IEEE, 2018; pp. 1–3. [Google Scholar] [CrossRef]
  4. Bu, X.; Zhang, Z.; Chen, L.; et al. Implementation of vortex electromagnetic waves high-resolution synthetic aperture radar imaging. IEEE Antennas and Wireless Propagation Letters, 2018, 17, 764–767. [Google Scholar] [CrossRef]
  5. Wang, J.; Liu, K.; Cheng, Y.; et al. Three-dimensional target imaging based on vortex stripmap SAR. IEEE sensors journal, 2018, 19, 1338–1345. [Google Scholar] [CrossRef]
  6. Wang, J.; Liu, K.; Wang, H. Side-looking stripmap SAR based on vortex electromagnetic waves. 2019 IEEE International Conference on Communications Workshops (ICC Workshops); IEEE, 2019; pp. 1–5. [Google Scholar] [CrossRef]
  7. Guo, S.; He, Z.; Fan, Z.; et al. CUCA based equivalent fractional order OAM mode for electromagnetic vortex imaging. IEEE Access, 2020, 8, 91070–91075. [Google Scholar] [CrossRef]
  8. Liu, H.; Wang, Y.; Wang, J.; et al. Electromagnetic vortex enhanced imaging using fractional OAM beams. IEEE Antennas and Wireless Propagation Letters, 2021, 20, 948–952. [Google Scholar] [CrossRef]
  9. Liang, J.; Chen, Y.; Zhang, Q.; et al. Three-Dimensional Imaging of Vortex Electromagnetic Wave Radar with Integer and Fractional Order OAM Modes. Remote Sensing, 2023, 15, 2903. [Google Scholar] [CrossRef]
  10. Yueyue, H.; Chenlu, L.; Yongxing, D.; et al. SAR imaging based on OAM-ωK algorithm. Radio Science, 2023, 58, 1–12. [Google Scholar] [CrossRef]
  11. Shu, B.W.; Sheng, W.Y. Research on Radar Correlation Imaging Technology Based on Orbital Angular Momentum. Smart City Application, 2023, 6, 10–12. [Google Scholar] [CrossRef]
  12. Berry, M.V. Optical vortices evolving from helicoidal integer and fractional phase steps. Journal of Optics A: Pure and Applied Optics, 2004, 6, 259. [Google Scholar] [CrossRef]
  13. Liu, K.; Cheng, Y.; Yang, Z.; et al. Orbital-angular-momentum-based electromagnetic vortex imaging. IEEE Antennas and Wireless Propagation Letters, 2014, 14, 711–714. [Google Scholar] [CrossRef]
  14. Wang, L.; Tao, L.; Li, Z.; et al. Three dimensional electromagnetic vortex radar imaging based on the modified RD algorithm. 2020 IEEE Radar Conference (RadarConf20); IEEE, 2020; pp. 1–5. [Google Scholar] [CrossRef]
  15. Wang, J. Research on SAR imaging technology based on vortex electromagnetic waves. National University of Defense Technology, 2019. [Google Scholar] [CrossRef]
Figure 1. UCA antenna model.
Preprints 140171 g001
Figure 2. SAR imaging model.
Preprints 140171 g002
Figure 3. Omega-K imaging algorithm.
Preprints 140171 g003
Figure 4. One dimensional imaging results of target azimuth angle under different modes (a) Mode: [-10.5, 10.5]. (b) Mode: [-25.5, 25.5].
Preprints 140171 g004
Figure 5. Mode: single point target imaging results (a)3D-SAR; (b)2D-SAR; (c)Point target slice map; (d) Point target slice interpolation map;(e) Distance oriented contour; (f) Directional contour.
Preprints 140171 g005
Figure 5. Imaging results of single point targets in modes [-25.5, 25.5] (a)Time domain of linear frequency modulation signal; (b)Frequency domain of linear frequency modulation signal; (c)3D target azimuth imaging results; (d)2D imaging range azimuth imaging results.
Preprints 140171 g006
Figure 7. Three dimensional imaging results (a) Point target location; (b) The imaging results of three point targets.
Preprints 140171 g007
Disclaimer/Publisher’s Note: The statements, opinions and data contained in all publications are solely those of the individual author(s) and contributor(s) and not of MDPI and/or the editor(s). MDPI and/or the editor(s) disclaim responsibility for any injury to people or property resulting from any ideas, methods, instructions or products referred to in the content.
Copyright: This open access article is published under a Creative Commons CC BY 4.0 license, which permit the free download, distribution, and reuse, provided that the author and preprint are cited in any reuse.
Prerpints.org logo

Preprints.org is a free preprint server supported by MDPI in Basel, Switzerland.

Subscribe

Disclaimer

Terms of Use

Privacy Policy

Privacy Settings

© 2025 MDPI (Basel, Switzerland) unless otherwise stated