
Submitted:
20 November 2024
Posted:
20 November 2024
You are already at the latest version
Abstract
Background: Accurate reconstruction and quantification in post-therapy SPECT/CT imaging of 166Ho microspheres for hepatic malignancies is crucial for treatment evaluation. This present study aimed to explore the impact of the OSEM reconstruction parameters on SPECT/CT image features for dose distribution determination, using Hybrid Recon™ (Hermes Medical Solutions AB) and full Monte Carlo (MC) collimator modeling. Methods: Image quality and activity quantification were evaluated using Jaszczak and PTW SPECT/PET body phantoms. Siemens Symbia Intevo Bold and Symbia Pro.specta camera models were used for imaging. Datasets were reconstructed using OSEM (varying number of iterations) with and without full MC collimator modeling. Contrast recovery coefficients (QH), coefficients of variation (CV), calibration factors (CF) and activity recovery coefficients (ARC) were calculated and used to evaluate image quality and activity quantification. Results: The reconstruction method that provided the higher QH and ARCs in both studied systems/phantoms was the one applying 5 iterations and 15 subsets, incorporating full Monte Carlo collimator modeling. CF were (14.5±0.6) cps/MBq and (15.4±0.5) cps/MBq for the Siemens Symbia Intevo Bold and Symbia Pro.specta, respectively, corresponding to Jaszczak and PTW SPECT/PET body phantoms. The two analytical approaches used to fit the ARCs data confirmed the expected activity underestimation in small volumes due to partial volume effect (PVE) and the validity of the results in two different scanners and phantoms. Conclusions: For post-SIRT 166Ho SPECT/CT imaging, OSEM (5 iterations, 15 subsets) with full Monte Carlo collimator modeling provided superior quantification results. The determination of CF and ARC is vital for accurate quantification of 166Ho and should be always considered.
Keywords:
166Ho
; radioembolization
; SPECT/CT reconstruction
; SPECT/CT quantification
; Image quality
1. Introduction
In the treatment of primary and secondary liver cancer, radioembolization with holmium-166 microspheres (166Ho-RE), also known as SIRT (Selective Internal Radiation Therapy), appears as a promising therapy. This procedure, as in other liver radioembolization techniques (90Y based) involves injecting radioactive microspheres into the hepatic artery through a microcatheter placed in the femoral artery [1].
A small activity of 166Ho microspheres, typically 200-250MBq, serves as a “scout dose” to assess the microspheres’ distribution within the liver and detect any extra-hepatic shunting. This is achieved through a post-scout SPECT/CT scan, which guides the planning and administration of the main treatment involving a higher activity of 166Ho microspheres. After this verification and planning first step, a therapeutic activity of typically 2-6 GBq is injected, mimicking the “scout dose” distribution. Following this therapeutic activity administration, a post-therapy SPECT/CT scan is conducted to evaluate the doses delivered to both the liver and the tumor.
166Ho is a high-energy beta-emitting radioactive isotope (maximum energy: 1.85 MeV, abundance 49%). It also emits low-energy gamma rays at 80.6 keV (abundance 6.6%), which enable the visualization of microspheres’ distribution through SPECT (Single-Photon Emission Computed Tomography) [1,2,3]. Additionally, there are gamma emissions at higher energies, including 1.34 MeV (0.9%), 1.58 MeV (0.2%) and 1.66 MeV (0.1%) [4].
When working with 166Ho, it’s crucial to take into account the presence of Bremsstrahlung radiation as well as Compton scattering of the radiation. The high-energy photons in the Bremsstrahlung spectrum can pass through the collimator septa, leading to reduced image quality and causing inaccurate results [5].
MC algorithms that simulate scattering within the object have been effective in recovering image information. The Hybrid Recon™ software by Hermes Medical Solutions AB (Stockholm, Sweden) incorporates a scatter modeling method named “convolution-based forced detection”, applying pre-calculated probability density functions of the 166Ho spectrum generated using the PENELOPE MC code [6,7].
This approach by Hybrid Recon™ includes a full MC collimator simulation, which comprehensively addresses all photon interactions at the collimator, including both primary and scattered photons, while also considering scatter within the object [7].
The OSEM (Ordered Subset Expectation Maximization) method is an iterative approach that involves discretizing continuous images and iteratively solving linear equations. The data is divided into a previously defined number of subsets and analyzed repetitively during N user defined iterations [8].
As the interest in post-therapy dosimetry grows [9], accurate quantification of 166Ho becomes necessary. Thus, properly determining the CF, which is required to convert SPECT image counts into radioactivity concentration units (MBq/ml), plays a critical role in activity quantification [10,11].
It is also essential to address the PVE, when discussing 166Ho activity quantification. PVE is an important factor that affects the measurement of activity concentration in emission tomographic imaging and can significantly impact the accuracy of radionuclide uptake determination in quantitative SPECT and PET imaging. To address this issue and potentially correct it, one approach is to use ARC along with the corresponding activity concentration recovery curves [12].
The primary goal was to enhance the OSEM reconstruction method for 166Ho SPECT and assess the impact of advanced MC scatter correction through Hybrid Recon™ on both image quality and quantification. The secondary objectives were to determine CF for 166Ho SPECT/CT imaging in two different systems and using two different phantoms and to investigate ARC identifying the most appropriate data-fitting function.
2. Materials and Methods
SPECT/CT Imaging Protocol
Images were acquired from two distinct hospitals, referred to as Hospital 1 and Hospital 2, each equipped with different SPECT/CT systems. Hospital 1 has a Siemens Symbia Intevo Bold SPECT/CT, while Hospital 2 has a Siemens Symbia Pro.specta. Although the SPECT/CT systems are distinct, the results were not expected to be substantially different because of this. The objective of the study is to obtain results that can be applicable to any system, regardless of the model or manufacturer. Thus, it does not correspond to a multi-center study but rather to an independent verification in two different systems/phantoms/acquisition parameters combinations.
The Hospital 1 SPECT/CT imaging parameters were set as follows: a non-circular step-and-shoot 360° orbit with 60 views per head and each view lasting 20 seconds. On the other hand, Hospital 2 also used 60 projections (or views) per head, however with a duration of 15 seconds per view. Both hospitals used a matrix size of 128 × 128 and a pixel size of 4.8 mm for the SPECT data acquisition.
The photopeak energy window was set at 80.6 keV with a 15% width. In the Siemens Symbia Intevo Bold system, a scatter energy window centered at 118 keV with a width of 12% was utilized to account for scatter from higher energy gamma emissions and Bremsstrahlung [13]. As for the Siemens Symbia Pro.specta camera, the scatter energy window was divided into two parts due to the unavailability of the “general scatter” option in the software. The lower scatter window, centered at 69.7 keV, had a width of 12% and the upper scatter window at 91.5 keV had also a 12% width.
CT scans were performed before SPECT acquisition. In Hospital 1, the CT scan used a tube voltage of 110 keV and a tube current-time product of 40 mAs. In Hospital 2, the CT scan employed a tube voltage of 110 keV and used a "Sn" filter to minimize radiation exposure. The quality reference tube current-time product was configured to 50 mAs.
To minimize the impact of Bremsstrahlung radiation and high-energy gamma rays emitted by 166Ho, medium energy low penetration (MELP) collimators were employed for all SPECT/CT acquisitions.
Phantoms Acquisitions
In Hospital 1, a Jaszczak phantom was used to assess the quality of reconstructed images, perform activity quantification and thus determine the CF. The phantom spheres have diameters ranging from 6.23 mm to 31.27 mm [14] and were filled with a 2.51 MBq/ml 166Ho chloride solution. The background compartment of the phantom contained only water and no activity. Subsequently, SPECT/CT data was collected (Figure 1B).
A second acquisition was carried out with activity in the background and a sphere-to-background ratio of 30:1 (Figure 1C), resulting in a background concentration of 0.074 MBq/ml.
At Hospital 2, a similar type of acquisition was conducted using the PTW SPECT/PET phantom (equivalent NEMA Body phantom), also known as PET Emission Phantom L981606, which has spherical inserts with inner diameters varying from 10 mm to 37 mm [15]. The option of using the PTW phantom instead of the Jaszczak phantom was due to the slightly higher diameter of the bigger sphere.
SPECT/CT Reconstructions
The reconstructions of the SPECT/CT datasets used the OSEM method, which is among the available techniques in the Hybrid Recon™ software.
Image Quality
Multiple reconstructions of the phantoms SPECT/CT data, obtained during the second acquisition, were conducted. The number of iterations varied from 1 to 7 while maintaining a constant number of 15 subsets, which is Hermes default value. The same protocol was used in [7] regards to a 90Y study. The reconstruction process involved applying a FWHM of 0.9 cm and incorporating all available corrections in the Hybrid Recon™ software (motion, attenuation and scatter corrections).
Attenuation correction using the CT data was performed and the resolution recovery option was enabled. Furthermore, standard MC scatter correction was applied to enhance the quality of the reconstructed images.
Image contrast and noise were calculated for each reconstruction to evaluate the number of iterations impact on the image quality. By analyzing these values and identifying the reconstruction that provided the highest QH, the best number of iterations was determined.
Circular regions of interest (ROIs) were drawn on the widest slice of the hot spheres using Hybrid Viewer™ (also from Hermes Medical Solutions AB). These ROIs had the same inner diameter as the hot spheres. Similarly, ROIs with the same diameter were drawn concentrically on three slices of the background region: one near the top, one near the bottom and one in the middle of the phantom [7]. The ROIs were initially drawn on the transaxial slices of the CT image and then copied onto the corresponding aligned SPECT image. For each one of the six hot sphere ROIs, the QH was calculated using the following equation [16]:
CH represents the average counts within the hot sphere ROI, CB represents the average of the mean counts in the three background ROIs and R represents the ratio of the activity concentration between the hot spheres and the background.
The CV was used as a measure of image noise, calculated using eq. 2 [16]. STDVB represents the standard deviation of all voxels within the background ROI. The background ROI was delineated on multiple slices using ImageJ software, specifically in areas where the influence of the hot spheres was minimal and only background was present. The CV value was obtained by averaging the calculated values from each slice.
After identifying the best number of iterations, the two second acquisitions (one for each phantom) underwent an additional set of reconstructions. The number of iterations was kept constant equal to the previously determined value, while the number of subsets varied between 8 and 15. These reconstructions were performed with and without full MC collimator modeling.
Activity quantification
The calibration factors were obtained using the second phantoms acquisitions (with background activity). It was assumed that the region below the hot spheres region, which was uniformly filled with 166Ho, was not influenced by the spheres themselves. This approach allowed for the estimation of calibration factors specific to the imaging setup and acquisition conditions used.
Using Hybrid Viewer™, a total of 20 spherical VOIs were delineated in the background compartment. These VOIs were selected to have the same volume. The count rate within each VOI () was recorded. The activity in each VOI () was calculated by multiplying the activity concentration of the background compartment by the volume of the respective VOI. After applying equation 3, the CF for the most suitable OSEM reconstruction protocol determined previously was calculated. Alongside the CF, the associated uncertainty was also calculated, following the guidelines outlined in [17].
ARC as a function of sphere volume were determined using the first set of phantom acquisitions. An ARC for each insert was then determined using three different methods.
The SPECT/CT reconstruction of the phantom data can be obtained in counts or in MBq/ml by applying the calibration factor. Consequently, the ARC can be calculated using both types of reconstructions. Spherical VOIs matching the size of the physical insert were delineated on the CT scan and then copied into the corresponding SPECT image. If the reconstruction output was expressed in counts, the ARC were calculated using equation 4 (adapted from [16]).
Considering equation 4, is the total count rate within each VOI corresponding to insert i, CF is the calibration factor and is the known activity in insert i (product of activity concentration of the spherical inserts and the volume of the respective insert). On the other hand, if the reconstruction was carried out in MBq/ml, the ARCs were determined using equation 5 [11].
and are the SPECT estimated and true activity concentrations in the spheres, respectively.
The last method used to determine the ARC followed the EANM (European Association of Nuclear Medicine) guidelines for uncertainty analysis [17]. It involves calculating the quotient between the observed count rate measured within the insert VOI, denoted as C, and the count rate of all counts originating from an oversized VOI that encompasses the sphere, denoted as .
Finally, for each method, the ARC data fit was determined using the expression proposed by [17] and expressed through the following equation:
Statistical Analysis
To confirm whether the enhancement offered by the reconstruction method considered the most suitable is statistically meaningful, a statistical assessment of differences in QH and ARC among the four reconstruction methods was performed. This assessment used the non-parametric Wilcoxon signed-rank test for paired data, with a significance level set at 0.05. This choice was driven by the unavailability of normality assumptions, attributed to the constrained sample sizes.
All statistical analysis were conducted using R software.
3. Results
Figure 3 displays the QH obtained for each reconstruction, illustrating their relationship with the number of iterations, with data presented for each phantom.
Upon observing the Figure 3A, a clear difference becomes evident between the three smaller spheres and the three larger spheres. The contrast recovery coefficients for the smaller spheres are below 10%, whereas those for the larger spheres attain higher values up to 50%.
Concerning the Figure 3B, the differences between the smaller and larger spheres are less prominent, which is to be expected due to the slightly larger diameter of these spheres compared to those in the Jaszczak phantom. However, it is evident once again that the contrast recovery coefficients rise with sphere size as expected.
The coefficient of variation was also calculated as an indicator of image noise. The outcomes were consistent for both phantoms and are presented in Figure 4.
For the Jaszczak phantom, employing a single iteration in the reconstruction resulted in a CV of (4.3±0.5) % whereas for the PTW SPECT/PET phantom, it was (4.7±0.5) %. In contrast, using 7 iterations led to a CV of (15±1) % for the Jaszczak phantom and (21±3) % for the PTW SPECT/PET phantom.
The subsequent phase involved investigating the most effective OSEM reconstruction. This entailed conducting reconstructions with a constant number of iterations, 5, while varying the number of subsets between 8 and 15. These reconstructions were carried out both with and without full MC collimator modeling. Consequently, four distinct OSEM reconstructions were analyzed: 5 iterations and 8 subsets, 5 iterations and 15 subsets, and both reconstructions with the application of the full MC collimator modeling.
Once again, the QH values and CV measurements were calculated for each reconstruction. These results are represented, respectively, in Figure 5 and Figure 6.
In Figure 5, the blue and yellow bars consistently yielded higher values than the red and green bars, respectively, across both reconstructions (with 8 or 15 subsets) and for most spheres. Actually, the graphic B consistently followed the previously explained pattern across all spheres. The graphic A similarly demonstrates the same behavior. However, for the three smaller spheres, it can be challenging, or even impossible, to observe this pattern.
Simply by looking at the information presented in Figure 5, it becomes apparent that the reconstruction method yielding the highest QH values is the OSEM with 5 iterations and 15 subsets, along with complete MC collimator modeling.
Across all the spheres in the Jaszczak phantom data, it was verified that the “OSEM 5it/15sub full” reconstruction resulted in a substantial and statistically significant increase in image contrast when compared to both the “OSEM 5it/8sub” reconstruction (p = 0.031) and the “OSEM 5it/8sub full” reconstruction (p = 0.031). However, this increased contrast was not found to be statistically significantly higher than that achieved by the “OSEM 5it/15sub” reconstruction (p = 0.0625).
Additionally, when performing similar analyses on the PTW SPECT/PET phantom data, it was found that the “OSEM 5it/15sub full” reconstruction yielded significantly higher image contrast than all the other three reconstruction methods (p = 0.031). This outcome aligns with the predicted results, as illustrated in Figure 5B, where the smaller spheres exhibit notably superior QH values compared to those presented in Figure 5A. This discrepancy between the bars is clearly visible, supporting the observed differences in image contrast.
The obtained p-values were very specific (consistently 0.03125 or 0.0625). These p-values might arise from the inherent discrete nature of the data, which can occasionally result in “spiky” distributions of p-values. Alternatively, the limited sample size could impose restrictions on the statistical power to detect genuine differences.
To ensure the robustness of the testing procedure, especially considering multiple comparisons, the Holm correction was performed. This correction was applied due to the comparison of the “OSEM 5it/15sub full” reconstruction with the other three reconstructions. However, post this correction, none of the data exhibited statistical significance. Consequently, conclusive determinations regarding the superior method cannot be drawn from the current findings.
Regarding image noise, Figure 6 analysis demonstrated that implementing full MC collimator modeling resulted in elevated CV values for the PTW SPECT/PET phantom. Conversely, for the Jaszczak phantom, CV values for the same reconstruction parameters exhibited minimal differences with and without the application of full MC collimator modeling.
Additionally, it was observed that an increase in the number of subsets corresponded to a rise in CV values for both datasets. By increasing the number of subsets, the projection data is partitioned into smaller segments. This acceleration in segmentation leads to quicker image updates within each iteration, as each subset contributes insights into a smaller region of the image. However, this accelerated updating process can intensify the reconstruction susceptibility to variations present in the input data [18]. Consequently, the reconstructed image can manifest increased noise, ultimately resulting in a heightened CV, as was observed in these datasets.
The CF and its associated uncertainty were calculated for both scanners, covering both the Jaszczak and PTW SPECT/PET phantoms. Specifically, for the Jaszczak phantom at Hospital 1, the CF was determined to be (14.5±0.6) cps/MBq. Similarly, at Hospital 2 with the PTW SPECT/PET phantom, the calculated CF was (15.4±0.5) cps/MBq.
The ARC were determined using three distinct methods for each of the four reconstructions examined earlier. The outcomes pertaining to the Jaszczak phantom are represented in Figure 7, while those associated with the PTW SPECT/PET phantom are illustrated in Figure 8 for both scanners.
It was clear that the previously defined optimized OSEM reconstruction method yielded superior ARC values across nearly all spheres - a desirable outcome as higher ARC values correspond to lesser underestimation of the true activity. Once again, the results did not achieve statistical significance.
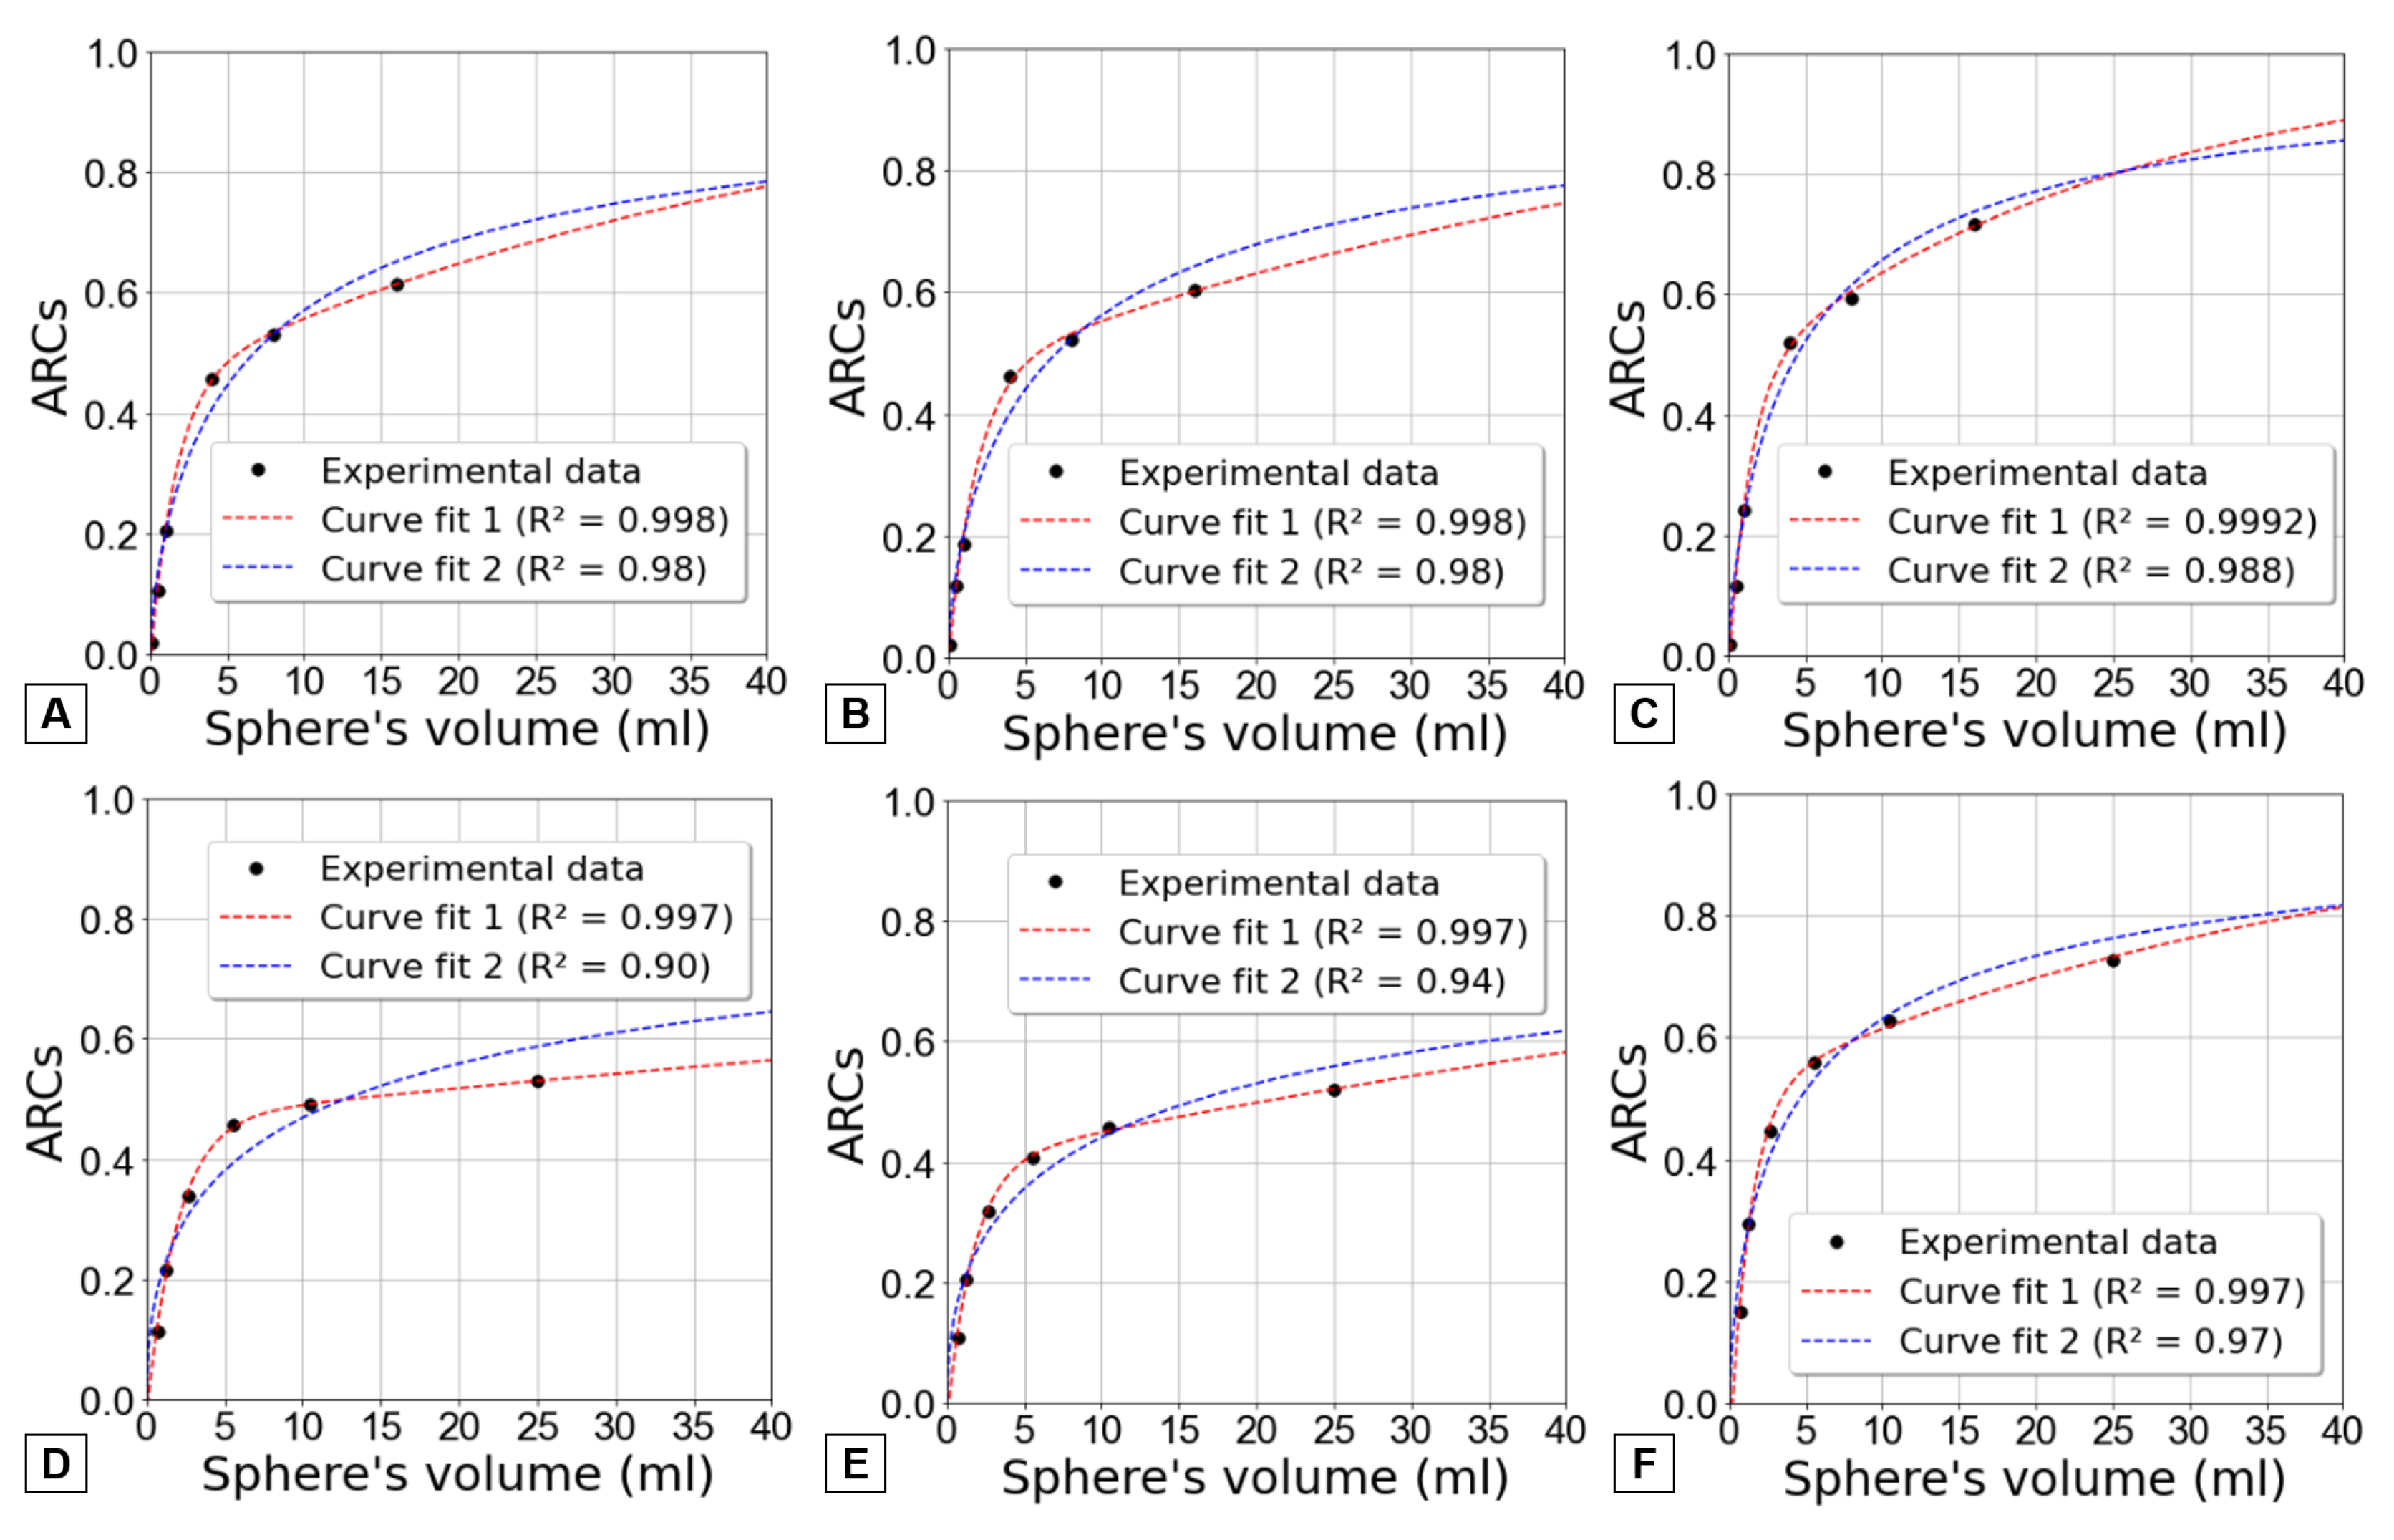
Figure 9 curve fit 2 (dashed blue line) shows an attempt to model the ARC data and achieve a trend of approaching unity as the volume increases. However, this fit demonstrates suboptimal performance when applied to the results obtained through the first two methods.
Considering this, an alternative expression, shown by equation 7, was found to better align with the data while maintaining the condition of ARCs converging to one for larger volumes. In this instance, the fitting procedure involved determining four parameters (a, b, c, and d) to effectively match the data.
This alternative approach is also represented in Figure 9 by a red dashed line named curve fit 1. It is readily apparent that equation 7 provides a more advantageous alignment with the data across all three methods for both phantoms. To substantiate this observation, determination coefficients (R2) were computed.
4. Discussion
The aim of the presented data on post-SIRT 166Ho SPECT/CT imaging was to examine the impact of OSEM reconstruction parameters and investigate the advantages of full MC collimator modeling in improving image quality and quantification.
The number of iterations used in the OSEM method can impact the qualitative accuracy of the reconstructed images. However, it is important to highlight that as the number of iterations increases, so does the background noise in the images. This may complicate the visual analysis of images, especially in detecting small lesions. Therefore, this study investigated how varying the number of iterations from 1 to 7 maintaining a constant number 15 subsets would alter the QH and noise values. Then verified if a lower number of subsets (in this case, 8) along with and without applying full MC collimator modelling would provide highest QH values in comparison with the reconstructions with 15 subsets.
The selection of the most suitable OSEM reconstruction method was determined based on the contrast recovery coefficients and then confirmed with the ARCs values. This indicates that the reconstruction offering the highest contrast and activity recovery coefficients was selected for patient image reconstruction following 166Ho-RE.
By analyzing Figure 3, it is possible to verify that the QH increase with the number of iterations for all spheres (except the smallest one). However, beyond 5 iterations, the contrast coefficients remain relatively constant, showing no significant increases.
It was also evident that the coefficient of variation increased correspondingly with the augmented number of iterations in each reconstruction (Figure 4). This outcome aligns with expectations based on the functioning of the OSEM method, where a higher number of iterations corresponds to increased background noise in the resultant images.
Consequently, it was determined that 5 iterations achieved an optimal balance between noise reduction and accuracy. As the number of iterations was increased to 6 and 7, it was observed that the contrast coefficients remained relatively stable for both phantoms. Therefore, additional iterations would not improve the reconstructions adequacy or reliability but would merely lead to elevated noise levels.
A limitation of this study was the consideration of a low number of subsets, preventing a conclusion on whether 5 iterations remain optimal with a varied subset count.
After establishing the number of iterations, it was conducted a subsequent investigation involving four different reconstructions. The number of subsets was 8 and 15, each reconstructed with and without full MC collimator modeling. Figure 5 illustrates that the inclusion of full MC collimator modeling enhances QH values.
Despite the increased noise, the most suitable OSEM reconstruction for 166Ho was determined to be the configuration with 5 iterations and 15 subsets, incorporating full MC collimator modeling because it provided the highest QH values.
A significant challenge to 166Ho SPECT/CT image acquisition arises from the inherent limitations of customary scatter correction techniques, which are designed for discrete energy spectra. This challenge is particularly pronounced due to the continuous nature of the Bremsstrahlung spectrum associated with 166Ho. Consequently, the use of Hybrid Recon™, a software that also incorporates modelling of scatter within the detector and collimator, comes as a welcome improvement in enhancing the quantification of 166Ho images.
Concerning the quantification of 166Ho activity, the study also successfully determined the CF for each hospital, resulting in similar values (around 15 cps/MBq). The close proximity of these values afforded a measure of confidence in them and facilitated the calculation of their uncertainty. This allowed for a more comprehensive understanding of the accuracy and reliability of the CF, ensuring its suitability for absolute activity quantification in 166Ho microsphere SPECT/CT imaging.
Additionally, the investigation determined ARC values for every spherical insert in both phantom models. These ARC values were computed through three distinct methodologies and their datasets subjected to fitting using two different functions.
Equation 6 appears to provide a satisfactory fit to the data for the third method, in contrast to the first two methods which exhibit more notable disparities. This finding aligns with expectations, considering that the fit provided by [17] in equation 6 was specifically designed for determining ARC values using the third method.
If the data had allowed for the consideration of larger volumes, within a specific range of smaller volumes (roughly from the volume of the fourth sphere up to 60ml), the ARC values appeared to exhibit a slower increase than what was anticipated by curve fit 2. However, when extrapolating for higher volumes (higher 150ml), the curve fit 1 outperforms curve fit 2. Using curve fit 1, ARC approaches more quickly to 1, indicating a more rapid convergence and showing that PVE becomes less significant as volume increases.
This analysis demonstrated that the developed analytical solution presented here offered a better fit to the data, making it a more accurate choice for application in patient images.
Figure 9 shows the clear limitation of using only spheres with diameters up to 37 mm once the recovery curve does not plateau. Therefore, the comparison of different fits become more difficult without additional data.
In summary, multiple methods for determining ARC values are available. The appropriate approach for performing PVE correction on small volumes depends on their specific usage context and the type of SPECT/CT reconstruction applied. Another significant insight from the ARC values analysis was the substantial potential underestimation of activity in small volumes caused by PVE. This highlights the critical need to account for and rectify PVE in local absorbed dose calculations.
5. Conclusions
OSEM reconstruction, utilizing 5 iterations and 15 subsets and enhanced through full MC collimator modeling, significantly improved 166Ho SPECT/CT image quality compared to other examined reconstruction methods. The use of full MC collimator modeling not only led to notable improvements in contrast recovery coefficients but also preserved image quality. This combination stands as the preferred reconstruction algorithm for post-SIRT 166Ho SPECT/CT imaging. Regarding quantification, two calibration factors using two different phantoms were established, both yielding similar values. Moreover, activity recovery coefficients, dependent on volume, were analyzed and described by two separate functions, one of which yielded better results, showing a faster convergence to one for smaller volumes.
Funding
This research received no external funding.
Data Availability Statement
The data presented in this study are available on request from the corresponding author.
Acknowledgments
In this section you can acknowledge any support given which is not covered by the author contribution or funding sections. This may include administrative and technical support, or donations in kind (e.g., materials used for experiments).
Conflicts of Interest
The authors declare no conflicts of interest.
Abbreviations
The following abbreviations are used in this manuscript:
| 166Ho-RE | Radioembolization with holmium-166 microspheres |
| 90Y | Yttrium-90 |
| ARC | Activity Recovery Coefficient |
| CF | Calibration Factor |
| CV | Coefficient of variation |
| EANM | European Association of Nuclear Medicine |
| FWHM | Full Width at Half Maximum |
| MC | Monte Carlo |
| MELP | Medium Energy Low Penetration |
| OSEM | Ordered Subset Expectation Maximization |
| PVE | Partial Volume Effect |
| QH | Contrast Recovery Coefficient |
| ROI | Region Of Interest |
| SIRT | Selective Internal Radiation Therapy |
| SPECT/CT | Single Photon Emission Computed Tomography/Computed Tomography |
| VOI | Volume Of Interest |
References
- Reinders, M.T.; Smits, M.L.; van Roekel, C.; Braat, A.J. Holmium-166 Microsphere Radioembolization of Hepatic Malignancies. Seminars in Nuclear Medicine 2019, 49, 237–243. [Google Scholar] [CrossRef] [PubMed]
- Stella, M.; Braat, A.J.; van Rooij, R.; de Jong, H.W.; Lam, M.G. Holmium-166 Radioembolization: Current Status and Future Prospective. CardioVascular and Interventional Radiology 2022, 45, 1634–1645. [Google Scholar] [CrossRef] [PubMed]
- Smits, M.L.; Elschot, M.; Bosch, M.A.V.D.; Maat, G.H.V.D.; Schip, A.D.V.H.; Zonnenberg, B.A.; Seevinck, P.R.; Verkooijen, H.M.; Bakker, C.J.; Jong, H.W.D.; Lam, M.G.; Nijsen, J.F. In vivo dosimetry based on SPECT and MR imaging of 166Ho-microspheres for treatment of liver malignancies. Journal of Nuclear Medicine 2013, 54, 2093–2100. [Google Scholar] [CrossRef] [PubMed]
- Wit, T.C.D.; Xiao, J.; Nijsen, J.F.W.; Schip, F.D.V.H.; Staelens, S.G.; Rijk, P.P.V.; Beekman, F.J. Hybrid scatter correction applied to quantitative holmium-166 SPECT. Physics in Medicine and Biology 2006, 51, 4773–4787. [Google Scholar] [CrossRef] [PubMed]
- Bonutti, F.; Avolio, M.; Magro, G.; Cecotti, A.; Schiava, E.D.; Do, E.D.; Longo, F.; Herassi, Y.; Bentayeb, F.; Rossi, M.; Ferretti, G.; Geatti, O.; Padovani, R. Optimization of the image contrast in SPECT-CT bremsstrahlung imaging for Selective Internal Radiation Therapy of liver malignancies with Y-90 microspheres. Medical Physics 2015. [Google Scholar]
- Salvat, F.; Fernández-Varea, J.M.; Baró, J.; Sempau, J. PENELOPE, an algorithm and computer code for Monte Carlo simulation of electron-photon showers, 1996. Available online: https://www.osti.gov/etdeweb/servlets/purl/20930131 (accessed on 13/02/2024).
- Porter, C.A.; Bradley, K.M.; Hippeläinen, E.T.; Walker, M.D.; McGowan, D.R. Phantom and clinical evaluation of the effect of full Monte Carlo collimator modelling in post-SIRT yttrium-90 Bremsstrahlung SPECT imaging. EJNMMI Research 2018, 8. [Google Scholar] [CrossRef] [PubMed]
- Liu, C.; Qiu, J. Ordered Subset Expectation Maximum algorithms based on symmetric structure for image reconstruction. Symmetry 2018, 10. [Google Scholar] [CrossRef]
- Sjogreen-Gleisner, K.; Flux, G.; Bacher, K.; Chiesa, C.; de Nijs, R.; Kagadis, G.C.; Lima, T.; Georgosopoulou, M.L.; Gabina, P.M.; Nekolla, S.; andJoao Santos, S.P.; Sattler, B.; Stokke, C.; Tran-Gia, J.; Gilligan, P.; Bardiès, M. EFOMP policy statement NO. 19: Dosimetry in nuclear medicine therapy – Molecular radiotherapy. Physica Medica 2023. [Google Scholar] [CrossRef] [PubMed]
- Danieli, R.; Milano, A.; Gallo, S.; Veronese, I.; Lascialfari, A.; Indovina, L.; Botta, F.; Ferrari, M.; Cicchetti, A.; Raspanti, D.; Cremonesi, M. Personalized Dosimetry in Targeted Radiation Therapy: A Look to Methods, Tools and Critical Aspects. Journal of Personalized Medicine 2022, 12. [Google Scholar] [CrossRef] [PubMed]
- Ramonaheng, K.; van Staden, J.A.; du Raan, H. The effect of calibration factors and recovery coefficients on 177Lu SPECT activity quantification accuracy: a Monte Carlo study. EJNMMI Physics 2021, 8. [Google Scholar] [CrossRef] [PubMed]
- Peters, S.M.; van der Werf, N.R.; Segbers, M.; van Velden, F.H.; Wierts, R.; Blokland, K.J.A.; Konijnenberg, M.W.; Lazarenko, S.V.; Visser, E.P.; Gotthardt, M. Towards standardization of absolute SPECT/CT quantification: a multi-center and multi-vendor phantom study. EJNMMI Physics 2019, 6. [Google Scholar] [CrossRef] [PubMed]
- Stella, M.; Braat, A.J.; Lam, M.G.; de Jong, H.W.; van Rooij, R. Gamma camera characterization at high holmium-166 activity in liver radioembolization. EJNMMI Physics 2021, 8. [Google Scholar] [CrossRef] [PubMed]
- Emission Computed Tomography (ECT) Phantoms, 2001. Available online: http://www.orion-france.com/pdf/catalogues/Orion_Data_Spectrum.pdf (accessed on 16/09/2023).
- Nuclear medicine products PTW, 2009. Available online: http://www.radiationprotection.com.sg/wp-content/uploads/products/nuclear_medicine/catalogs/Nuclear_Medicine_Cat_en_70222900_03.pdf (accessed on 13/02/2024).
- Elschot, M.; Vermolen, B.J.; Lam, M.G.; de Keizer, B.; van den Bosch, M.A.; de Jong, H.W. Quantitative Comparison of PET and Bremsstrahlung SPECT for Imaging the In Vivo Yttrium-90 Microsphere Distribution after Liver Radioembolization. PLoS ONE 2013, 8. [Google Scholar] [CrossRef] [PubMed]
- Gear, J.I.; Cox, M.G.; Gustafsson, J.; Gleisner, K.S.; Murray, I.; Glatting, G.; Konijnenberg, M.; Flux, G.D. EANM practical guidance on uncertainty analysis for molecular radiotherapy absorbed dose calculations. European Journal of Nuclear Medicine and Molecular Imaging 2018, 45, 2456–2474. [Google Scholar] [CrossRef] [PubMed]
- Morey, A.M.; Kadrmas, D.J. Effect of varying number of OSEM subsets on PET lesion detectability. Journal of Nuclear Medicine Technology 2013, 41, 268–273. [Google Scholar] [CrossRef] [PubMed]
Short Biography of Authors
 |
Rita Albergueiro holds a M.Sc. degree in medical physics, which she attained in 2023. Throughout her thesis research, she undertook an internship at the Santo António University Hospital Center, where she focused on the investigation of dosimetry in nuclear medicine therapies. Presently, Rita is employed as a Medical Physicist within the Department of Nuclear Medicine at the São João University Hospital Center. |
 |
Vera Antunes holds a B.Sc. degree in physics and a M.Sc. in medical physics. Since 2014, she has been working as a Medical Physicist in Nuclear Medicine at the Portuguese Institute of Oncology of Porto (IPOPFG, EPE). She is a member of the Medical Physics, Radiobiology and Radiation Protection Group at the IPOPFG Research Center. |
 |
João Santos received the M.Sc. degree in physics (optoelectronics and lasers) and the Ph.D. degree in physics (condensed matter). He concluded the Residency in Medical Physics at the Portuguese Institute of Oncology of Porto (IPOPFG, EPE), in 2005. He is currently a Medical Physicist Expert and a Coordinator of the Medical Physics, Radiobiology and Radiation Protection Group, IPOPFG Research Centre, and an Affiliated Professor with the University of Porto. |
Figure 1.
SPECT/CT images of the Jaszczak phantom. A) Phantom setup for acquisition; B) SPECT transaxial slice without background activity; C) SPECT transaxial slice with background activity.
Figure 1.
SPECT/CT images of the Jaszczak phantom. A) Phantom setup for acquisition; B) SPECT transaxial slice without background activity; C) SPECT transaxial slice with background activity.
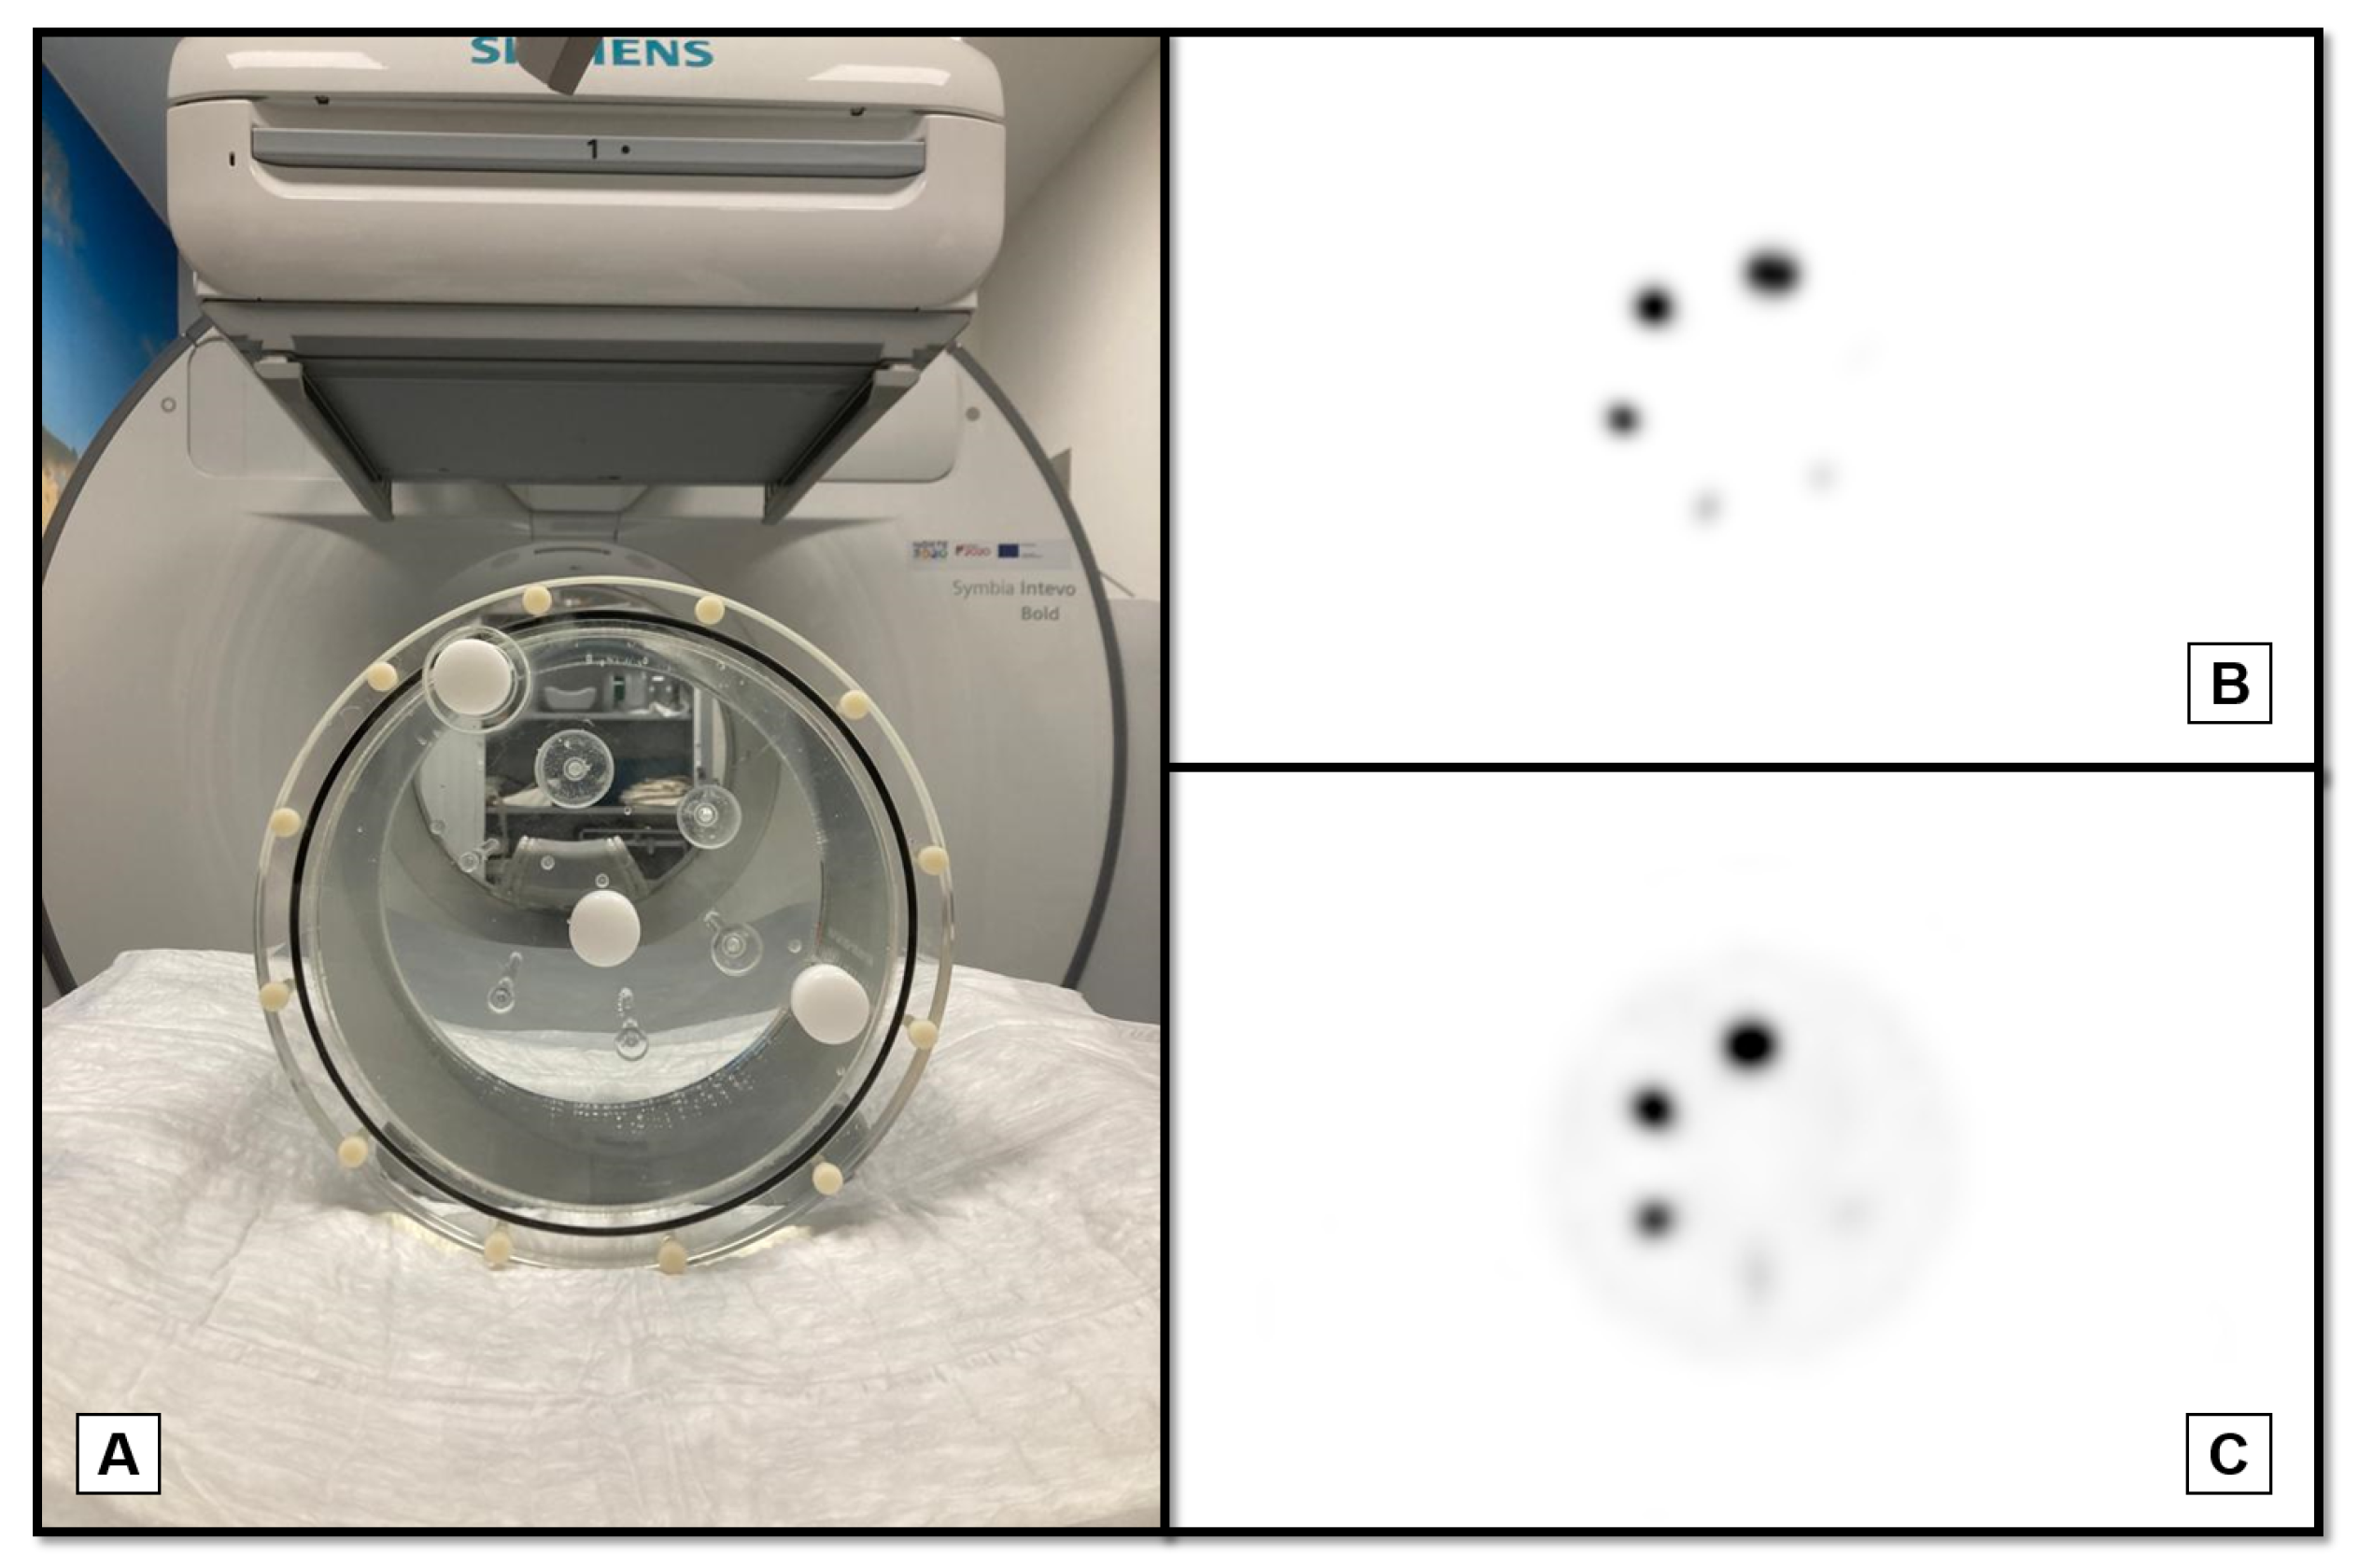
Figure 2.
SPECT/CT images of the PTW SPECT/PET phantom. A) Phantom setup for acquisition; B) SPECT transaxial slice without background activity; C) SPECT transaxial slice with background activity.
Figure 2.
SPECT/CT images of the PTW SPECT/PET phantom. A) Phantom setup for acquisition; B) SPECT transaxial slice without background activity; C) SPECT transaxial slice with background activity.
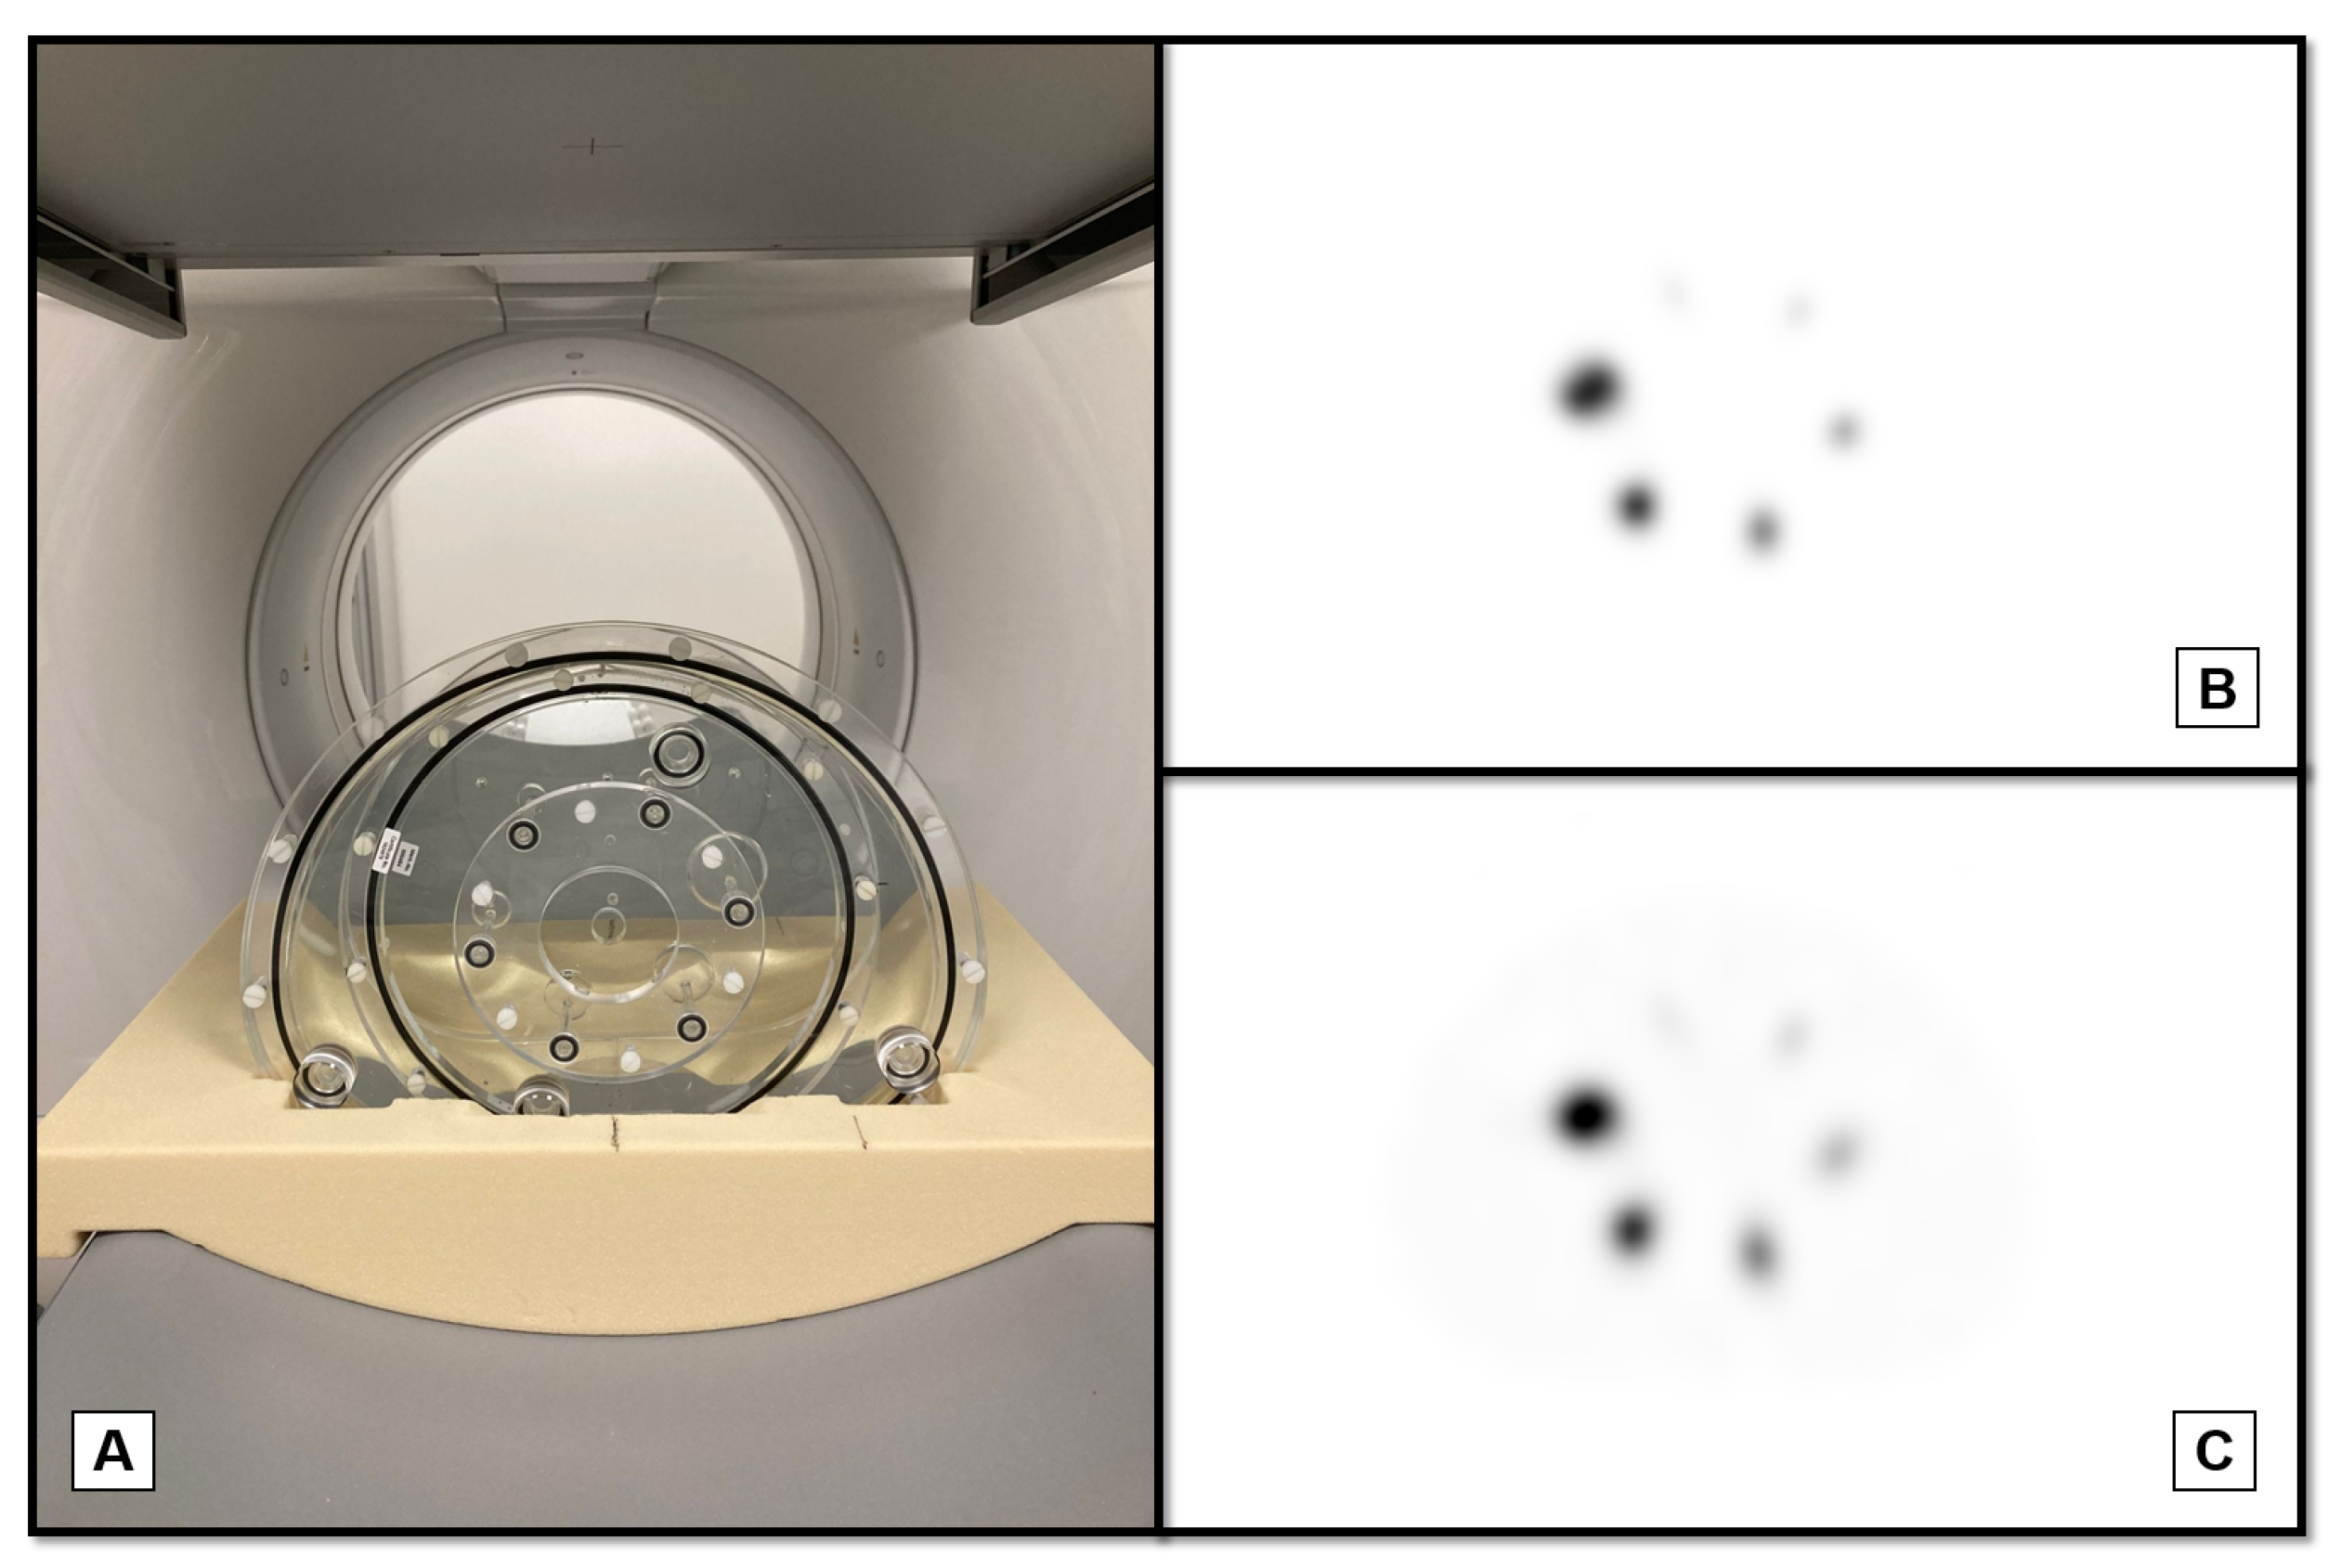
Figure 3.
Relationship between the number of iterations and contrast recovery coefficients for all six spheres. Graph A represents data from the Jaszczak phantom, while Graph B pertains to the PTW SPECT/PET phantom.
Figure 3.
Relationship between the number of iterations and contrast recovery coefficients for all six spheres. Graph A represents data from the Jaszczak phantom, while Graph B pertains to the PTW SPECT/PET phantom.
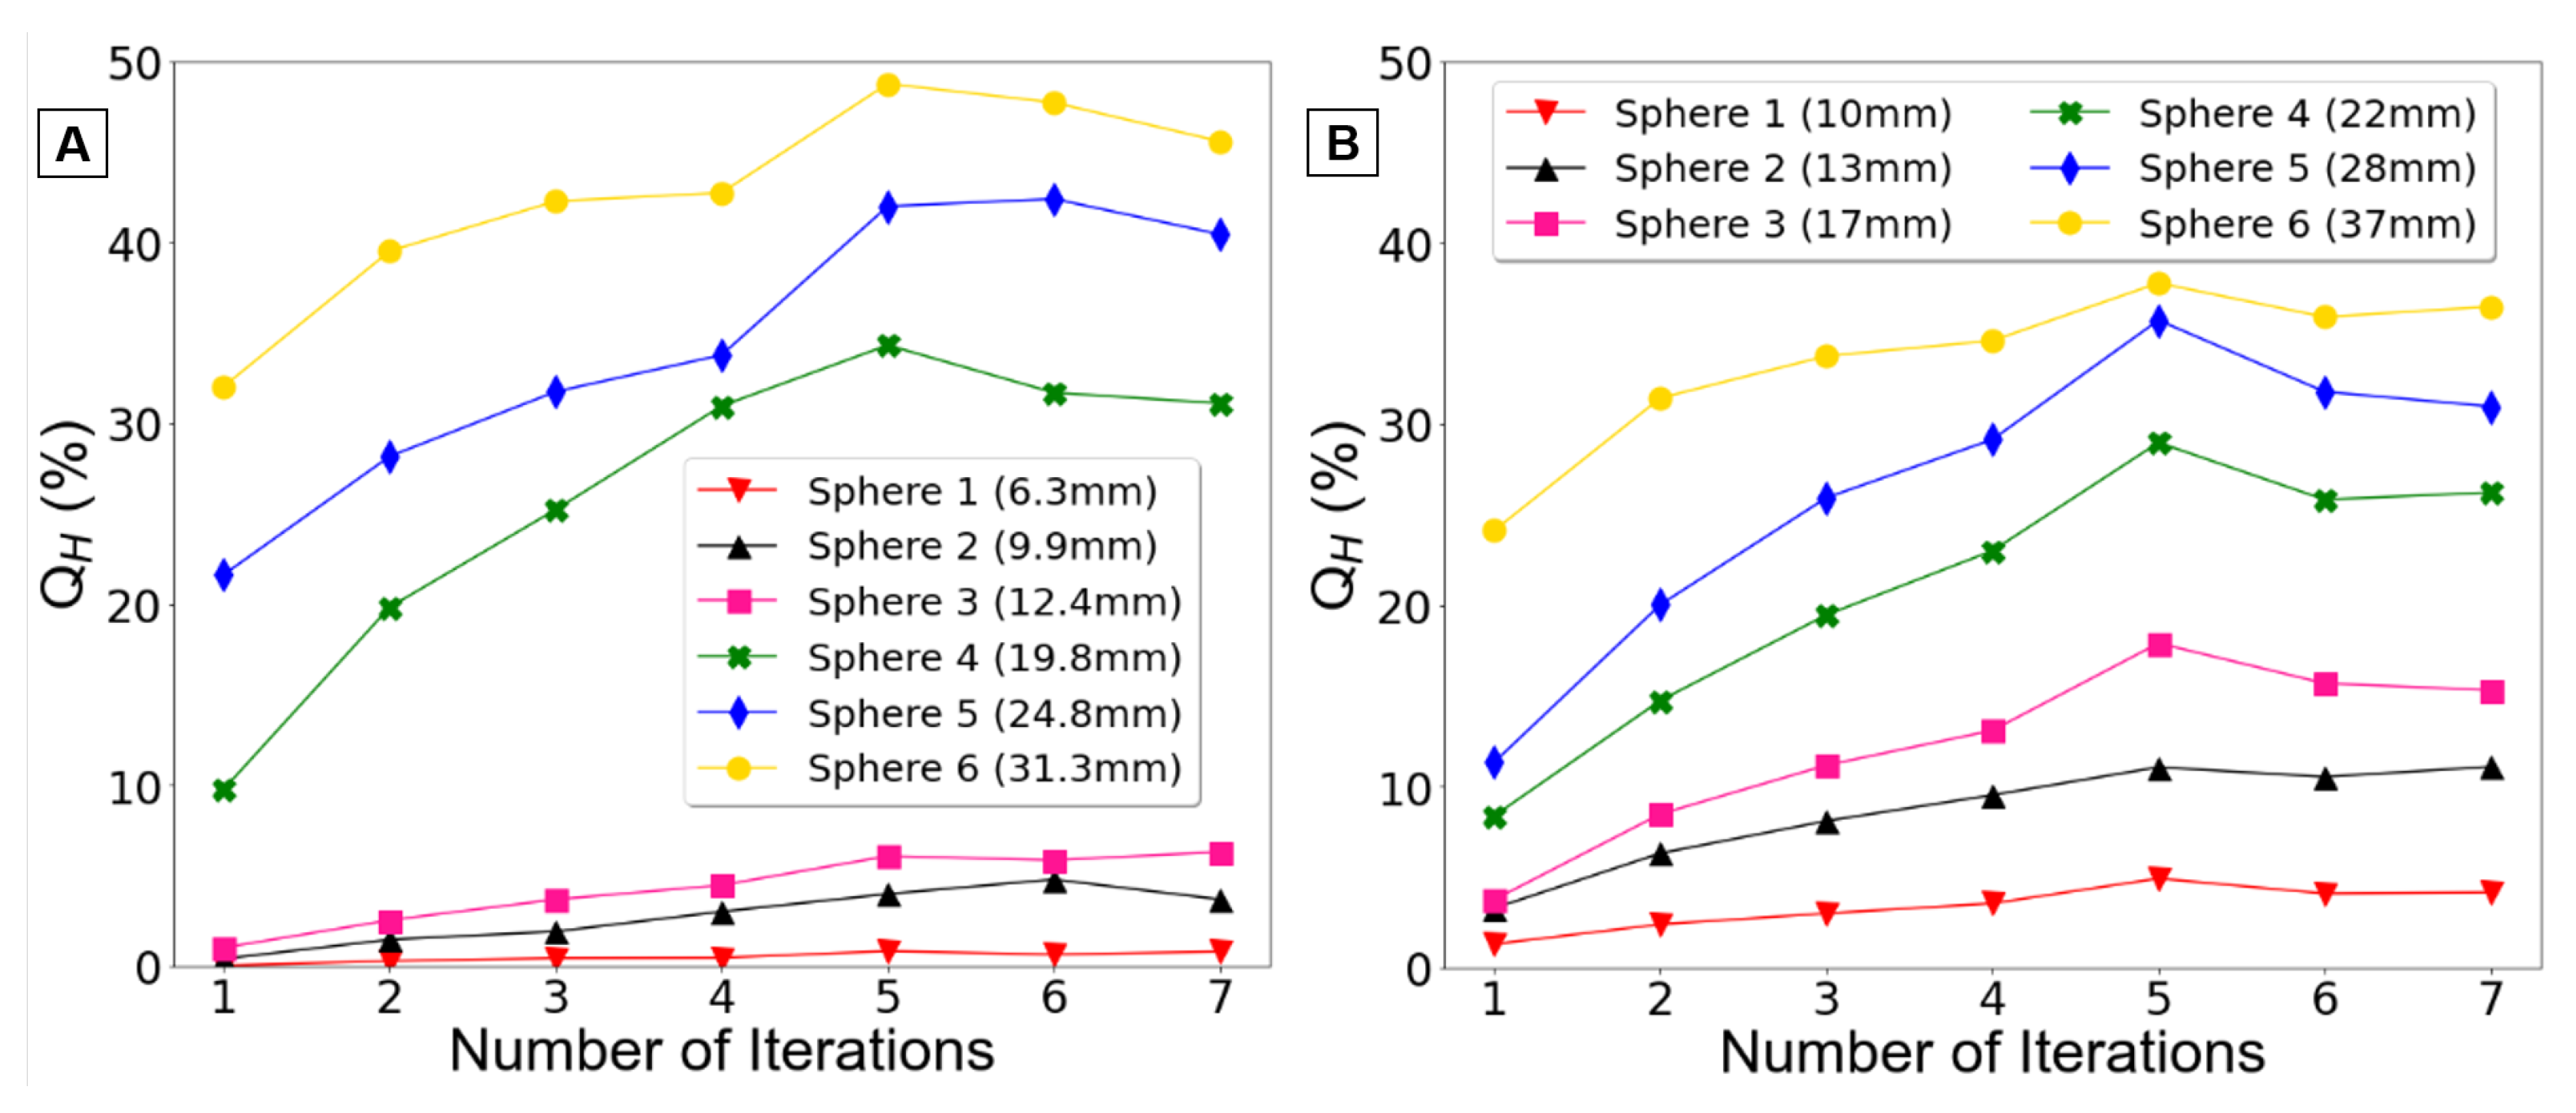
Figure 4.
Percentage coefficient of variation, CV (%), corresponding to each reconstruction, where the number of iterations ranged from 1 to 7 while the number of subsets remained constant, for each phantom.
Figure 4.
Percentage coefficient of variation, CV (%), corresponding to each reconstruction, where the number of iterations ranged from 1 to 7 while the number of subsets remained constant, for each phantom.
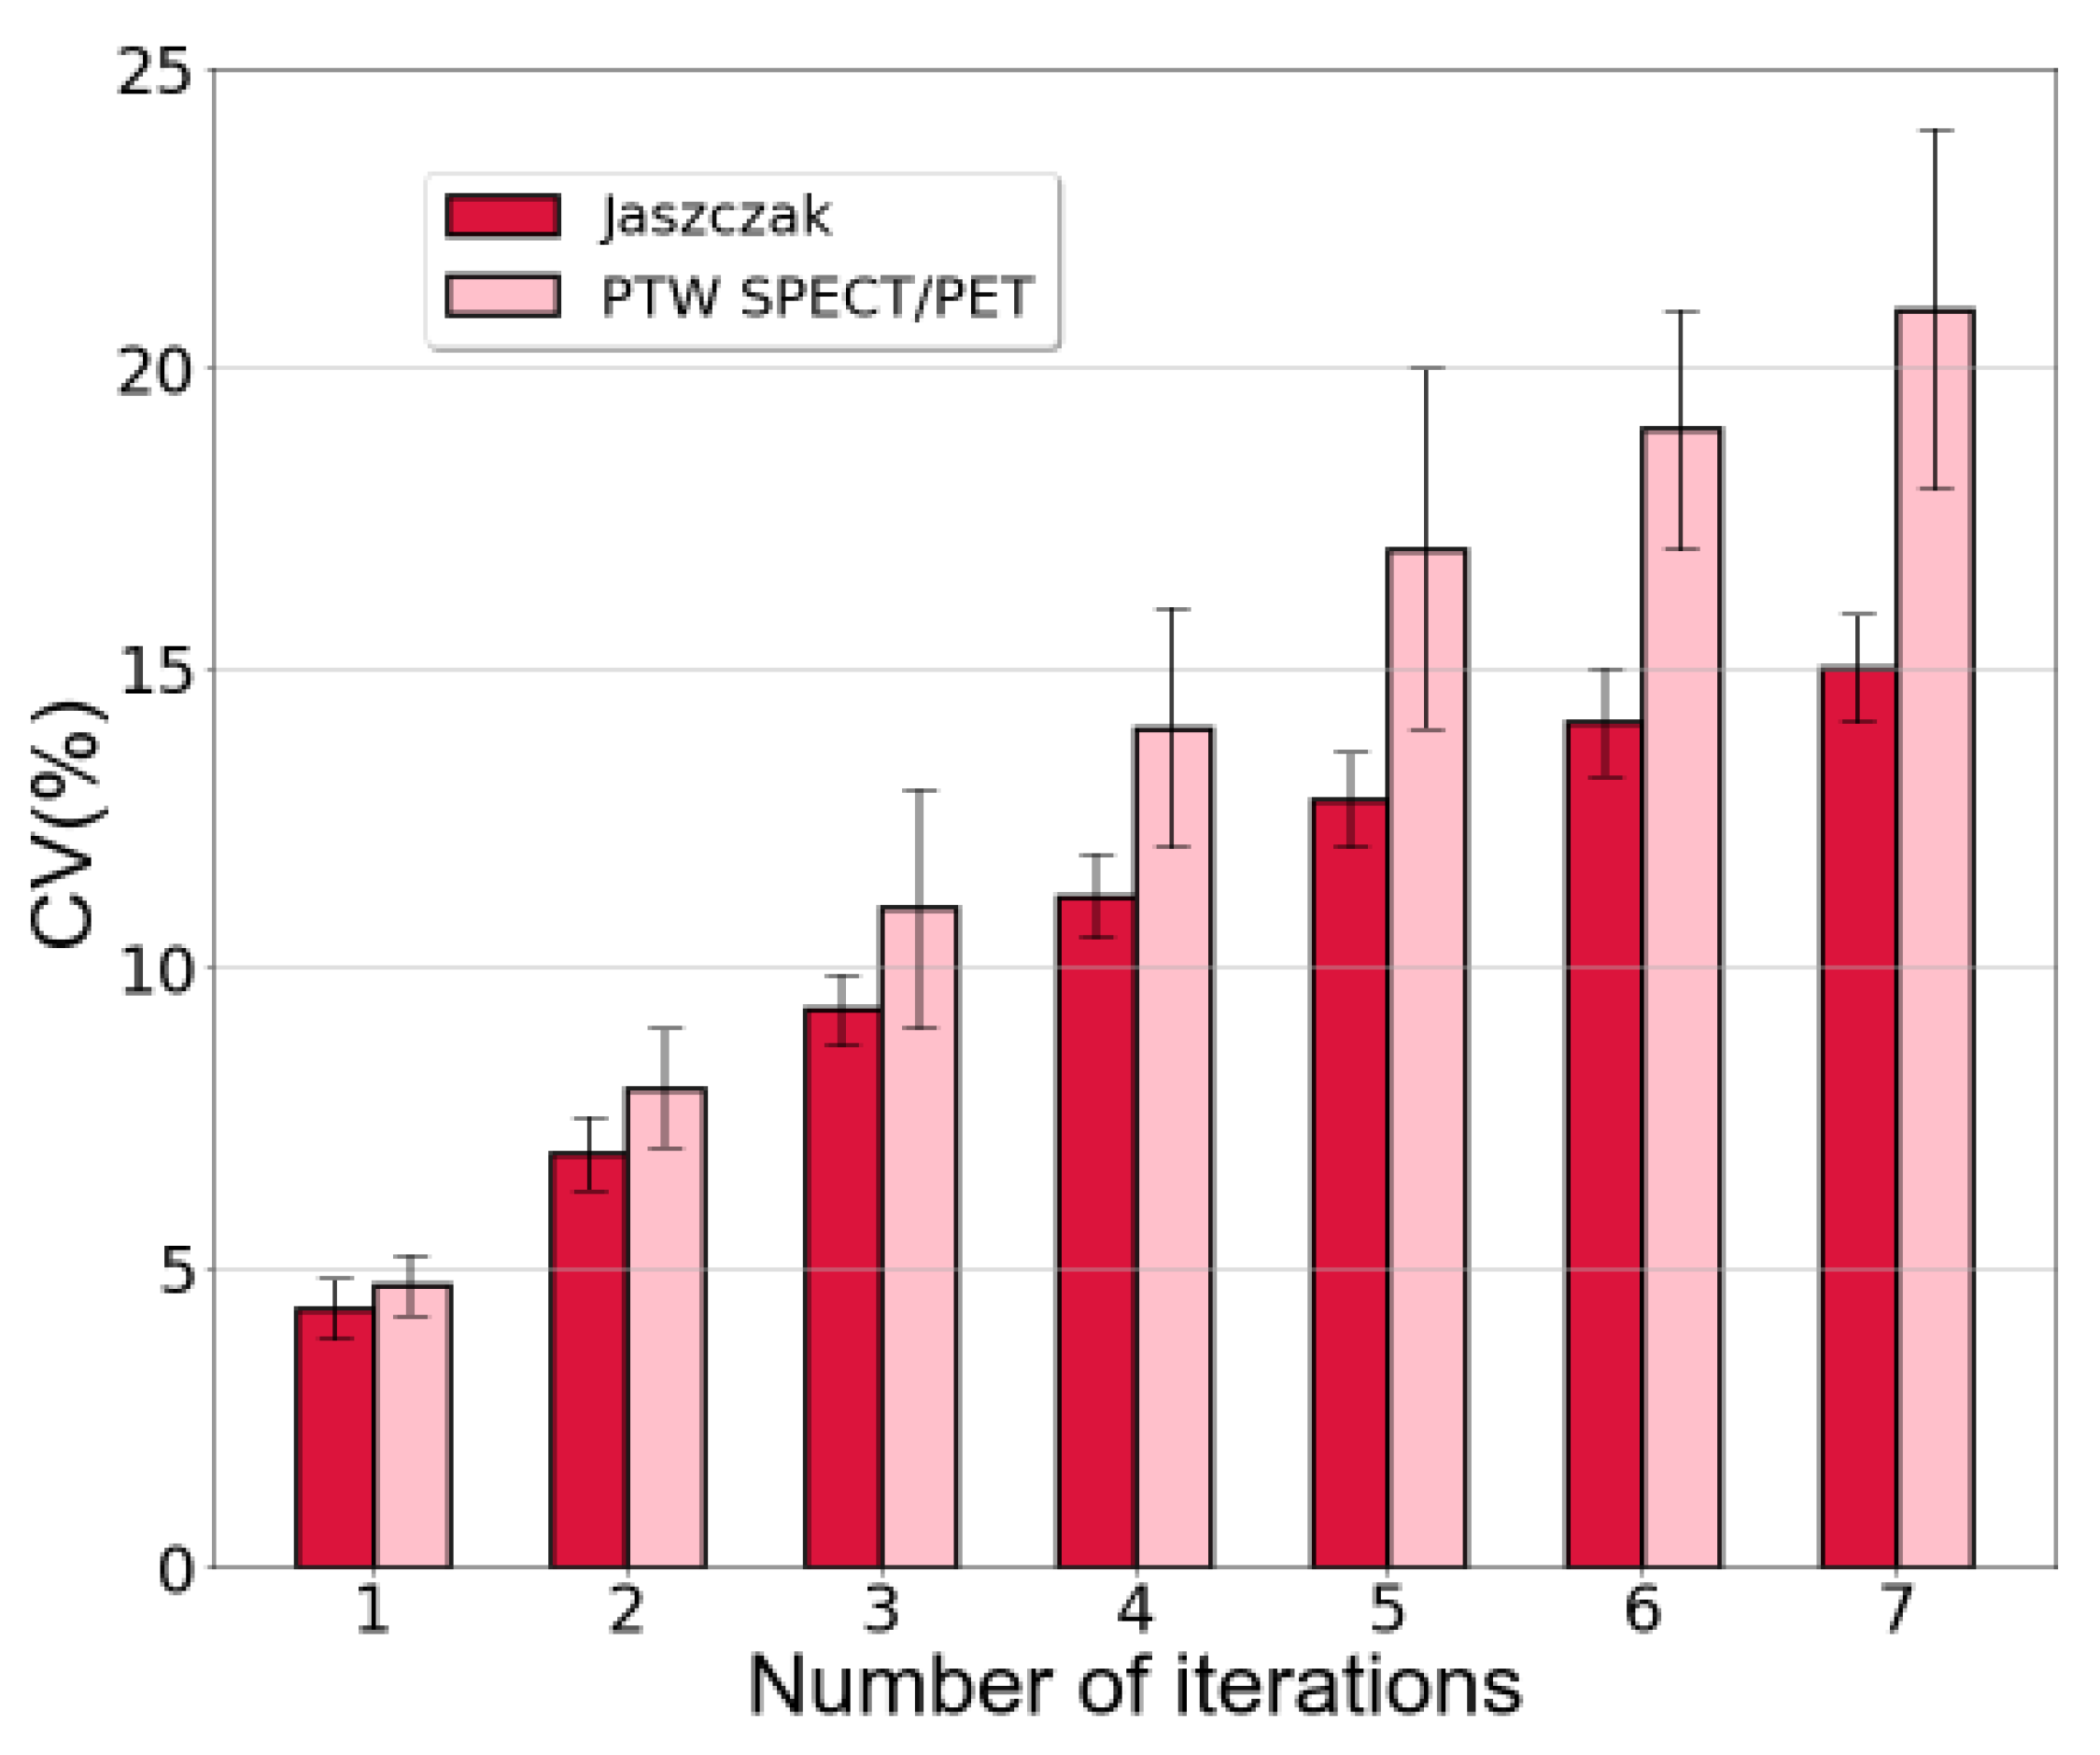
Figure 5.
Impact of full MC collimator modeling and varying subsets on contrast recovery coefficients. Graph A displays data from the Jaszczak phantom, while Graph B corresponds to the PTW SPECT/PET phantom.
Figure 5.
Impact of full MC collimator modeling and varying subsets on contrast recovery coefficients. Graph A displays data from the Jaszczak phantom, while Graph B corresponds to the PTW SPECT/PET phantom.
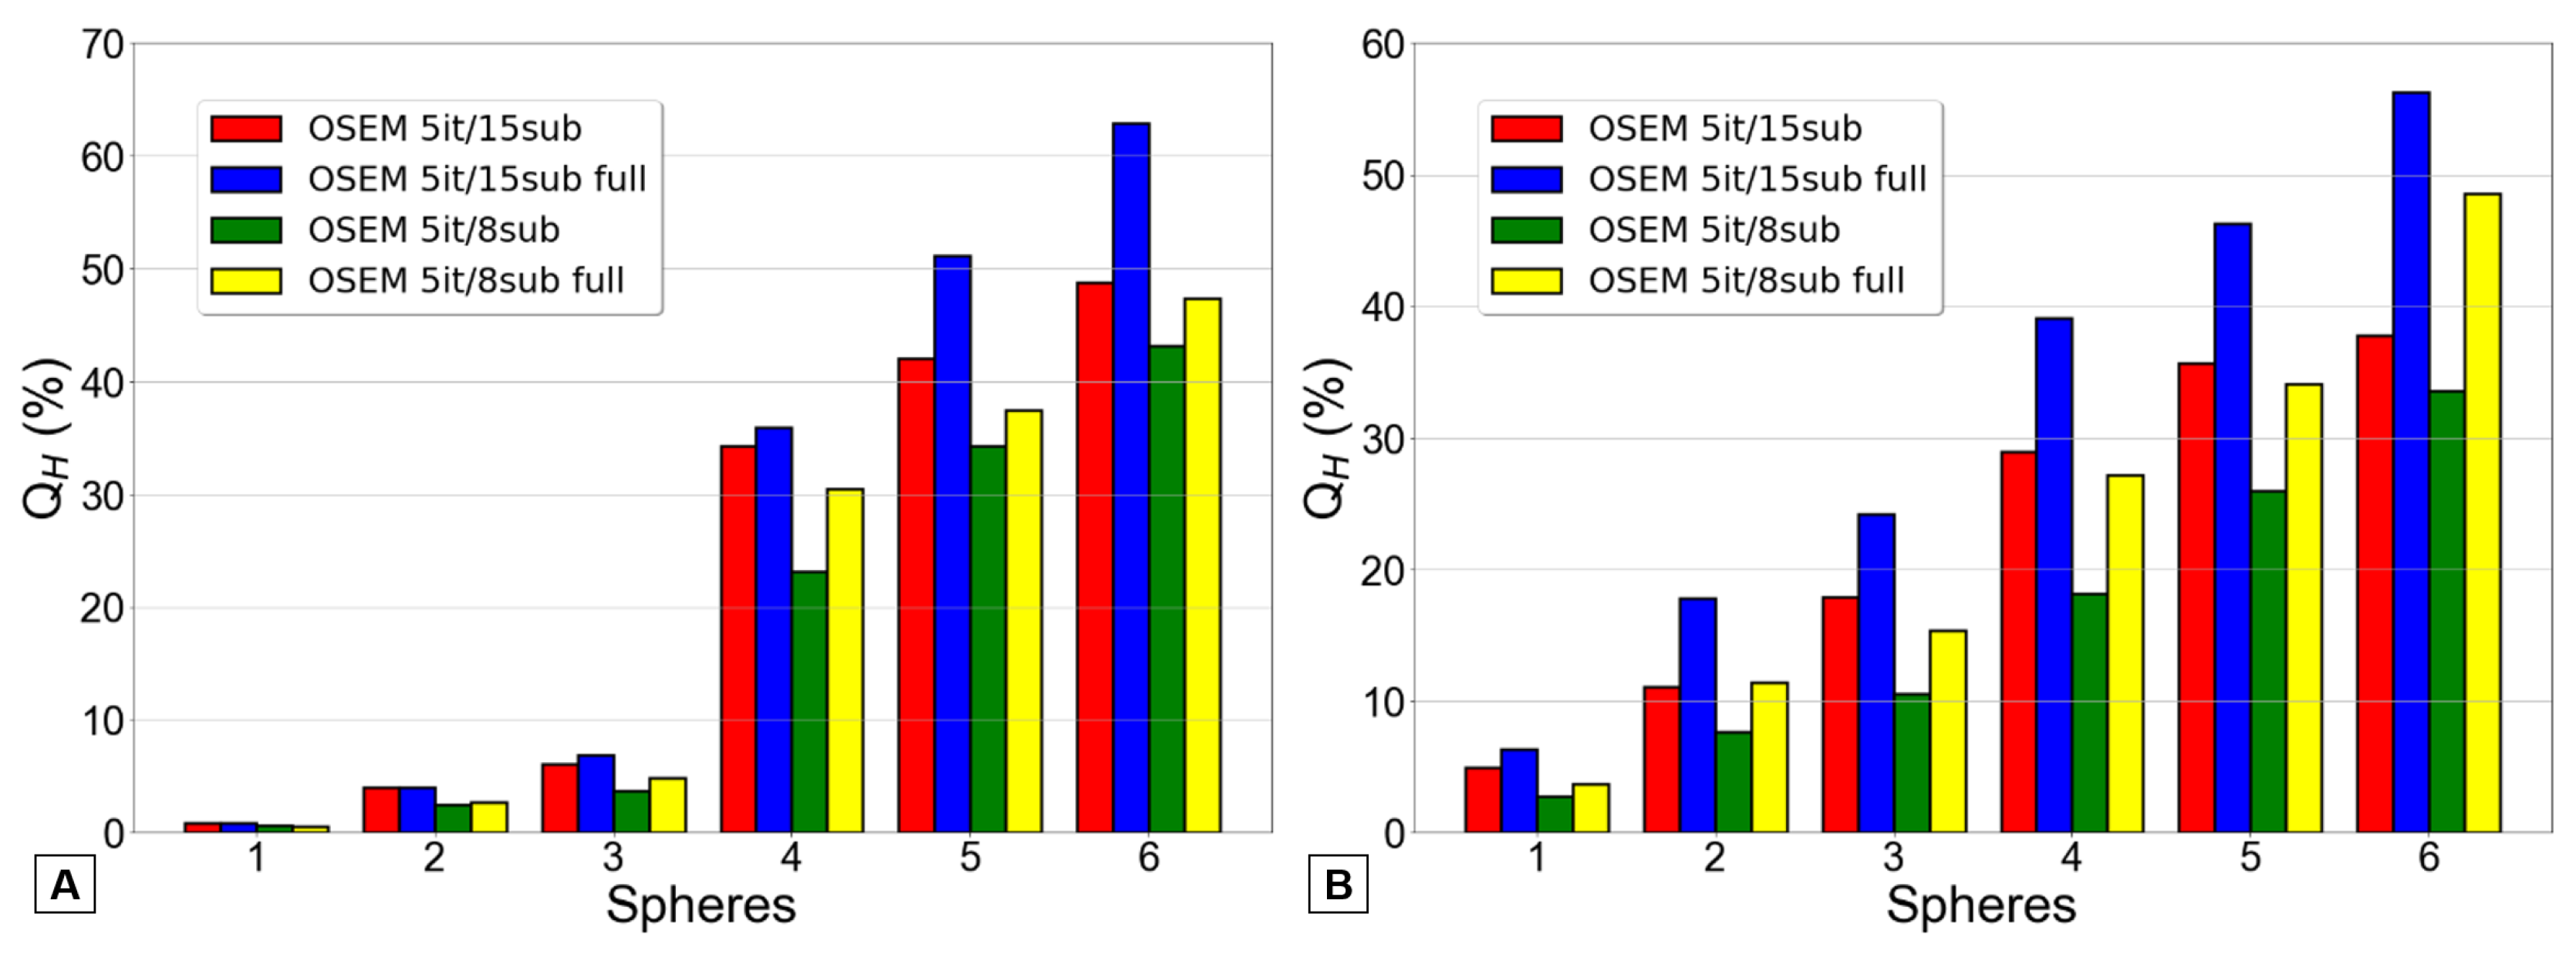
Figure 6.
CV (%) associated with the four reconstructions for each phantom. Error bars indicate the uncertainty determined for each measure.
Figure 6.
CV (%) associated with the four reconstructions for each phantom. Error bars indicate the uncertainty determined for each measure.
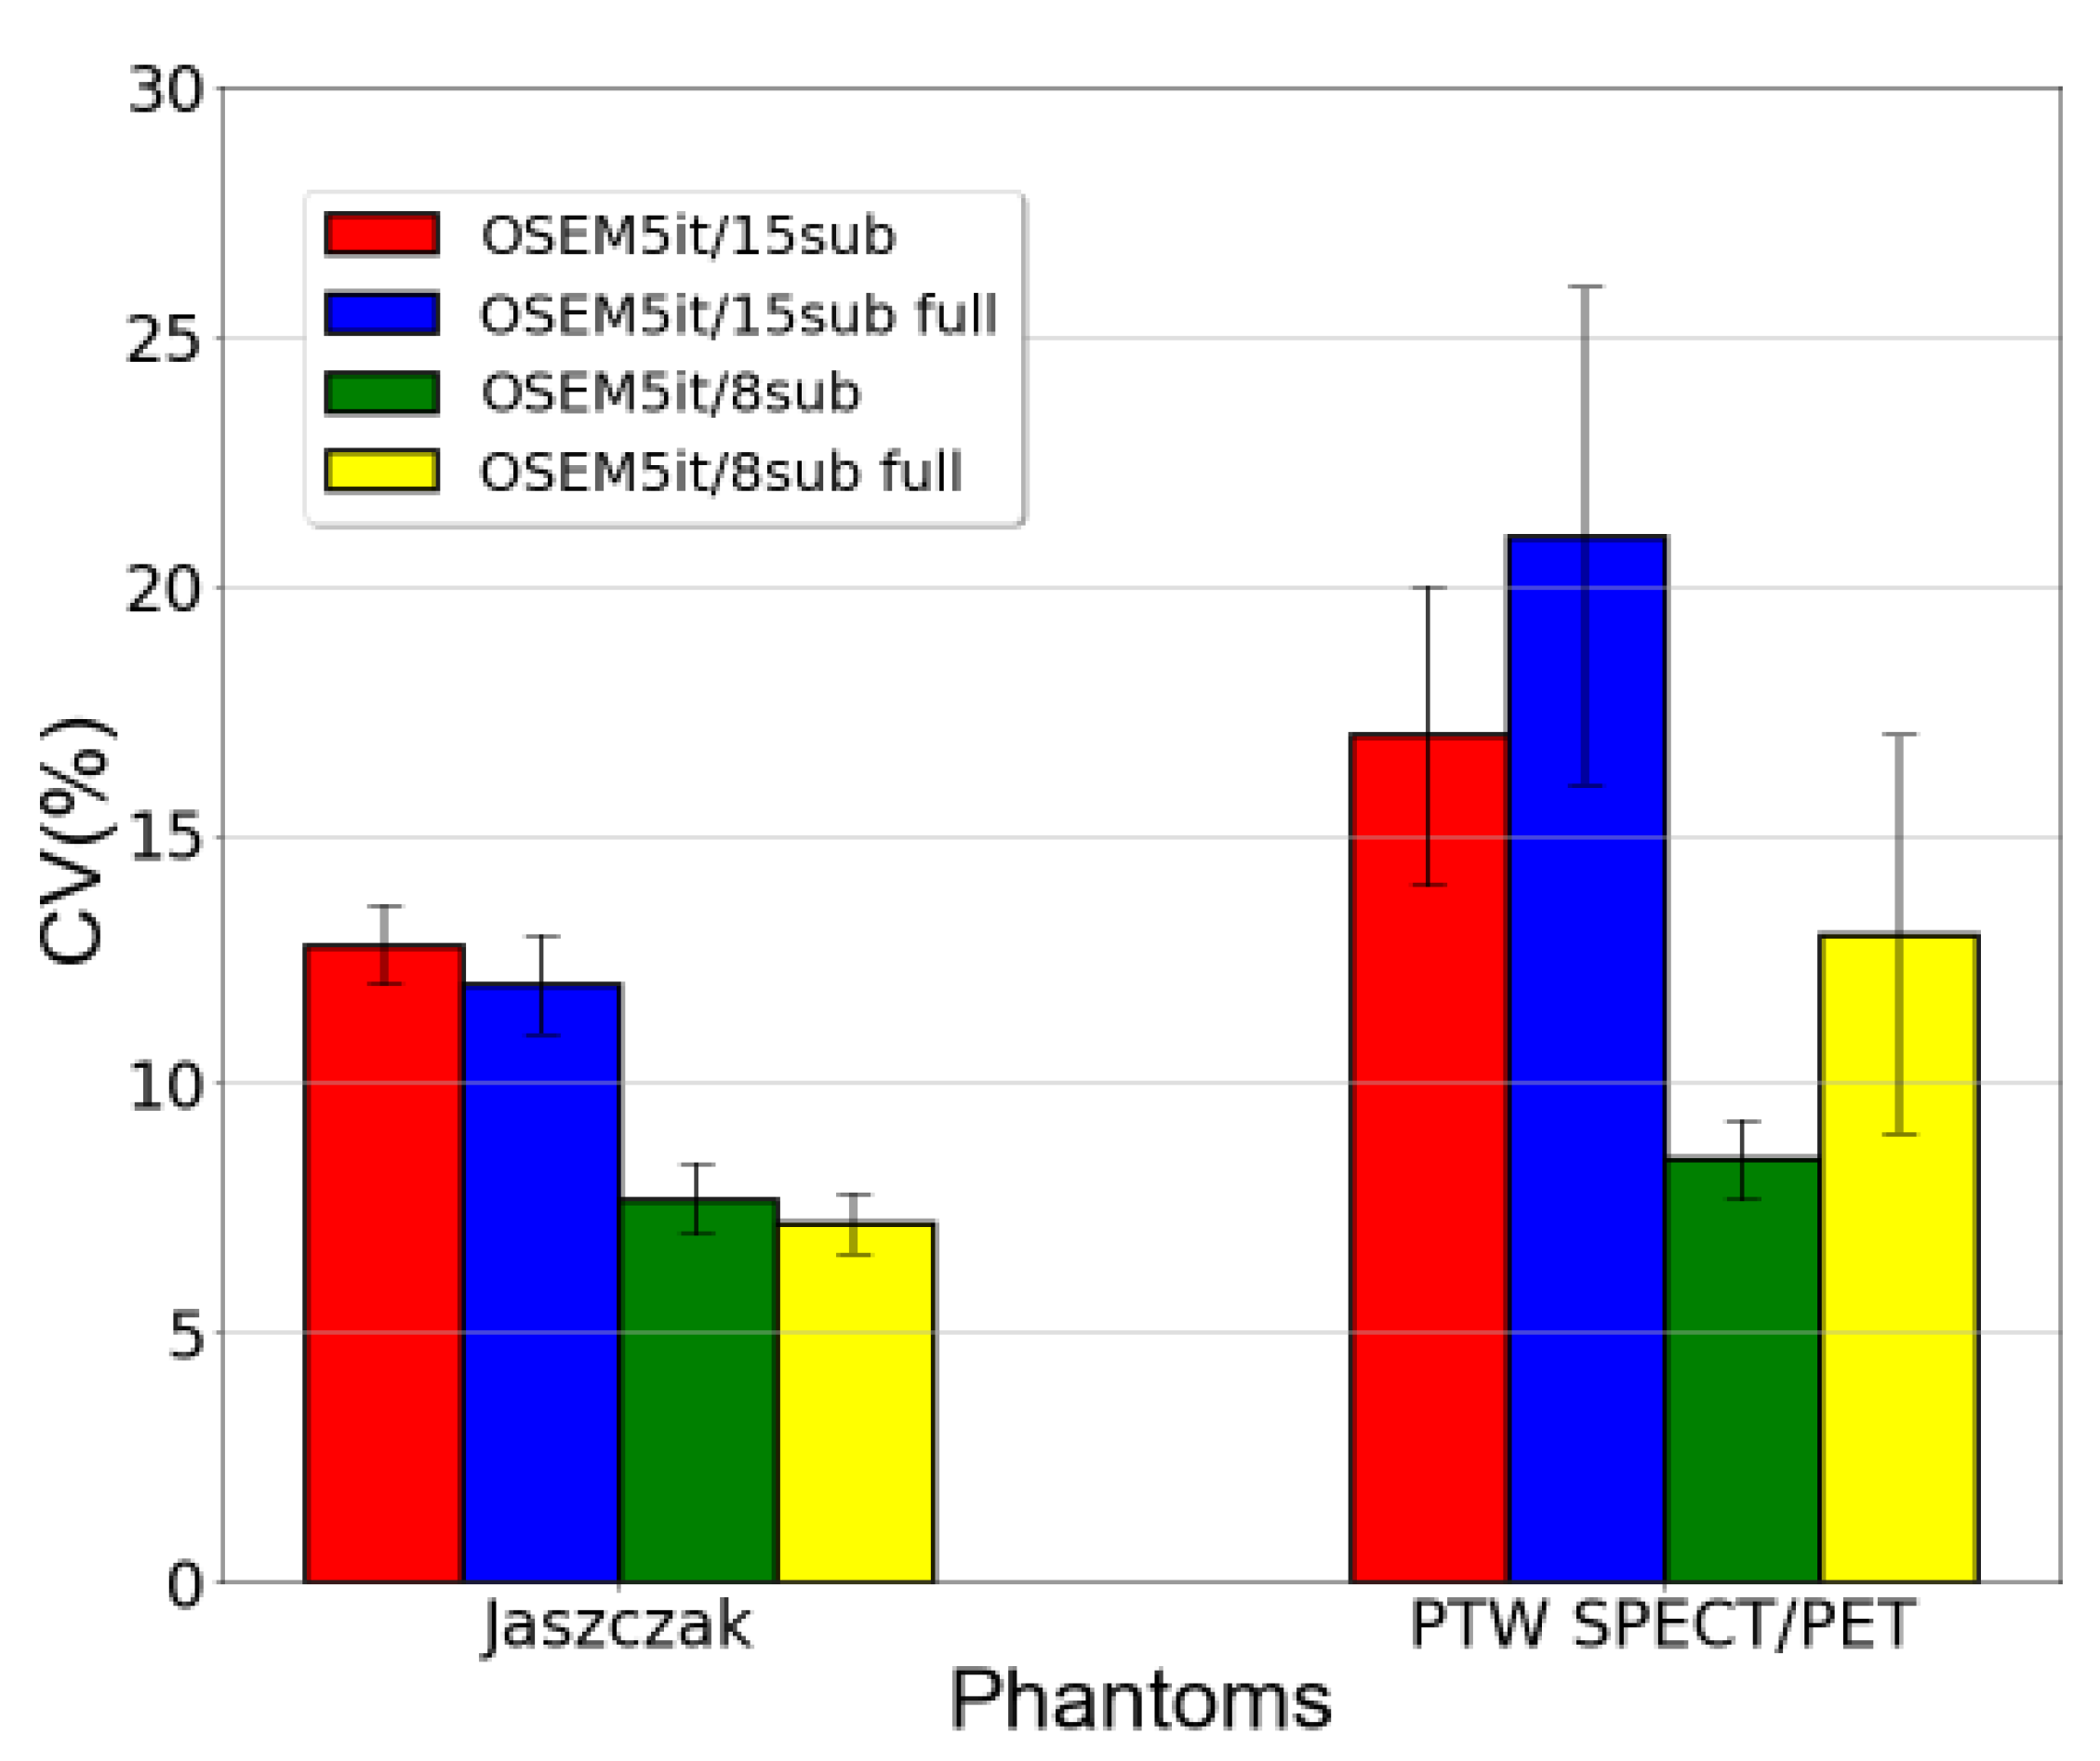
Figure 7.
ARC acquired using the Jaszczak phantom are presented for each reconstruction and sphere. These coefficients were calculated using one of three methods as described by equations 4 (A), 5 (B) or based on [17] (C), respectively.
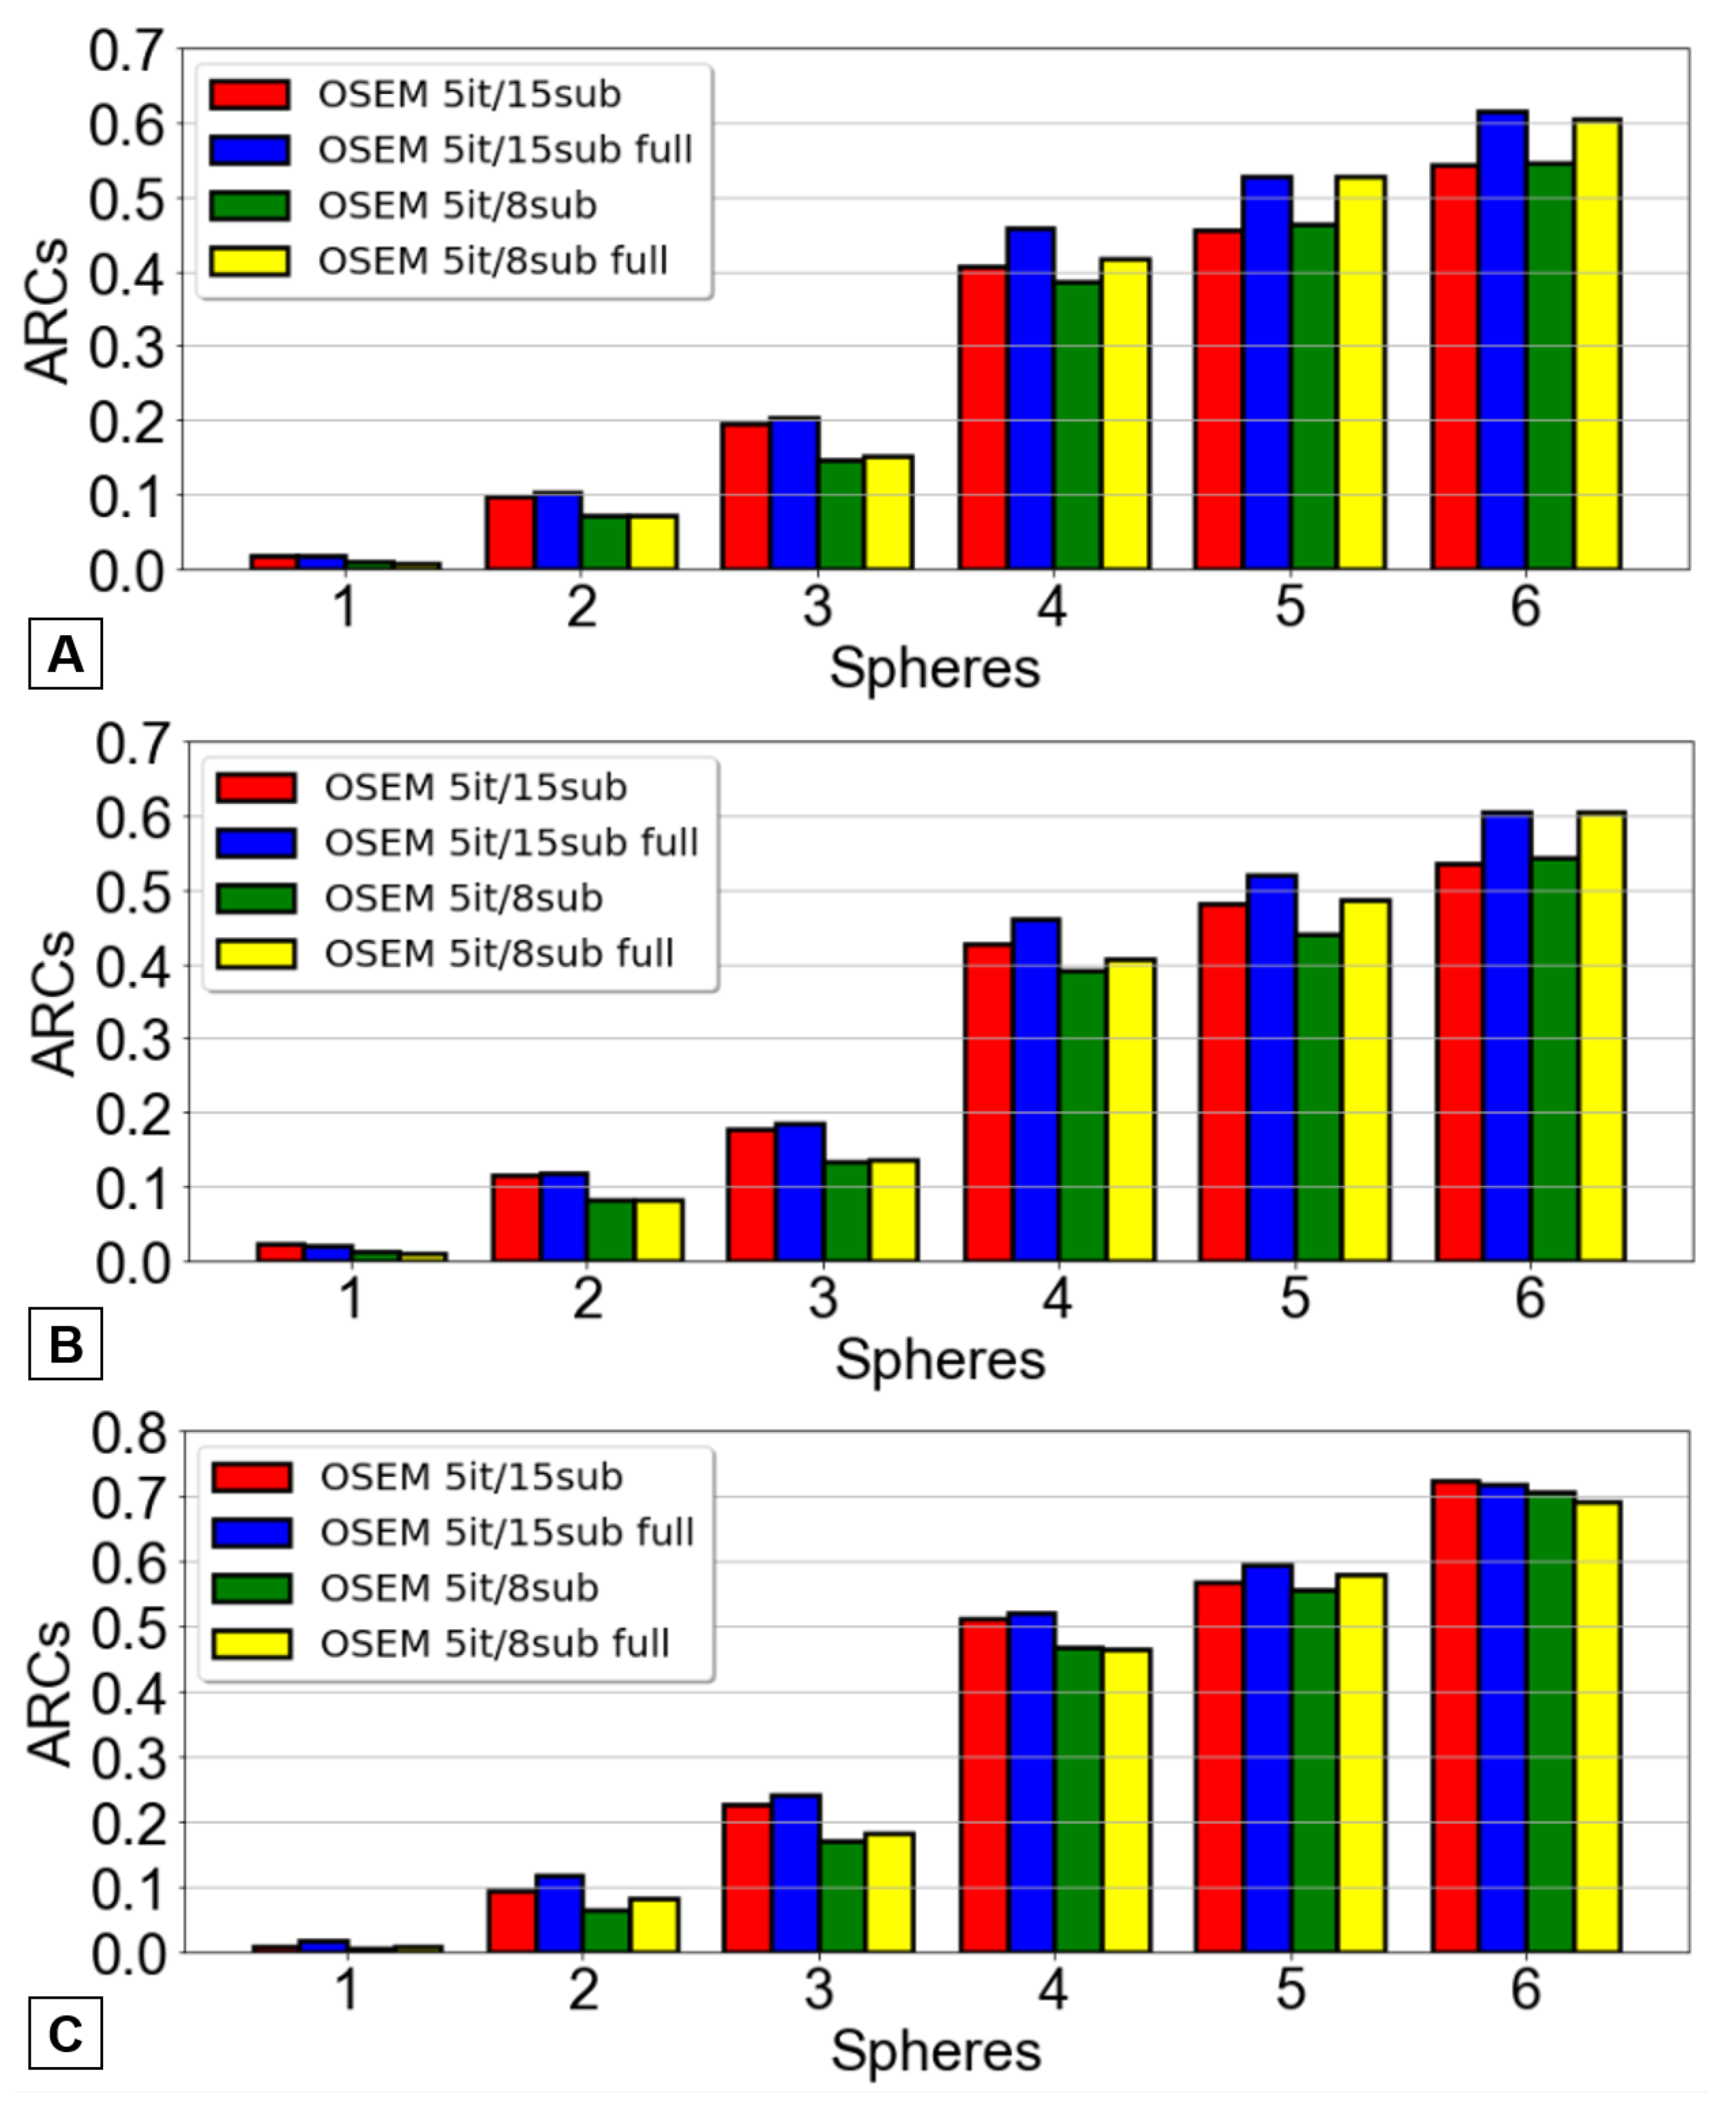
Figure 8.
ARC acquired using the PTW SPECT/PET phantom are presented for each reconstruction and sphere. These coefficients were calculated using one of three methods as described by equations 4 (A), 5 (B) or based on [17] (C), respectively.
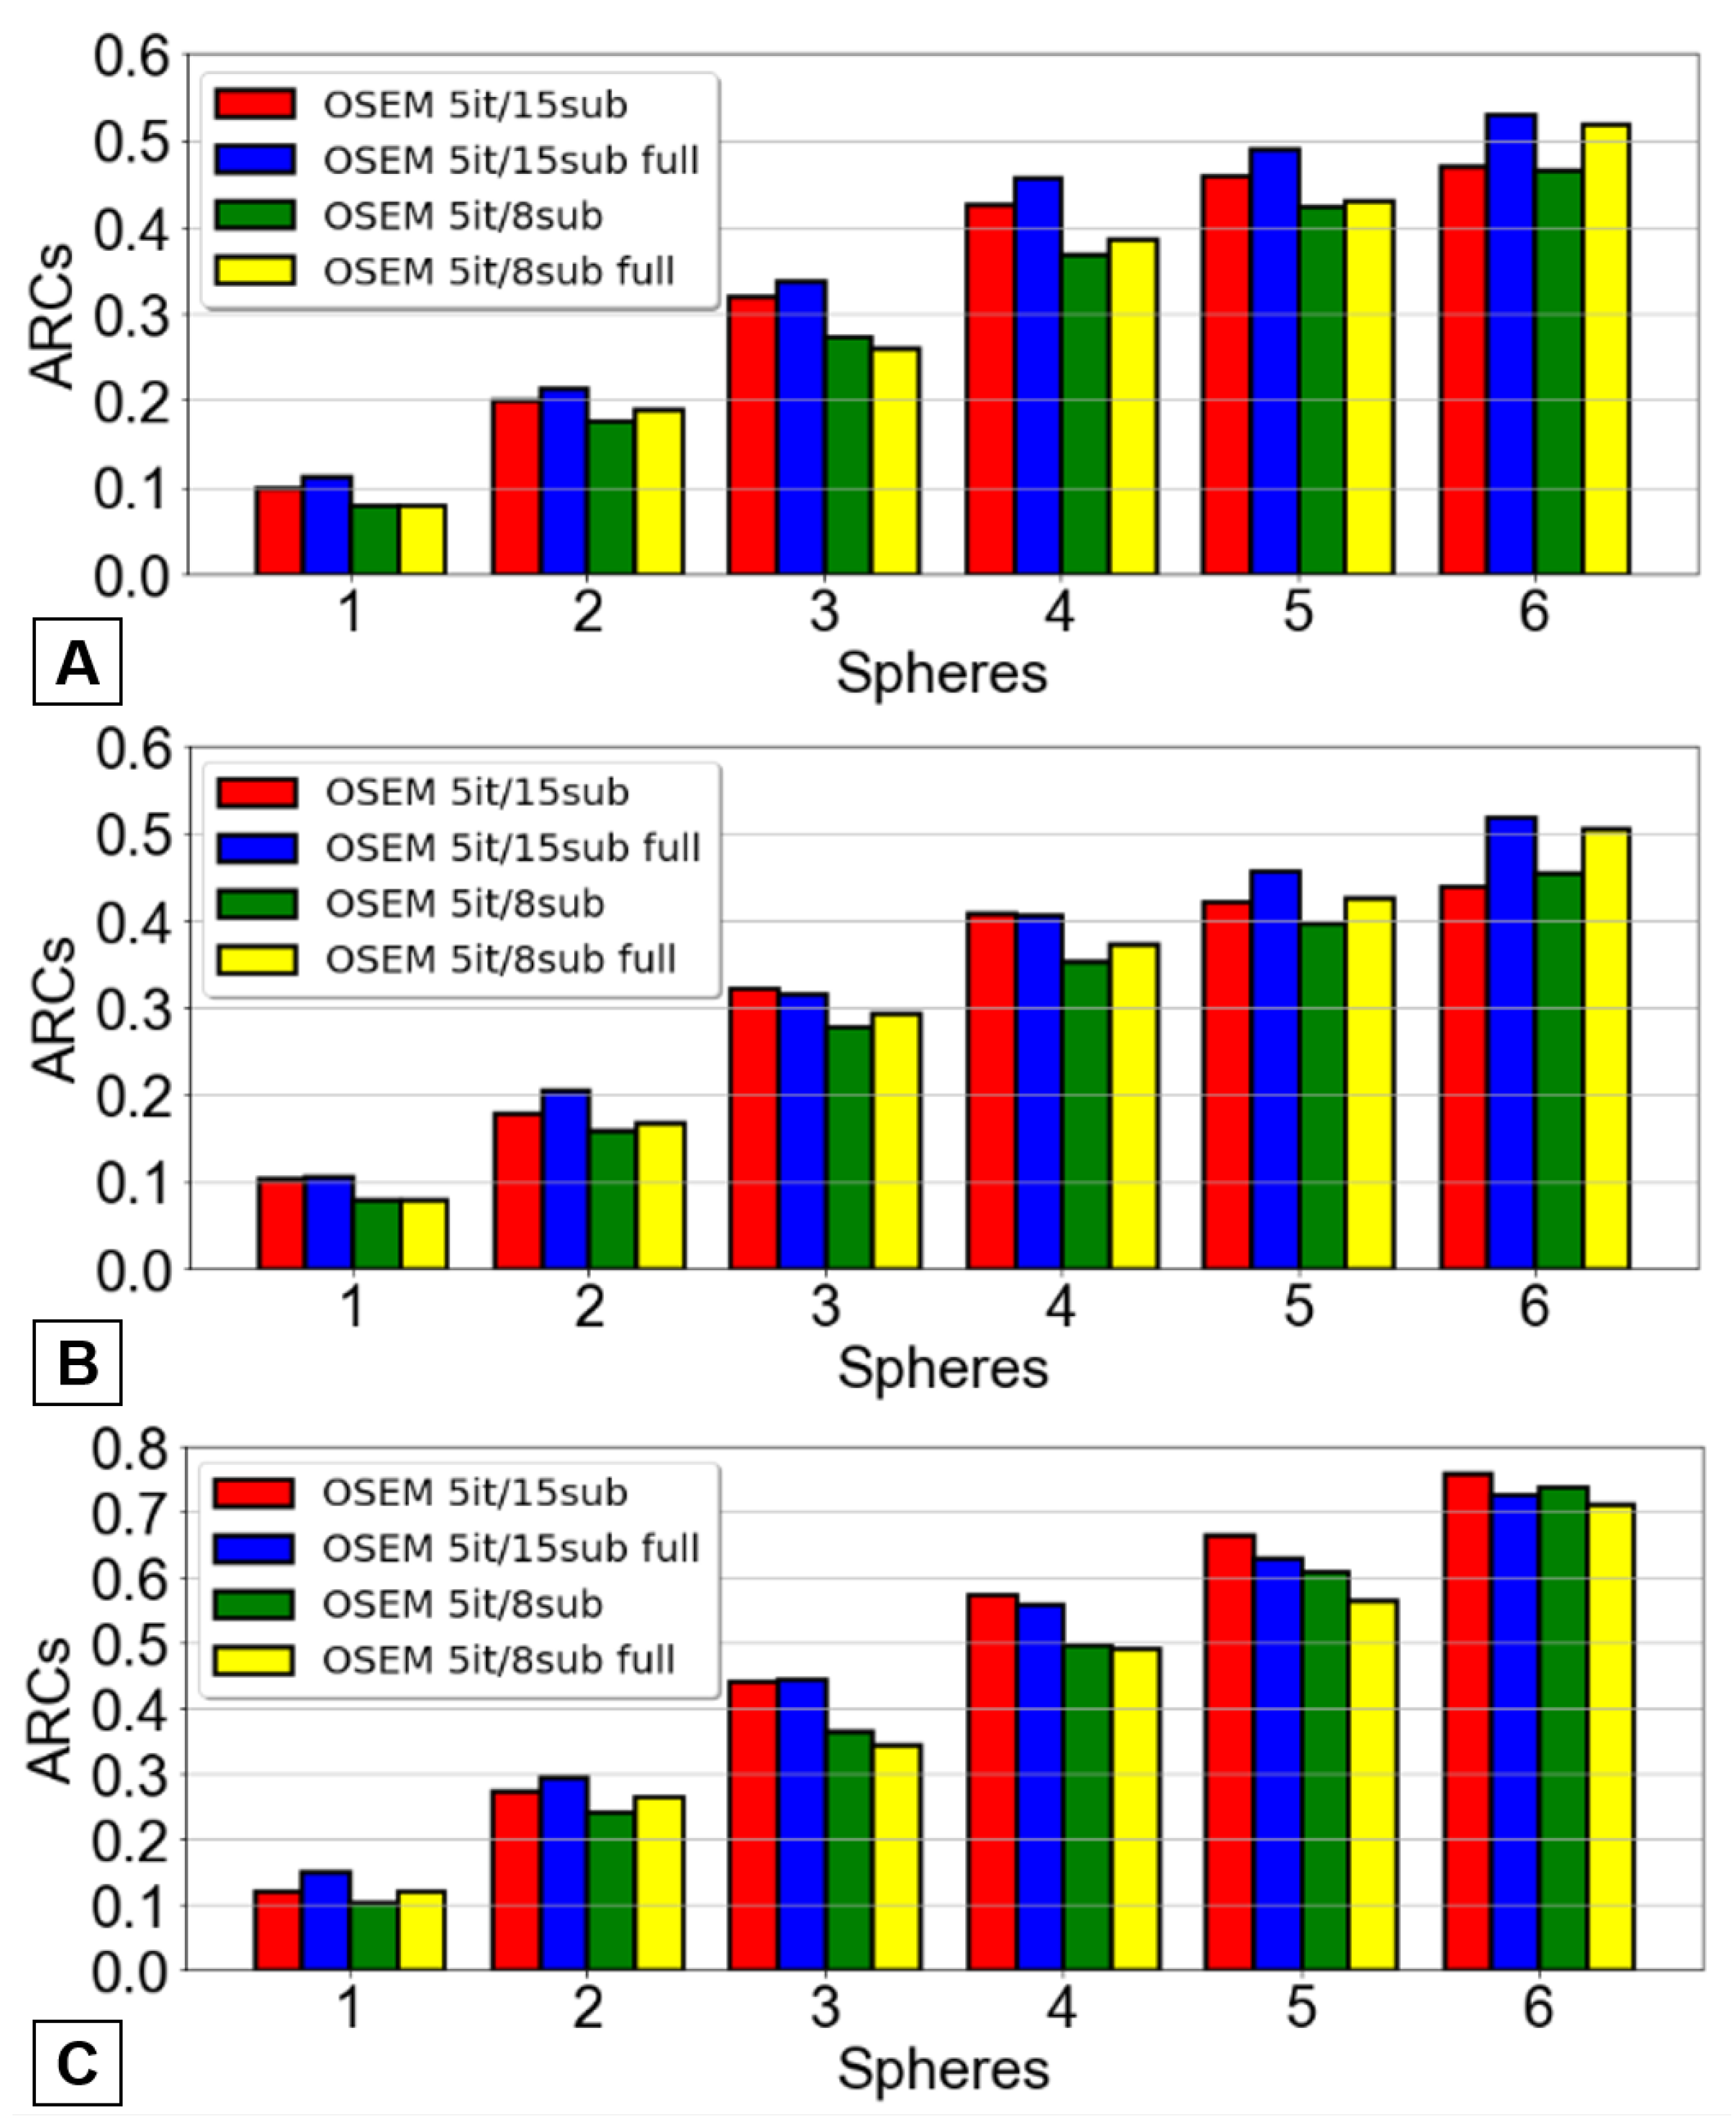
Figure 9.
ARC as a function of sphere volume. The first line of graphs (A, B and C) corresponds to the Jaszczak phantom for the three methods explored previously, while the second line (D, E and F) pertain to the PTW SPECT/PET phantom. The red and blue curves correspond to equations 7 and 6, respectively.
Disclaimer/Publisher’s Note: The statements, opinions and data contained in all publications are solely those of the individual author(s) and contributor(s) and not of MDPI and/or the editor(s). MDPI and/or the editor(s) disclaim responsibility for any injury to people or property resulting from any ideas, methods, instructions or products referred to in the content. |
© 2024 by the authors. Licensee MDPI, Basel, Switzerland. This article is an open access article distributed under the terms and conditions of the Creative Commons Attribution (CC BY) license (https://creativecommons.org/licenses/by/4.0/).
Copyright: This open access article is published under a Creative Commons CC BY 4.0 license, which permit the free download, distribution, and reuse, provided that the author and preprint are cited in any reuse.


