Preprint
Article

This version is not peer-reviewed.

Effects of Photopatterning Conditions on Azimuthal Surface Anchoring Strength

A peer-reviewed article of this preprint also exists.

Submitted:

20 November 2024

Posted:

22 November 2024

You are already at the latest version

Abstract

Spatially-varying alignment of liquid crystals is essential for research and applications. One widely used method is based on the photopatterning of thin layers of azo-dye molecules, such as Brilliant Yellow (BY), that serve as an aligning substrate for a liquid crystal. In this study, we examine how photopatterning conditions, such as BY layer thickness (b), light intensity (I), irradiation dose, and age affect the alignment quality and the strength of the azimuthal surface anchoring. The azimuthal surface anchoring coefficient, W, is determined by analyzing the splitting of integer disclinations into half-integer disclinations at prepatterned substrates. The strongest anchoring is achieved for b in the range of 5–8 nm. W increases with the dose, and within the same dose, W increases with I. Aging of a non-irradiated BY coating above 15 days reduces W. Sealed photopatterned cells filled with a conventional nematic preserve their alignment quality for up to four weeks, after which time W decreases. This work suggests the optimization pathways for photoalignment of nematic liquid crystals.

Keywords: 
;  ;  ;  ;  ;  

1. Introduction

Alignment of liquid crystals (LCs) is crucial for their applications. While the unidirectional alignment can be achieved by mechanical rubbing [1,2,3], alignment with spatially-varying “easy axis” requires a more sophisticated approach. Spatially-varying alignment becomes exceedingly important in many academic and applied projects, such as the fabrication of planar optics elements [4,5,6,7,8], LC elastomer coatings with predesigned topography [9,10,11,12,13,14], orientationally ordered environments that control collective and individual dynamics of microswimmers [15,16,17,18], and substrates that align living tissues [19,20,21]. The most popular approach to achieving spatially-varying alignment of LCs is photoalignment [12,22,23,24,25,26]. Photoalignment allows one to design complex director patterns with high spatial resolution [25,26], controllable surface anchoring [27], dynamic director alignment [28], and the capability to pattern the alignment on flexible and curved substrates [29,30]. Photoalignment does not induce impurities, electric charges, or mechanical damage to the treated surfaces.
A commonly used material for photoalignment is the azo-dye Brilliant Yellow. It allows one to produce high quality alignment in a relatively easy process [24,31,32,33,34,35]. Azo-dye molecules undergo photoinduced reorientation when exposed to light [35,36,37]. For irradiation with a linearly polarized beam, the probability of absorption is P c o s 2 β where β is the angle between the long axis of the molecule in its trans state and the light polarization direction. The absorption-reorientation process repeats itself until the dye molecule align perpendicularly to the light polarization, β = π / 2 . Once most of the molecules are photoaligned and the irradiation stops, molecular interactions lock their positions, preventing reorientation [36]. Studies by Wang et al. [38] and Shi et al. [39] show that alignment quality strongly depends on exposure to humidity and only slightly depends on the type of surface used for depositing BY. Our previous work showed that a longer light exposure produces a stronger in-plane (azimuthal) surface anchoring [27]. However, the effect of other important factors remained unexplored.
This study investigates the effect of photopatterning conditions, such as BY layer thickness ( b ), light intensity ( I ), irradiation dose, and age of non-irradiated substrate, on the alignment quality and the strength of azimuthal anchoring expressed by the anchoring coefficient W in the surface potential 1 2 W s i n 2 α , where α is the angle between the alignment direction imposed by the patterned BY layer and the actual director specifying the local orientation of the liquid crystal. The coefficient W is determined by analyzing the splitting of integer disclinations into half-integer disclination at photopatterned substrates [19,27]. We find that b in the range 5–8 nm yields the strongest azimuthal anchoring. W increases with the dose and with I when the doze is fixed. BY-coated substrates, which are photopatterned within 15 days of substrate preparation (after BY spin coating and baking, but before irradiation), show no significant change in W . However, substrates aged for more than 15 days before irradiation exhibit a decline in W . Photopatterned cells filled with a conventional nematic LC and sealed with epoxy glue preserve their alignment strength for about 4 weeks, but further aging of the filled cell leads to a reduction of W . The results facilitate the optimization of BY photoalignment for liquid crystal applications.

2. Materials and Methods

2.1. Cell Preparations

Indium tin oxide (ITO) coated glass plates are sonicated in water with a small amount of detergent at 60 ° C for 15 min. Although the studies do not require an application of an electric field, the choice of ITO-coated plates is justified by the fact that most applications of liquid crystals involve electro-optic effects thus the presence of the ITO electrodes is often a necessity. The plates are rinsed with isopropanol, dried in an oven at 80 ° C for 15 min, and exposed to UV in an ozone chamber for 15 min. The plates are spin-coated with a solution of azo-dye BY in N, N-dimethylformamide (DMF), Figure 1a (both purchased from Sigma Aldrich) at 3000 rpm for 30 seconds, and baked at  80   ° C for 30 min. We use DMF solutions with various BY concentrations, 0.2, 0.4, 0.5, 0.6, 0.8, 1.0, 2.0, and 4.0 %wt, in order to vary the thickness b of the resulting BY layer and to explore its effect on the anchoring strength. All other experiments are performed with substrates coated with a 0.5 wt% BY solution, resulting in b = 7.6 nm, which is in the optimal thickness range of 5-8 nm that yields the strongest W . To avoid detrimental effects of humidity on BY alignment [38], we control the relative humidity (RH) of the environment at less than 20% during the spin coating and baking, at 20-35% during substrates storage, cell assembly, and photopatterning and, and at less than 50% during imaging the sealed LC filled cells kept at a constant temperature of 45 ° C.
Cells are assembled from two glass substrates with the BY-coated surfaces facing each other; these are called BY-BY cells throughout the text. The gap is fixed using epoxy glue NOA 65, without spacers, to achieve a thickness of ~1 μm. The thickness h of the gap between two plates is measured by an interferometric technique using a UV/VIS spectrometer Lambda 18 (Perkin Elmer).

2.2. Photopatterning

We use the plasmonic metamask (PMM) technique introduced by Guo et al. [24,25] to pattern the substrates with an array of +1 and −1 defects. PMM is an aluminum film with a thickness of 150 nm containing an array of nanoslits, each with a length of 220 nm and a width of 100 nm. When an unpolarized light beam passes through a nanoslit, the transmitted light becomes polarized along the short axis of the nanoslit. The transmitted light beam then aligns azobenzene molecules perpendicularly to the light polarization direction. As a result, a desired pattern, which replicates the pattern of nanoslits in the PMM, is produced in the azo-dye layer. We use a light source EXFO X-Cite with a wavelength range of (320-750) nm. The light beam propagates along normal to the surfaces of the PMM and the cell. The light intensity I is measured at the point of cell incidence using a power and energy meter console PM 100D (THORLABS).
A periodic square lattice of defects with strength +1 and −1 is designed by using a superposition rule for the in-plane director, n ^ B Y = n x , n y , 0 = ( c o s φ , s i n φ , 0 ) , where φ = i = 1 p j = 1 q ( 1 ) i + j a r c t a n ( y j b x i a ) , x and y are the Cartesian coordinates, p and q are the numbers of defects in rows and columns, respectively, p = q = 10 ;   a = b = 200   μ m is the distance between the defects along the x and y directions, respectively. The +1 defects in the pattern are of a radial type, so that the director around them experiences mostly splay, Figure 1b.

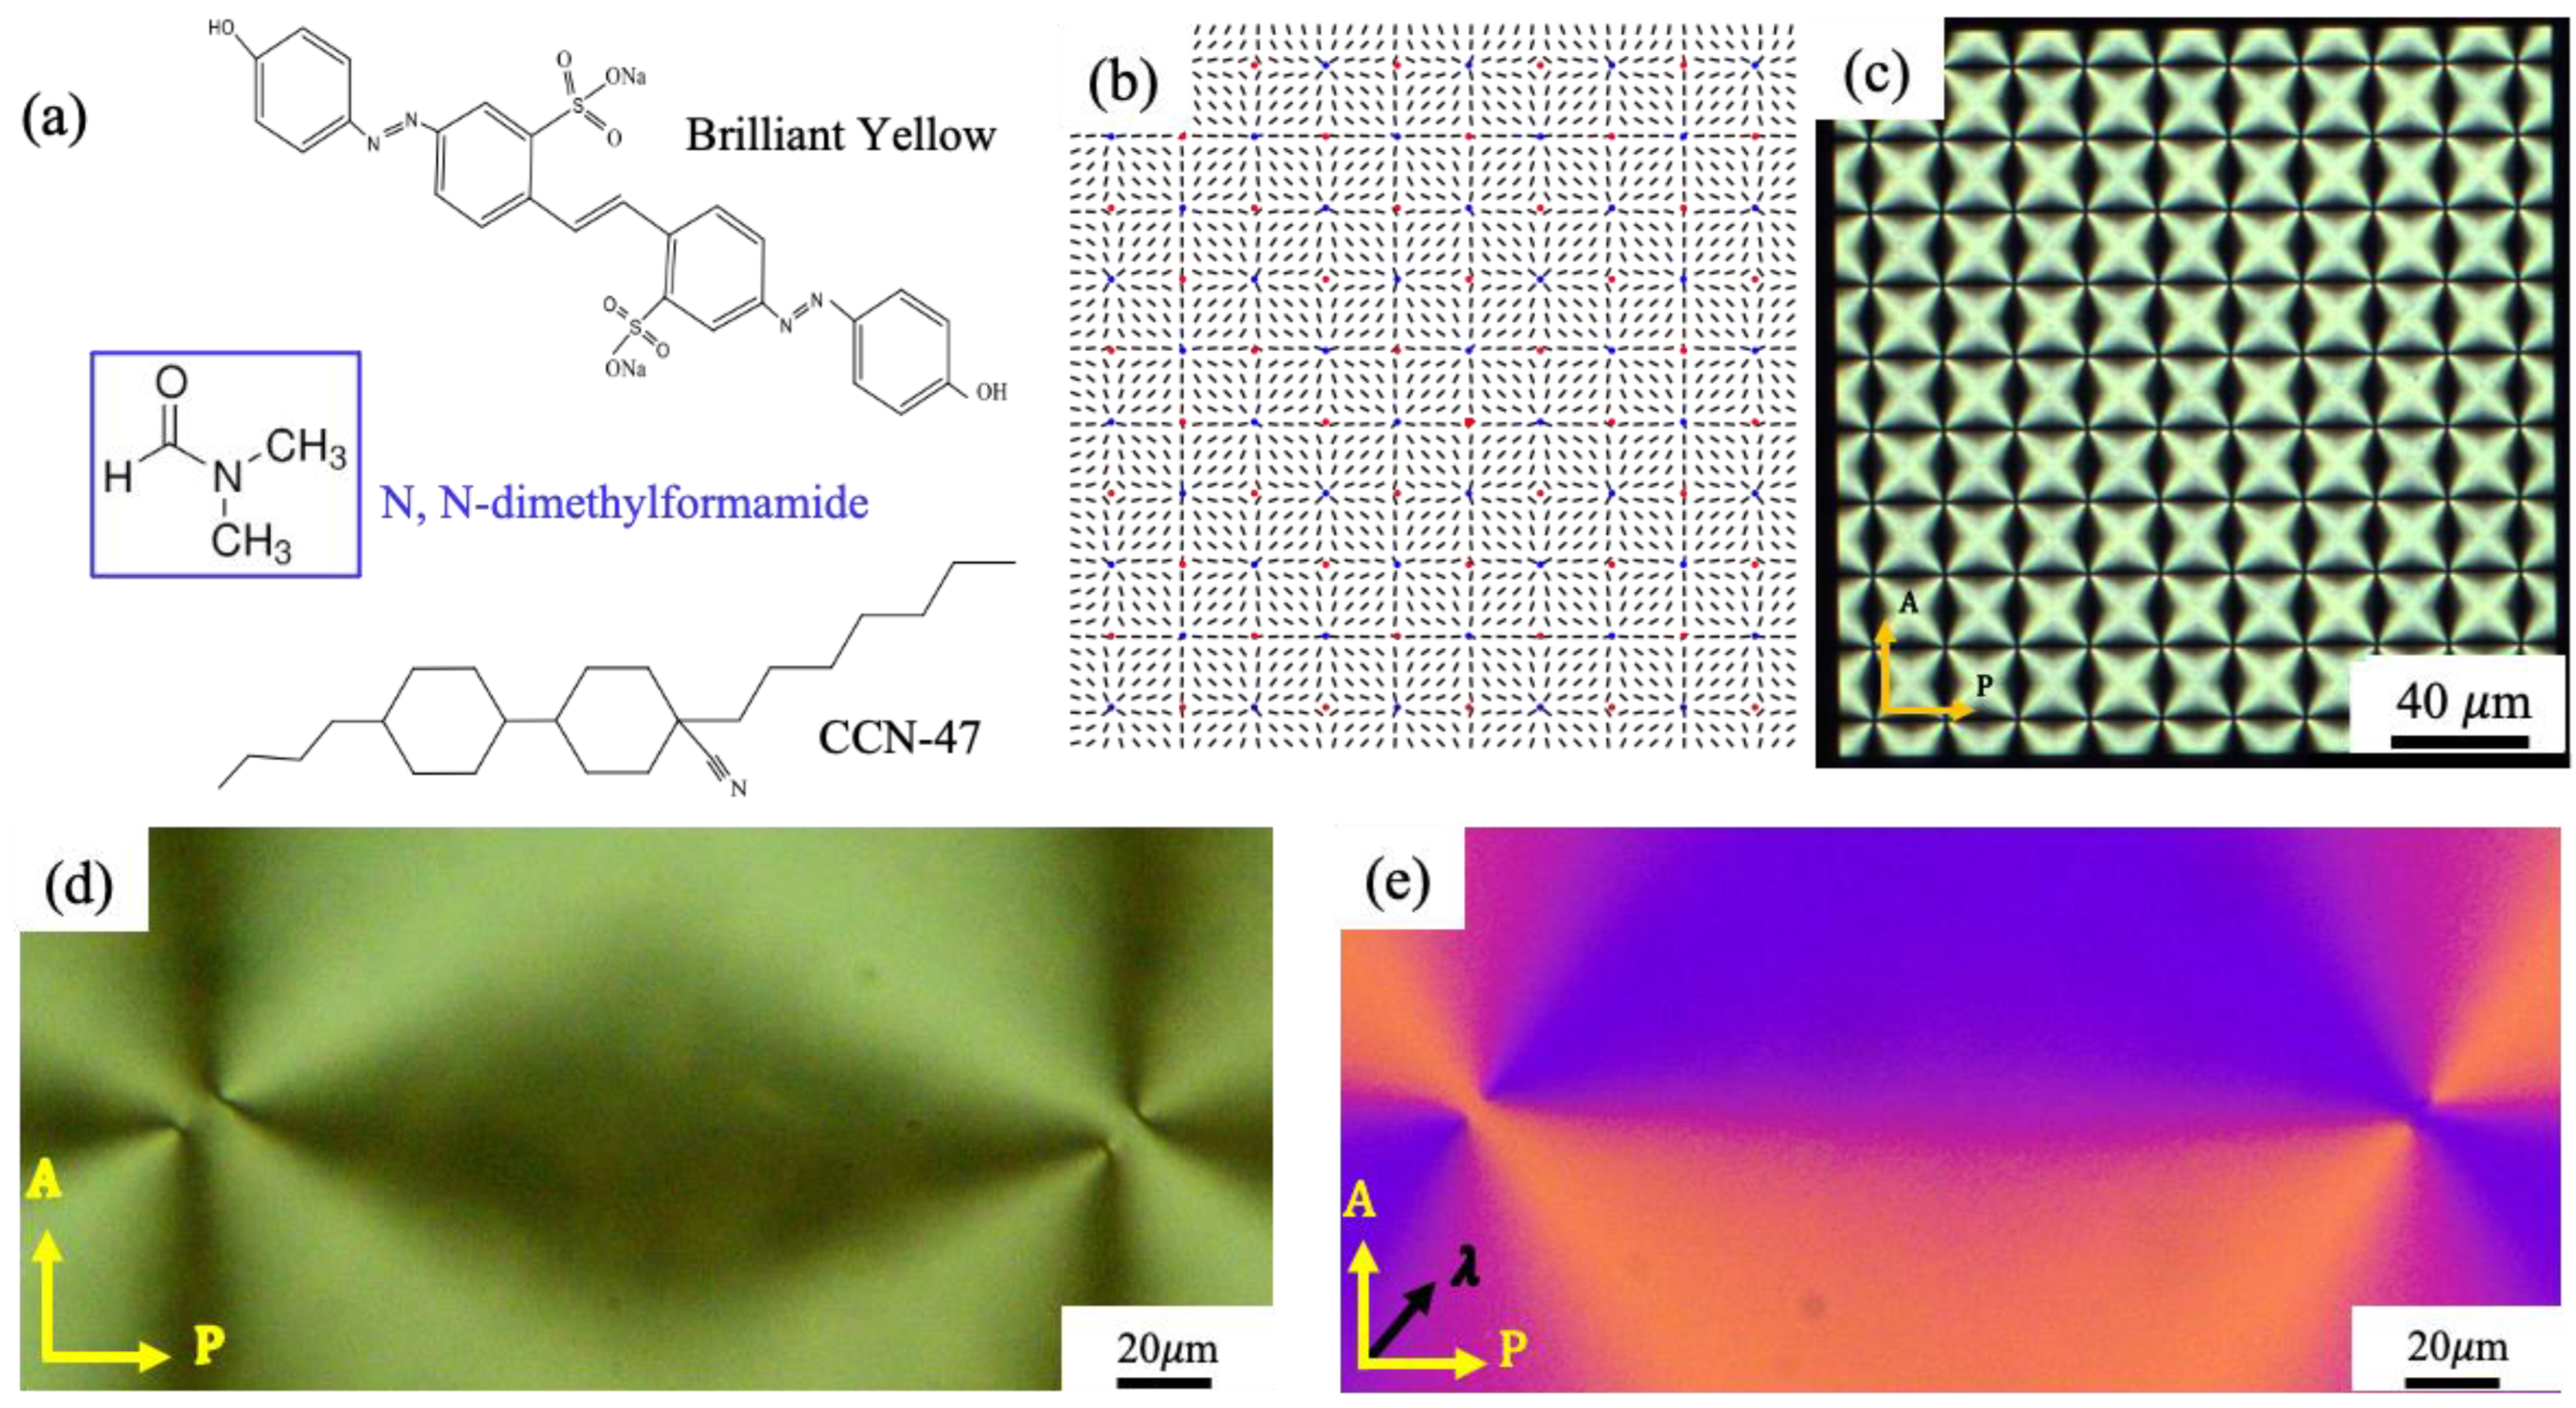
2.3. Nematic Material

The photopatterned cells are filled with 4-butyl-4-heptyl-bicyclohexyl-4-carbononitrile (CCN-47), Figure 1a, by capillary action in the isotropic state at the temperature 70 ° C. The material exhibits the following phase transitions upon heating: Smectic A 29.9 ° C Nematic 58.5 ° C Isotropic. After filling the cells, they are kept at 45 ° C during the experiments using a Linkam hot stage. At 45 ° C, the elastic constants K 1 of splay and K 3 of bend of CCN-47 are equal, K 1 = K 3 = K = 8   p N [40], which allows one to use the superposition rule for the director field and to analyze the elastic properties of the patterns in the so-called one-constant approximation [41].

2.4. Optical Microscopy Characterization

Optical textures of photopatterned LC cells are recorded using a polarized optical microscope (Olympus BX51) equipped with a Basler (acA1920-155um) digital color camera, Figure 1d,e. A full-wavelength (530 nm) optical compensator is used to reconstruct the director field, Figure 1e. Regions where the director aligns parallel to the slow axis of the compensator, exhibit a blue interference color, while areas where the director is perpendicular to the slow axis appear yellow. The left defect in Figure 1d,e is a +1 radial defect, while the right is a −1 defect. The separation distance between half integer defects, d , is measured using the open-source software package Fiji/ImageJ.

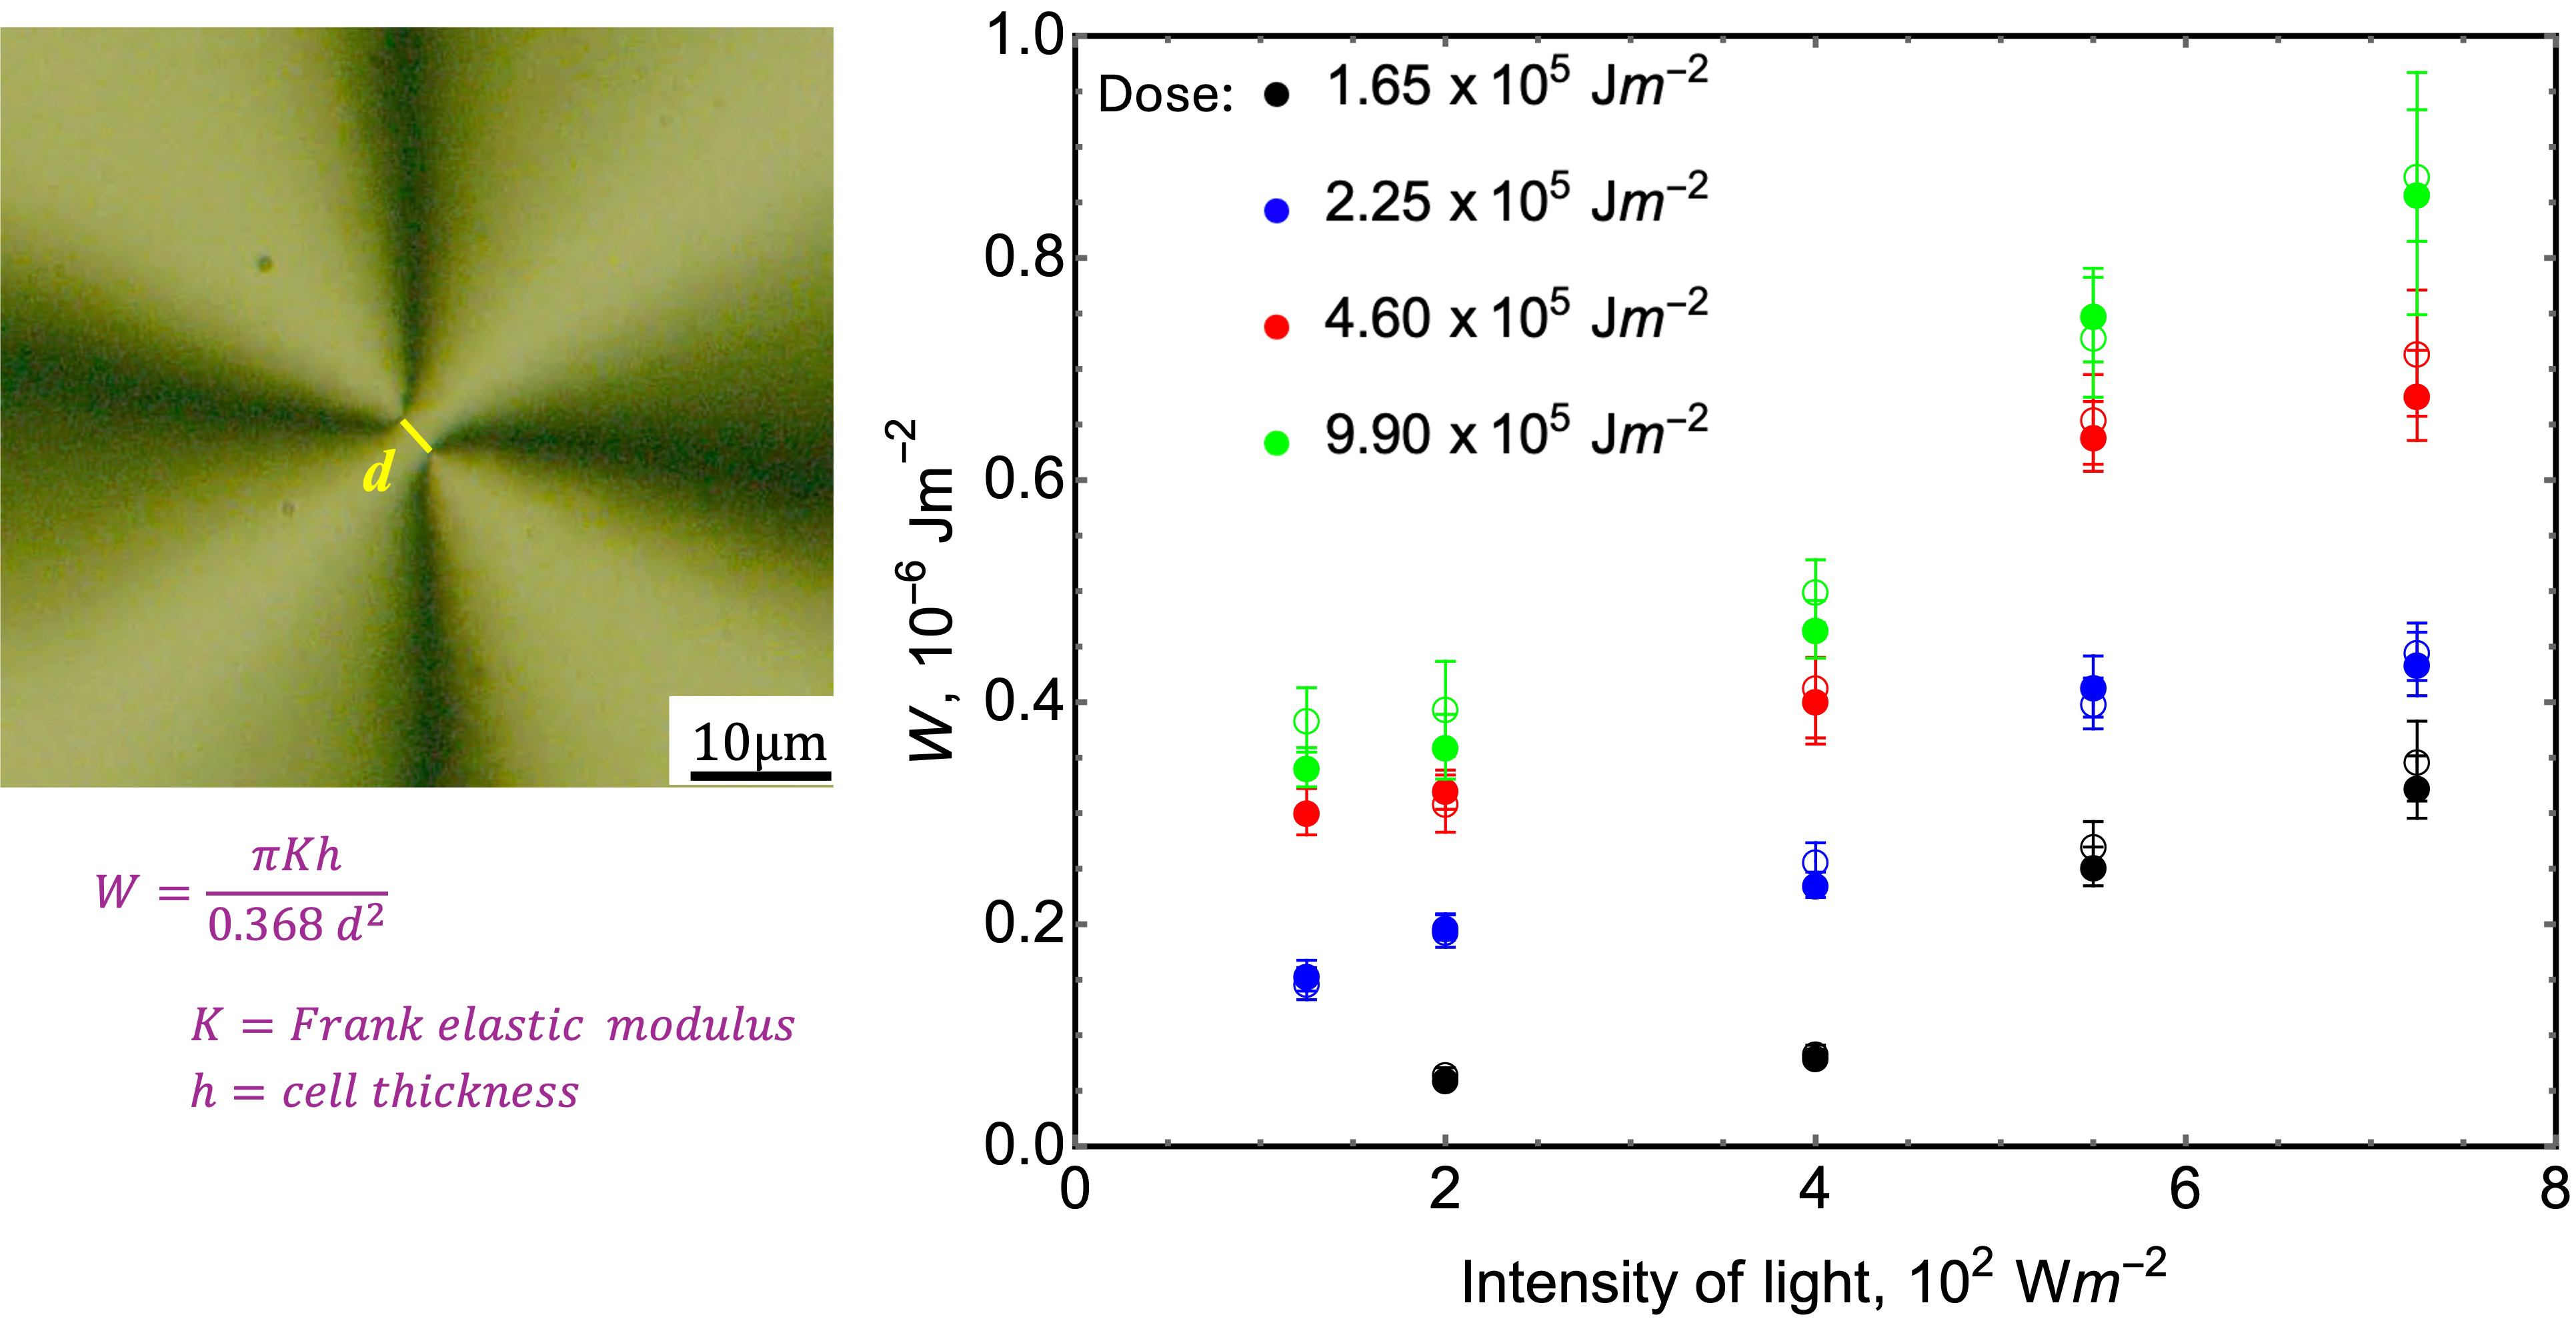
2.5. Theoretical Background

Defects of strength ±1 tend to split into pairs of ±1/2 to reduce their elastic energy [41]. In the so-called one-constant approximation, the elastic repulsive potential of two +1/2 or two −1/2 defects is weakly dependent on their separation d : F E = π K h 2 ln d 2 r c , where K is the average Frank elastic modulus, h and r c are the cell thickness and the radius of the disclination core, respectively [19,41]. In a photopatterned cell, the separation of the defects is resisted by surface anchoring that tends to enforce the patterned ±1 defects. The elasticity-anchoring balance determines the equilibrium separation distance d of the semi-integer cores. The surface anchoring energy of a patterned cell can be found by integrating the Rapini-Papoular potential, F S = 2 0 2 π 0 d 1 2 W 1 n ^ B Y · n ^ L C 2 r d r d φ which yields F S = 2 α W d 2 ; here n ^ L C is the actual director field of a split defect pair, n ^ B Y is the ideal radial pattern of the easy axis at the substrates, α 0.184 is a numerical coefficient, and the factor 2 reflects anchoring at both plates [19,27,41]. The equilibrium value of d allows one to calculate the anchoring strength as W = π K h / 8 α d 2 . For cells assembled with one photopatterned surface and the second plate providing degenerate in-plane anchoring, W = π K h / 4 α d 2 .
We calculate W by measuring d and h and using the known values of K and α , Figure 3, Figure 5, Figure 6 and Figure 7. The resolution of the optical microscope is sufficient for precise measurements, as the experiments show that the parameter d is higher than 3   μ m even for the highest achieved anchoring. The distance between neighboring photopatterned +1 and −1 defects is set to be ~ 200   μ m , which is sufficiently large to prevent any interactions between them. The experiments are designed with thin cells to ensure core splitting is the prevailing director structure as opposed to the escape in the third dimension [27,42]. Each data point for d and W represents the average value obtained from 50 defects of the same sign within the array, with the errors calculated as the standard deviation [43].

3. Results

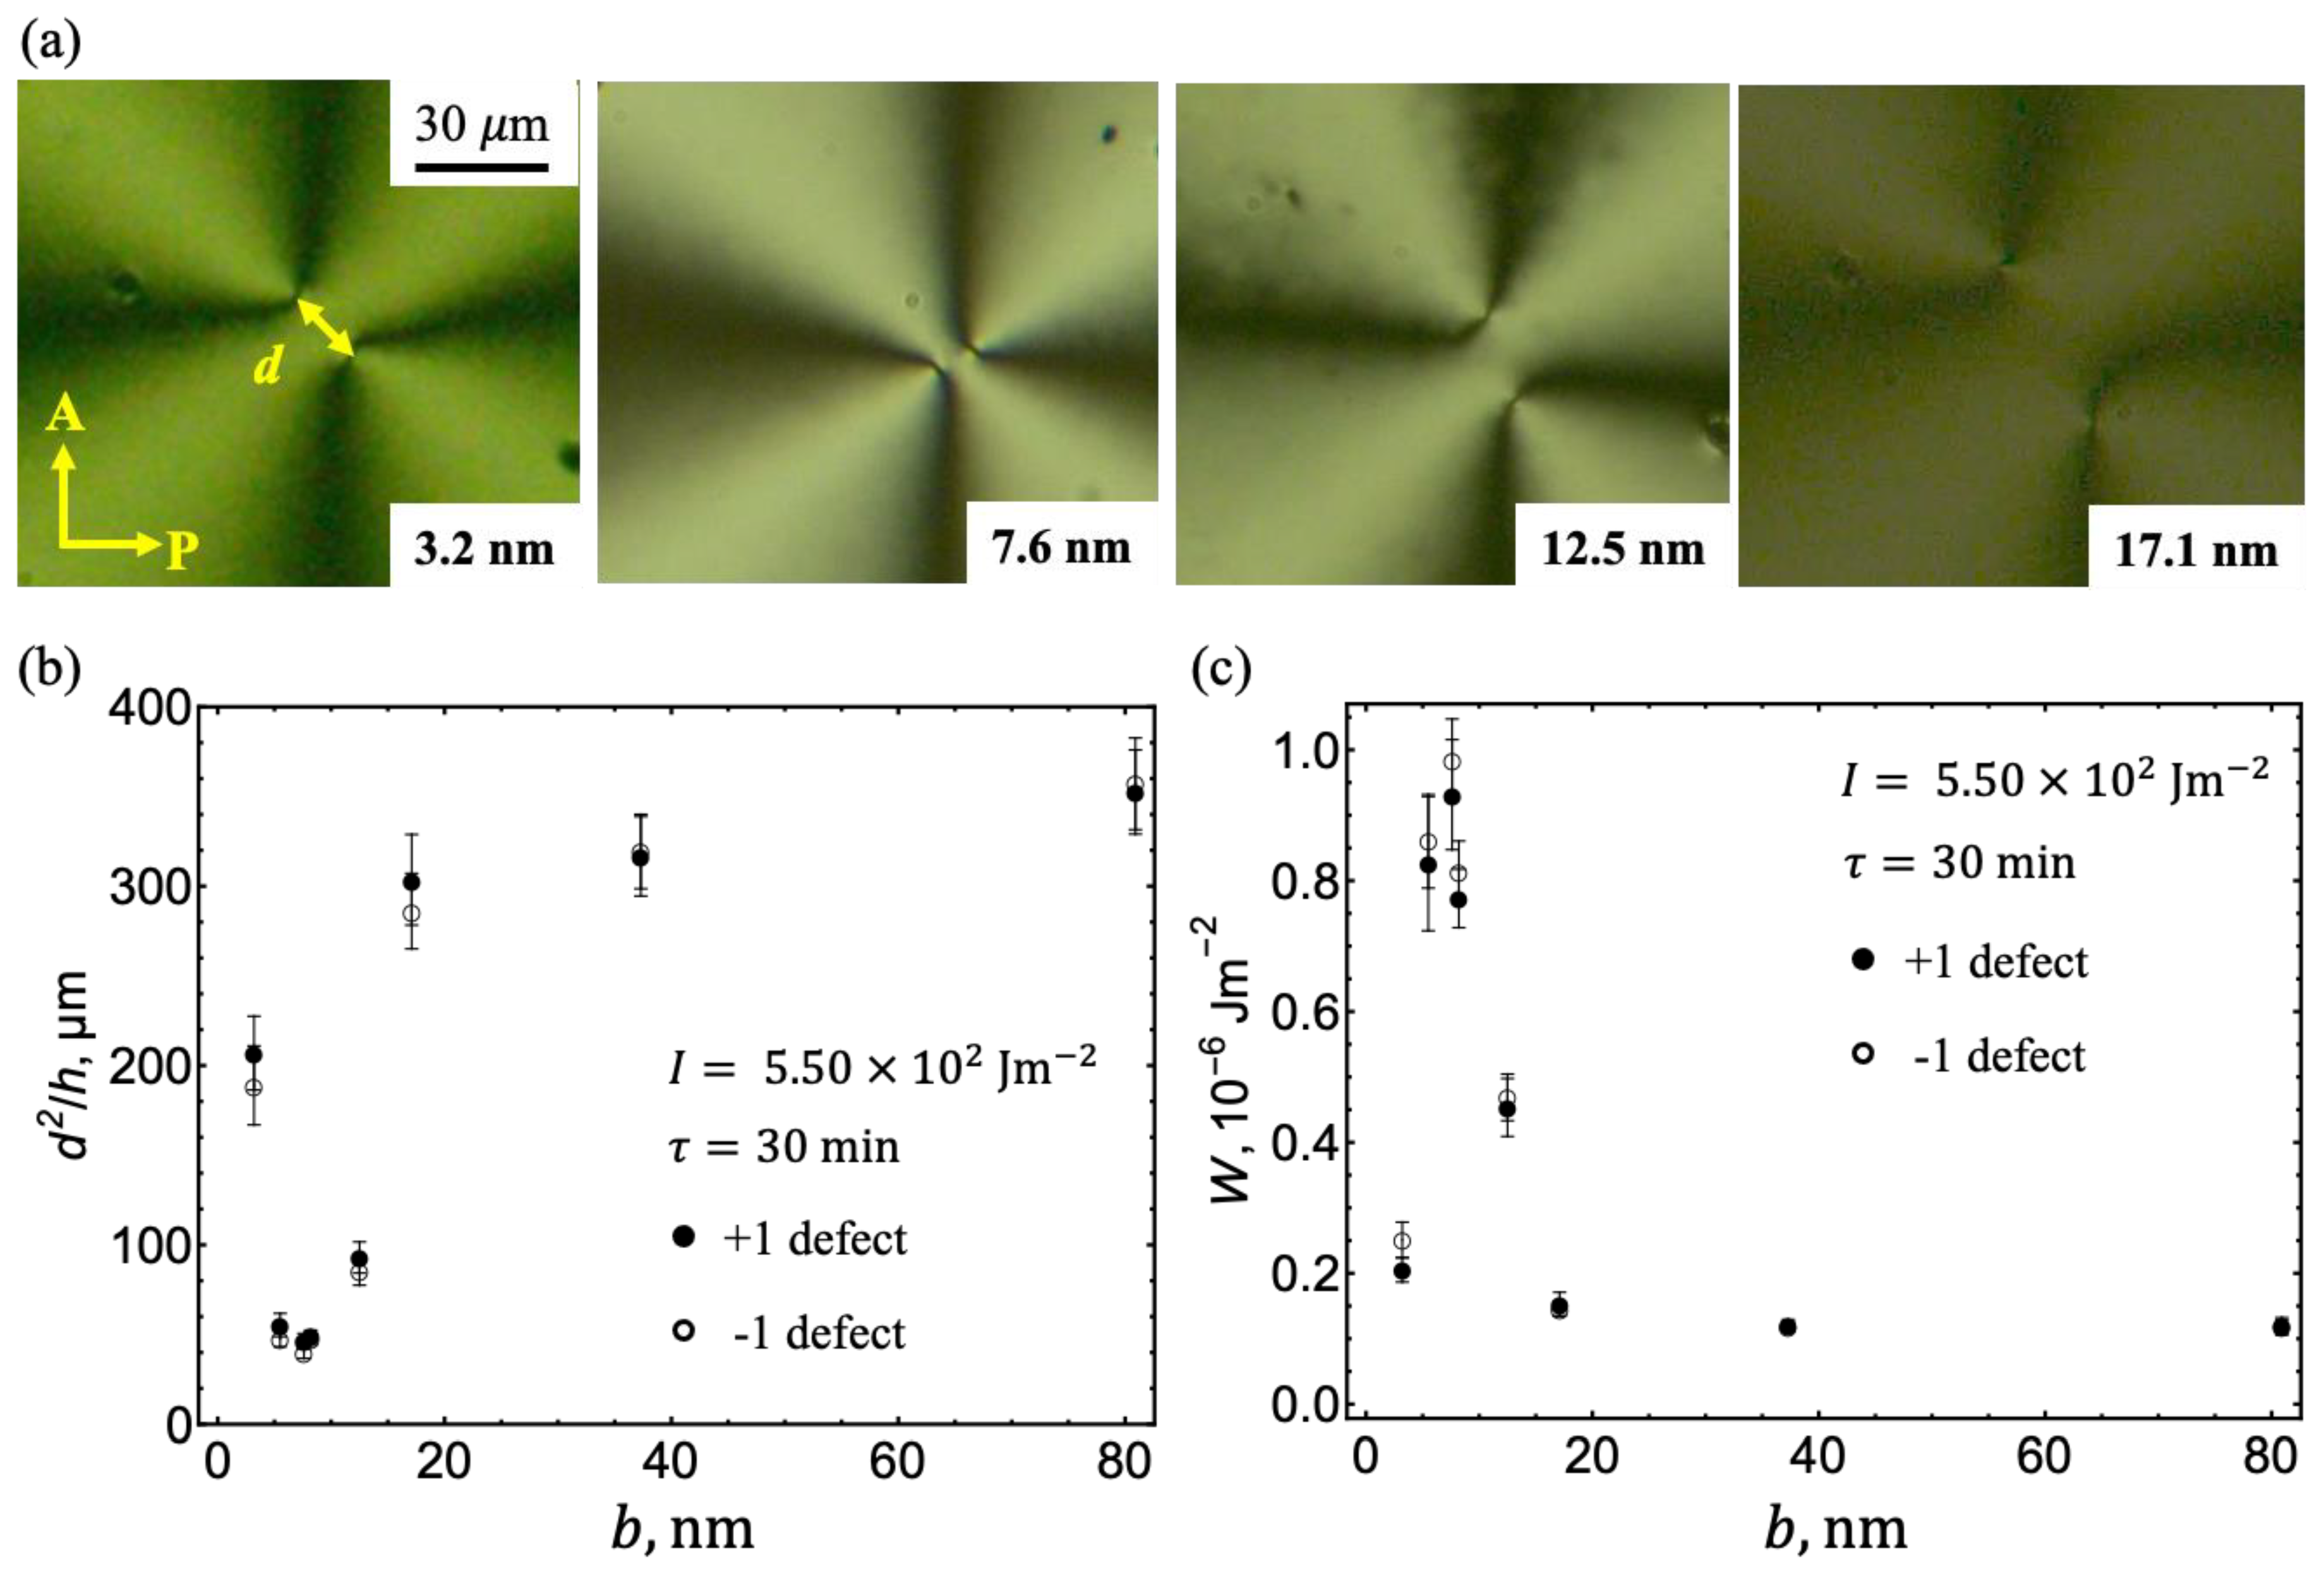
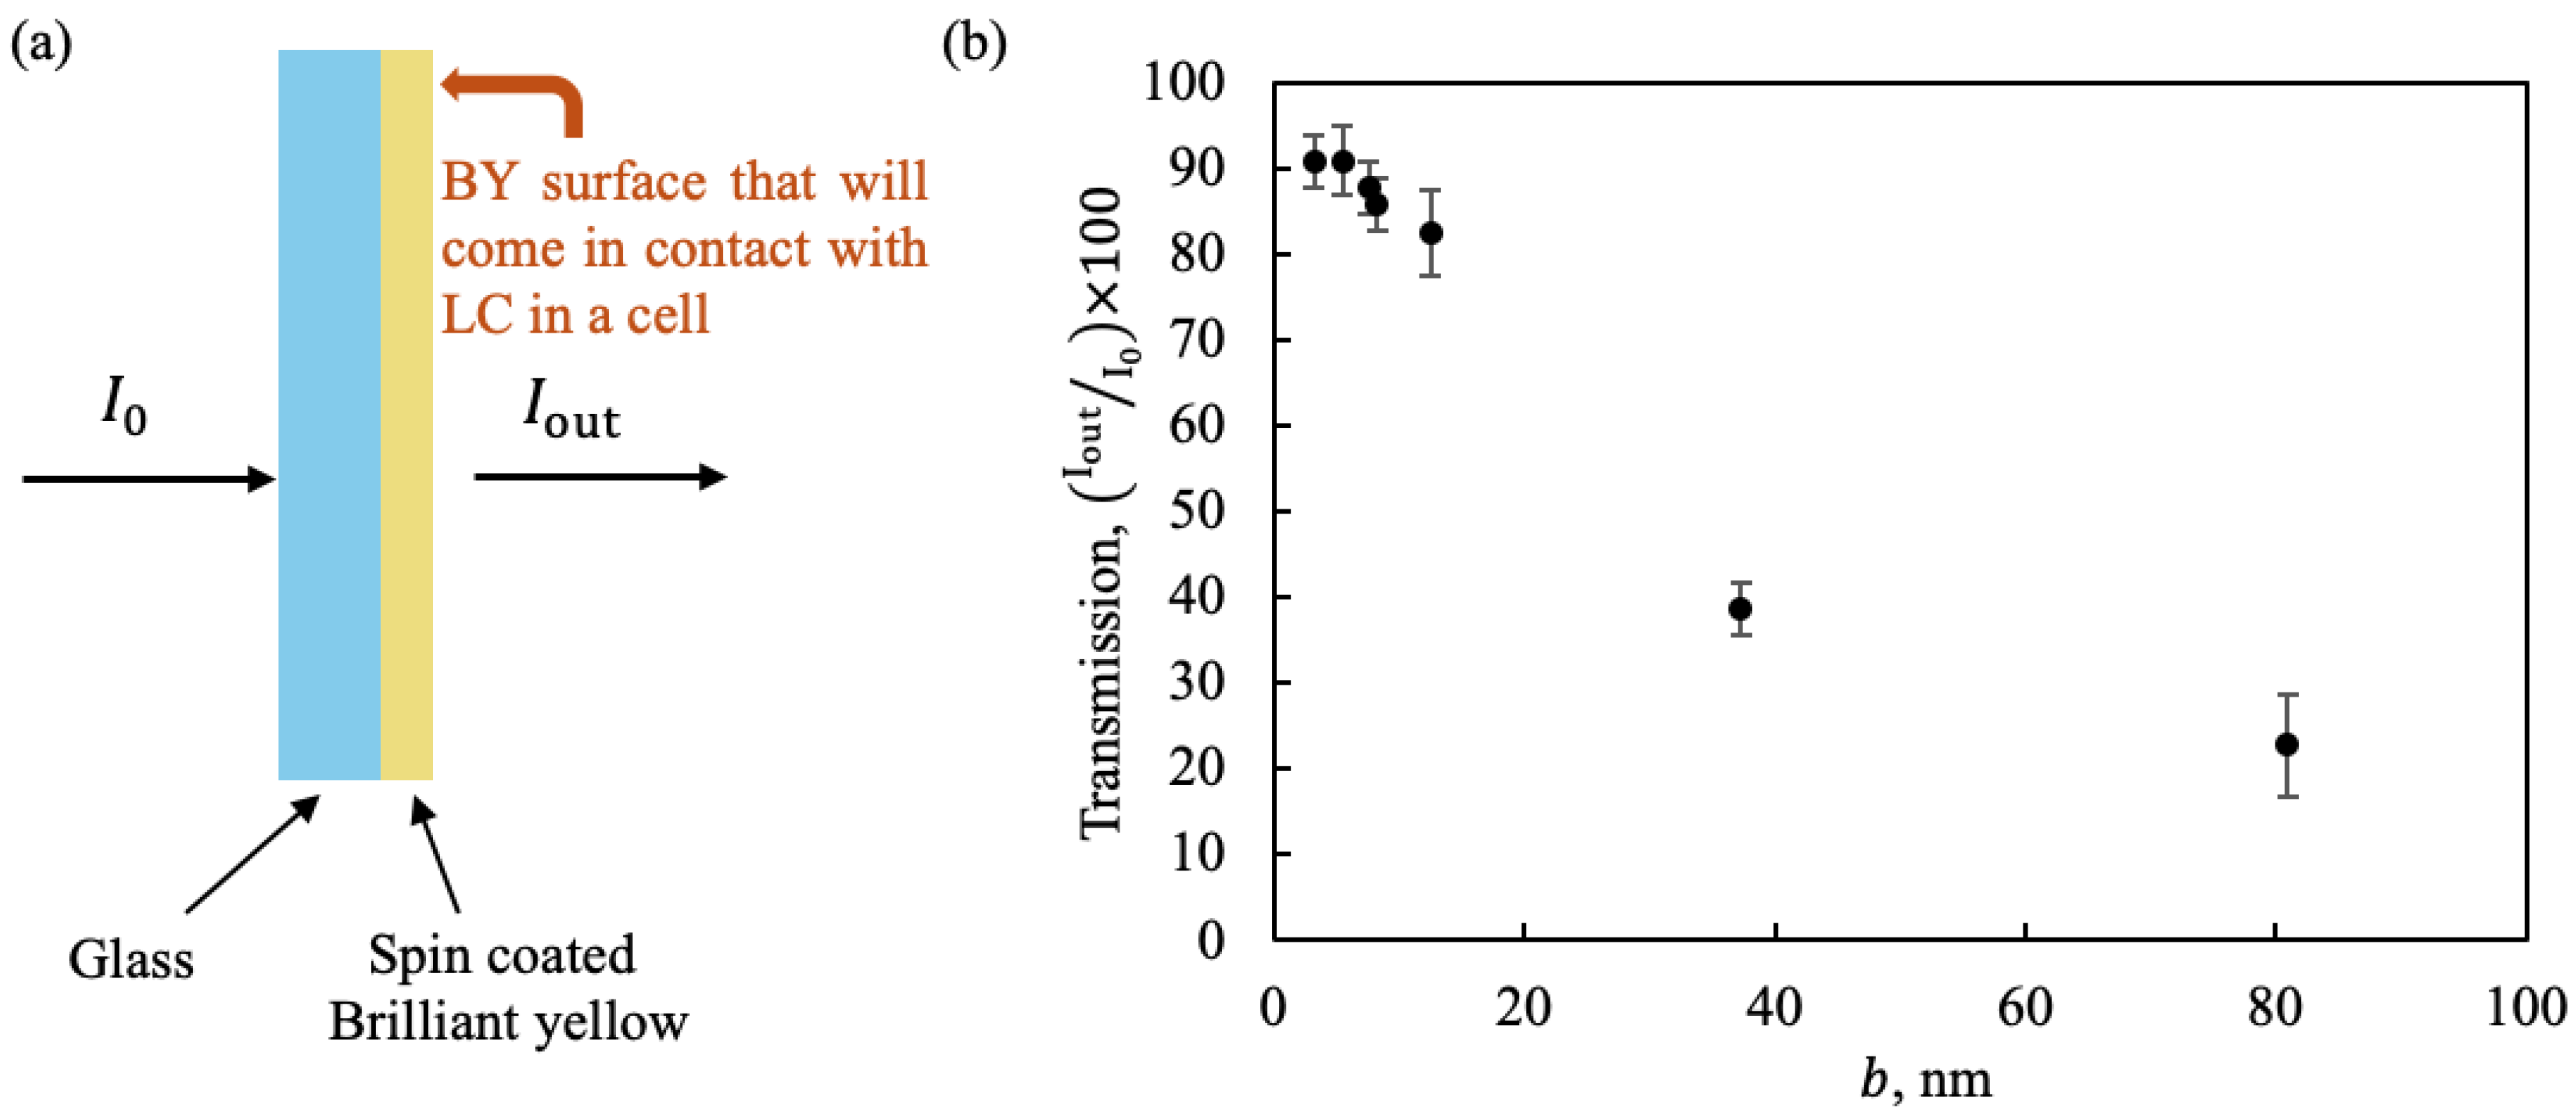
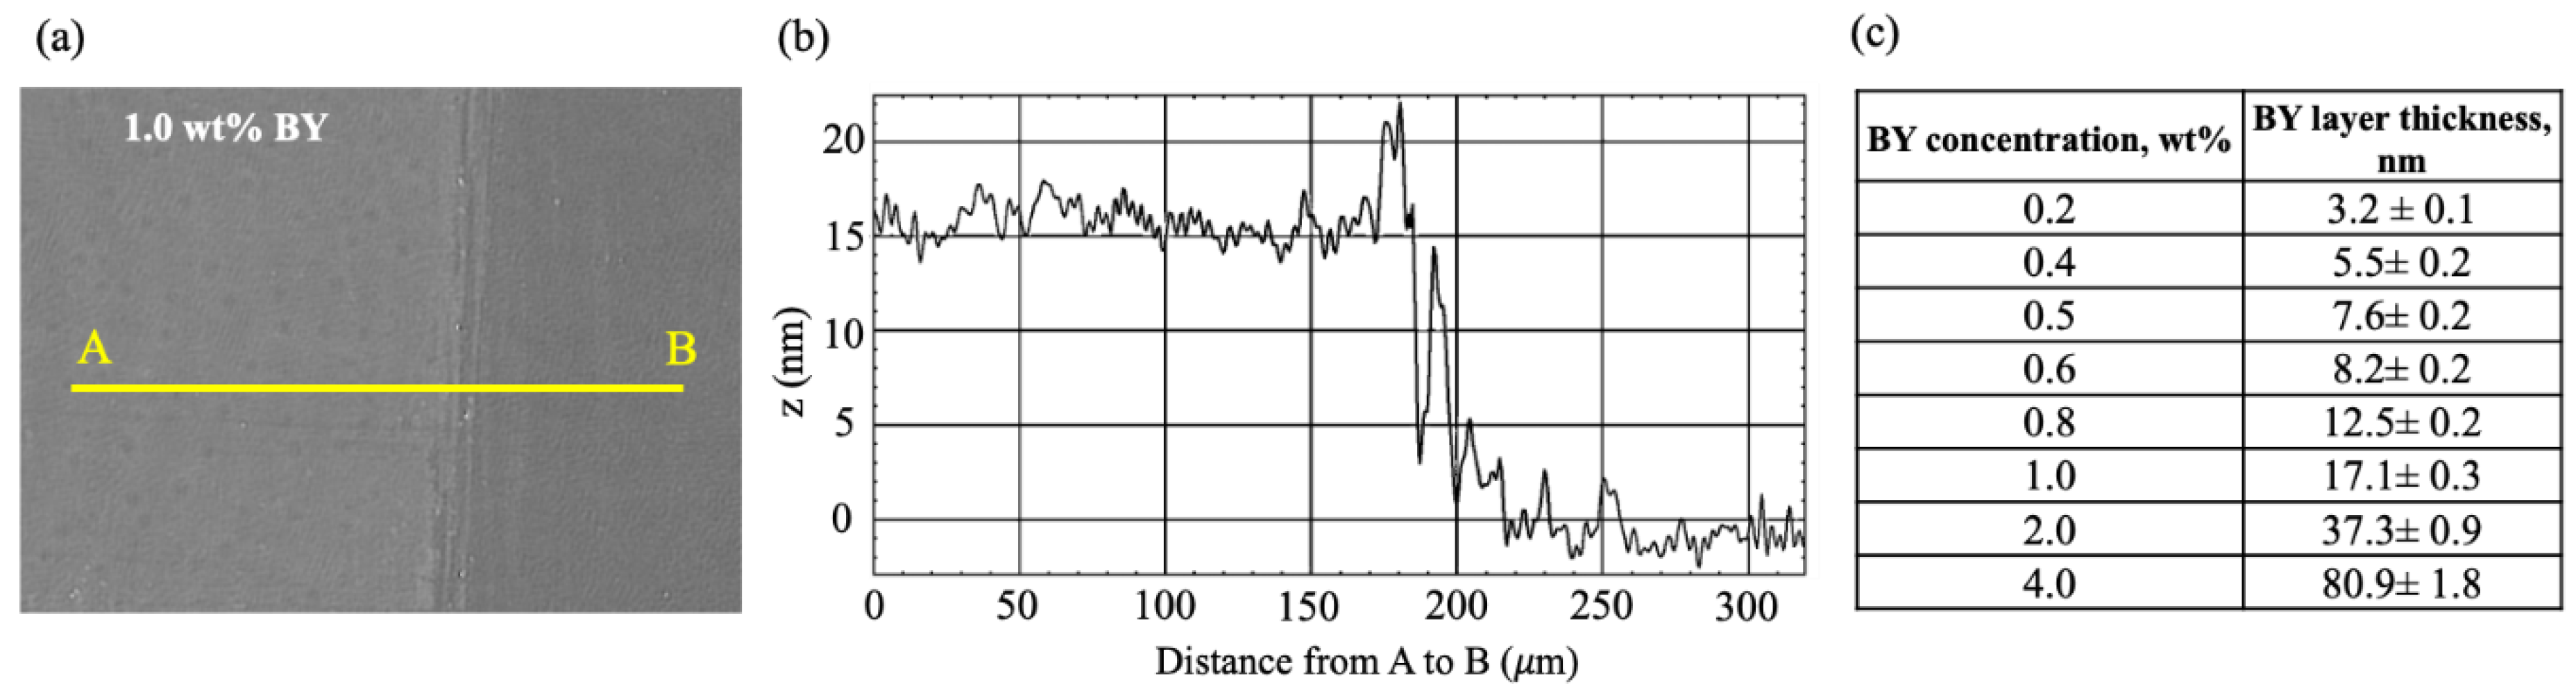
3.1. Effect of BY Layer Thickness on Photoalignment

The thickness b of BY coatings affects the anchoring strength. Therefore, BY coatings with different thicknesses are produced by spin coating solutions with different BY concentrations. The thickness b is measured using a digital holographic microscope (Lyncée Tec) with a vertical resolution < 1 nm. A portion of the BY coating is removed by wiping the substrates with water, followed by isopropanol using a cotton bud, exposing the glass surface to serve as the reference for thickness measurement, Figure 2a. After imaging the surface, the height difference between the coating and the glass substrate is measured using the open-source software package Fiji/ImageJ, Figure 2b. Thickness is measured at 10 different locations on the coated surface, and the average of these measurements is used as b . Changing the BY concentrations (0.2, 0.4, 0.5, 0.6, 0.8, 1.0, 2.0, and 4.0 wt%) in DMF results in different values of b , ranging from 3.2 - 80.9 nm, Figure 2c. The thickness b was also verified by scratching the BY coated glass with a sharp blade to create a groove; the depth b of the groove is measured by a digital holographic microscope. The b values obtained by the two methods are in good agreement with each other, being within the measurement error.
A larger b reduces the intensity of light that reaches the second plate that is further away from the source due to absorption by the BY layer on the front plate. To explore the effect, we prepare cells with one BY-coated substrate as the front plate and a polystyrene (PS) coated glass plate as the back substrate; these are called BY-PS cells throughout the text. During photoirradiation, the pattern is focused on the BY-coated front plate. PS coated plates yield a negligibly weak azimuthal anchoring, W P S ~ 10 10   J / m 2 W [44]. Thus, it is the patterned substrate that dictates the director orientation and the separation distance between the defects. The anchoring coefficient for these BY-PS cells is calculated as W = π K h / 4 α d 2 . The PS coated plates are prepared by spin-coating (3000 rpm, 30 s) a solution of 0.5 wt% PS in chloroform (Sigma-Aldrich, >98%) on clean glass substrates. The plates are kept at 80 °C for 30 min to evaporate the solvent. All cell preparation steps and observations are done on the same day. The cells are photopatterned with I =   5.50 × 10 2   W m 2 for 30 min.
The anchoring coefficient is measured for BY-PS cells with different b , Figure 3a–c. For a thin BY layer of 3.2 nm, W is weak ~ 0.2 × 10 6   J m 2 , Figure 3c. Anchoring increases sharply with b and reaches a maximum of 0.98 × 10 6   J m 2 for b ranging from 5.5 nm to 8.2 nm, Figure 3c. For layers with b =   12.5 37.3 nm, W sharply decreases to around 10 7   J m 2 and remains constant for thicker BY layers, Figure 3c.
Figure 3. Effect of Brilliant Yellow coating thickness on photoalignment in BY-PS cells. (a) Optical microscopy textures of photopatterned cells with different BY layer thicknesses, b . h = 2.2 ± 0.2   μ m . Cells are photopatterned with I = 5.50 × 10 2   W m 2 and a dose of 9.90 × 10 5   J m 2 , corresponding to an irradiation time τ = 30   m i n . Cell preparation and observation steps are performed on the same day. (b) d 2 h , and (c) W , as functions of b . Each data point represents the average value obtained from 50 defects of the same sign within the array, with the errors calculated as the standard deviation.
Preprints 140339 g003
The weaker W at thick BY layers is attributed to weaker light intensity received by BY molecules at the interface with the LC, due to absorption by BY along the light path. The transmittance of BY layers with different thicknesses is measured using a UV/VIS spectrometer Lambda 18 (Perkin Elmer). The data show 90% of incident light is transmitted by the BY layers when b 6   n m , but the transmission is reduced to 22% for b = 80.9   n m , Figure 4b. As a result, the light intensity received by BY molecules on the surface that will meet the LC is substantially reduced, Figure 4a,b. As shown in the next section, a lower intensity results in a weaker W . Since BY layers with thicknesses less than 8 nm transmit over 85% of the incident light, and the thickness of 5- 8 nm results in stronger azimuthal anchoring, a 7.6 nm thick BY coating layer (spin coated with a 0.5 wt% BY solution) is used for the rest of experiments, presented in Figure 5, Figure 6 and Figure 7. For a BY-BY cell, each with a 7.6 nm thick BY layer, the substrate that is further from the light source receives 87% of the incident light intensity during photoalignment. In such a cell, both BY surfaces that will later meet the LC are aligned with the same light intensity, 87% of the incident light. As shown in Figure 3c, this intensity is sufficient to achieve the strongest anchoring. Therefore, all subsequent experiments are performed using BY-BY cells assembled with two BY coated glass substrates.
Figure 4. Transmittance measurements of different Brilliant Yellow layer thicknesses. (a) Schematic illustration of BY-coated glass. Here, I 0 is the incident light intensity and I o u t is the intensity of light transmitted through BY layer. (b) Transmission as a function of BY coating thickness.
Preprints 140339 g004

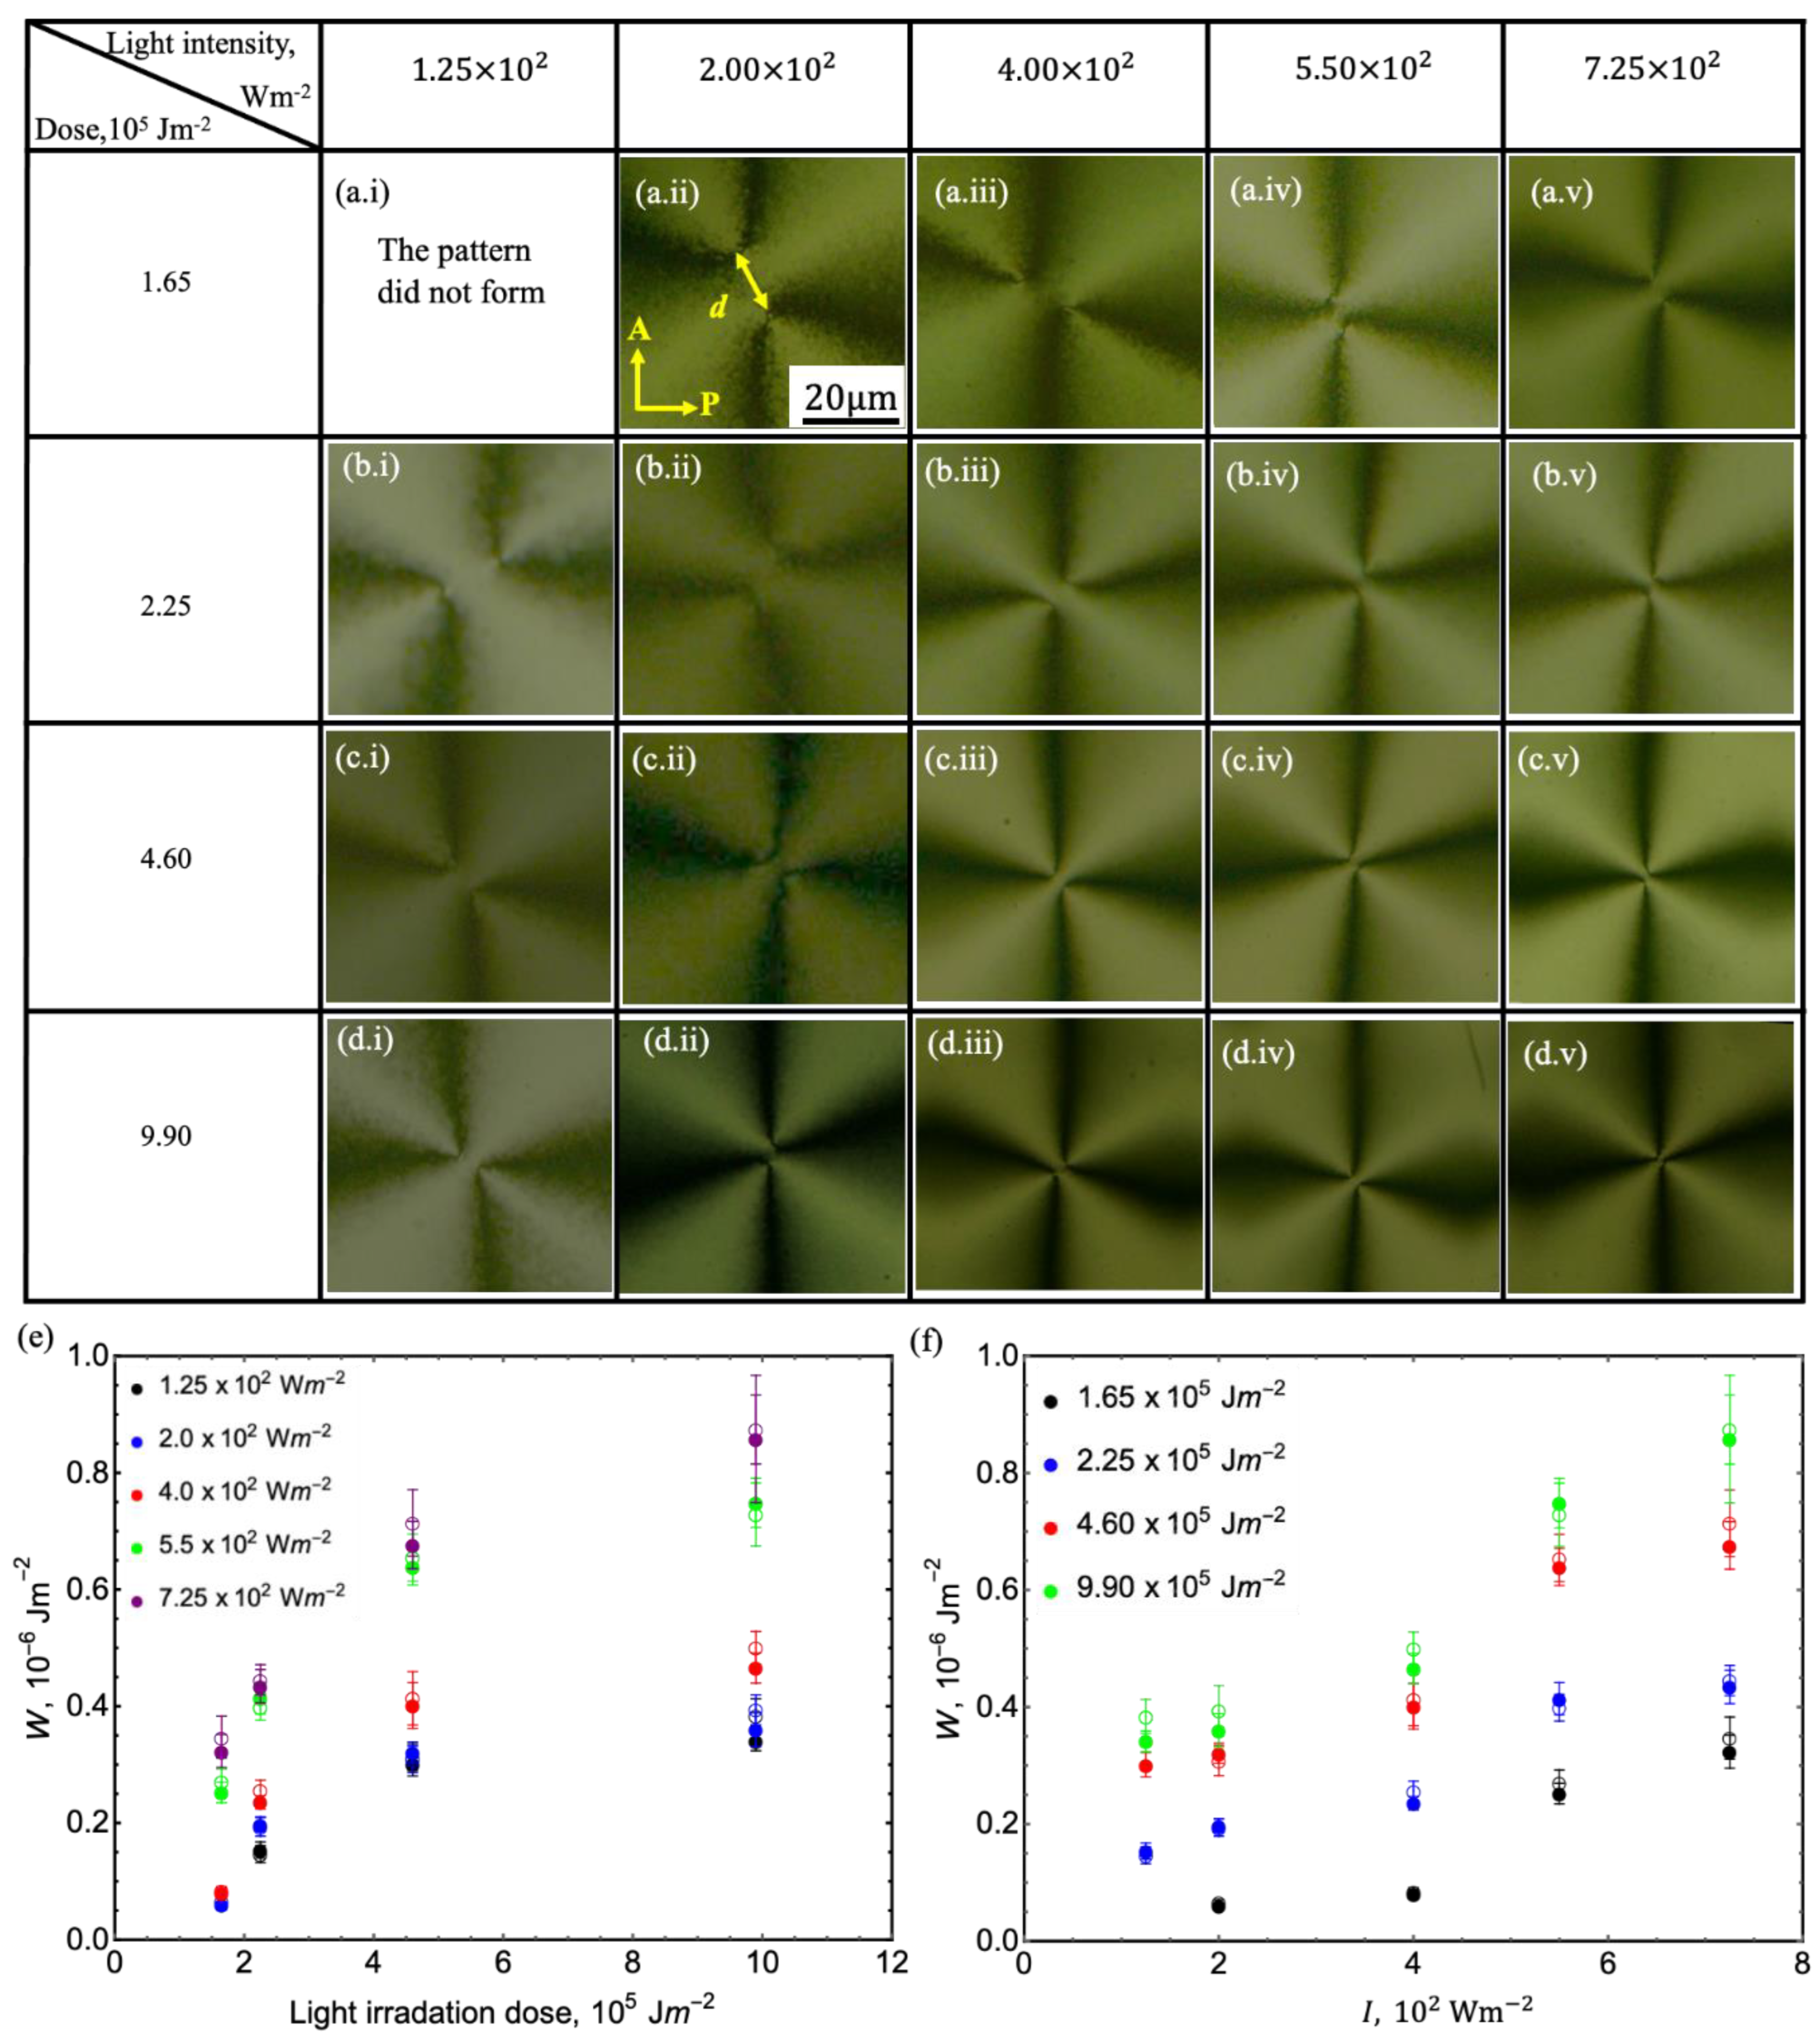
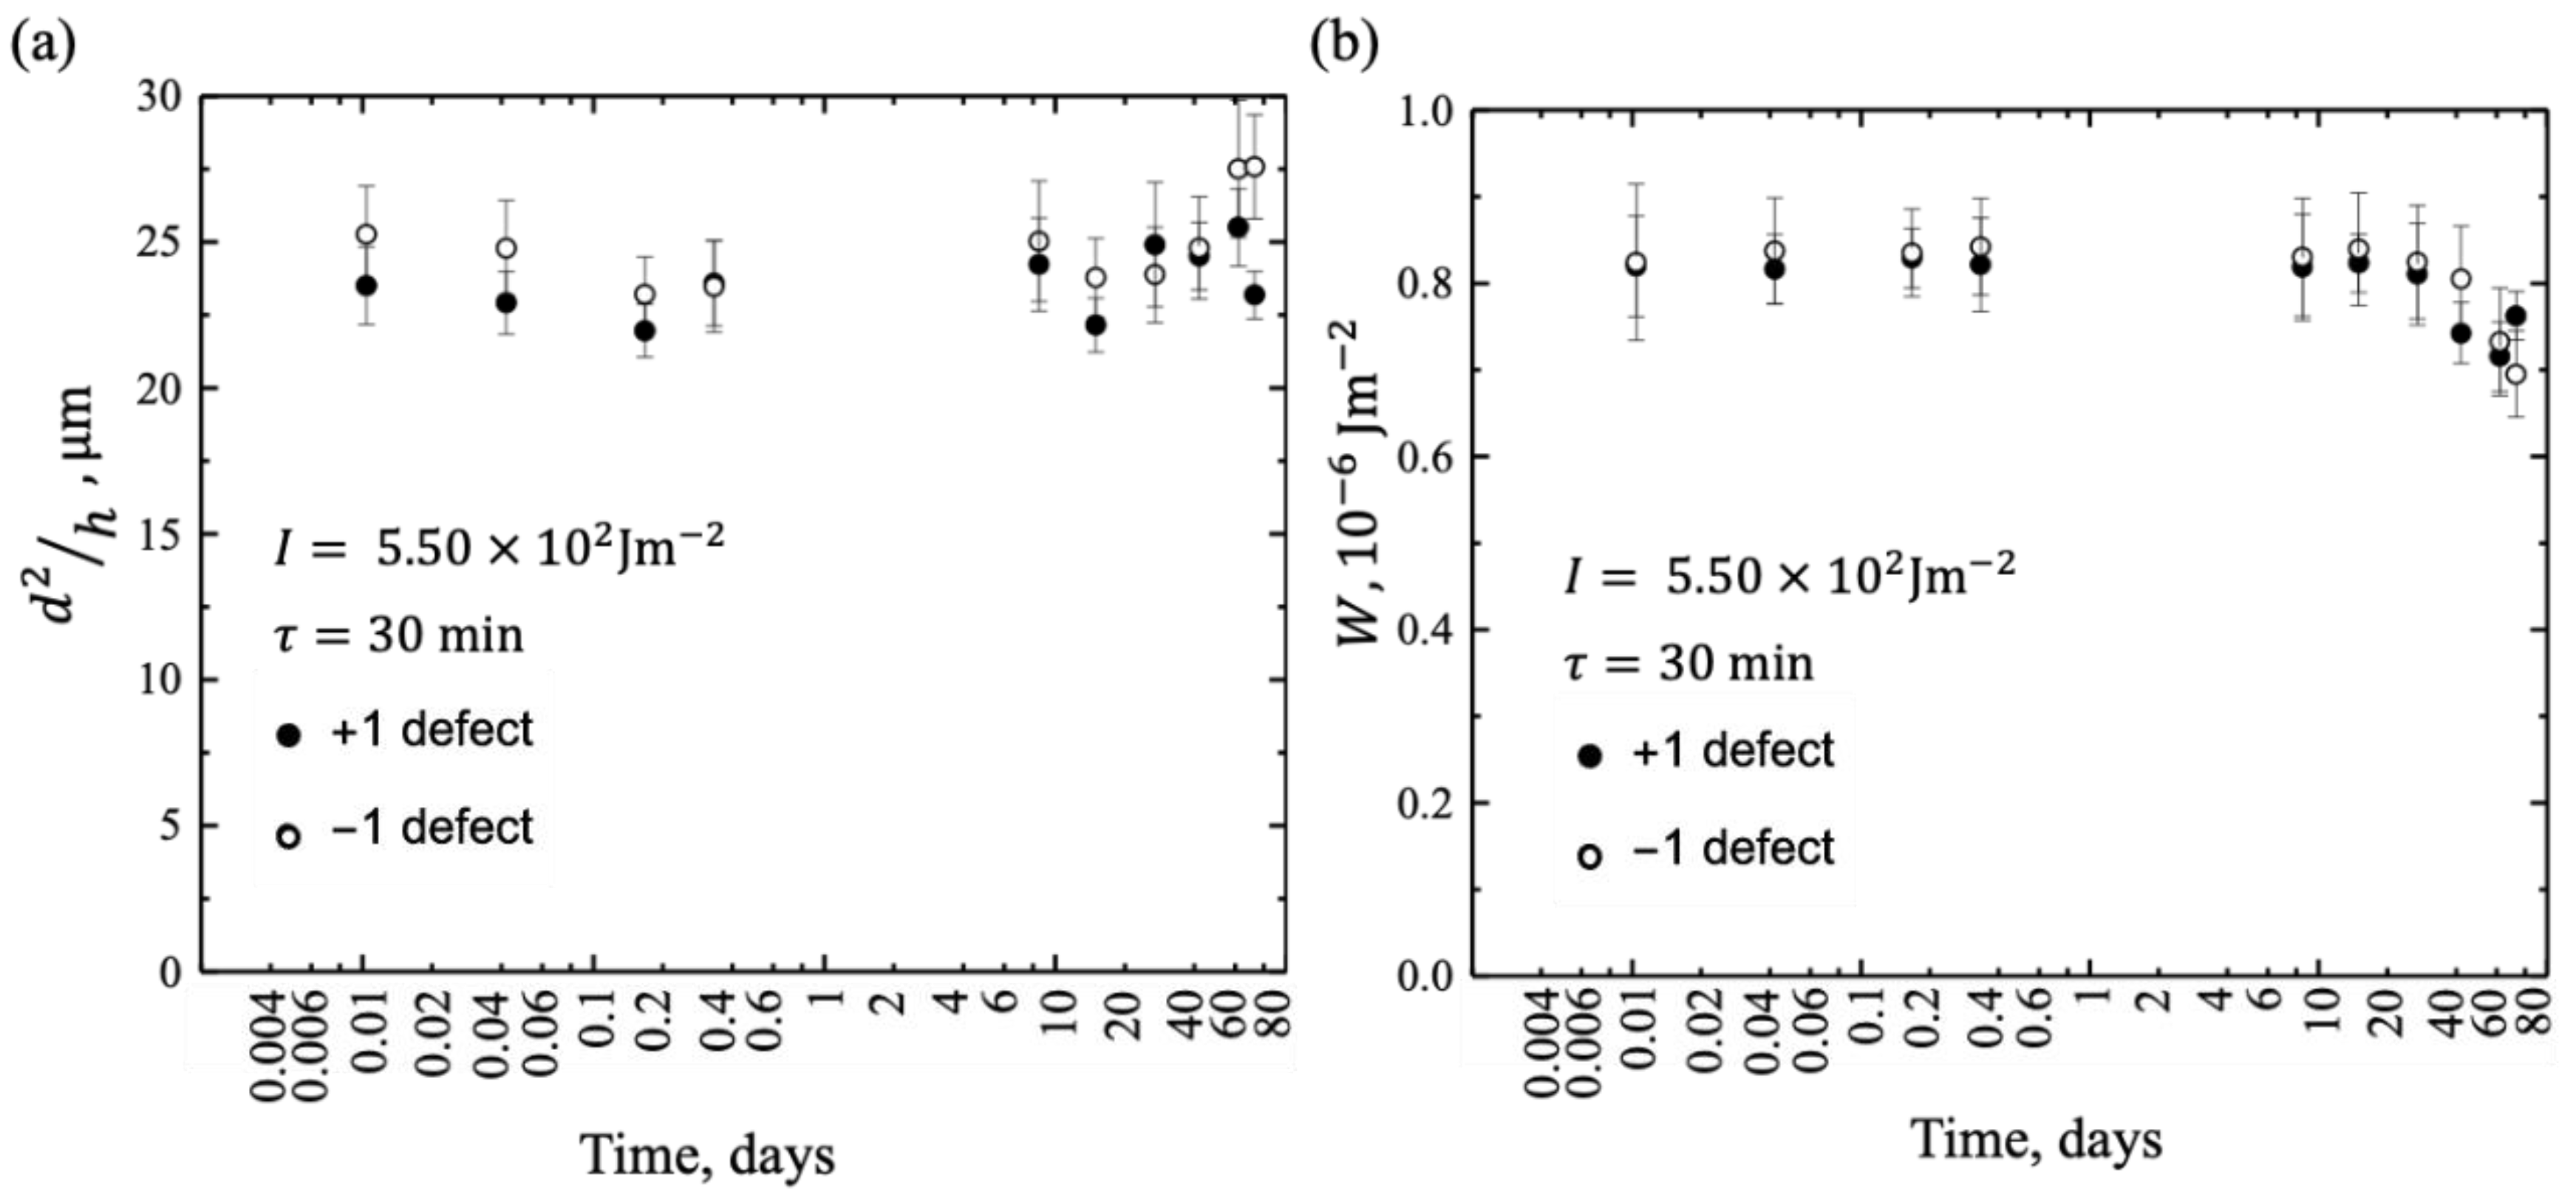
3.1. Effect of Light Dose and Intensity on Photoalignment

The BY-BY cells are photopatterned with four different light irradiation doses. The dose is defined as a product of irradiation time ( τ ) and the light intensity I . τ is changed to vary the dose while I is kept constant. When studying the effect of I , the dose is kept constant by varying τ . The cell preparation and characterization are completed within a maximum of two consecutive days to minimize the effects of aging.
Increasing the dose from 1.65 × 10 5   J m 2 to 9.90 × 10 5   J m 2 results in an increase of W , Figure 5a–d columns and Figure 5e; W saturates at doses higher than 4.6 × 10 5   J m 2 . This behavior is consistent with the previous study on the effect of photopatterning time on W [27].
Increasing I from 1.25 × 10 2   W m 2 to 7.25 × 10 2   W m 2 at a fixed dose increases W and creates better alignment, Figure 5i–v rows and Figure 5f. It is notable that although dose and I are interrelated, both must be set properly to achieve a high quality patterning. For instance, photopatterning with a high dose of 9.90 × 10 5   J m 2 and a low I of 1.25 × 10 2   W m 2 results in a poor alignment (Figure 5d.i), and a weak W = 0.36 ± 0.02 × 10 6   J m 2 , Figure 5e,f. However, a moderate dose of 2.25 × 10 5   J m 2 at I   > 5.50 × 10 2   W m 2 results in a better alignment with W 0.4 × 10 6   J m 2 . Using W values, one can establish criteria for setting irradiation conditions to achieve a good alignment. The results also show that W can be tuned by adjusting the dose and I . At a constant dose, photopatterning with high I for a short τ is more efficient than low intensity irradiation over a prolonged τ (compare columns i and v in Figure 5),Figure 5f.
Figure 5. Effect of dose and light intensity on photoalignment in BY-BY cells. (a-d) Optical microscopy textures of photopatterned cells at different irradiation doses and light intensities. The images show a pair of +1/2 defects split from a photopatterned +1 defect. h = 1.3 ± 0.3   μ m and b = 7.6   n m . Cell preparation and characterization are performed within two consecutive days. (e) Azimuthal surface anchoring coefficient, W , as a function of dose for various light intensities. (f)  W as a function of I for different doses. Colors indicate different intensities and doses in (d) and (f), respectively. Filled circles represent +1 defects, and open circles represent −1 defects. Each data point for W represents the average value obtained from 50 defects in the array, with the errors calculated as the standard deviation.
Preprints 140339 g005

3.1. Effect of Aging of Non-Irradiated BY Coatings

The glass substrates, which were spin-coated with BY and then baked, are stored in a Humidity and Temperature-Controlled Cabinet (SIRUI HC series) for up to 310 days at relative humidity (RH) 25-35%, and 23 ° C. Then BY-BY cells are assembled using two aged, non-irradiated BY-coated plates. After a predetermined aging time, the BY coatings are photopatterned with an I of 5.50 × 10 2   W m 2 for 30 min. The cells are filled with the nematic material, sealed and analyzed under the optical microscope
Aging of the non-irradiated BY layer impacts photopatterning in two phases. For BY layers irradiated within 15 days after the layers were spin-coated, dried and baked, W remains constant at ~ 0.88 ± 0.01 × 10 6   J m 2 , Figure 6. This suggests that BY coated substrates can be safely stored at controlled humidity conditions (at RH 25-35%) for around two weeks without a noticeable effect on their photopatterning quality. However, for older BY layers, W decreases continuously with age and reduces to 0.08 × 10 6   J m 2 for substrates photopatterned 310 days after preparation, Figure 6. A possible reason could be the water absorption by the BY layers during storage as the substrates are kept at RH 20-35%, weakening the bonds between the BY molecules and the glass surface.
Figure 6. Effect of non-irradiated BY coated layer aging on photoalignment in BY-BY cells. (a) d 2 h , and (b) W , as a function of non-irradiated BY layer aging time. Each data point represents the average value obtained from 50, +1 and 50, -1 defects within the array, with the errors calculated as the standard deviation. h = 1.1 ± 0.2 μm and b = 7.6   n m . Cell assembly, photopatterning, and characterization are performed on the same day. Cells are photopatterned with I = 5.50 × 10 2   W m 2 and dose of 9.90 × 10 5   J m 2 .
Preprints 140339 g006

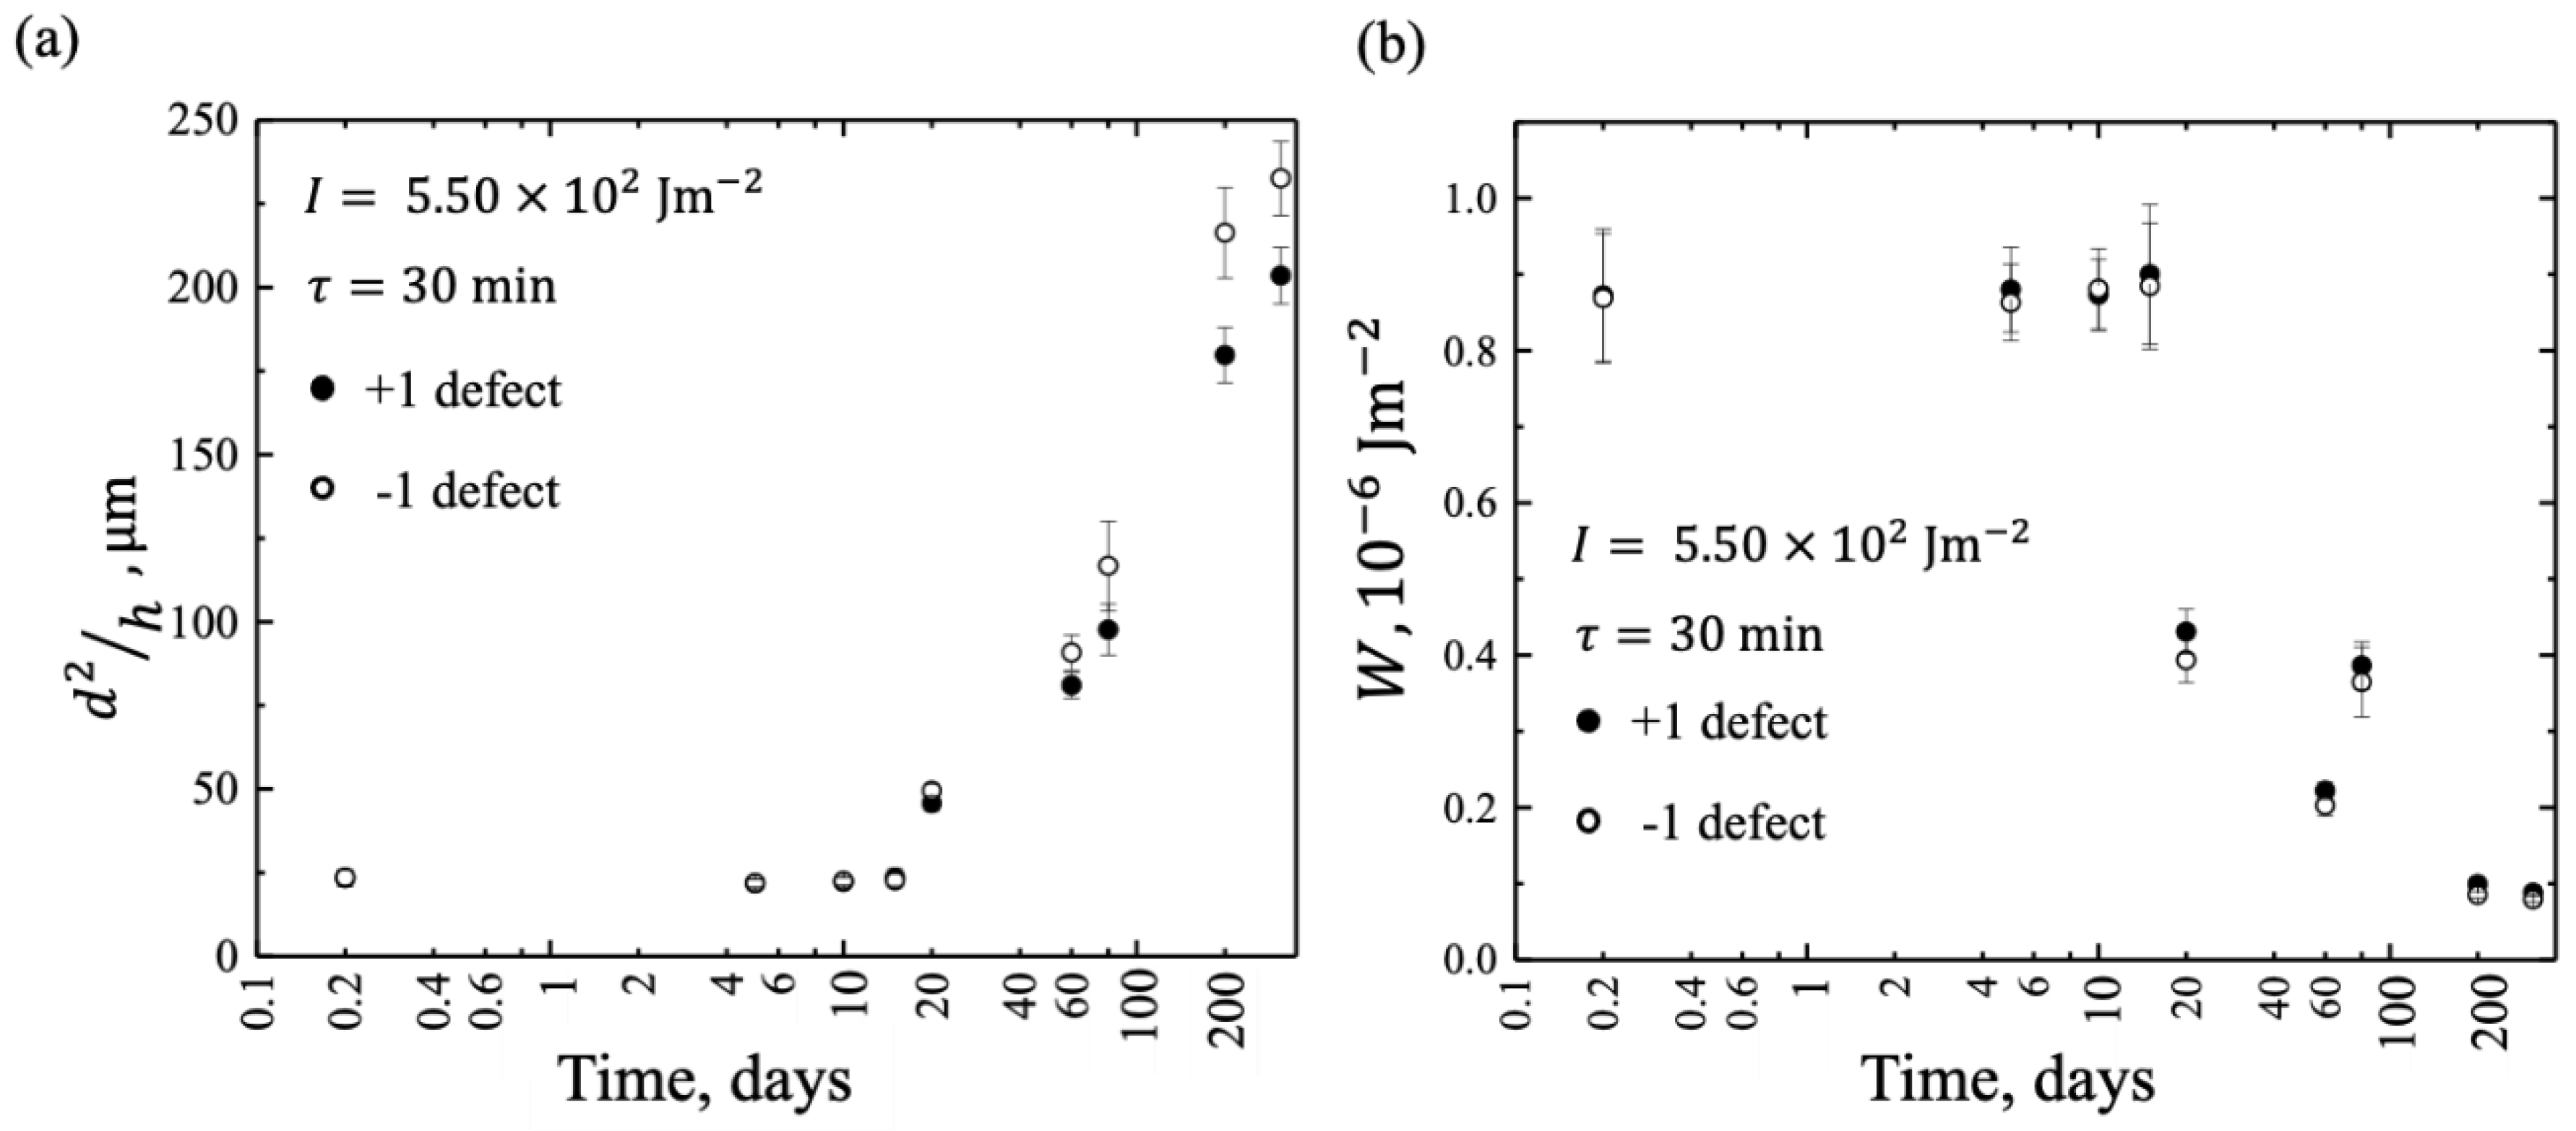
3.1. Surface Patterning Stability of Aged LC-Filled Cells

A photopatterned BY-BY cell is filled with CCN-47, and the edges of the cell are sealed with epoxy glue after the filling. Photopatterning is performed with I = 5.50 × 10 2   W m 2 for 30 min. The LC-filled BY-BY cell is maintained in an environment with RH <50% at 45 ° C for 72 days. While maintaining the temperature at 45 °C to stabilize the nematic phase, optical textures of the cell are recorded over time as the cell ages.
The distance d remains at around 10.4 ± 0.3   μ m for 26 days, corresponding to W = 0.82 ± 0.01 × 10 6   J m 2 , Figure 7a,b. Maintaining the cell for a longer period (around 72 days) results in a slight decrease in W to 0.76 × 10 6   J m 2 , Figure 7b. This result suggests that filling the photopatterned cell with LC and sealing it helps to preserve the quality of photopatterning. The observed decline could be due to the gradual dissolution of LC into the BY coating [45,46] or the dissolving of epoxy glue into the LC over time [47]
Figure 7. Surface patterning stability of aged LC-filled BY-BY cells. (a) d 2 / h , and (b) W , as functions of the age of the LC filled cell. Each data point represents the average value obtained from 50 defects of the same sign within the array, with the errors calculated as the standard deviation. h = 1.5 ± 0.02 μm and b = 7.6   n m . The cell is photopatterned with I = 5.50 × 10 2   W m 2 and a dose of 9.90 × 10 5   J m 2 . Cell preparation steps are performed on the same day and observation is done as the cell ages.
Preprints 140339 g007

5. Conclusions

We have demonstrated how various photopatterning conditions, including the thickness b of the azobenzene alignment layers the intensity I of light used for photopatterning, the irradiation dose, and substrate aging, affect the anchoring strength of a photopatterned nematic LC. Our results show that BY layers of thickness b = 5 - 8 nm produce the strongest anchoring coefficient W . Moreover, W increases with both irradiation dose and I . Also, aging of non-irradiated substrates beyond 15 days significantly reduces W . However, if the cell is filled with a LC immediately after photopatterning of the azo-dye layer, W remains constant for up to 4 weeks. This work provides practical strategies for enhancing the azimuthal strength of the photopatterned anchoring of nematics. The results offer guidelines for optimizing BY photoalignment parameters and storage.

Author Contributions

N.P.H. did the experiments, analyzed and discussed the data, and contributed to the writing, M.R. discussed the data and contributed to the writing, O.D.L. contributed to the writing and directed the research. All authors have read and agreed to the published version of the manuscript.

Funding

The work is supported by NSF grant DMR-2215191.

Data Availability Statement

The datasets generated during and/or analyzed during the current study are available from the corresponding author upon reasonable request.

Conflicts of Interest

The authors declare no conflict of interest.

References

  1. Cognard, J. Alignment of nematic liquid crystals and their mixtures. Mol. Cryst. Liq. Cryst. 1982, 78, 1. [Google Scholar]
  2. Babakhanova, G.; Lavrentovich, O.D. The techniques of surface alignment of liquid crystals. In Proceedings of the Modern Problems of the Physics of Liquid Systems: Selected Reviews from the 8th International Conference “Physics of Liquid Matter: Modern Problems”, Kyiv, Ukraine, May 18-22, 2018 8, 2019; pp. 165-197.
  3. Muravsky, A.; Murauski, A. Q&A of liquid crystal alignment: theory and practice. Frontiers in Soft Matter 2024, 4, 1382925. [Google Scholar]
  4. Huang, Y.H.; Ko, S.W.; Li, M.S.; Chu, S.C.; Fuh, A.Y.G. Modulation of shape and polarization of beam using a liquid crystal q-plate that is fabricated via photo-alignment. Optics Express 2013, 21, 10954–10961. [Google Scholar] [CrossRef] [PubMed]
  5. Jiang, M.; Guo, Y.; Yu, H.; Zhou, Z.; Turiv, T.; Lavrentovich, O.D.; Wei, Q.H. Low f-Number Diffraction-Limited Pancharatnam–Berry Microlenses Enabled by Plasmonic Photopatterning of Liquid Crystal Polymers. Advanced Materials 2019, 31, 1808028. [Google Scholar] [CrossRef]
  6. Tang, D.; Shao, Z.; Zhou, Y.; Lei, Y.; Chen, L.; Xie, J.; Zhang, X.; Xie, X.; Fan, F.; Liao, L. Simultaneous surface display and holography enabled by flat liquid crystal elements. Laser & Photonics Reviews 2022, 16, 2100491. [Google Scholar]
  7. Jiang, M.; Yu, H.; Feng, X.; Guo, Y.; Chaganava, I.; Turiv, T.; Lavrentovich, O.D.; Wei, Q.H. Liquid crystal Pancharatnam–Berry micro-optical elements for laser beam shaping. Advanced Optical Materials 2018, 6, 1800961. [Google Scholar] [CrossRef]
  8. Chen, P.; Wei, B.Y.; Hu, W.; Lu, Y.Q. Liquid-crystal-mediated geometric phase: from transmissive to broadband reflective planar optics. Advanced Materials 2020, 32, 1903665. [Google Scholar] [CrossRef]
  9. Ware, T.H.; McConney, M.E.; Wie, J.J.; Tondiglia, V.P.; White, T.J. Voxelated liquid crystal elastomers. Science 2015, 347, 982–984. [Google Scholar] [CrossRef]
  10. Mostajeran, C.; Warner, M.; Ware, T.H.; White, T.J. Encoding Gaussian curvature in glassy and elastomeric liquid crystal solids. Proceedings of the Royal Society A: Mathematical, Physical and Engineering Sciences 2016, 472, 20160112. [Google Scholar] [CrossRef]
  11. Babakhanova, G.; Turiv, T.; Guo, Y.; Hendrikx, M.; Wei, Q.H.; Schenning, A.P.; Broer, D.J.; Lavrentovich, O.D. Liquid crystal elastomer coatings with programmed response of surface profile. Nature communications 2018, 9, 456. [Google Scholar] [CrossRef]
  12. McConney, M.E.; Martinez, A.; Tondiglia, V.P.; Lee, K.M.; Langley, D.; Smalyukh, I.I.; White, T.J. Topography from topology: photoinduced surface features generated in liquid crystal polymer networks. Advanced Materials 2013, 25, 5880–5885. [Google Scholar] [CrossRef] [PubMed]
  13. Feng, W.; Liu, D.; Broer, D.J. Functional liquid crystal polymer surfaces with switchable topographies. Small Structures 2021, 2, 2000107. [Google Scholar] [CrossRef]
  14. Babakhanova, G.; Yu, H.; Chaganava, I.; Wei, Q.H.; Shiller, P.; Lavrentovich, O.D. Controlled placement of microparticles at the water–liquid crystal elastomer interface. ACS applied materials & interfaces 2019, 11, 15007–15013. [Google Scholar]
  15. Peng, C.; Turiv, T.; Guo, Y.; Wei, Q.H.; Lavrentovich, O.D. Command of active matter by topological defects and patterns. Science 2016, 354, 882–885. [Google Scholar] [CrossRef] [PubMed]
  16. Turiv, T.; Koizumi, R.; Thijssen, K.; Genkin, M.M.; Yu, H.; Peng, C.; Wei, Q.H.; Yeomans, J.M.; Aranson, I.S.; Doostmohammadi, A. Polar jets of swimming bacteria condensed by a patterned liquid crystal. Nature Physics 2020, 16, 481–487. [Google Scholar] [CrossRef]
  17. Koizumi, R.; Turiv, T.; Genkin, M.M.; Lastowski, R.J.; Yu, H.; Chaganava, I.; Wei, Q.H.; Aranson, I.S.; Lavrentovich, O.D. Control of microswimmers by spiral nematic vortices: Transition from individual to collective motion and contraction, expansion, and stable circulation of bacterial swirls. Physical Review Research 2020, 2, 033060. [Google Scholar] [CrossRef]
  18. Dhakal, N.P.; Jiang, J.; Guo, Y.; Peng, C. Self-assembly of aqueous soft matter patterned by liquid-crystal polymer networks for controlling the dynamics of bacteria. ACS applied materials & interfaces 2020, 12, 13680–13685. [Google Scholar]
  19. Turiv, T.; Krieger, J.; Babakhanova, G.; Yu, H.; Shiyanovskii, S.V.; Wei, Q.H.; Kim, M.-H.; Lavrentovich, O.D. Topology control of human fibroblast cells monolayer by liquid crystal elastomer. Science Advances 2020, 6, eaaz6485. [Google Scholar] [CrossRef]
  20. Dhakal, N.P.; Jiang, J.; Guo, Y.; Peng, C. Photopatterning DNA structures with topological defects and arbitrary patterns through multiple length scales. Physical Review Applied 2020, 13, 014026. [Google Scholar] [CrossRef]
  21. Jiang, J.; Dhakal, N.P.; Guo, Y.; Andre, C.; Thompson, L.; Skalli, O.; Peng, C. Controlled dynamics of neural tumor cells by templated liquid crystalline polymer networks. Advanced Healthcare Materials 2020, 9, 2000487. [Google Scholar] [CrossRef]
  22. Culbreath, C.; Glazar, N.; Yokoyama, H. Note: Automated maskless micro-multidomain photoalignment. Review of Scientific Instruments 2011, 82. [Google Scholar] [CrossRef] [PubMed]
  23. Shteyner, E.A.; Srivastava, A.K.; Chigrinov, V.G.; Kwok, H.-S.; Afanasyev, A.D. Submicron-scale liquid crystal photo-alignment. Soft Matter 2013, 9, 5160–5165. [Google Scholar] [CrossRef]
  24. Guo, Y.; Jiang, M.; Peng, C.; Sun, K.; Yaroshchuk, O.; Lavrentovich, O.D.; Wei, Q.H. Designs of plasmonic metamasks for photopatterning molecular orientations in liquid crystals. Crystals 2016, 7, 8. [Google Scholar] [CrossRef]
  25. Guo, Y.; Jiang, M.; Peng, C.; Sun, K.; Yaroshchuk, O.; Lavrentovich, O.; Wei, Q.H. High Resolution and High Throughput Plasmonic Photopatterning of Complex Molecular Orientations in Liquid Crystals. Advanced Materials 2016, 28, 2353–2358. [Google Scholar] [CrossRef] [PubMed]
  26. Yun, H.; Jiang, S.; Chen, H.; Zhu, Y.; Xu, X.; Li, B.; Xi, P.; Jiang, M.; Wei, Q.H. Ultra-high spatial resolutions in photopatterning molecular orientations. Optics Express 2024, 32, 31107–31119. [Google Scholar] [CrossRef]
  27. Padmini, H.N.; Rajabi, M.; Shiyanovskii, S.V.; Lavrentovich, O.D. Azimuthal anchoring strength in photopatterned alignment of a nematic. Crystals 2021, 11, 675. [Google Scholar] [CrossRef]
  28. Jiang, J.; Wang, X.; Akomolafe, O.I.; Tang, W.; Asilehan, Z.; Ranabhat, K.; Zhang, R.; Peng, C. Collective transport and reconfigurable assembly of nematic colloids by light-driven cooperative molecular reorientations. Proceedings of the National Academy of Sciences 2023, 120, e2221718120. [Google Scholar] [CrossRef]
  29. Chigrinov, V.G.; Kozenkov, V.M.; Kwok, H.S. Photoalignment of liquid crystalline materials: physics and applications; John Wiley & Sons: 2008.
  30. Chigrinov, V.; Sun, J.; Wang, X. Photoaligning and photopatterning: New LC technology. Crystals 2020, 10, 323. [Google Scholar] [CrossRef]
  31. Yaroshchuk, O.; Gurumurthy, H.; Chigrinov, V.G.; Kwok, H.S.; Hasebe, H.; Takatsu, H. Photoalignment properties of brilliant yellow dye. In Proceedings of the Proc. IDW, 2007; pp. 1665-1668.
  32. Folwill, Y.; Zeitouny, Z.; Lall, J.; Zappe, H. A practical guide to versatile photoalignment of azobenzenes. Liquid Crystals 2021, 48, 862–872. [Google Scholar] [CrossRef]
  33. Lall, J.; Zappe, H. In situ, spatially variable photoalignment of liquid crystals inside a glass cell using brilliant yellow. In Proceedings of the Photosensitive Materials and their Applications II, 2022; pp. 91-97.
  34. Chigrinov, V.; Kudreyko, A.; Guo, Q. Patterned photoalignment in thin films: physics and applications. Crystals 2021, 11, 84. [Google Scholar] [CrossRef]
  35. Yin, K.; Xiong, J.; He, Z.; Wu, S.T. Patterning liquid-crystal alignment for ultrathin flat optics. ACS omega 2020, 5, 31485–31489. [Google Scholar] [CrossRef] [PubMed]
  36. Fang, G.; Shi, Y.; Maclennan, J.E.; Clark, N.A.; Farrow, M.J.; Walba, D.M. Photo-reversible liquid crystal alignment using azobenzene-based self-assembled monolayers: comparison of the bare monolayer and liquid crystal reorientation dynamics. Langmuir 2010, 26, 17482–17488. [Google Scholar] [CrossRef] [PubMed]
  37. Fang, G.; Maclennan, J.; Yi, Y.; Glaser, M.; Farrow, M.; Korblova, E.; Walba, D.; Furtak, T.; Clark, N. Athermal photofluidization of glasses. Nature communications 2013, 4, 1521. [Google Scholar] [CrossRef] [PubMed]
  38. Wang, J.; McGinty, C.; West, J.; Bryant, D.; Finnemeyer, V.; Reich, R.; Berry, S.; Clark, H.; Yaroshchuk, O.; Bos, P. Effects of humidity and surface on photoalignment of brilliant yellow. Liquid Crystals 2017, 44, 863–872. [Google Scholar] [CrossRef]
  39. Shi, Y.; Zhao, C.; Ho, J.Y.L.; Song, F.; Chigrinov, V.G.; Luo, D.; Kwok, H.S.; Sun, X.W. High photoinduced ordering and controllable photostability of hydrophilic azobenzene material based on relative humidity. Langmuir 2018, 34, 4465–4472. [Google Scholar] [CrossRef]
  40. Zawadzki, A.; Walton, H. Measurements of the splay and bend elastic constants of 4′-butyl-4-heptyl-bicyclohexyl-4-carbononitrile, CCN47. Molecular Crystals and Liquid Crystals 2012, 569, 10–14. [Google Scholar] [CrossRef]
  41. Kleman, M.; Laverntovich, O.D. Soft Matter Physics: An Introduction; Springer: 2003.
  42. Chiccoli, C.; Feruli, I.; Lavrentovich, O.; Pasini, P.; Shiyanovskii, S.V.; Zannoni, C. Topological defects in schlieren textures of biaxial and uniaxial nematics. Physical Review E 2002, 66, 030701. [Google Scholar] [CrossRef]
  43. Taylor, J. Introduction to error analysis, the study of uncertainties in physical measurements, 2nd ed.; University Science Books: 1997.
  44. Ramdane, O.O.; Auroy, P.; Forget, S.; Raspaud, E.; Martinot-Lagarde, P.; Dozov, I. Memory-free conic anchoring of liquid crystals on a solid substrate. Physical Review Letters 2000, 84, 3871. [Google Scholar] [CrossRef]
  45. Vilfan, M.; Olenik, I.D.; Mertelj, A.; Čopič, M. Aging of surface anchoring and surface viscosity of a nematic liquid crystal on photoaligning poly-(vinyl-cinnamate). Physical Review E 2001, 63, 061709. [Google Scholar] [CrossRef]
  46. Perny, S.; Barny, P.L.; Delaire, J.; Buffeteau, T.; Sourisseau, C.; Dozov, I.; Forget, S.; Martinot-Lagarde, P. Photoinduced orientation in poly (vinylcinnamate) and poly (7-methacryloyloxycoumarin) thin films and the consequences on liquid crystal alignment. Liquid crystals 2000, 27, 329–340. [Google Scholar] [CrossRef]
  47. Drzaic, P.S. Liquid Crystal Dispersions; World Scientific: 1995.
Figure 1. Chemical structures of materials and photopatterned defect array. (a) Photoresponsive azo-dye Brilliant Yellow, liquid crystal CCN-47, and solvent N, N-dimethylformamide. (b) Director pattern of the defects array. The blue dots represent the cores of +1 defects, and the red dots represent the cores of −1 defects. (c) A polarizing optical microscope texture of the plasmonic meta mask with ±1 radial defect array. (d) Polarized optical microscope images of a portion of a photopatterned cell with a +1 radial defect on the left and a −1 defect on the right. The cell thickness is 1.1 μm. (e) the same, polarizing microscopy with a full-wavelength optical compensator with the slow axis λ . P and A represent the polarizer and analyzer, respectively.
Preprints 140339 g001
Figure 2. Brilliant Yellow layer thickness measurement. (a) An image of a 1.0 wt% BY-coated, partially wiped surface taken using a digital holographic microscope. The left side of the image shows the BY coating, while the right side shows the glass surface after wiping off the coating. (b) The surface profile plot along the line AB marked in (a), and (c) BY layer thicknesses for different BY concentrations in the spin-coated solutions.
Preprints 140339 g002
Disclaimer/Publisher’s Note: The statements, opinions and data contained in all publications are solely those of the individual author(s) and contributor(s) and not of MDPI and/or the editor(s). MDPI and/or the editor(s) disclaim responsibility for any injury to people or property resulting from any ideas, methods, instructions or products referred to in the content.
Copyright: This open access article is published under a Creative Commons CC BY 4.0 license, which permit the free download, distribution, and reuse, provided that the author and preprint are cited in any reuse.
Prerpints.org logo

Preprints.org is a free preprint server supported by MDPI in Basel, Switzerland.

Subscribe

Disclaimer

Terms of Use

Privacy Policy

Privacy Settings

© 2025 MDPI (Basel, Switzerland) unless otherwise stated