
Submitted:
21 November 2024
Posted:
21 November 2024
You are already at the latest version
Abstract
Understanding the mechanical properties of the grid component of textile-reinforced mortars (TRM) is critical because they directly influence the behaviour and strengthening capabilities of the composite. This study explored the dynamic tensile behaviour of a bi-directional basalt fibre grid using a high-speed servo-hydraulic direct tensile testing machine with specialised grips. Failure mode and deformation were captured with a high-speed camera. Tensile strain values were extracted from the recorded images using a Matlab computer vision tool - 'vision.PointTracker'. Specimen sizes of one and four rovings were tested at intermediate (1-8/s) and quasi-static (10-3/s) strain rates for comparison. After the tensile tests, scanning electron microscopy (SEM) analyses were performed to examine the microscopic failure of the grid. Linear and non-linear stress-strain behaviours were observed in the range of 10-3 to 1/s and 4 to 8/s, respectively. Increased strain rate enhanced tensile strength, ultimate strain, toughness, and elastic modulus. Overall, the dynamic increase factors for these properties, except for the elastic modulus, were between 1.4 and 2.3. At the macroscopic level, the grid generally failed in a brittle manner. However, microscopic analysis revealed that the fibre and polymer coating were strain rate sensitive. The enhanced tensile performance of the grid under dynamic loading circumstances makes it suitable for retrofitting structures prone to extreme loading conditions.
Keywords:
dynamic
; strain rate
; basalt fibre
; tensile tests
; textile reinforcement
; scanning electron microscopy
; computer vision
; TRM
; FRCM
1. Introduction
Textiles are used in two state-of-the-art techniques to strengthen civil engineering structures: externally bonded fibre-reinforced polymers (FRP) and textile-reinforced mortars (TRM). In the 1990s, the FRP method emerged, utilising a composite made of a continuous, unidirectional fibre textile saturated with resin [1,2]. However, constraints related to using organic resins for impregnating textiles led to the introduction of the TRM method in the early 2000s. The TRM approach integrates a bi-directional, open-mesh grid into an inorganic matrix to optimise the interactions between fibres and the matrix for improved performance [3]. Textile strengthening techniques are used in various applications, including those that expose them to extreme, dynamic conditions. They are used to reinforce structures against blasts and shockwaves [4], offshore structures exposed to harsh wave actions [5], collision-prone ship platforms and piers [6], and building/bridge components in seismic regions [7]. Textiles have also been explored as possible connections to minimise roof uplift during hurricanes [8].
Previous studies have shown that the textile components of composites used for structural strengthening are strain-rate sensitive [9,10,11]. Therefore, understanding the mechanical performance at strain rates that reflect the aforementioned dynamic loading events is critical for developing safe, reliable, and efficient structures. However, published work on textile components at intermediate (10-1 to 103/s) and high (103 to 106/s) strain rates is lacking and inconclusive.
Most dynamic characterisation efforts were carried out using a drop-weight impact system that applied intermediate strain rates of 40, 80, 120, and 160/s. Ou, Zhu and Li [9] found that basalt fibre yarns experienced increased elastic modulus and tensile strength with increasing strain rate. Bai, Yan, Ozbakkaloglu, Han, Dai and Zhu [10] examined polyethylene terephthalate (PET) fibre bundles and reported that an increase in the strain rate led to an increase in the elastic modulus and tensile strength and a decrease in the failure strain and toughness. Unique failure modes were observed under quasi-static and dynamic loading conditions. Ou et al. [12] studied the effect of strain rate on the tensile behaviour of Kevlar® 29 single filaments and yarns. Increased strain rates resulted in increased elastic modulus and tensile strength, reduced ultimate strain, and varying trends related to toughness. In addition, the tensile strength of the single filaments was greater than that of the single yarns. Ou et al. [13] examined individual yarns extracted from unidirectional glass textiles. The tensile strength of the yarns increased significantly and continuously with an increase in the strain rate, while the toughness increased up to 40/s and then decreased when the strain rate changed from 120 to 160/s due to the reduction in the ultimate strain.
Yao et al. [14] used an MTS high-rate servo-hydraulic testing machine to examine the effect of strain rate on several types of plain-woven, unidirectional textiles, including aramid, glass, basalt, and carbon. Maximum strain, average tensile strength, and toughness increased as the strain rate increased from 25 to 100/s.The failure modes of the different materials were reportedly independent of the strain rate, and the glass textiles were found to be the most ductile.
In addition, Zhu et al. [15] investigated basalt filament tows at intermediate and high strain rates using a split Hopkinson tension bar. Tows were tested between 600 and 3000/s and demonstrated increased elastic modulus and tensile strength and decreased failure strain with an increased strain rate.
All of the studies mentioned above relate to unidirectional textiles associated with the FRP method. The dynamic behaviour of bi-directional, open-mesh grids used in textile-reinforced concrete or mortar remains largely unexplored. Zhu, Peled and Mobasher [11] considered the tensile behaviour of alkali-resistant (AR) glass, polyethylene (PE) and carbon TRM grids within the range of 9-28/s. The glass and carbon grids demonstrated a linear elastic behaviour with brittle failure, whereas the PE material exhibited ductile behaviour. A recent study by Milling et al. [16] on basalt TRM grids was conducted at 0.2 and 2/s. This study reported that the material's elastic modulus and tensile strength decreased with an increasing strain rate. Both studies reported that specimens deemed suitable for quasi-static testing were unsuitable for dynamic loading conditions due to premature failures.
The strain-rate sensitivity of textiles is highly dependent on fibre type, roving orientation, mesh size, resin properties, and the performance of fibre-resin interfaces [17]. Nevertheless, the relationship between these parameters and the tensile mechanical characteristics under dynamic strain rates remains ambiguous. Knowledge of the experimental approach for investigating this material is lacking. Specimen types and gripping procedures that have been successful in FRP unidirectional textiles and TRM tests under quasi-static conditions cannot be transferred to TRM grids under dynamic loading [11,16]. Moreover, the effect of specimen size on the dynamic tensile properties of TRM grids is yet to be explored. These gaps highlight the need for research efforts to advance knowledge and develop standardised testing guidelines, which are currently non-existent.
This research investigated the tensile characteristics of a basalt TRM grid at quasi-static (10-3/s) and intermediate (1-8/s) strain rates. Tensile tests were carried out using a high-speed servo-hydraulic machine with an improved version of the specialised grips used in [16]. A high-speed camera captured the material's failure mode and strain distribution during tensile loading. Strain analysis was performed by applying the 'vision.PointTracker' from Matlab's Computer vision toolbox, which is used to extract displacement values by pixel tracking. The experimental methodology details the series of grips and specimen types explored and the challenges encountered. The study provides novel insights into how variations in strain rate and specimen geometry impact the stress-strain behaviour, tensile mechanical properties, and failure modes of the grid material. The dynamic increase factors for the tensile strength, ultimate strain, and toughness are also determined, and empirical equations for predicting these properties at various strain rates are proposed. Furthermore, for the first time, a scanning electron microscope (SEM) analysis is performed to provide insights into the microscopic failure of the basalt grid under dynamic conditions.
2. Materials and Methods
2.1. Materials
The basalt fibre grid used in this study was the MAPEGRID B 250. This grid, shown in Figure 1, is made of orthogonal warp and weft rovings, forming a 6mm x 6mm squared mesh pattern. The centre-to-centre spacing between the rovings is approximately 7.6mm. MAPEI ® coats the fibres with an anhydrous, alkali-resistant polymer to protect them from chemical attacks when embedded in a cementitious matrix. The material has an equivalent thickness of 0.039 mm, a mass density of 2.75 g/cm³, and a weight of 250 g/m². The tensile strength is 60 kN/m, with an elongation of 1.8% and an elastic modulus of 89 GPa.
2.2. Tensile Testing
All tensile tests were conducted at the Institute of Science and Innovation in Mechanical and Industrial Engineering (INEGI), Portugal, using a high-rate servo-hydraulic testing machine that can operate within the range of 1 - 1100mm/s with a load capacity of 20 kN. Deformation and failure behaviours were captured with a high-speed camera of the FASTCAM Nova S6 type, model 800K-M-16 GB 10GbE, and two halogen spotlights. Twelve 'grid' (four warp rovings) specimens and six 'roving' (one warp roving) specimens were tested at strain rates in the range of 10-3 and 8/s following a set of trial setups.
2.2.1. Tensile Grips and Specimen Types
Due to the lack of standardised testing methods for grids used in TRM applications, this study explored several grips to achieve reliable results, see Figure 2. Initially, trial tests were conducted with clamp grips and four warp roving x 140mm aluminium-tabbed coupon specimens. This specimen type was adopted from [18], who established that it effectively distributed the gripping load and avoided specimen failure at the gripping areas under quasi-static loading. However, after numerous attempts, the specimens failed by the sliding of one or more rovings from the gripping section, as shown in Figure 2a.
A set of specialised grips made of stainless steel (SG1) was developed to ensure a valid specimen failure. SG1 specimens were cut at 490mm lengths and spanned a width of four warp rovings. They were aligned between the top and bottom grips with a 100mm gauge length. The specimen folds over the grips and ends between the two jaws, as shown in Figure 2b. With increasing tension on the specimen, the clamping force becomes stronger. No signs of stress concentrations were observed in the grip area; nonetheless, using SG1 led to excessive grip slippage and failure to reach the desired strain rates, as discussed in [16]. To address these problems, a 2mm thick rubber layer was added to the grip region of SG1 to enhance the contact friction, see Figure 2c. Wrapping the contact area of SG1 with rubber proved ineffective, leading to non-uniform stress distribution and premature failure at the grips. Discontinuities in the stress-strain behaviours were also evident when the grip area was partially and fully covered with rubber, indicating that the specimens were not appropriately fastened.
Based on the shortcomings of SG1, the specialised grips SG2 - a modification of SG1, were conceptualised. Vice-type clamps were installed at the top and bottom of the grips to prevent the ends of the specimens from slipping through the grips, as shown in Figure 2d. The distance between the top and bottom grips was also reduced from 100mm to 55mm. These alterations to SG1 resolved the slippage issue and made achieving the targeted strain rates possible. SG2 specimens were cut at lengths of 490mm and had a width of 26.8mm or 6.7mm, depending on whether they included four or one warp roving, respectively. The specimen installation process involved the following steps: (i) securing the upper end of the specimen using the top clamp, (ii) looping the loose end around the curved grips, threading it through the jaws, and (iii) securing the lower end of the specimen using the bottom clamp. Once the specimen was secured, it was subjected to the weight of the lower grip and the associated impact disc, approximately 63N.
2.2.2. Testing Programme
The tensile load was recorded at 750kHz, and images were captured at 6.4kHz for all tests, except for those conducted at 1mm/s, which were recorded at 50Hz. Three samples were tested at each loading rate, as listed in Table 1, except for 800mm/s. Specimens were labelled 'G' for grid, four-roving specimens and 'R' for single-roving specimens. The second component of the Specimen ID is the measured strain rate (10-3,1,4,5, and 8/s) derived from the slope of the strain-time graphs, and the last component represents the sample number. Notably, the grid specimens reached lower strain rate values than single rovings at the same loading rate of 1100mm/s (see G5 and R8 specimens).
2.2.3. Strain Data Processing
A modified version of the MATLAB pixel tracking code developed by Lydon et al. [19] was used to quantify strain. The sequence of images for each specimen was first converted to grayscale to reveal the intensity information and easily track the points of interest. This method was convenient as it did not require a speckle pattern or 'surface component' as required by commercial digital image correlation software. For the grid and roving specimens, virtual extensometers were defined in the first frame by selecting eight points (P1-P8) or two points (P1-P2) of interest, respectively. Figure 3 illustrates the placement of these points in the centre of a grid specimen. The vertical displacements of the points, measuring 15 x 15 pixels, were tracked from the first frame (Figure 3a) and continued across the sequence to the frame corresponding to the maximum tensile load (Figure 3b) by implementing the vision.PointTracker function.
The strain values were derived from the displacement measured in the gauge length region of the specimens to avoid the effects of friction and slippage in the grip region [20].

Table 1.
Summary of Specimen ID, machine displacement rate, and measured strain rate.
| Specimen ID |
Machine displacement rate [mm/s] |
Measured Strain rate [1/s] |
|---|---|---|
| G10-3-1 | 2.2x10⁻³ | |
| G10-3-2 | 1 | 2.8x10⁻³ |
| G10-3-3 | 3.0x10⁻³ | |
| R10-3-1 | 1.9x10⁻³ | |
| R10-3-2 | 1 | 2.5x10⁻³ |
| R10-3-3 | 2.9x10⁻³ | |
| G1-1 | 0.79 | |
| G1-2 | 200 | 0.83 |
| G1-3 | 0.84 | |
| G4-1 | 800 | 3.79 |
| G4-2 | 4.19 | |
| G5-1 | 4.90 | |
| G5-2 | 1100 | 5.58 |
| G5-3 | 5.56 | |
| G5-4 | 5.86 | |
| R8-1 | 7.05 | |
| R8-2 | 1100 | 8.49 |
| R8-3 | 8.83 |
Strain, ε, was computed as the average of the individual strains measured by each virtual extensometer as expressed in Equation 1:
where N represented the number of extensometers, and represented the original and final length of the i-th extensometer. Pixel-based measurements of original and final length were converted into millimetres by determining the image resolution (pixels per mm) using MATLAB's Imtool. Calibration was facilitated by placing square markers with predetermined dimensions on the grips.
2.3. Microscopic Analysis
After tensile testing, the microstructures of the samples obtained from the ends of the ruptured rovings were analysed. The samples did not exceed a length of 12.5mm, which was the diameter of the SEM specimen stubs. The specimens underwent gold plating using a manual Agar sputter coater and were then examined using a Quanta FEG-250 scanning electron microscope. Depending on the sample, the microscope was operated at either 10kV or 20kV accelerating voltage to mitigate the impact of charging.
3. Results and Discussion
3.1. Strain rate Effect on the Stress-Strain Relationship
Stress-strain curves of grid and roving samples at various strain rates are plotted in Figure 4. The comparison between the five groups of samples shows how the curve trends change from linear to non-linear with the increased strain rate. The stress-strain relationship of all 10-3 and 1/s specimens, except G10-3-1, displayed one linear elastic region until failure. The G4 and R8-2 specimens, shown in Figure 4b and e, exhibited two linear regions, while the G5, R8-1 and R8-3 specimens, see Figure 4c and d, had three linear regions.
The toe, linear and transition regions of the stress-strain curves are highlighted in the schematic shown in Figure 5. A non-linear, gradually increasing slope at the initial stage, called the ‘toe region’, was typical in all plots. The transition point between the toe and the E1 Region, P1, primarily occurred around 400 MPa or less, except for specimen R8-1, which occurred at 1100 MPa. The specimens tested at 10-3 and 1/s ruptured at the end of the E1 region. However, in the range of 4 to 8/s, the specimens possessed a ‘knee’ feature at the end of the E1 region, followed by a distinct ‘transition zone’. The maximum point of the knee at P2 represented the yield point where the material started to experience irreversible fibre or polymer damage [21,22]. The yield stress increased from 900 to 2950 MPa with an increase in strain rate from 4 to 8/s. The transition zones for the G and R specimens occurred within the range of 900-1500 MPa and 1.3-2.7%, and 1510-2950 MPa and 1.4-3.6%, respectively. For the G specimens, the stress at the endpoints of the transition zones, P3, were higher than the yield stress, demonstrating a strain-hardening behaviour. Conversely, a softening behaviour was noted for the R specimens, where the stress values at P3 were lower than the yield stresses. Region E2 ranged from 1050-3750 MPa. A modest knee between 2300-2750 MPa facilitated the transition to the E3 region for all specimens in the range of 5 to 8/s, except for specimen R8-2.
The observed non-linear behaviour of the basalt grid as it transitioned from regions E1 through E3 are indications of microscopic damage accumulation [23,24,25] and thermal softening [26], both of which were confirmed by the SEM analysis discussed in the ‘Microscopic Failure’ section of this paper. Furthermore, the more noticeable non-linear behaviour of the R specimens relative to the G specimens, especially in the transition zones, can be due to the load distribution mechanism. In the G specimens with several weft and warp rovings, the failure of certain fibres within the rovings results in the redistribution of load to other fibres and rovings. In the R specimens, the load is borne entirely by the fibres within a single roving, which can lead to a more catastrophic failure if one or more fibres fail.
The inconsistent stress-strain relationships displayed by specimens G10-3-1 and R8-2 can be linked to their misalignment during testing. Figure 6 shows that all the weft rovings for G10-3-1 were horizontal when the test started and began misaligning at around 13.7s, whereas R8-2 maintained a slanted orientation for the entire test duration. Specimen G10-3-1 change in alignment corresponded to a considerable decrease in the stress-strain behaviour observed in Figure 4a, around 2.1% strain. This sample also had the lowest elastic modulus and tensile strength of 50 GPa and 1664 MPa, respectively. Interestingly, in the case of R8-2, despite being misaligned, this sample's tensile strength and ultimate strain were consistent with the results reported for other (aligned) roving specimens.
3.2. Strain Rate Effect on Tensile Mechanical Characteristics
3.2.1. Tensile Strength
The tensile strength was determined by dividing the ultimate force by the product of the grid's equivalent thickness (0.039mm), the number of warp rovings (4 for the grid specimens and 1 for the single roving specimens), and the spacing between the warp rovings (7.6mm). Figure 7 shows an increase in the ultimate tensile strength and dynamic increase factor with increasing strain rate. Grid specimens experienced a tensile strength increase from 1664 to 3069 MPa, namely 84%, when the strain rate increased from 10-3 to 5/s. Roving specimens also followed a similar trend, where the strength increased by 114% from 1755 (at 10-3/s) to 3747 MPa (at 8/s). Data analysis suggests that the R specimens were more than 20% stronger than the G specimens in the dynamic range. Usually, smaller specimens have higher strength than their larger counterparts of the same material due to fewer defects and a lower probability of critical flaws [14]. However, in this study, the lower strength of the grid specimens could be attributed to the interaction of the weft rovings and non-uniform stress distribution due to deviation from the parallelism of warp rovings. Visual inspection of the G specimens revealed substantial misalignment of up to 15 degrees and cell size variation from 1 to 3mm.
The enhanced tensile strength observed at dynamic rates for both R and G specimens may be attributed to the short duration of the deformation process, which was less than 10ms. Under such conditions, microstructural defects, which significantly influence the tensile strength of basalt fibres [27], have little time to initiate, propagate and connect, thus requiring a higher stress to fracture [9]. Also, there may have been inadequate time for the fibres to shift and reorganise, resulting in intensified inter-fibre friction. Although there has been no confirmation regarding basalt fibres, several studies [28,29,30] have demonstrated that enhanced inter-fibre friction in polyester, Kevlar, and aramid fibres improves mechanical characteristics. The polymer coating may have also been a significant contributor to the enhanced tensile strength of the grid, as the findings of [31,32,33] revealed a positive correlation between tensile strength and strain rate for polymer coatings. Nonetheless, the specific influence of the fibres, polymer coating, or inter-surface interactions in improving the tensile strength of the basalt grid is unknown and remains an open issue.
Similar trends of increased tensile strength with increasing strain rates were reported for basalt yarn [9], unidirectional fibres[14], and filament tows[15] at 40-160/s, 25-100/s and 600-3000/s, respectively. The tensile strength of the basalt grid was higher than those for basalt yarn at 40-160/s [9] by more than 50%, basalt unidirectional fabrics at 25 to 100/s [14] by more than 100%, and basalt filament tows at 600 to 3000/s [15] by more than 80%.
3.2.2. Ultimate Strain
Figure 8 illustrates a gradual increase in the ultimate strain with increasing strain rate. The G10-3 and R10-3 specimens showed deformation ranging from 2.7% to 3.3% before rupture. In contrast, the dynamic specimens subjected to strain rates ranging from 1 to 8/s revealed a higher strain capacity, deforming by 3.8% to 4.4% before failure. This reflects a 30% increase in strain capacity in dynamic samples compared to quasi-static ones. The results also show that specimen size did not significantly influence the ultimate strains of the roving and grid specimens under dynamic loading.
Studies on basalt fibre materials at higher strain rates have reported similar and differing failure strains and trends. Yao, Zhu, Zhang, Li and Mobasher [14] found that loading unidirectional basalt textiles at strain rates of 25-100/s increased the ultimate strain from 2.4 to 3.2%. In contrast, basalt filament tows tested between 600 and 3000/s decreased with increasing strain rate and had an ultimate failure strain of less than 3% [15]. Regarding the effect of specimen size on the ultimate strain, Ou, Zhu and Li [9] showed that basalt grid specimens experienced 75% more ultimate strain than smaller basalt yarn specimens when tested in the range of 40-160/s.
3.2.3. Toughness
Toughness was calculated using MATLAB's 'cumtrapz' numerical integration function to find the area under the stress-strain curves in Figure 4. Figure 9 shows an overall increase in the energy absorbed by the material as the strain rate increased from 10-3 to 8/s. The average toughness of the grid at 5/s and roving at 8/s were more than twice the toughness at 10-3. The graph also shows that the roving specimens absorbed more energy than the grid specimens. This observed trend agrees with the results reported in [34]. However, a contradictory study by [9] found that basalt grid specimens were 3.75 times tougher than the single yarn specimens at 40-160/s.
3.2.4. Elastic Modulus
Figure 10 shows the effect of strain rate on the elastic modulus. The elastic modulus or stiffness was assessed in two ways. The first method (LBF) considered the slope of the best-fit line of each stress-strain curve in Figure 4. This method implied that the stiffness was independent of strain rate since the average elastic modulus at 10-3/s and 1-8/s were 62.8 GPa and 65 GPa, respectively – about 28% less than the manufacturer's value. Ou, Zhu and Li [9], who also used the LBF method, reported elastic moduli in the range of 62-87 GPa for basalt yarn at 40-160/s.
The second method analysed the slopes of the three linear regions previously identified in Figure 5. The E1, E2 and E3 values in Figure 10 and Table 2 show a general trend of increasing stiffness with increasing strain rates in each region. The G4 specimens with two linear regions showed reduced stiffness in the second region compared with the first region (E1>E2), while the G5 specimens with three regions showed the greatest stiffness in region 2 (E2>E1 and E2>E3). Regarding the roving specimens, stiffness decreased with the increasing linear regions, E1>E2>E3. E1 ranged from 62-119 GPa for the dynamic grid specimens and 182-226 GPa for the roving specimens. E2 for the grid ranged from 66-161 GPa and 166-387 GPa for the single rovings. E3, often the least stiff compared to E1 and E2, ranged from 65-115 GPa. The maximum stiffness experienced by the grid and roving specimens was 145GPa and 387 GPa, respectively.
3.2.5. Dynamic Increase Factor (DIF)
The dynamic increase factor was used to quantitatively describe the effect of strain rate on the basalt grid's tensile strength, ultimate strain, and toughness. The DIF was defined as the ratio of the value under a dynamic strain rate to the average quasi-static value. Figure 7b, Figure 8b and Figure 9b display the relationship between DIFs and strain rates. Overall, the DIFs were between 1.4 and 2.3. DIFs for the grid specimens at strain rates of 1 to 5/s ranged from 1.4 to 1.7 for tensile strength, from 1.3 to 1.4 for ultimate strain and from 1.6 to 2.3 for toughness. For the rovings tested at 8/s, the DIFs were in a similar range to the grid for the ultimate strain and toughness. However, the DIFs were higher for the tensile strength (1.9 to 2.0).
The parameters of the DIF models, plotted in Figure 7b, Figure 8b and Figure 9b, are reported in Table 3. The reliabilities of the models were checked using Excel's regression analysis tool, and the P-values associated with the ANOVA F statistic are also reported. The tensile properties of the grid and roving were all statistically significant at the 5% confidence level (CL), except for the grid ultimate strain and roving toughness models. These models were, however, statistically significant at the 10% CL. Similar models were proposed by [35] and [34] for unidirectional and tendon basalt FRPs; however, no models for TRM grids are available in the literature.
3.3. Strain Rate Effect on Tensile Failure
3.3.1. Macroscopic Failure
The G and R specimens experienced brittle and abrupt ruptures in their rovings. Figure 11 illustrates how failure evolved in the dynamic specimens in relation to their stress-strain responses. Initially, in the toe and E1 regions, the material underwent a process of adjustment, during which the rovings were straightened. Beyond the E1 region, microscopic deterioration of individual fibres and the polymer coating began. This degradation progressed until the material reached its ultimate tensile stress, marked by point A. At this point, as shown in Figure 12a, no noticeable damages to the rovings were seen. However, shortly after, at point B, the specimens exhibit macroscopic brittle failures as individual rovings ruptured (Figure 12b). For all samples, failure occurred within the gauge length region. Failures in the G specimens were initiated at arbitrary internal or external rovings. The random stress-concentrated areas in the grid were influenced by misalignment during testing, geometric irregularities and material imperfections, as discussed in Section 3.1, Section 3.2.1 and Section 3.3.2, respectively.
3.3.2. Microscopic Failure
After the tensile tests, SEM analysis was conducted for five samples (G10-3-1, G1-2, G4-2, G5-2 and R8-2) to examine the influence of strain rate on the basalt grid’s microscopic failure. The micrographs showed that the basalt grid underwent fibre breakage, breakage and deformation of the coating, interfacial debonding between the fibres and coating, and delamination.
The basalt fibres failed brittle at quasi-static and dynamic strain rates. The fracture planes of the fibres were predominantly flat (Figure 13b); inclined surfaces (Figure 13a) were only observed for G5-2 and R8-2. The flat fracture surface in Figure 13c exhibits the characteristic mirror, mist, and hackle features typically observed in brittle fibre fractures [36,37]. In this instance, the failure originated from the central area of the mirror region (A) and propagated throughout the mist region (B). The crack continued in the direction of the river markings in the hackle region C until the fibre broke entirely.
Only brittle coating failure was observed in the quasi-static specimen G10-3-1, see Figure 14a; but for the dynamic specimens, a combination of brittle and ductile coating failures was observed (Figure 14 and Figure 15). Signs of brittle coating failures included scarps and cusps - commonly observed in brittle polymer matrices [38]. Figure 15 shows that the coating around the fibres was stretched and deformed at dynamic strain rates. A possible explanation for this observation might be the local softening of the coating in the area surrounding the fibre-coating interface [39]. It is inferred that the dynamic loading conditions caused a temperature increase in the immediate coating layer surrounding the fibres, resulting in the coating reaching its 'softening onset temperature'. The generated heat would have been insufficient to soften the entire coating. Therefore, the external layer of the coating failed brittle (Figure 14) as it would under quasi-static conditions. The non-linear stress-strain behaviour of the specimens at strain rates greater than 1/s is most likely due to the softening of the coating surrounding the fibres. However, further research is required to validate this inference.
Failures in the coating were triggered and propagated by defects such as porosities, voids, cavities, and cracks, as shown in Figure 14. Microcracks were present on the external surface of the coating (Figure 14c) and along the failure plane (Figure 14d). However, it is uncertain whether these cracks occurred before or after failure. Figure 14c also shows that the coalescence of the porosities played a role in the propagation of cracks. These defects may have resulted from the trapping of air during the impregnation process [40], misalignment of fibres during impregnation, or inadequate bonding between the fibres and coating, as suggested by Gaylord [41]. Figure 14b provides evidence supporting the latter explanation, as it shows that the exterior coating layer has a thickness exceeding 30μm (equivalent to the diameter of three fibres) and little to no coating between the fibres.
All five samples exhibited debonding, which is the separation or loss of adhesion between the fibres and the surrounding coating. Debonding weakens the stress transfer between the coating and the fibres, reducing the material's stiffness. Also, cracks can propagate effortlessly through the coating without the fibres, reducing toughness [42]. Evidence of this phenomenon can be observed in the stress-strain behaviour of the dynamic specimens, where the stiffness, E1 to E3 (Figure 10), progressively decreased with increasing tensile load. Debonding could also be why the toughness of G1-2 is 15% less than that of G1-1 and G1-3.
The micrographs revealed variations in the interfacial bond strength between the fibres and the coating. Generally, the surfaces of the debonded fibres appeared rough, with remnants of the coating still attached (Figure 14 and Figure 15), suggesting strong adhesion between the fibres and the coating. However, sample G10-3-1 in Figure 14a demonstrated weak interfacial bonding, as indicated by the absence of coating on the fibres [43]. Additionally, the smooth and pitted fibre imprints observed within the coating (Figure 16) further suggested inconsistencies in the interfacial bond strength.
The fracture surfaces shown in Figure 16 highlight two prominent features of delamination: fibre imprints and hackles, as previously noted by [44]. Hackles oriented perpendicularly to the loading direction in Figure 16b suggest a mode II fracture within the roving, as described in [45]. The large cavities on the fracture surfaces are weak points in the coating; they promote delamination. Delamination was observed in the two specimens, G10-3-1 and R8-2, which exhibited unusual stress-strain behaviours. These observations indicate that cavities and delamination in the coating significantly influence the grid’s stress-strain response under quasi-static and dynamic strain rates.
4. Conclusions
Tensile characterization of the basalt fibre grid was successfully conducted at intermediate (1 to 8/s) and quasi-static (10⁻³/s) strain rates using specialized grips developed for this purpose. The key conclusions drawn from this study are as follows:
- The type of grip and specimen type used for dynamic tensile testing of the material are essential for achieving valid results. Initial approaches, including clamp grips and SG1 specialised grip, failed due to slippage, non-uniform stress distribution, and premature failures. The modified SG2 grips, featuring vice-type clamps and reduced gauge length, eliminated slippage and enabled consistent strain rates and valid specimen failures.
- The material displayed a linear stress-strain relationship in the range of 10-3 to 1/s. Conversely, non-linear stress-strain relationships with several linear and transition regions were observed when the strain rate ranged from 4 to 8/s. Specimens with anomalous stress-strain behaviours were found to experience misalignment during testing.
- Increased strain rate enhanced the basalt grid's tensile strength, ultimate strain, toughness, and elastic modulus. This renders the grid promising for retrofitting structures such as bridges or high-rise buildings that may experience high loads, vibrations, or potential impacts.
- The correlation between strain rate and tensile strength, ultimate strain, and toughness was logarithmic. Overall, the dynamic increase factors were between 1.4 and 2.3. The DIF for tensile strength, ultimate strain and toughness in the range of 10-3 and 8/s can be predicted with a 10% confidence level using the model: .
- The grid specimens reached lower strain rate values than single rovings at the same loading rate of 1100mm/s, but in the quasi-static range (1mm/s), the specimen size did not affect the strain rate experienced by the samples. The single-roving specimens exhibited higher tensile strength, toughness and elastic modulus than the larger specimens. However, the ultimate strains were comparable for both specimen sizes. The different grid and roving behaviours are attributed to non-uniform stress distribution in the grid caused by geometric roving misalignment and grid effect.
- At the macroscopic level, the basalt grid generally failed brittle. Microscopic investigation revealed that the failure mechanisms included fibre and coating fracture, debonding, and delamination. The SEM analyses also showed that the strain rate influenced the angle of the basalt fibres' fracture plane and the polymer coating's ductility.
- Defects such as cavities, voids, and microcracks were found on the fracture surfaces of the samples, especially those that displayed anomalous stress-strain behaviour and reduced toughness and stiffness. Another critical issue was insufficient coating around the fibres, which compromised the interfacial bond strength of the fibres and coating.
Further research is required to address the issue of grid misalignment during testing. It would also be useful to investigate the effect of strain rate on the individual components of the grid, including the fibre, coating, and interface. Finally, improved coating techniques should be explored to reduce defects and mitigate fibre debonding. Improving the polymer coating could significantly improve the durability and load-bearing capacity of TRMs, particularly under dynamic loading conditions.
Author Contributions
Conceptualization, G.A. and A.M; methodology, P.M.,D.B,A.M; software, A.M.; validation, D.B., G.A. and A.M.; formal analysis, A.M.,G.A.,S.T.; investigation, P.M.,D.B.,A.M.; resources, G.A.,S.T.; data curation, D.B., G.A. and A.M.; writing—original draft preparation, A.M.,G.A.,S.T.; writing—review and editing, G.A.,S.T.; visualization, A.M.,G.A.; supervision, G.A.,S.T.; project administration, G.A.,S.T.,P.M.; funding acquisition, G.A.,S.T.
Funding
This research was funded by the Engineering & Physical Sciences Research Council (EPSRC), United Kingdom, grant number EP/T518074/1.
Data Availability Statement
The data on which this paper is based are available from the authors upon reasonable request.
Conflicts of Interest
The authors declare no conflicts of interest.
References
- Ritchie, P.A. External reinforcement of concrete beams using fiber reinforced plastic. Lehigh University, 1988.
- Triantafillou, T.; Plevris, N. Strengthening of RC beams with epoxy-bonded fibre-composite materials. Materials and structures 1992, 25, 201–211. [Google Scholar] [CrossRef]
- Triantafillou, T.C.; Papanicolaou, C.G. Textile Reinforced Mortars (TRM) versus Fiber ReinforcedPolymers (FRP) as StrengtheningMaterials of Concrete Structures. Special Publication 2005, 230, 99–118. [Google Scholar] [CrossRef]
- Buchan, P.A.; Chen, J.F. Blast resistance of FRP composites and polymer strengthened concrete and masonry structures – A state-of-the-art review. Composites Part B: Engineering 2007, 38, 509–522. [Google Scholar] [CrossRef]
- George, J.M.; Kimiaei, M.; Elchalakani, M.; Fawzia, S. Underwater strengthening and repairing of tubular offshore structural members using Carbon Fibre Reinforced Polymers with different consolidation methods. Thin-Walled Structures 2022, 174, 109090. [Google Scholar] [CrossRef]
- Lin, H.; Han, C.; Yang, L.; Karampour, H.; Luan, H.; Han, P.; Xu, H.; Zhang, S. Dynamic Performance and Crashworthiness Assessment of Honeycomb Reinforced Tubular Pipe in the Jacket Platform under Ship Collision. Journal of Marine Science and Engineering 2022, 10, 1194. [Google Scholar] [CrossRef]
- Zhou, Y.; Wang, X.; Hu, B.; Sui, L.; Yuan, F. Seismic Retrofit of Nonuniformly Corroded Coastal Bridge Piers with FRP and Engineered Cementitious Composite Overlays. Journal of Composites for Construction 2023, 27, 04022088. [Google Scholar] [CrossRef]
- Dhakal, A.; Parvin, A. Fiber Reinforced Polymer as Wood Roof-to-Wall Connections to Withstand Hurricane Wind Loads. CivilEng 2021, 2, 652–669. [Google Scholar] [CrossRef]
- Ou, Y.; Zhu, D.; Li, H. Strain rate and temperature effects on the dynamic tensile behaviors of basalt fiber bundles and reinforced polymer composite. Journal of Materials in Civil Engineering 2016, 28, 04016101. [Google Scholar] [CrossRef]
- Bai, Y.-L.; Yan, Z.-W.; Ozbakkaloglu, T.; Han, Q.; Dai, J.-G.; Zhu, D.-J. Quasi-static and dynamic tensile properties of large-rupture-strain (LRS) polyethylene terephthalate fiber bundle. Construction and Building Materials 2020, 232, 117241. [Google Scholar] [CrossRef]
- Zhu, D.; Peled, A.; Mobasher, B. Dynamic tensile testing of fabric–cement composites. Construction and Building Materials 2011, 25, 385–395. [Google Scholar] [CrossRef]
- Ou, Y.; Zhu, D.; Huang, M.; Li, H. The effects of gage length and strain rate on tensile behavior of Kevlar® 29 single filament and yarn. Journal of Composite Materials 2017, 51, 109–123. [Google Scholar] [CrossRef]
- Ou, Y.; Zhu, D.; Zhang, H.; Huang, L.; Yao, Y.; Li, G.; Mobasher, B. Mechanical Characterization of the Tensile Properties of Glass Fiber and Its Reinforced Polymer (GFRP) Composite under Varying Strain Rates and Temperatures. Polymers 2016, 8, 196. [Google Scholar] [CrossRef] [PubMed]
- Yao, Y.; Zhu, D.; Zhang, H.; Li, G.; Mobasher, B. Tensile behaviors of basalt, carbon, glass, and aramid fabrics under various strain rates. Journal of Materials in Civil Engineering 2016, 28, 04016081. [Google Scholar] [CrossRef]
- Zhu, L.; Sun, B.; Gu, B. Frequency features of basalt filament tows under quasi-static and high strain rate tension. Journal of composite materials 2012, 46, 1285–1293. [Google Scholar] [CrossRef]
- Milling, A.; Amato, G.; Taylor, S.; Robinson, D. Experimental and numerical analysis of the tensile behaviour of basalt textile at various strain rates. In Proceedings of the 11th International Conference on Fiber-Reinforced Polymer (FRP) Composites in Civil Engineering (CICE 2023), Rio de Janeiro, Brazil, 2023.
- Ahmed, A.; Rahman, M.Z.; Ou, Y.; Liu, S.; Mobasher, B.; Guo, S.; Zhu, D. A review on the tensile behavior of fiber-reinforced polymer composites under varying strain rates and temperatures. Construction and Building Materials 2021, 294, 123565. [Google Scholar] [CrossRef]
- D'Anna, J.; Amato, G.; Chen, J.F.; Minafò, G.; La Mendola, L. Experimental application of digital image correlation for the tensile characterization of basalt FRCM composites. Construction and Building Materials 2021, 271, 121770. [Google Scholar] [CrossRef]
- Lydon, D.; Lydon, M.; Del Rincon, J.M.; Taylor, S.E.; Robinson, D.; O’Brien, E.; Catbas, F.N. Development and field testing of a time-synchronized system for multi-point displacement calculation using low-cost wireless vision-based sensors. IEEE Sensors Journal 2018, 18, 9744–9754. [Google Scholar] [CrossRef]
- Luyckx, T.; Verstraete, M.; De Roo, K.; De Waele, W.; Bellemans, J.; Victor, J. Digital image correlation as a tool for three-dimensional strain analysis in human tendon tissue. Journal of experimental orthopaedics 2014, 1, 1–9. [Google Scholar] [CrossRef] [PubMed]
- Stepanović, J.; Ćirković, N.; Sadiković, A.; Stepanović, J. Analysis of the deformation characteristics of woven textile materials in plain weave. Advanced Technologies 2024, 13, 50–56. [Google Scholar] [CrossRef]
- Burkinshaw, S.M. Physico-chemical aspects of textile coloration; John Wiley & Sons: 2016.
- Hughes, M.; Carpenter, J.; Hill, C. Deformation and fracture behaviour of flax fibre reinforced thermosetting polymer matrix composites. Journal of Materials Science 2007, 42, 2499–2511. [Google Scholar] [CrossRef]
- Zhou, G.; Sun, Q.; Meng, Z.; Li, D.; Peng, Y.; Zeng, D.; Su, X. Experimental investigation on the effects of fabric architectures on mechanical and damage behaviors of carbon/epoxy woven composites. Composite structures 2021, 257, 113366. [Google Scholar] [CrossRef] [PubMed]
- Bogdanovich, A.E.; Karahan, M.; Lomov, S.V.; Verpoest, I. Quasi-static tensile behavior and damage of carbon/epoxy composite reinforced with 3D non-crimp orthogonal woven fabric. Mechanics of Materials 2013, 62, 14–31. [Google Scholar] [CrossRef]
- Tamrakar, S.; Ganesh, R.; Sockalingam, S.; Haque, B.Z.; Gillespie, J.W. Strain rate-dependent large deformation inelastic behavior of an epoxy resin. Journal of Composite Materials 2020, 54, 71–87. [Google Scholar] [CrossRef]
- Yang, Y.; Yu, J.; Xu, H.; Sun, B. Porous lightweight composites reinforced with fibrous structures; Springer: Berlin, 2017.
- Broughton Jr, R.M.; Mogahzy Jr, Y.E.; Hall Jr, D. Mechanism of yarn failure. Textile research journal 1992, 62, 131–134. [Google Scholar] [CrossRef]
- Wang, Y.; Miao, Y.; Huang, L.; Swenson, D.; Yen, C.-F.; Yu, J.; Zheng, J.Q. Effect of the inter-fiber friction on fiber damage propagation and ballistic limit of 2-D woven fabrics under a fully confined boundary condition. International Journal of Impact Engineering 2016, 97, 66–78. [Google Scholar] [CrossRef]
- Briscoe, B.; Motamedi, F. The ballistic impact characteristics of aramid fabrics: the influence of interface friction. Wear 1992, 158, 229–247. [Google Scholar] [CrossRef]
- Ahmed, A.; Zillur Rahman, M.; Ou, Y.; Liu, S.; Mobasher, B.; Guo, S.; Zhu, D. A review on the tensile behavior of fiber-reinforced polymer composites under varying strain rates and temperatures. Construction and Building Materials 2021, 294, 123565. [Google Scholar] [CrossRef]
- Gilat, A.; Goldberg, R.K.; Roberts, G.D. Strain rate sensitivity of epoxy resin in tensile and shear loading. Journal of Aerospace Engineering 2007, 20, 75–89. [Google Scholar] [CrossRef]
- Fitoussi, J.; Bocquet, M.; Meraghni, F. Effect of the matrix behavior on the damage of ethylene–propylene glass fiber reinforced composite subjected to high strain rate tension. Composites Part B: Engineering 2013, 45, 1181–1191. [Google Scholar] [CrossRef]
- Xu, X.; Rawat, P.; Shi, Y.; Zhu, D. Tensile mechanical properties of basalt fiber reinforced polymer tendons at low to intermediate strain rates. Composites Part B: Engineering 2019, 177, 107442. [Google Scholar] [CrossRef]
- Chen, W.; Hao, H.; Jong, M.; Cui, J.; Shi, Y.; Chen, L.; Pham, T.M. Quasi-static and dynamic tensile properties of basalt fibre reinforced polymer. Composites Part B: Engineering 2017, 125, 123–133. [Google Scholar] [CrossRef]
- Kessler, E.; Gadow, R.; Straub, J. Basalt, glass and carbon fibers and their fiber reinforced polymer composites under thermal and mechanical load. AIMS Materials Science 2016, 3, 1561–1576. [Google Scholar] [CrossRef]
- Hearle, J. Forms of fibre fracture. In Fiber fracture, Elices, M., Llorca, J., Eds.; Elsevier: Oxford, 2002; pp. 57-71.
- Greenhalgh, E. Failure analysis and fractography of polymer composites; Elsevier: Oxford, 2009.
- Taniguchi, N.; Nishiwaki, T.; Hirayama, N.; Nishida, H.; Kawada, H. Dynamic tensile properties of carbon fiber composite based on thermoplastic epoxy resin loaded in matrix-dominant directions. Composites Science and Technology 2009, 69, 207–213. [Google Scholar] [CrossRef]
- Judd, N.C.W.; Wright, W.W. Voids and their effects on the mechanical properties of composites - An Appraisal. SAMPE Journal 1978, 14, 10–14. [Google Scholar]
- Gaylord, M. Reinforced plastics: Theory and practice; Cahners Books: Boston, 1974.
- Zhang, Z.; Hartwig, G. Relation of damping and fatigue damage of unidirectional fibre composites. International journal of fatigue 2002, 24, 713–718. [Google Scholar] [CrossRef]
- Deng, S.; Ye, L. Influence of fibre-matrix adhesion on mechanical properties of graphite/epoxy composites: III. Impact and dynamic mechanical properties. Journal of reinforced plastics and composites 2000, 19, 689–703. [Google Scholar] [CrossRef]
- Alderliesten, R. Critical review on the assessment of fatigue and fracture in composite materials and structures. Engineering Failure Analysis 2013, 35, 370–379. [Google Scholar] [CrossRef]
- Marat-Mendes, R.; de Freitas, M. Characterization of Delamination Fracture Surfaces Under Mixed Mode Loading. In Proceedings of the Iberian Conference on Fracture and Structural Integrity, Porto, Portugal, 2010.
Figure 1.
(a) Photo of the basalt grid with three rovings in the warp direction (dimension in mm); (b) x100 magnified cross-section A-A of a warp roving; (c) x500 section view of warp roving.
Figure 1.
(a) Photo of the basalt grid with three rovings in the warp direction (dimension in mm); (b) x100 magnified cross-section A-A of a warp roving; (c) x500 section view of warp roving.
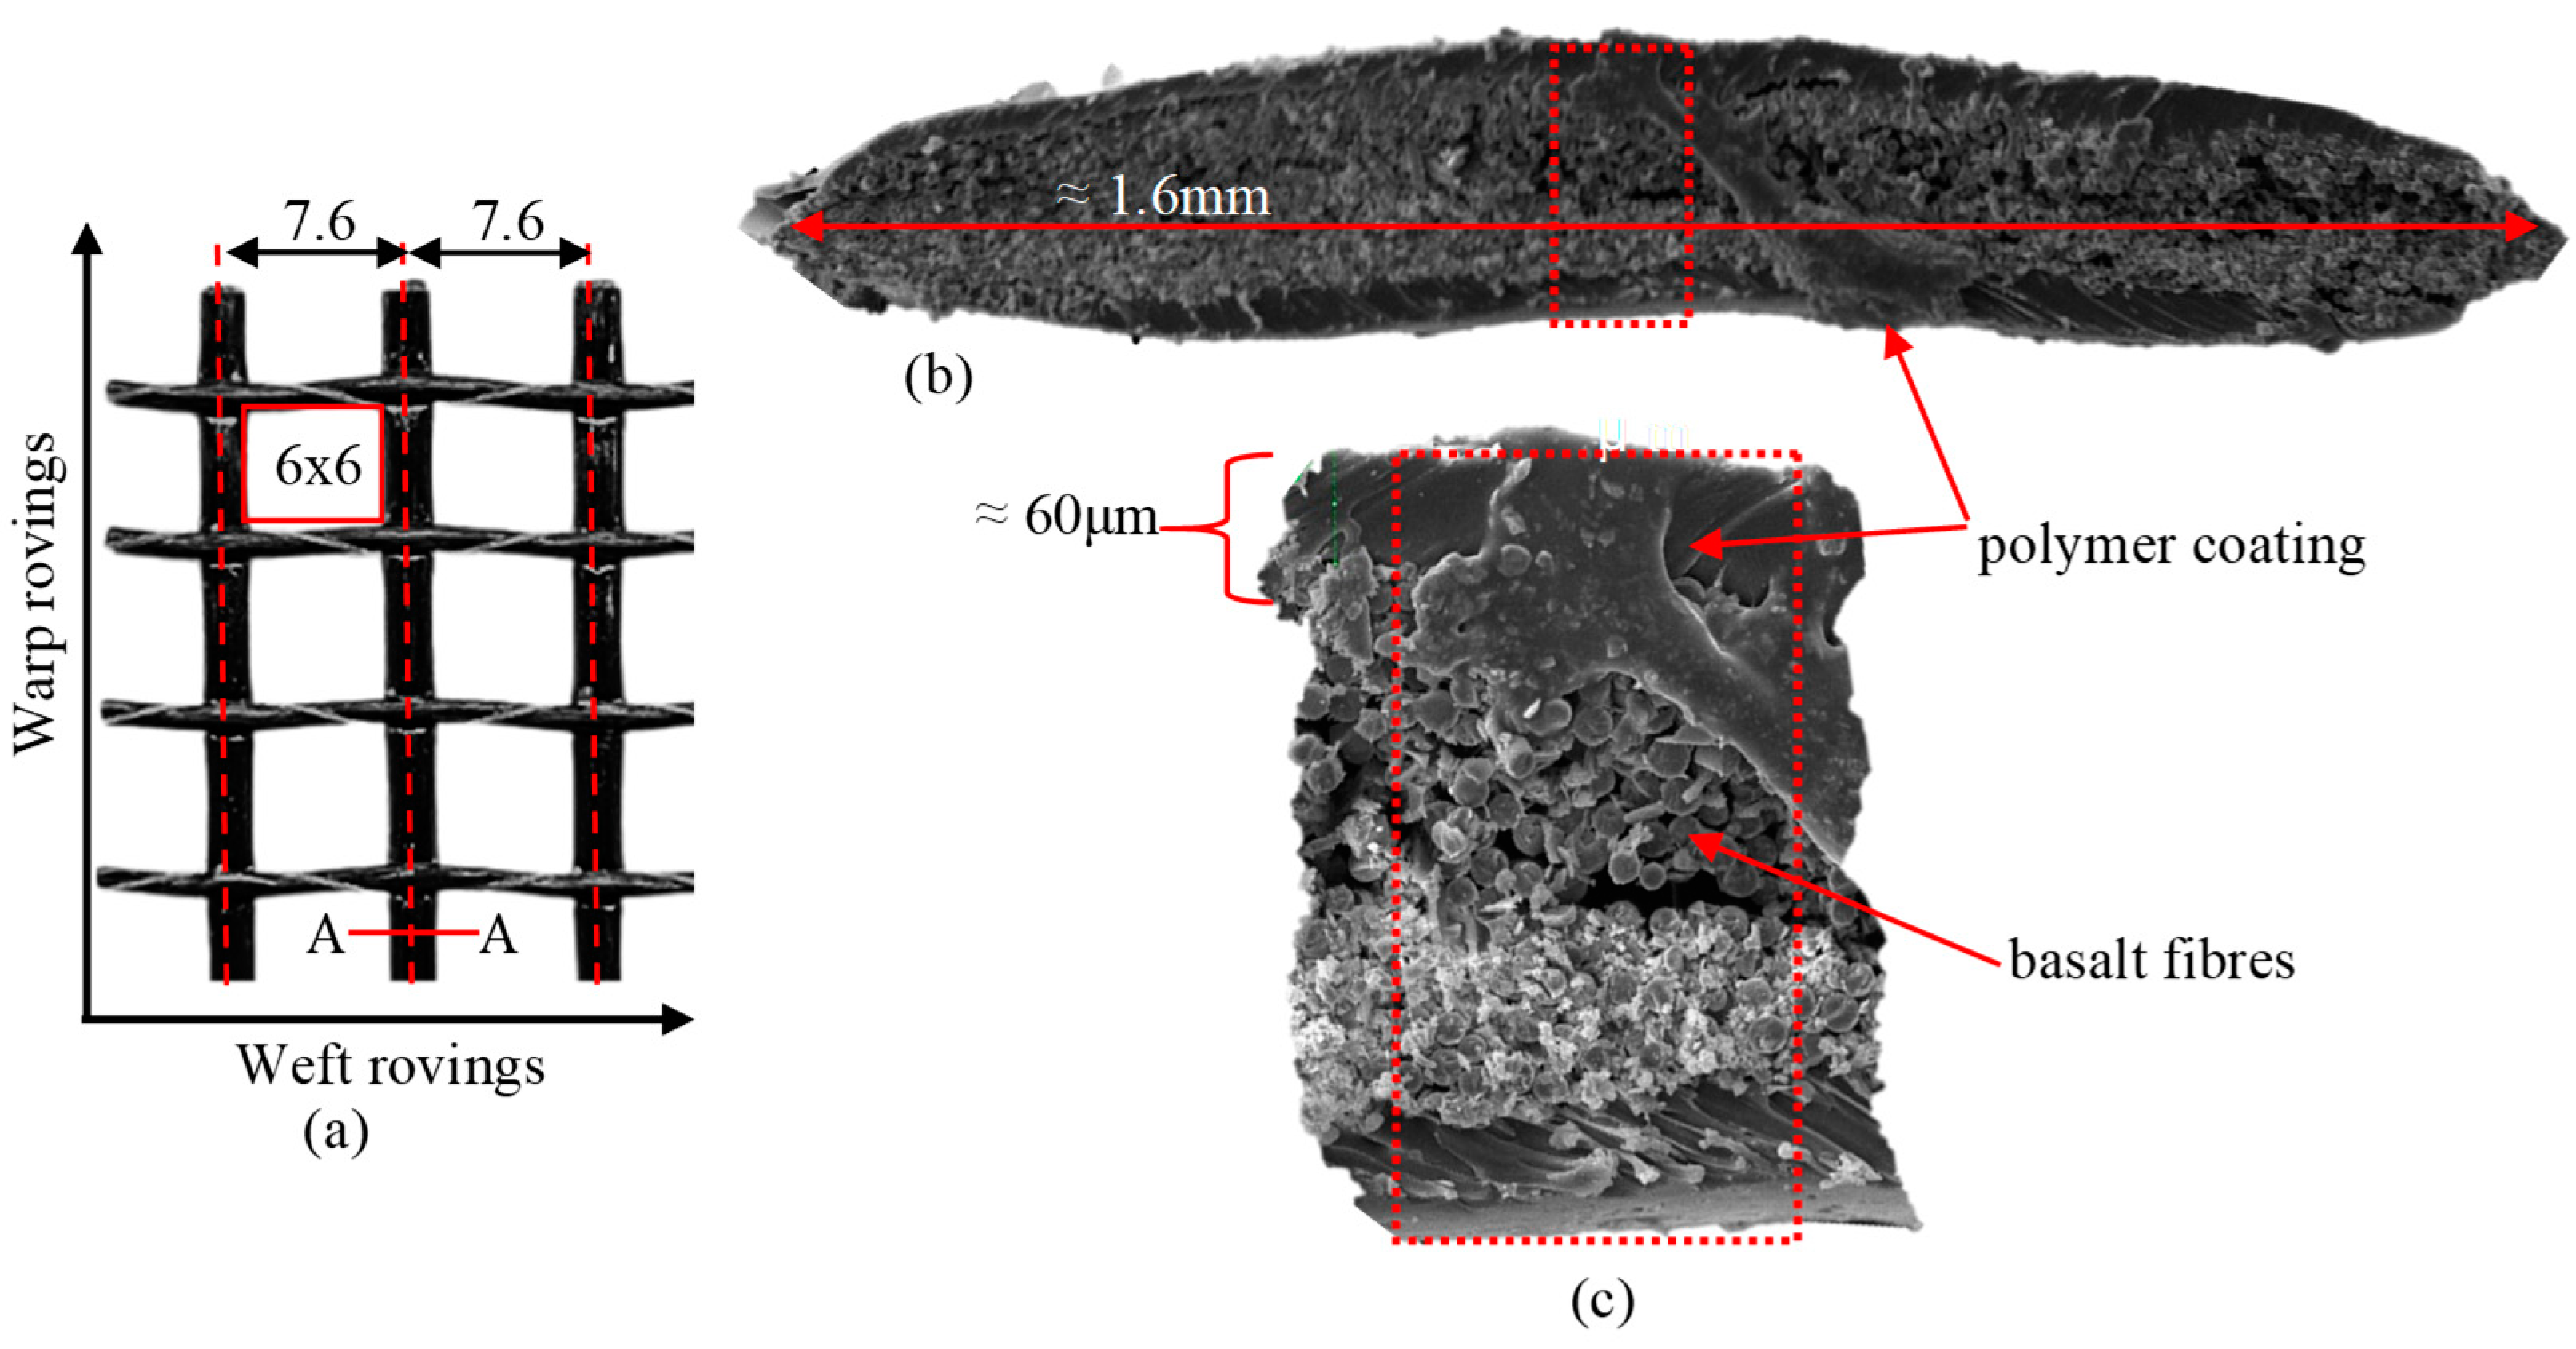
Figure 2.
Front view, side view and failure modes of the basalt grid specimens tested with (a) clamp grips; (b) specialised grips 1 (SG1); (c) SG1 with rubber; (d) specialised grips 2 (SG2).
Figure 2.
Front view, side view and failure modes of the basalt grid specimens tested with (a) clamp grips; (b) specialised grips 1 (SG1); (c) SG1 with rubber; (d) specialised grips 2 (SG2).
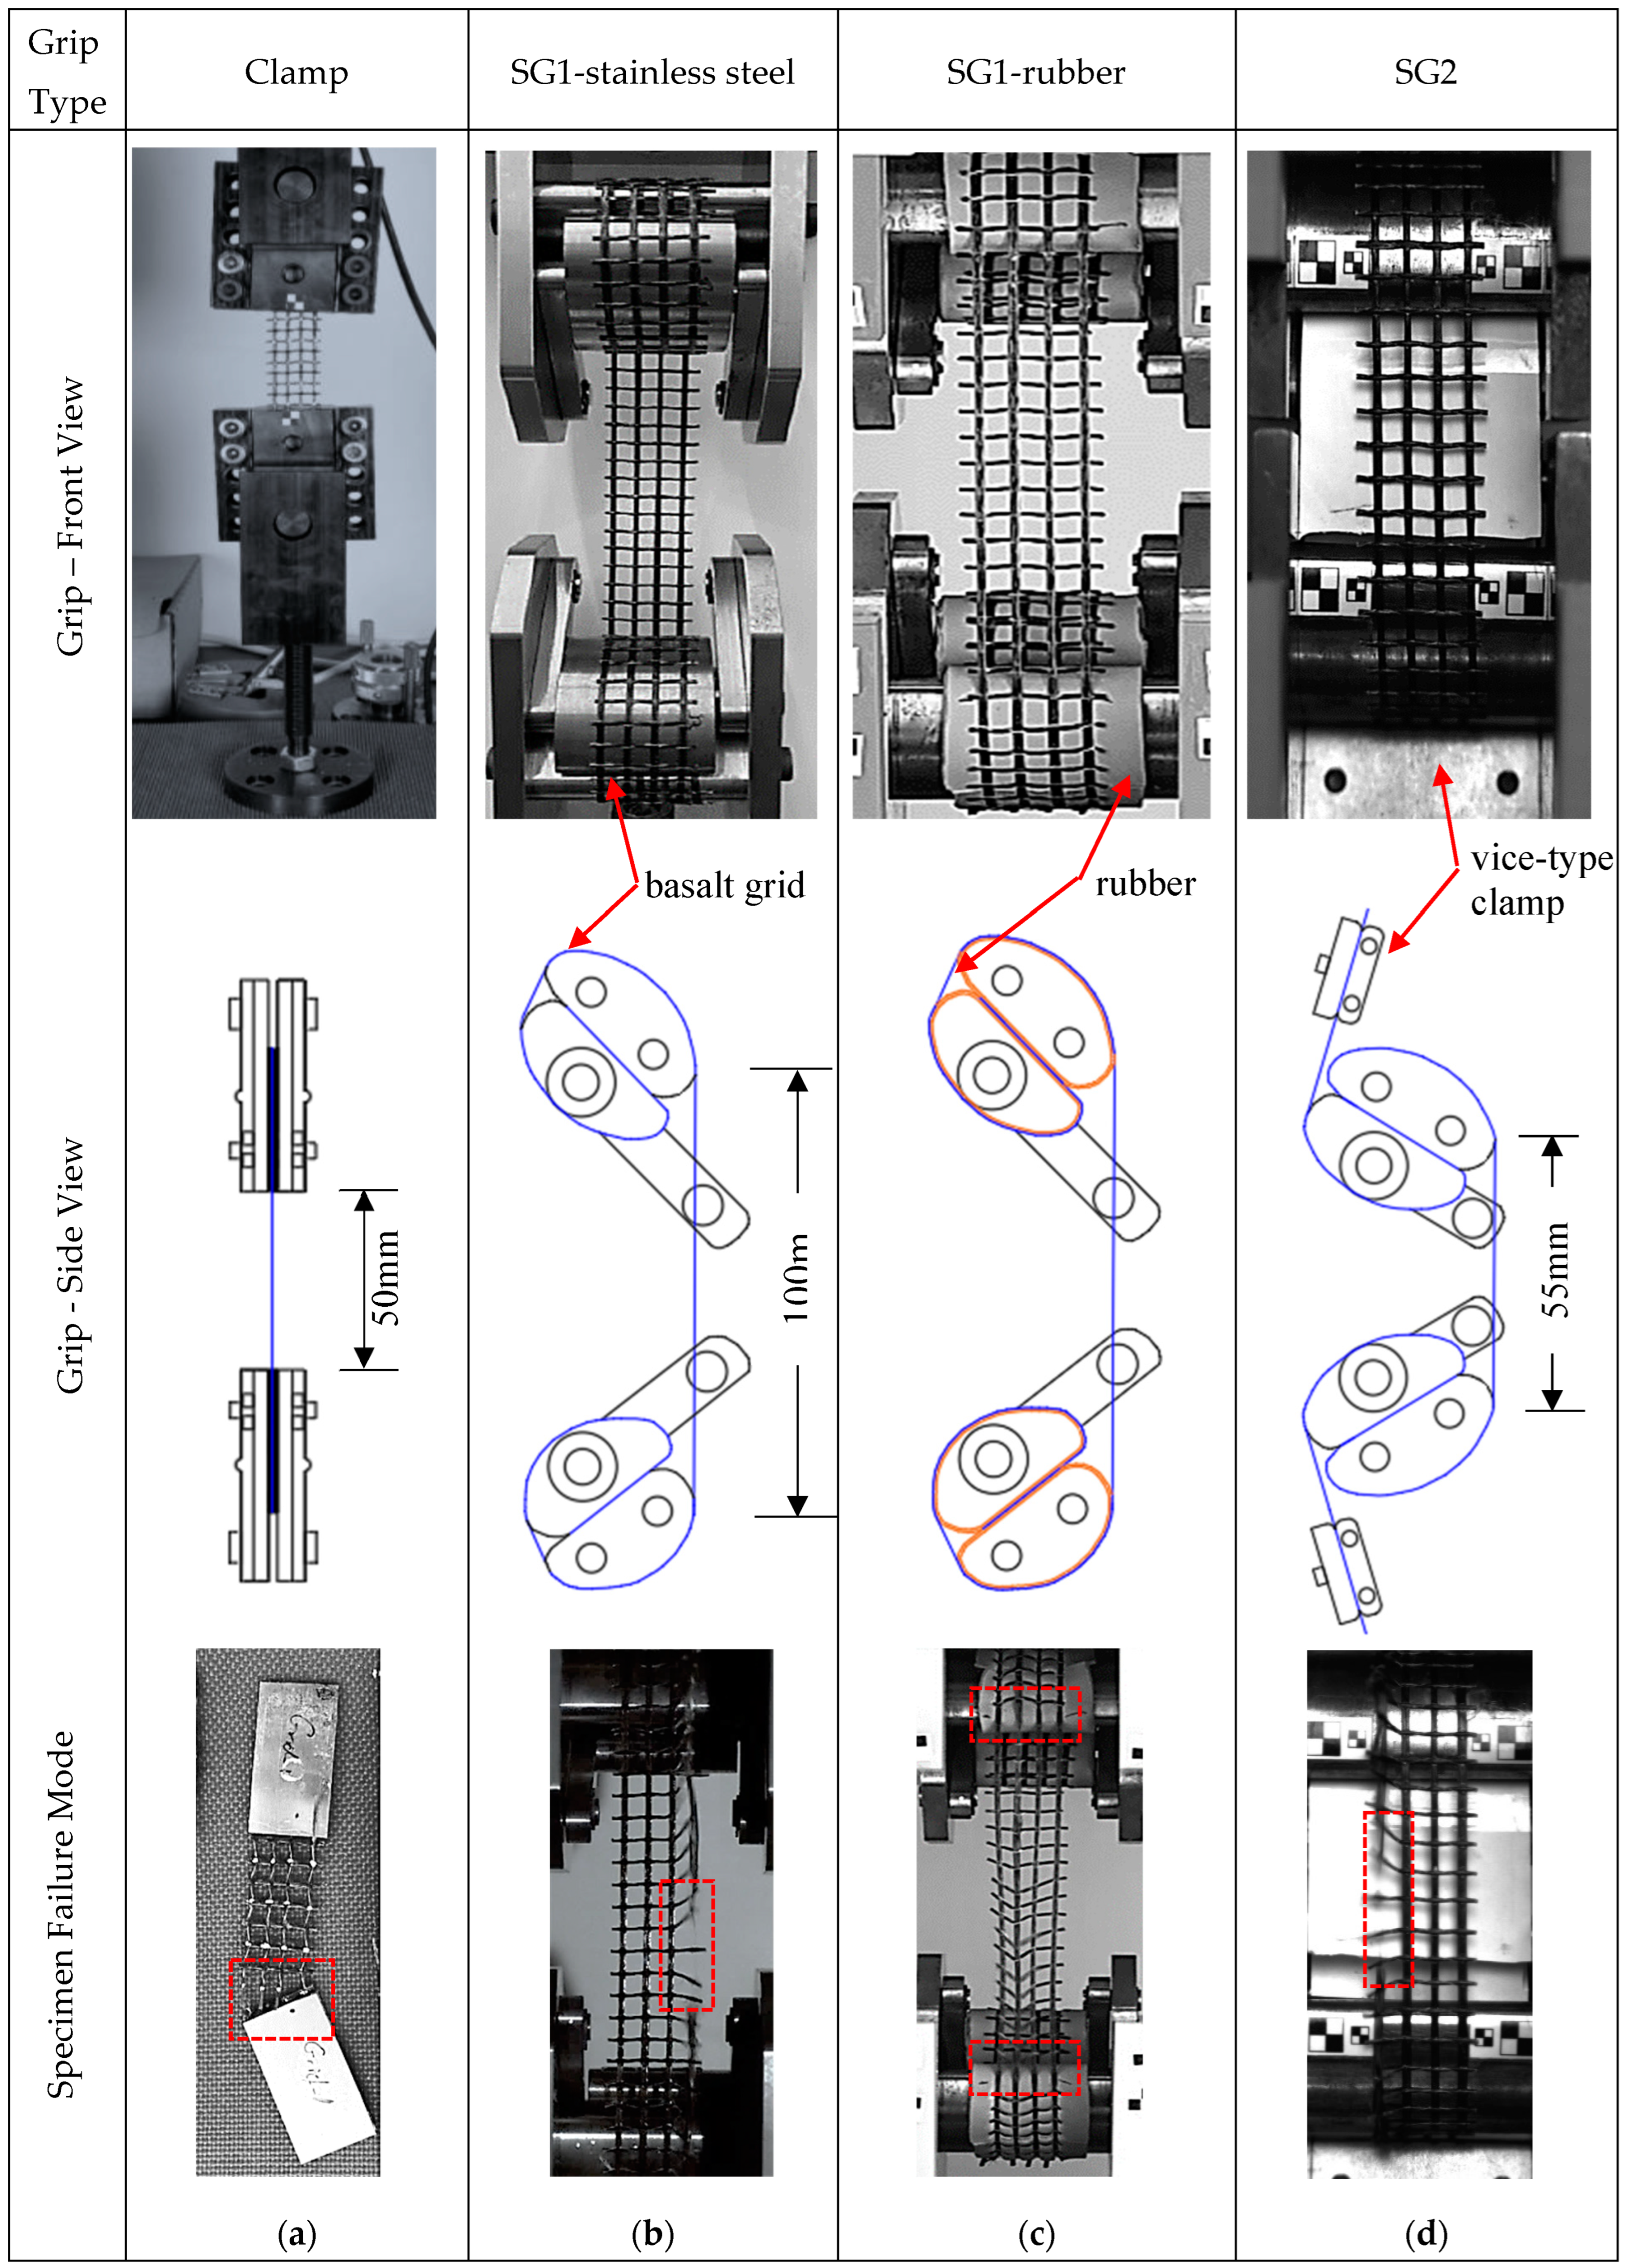
Figure 3.
Four virtual extensometers on the grid specimen used to determine strain: (a) initial frame; (b) frame at maximum tensile load.
Figure 3.
Four virtual extensometers on the grid specimen used to determine strain: (a) initial frame; (b) frame at maximum tensile load.
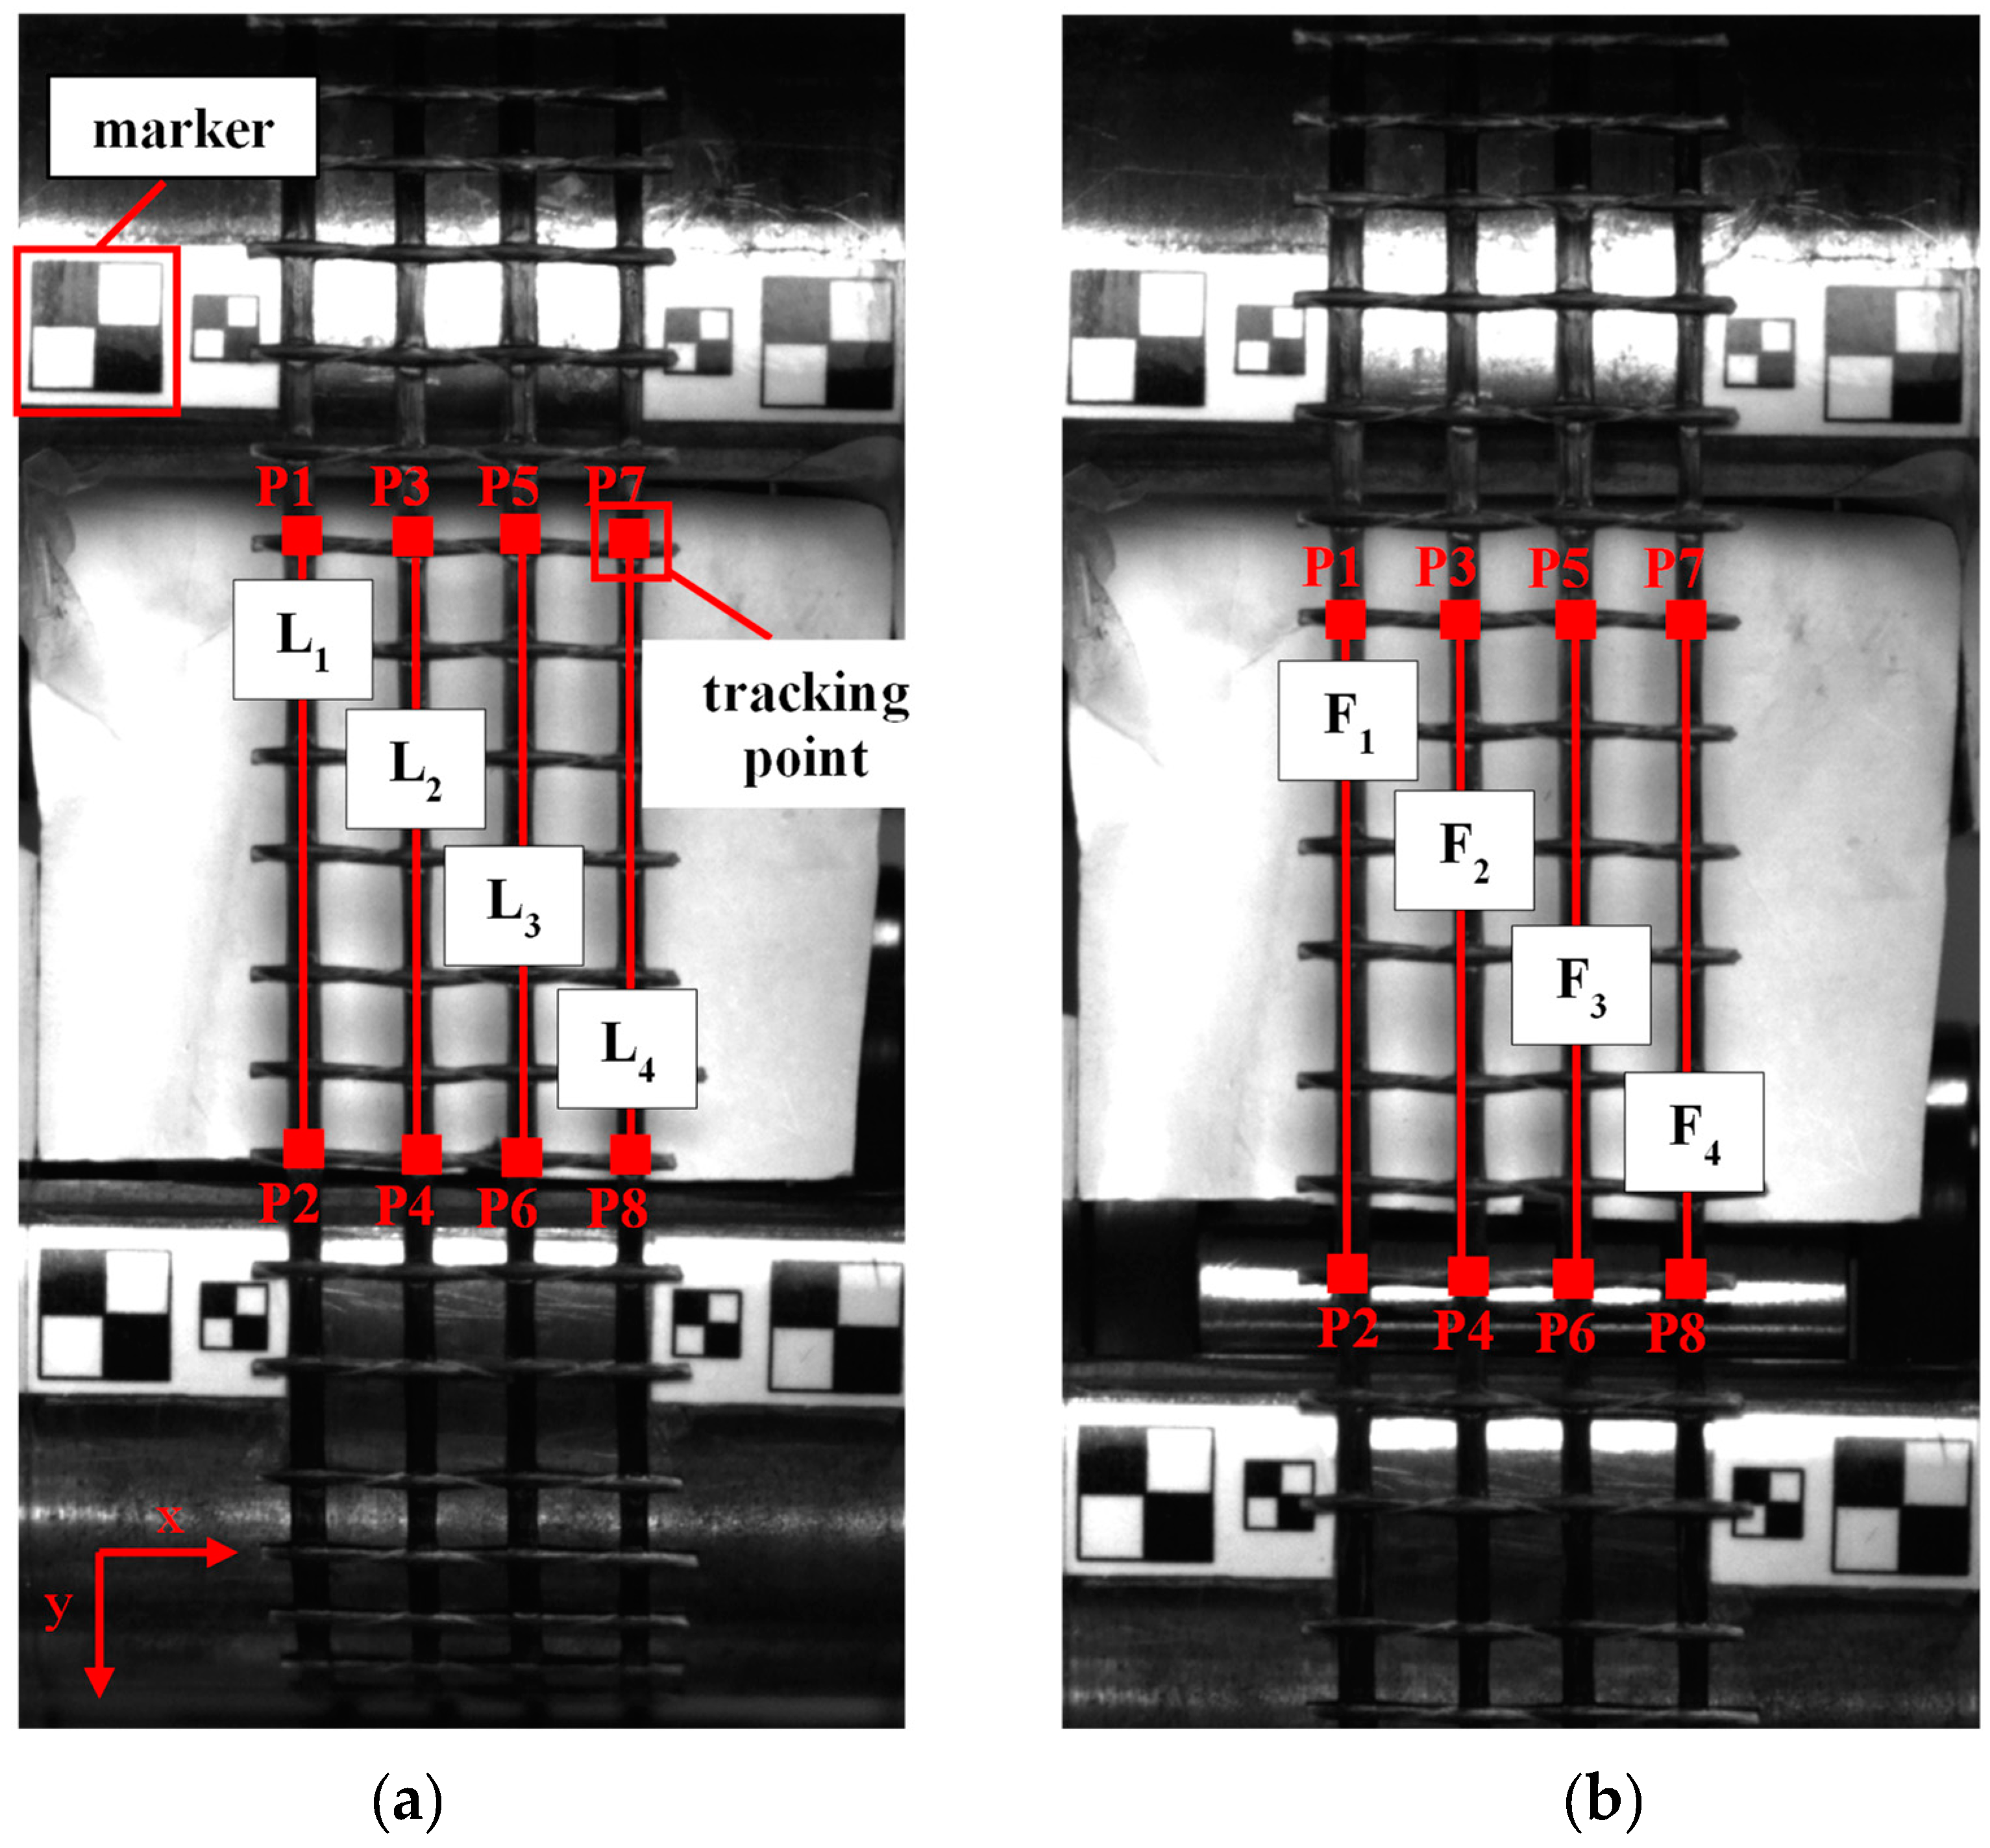
Figure 4.
Stress-strain relationship of the basalt fibre grid at various strain rates: (a) 10-3/s; (b) 1/s; (c) 4/s ;(d) 5/s, (e) 8/s.
Figure 4.
Stress-strain relationship of the basalt fibre grid at various strain rates: (a) 10-3/s; (b) 1/s; (c) 4/s ;(d) 5/s, (e) 8/s.
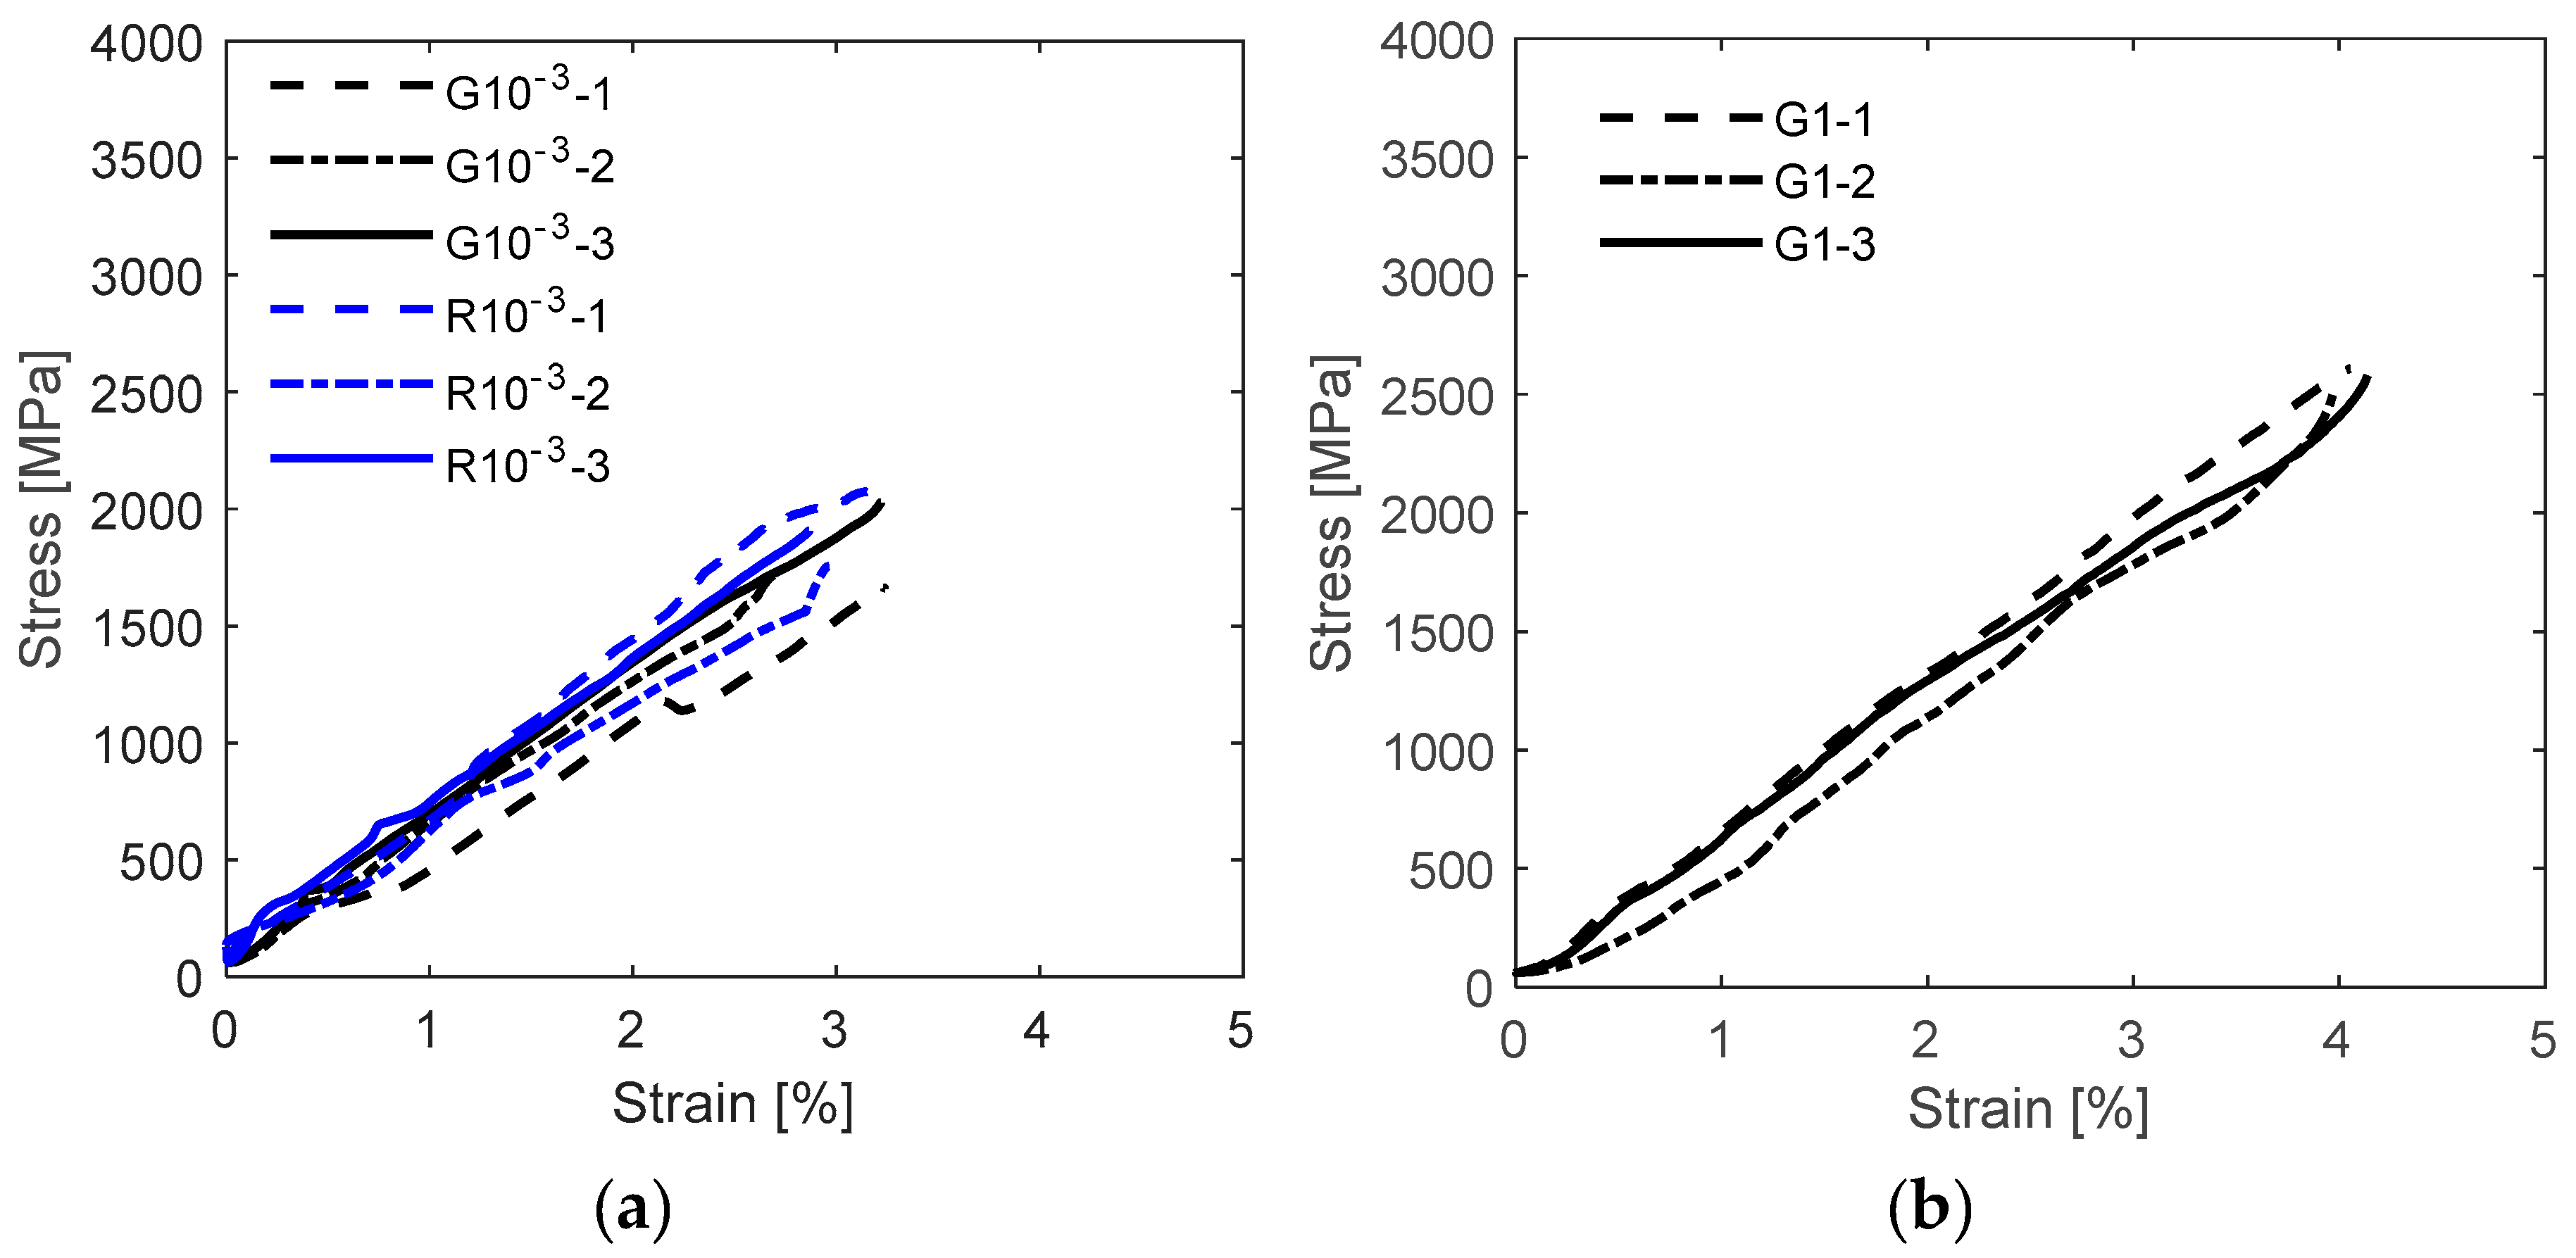
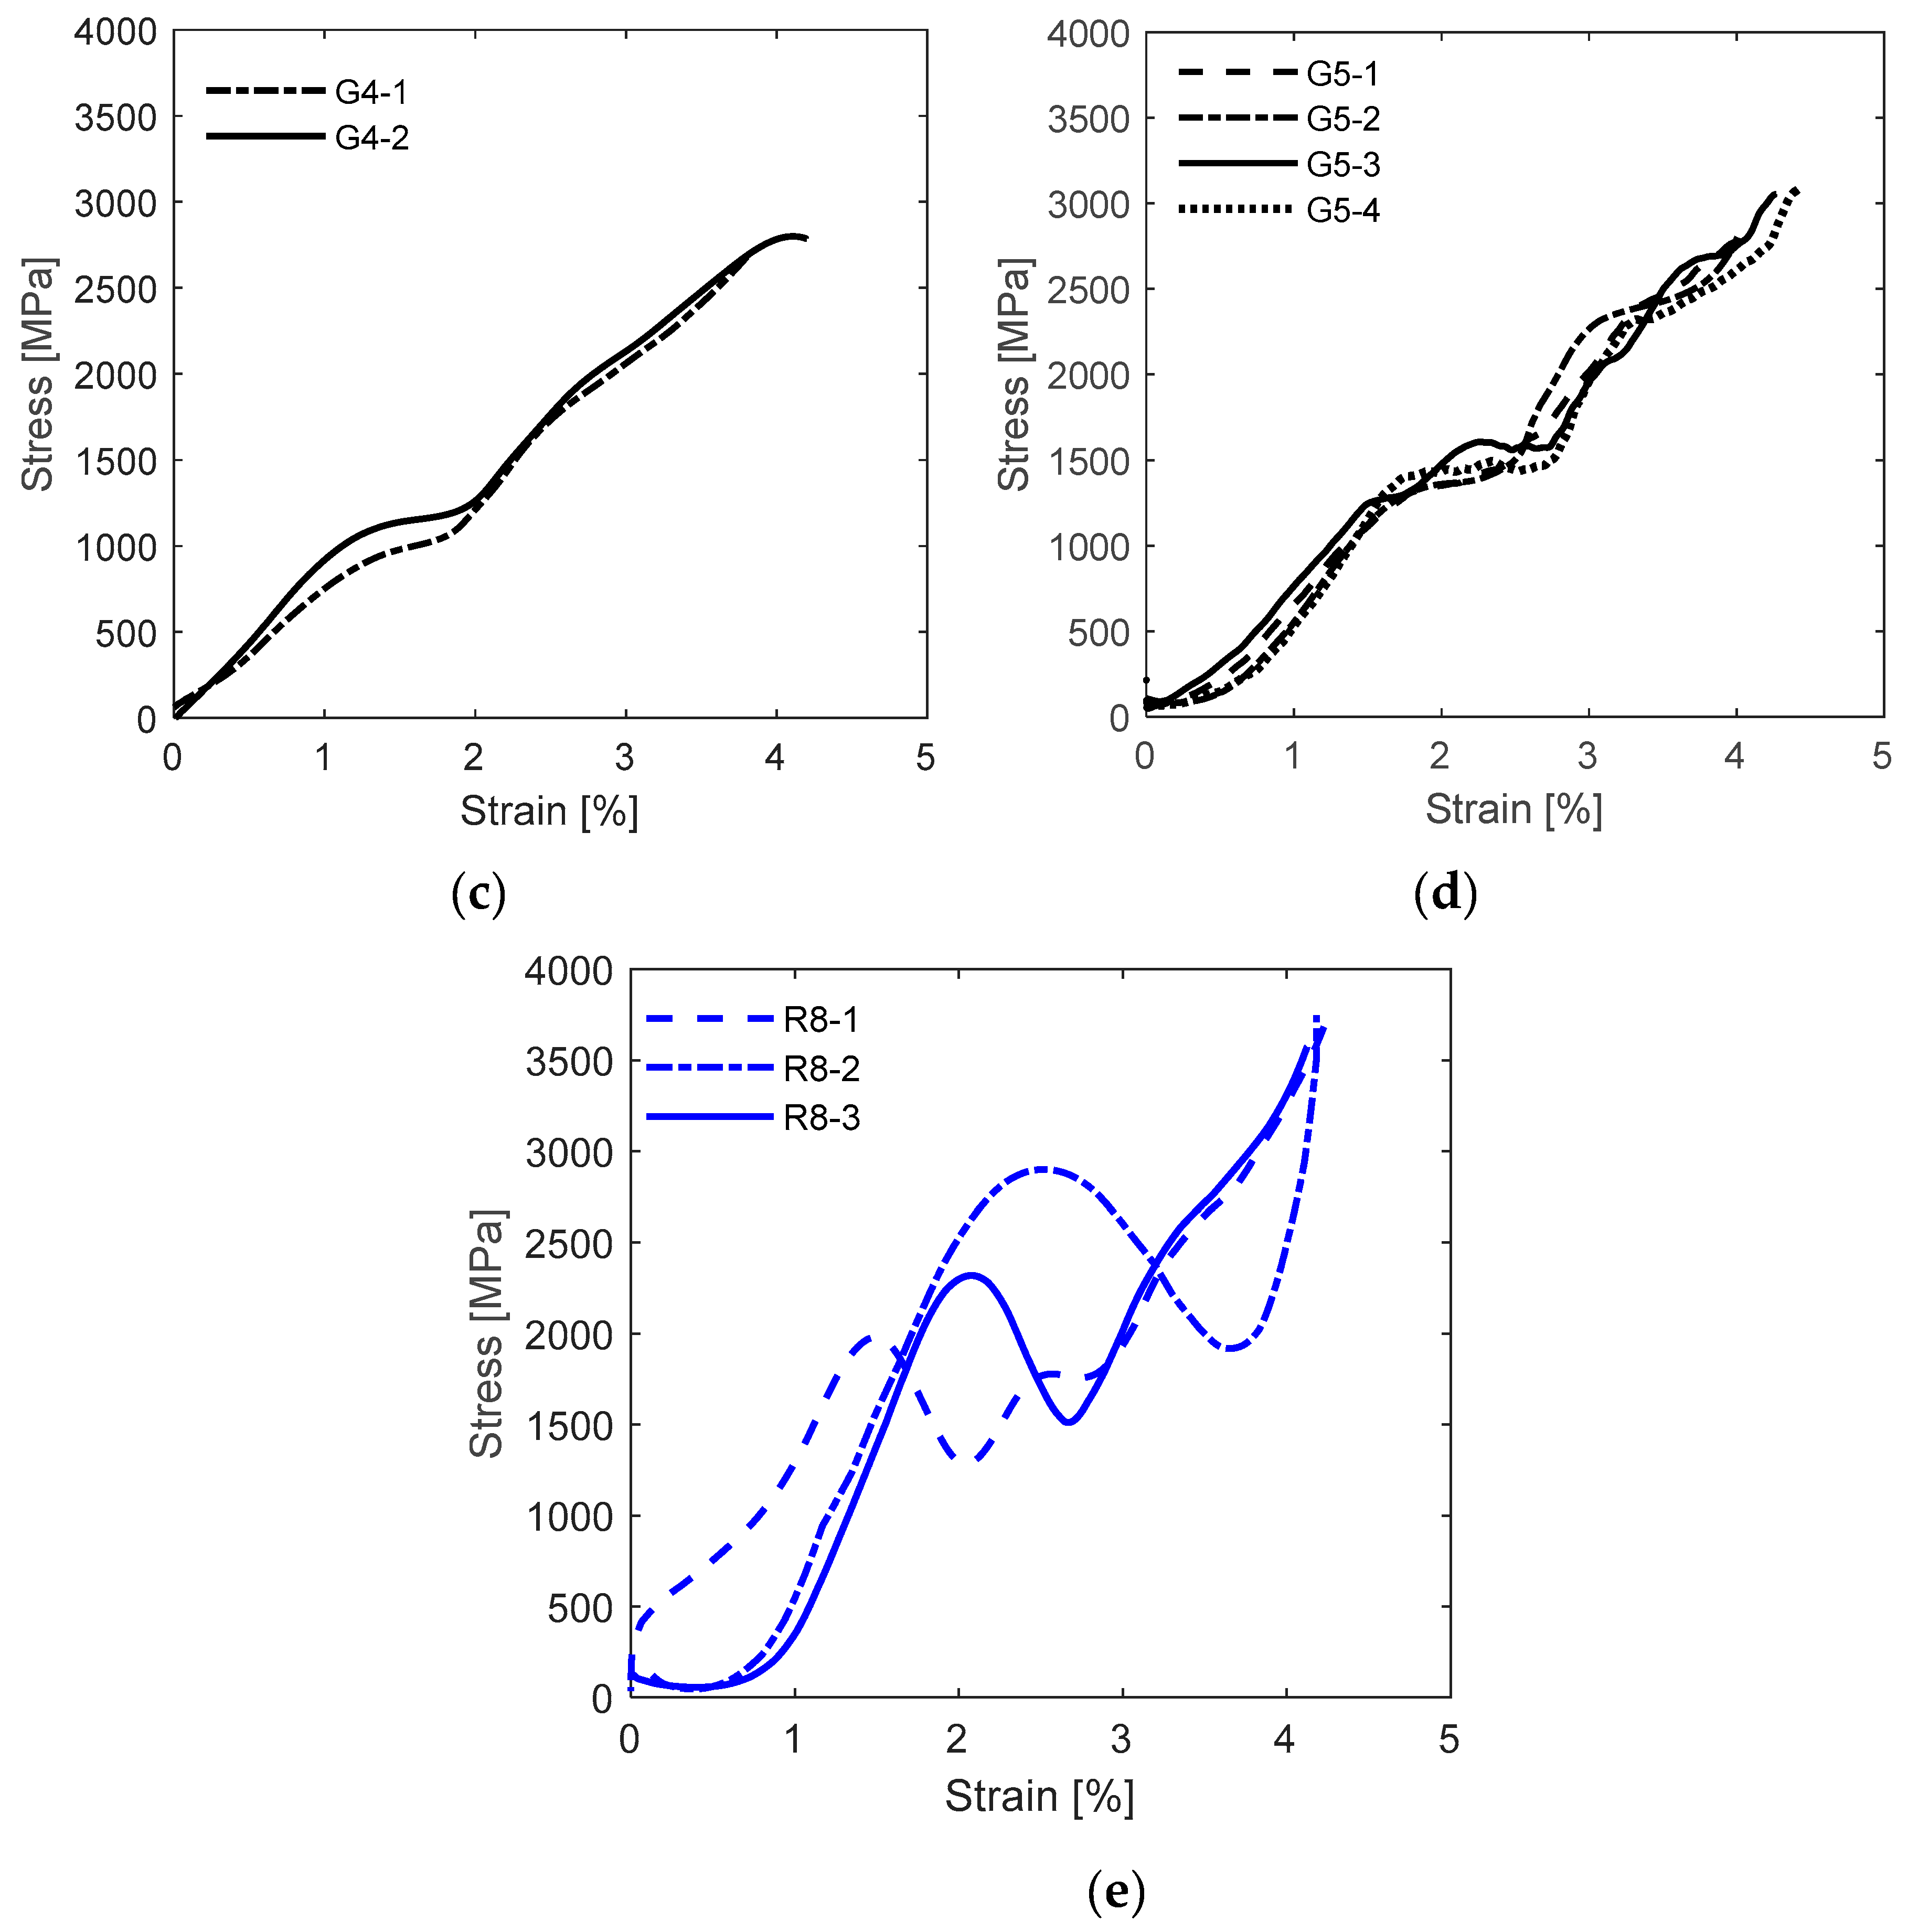
Figure 5.
Schematic stress-strain curves highlighting the points and regions of interest for the different strain rate ranges (a) 10-3 to 1/s; (b) 4/s; (c) 5/s; (d,e) 8/s.
Figure 5.
Schematic stress-strain curves highlighting the points and regions of interest for the different strain rate ranges (a) 10-3 to 1/s; (b) 4/s; (c) 5/s; (d,e) 8/s.
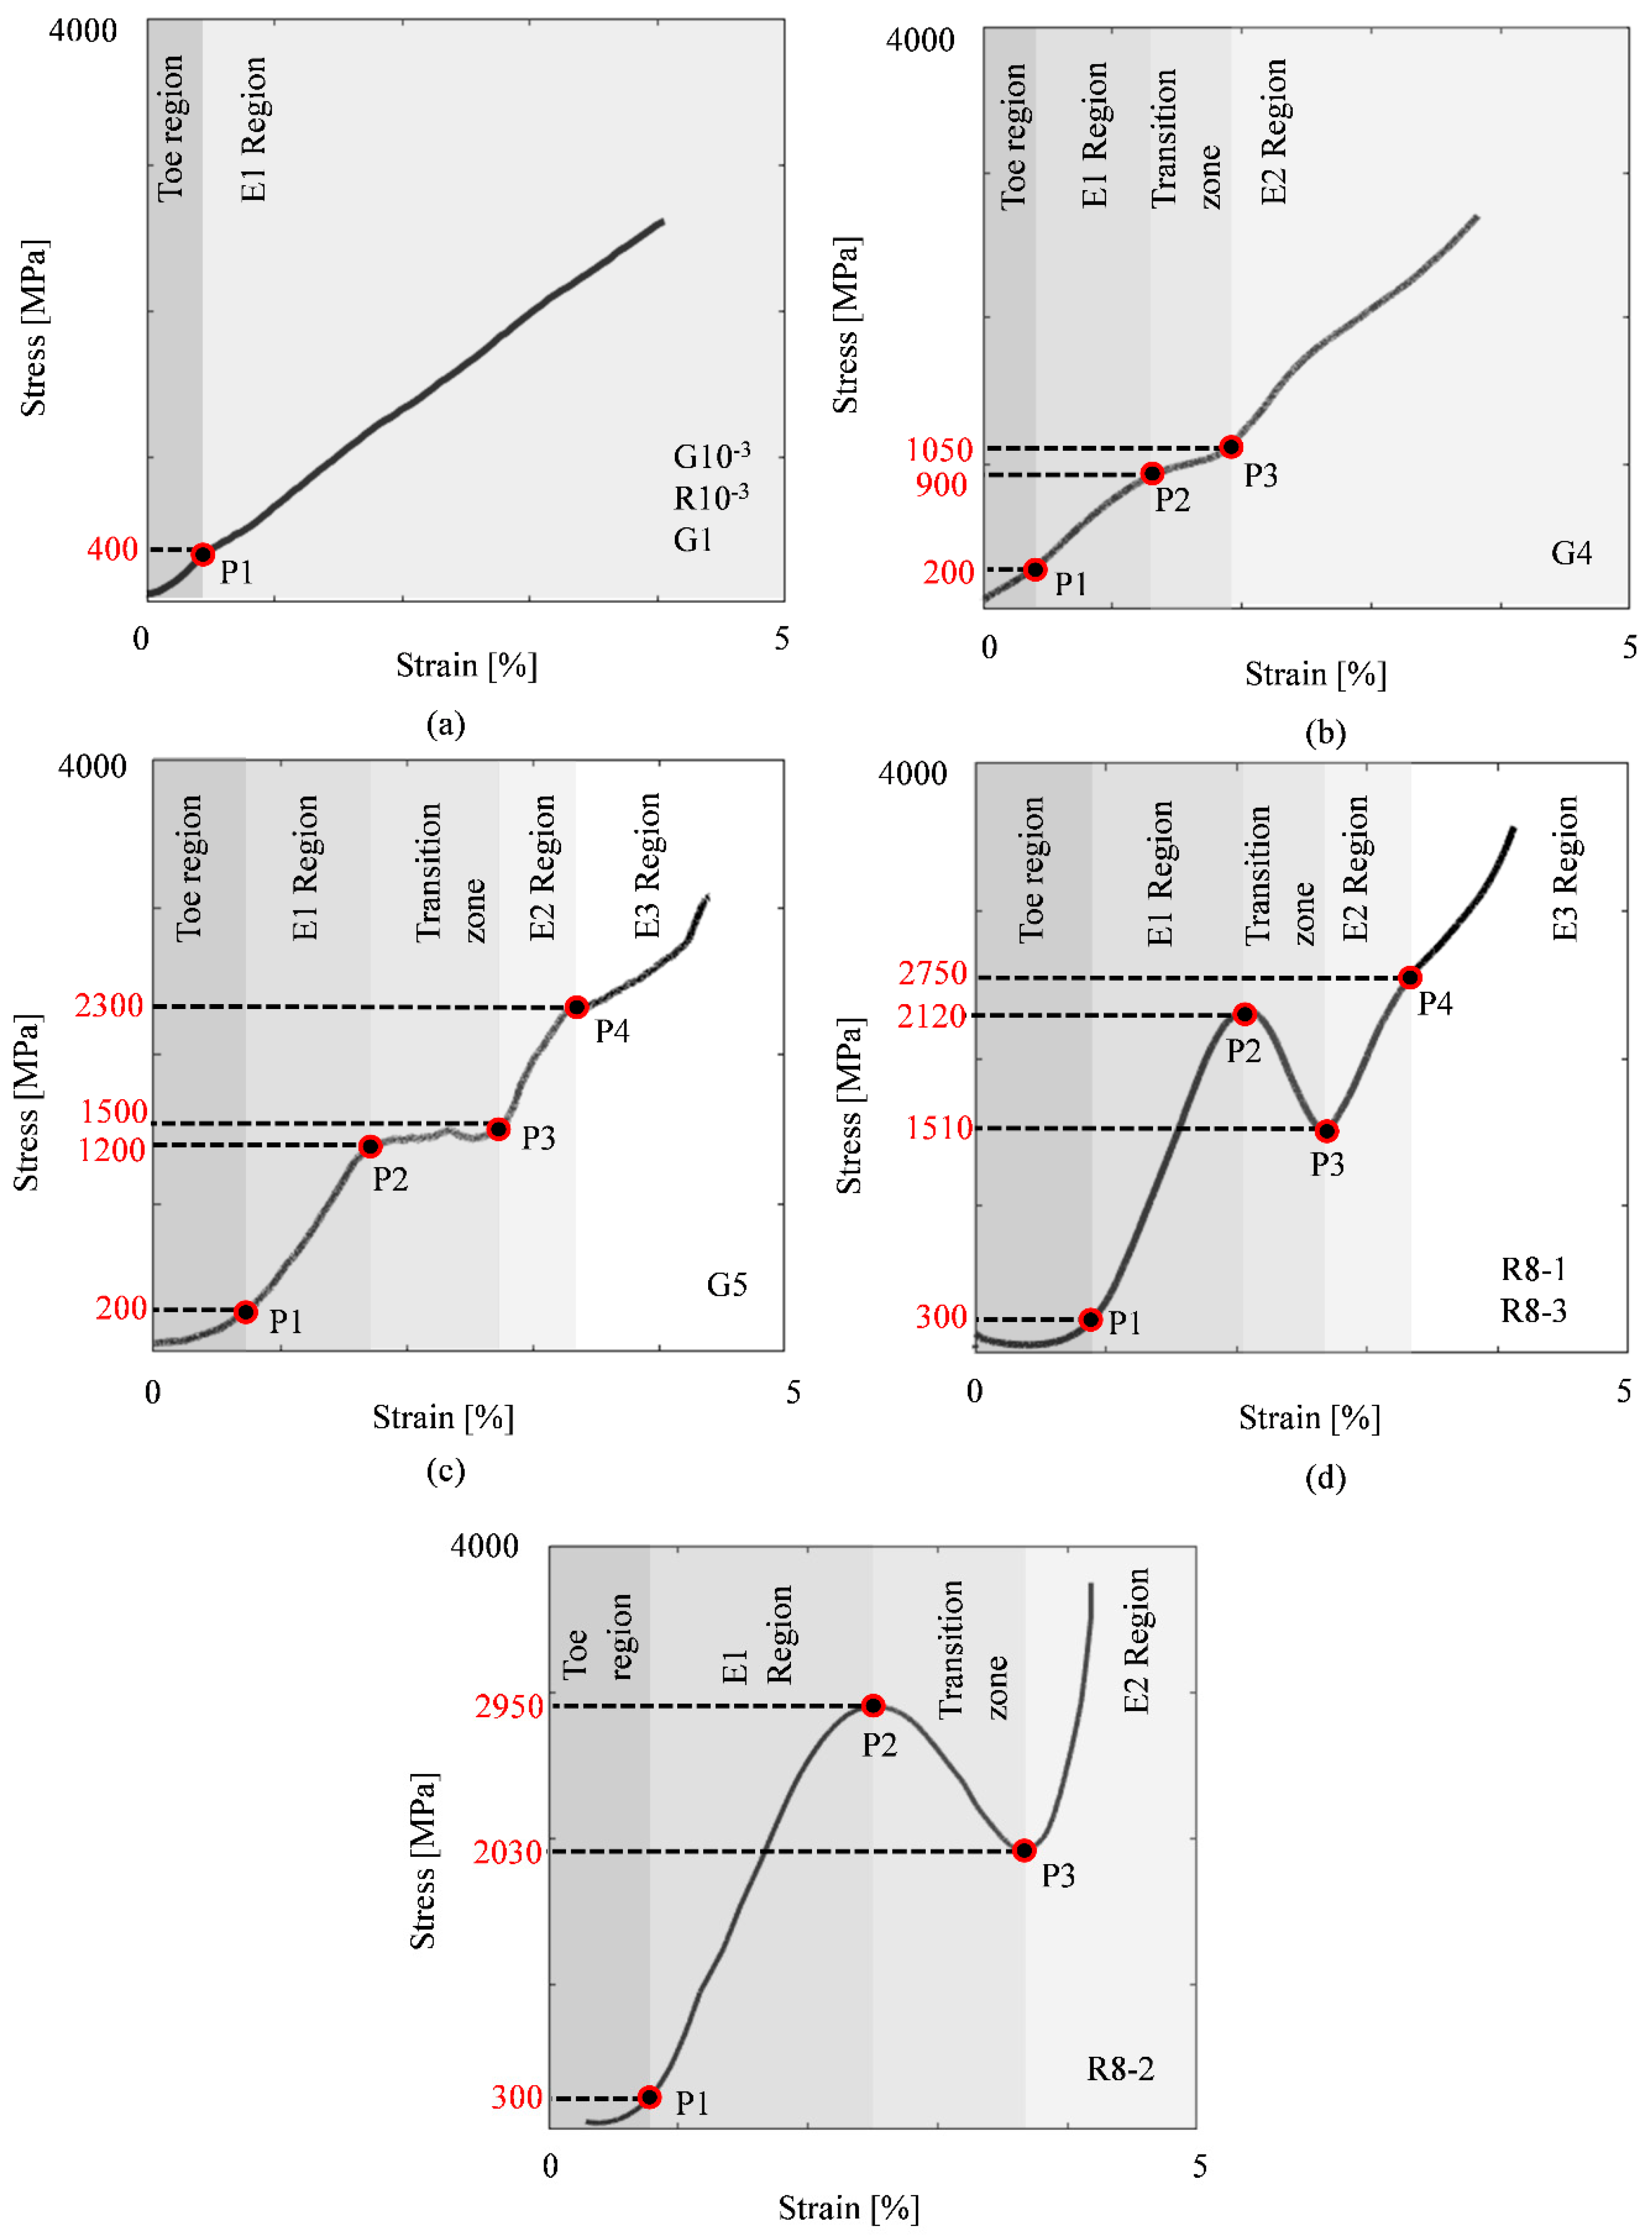
Figure 6.
Specimen misalignment during testing (a) G10-3-1; (b) R8-2.
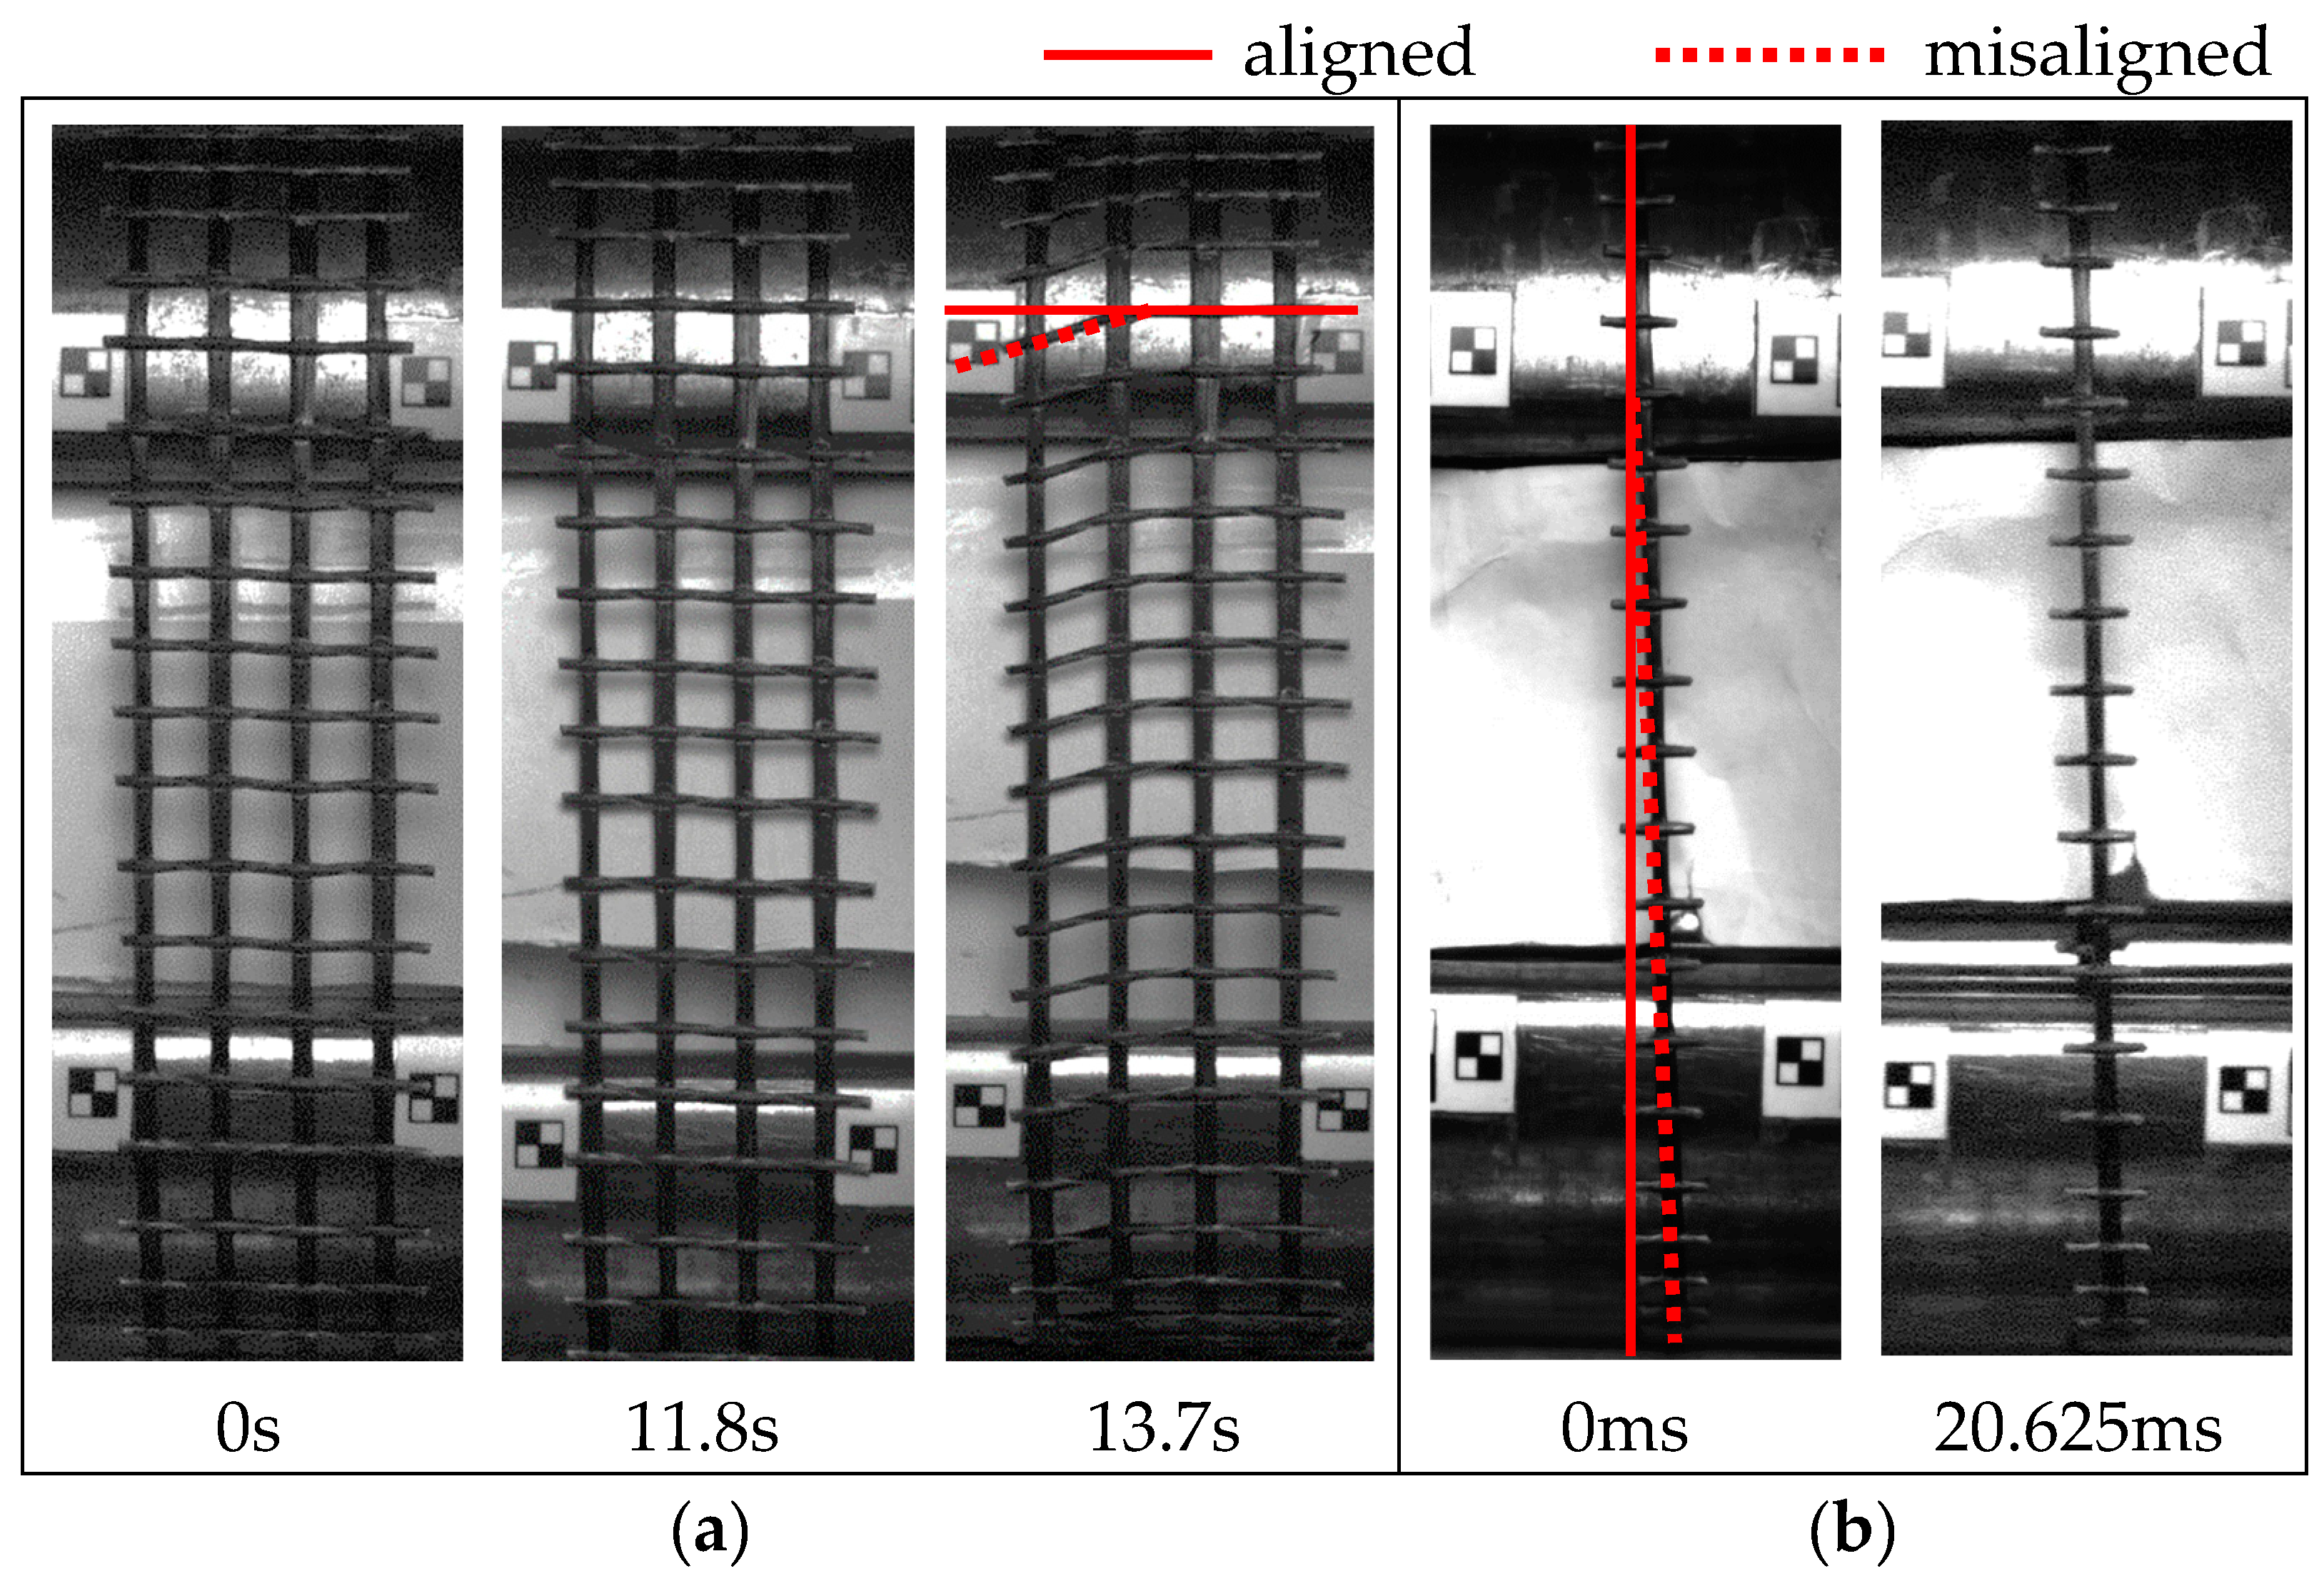
Figure 7.
Effect of strain rate on (a) tensile strength; (b) dynamic increase factor for tensile strength.
Figure 7.
Effect of strain rate on (a) tensile strength; (b) dynamic increase factor for tensile strength.
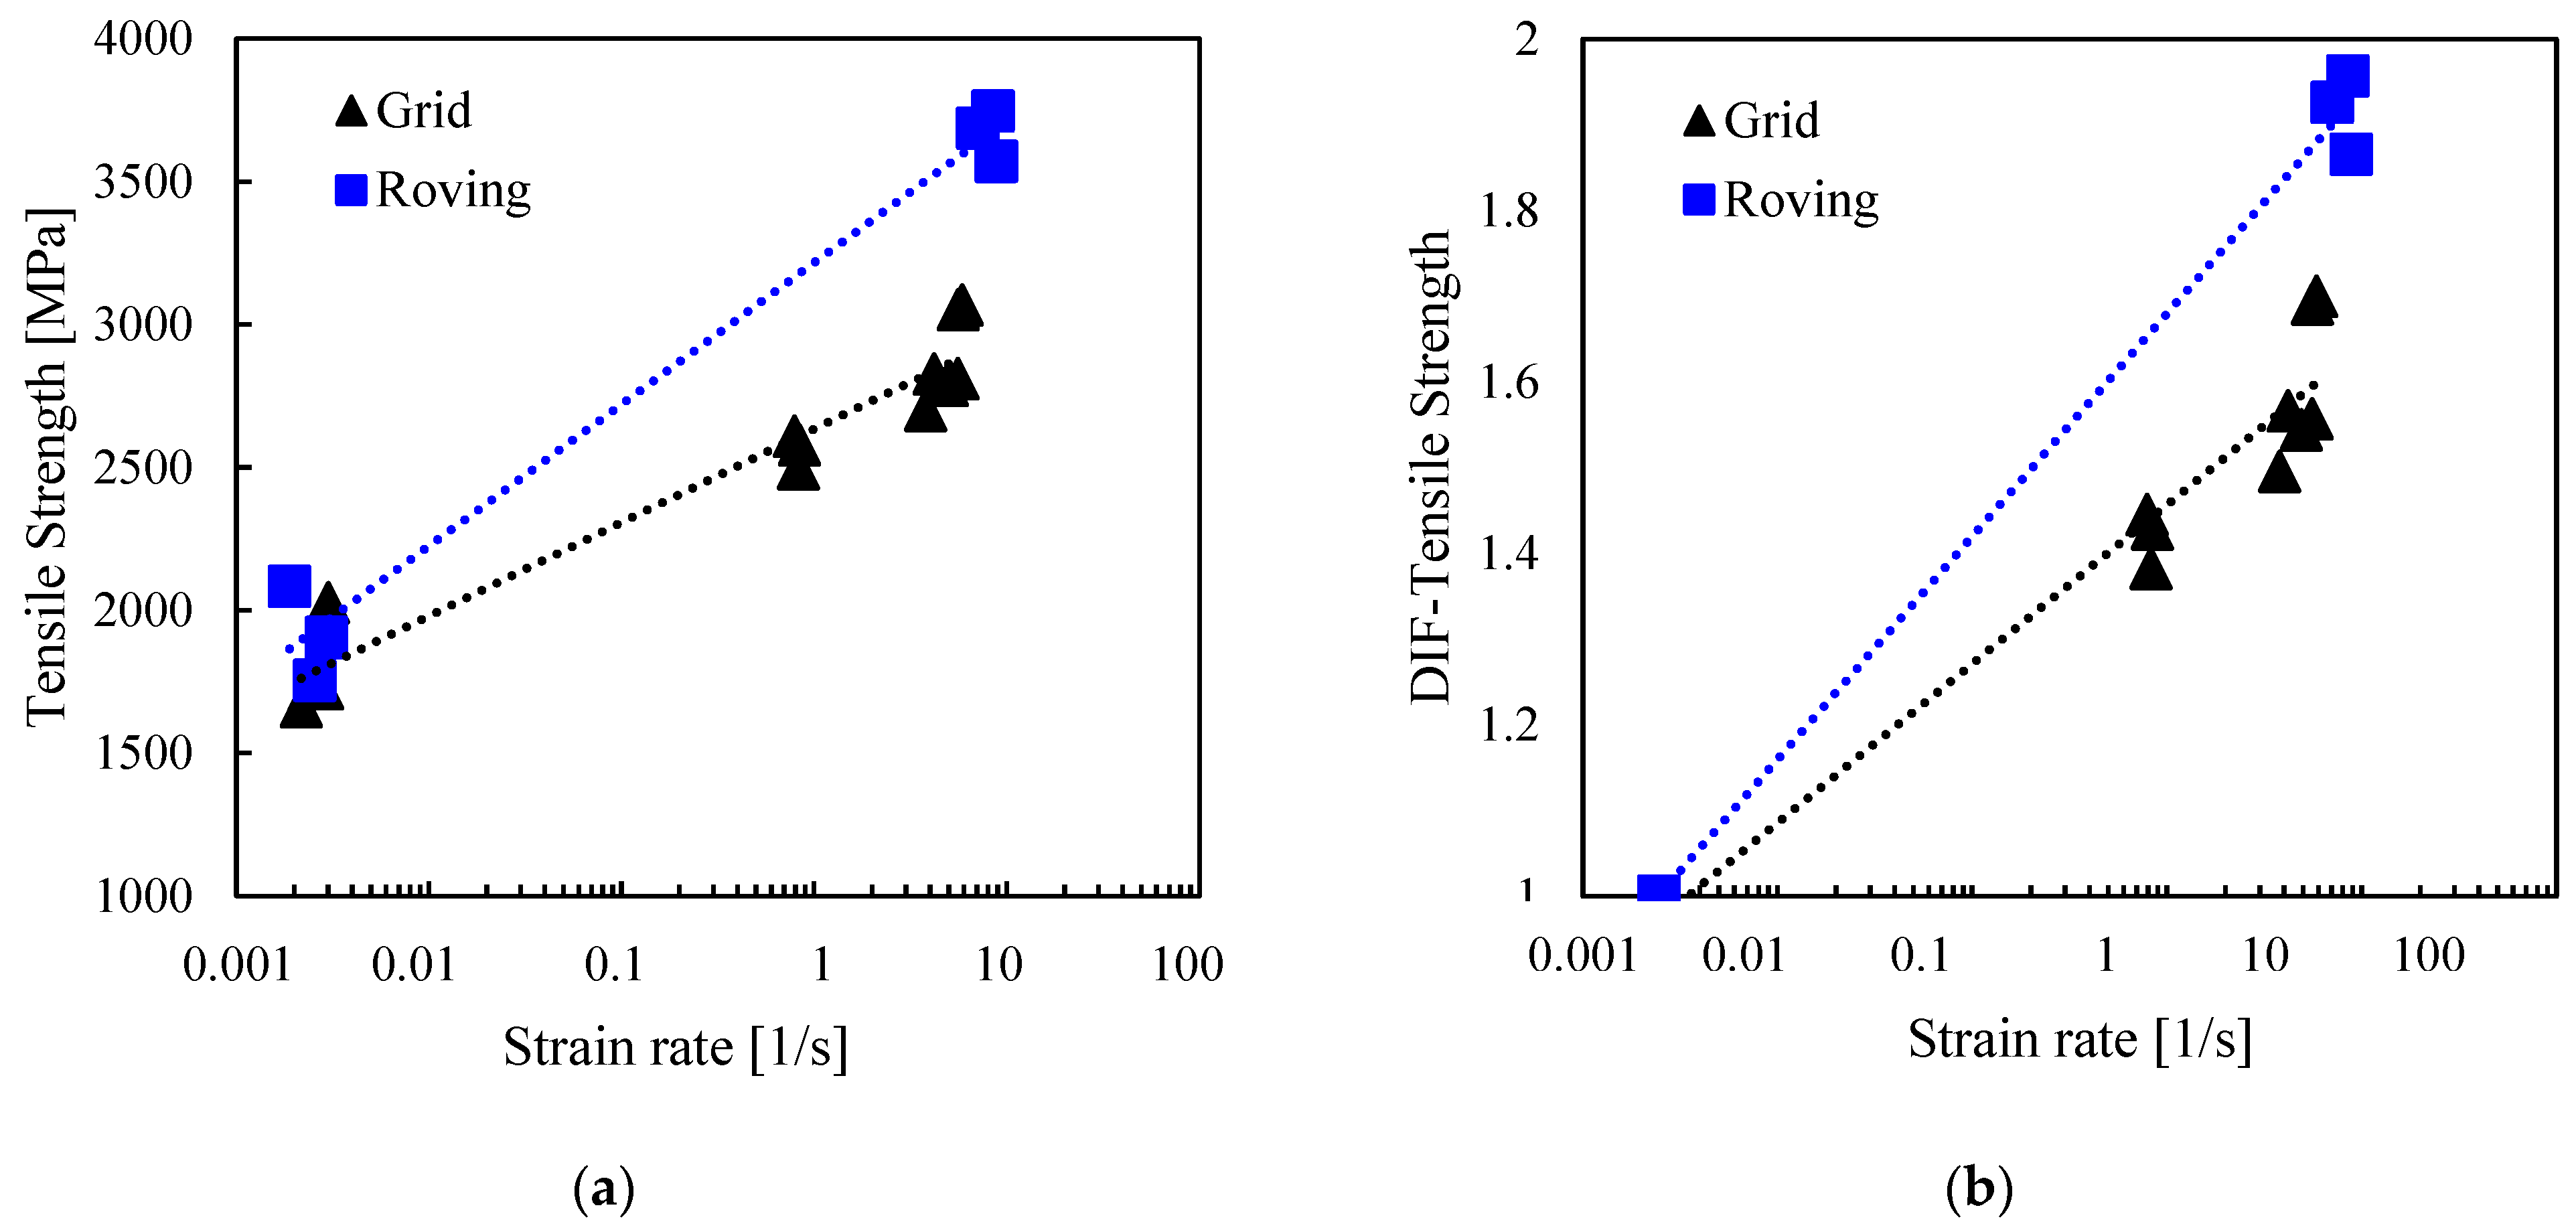
Figure 8.
Effect of strain rate on (a) ultimate strain; (b) dynamic increase factor for ultimate strain.
Figure 8.
Effect of strain rate on (a) ultimate strain; (b) dynamic increase factor for ultimate strain.
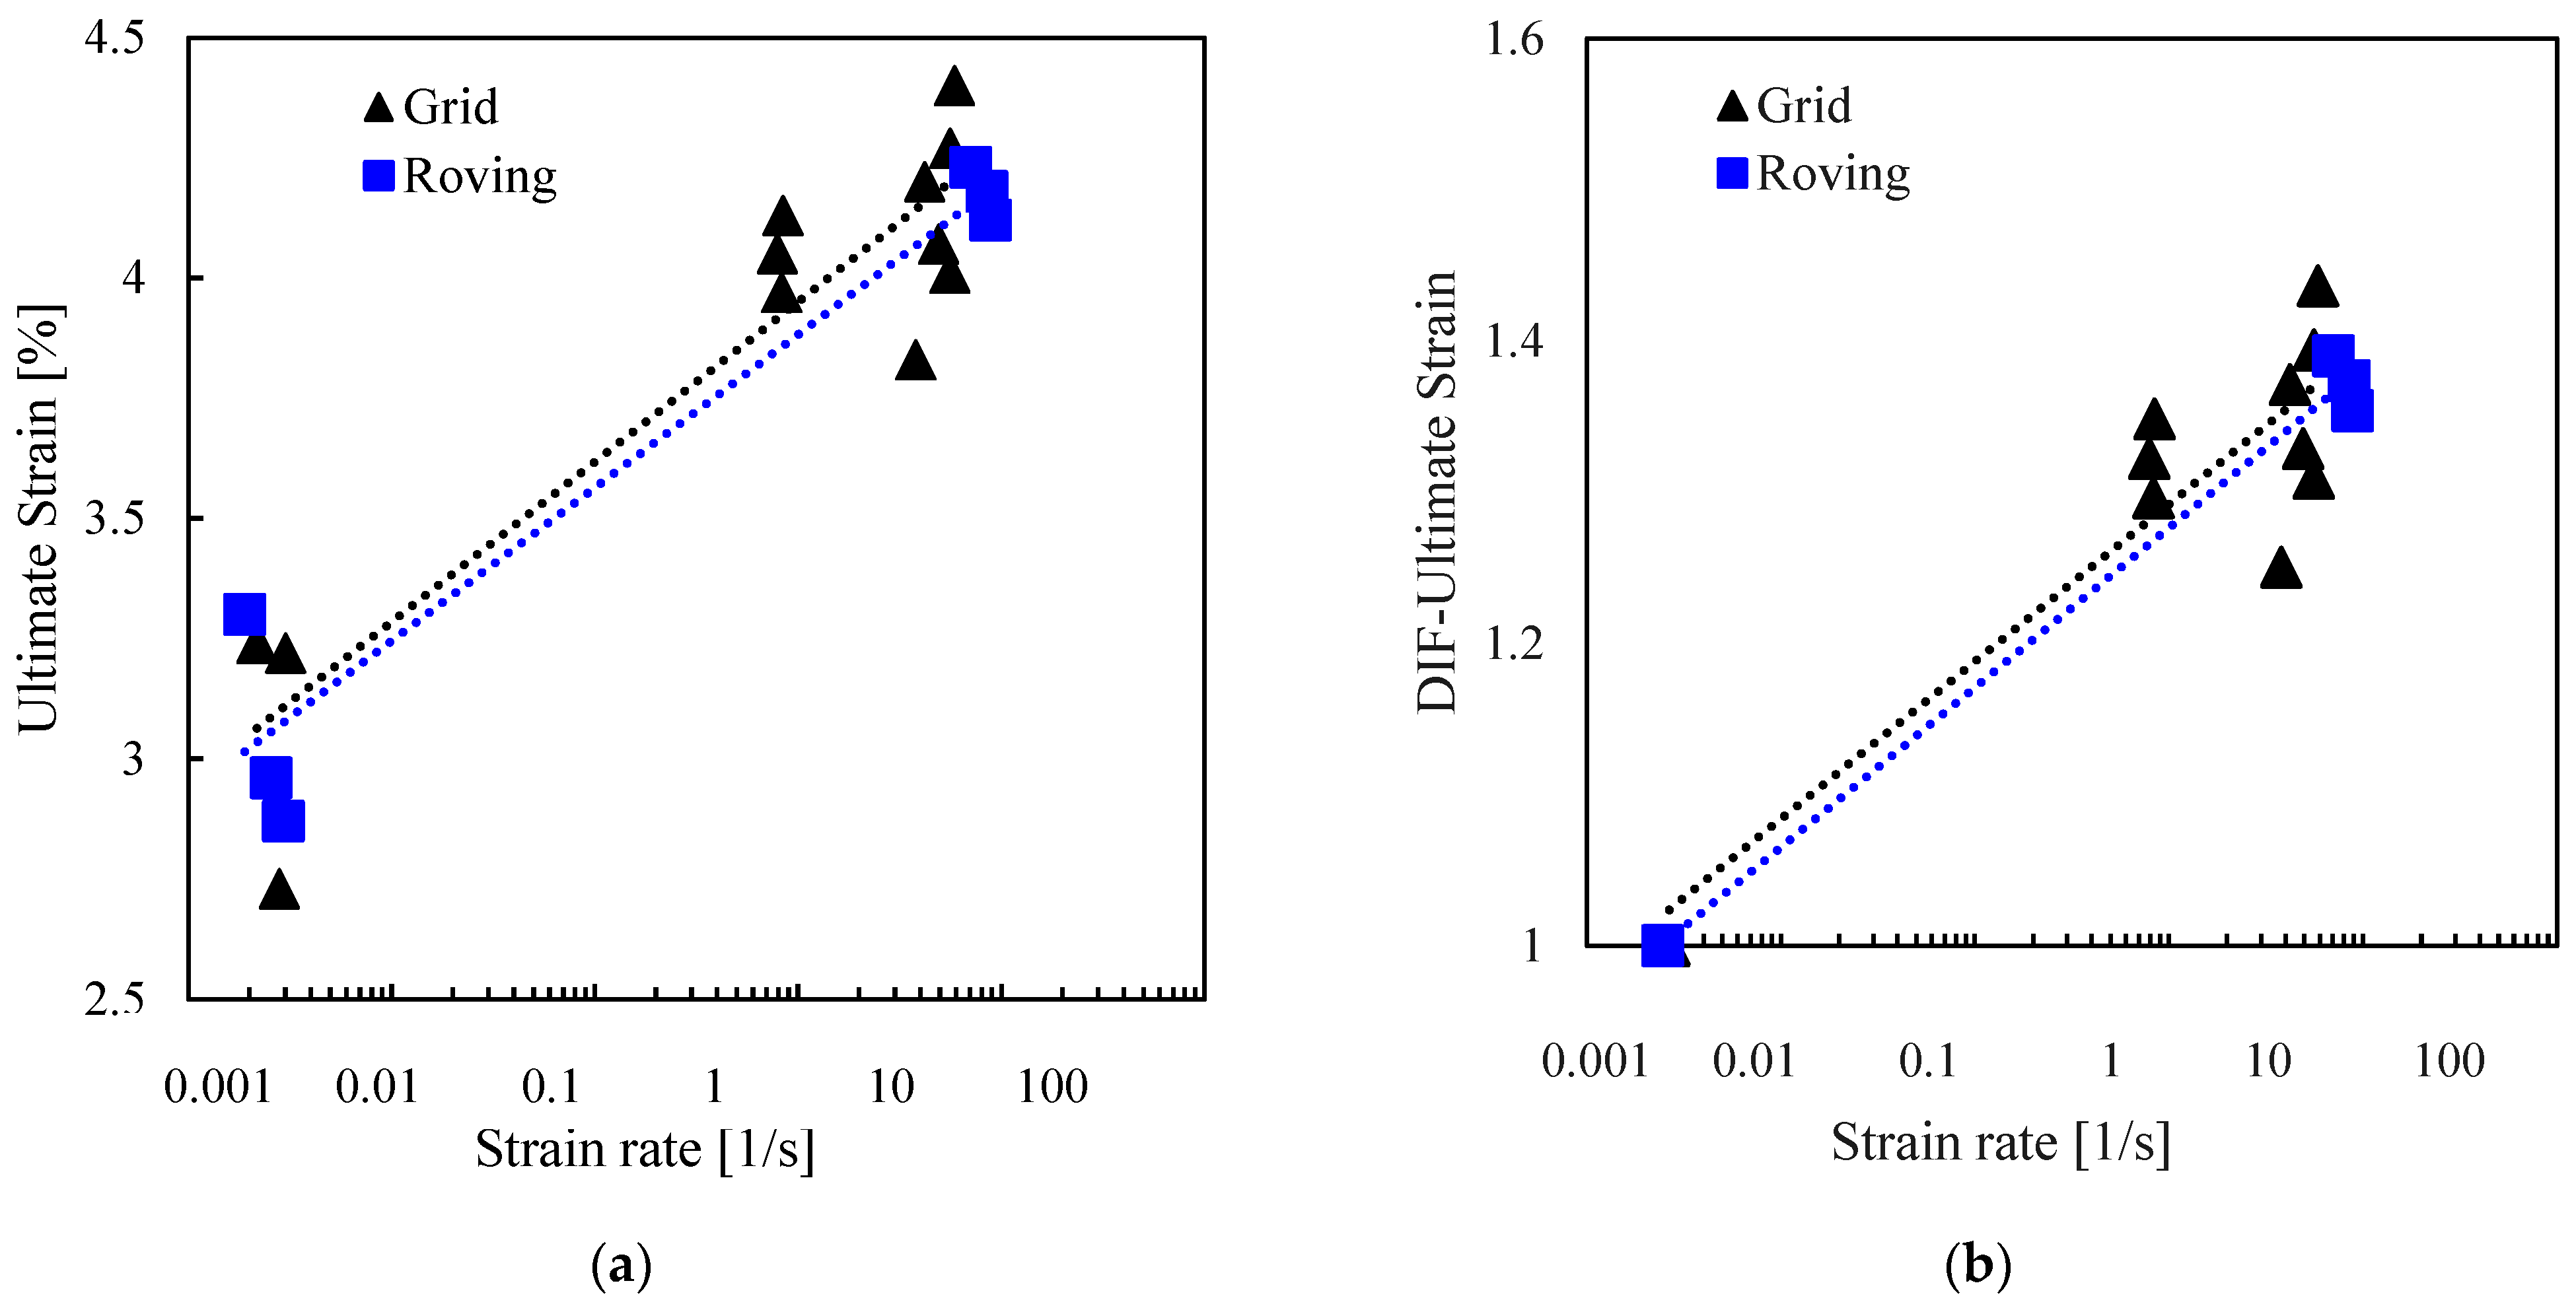
Figure 9.
Effect of strain rate on (a) toughness; (b) dynamic increase factor for toughness.
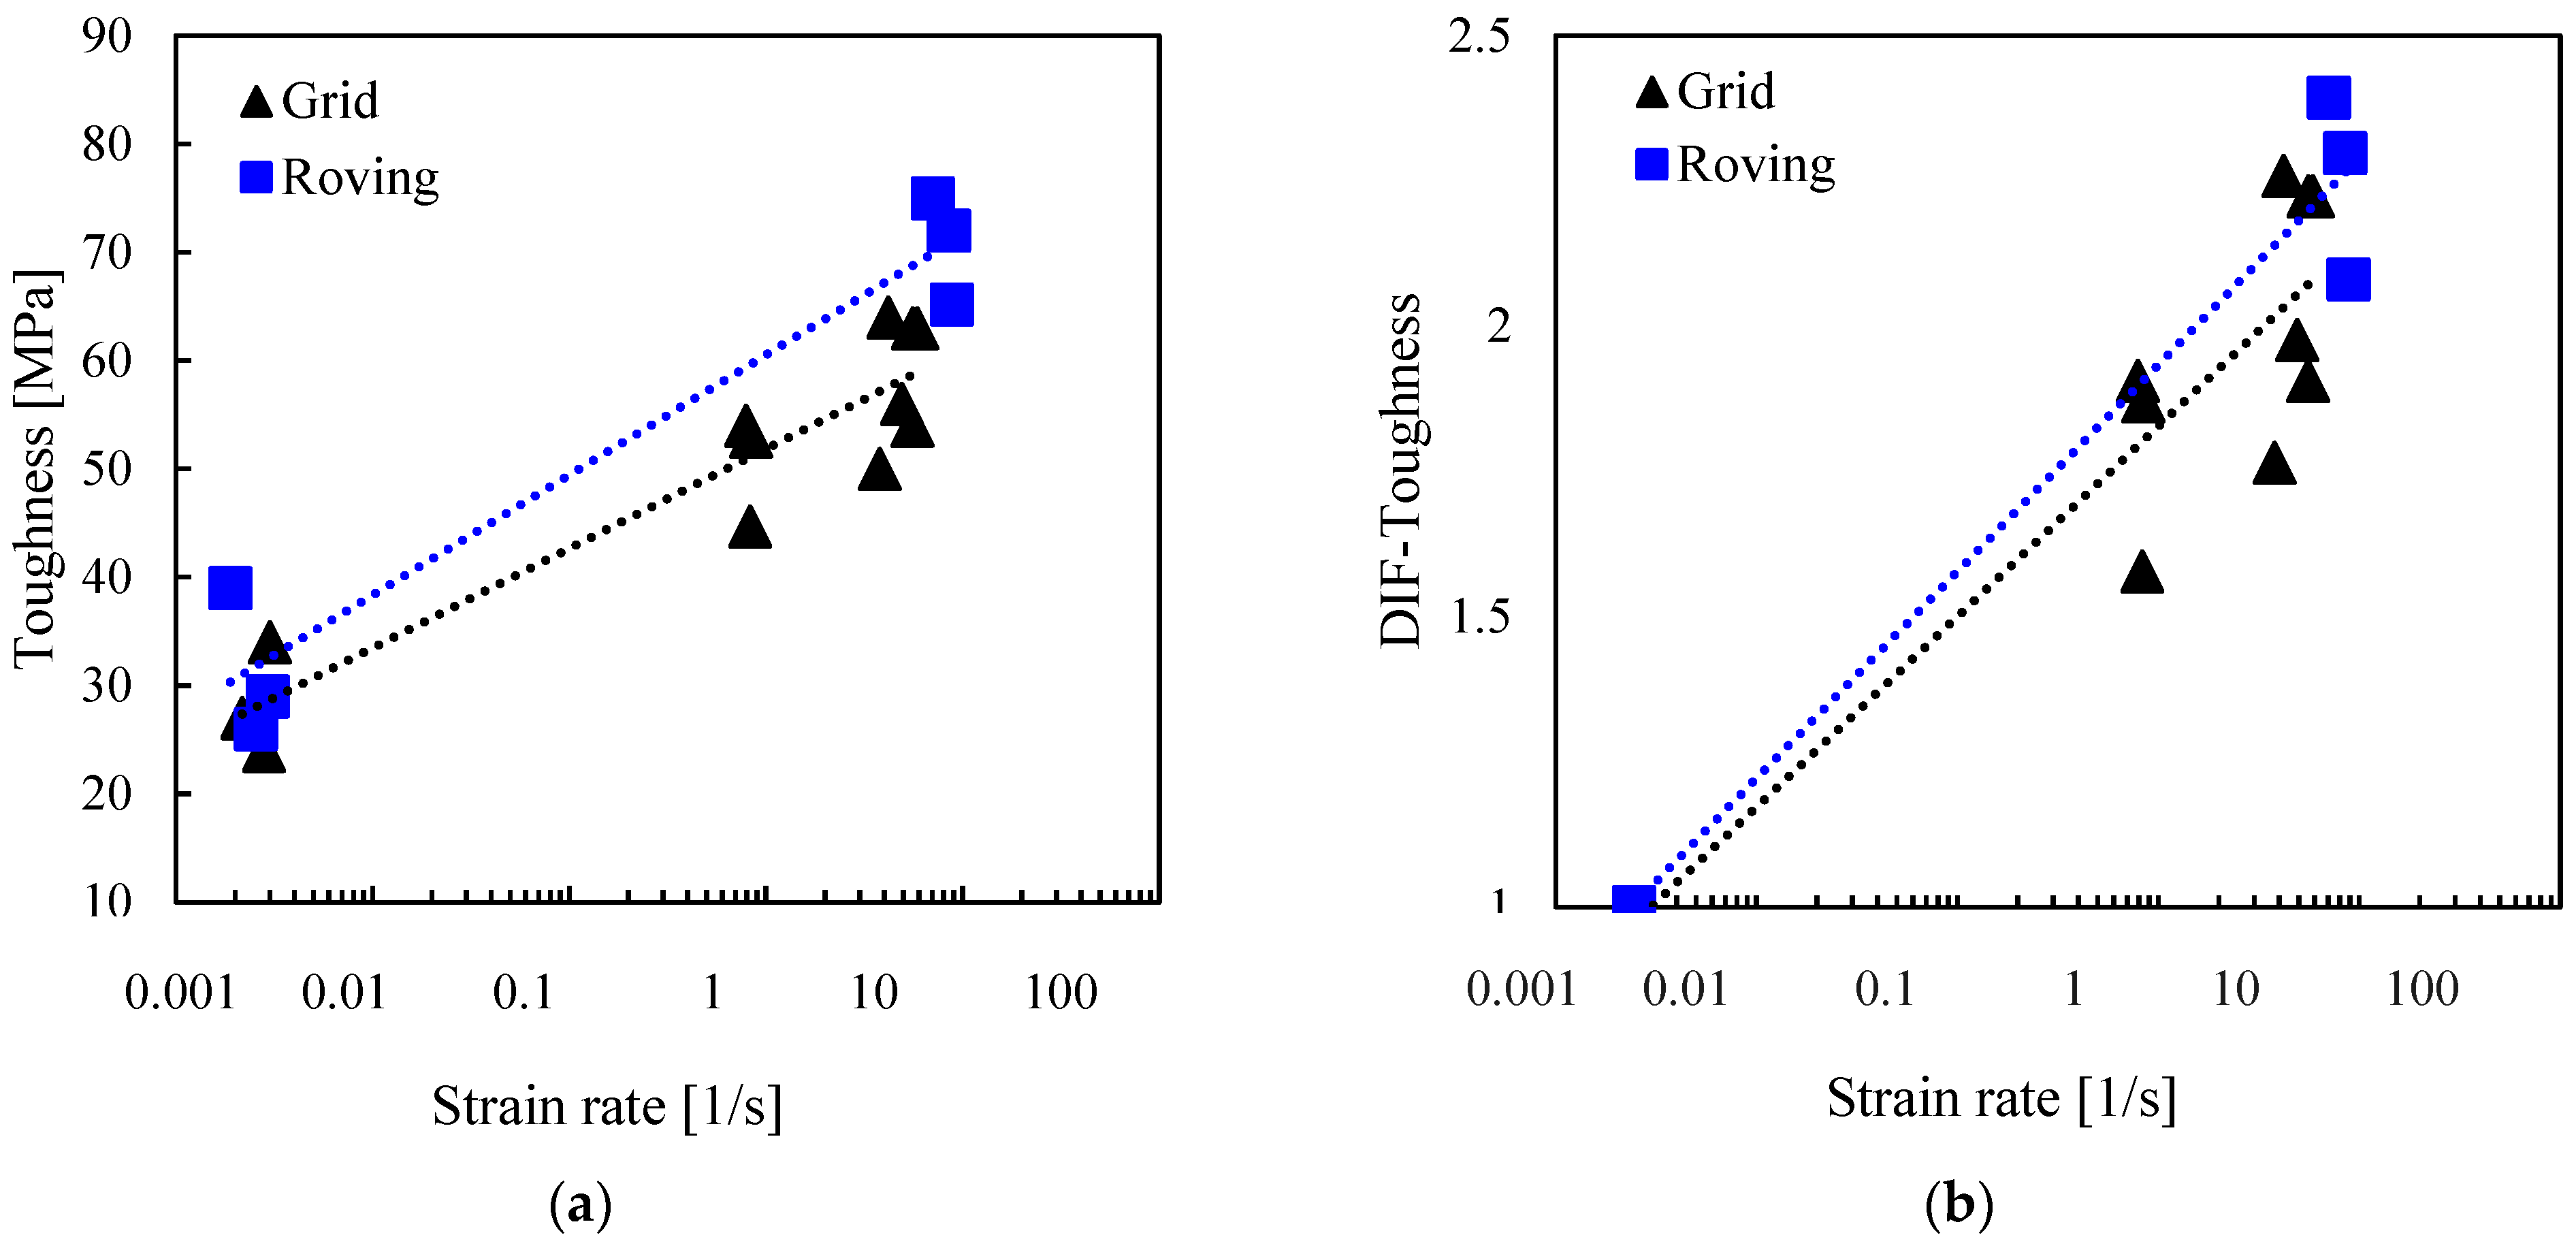
Figure 10.
Effect of strain rate on elastic modulus.
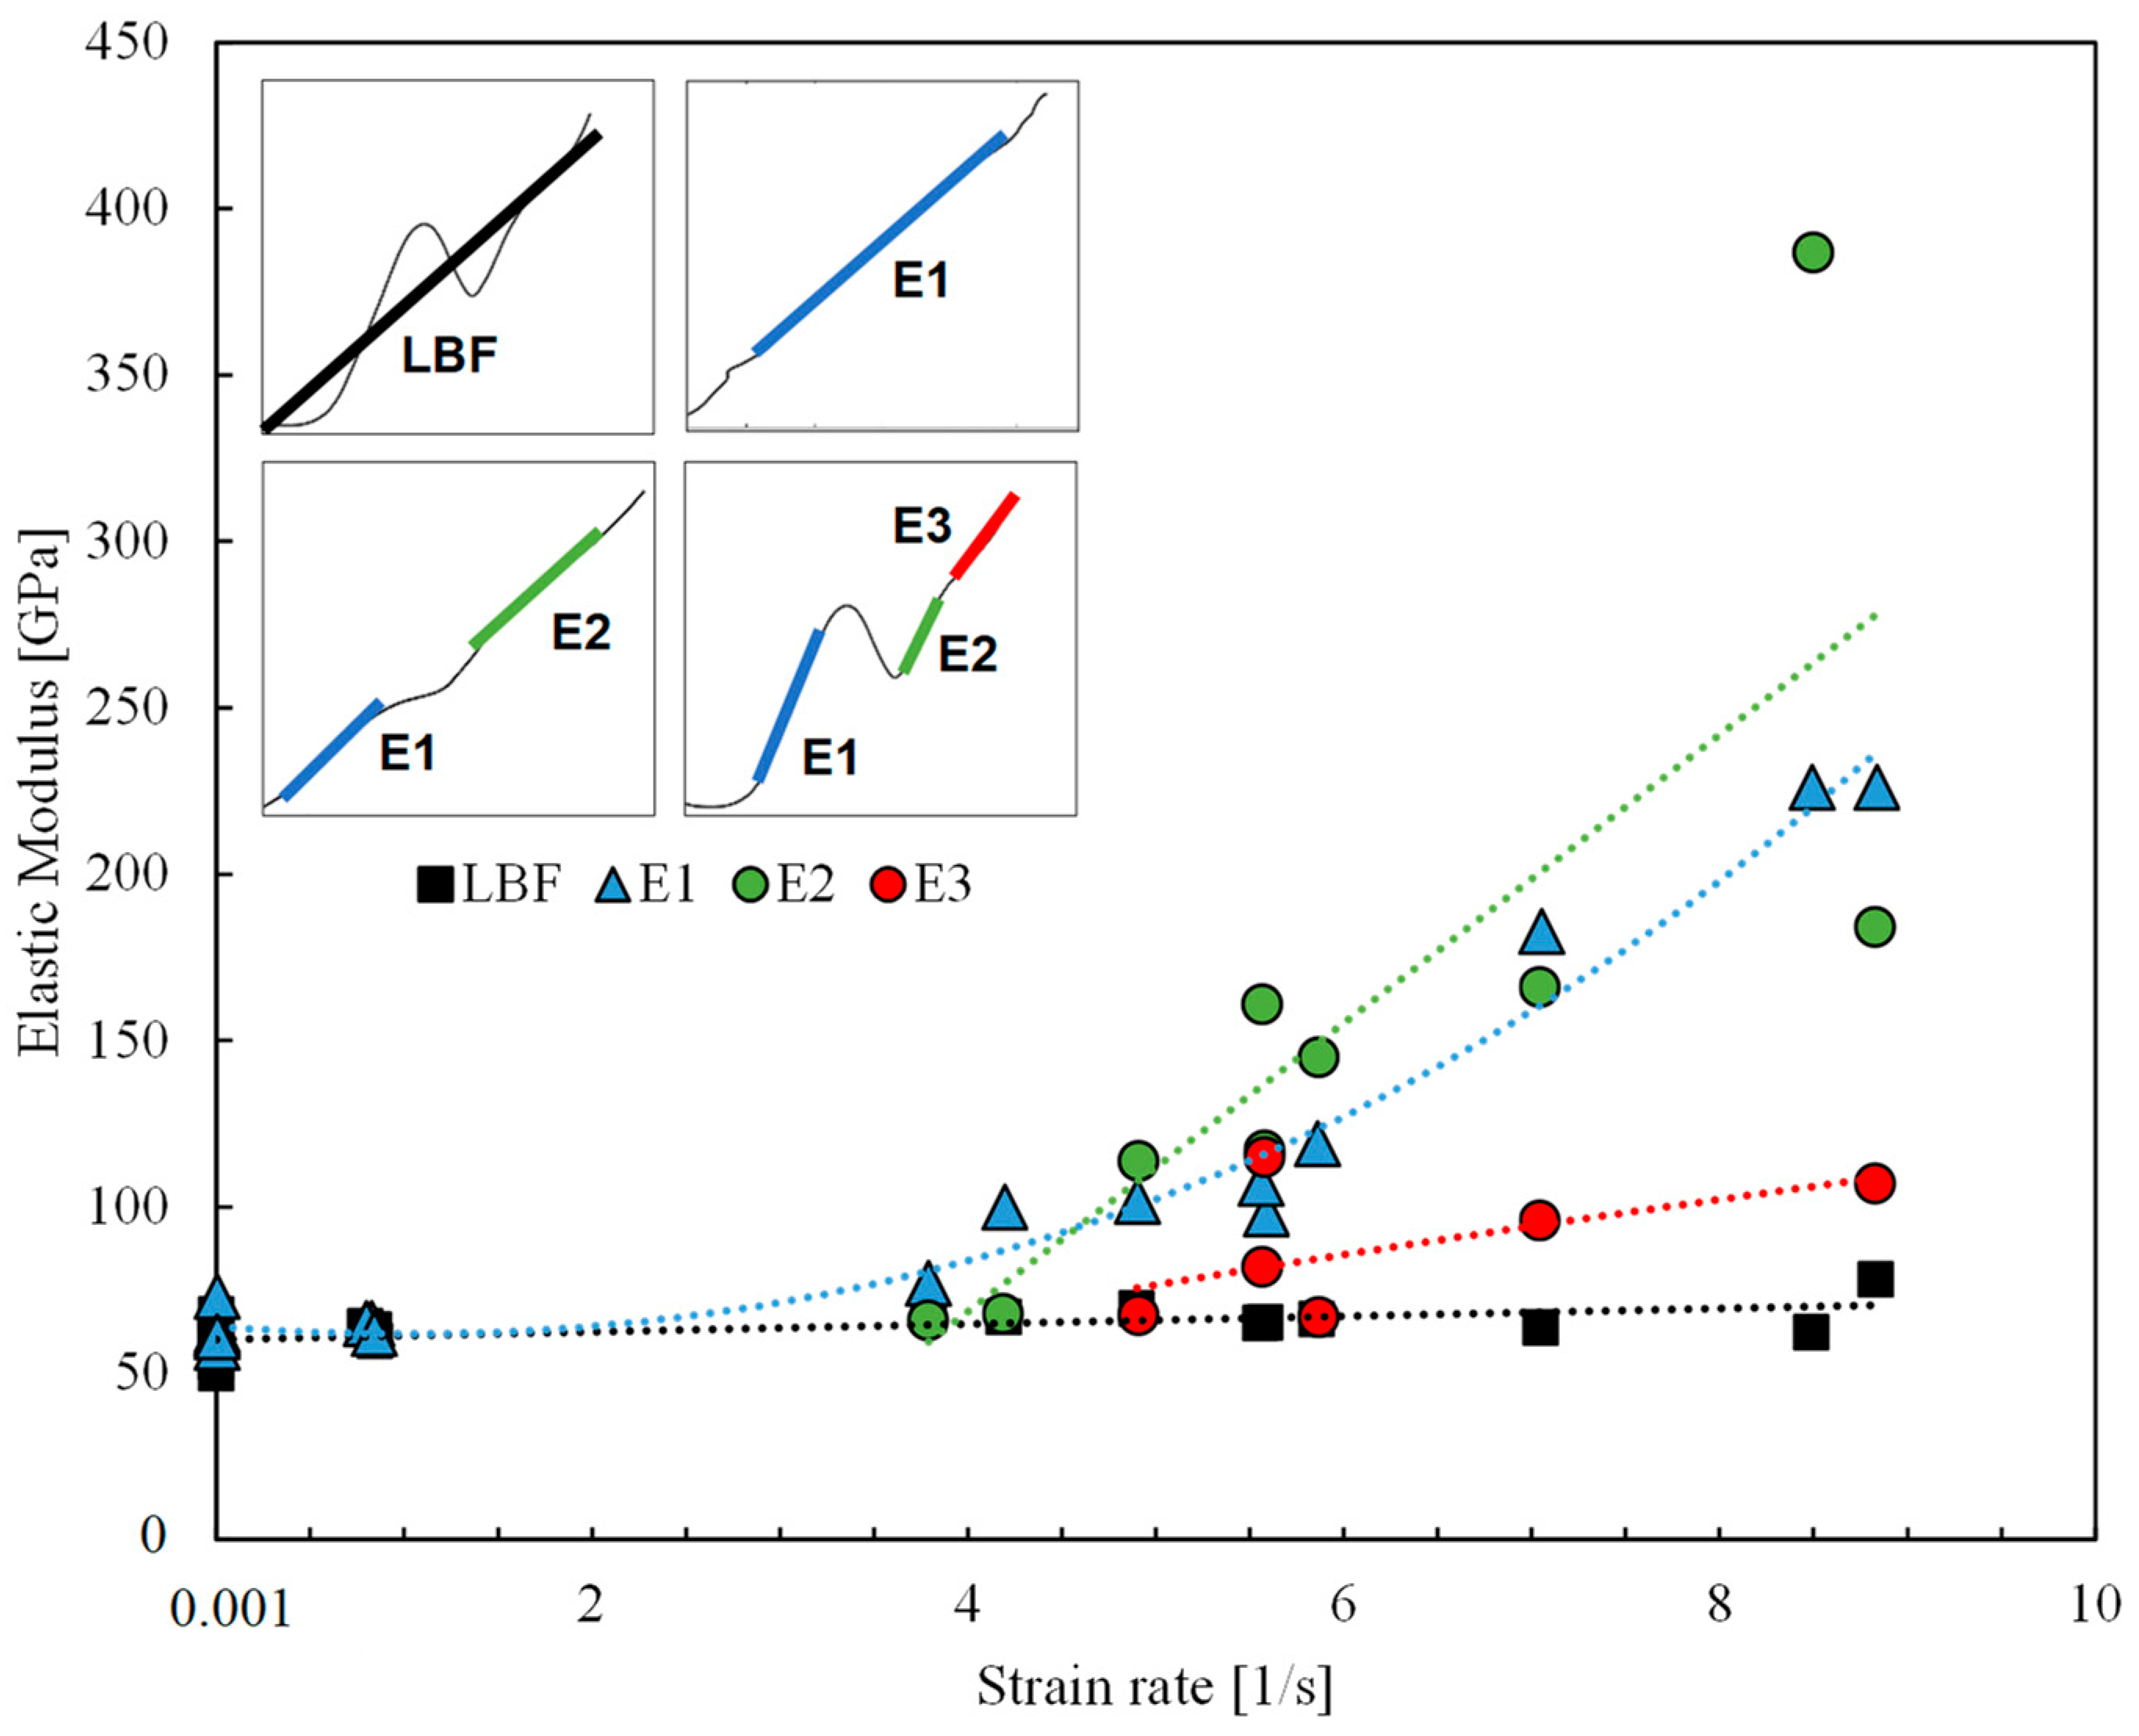
Figure 11.
Schematic showing the basalt grid’s stress-strain response and different regions of failure progression under dynamic loading conditions.
Figure 11.
Schematic showing the basalt grid’s stress-strain response and different regions of failure progression under dynamic loading conditions.
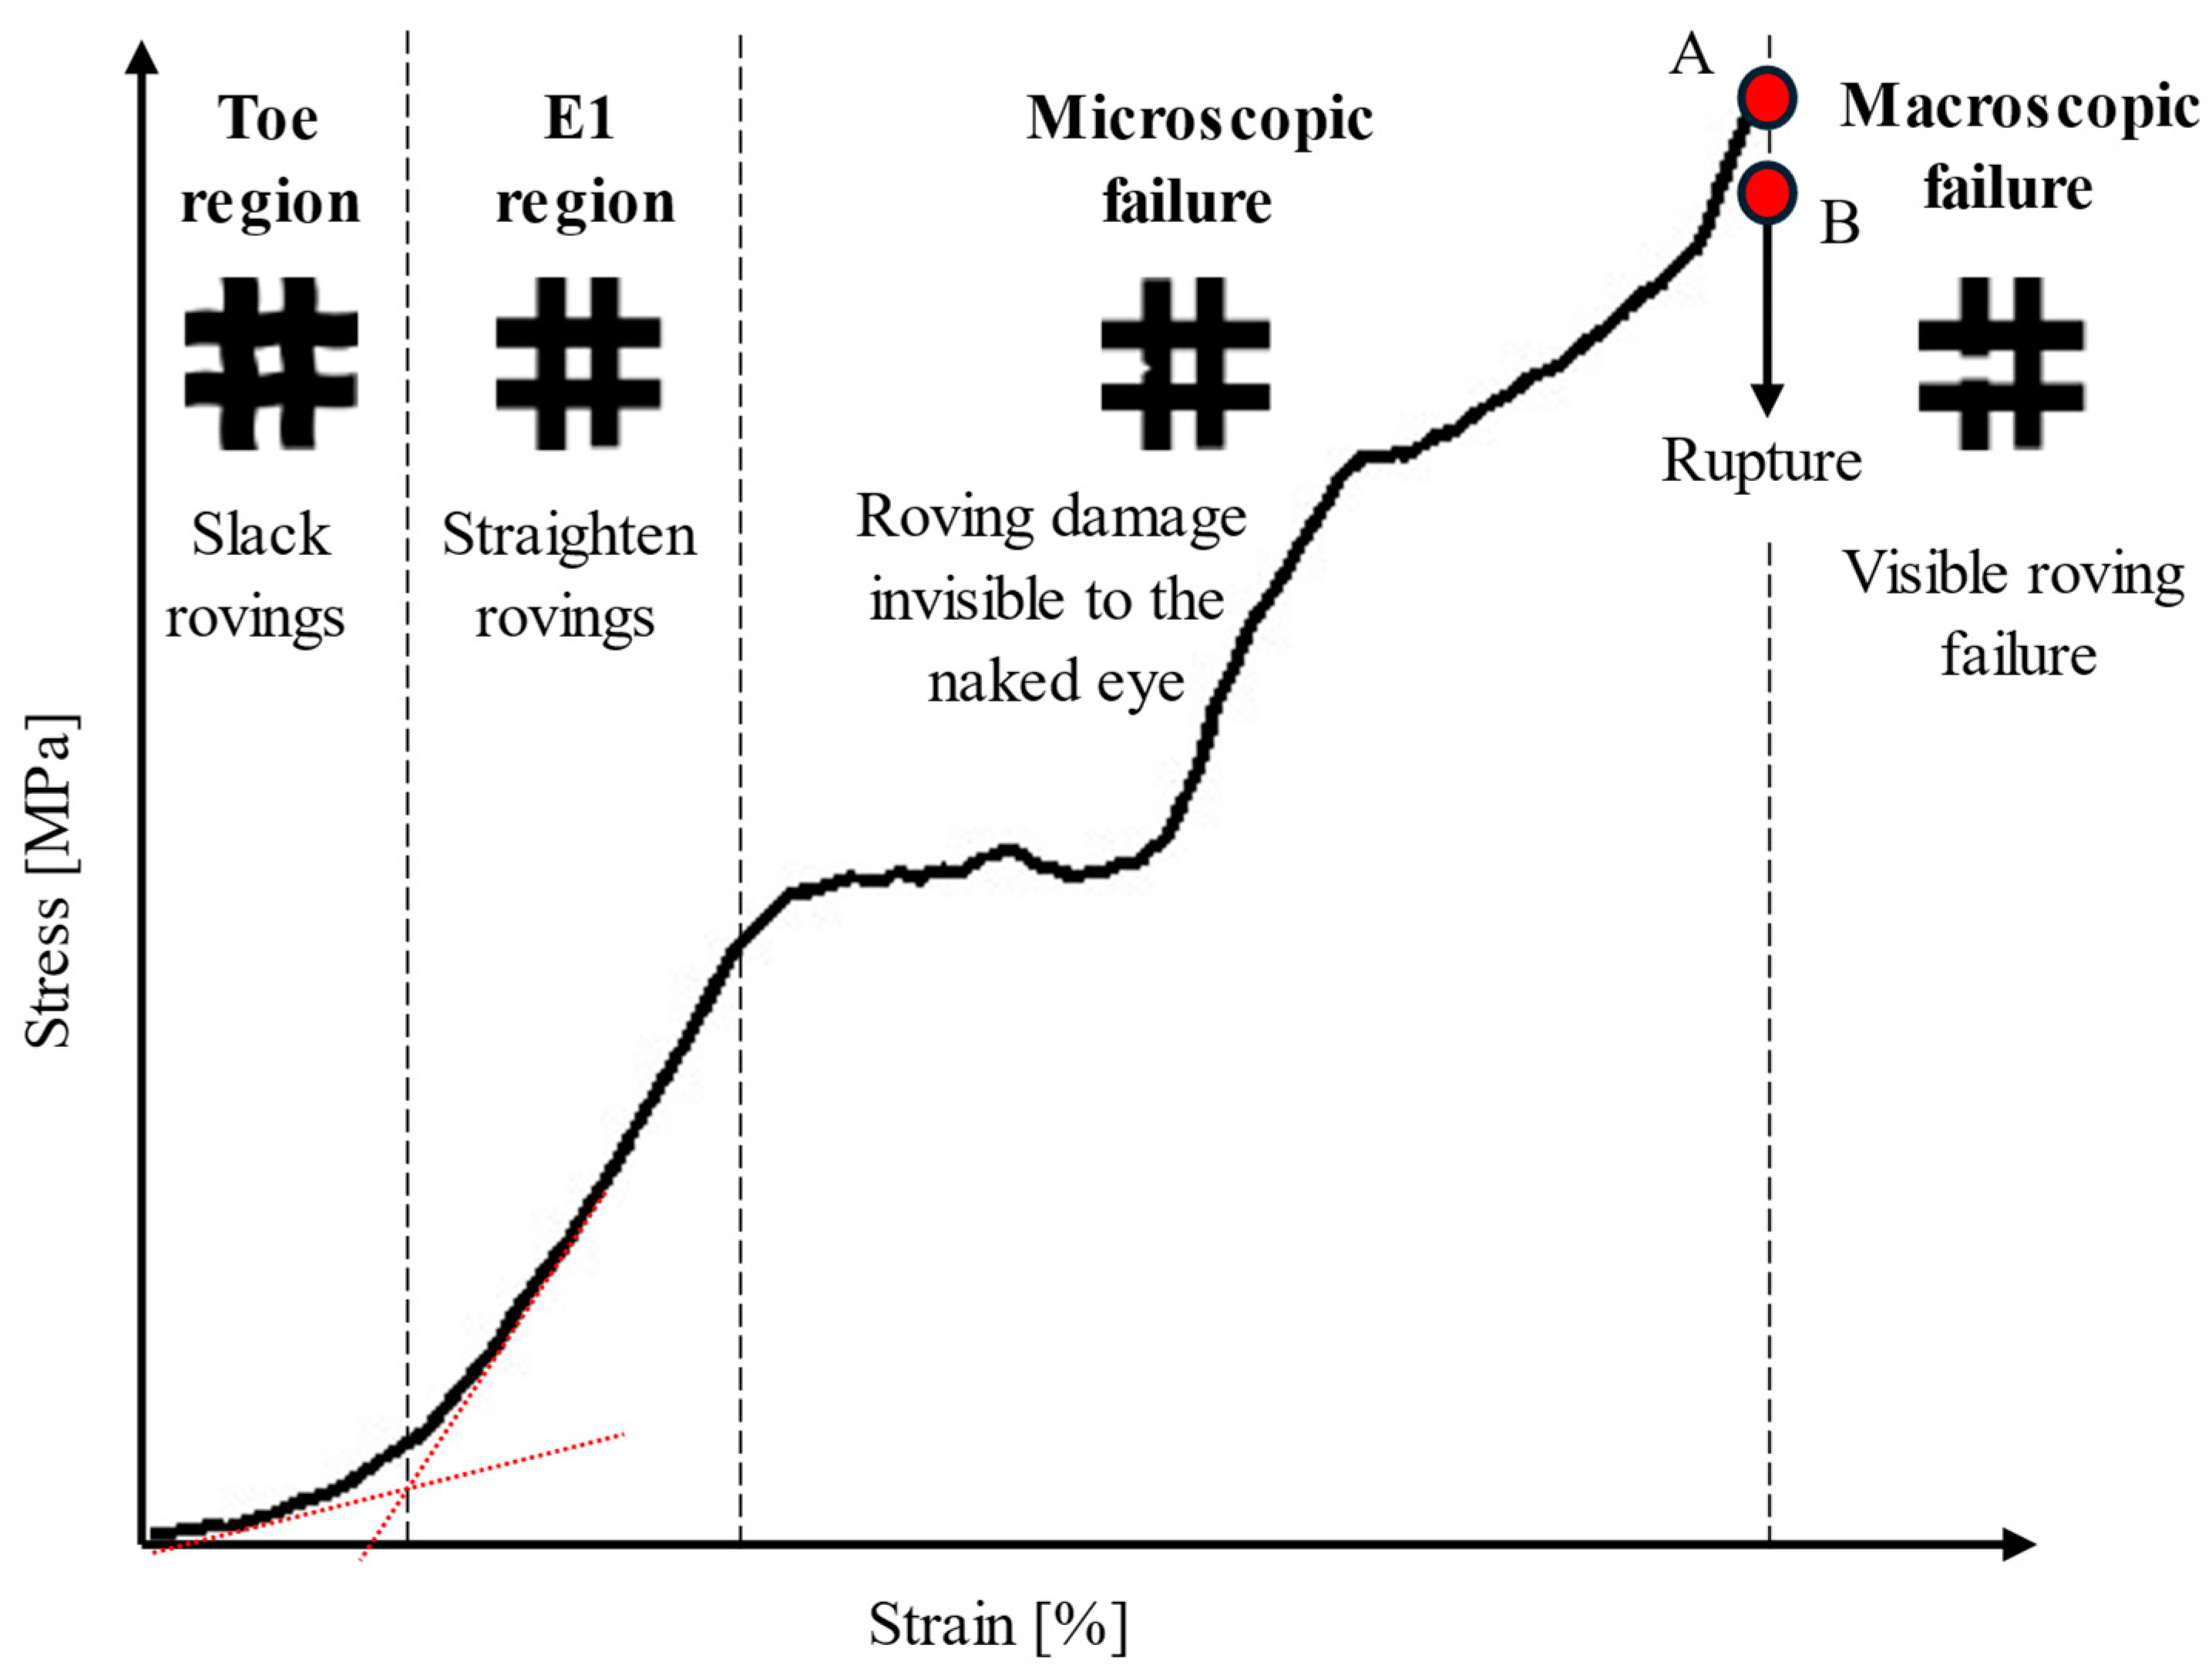
Figure 12.
Image frame of representative specimens (a) Point A- ultimate tensile stress; (b) Point B-immediately after the point of ultimate tensile stress.
Figure 12.
Image frame of representative specimens (a) Point A- ultimate tensile stress; (b) Point B-immediately after the point of ultimate tensile stress.
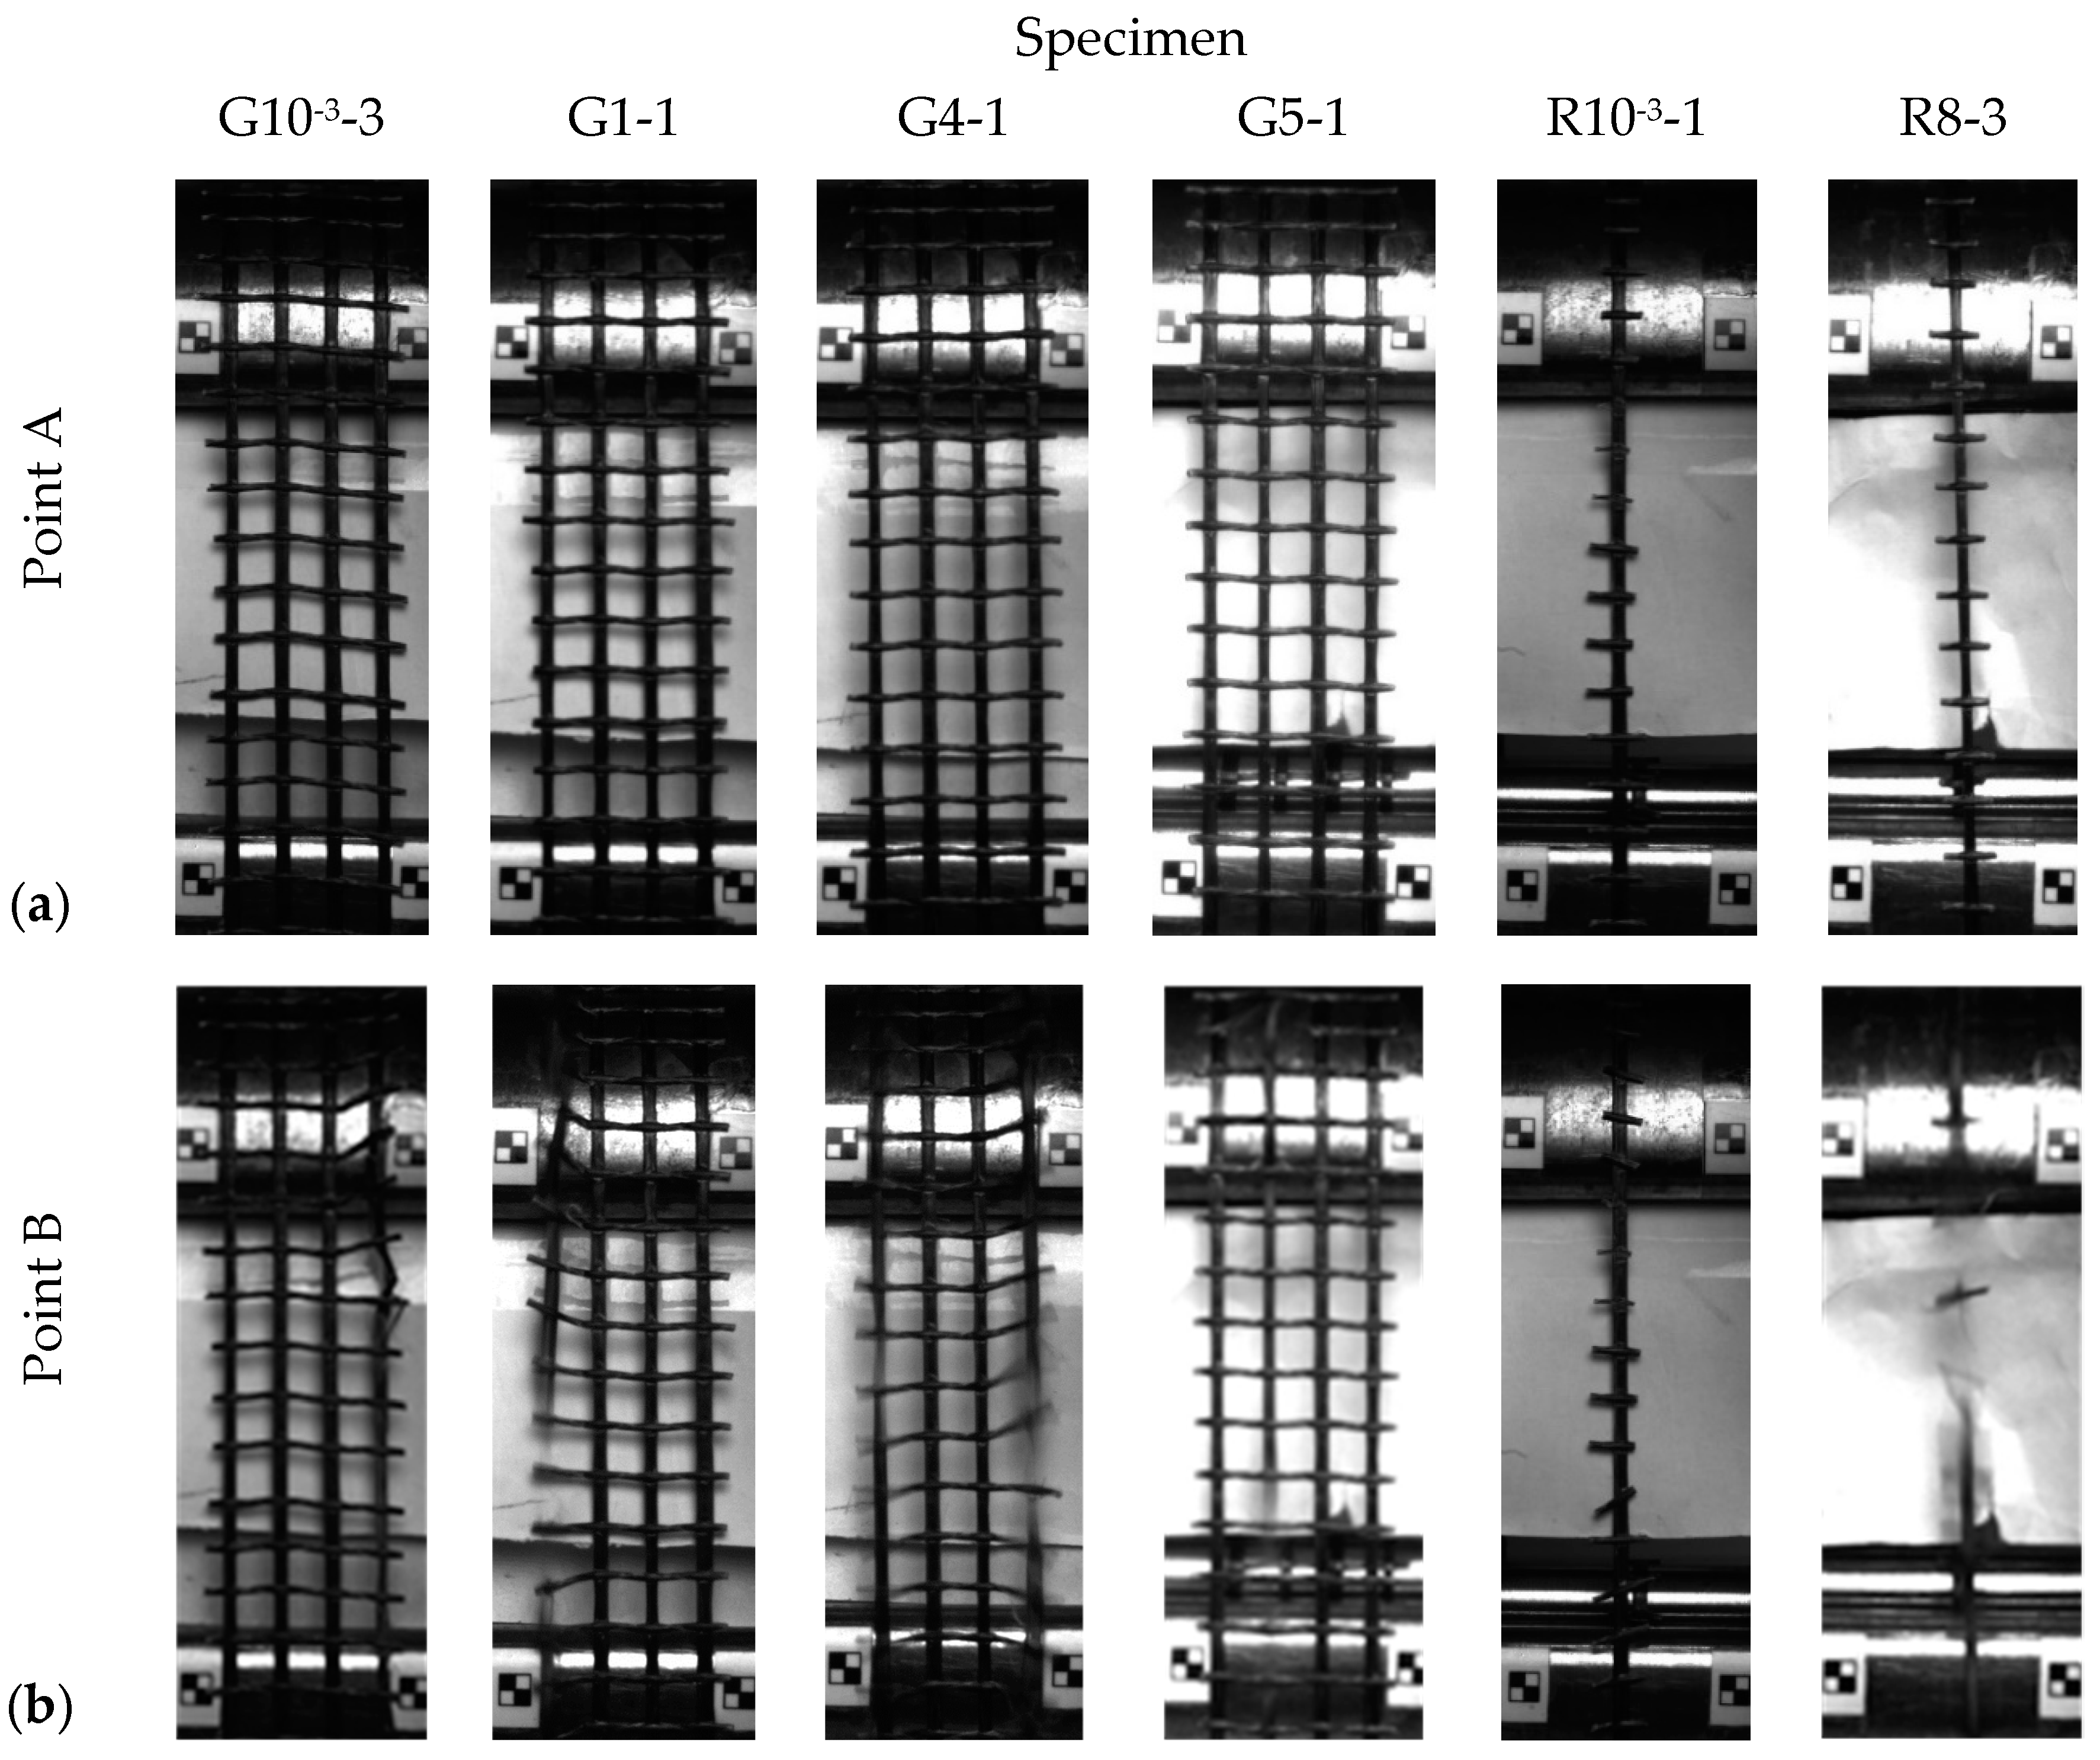
Figure 13.
Morphology of fibre fracture plane for G5-2: (a) inclined; (b) flat; (c) magnification of flat fracture plane showing features of a brittle fracture.
Figure 13.
Morphology of fibre fracture plane for G5-2: (a) inclined; (b) flat; (c) magnification of flat fracture plane showing features of a brittle fracture.
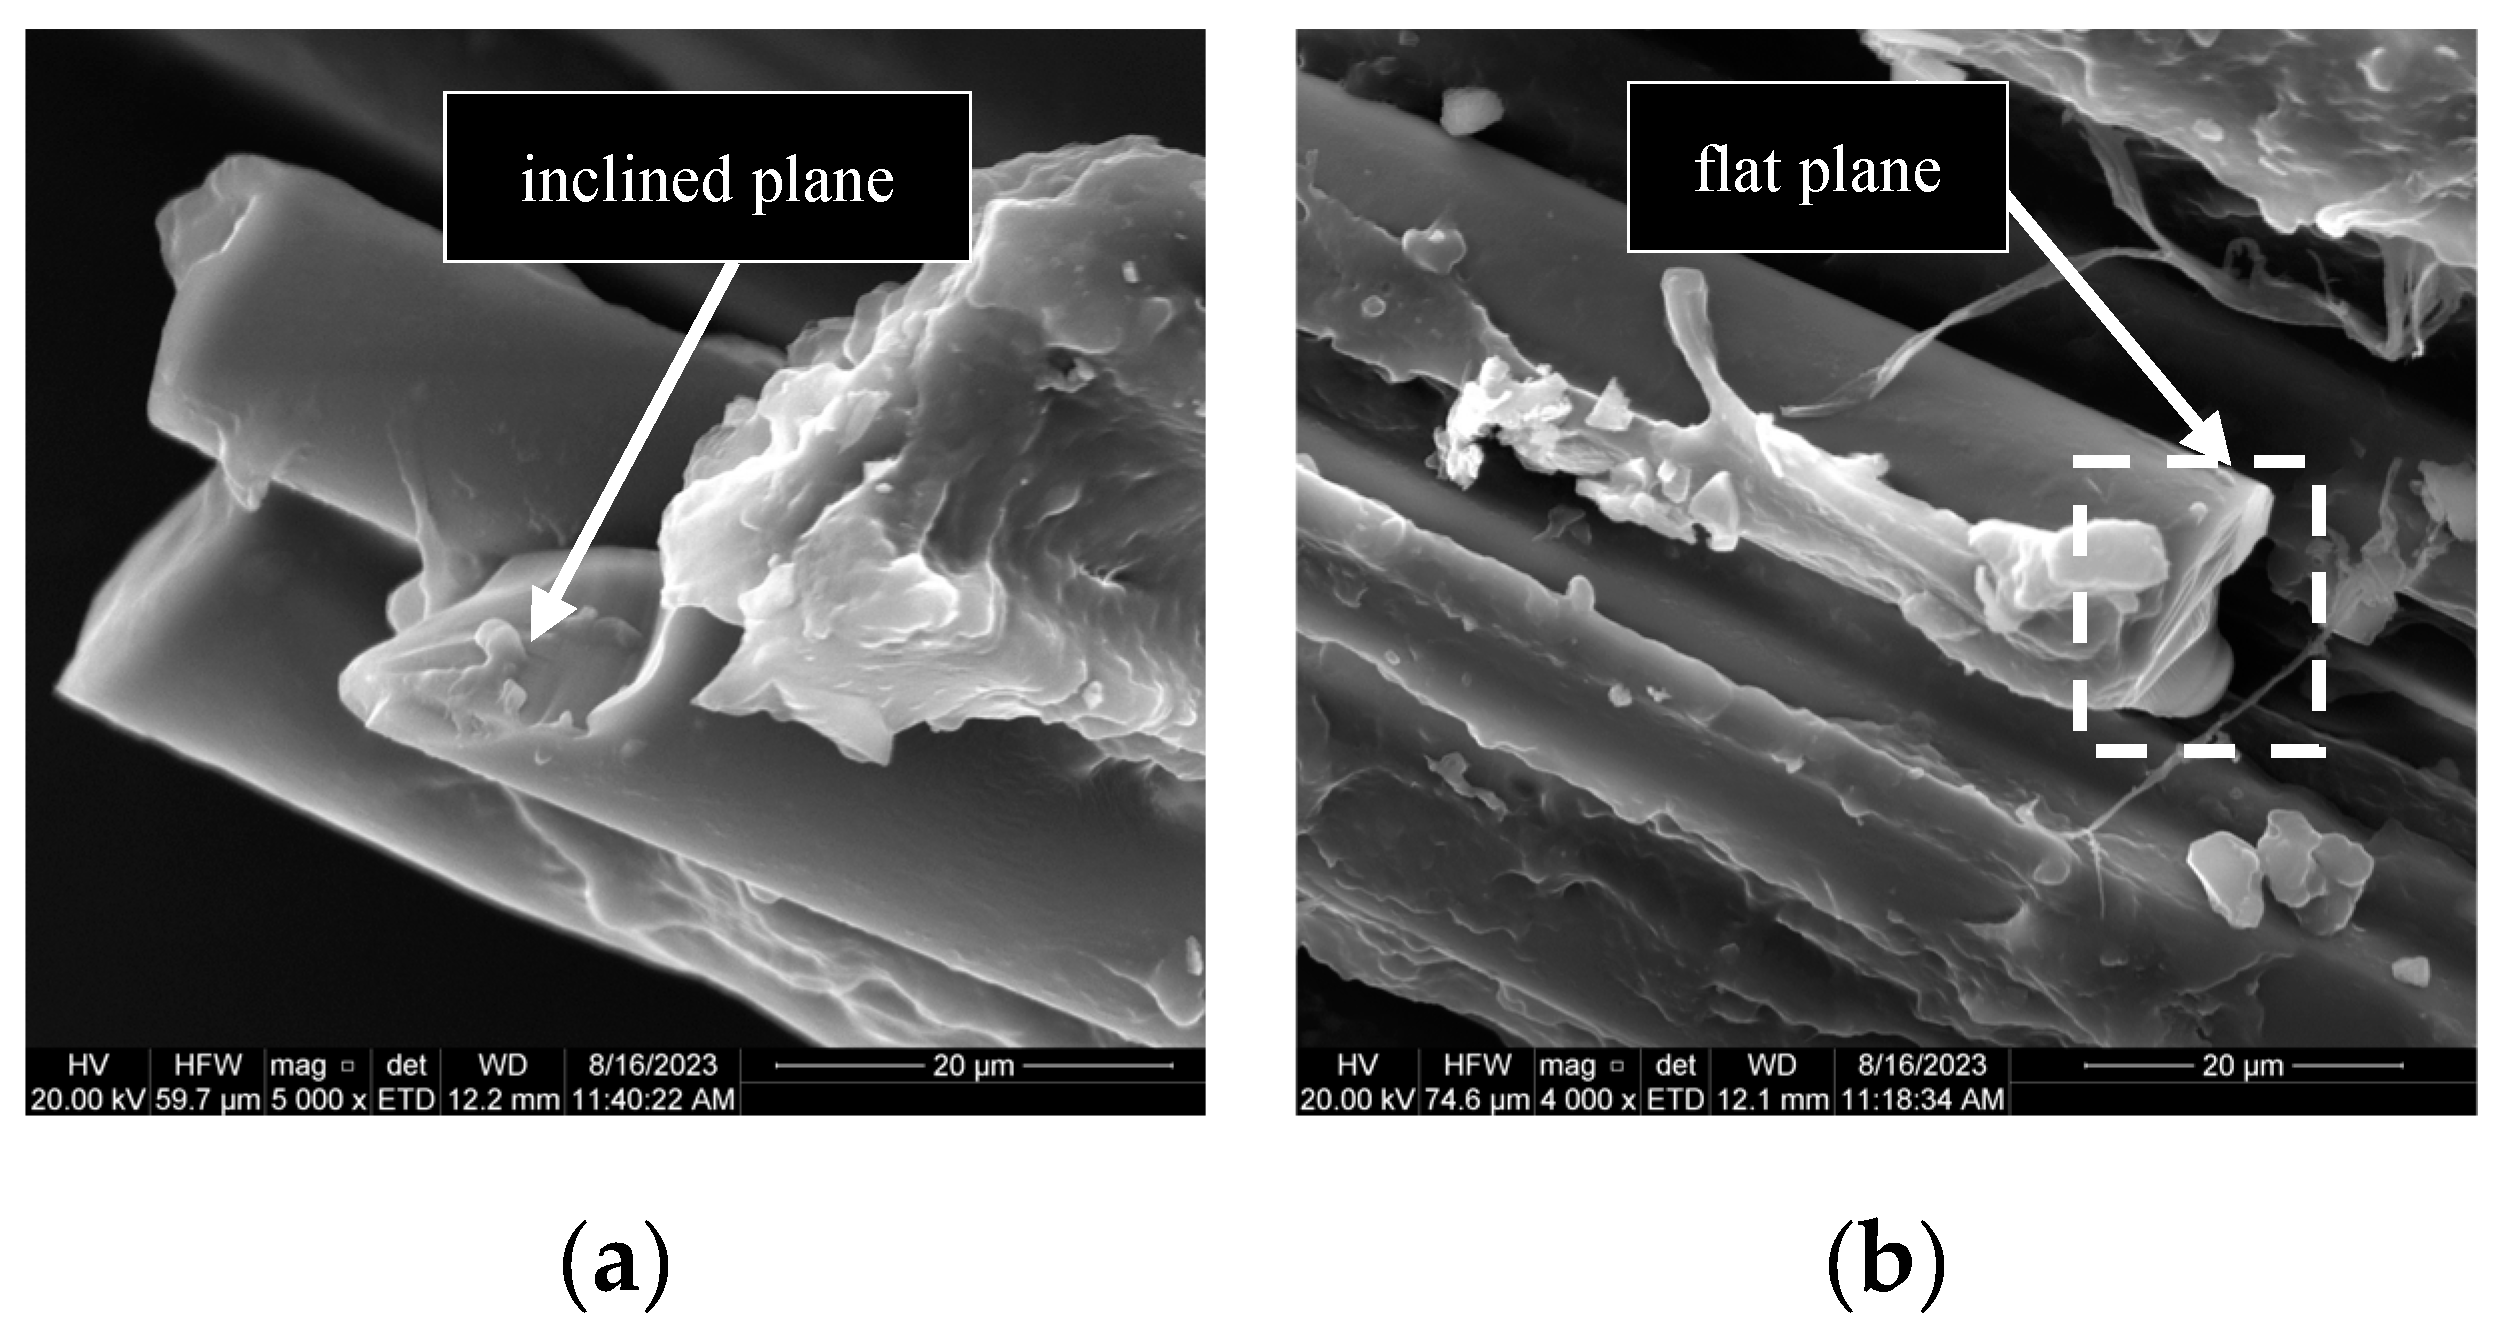
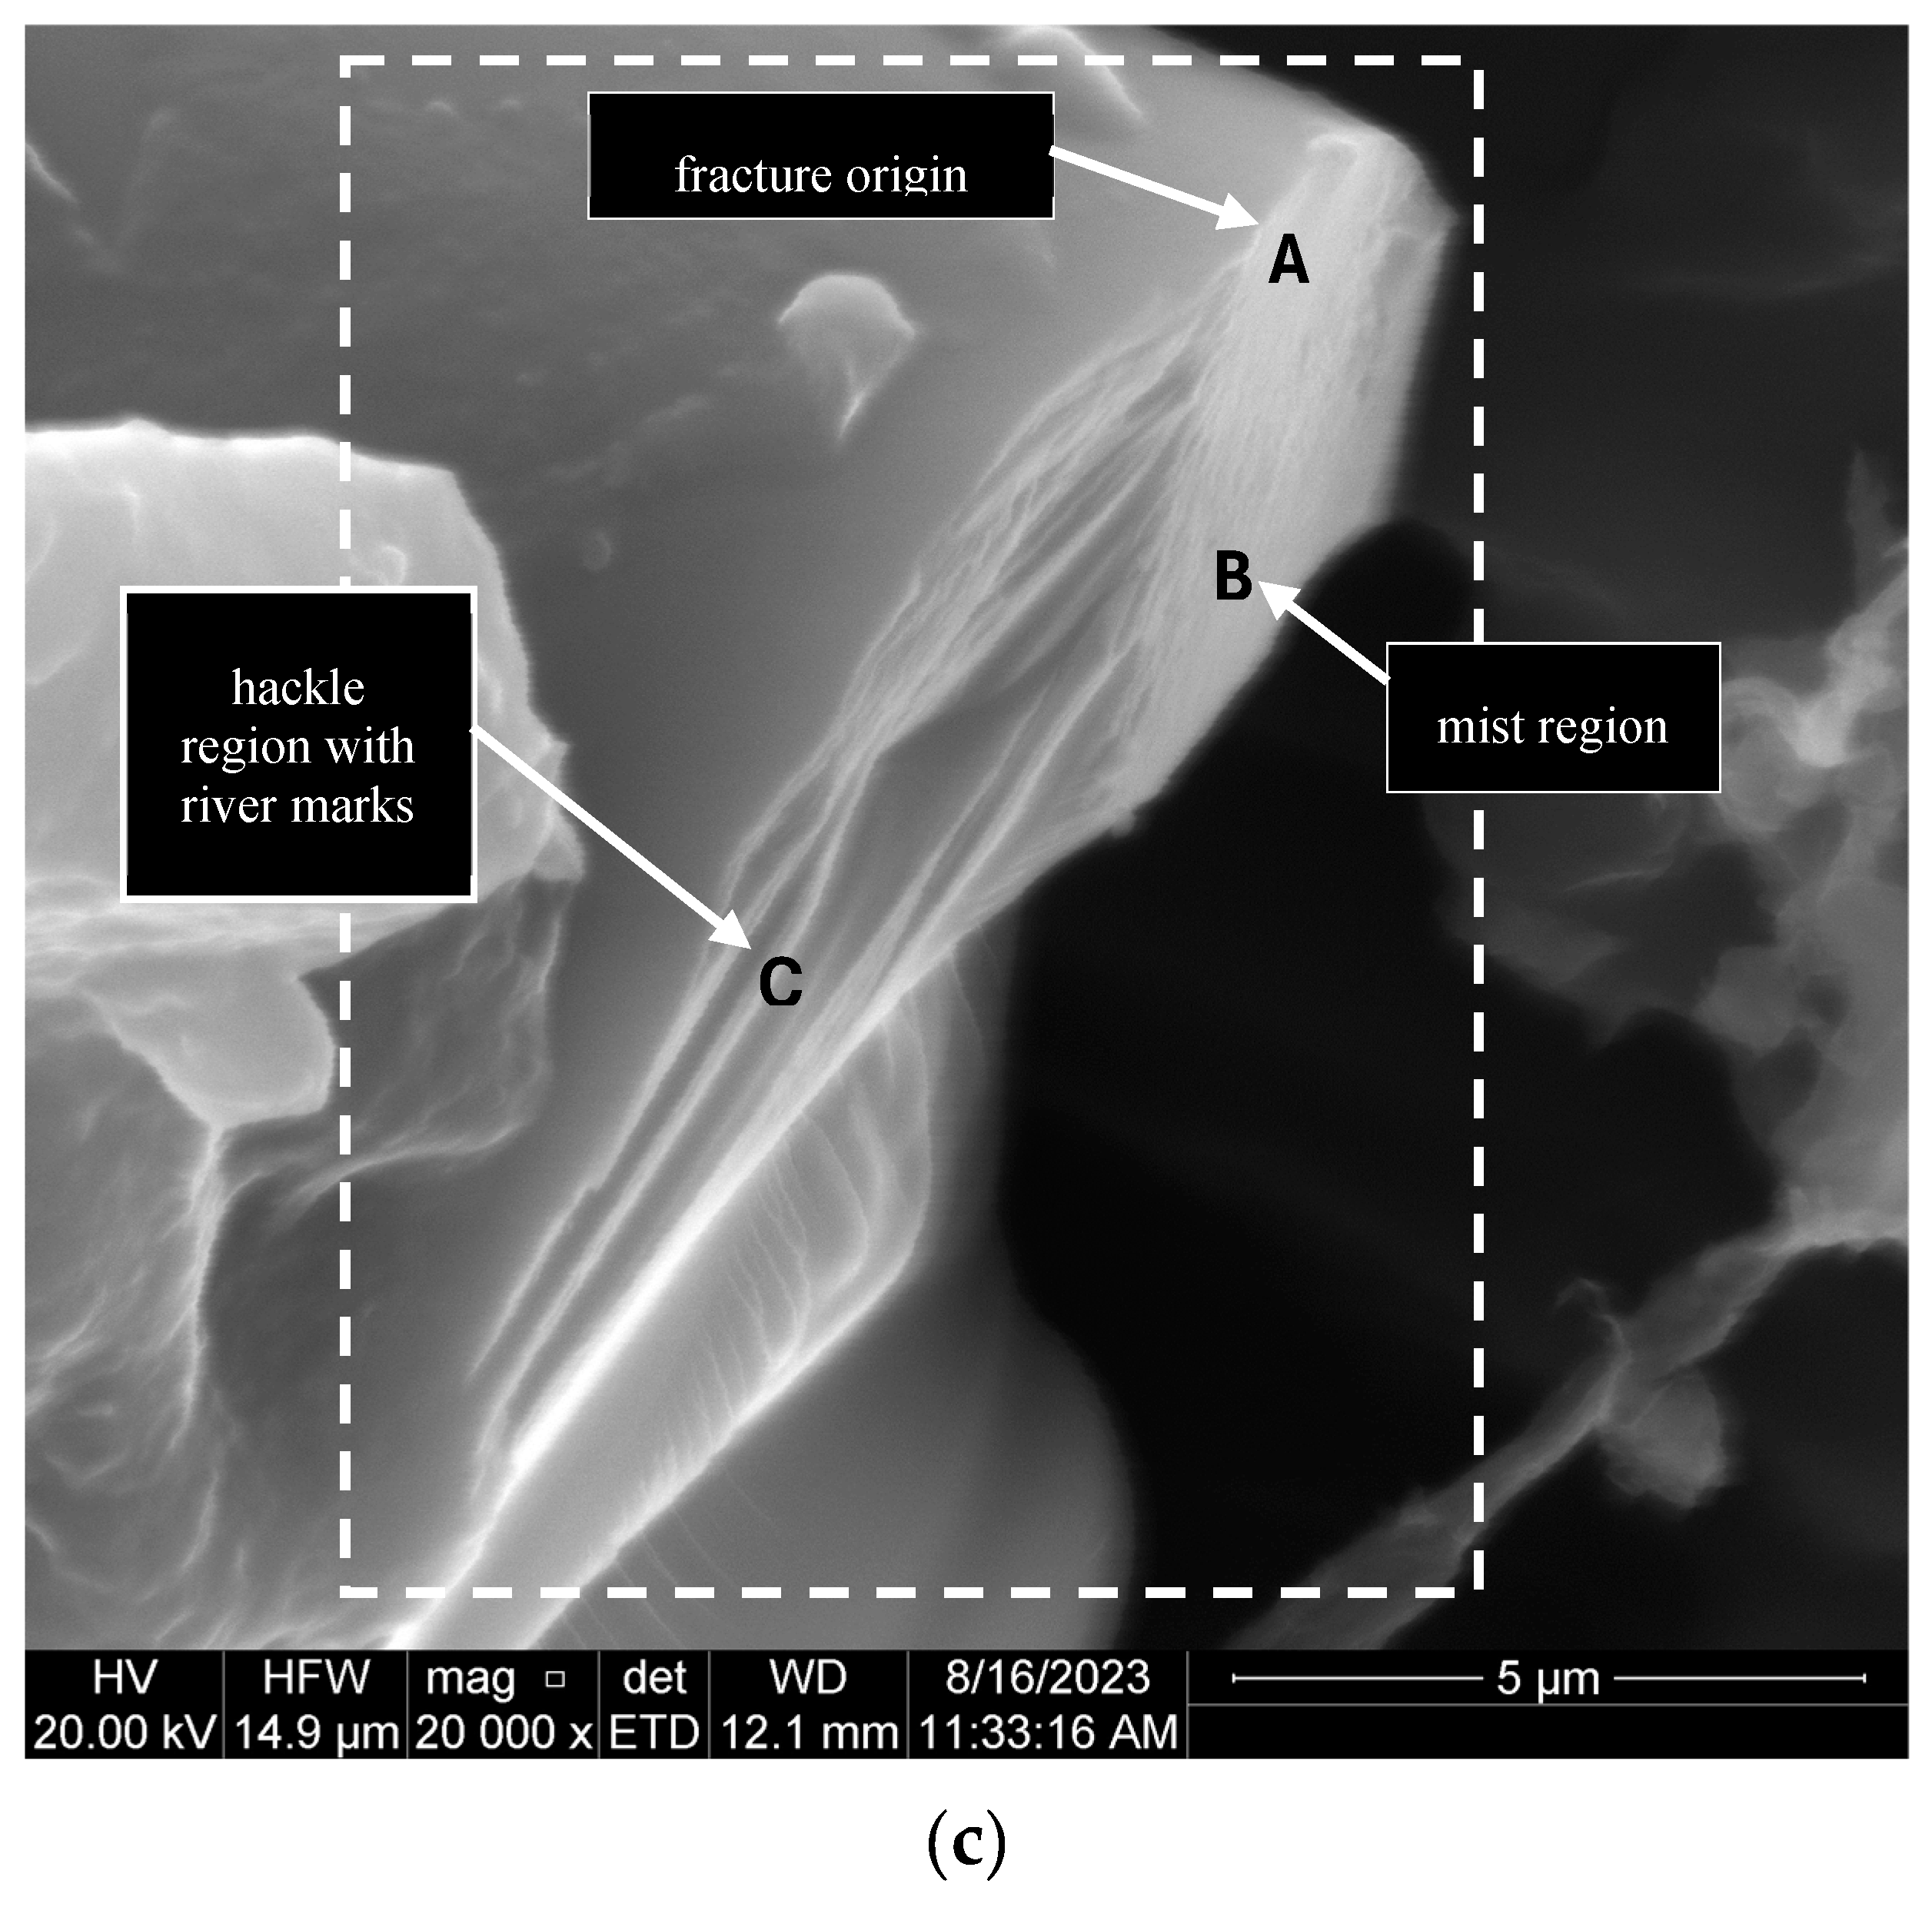
Figure 14.
Brittle coating fracture at quasi-static and dynamic strain rates (a) G10-3-1; (b) G5-2; (c,d) R8-2.
Figure 14.
Brittle coating fracture at quasi-static and dynamic strain rates (a) G10-3-1; (b) G5-2; (c,d) R8-2.
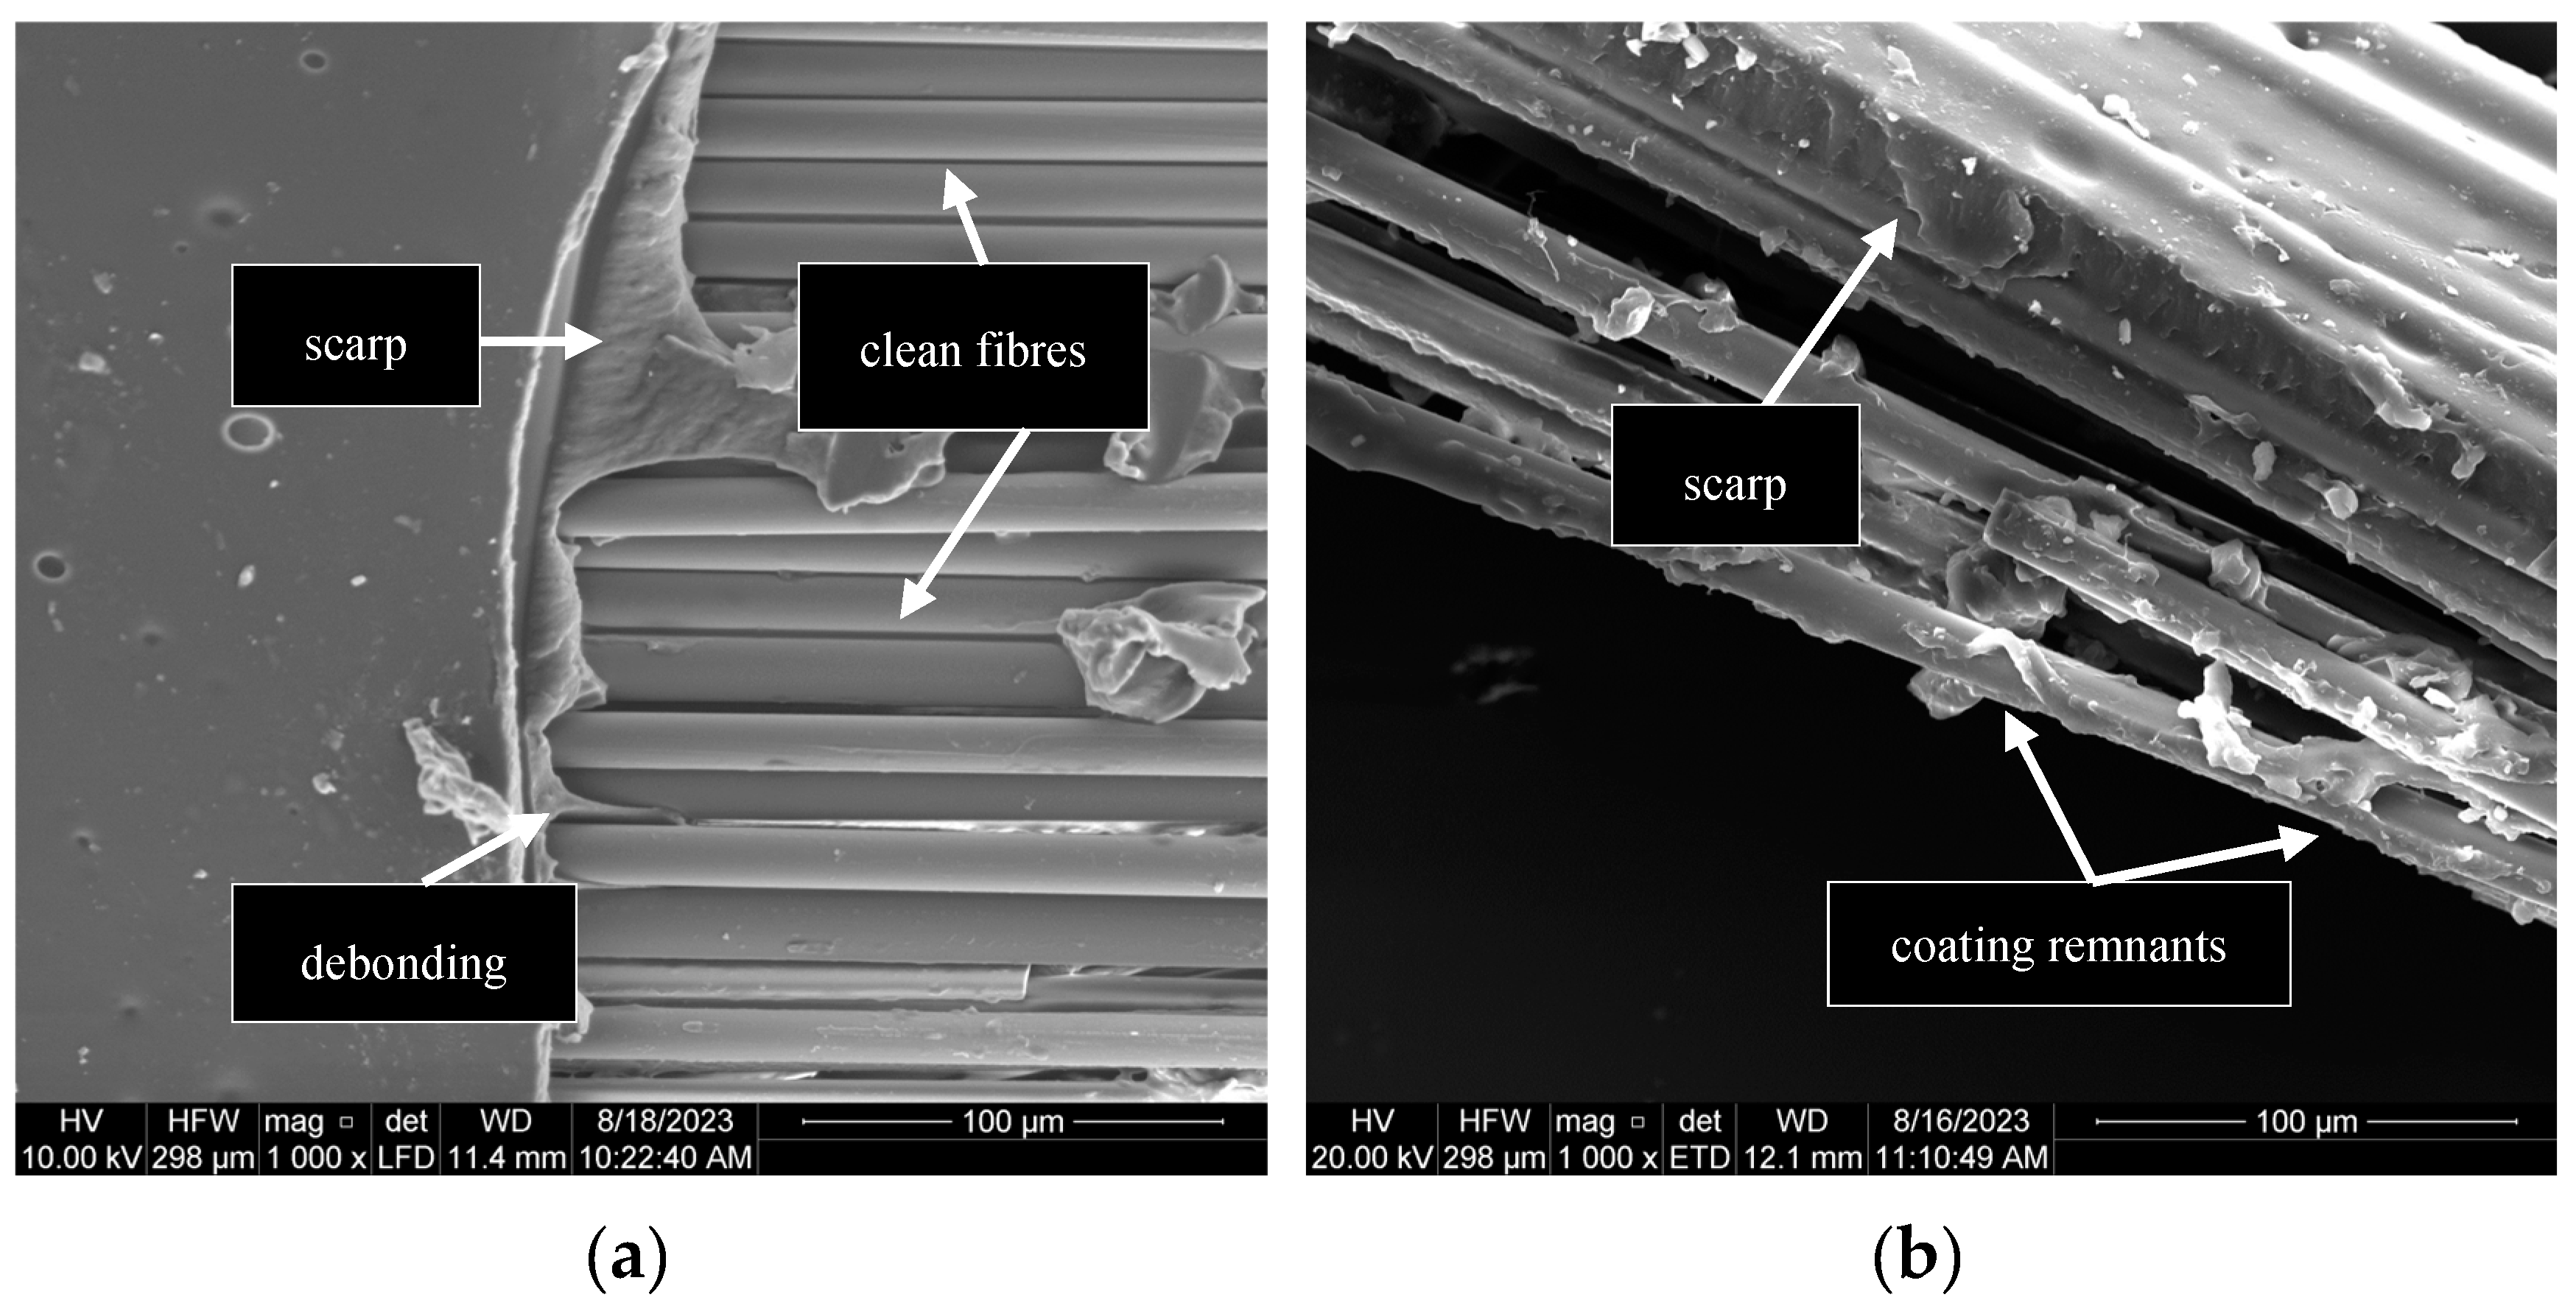
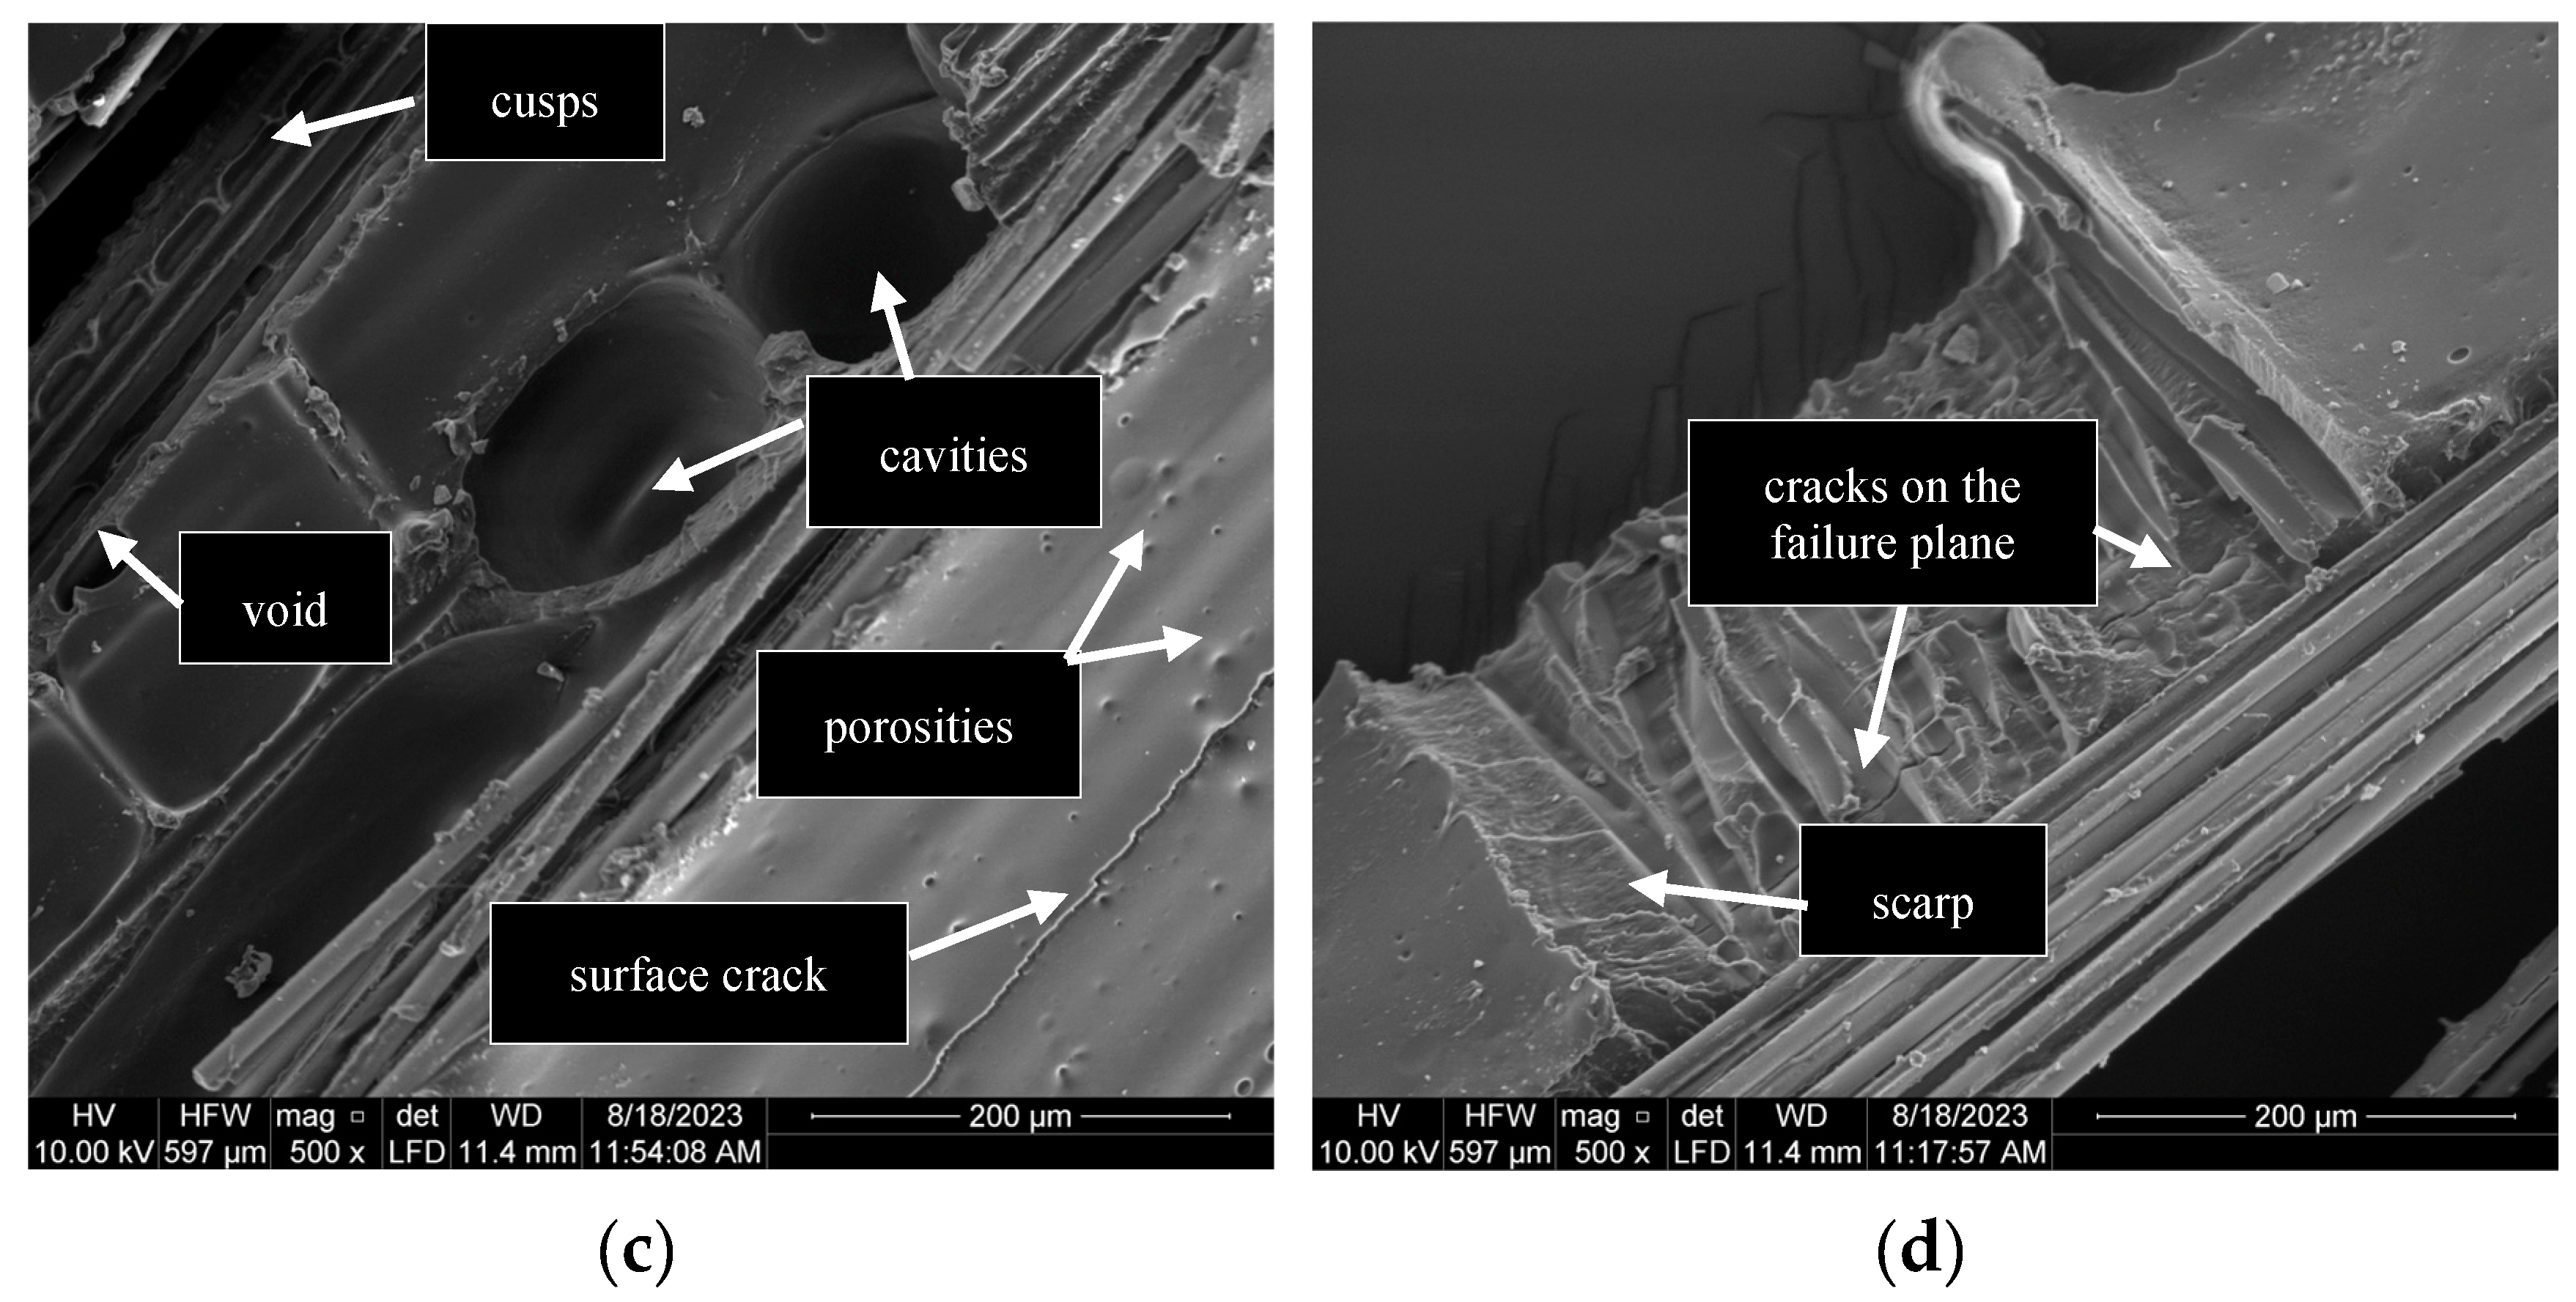
Figure 15.
Ductile fracture of the coating at dynamic strain rates (a) G4-2; (b) R8-2; (c,d) G5-2.
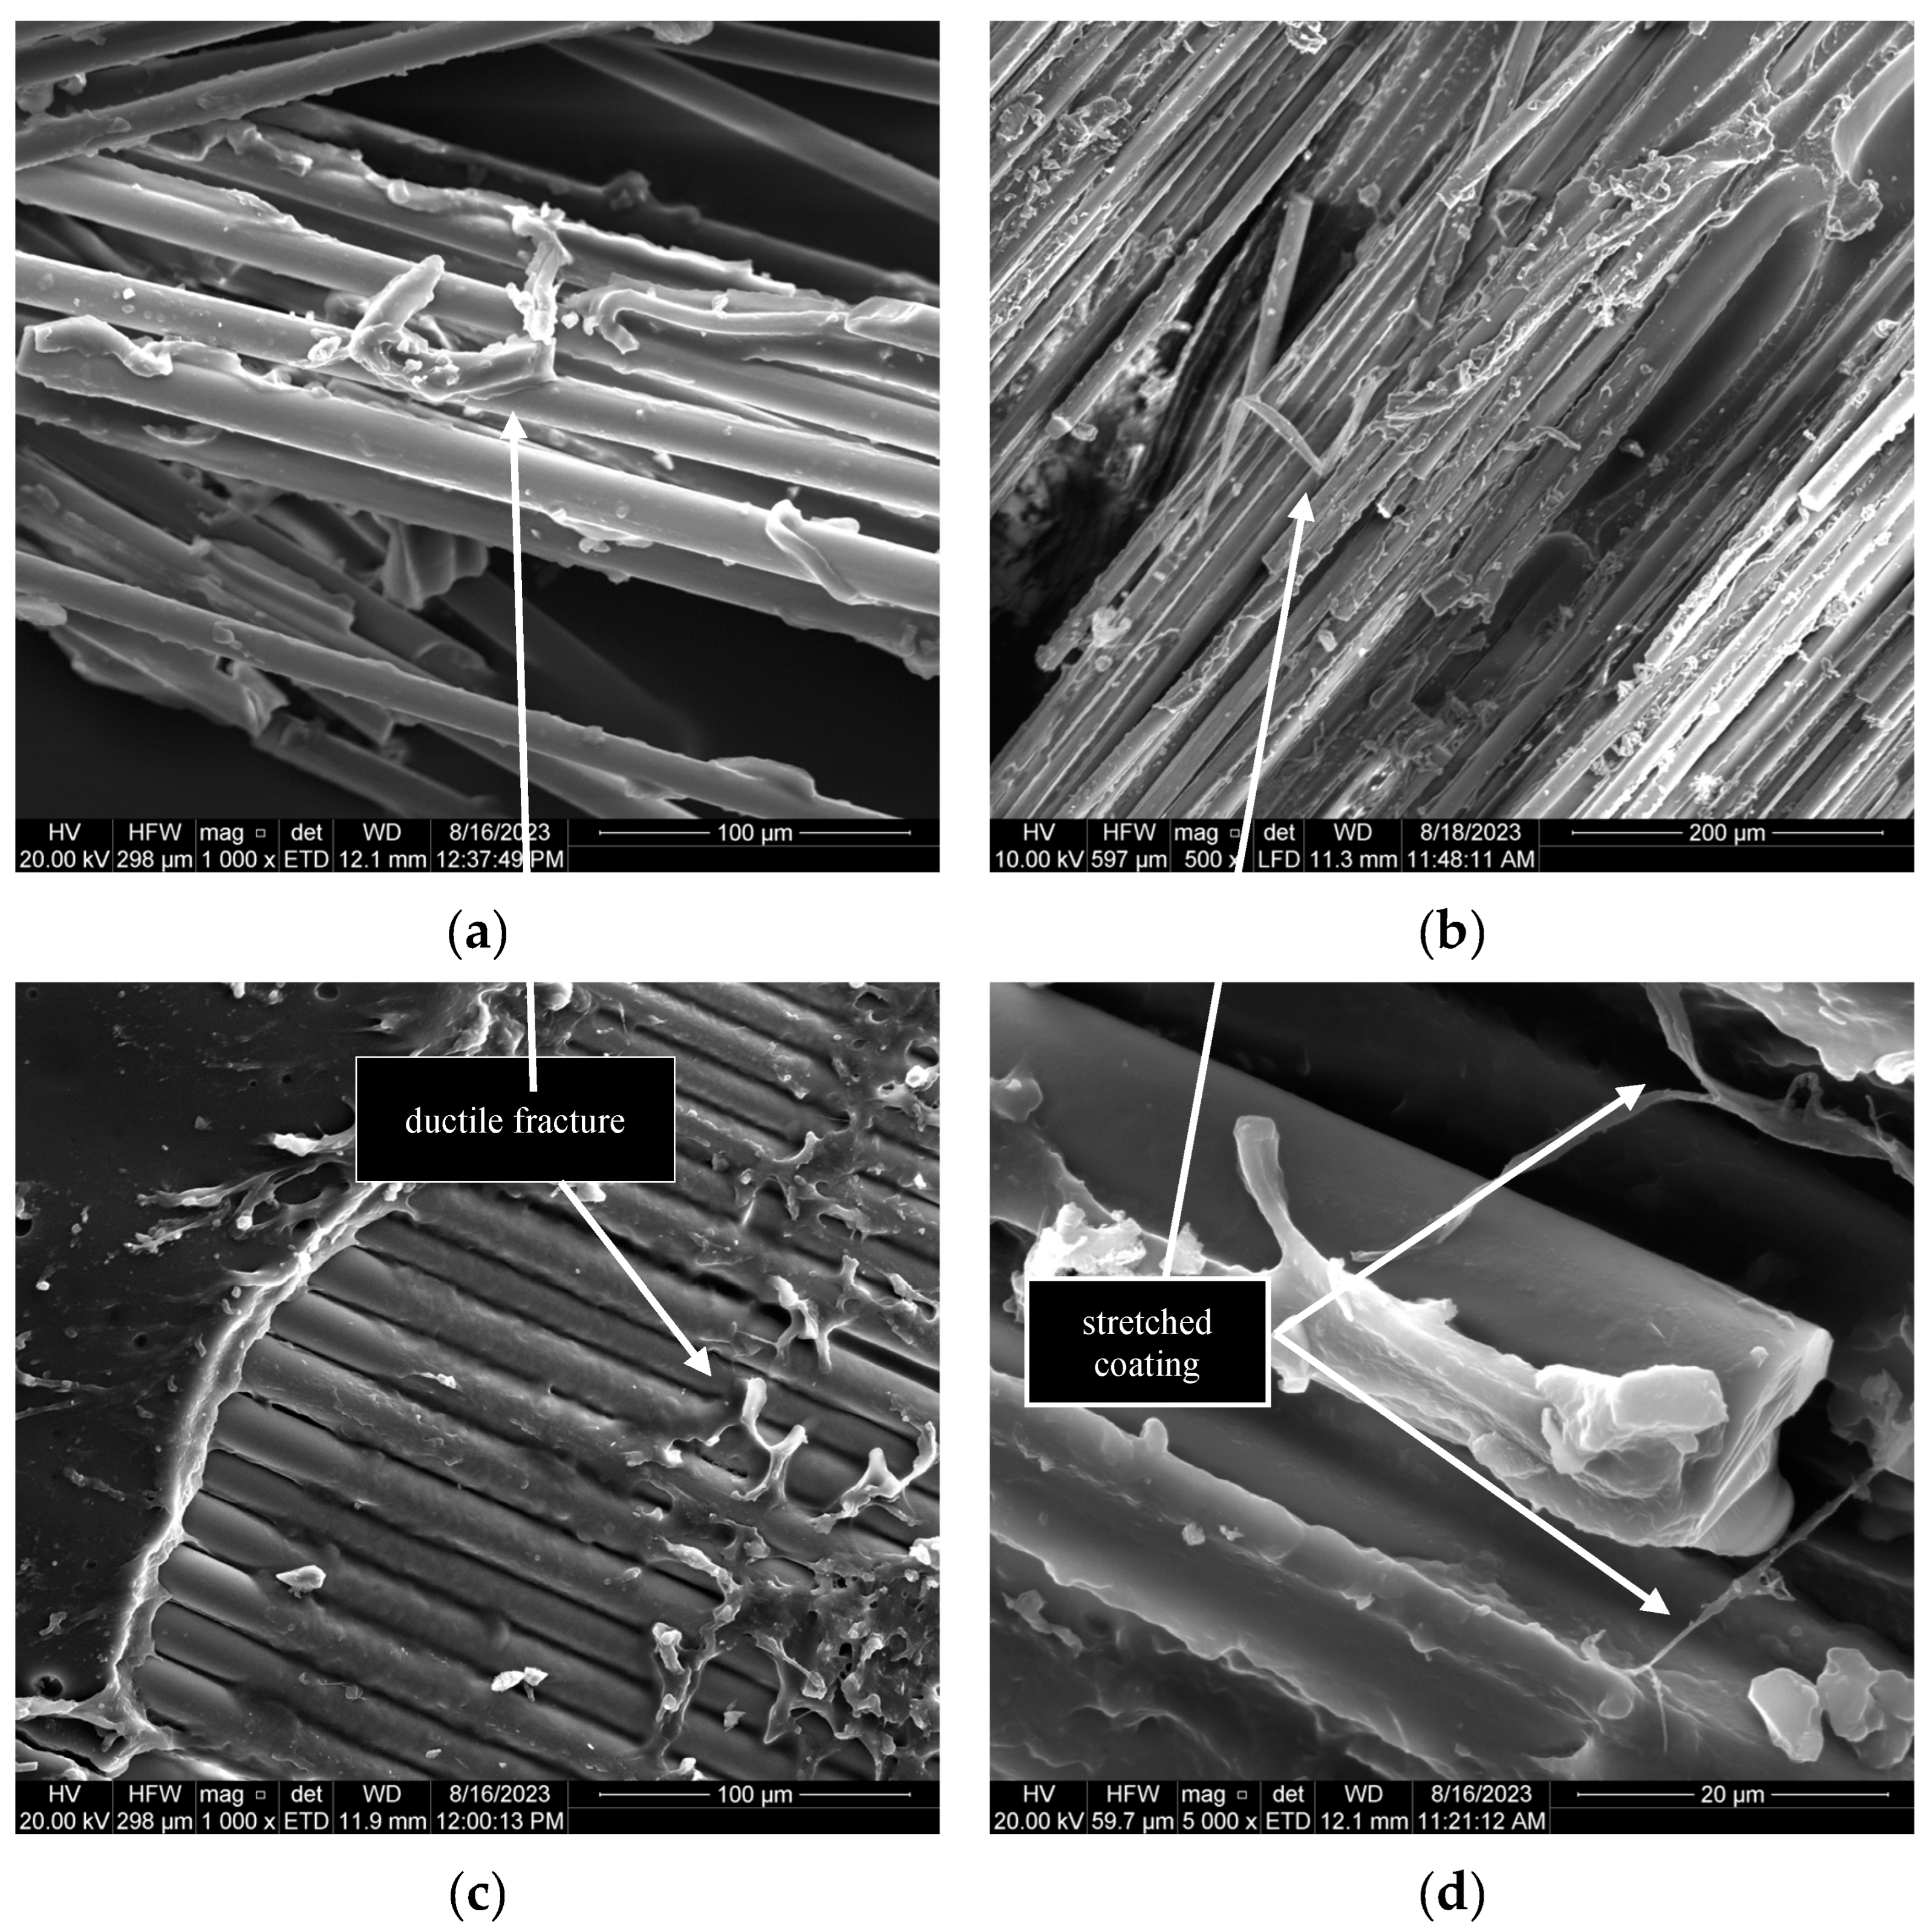
Figure 16.
Delamination fracture surfaces (a) G10-3-1; (b) R8-2.
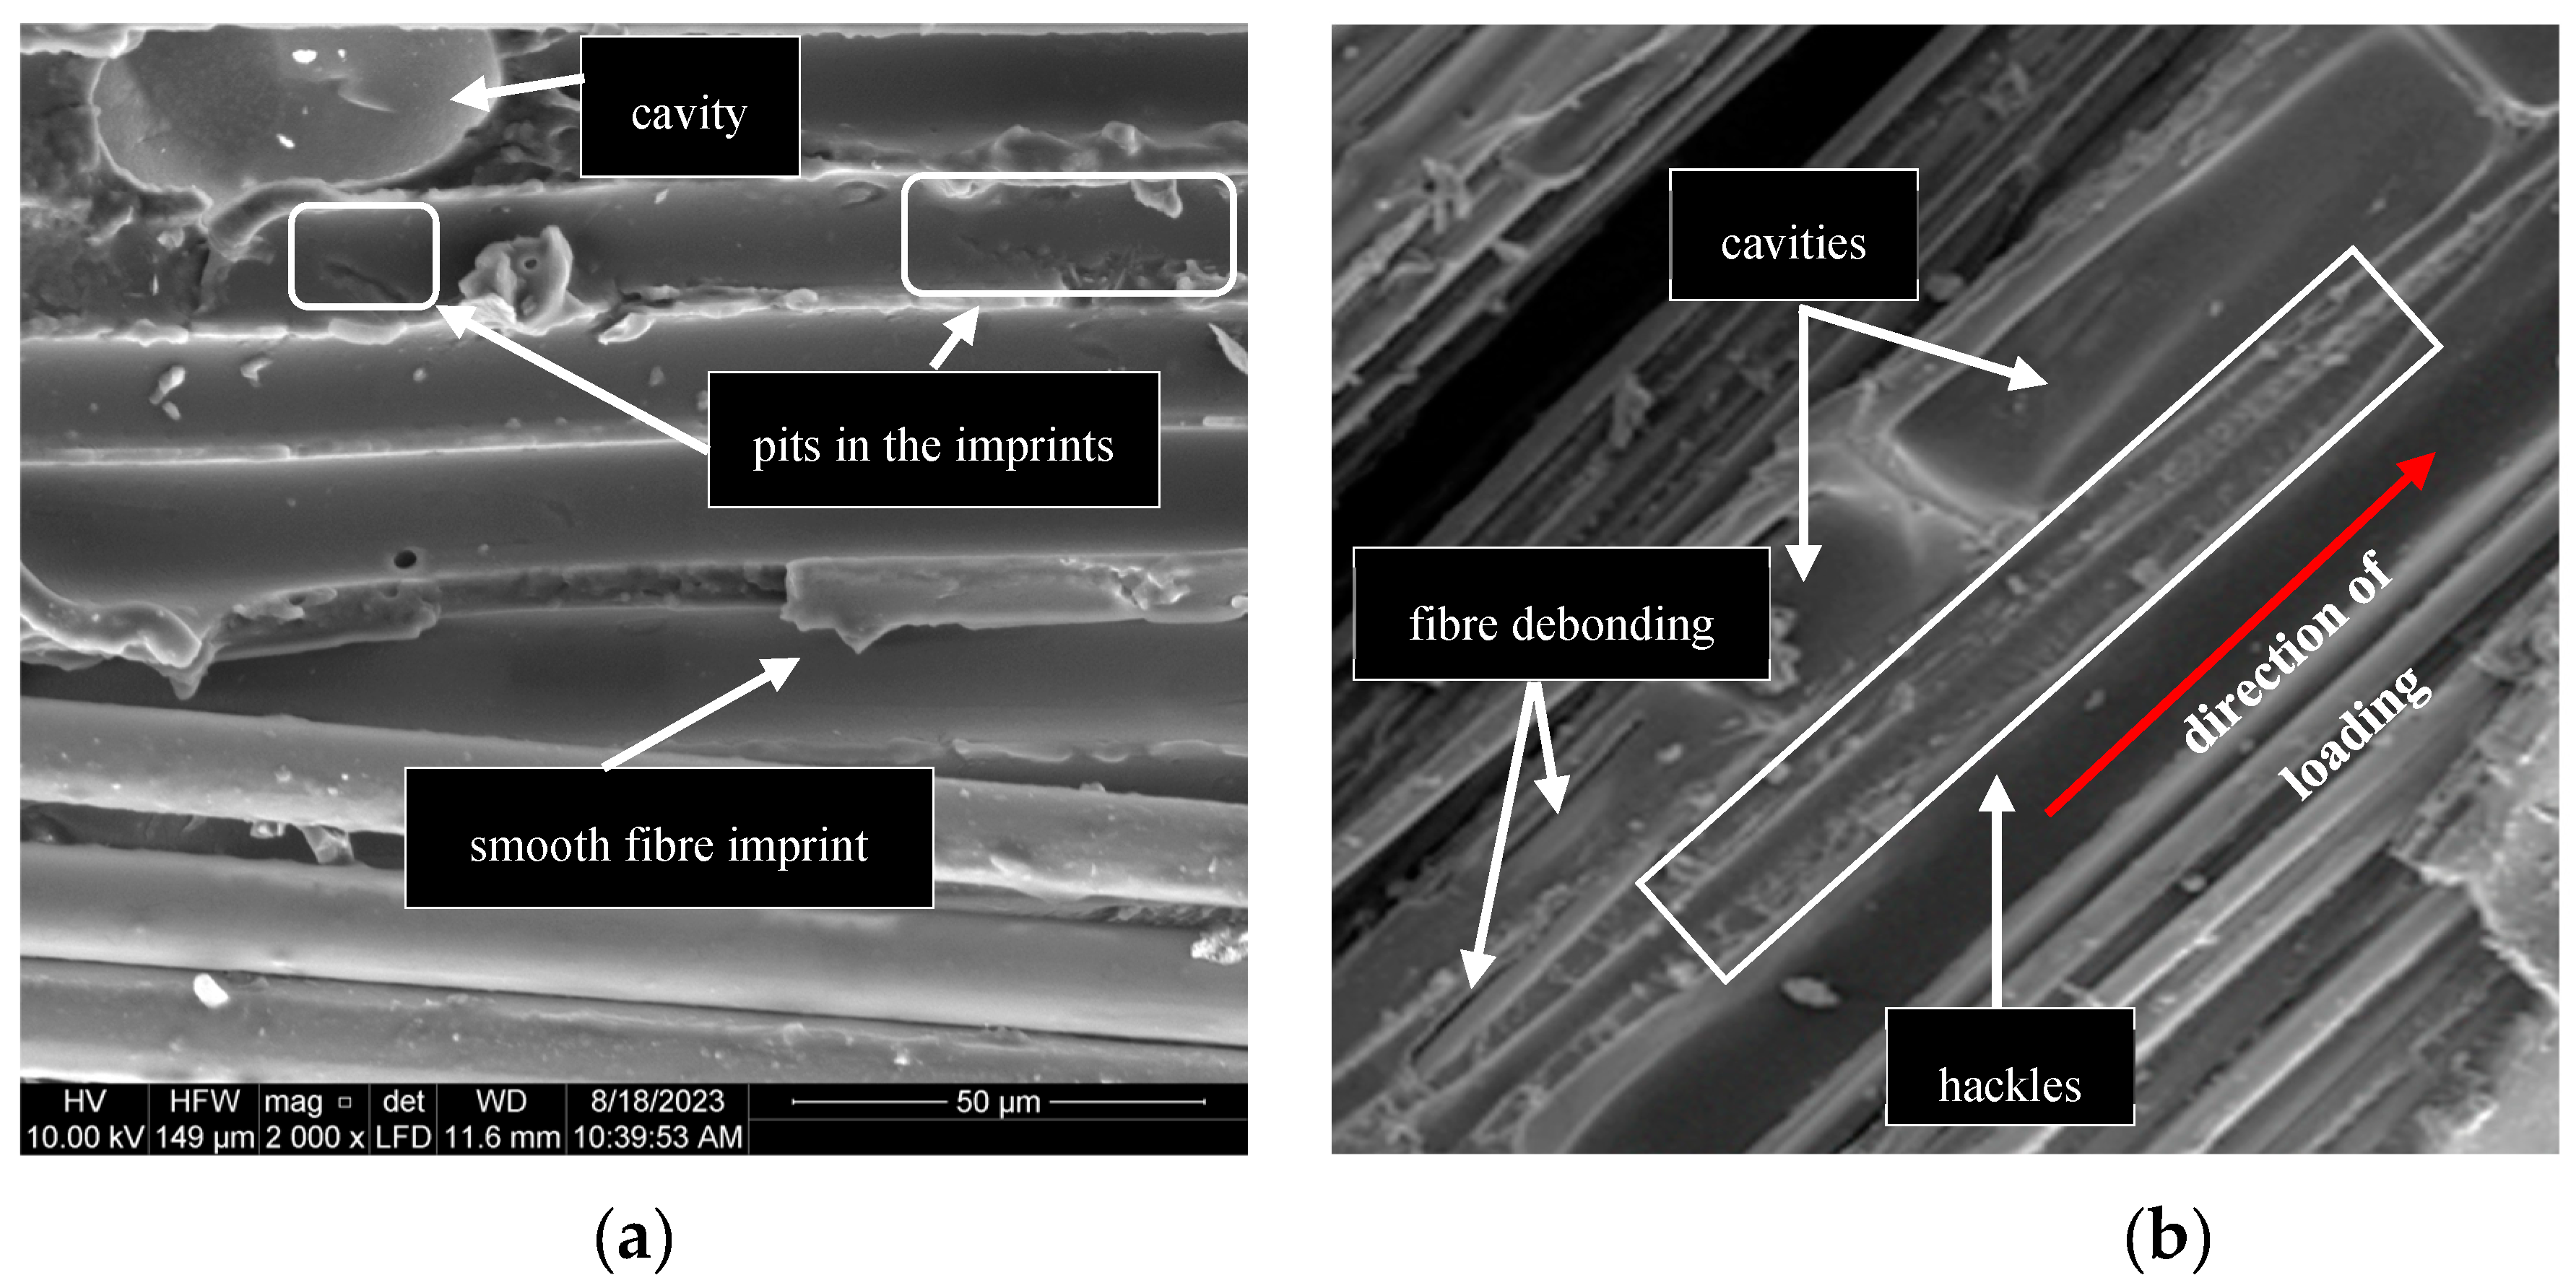
Table 2.
Elastic Modulus of grid and roving specimens.
| Specimen ID | Elastic Modulus [GPa] | |||
|---|---|---|---|---|
| LBF | E1 | E2 | E3 | |
| Grid | ||||
| G10-3-1 | 50.0 | 62.0 | ||
| G10-3-2 | 60.9 | 62.0 | ||
| G10-3-3 | 60.7 | 63.0 | ||
| G1-1 | 64.1 | 65.0 | ||
| G1-2 | 63.1 | 65.0 | ||
| G1-3 | 59.7 | 62.0 | ||
| G4-1 | 67.7 | 77.0 | 66.0 | |
| G4-2 | 66.9 | 100.0 | 68.0 | |
| G5-1 | 69.6 | 101.8 | 113.9 | 67.5 |
| G5-2 | 65.4 | 98.0 | 117.0 | 115.0 |
| G5-3 | 65.2 | 107.0 | 161.0 | 82.0 |
| G5-4 | 66.4 | 119.0 | 145.0 | 67.0 |
| Roving | ||||
| R10-3-1 | 67.8 | 73.2 | ||
| R10-3-2 | 53.4 | 57.9 | ||
| R10-3-3 | 61.6 | 61.1 | ||
| R8-1 | 63.8 | 182.8 | 166.2 | 96.0 |
| R8-2 | 62.4 | 226.1 | 387.0 | |
| R8-3 | 78.3 | 226.1 | 184.2 | 107.0 |
Table 3.
DIF model parameters for strength, ultimate strain and toughness at 5% CL, where .
| Tensile Property | Specimen type |
Parameters | P-value | |
|---|---|---|---|---|
| A | B | |||
| Tensile strength | grid | 0.0806 | 1.4564 | 0.0036 |
| roving | 0.113 | 1.6796 | 0.0265 | |
| Ultimate strain | grid | 0.0452 | 1.2919 | 0.0710* |
| roving | 0.0459 | 1.2763 | 0.0343 | |
| Toughness | grid | 0.1424 | 1.8276 | 0.0178 |
| roving | 0.1545 | 1.933 | 0.0704* | |
*Model is statistically insignificant
Disclaimer/Publisher’s Note: The statements, opinions and data contained in all publications are solely those of the individual author(s) and contributor(s) and not of MDPI and/or the editor(s). MDPI and/or the editor(s) disclaim responsibility for any injury to people or property resulting from any ideas, methods, instructions or products referred to in the content. |
© 2024 by the authors. Licensee MDPI, Basel, Switzerland. This article is an open access article distributed under the terms and conditions of the Creative Commons Attribution (CC BY) license (http://creativecommons.org/licenses/by/4.0/).
Copyright: This open access article is published under a Creative Commons CC BY 4.0 license, which permit the free download, distribution, and reuse, provided that the author and preprint are cited in any reuse.


