
Submitted:
26 November 2024
Posted:
27 November 2024
You are already at the latest version
Abstract
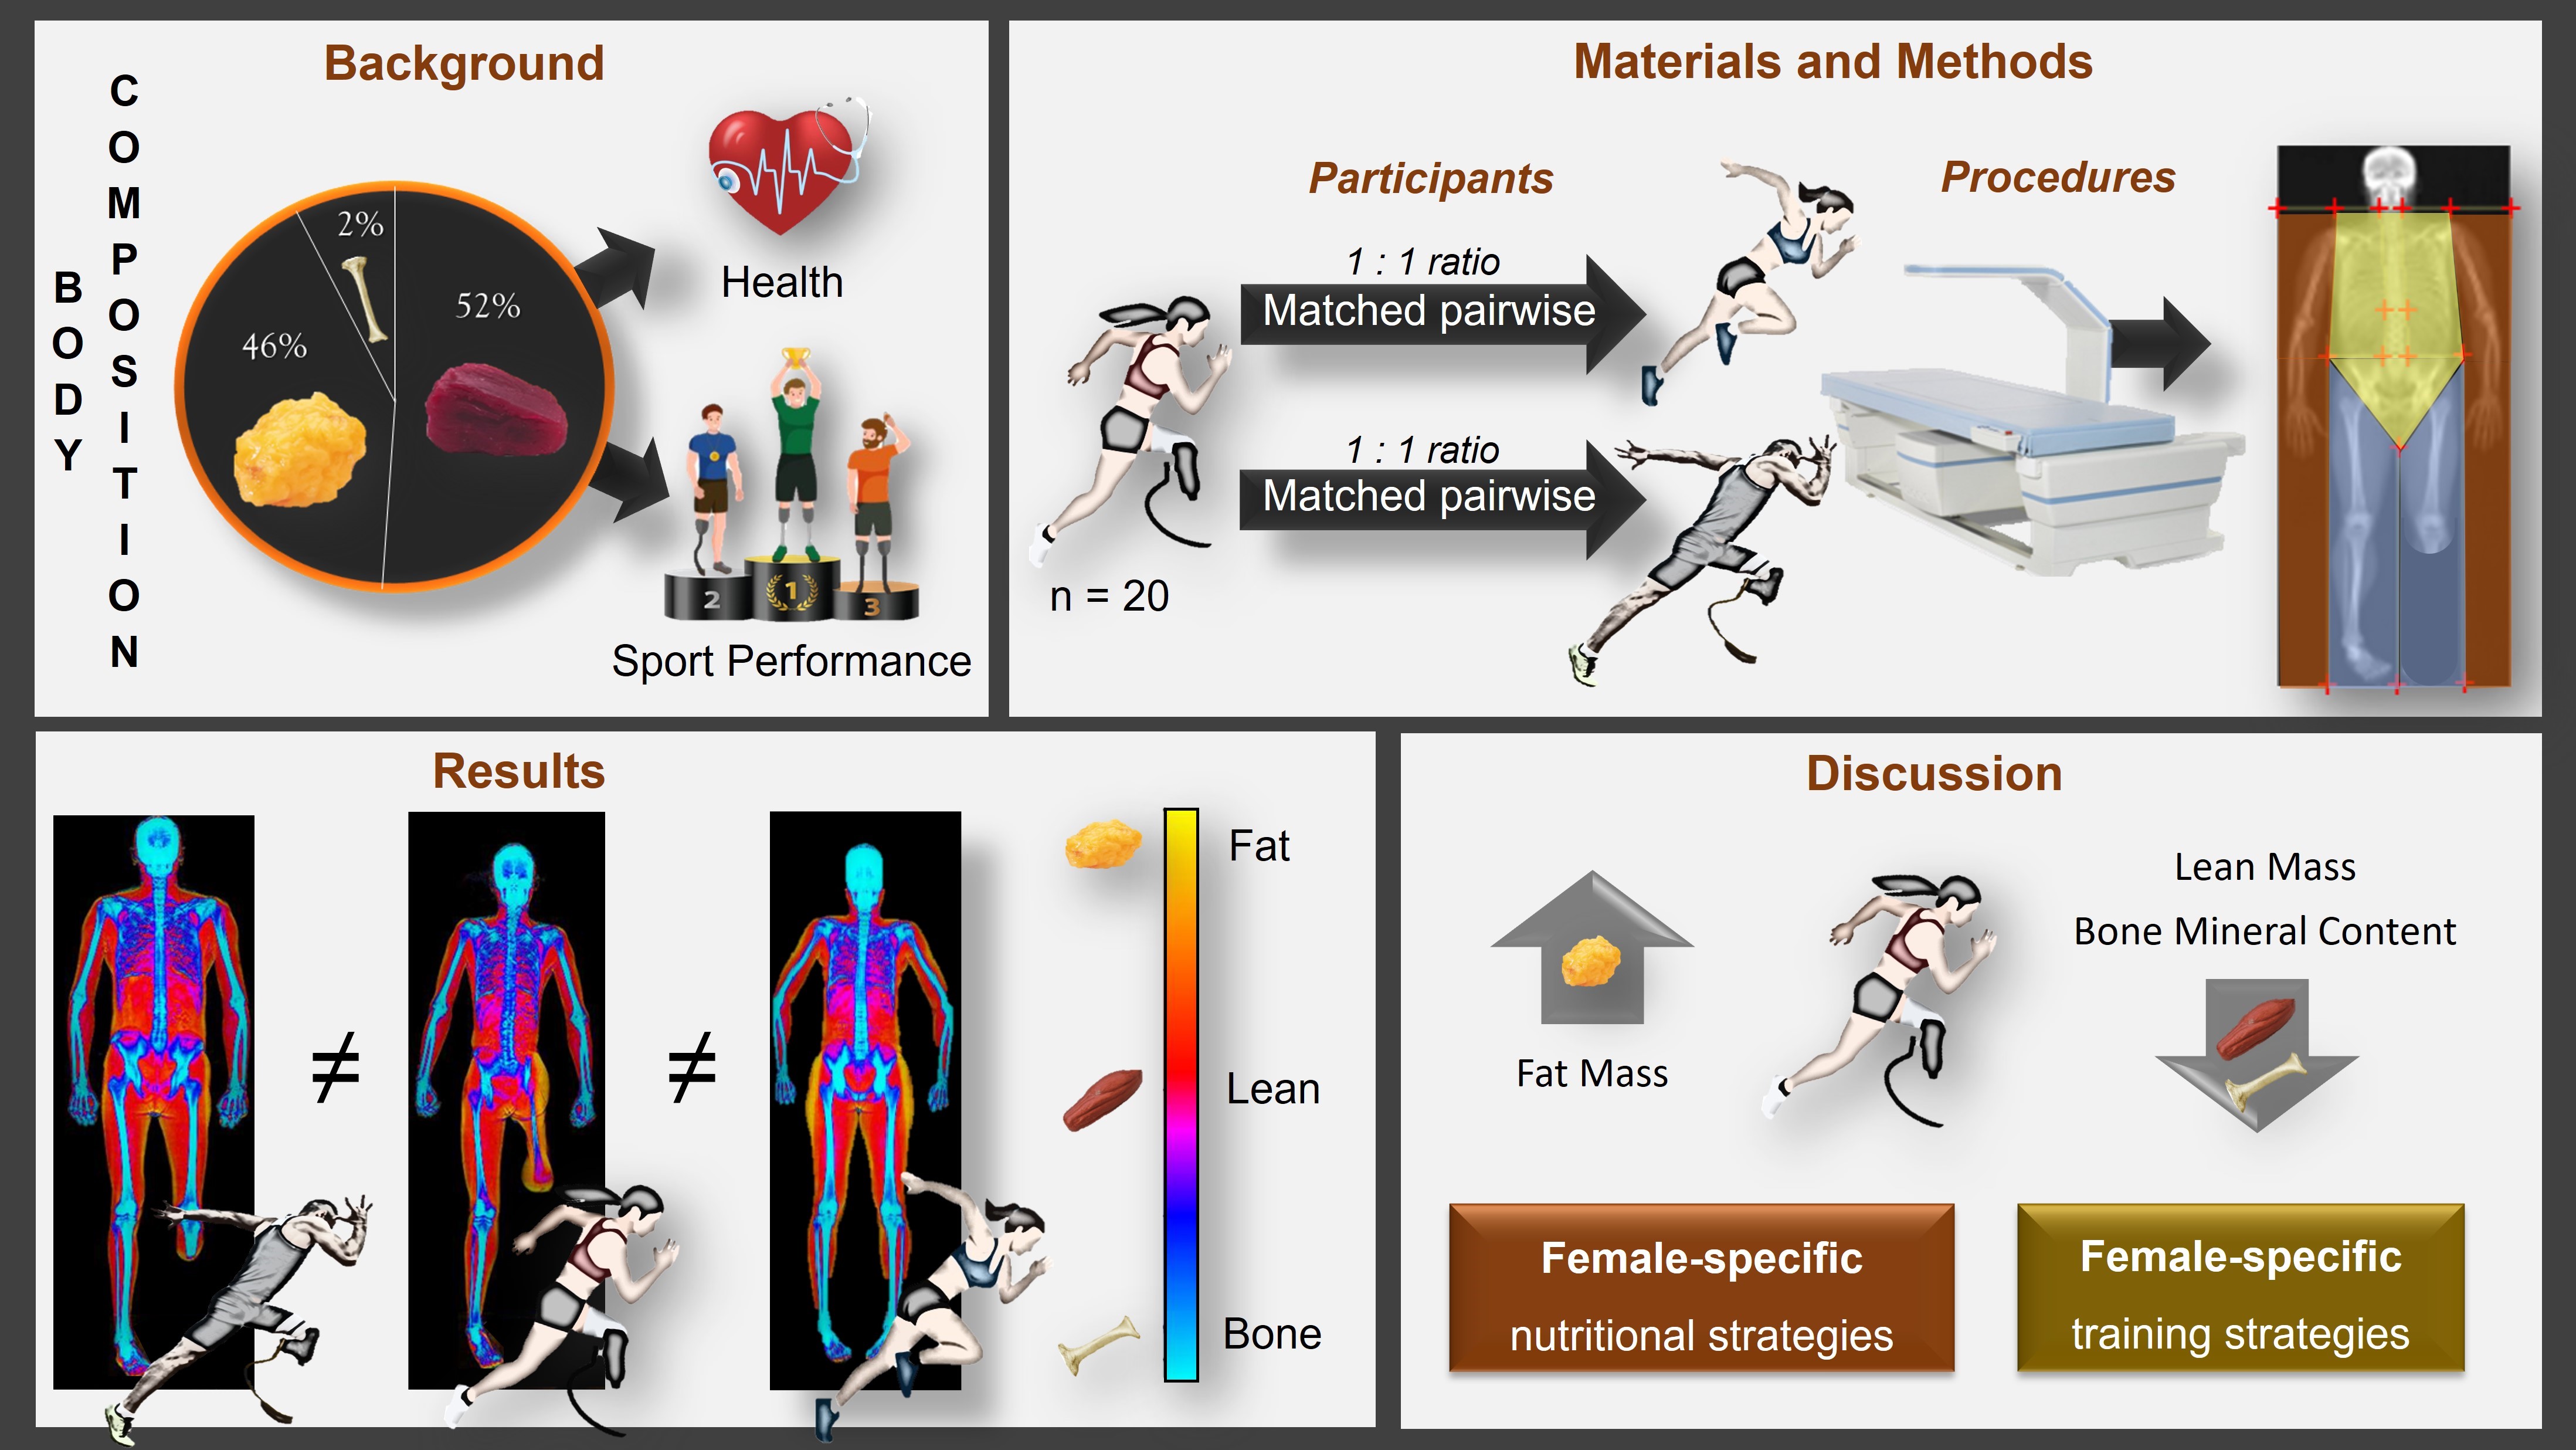
Background/Objectives: In recent years, awareness has been growing regarding the needs of fe-male athletes with physical impairment. Despite the importance of assessing body composition from both health and performance perspectives in this athletic population, there is limited literature focusing on this topic. This study explored whole-body and regional three-compartment body composition in female athletes with physical impairment to assess the impact of impairment and sex on body composition parameters in this population. Methods: Twenty female athletes with a physical impairment were pair-matched by age with an able-bodied female athlete and a male athlete with a comparable physical impairment. All athletes underwent whole-body scanning with Dual-Energy X-Ray Absorptiometry. Results: Female athletes with physical impairment showed body composition changes consisting in a higher amount of fat mass, particularly in the lower body regions. Among athletes with physical impairment, sex showed an independent effect on whole-body composition, with females showing higher fat mass and lower lean mass, and bone mineral content compared to males especially in the legs. Conclusions: Female athletes with physical impairment have a distinct body composition profile, characterized by a sex-specific dis-tribution of body tissues at the regional level. Nutritional and training strategies aimed at optimizing body composition in female athletes with physical impairments should be specifically tailored to meet the needs of this athletic population.
Keywords:
paralympic athletes
; fat mass
; lean mass
; bone mineral content
; spinal cord injury
; amputation
; Low Energy Availability
1. Introduction
In the sports field, assessing an athlete's body composition provides insight into the relative proportion of fat mass, lean mass, and other essential components. This assessment serves as a valuable tool for professionals working with athletes, as it helps understand the athlete's nutritional status and monitor the combined effects of dietary intake and training [1]. When interpreting an athlete's body composition, it is important to recognize that it reflects a complex interaction of multiple interconnected factors, including genetic predisposition, age, sex, race, ethnicity, medications, health conditions, and lifestyle choices such as diet and physical activity levels [2]. Furthermore, in the case of athletes, sports science literature has long demonstrated that body composition is also influenced by the type of sport practiced, the athlete’s specific role or playing position (especially in team sports), training volume, and level of athletic performance [1,3,4].
These interactions among interconnected factors become even more complex in Paralympic athletes, such as Wheelchair Basketball players, Sitting Volleyball players, and Para Skiers, as well as in athletes participating in adapted sports not yet part of the Paralympic Games, like Amputee Soccer or Paraclimbing. In fact, in this unique athletic population, body composition is influenced by additional factors, including the type of impairment (e.g., spinal cord injury, limb amputation, multiple sclerosis), impairment severity (e.g., level of spinal cord injury or amputation), duration of the injury, and the specific adapted sport practiced [5,6,7,8,9].
In recent years, the scientific community has increasingly focused on various aspects of body composition in athletes with physical impairment, including the validity of techniques used to estimate the different compartments of body composition, and the effort to provide reference data for characterizing this population and monitoring changes throughout the competitive season [5,6,7,8,9,10,11,12,13,14,15]. Despite the importance of assessing body composition in athletes with physical impairment [6] and the growing participation of female athletes in both Paralympic and other international events [16], research in this area is still in its early stages compared to studies on able-bodied athletes. To date, research in this field has predominantly focused on male athletes with physical impairment or on male and female athletes as a combined group, leaving a notable lack of female-specific investigations. This research gap might lead to inappropriate extrapolation of findings from male athletes with physical impairment to female athletes, or from able-bodied female athletes to those with physical impairment. Therefore, there is a need for scientific data on the body composition of female athletes with physical impairment to better characterize this unique athletic population.
In this study, we assessed body composition in female athletes with physical impairment using Dual-Energy X-Ray Absorptiometry (DXA), considered the gold standard for evaluating body composition in this athletic population [17]. The first aim of this study was to explore the impact of physical impairment on body composition by comparing female athletes with physical impairment to an age- and sex-matched control group of able-bodied female athletes. The second aim of this study was to investigate sex-related differences in body composition by comparing DXA-measured variables of female athletes with physical impairment to those of their male counterparts, matched for type and severity of physical impairment. We hypothesized that female athletes with physical impairment exhibit a distinct body composition phenotype, differing both from able-bodied female athletes and from their male counterparts.
2. Materials and Methods
For the study sample, the inclusion criteria were age > 18 years, participation in an adapted sport at a competitive level, and at least one season of sport practice. The exclusion criteria included pregnancy or breastfeeding, or the presence of other comorbidities (e.g., diabetes) in addition to the disability that could affect body composition. Twenty female athletes with physical impairments, aged 34.4 ± 8.2 years, met the inclusion and exclusion criteria and volunteered to participate in this cross-sectional study.
Physical impairments included spinal cord injury at the cervical (n = 1), thoracic (n = 2), and lumbar level (n = 1), monoplegia (n = 2), hemiplegia (n = 1), ataxia (n = 1), cerebral palsy (n = 1), nerve damage (n = 2), unilateral transfemoral amputation (n = 2), bilateral transfemoral amputation (n = 1), partial upper limb amelia (n = 2), and other musculoskeletal conditions such as reduced range of movement and limb deformities (n = 4). The origin of the disability was acquired (n = 14) or congenital (n = 6). Among those with acquired disabilities, the causes were traumatic (n = 13) or due to illness (n = 1). The average duration of the injury was 14.4 ± 9.7 years, and the average time since starting (or restarting) their athletic career after injury was 6.9 ± 8.4 years. The female athletes practiced adapted sports (e.g., Sitting Volleyball, Wheelchair Basketball, Para Table Tennis, Wheelchair Fencing, Wheelchair Rugby, Para Alpine Skiing, and Paraclimbing) for at least one competitive season. The average experience in the practiced adapted sport was 4.6 ± 5.3 years, and the average amount of training was 5.6 ± 1.9 hours per week. Female athletes with a physical impairment were either wheelchair-dependent (n = 3) or able to ambulate, even with the use of support devices such as crutches or prostheses (n = 17).
According to the purposes of this study, each female athlete with a physical impairment was matched 1:1 with an able-bodied female athlete of similar age (± 2 years) and a male athlete with a similar physical impairment. Matching criteria for both control groups included practicing a sport (or an adapted sport in the case of male athletes with physical impairments) at a competitive level for at least one year. Female non-disabled athletes were involved in various sports such as Track and Field, Alpine Skiing, Swimming, Cycling, Dancing, and Karate, while male athletes with physical impairments participated in adapted sports like Wheelchair Basketball, Wheelchair Rugby, Para Table Tennis, Sitting Volleyball, Amputee Soccer, and Handbike. To match female athletes with physical impairments to their male counterparts, the criteria included selecting a male athlete with a similar impairment in terms of type (i.e., neurological or musculoskeletal condition), location of impairment (i.e., upper limb(s), lower limb(s), or both), and ambulation modality in daily life (i.e., wheelchair-dependent or non-wheelchair-dependent). For the type of impairment, we applied strict matching criteria, pairing athletes with similar subtypes (e.g., spinal cord injury, limb amputation) and severity (e.g., level of lesion or amputation) where possible.
2.1. Testing Procedures
Testing took place in the late morning or early afternoon, after a 3–4 hour fast. All participants were instructed to avoid strenuous physical activity the day before each measurement session and to refrain from exercising on the day of the measurements.
Before the DXA scan, a questionnaire was administered to the participants to confirm their eligibility and gather general information to characterize the sample. Body mass and stature, required by the DXA software for scanning, were assessed as follows: for athletes who were able to stand, body mass was measured to the nearest 0.1 kg using an electronic scale (Tanita BWB-800 MA), and stature was measured to the nearest 0.5 cm with a Harpenden stadiometer (Holtain Ltd., Crymych, Pembs., UK), following conventional criteria and procedures [18]. For athletes who were wheelchair users and unable to stand, body mass and stature were self-reported. Body Mass Index for all participants was calculated as body mass (kg) divided by height squared (m²).
Body composition was assessed using a DXA total body scanner (QDR Horizon, Hologic MA, USA; fan-beam technology, software version 13.6.05 for Windows XP). The assessment followed “The Best Practice Protocol for the Assessment of Whole-Body Body Composition by DXA” [19], with slight adaptations to accommodate participants with physical impairments, as described by Cavedon et al. [5,6]. Specifically, athletes were instructed to void their bladder and remove all metal, jewelry, or reflective materials, including prostheses, if possible, before the DXA scan. Additionally, athletes were required to wear only underwear during scanning.
2.2. Data Analysis and DXA Outcomes
Analysis of the scans was performed by one trained researcher, specific anatomical landmarks were used to delineate the standard regions of interest (trunk, arms [right and left], legs [right and left]). The android and gynoid regions were defined automatically by the software. For statistical purposes in this study, the left and right arms, as well as the left and right legs, were considered as one region each (i.e., arms and legs, respectively).
At the whole-body level, the following DXA variables were considered: total mass (expressed in grams), lean mass (expressed in grams), bone mineral content (expressed in grams), fat mass (expressed in grams), relative fat mass (expressed as a percentage), and the fat-to-lean mass ratio. At the regional level (i.e., in the arms, trunk, and legs), we analysed the DXA values for fat mass, lean mass, bone mineral content, total mass, and relative fat mass. For the android and gynoid regions, only fat mass (expressed in absolute terms), relative fat mass, and the android-to-gynoid ratio were included in the analysis. Additionally, the Appendicular Lean Mass Index was calculated as the ratio of appendicular lean mass (i.e., the sum of lean mass in the arms and legs, expressed in kilograms) to the square of height (in meters).
2.3. Statistical Analysis
Descriptive statistics (mean and standard deviation) were computed for all variables. Data normality was assessed using the Kolmogorov-Smirnov test, variance homogeneity was evaluated with Levene’s test. A two-tailed Student's t-test for independent samples was used to compare means between two groups.
Cohen’s d was calculated to assess effect size in the Student's t-test for independent samples, with effect sizes interpreted as small (d = 0.2), medium (d = 0.5), and large (d = 0.8), following Cohen's guidelines [20].
All analyses were performed using SPSS v.16.0 (IBM Corp., Armonk, NY, USA). Statistical significance was set at P value ≤ 0.05.
3. Results
Descriptive statistics for all the variables considered are presented in Table 1.
The t-test showed no statistically significant differences in age between groups (P > 0.05 for all comparisons; Table 2). The group of females with a physical impairment was comparable to the able-bodied female group in terms of weight and stature, and similar to the male group with a physical impairment in terms of Body Mass Index (P > 0.05 for all comparisons; Table 2). Females with a physical impairment had a statistically significantly lower Body Mass Index (on average –2.5 kg/m²) than able-bodied females. They also showed lower body weight (on average –12.9 kg) and shorter stature (on average –13.1 cm) compared to males with a physical impairment (Table 2).
3.1. Comparison of DXA-Measured Body Composition Between Females with a Physical Impairment and Able-Bodied Females
As reported in Table 2 and in Figure 1, the t-test showed that, at the whole-body level, the group of females with a physical impairment had higher fat mass (both absolute and relative) and a higher fat-to-lean mass ratio compared to the females in the group of able-bodied females. At the whole-body level, no statistically significant differences were found between the two groups for lean mass, bone mineral content, and Appendicular Lean Mass Index.
Regionally, statistically significant differences in body composition between female athletes with a physical impairment and able-bodied females were found for fat mass (both absolute and relative) in the arms and trunk regions, with higher values observed in the group of females with a physical impairment compared to their female counterparts (Table 2). The group of females with a physical impairment also showed higher absolute and relative fat mass in the android (746.8 g and 11.1%, respectively) and gynoid (1003 g and 7.9%, respectively) regions compared to the group of able-bodied females. In the legs region, the group of females with a physical impairment displayed statistically significant higher fat mass (both absolute and relative), along with lower lean mass and bone mineral content (Figure 1).
3.2. Comparison of DXA-Measured Body Composition Between the F_PI Group and the M_PI Group
The t-test showed that at the whole-body level, the group of females with a physical impairment had statistically significant higher values for absolute fat mass (about +5 kg on average), relative fat mass (about +12.3% on average), total mass (about +12 kg on average), and fat-to-lean mass ratio (about +0.3 points on average), along with statistically significant lower values for lean mass (about -17 kg on average), bone mineral content (about -0.5 kg on average), and Appendicular Lean Mass Index (about -1.9 points on average). Similar differences were observed at the regional level, with the exception of total mass in the leg region and absolute fat mass in both the trunk and android regions (Table 2).
4. Discussion
This study assessed the impact of physical impairment and sex on three-compartment body composition in female athletes with a physical impairment. The present study is the first to investigate body composition in a relatively large cohort of female athletes with physical impairment in comparison with two control groups matched in a 1:1 ratio: an equivalent sample of female able-bodied athletes and of male athletes with physical impairment. The study group was carefully matched with each control group for key confounding variables. This is crucial in body composition research involving athletes with physical impairment, as the inherent large variability within this population may hamper accurate and reliable findings.
A first aim of this study was to explore the impact of impairment on body composition in female athletes with a physical impairment by assessing difference with able-bodied female athletes matched pairwise by age. The results showed that at the whole-body level female athletes with a physical impairment have higher amount of fat mass, both absolute and relative, along with higher fat to lean mass ratio (Table 1). The difference in relative fat mass between females with a physical impairment and their able-bodied counterparts at the whole-body level (9% on the average), is nearly maintained in the arms (10.8%), trunk (9.1%), and legs (11.4%) regions. This finding is supported by data from Sutton and colleagues [9] showing difference in the distribution of bone, lean, and fat mass at the regional level in a sample of female wheelchair athletes. At partial variance with our results, Sutton and colleagues [9] found improved body composition (i.e., lower relative fat mass and higher amounts of lean mass and bone mineral density) in the arms of female wheelchair athletes vs. able-bodied athletes. This is probably due to the limited number of wheelchair athletes in our sample. Future research should address the combined effect of the type of physical impairment and the type of sport practiced in athletes with a physical impairment.
The region with the greatest differences in body composition between female athletes with a physical impairment and their able-bodied counterparts was the legs. Here, female athletes with physical impairments had higher fat mass, lower lean mass and lower bone mineral content, compared to able-bodied female athletes (Table 2; Figure 1, Panels a-c). This finding is in accordance with previous data [9] reporting that female wheelchair athletes had significantly lower lean mass and bone mineral density, as well as higher fat mass in the legs compared to their able-bodied reference group. Of note, the reduction in bone mineral content (reported in our study) and bone mineral density (reported in [9]) in the legs of female athletes with a physical impairment might represent a warning for osteopenia and osteoporosis later in age. In fact, it is known that postmenopausal females tend to lose bone mineral content and bone mineral density [21], with an increased risk of osteoporotic fractures [21]. In addition to that, it is reasonable to assume that female athletes with physical impairments are at an even higher risk of osteoporotic fractures than the general female population because of the negative effects of physical impairment, e.g. long periods of immobilization and decreased gravitational loading from wheelchair use [5]. Accordingly, training and nutrition in female athletes with a physical impairment should be optimized to prevent osteoporosis and the consequent risk of fractures.
A second aim of this study was to assess the impact of sex on body composition in athletes with a physical impairment. The results support the experimental hypothesis, showing that female athletes with a physical impairment exhibit a distinct body composition profile compared to their male counterparts. Specifically, females, on average, tend to have a higher relative fat mass and lower lean mass and bone mineral content than males, both at the whole-body and regional level. At the whole-body level, female athletes with a physical impairment have, on average, 5 kilograms more absolute fat mass, relative fat mass, and higher fat-to-lean mass ratio than their male counterparts (Table 1; Figure 1, Panels c and d). This result is consistent with previous findings on sex differences in the body composition of wheelchair athletes showing that females tend to have higher fat mass than their male counterparts [7,15,22]. Mojtahedi and colleagues [15] considered a sample of 16 wheelchair athletes (i.e., wheelchair basketball and wheelchair fencing; females, n = 8) with spinal cord injuries showing that females had, on average, 11% more DXA-measured fat mass than males at the whole-body level. Similarly, Flueck [7] found, in 20 female athletes engaged in various wheelchair sports a DXA-measured relative fat mass that was about 12% higher compared to males (n = 49). Findings in athletes with a physical impairment are consistent with those in the general population showing that women have a substantially greater mean relative fat mass (about 10%) than men [23,24]. It therefore seems that, when accounting for age and type of impairment in athletes with physical impairments, sex differences in body composition should be considered innate and attributable to a combination of biological, reproductive, hormonal, and metabolic factors [23,24,25,26].
Results of the present work showed that the innate sex differences between females and males observed at whole-body are generally maintained at the regional level. In fact, as shown in Figure 1 (Panels c and d) female athletes with a physical impairment had higher absolute and relative fat mass than males in the arms (0.8 kg and 16.7%, respectively), legs (3.6 kg and 19.7%, respectively), trunk (0.8 kg and 7.9%, respectively), android (0.1 kg and 7.3%, respectively) and gynoid (1.4 kg and 16.4%, respectively) regions. These results are in line with those of Flueck [7], who reported that, compared to males, female athletes with a physical impairment had higher relative fat mass at the regional level. The largest difference in relative fat mass between the two sexes was found in the legs region (21.3%), followed by the arms (15.2%) and trunk (8.1%) regions [7]. A similar trend was observed in able-bodied non-athletic adults [23,24]. In fact, it has been reported [23,24] that male and female able-bodied non-athletic adults have similar fat mass in the trunk showing about 10% more fat mass in the arms (a lower difference than that found in athletes with physical impairments in this study) and 30% more fat mass in the legs (a higher difference than that found in athletes with physical impairments in this study). It may be hypothesized that this discrepancy is due to the different response of females and males with a physical impairment to training and diet interventions compared to able-bodied individuals, especially at the regional level.
We showed herein that females with a physical impairment have higher relative fat mass in the arms than in the trunk region, while the opposite was found in their male counterparts (Figure 1, Panels a and c). Furthermore, although both females and males have a higher relative fat mass in the legs compared to the upper body, females exhibit a greater relative fat mass in the legs than males. Females also displayed a lower android-to-gynoid fat ratio than males (Table 2), which is consistent with greater fat accumulation in the lower body of females. This pattern of fat mass distribution is consistent with findings in able-bodied individuals [25] and suggests that females and males with a physical impairments store their fat mass differently, which could contribute to sex differences in energy metabolism probably due to the typical demands of female reproductive physiology [28,29].
In recent years, awareness has been growing of the particular needs of female athletes [30,31,32,33], and Paralympic women are recognized as doubly marginalized by the intersection of gender and disability [34]. Paralympic women reported barriers in their training process [35] and a higher percentage than the Olympic female athletes reported their performance to be impacted by their menstrual cycle [36]. In particular, neurologic pain and exacerbation of multiple sclerosis symptoms have been reported by some athletes [36]. Although menstrual dysfunction, LEA, and low bone mineral density are common in paralympic athletes [37] less than 10% of athletes reported awareness of the Female Athlete Triad [38].
Fat-free mass is among the main predictors of resting metabolic rate in Paralympic athletes [39]. According to previously studies [7,40], we found lower fat-free mass and Appendicular Lean Mass Index in female compared to male Paralympic athletes. Appendicular Lean Mass Index is among the criteria for definition of sarcopenic obesity [41], independently from Body Mass Index. The latter did not differ significantly between female athletes with a physical impairment and their male counterparts. However, we observed in female athletes with a physical impairment higher fat-to-lean mass ratio, relative fat mass at the whole-body level, and in the arms, legs, android and in the gynoid regions, compared with both the group of able-bodied females and the group of male athletes with a physical impairment. Concerning central obesity, in female athletes with a physical impairment the android-to-gynoid ratio was higher and lower compared to able-bodied female athletes and male athletes with a physical impairment, respectively. In this context, it is important to underline that interleukin 6 (IL-6) levels increased 3.35 pg/ml for every unit increase in android-to gynoid fat mass ratio [42].
Information about body composition in female athletes with a physical impairment is indeed crucial for understanding the potential risk factors associated with Low Energy Availability (LEA). Body composition data helps identify how LEA may impact their fat and lean mass, and it is essential for monitoring the health consequences of LEA, such as menstrual dysfunction, bone health issues, and muscle loss. Additionally, understanding body composition allows for the development of individualized interventions aimed at optimizing both health and performance. This could involve adjusting nutrition, exercise, and recovery protocols based on the athlete’s specific body composition characteristics, ensuring they are able to meet the energy demands of both training and daily physiological functions.
This study has some limitations that should be acknowledged. First, the relatively limited number of female athletes with a physical impairment in this study prevented the investigation of body composition according to the type of physical impairment (e.g., spinal cord injury or limb amputation/s), as well as analysis of the combined effects of the type and severity of physical impairment, and the type of sport practiced. Second, we were unable to assess the dietary habits and basal metabolism of the participants, which could affect their body composition.
5. Conclusions
In conclusion, the results of the present study highlight that female athletes with a physical impairment exhibit a distinct body composition profile compared to female able-bodied athletes and male athletes with a physical impairment, characterized by a sex-specific pattern of body fat and lean tissue distribution at the regional level. Nutritional and training strategies aimed at improving (or maintaining) body composition in female athletes with a physical impairment should be specifically tailored to this athletic population. Future research in a larger sample of female athletes with a physical impairment is therefore needed to assess the combined effects of the type and severity of disability, the type of sport practiced, the dietary habits, and the many complexities of female physiology, including the menstrual cycle.
Author Contributions
Conceptualization, V.C. and C.M.; methodology, V.C. and M.S.; validation, V.C. and C.M. and Z.Z.; formal analysis, V.C. and M.S.; investigation, V.C. and A.P.; data curation, V.C. and M.S.; writing—original draft preparation, V.C., P.I.; C.Z.; visualization, T.I and C.Z.; supervision, C.M. and C.Z. All authors have read and agreed to the published version of the manuscript.
Funding
This research received no external funding.
Institutional Review Board Statement
The study was conducted in accordance with the Declaration of Helsinki, and approved by the Institutional Review Board of the University of Verona (Protocol number: 18198, 05/04/2013).
Informed Consent Statement
Informed consent was obtained from all subjects involved in the study.
Data Availability Statement
Research data will be made available upon request to the corresponding author.
Acknowledgments
The authors would like to warmly thank all the athletes who participated in the study and their technical and medical staff for kind cooperation.
Conflicts of Interest
The authors declare no conflicts of interest.
References
- Ackland, T.R.; Lohman, T.G.; Sundgot-Borgen, J.; Maughan, R.J.; Meyer, N.L.; Stewart, A.D.; Müller, W. Current Status of Body Composition Assessment in Sport: Review and Position Statement on Behalf of the Ad Hoc Research Working Group on Body Composition Health and Performance, under the Auspices of the I.O.C. Medical Commission. Sports Med 2012, 42, 227–249. [Google Scholar] [CrossRef] [PubMed]
- Heymsfield, S.B.; Wang, Z.; Baumgartner, R.N.; Ross, R. Human Body Composition: Advances in Models and Methods. Annu Rev Nutr 1997, 17, 527–558. [Google Scholar] [CrossRef] [PubMed]
- Cavedon, V.; Milanese, C.; Marchi, A.; Zancanaro, C. Different Amount of Training Affects Body Composition and Performance in High-Intensity Functional Training Participants. PLoS One 2020, 15, e0237887. [Google Scholar] [CrossRef] [PubMed]
- Milanese, C.; Cavedon, V.; Corradini, G.; De Vita, F.; Zancanaro, C. Seasonal DXA-Measured Body Composition Changes in Professional Male Soccer Players. J Sports Sci 2015, 33, 1219–1228. [Google Scholar] [CrossRef]
- Cavedon, V.; Sandri, M.; Peluso, I.; Zancanaro, C.; Milanese, C. Body Composition and Bone Mineral Density in Athletes with a Physical Impairment. PeerJ 2021, 9, e11296. [Google Scholar] [CrossRef]
- Cavedon, V.; Zancanaro, C.; Milanese, C. Body Composition Assessment in Athletes with Physical Impairment Who Have Been Practicing a Wheelchair Sport Regularly and for a Prolonged Period. Disabil Health J 2020, 13, 100933. [Google Scholar] [CrossRef]
- Flueck, J.L. Body Composition in Swiss Elite Wheelchair Athletes. Front Nutr 2020, 7, 1. [Google Scholar] [CrossRef]
- Inukai, Y.; Takahashi, K.; Wang, D.-H.; Kira, S. Assessment of Total and Segmental Body Composition in Spinal Cord-Injured Athletes in Okayama Prefecture of Japan. Acta Med Okayama 2006, 60, 99–106. [Google Scholar] [CrossRef]
- Sutton, L.; Wallace, J.; Goosey-Tolfrey, V.; Scott, M.; Reilly, T. Body Composition of Female Wheelchair Athletes. Int J Sports Med 2009, 30, 259–265. [Google Scholar] [CrossRef]
- Cavedon, V.; Sandri, M.; Peluso, I.; Zancanaro, C.; Milanese, C. Sporting Activity Does Not Fully Prevent Bone Demineralization at the Impaired Hip in Athletes with Amputation. Front Physiol 2022, 13, 934622. [Google Scholar] [CrossRef]
- Cavedon, V.; Sandri, M.; Venturelli, M.; Zancanaro, C.; Milanese, C. Anthropometric Prediction of DXA-Measured Percentage of Fat Mass in Athletes With Unilateral Lower Limb Amputation. Front Physiol 2020, 11, 620040. [Google Scholar] [CrossRef] [PubMed]
- Goosey-Tolfrey, V.L.; Keil, M.; Brooke-Wavell, K.; de Groot, S. A Comparison of Methods for the Estimation of Body Composition in Highly Trained Wheelchair Games Players. Int J Sports Med 2016, 37, 799–806. [Google Scholar] [CrossRef] [PubMed]
- Goosey-Tolfrey, V.L.; de Zepetnek, J.O.T.; Keil, M.; Brooke-Wavell, K.; Batterham, A.M. Tracking Within-Athlete Changes in Whole-Body Fat Percentage in Wheelchair Athletes. Int J Sports Physiol Perform 2021, 16, 13–18. [Google Scholar] [CrossRef] [PubMed]
- Mojtahedi, M.C.; Valentine, R.J.; Arngrímsson, S.A.; Wilund, K.R.; Evans, E.M. The Association between Regional Body Composition and Metabolic Outcomes in Athletes with Spinal Cord Injury. Spinal Cord 2008, 46, 192–197. [Google Scholar] [CrossRef]
- Mojtahedi, M.C.; Valentine, R.J.; Evans, E.M. Body Composition Assessment in Athletes with Spinal Cord Injury: Comparison of Field Methods with Dual-Energy X-Ray Absorptiometry. Spinal Cord 2009, 47, 698–704. [Google Scholar] [CrossRef]
- International Paralympic Committee Paris 2024: Record Number of Delegations and Females to Compete 2024.
- Keil, M.; Totosy de Zepetnek, J.O.; Brooke-Wavell, K.; Goosey-Tolfrey, V.L. Measurement Precision of Body Composition Variables in Elite Wheelchair Athletes, Using Dual-Energy X-Ray Absorptiometry. Eur J Sport Sci 2016, 16, 65–71. [Google Scholar] [CrossRef]
- Lohman, T.J.; Roache, A.F.; Martorell, R. Anthropometric Standardization Reference Manual: In Proceedings of the Medicine & Science in Sports & Exercise; August 1992; Vol. 24; p. 952.
- Nana, A.; Slater, G.J.; Stewart, A.D.; Burke, L.M. Methodology Review: Using Dual-Energy X-Ray Absorptiometry (DXA) for the Assessment of Body Composition in Athletes and Active People. Int J Sport Nutr Exerc Metab 2015, 25, 198–215. [Google Scholar] [CrossRef]
- Cohen, J. Statistical Power Analysis for the Behavioral Sciences; 2nd ed.; Routledge: New York, 1988; ISBN 978-0-203-77158.
- Lim, S.; Joung, H.; Shin, C.S.; Lee, H.K.; Kim, K.S.; Shin, E.K.; Kim, H.-Y.; Lim, M.-K.; Cho, S.-I. Body Composition Changes with Age Have Gender-Specific Impacts on Bone Mineral Density. Bone 2004, 35, 792–798. [Google Scholar] [CrossRef]
- Cavedon, V.; Zancanaro, C.; Milanese, C. Anthropometry, Body Composition, and Performance in Sport-Specific Field Test in Female Wheelchair Basketball Players. Front Physiol 2018, 9, 568. [Google Scholar] [CrossRef]
- Nindl, B.C.; Scoville, C.R.; Sheehan, K.M.; Leone, C.D.; Mello, R.P. Gender Differences in Regional Body Composition and Somatotrophic Influences of IGF-I and Leptin. J Appl Physiol (1985) 2002, 92, 1611–1618. [Google Scholar] [CrossRef]
- Wells, J.C.K. Sexual Dimorphism of Body Composition. Best Pract Res Clin Endocrinol Metab 2007, 21, 415–430. [Google Scholar] [CrossRef] [PubMed]
- Sanchez, B.N.; Volek, J.S.; Kraemer, W.J.; Saenz, C.; Maresh, C.M. Sex Differences in Energy Metabolism: A Female-Oriented Discussion. Sports Med 2024, 54, 2033–2057. [Google Scholar] [CrossRef] [PubMed]
- Wohlgemuth, K.J.; Arieta, L.R.; Brewer, G.J.; Hoselton, A.L.; Gould, L.M.; Smith-Ryan, A.E. Sex Differences and Considerations for Female Specific Nutritional Strategies: A Narrative Review. Journal of the International Society of Sports Nutrition 2021, 18, 27. [Google Scholar] [CrossRef] [PubMed]
- Kirchengast, S. Gender Differences in Body Composition from Childhood to Old Age: An Evolutionary Point of View. Journal of Life Sciences 2010, 2, 1–10. [Google Scholar] [CrossRef]
- Ellison, P.T. Human Ovarian Function and Reproductive Ecology: New Hypotheses. American Anthropologist 1990, 92, 933–952. [Google Scholar] [CrossRef]
- Kirchengast, S.; Huber, J. Fat Distribution Patterns in Young Amenorrheic Females. Hum Nat 2001, 12, 123–140. [Google Scholar] [CrossRef]
- Elliott Sale, K.J.; Flood, T.R.; Arent, S.M.; Dolan, E.; Saunders, B.; Hansen, M.; Ihalainen, J.K.; Mikkonen, R.S.; Minahan, C.; Thornton, J.S.; et al. Effect of Menstrual Cycle and Contraceptive Pill Phase on Aspects of Exercise Physiology and Athletic Performance in Female Athletes: Protocol for the Feminae International Multisite Innovative Project. BMJ Open Sport Exerc Med 2023, 9, e001814. [Google Scholar] [CrossRef]
- Elliott-Sale, K.J.; Ackerman, K.E.; Lebrun, C.M.; Minahan, C.; Sale, C.; Stellingwerff, T.; Swinton, P.A.; Hackney, A.C. Feminae: An International Multisite Innovative Project for Female Athletes. BMJ Open Sport Exerc Med 2023, 9, e001675. [Google Scholar] [CrossRef]
- McCleery, J.; Diamond, E.; Kelly, R.; Li, L.; Ackerman, K.E.; Adams, W.M.; Kraus, E. Centering the Female Athlete Voice in a Sports Science Research Agenda: A Modified Delphi Survey with Team USA Athletes. Br J Sports Med 2024, 58, 1107–1114. [Google Scholar] [CrossRef]
- Moore, I.S.; Crossley, K.M.; Bo, K.; Mountjoy, M.; Ackerman, K.E.; Antero, J. da S.; Sundgot Borgen, J.; Brown, W.J.; Bolling, C.S.; Clarsen, B.; et al. Female Athlete Health Domains: A Supplement to the International Olympic Committee Consensus Statement on Methods for Recording and Reporting Epidemiological Data on Injury and Illness in Sport. Br J Sports Med 2023, 57, 1164–1174. [Google Scholar] [CrossRef]
- Dos Santos, L.G.T.F.; Alves, I.D.S.; Feliciano, N.F.; Torres, A.A.O.; de Campos, L.F.C.C.; Alves, M.L.T. Brazilian Women in Paralympic Sports: Uncovering Historical Milestones in the Summer Paralympic Games. Adapt Phys Activ Q 2024, 41, 499–512. [Google Scholar] [CrossRef] [PubMed]
- Rodríguez Macías, M.; Giménez Fuentes-Guerra, F.J.; Abad Robles, M.T. Factors Influencing the Training Process of Paralympic Women Athletes. Sports (Basel) 2023, 11, 57. [Google Scholar] [CrossRef] [PubMed]
- McNamara, A.; Harris, R.; Minahan, C. “That Time of the Month” … for the Biggest Event of Your Career! Perception of Menstrual Cycle on Performance of Australian Athletes Training for the 2020 Olympic and Paralympic Games. BMJ Open Sport Exerc Med 2022, 8, e001300. [Google Scholar] [CrossRef] [PubMed]
- Blauwet, C.A.; Brook, E.M.; Tenforde, A.S.; Broad, E.; Hu, C.H.; Abdu-Glass, E.; Matzkin, E.G. Low Energy Availability, Menstrual Dysfunction, and Low Bone Mineral Density in Individuals with a Disability: Implications for the Para Athlete Population. Sports Med 2017, 47, 1697–1708. [Google Scholar] [CrossRef]
- Brook, E.M.; Tenforde, A.S.; Broad, E.M.; Matzkin, E.G.; Yang, H.Y.; Collins, J.E.; Blauwet, C.A. Low Energy Availability, Menstrual Dysfunction, and Impaired Bone Health: A Survey of Elite Para Athletes. Scand J Med Sci Sports 2019, 29, 678–685. [Google Scholar] [CrossRef]
- Weijer, V.C.R.; Jonvik, K.L.; van Dam, L.; Risvang, L.; Raastad, T.; van Loon, L.J.C.; Dijk, J.-W. van Measured and Predicted Resting Metabolic Rate of Dutch and Norwegian Paralympic Athletes. J Acad Nutr Diet 2024, S2212-2672(24)00248-X. [Google Scholar] [CrossRef]
- Egger, T.; Flueck, J.L. Energy Availability in Male and Female Elite Wheelchair Athletes over Seven Consecutive Training Days. Nutrients 2020, 12, 3262. [Google Scholar] [CrossRef]
- Booranasuksakul, U.; Tsintzas, K.; Macdonald, I.; Stephan, B.C.; Siervo, M. Application of a New Definition of Sarcopenic Obesity in Middle-Aged and Older Adults and Association with Cognitive Function: Findings from the National Health and Nutrition Examination Survey 1999-2002. Clin Nutr ESPEN 2024, 63, 919–928. [Google Scholar] [CrossRef]
- Park, A.; Ryder, S.; Sevigny, M.; Monden, K.R.; Battaglino, R.A.; Nguyen, N.; Goldstein, R.; Morse, L.R. Association between Weekly Exercise Minutes and Resting IL-6 in Adults with Chronic Spinal Cord Injury: Findings from the Fracture Risk after Spinal Cord Injury Exercise Study. Spinal Cord 2022, 60, 917–921. [Google Scholar] [CrossRef]
Figure 1.
Graphical representation of the results of the Independent Samples T-Test. Lean mass (a), bone mineral content (b), absolute fat mass (c), and relative fat mass (d). Legend: WB, whole-body level; F_PI group, group of female athletes with a physical impairment; F_ND group, group of able-bodied female athletes; M_PI group, group of male athletes with a physical impairment. *, P < 0.05 (F_PI group versus M_PI group); #, P < 0.005 (F_PI group versus F_ND group).
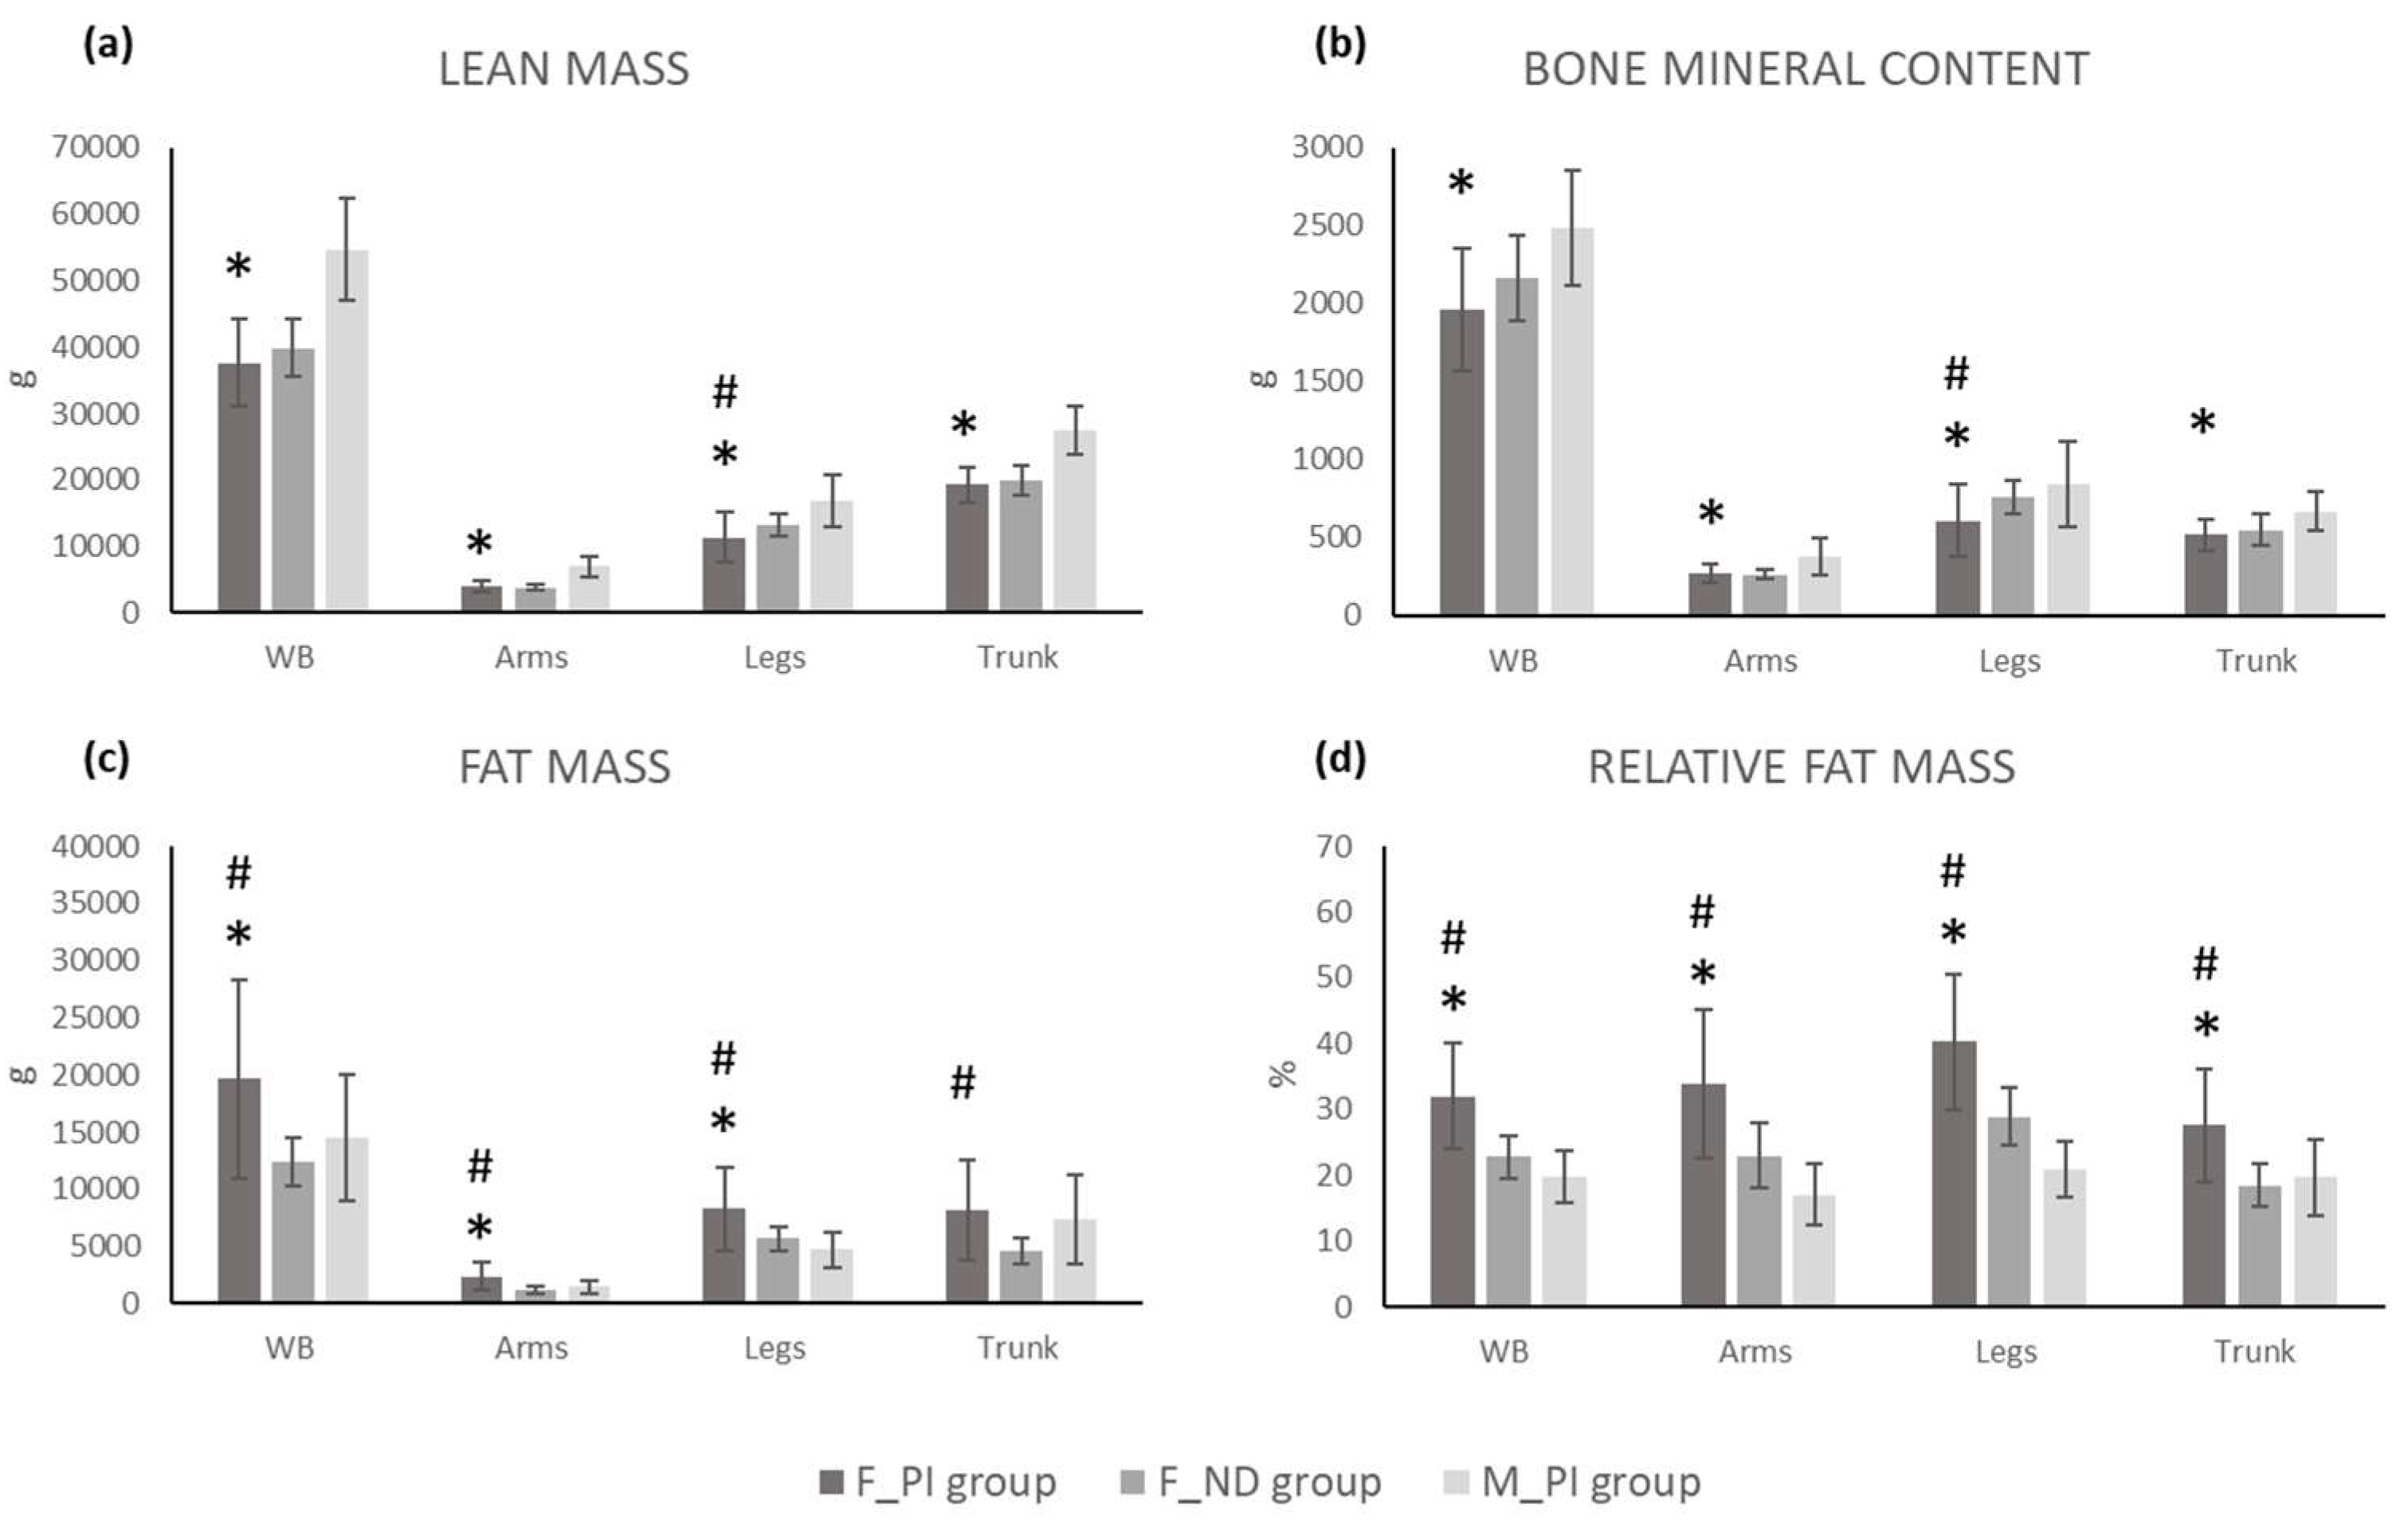

Table 1.
Descriptive statistics for all the variables considered.
| F_PI | F_ND | M_PI | ||||
| (n = 20) | (n = 20) | (n = 20) | ||||
| Mean | SD | Mean | SD | Mean | SD | |
| Demographic and anthropometric characteristic | ||||||
| Age (years) | 34.4 | 8.5 | 34.3 | 8.5 | 36.5 | 10.7 |
| Weight (kg) | 59.8 | 14.1 | 55.1 | 5.6 | 72.7 | 13.3 |
| Stature (cm) | 161.8 | 8.2 | 164.6 | 4.7 | 174.9 | 9.9 |
| BMI (kg/m2) | 22.8 | 5.1 | 20.3 | 1.6 | 23.6 | 2.8 |
| Whole-body composition | ||||||
| FM (g) | 19645.5 | 8620.6 | 12391.0 | 2164.6 | 14531.1 | 5552.4 |
| LM | 37623.7 | 6567.5 | 39814.6 | 4345.7 | 54670.4 | 7736.5 |
| BMC (g) | 1961.4 | 398.3 | 2161.3 | 273.5 | 2488.2 | 367.9 |
| Total mass (g) | 59230.3 | 14066.3 | 54366.8 | 5586.9 | 71689.7 | 12912.8 |
| RFM (%) | 32.0 | 8.0 | 22.8 | 3.1 | 19.7 | 3.9 |
| FM/LM ratio (n) | 0.5 | 0.2 | 0.3 | 0.1 | 0.3 | 0.1 |
| ALMI (kg/m2) | 5.9 | 1.4 | 6.3 | 0.6 | 7.7 | 0.9 |
| Regional body composition | ||||||
| Arms FM (g) | 2364.8 | 1234.8 | 1243.3 | 309.7 | 1516.0 | 564.4 |
| Arms LM (g) | 4068.7 | 793.5 | 3868.0 | 480.0 | 7009.2 | 1617.6 |
| Arms BMC (g) | 268.0 | 62.4 | 263.6 | 35.0 | 377.5 | 115.3 |
| Arms total mass (g) | 6703.5 | 1697.2 | 5374.9 | 637.7 | 8906.8 | 2018.6 |
| Arms RFM (%) | 33.8 | 11.3 | 23.0 | 4.8 | 17.1 | 4.6 |
| Legs FM (g) | 8278.8 | 3659.1 | 5703.1 | 1069.2 | 4725.8 | 1565.5 |
| Legs LM (g) | 11337.7 | 3733.3 | 13263.2 | 1685.7 | 16834.5 | 3991.6 |
| Legs BMC (g) | 608.3 | 236.0 | 759.0 | 110.9 | 840.5 | 270.6 |
| Legs total mass (g) | 20224.7 | 6532.0 | 19725.3 | 2195.3 | 22400.8 | 5368.6 |
| Legs RFM (%) | 40.3 | 10.3 | 28.9 | 4.4 | 20.9 | 4.3 |
| Trunk FM (g) | 8181.8 | 4343.8 | 4659.7 | 1099.6 | 7323.1 | 3876.1 |
| Trunk LM (g) | 19309.5 | 2668.4 | 19853.7 | 2275.1 | 27413.4 | 3624.4 |
| Trunk BMC (g) | 516.4 | 103.1 | 548.1 | 105.3 | 667.6 | 128.5 |
| Trunk total mass (g) | 28007.7 | 6600.6 | 25061.5 | 2971.6 | 35404.1 | 7130.7 |
| Trunk RFM (%) | 27.6 | 8.6 | 18.5 | 3.3 | 19.7 | 5.7 |
| Android FM (g) | 1379.1 | 882.9 | 632.3 | 207.7 | 1275.0 | 709.0 |
| Android RFM (%) | 29.5 | 9.5 | 18.4 | 4.5 | 22.2 | 6.5 |
| Gynoid FM (g) | 3806.2 | 1465.4 | 2803.2 | 495.3 | 2424.0 | 743.1 |
| Gynoid RFM (%) | 38.4 | 8.4 | 30.5 | 3.8 | 22.0 | 3.8 |
| A/G ratio (n) | 0.3 | 0.1 | 0.2 | 0.1 | 0.5 | 0.2 |
Legend: F_PI, female athletes with a physical impairment; F_ND, able-bodied female athletes; M_PI, male athletes with a physical impairment; SD, standard deviation; FM, absolute fat mass; LM, lean mass; BMC, bone mineral content; RFM, relative fat mass; FM/LM ratio, fat mass to lean mass ratio; ALMI, Appendicular Lean Mass Index; A/G ratio, android-to-gynoid ratio.
Table 2.
Results of the Independent Samples T-Test.
| F_PI vs. F_ND | F_PI vs. M_PI | |||||
| t value | P value | Effect size | t value | P value | Effect size | |
| General characteristics | ||||||
| Age (years) | 0.037 | 0.971 | 0.01 | -1.008 | 0.320 | 0.2 |
| Weight (kg) | 1.382 | 0.175 | 0.4 | -3.341 | 0.002 | 0.9 |
| Stature (cm) | -1.327 | 0.192 | 0.4 | -5.319 | <0.001 | 1.4 |
| BMI (kg/m2) | 2.103 | 0.042 | 0.7 | -0.695 | 0.491 | 0.2 |
| Whole-body analysis | ||||||
| FM (g) | 3.650 | 0.001 | 1.2 | 2.059 | 0.047 | 0.7 |
| LM | -1.244 | 0.221 | 0.4 | -8.287 | <0.001 | 2.2 |
| BMC (g) | -1.850 | 0.072 | 0.6 | -4.831 | <0.001 | 1.3 |
| Total mass (g) | 1.437 | 0.159 | 0.5 | -3.249 | 0.002 | 0.9 |
| RFM (%) | 4.820 | <0.001 | 1.5 | 5.969 | <0.001 | 1.8 |
| FM/LM ratio (n) | 4.707 | <0.001 | 1.5 | 5.659 | <0.001 | 1.7 |
| ALMI (kg/m2) | -1.312 | 0.197 | 0.4 | -5.212 | <0.001 | 1.5 |
| Regional analysis | ||||||
| Arms FM (g) | 3.940 | <0.001 | 1.2 | 2.691 | 0.011 | 0.8 |
| Arms LM (g) | 0.968 | 0.339 | 0.3 | -7.660 | <0.001 | 2.0 |
| Arms BMC (g) | 0.270 | 0.788 | 0.1 | -3.963 | <0.001 | 1.0 |
| Arms total mass (g) | 3.277 | 0.002 | 1.0 | -3.940 | <0.001 | 1.0 |
| Arms RFM (%) | 3.923 | <0.001 | 1.2 | 6.038 | <0.001 | 1.7 |
| Legs FM (g) | 3.022 | 0.004 | 1.0 | 3.809 | 0.001 | 1.1 |
| Legs LM (g) | -2.102 | 0.042 | 0.7 | -4.769 | <0.001 | 1.2 |
| Legs BMC (g) | -2.585 | 0.014 | 0.8 | -3.149 | 0.003 | 0.8 |
| Legs total mass (g) | 0.324 | 0.748 | 0.1 | -1.366 | 0.180 | 0.3 |
| Legs RFM (%) | 4.525 | <0.001 | 1.4 | 7.512 | <0.001 | 2.1 |
| Trunk FM (g) | 3.515 | 0.001 | 1.1 | 0.491 | 0.626 | 0.2 |
| Trunk LM (g) | -0.694 | 0.492 | 0.2 | -9.131 | <0.001 | 2.2 |
| Trunk BMC (g) | -0.961 | 0.343 | 0.3 | -4.495 | <0.001 | 1.1 |
| Trunk total mass (g) | 1.820 | 0.077 | 0.6 | -3.781 | 0.001 | 0.9 |
| Trunk RFM (%) | 4.443 | <0.001 | 1.4 | 3.241 | 0.003 | 0.9 |
| Android FM (g) | 3.682 | 0.001 | 1.2 | 0.405 | 0.688 | 0.1 |
| Android RFM (%) | 4.692 | <0.001 | 1.5 | 2.783 | 0.008 | 0.7 |
| Gynoid FM (g) | 2.900 | 0.006 | 0.9 | 3.684 | 0.001 | 1.0 |
| Gynoid RFM (%) | 3.845 | <0.001 | 1.2 | 7.804 | <0.001 | 2.1 |
| A/G ratio (n) | 4.126 | <0.001 | 1.3 | -3.967 | <0.001 | 1.0 |
Legend. F_PI, female athletes with a physical impairment; F_ND, able-bodied female athletes; M_PI, male athletes with a physical impairment; vs., versus; SD, standard deviation; FM, absolute fat mass; LM, lean mass; BMC, bone mineral content; RFM, relative fat mass; FM/LM ratio, fat mass to lean mass ratio; ALMI, Appendicular Lean Mass Index; A/G ratio, android-to-gynoid ratio. Statistically significant results are in bold.
Disclaimer/Publisher’s Note: The statements, opinions and data contained in all publications are solely those of the individual author(s) and contributor(s) and not of MDPI and/or the editor(s). MDPI and/or the editor(s) disclaim responsibility for any injury to people or property resulting from any ideas, methods, instructions or products referred to in the content. |
© 2024 by the authors. Licensee MDPI, Basel, Switzerland. This article is an open access article distributed under the terms and conditions of the Creative Commons Attribution (CC BY) license (http://creativecommons.org/licenses/by/4.0/).
Copyright: This open access article is published under a Creative Commons CC BY 4.0 license, which permit the free download, distribution, and reuse, provided that the author and preprint are cited in any reuse.


