
Submitted:
26 November 2024
Posted:
27 November 2024
You are already at the latest version
Abstract
Given the abundance of kikuyu biomass resulting from the pruning of green areas, the aim of this study was to evaluate its use as a biosorbent (BK) for Cr (III) removal from polluted waters. The biomass was activated using H2SO4 (1.25%) and, NaOH (3.25%), and then characterized using Fourier-Transform Infrared Spectroscopy (FTIR) and, Scanning Electron Microscopy/Energy Dispersive Spectroscopy (SEM/EDS). The surface area was measured using the Brunauer-Emmett-Teller (BET) method. The adsorption process was carried out by employing a jar test, evaluating the adsorption capacity (q) as a function of biomass granulometry, dose (BK) and the pH of the solution. In addition, the kinetic process, BK regeneration and adsorption capacity on fur industry effluents were evaluated. Our results confirmed the presence of active groups on BK such as: –OH, -C=C-, -C=O, and -C-O-, with an increase of 1308.58% in specific surface area, as well as the presence of chromium. The three variables under study were significant and related in a mathematical model. Maximum adsorption capacities (qmax) of 47.9, and 37.6 mg/g were obtained when using synthetic waters and fur industry effluents, respectively. The pseudo-second-order kinetic model confirmed that the adsorption mechanism is chemisorption. Furthermore, it was possible to regenerate the BK at a pH of 3 with an adsorption capacity of 28.7 mg/g. The possibility of using kikuyu within the circular economy was demonstrated.
Keywords:
kikuyu
; biosorption
; Cr (III)
; fur effluents
; regeneration
; kinetics
1. Introduction
Caring for the environment, is both a necessity and a requirement for sustainable development, a responsibility that each society assumes for future generations. Metallurgical, electroplating, tanning, leatherworking, pulp production, battery and paper printing ink industries, among others, are of high environmental significance due to the presence of Cr (III) and Cr (VI) in their effluents. These effluents, ranging from tens to hundreds of mg/L, cause negative environmental impacts [1,2,3,4]. The tanning industry has been extensively developed in the south of Peru. Leatherworking is other important form of artisanal production in the Cusco Region, generating effluents with a pollution load of Cr (III) equivalent to one-third of the chromium salt used [5]. The These effluents can be treated via conventional treatment processes such as chemical precipitation, flotation, ion exchange, membrane separation, electrocoagulation, and adsorption [6,7]. Among these methods, biosorption is a physicochemical phenomenon where solute particles, in solution, accumulate themselves on the surface of a biomass (alive or dead) [7,9]. Peru has a wide range of plant species that are interesting to study as biosorbents for removing of contaminants in water. There have been suggestions to reorient efforts toward species of plants that are typically considered weeds, grow during the rainy season, lack potential for medicinal applications, or are not registered as a traditional medicine from their country of origin. Kikuyu (Pennisetum clandestinium Hochst) belongs to these types of biomasses. Belonging to the Poaceae family and originating of Africa, it has been reported in Peru, where it is considered an invader of natural forests, crops, agricultural and coastal areas, as well as, roadsides, and in some cases, it is used in dairy production systems [10]. Biomasses contain chemical functional groups in their structures that retain pollutants through electrical attractions, van der Waals forces, or their chemical nature [11,12]. Approximately 60-90% of biomass is composed of polymeric substances that could form stable complexes with heavy metals through their functional groups; for example, carboxylic acids, phosphates, sulfates, amines, and amides [13,14,15,16,17]. It is interesting to note that the properties and characteristics of surface biomass depend on, among other aspects, the prior treatment of the natural material, which could increase its adsorption performance [18]. Thus, acid and/or basic treatment of biomaterials enables an increase in their adsorption capacity, as it leads to a rupture of their polymer chains and the emergence of a greater number of functional groups from cellulose [19]. Therefore, in this study, we aimed to evaluate the biosorption capacity of Cr (III) from polluted waters using the residual biomass of kikuyu (Pennisetum clandestinum Hochst) activated via acid and basic treatment. For this reason, we conducted a physical, chemical and morphological characterization of the BK biosorbent, evaluating the influence of the biosorbent particle size, dose and pH of the polluted solution on the adsorption capacity. In addition, we established a mathematical model to relate the variables under study, as well as a kinetic model for kikuyu regeneration from the saturated biosorbent with Cr (III), treated under various pH conditions. Finally, the Cr (III) adsorption capacity of the effluent obtained from the ASAPES fur industry was evaluated using the biosorbent.
2. Materials and Methods
Biosorbent Preparation
A total of 1 kg of kikuyu (Pennisetum clandestinum Hochst), was collected from the gardens at the Universidad Nacional de San Antonio Abad del Cusco (UNSAAC), washed with deionized water, dried in a KYNTEL forced convection oven at 80 °C for 24 hours, weighed (EUROTECH precision analytical digital scale, model FSF-A2204B, repeatability +/- 0.1 mg) and ground. The obtained biomass (B) was activated, following the method reported in [7,20] in soxhlet equipment via acid treatment with H2SO4 (p.a. 97%, SCHARLAU brand) at 1.25% for 60 minutes and then dried. This was followed by basic treatment with NaOH (98.8% SCHARLAU brand) at 3.25% for 60 minutes and subsequent drying. Then, the activated biomass was sifted through certified ASTM standard Tyler meshes No. 70, 100 and 140 and stored in a desiccator. The resulting product constitutes the biosorbent (BK).
Biosorbent Characterization
The active functional groups of B, BK and saturated biosorbent with Cr (III) (BKS) were identified using Fourier Transform Infrared Spectroscopy (FTIR), in the range of 380 cm-1 to 4000 cm-1, employing a PERKIN ELMER spectrophotometer with Spectrum 10 software Origin [21].
The measurement of the specific surface areas and characteristics of the mesopores of B and BK were carried out using Brunauer-Emmet-Teller (BET) analysis in a MICROMETRICS surface area analyzer. Prior to the N2 sorption experimental runs, each sample was degassed with He through a heat treatment at 200 °C for 6 hours under vacuum.
Using Scanning Electron Microscopy (SEM) [6], the morphology and the presence of characteristic elements were elucidated for the BK and BKS samples’ spectra through photomicrographs. For this analysis, a scanning electron microscope was used. (SEM/EDS, FEI QUANTA 650, detector: EDAX model OCTANE PRO).
Biosorption Tests with Synthetic Polluted Water
A standard stock solution with a concentration of 250 ppm Cr (III) was prepared from Cl3Cr∙6H2O salt (99%, Merck). The biosorption tests were carried out using jar test equipment (DAIHAN SCIENTIFIC, Model JT-M6C), employing synthetic polluted water containing 50 mg/L Cr (III) (a concentration that exceeds the concentrations of chromium from fur effluents in the region) with a volume of 300 mL. The stirring speed was 150 rpm, with tests conducted for 2 hours. We utilized with a Multivariable Factorial Experimental Design 23. Table 1 shows the independent variables and their respective levels. The total number of trials was 33, considering 3 midpoints, and 2 replications.
At the end of each test, the samples were filtered using Wattman N°40 filter paper, where the residual Cr (III) content was analyzed via a Flame Atomic Absorption Spectrophotometer (THERMO SCIENTIFIC, AA ICE 3300) at 357.87 nm. The number of chromium ions adsorbed (q) in mg Cr/g biosorbent, during the series of batch experiments, was determined using the mass balance equation [9]:
where q is the adsorption capacity of Cr (III) in mg/g, Cf is the final concentration of Cr (III) in ppm, Ci is the initial concentration of Cr (III) in ppm, V is the volume of the solution in liters (L), and m is the mass of biosorbent in grams (g). The biosorbent size (T), dose (D), and pH conditions that reached the highest q were fixed as parameters for the following tests.
Statistical Analysis
The data obtained were statistically treated with the Statgraphics Centurion 18 software, to determine the effect of the independent variables (T, D and pH) on q. These variables were assessed through ANOVA, the mathematical prediction model, and its goodness of fit.
Kinetics Study
The biosorption kinetics of Cr (III) on BK were analyzed by fitting the experimental data to the pseudo-first-order, pseudo-second-order, and Elovich kinetic models, as reported in [22]. For this purpose, 300 mL of a polluted solution with Cr (III) (50 mg/L) was prepared, with the biosorbent dose (D) and pH determined in the previous tests, and stirred at a speed of 150 rpm. At different times, 10 ml aliquots were taken up to 2 hours and then filtered, and the concentration of Cr (III) was subsequently determined via atomic absorption. Two replicates were performed for each test. The linearized forms of the kinetic models are expressed using Equations (2)-(4):
where q is the adsorption capacity at time t (mg/g), t is the contact time (min), qe is the adsorption capacity at equilibrium (mg/g), k1 is the constant rate (min-1), k2 is the pseudo-second order rate constant (g∙mg-1∙min-1), α is the initial adsorption rate (mg/g min) and β is the ratio with the covered surface and the activation energy for chemisorption, (g/mg).
Saturated Biosorbent Regeneration
The regeneration tests involved desorbing Cr (III) from the BKS obtained during biosorption process under conditions where higher q values were achieved. To achieve this, 25 ml solutions with varying pH (3,4,8, and 9) were added to the BKS in a shaker (ORBITAL, MU-E25-91146), utilizing a stirring speed of 50 rpm for a period of 2 hours. Afterward, the samples were filtered and the Cr (III) concentration that was released from the saturated biosorbent was determined via atomic absorption (AA). The percentage of desorption was calculated using Equation 5 [23]:
where Cad is the Cr (III) adsorbed concentration in mg/L, and Cds is the desorbed concentration in mg/L. The regenerated biosorbent (BR) was dried in the environment. The Cr (III) adsorption capacity (q) of a polluted solution containing 50 mg/L Cr (III) was tested again, employing a volume of 300 mL, a stirring speed of 150 rpm, and a duration of 2 h. Regeneration tests were performed in triplicate.
Biosorption of Fur Industry Effluent
Finally, the Cr (III) adsorption process using BK was tested in a real sample. This sample was collected from the ASAPES fur industry (Sicuani-Cusco-Peru), specifically being an effluent from the tanning bath process. A composite sample of 3 L was taken and filtrated using Wattman No. 40 paper. Then, 300 mL of water was treated at a stirring speed of 150 rpm for a duration of 2 h. The residual concentration of Cr (III) was measured via AA, and the adsorption capacity q was calculated using Equation (1).
3. Results and Discussion
3.1. Biosorbent Characterization
Figure 1 shows the FTIR spectra of B, BK, and BKS, respectively, where a large number of absorption peaks are observed that characterize the presence of the functional groups -OH (3285 cm-1), -C=O (1634 cm-1), -C-O- (1041 cm-1), and C=C- (1690 cm-1)), confirming its lignocellulosic nature [23]. The first three functional groups, where the oxygen atom is present with its two pairs of free electrons, provide the BK points of high electron density, which become active adsorption centers. In the case of the group C=C- the electron density arises from the π bond; therefore, the group C=O has a higher electronic density [4]. The difference between the spectra occurs with lower values of transmittance percentage (higher absorbance percentage), indicating a better arrangement of the negatively charged functional groups in BK with respect to B. This is attributed to acid base treatment [24] and its screening with Cr (III) cations (BKS), whereby the active attraction of these cations towards the surface of the BK in the adsorption process occurs. This is due to complexation with functional groups that contain oxygen such as the hydroxyl group and electrostatic attraction using carbonyl, confirming effective adsorption of a chemical nature [25].
Through BET analysis, it was possible to estimate that 1 g of kikuyu biomass has 0.0303 m2 of specific surface area, increasing to 0.4268 m2 (an increase of 1308.58%) due to the acid treatment solubilizing the hemicellulose and the basic treatment rupturing its polymer chains, thereby increasing the porosity and surface area of the biosorbent and, thus, increasing the quantity of ionic functional groups [20,24]. In [26], higher specific surfaces areas for the biomasses of banana piths, pineapple stems, and bamboo stems were determined; these results could be attributed to the chemical modifications that those biomasses underwent. The morphological micrograph (A) of the BK (Figure 2) shows an elongated, striated, laminated solid structure formed by horizontal rough plates with the presence of randomly distributed surface undulations and cavities, providing surface texture and different levels of microporosity, which, thus, enhances adsorption capacity [21,23]. The micrograph of the BKS (a), however, presents an ordered honeycomb-shaped structure, which could be due to the saturation of the pores with Cr (III). Similar structures are shown in [27,28].
EDS elemental analysis of the BKS (Table 2) confirmed the presence of Cr (III), aligninig with its organic nature, which is due to the high presence of carbon.
The results of the characterization using FTIR spectroscopy, the BET method, and scanning electron microscopy (SEM/EDS) show the potential of the biosorbent to remove Cr (III) from polluted waters.
3.2. Biosorption Tests and Statistical Analysis
Table 3 shows the average results of the adsorption capacity (q). An analysis of the results shows that a minimum Cr (III) adsorption capacity was achieved in test 6, corresponding to 21.3 ± 3.6 mg/g under lower pH conditions (4.8) of the polluted solution, a higher dose (1 g/L), and higher biosorbent size (212 μm). The highest adsorption capacity (47.9 ± 4.5 mg/g) was achieved in test 10, which included the highest pH (5.5), a lower biosorbent dose (0,5 g/L) and a lower biosorbent size (106 μm). This performance could be due to the fact that at a higher pH, there is less competition between hydrogen ions and Cr (III) cations [29]. Similarly, if the particle size is smaller, the active groups are more available for the absorbate and facilitates diffusion into the pores. However, a lower dose involves the presence of the active sites necessary for the adsorption of Cr (III), with a lower presence of unsaturated active sites. In [30], it was indicated that higher doses of biosorbent could cause agglomeration or superposition on the active sites, thus preventing the desired electrostatic interactions that would affect the decrease in adsorption capacity. The results obtained in this research exceed the performance of a Cr (III) biosorbent prepared with Saccharomyces cerevisiae in [31] (11.85 mg/g). Higher Cr (III) adsorption capacities were reported by [28], who tested yellow passion fruit peel as a biosorbent.
In [7], the authors demonstrated the selectivity of a biosorbent obtained from Pennisetum clandestinium for Pb (II) ions (139.35 mg/g). Their result may be due to the relationship between the average pore size of the biosorbent and the radius of the ion. Table 4 shows the estimated effects of the independent variables on the adsorption capacity (q).
From Table 4, it can be observed that the effect of pH is positive; thus, by increasing the pH from 4.8 to 5.5, the adsorption capacity increases by 3.86 mg/g on average. However, the effect of the biosorbent dose is negative, as increasing the dose from 0.5 to 1 mg/L results in an average decrease in adsorption capacity of 17.74 mg/g. Similarly, the effect of the biosorbent size is negative, as increasing the size from 106 to 212 μm, results in an average decrease in adsorption capacity of 3.99 mg/g. Regarding the interactions, the effects of the variables are negative in the case of pH-dose (AB) and pH-biosorbent size (AC) interactions but positive in the case of dose-size (BC) interactions, where the adsorption capacity increases on average by 1.77 mg/g. Figure 3 shows a standardized Pareto diagram for the adsorption capacity.
From the graph, it can be inferred that the three variables (biosorbent dose, size, and pH) exhibit significant effects with respect to the adsorption capacity. The statistical significance of the effects was analyzed using ANOVA, and the results are summarized in Table 5. The results indicate that the three variables under study pH, biosorbent dose, and size were significant (p-value <0.05), suggesting a significant difference from zero, with a confidence level of 95%. Among these variables, it is noteworthy that dose is highly significant.
The pH of the solution has an important role in the adsorption process, as it determines the surface charge, degree of ionization, and adsorption process [30]. Thus, in several studies, higher adsorption capacities were reported with a pH in the range of 4.5 to 5.0. [23,32,33,34], despite the competition between H+ and Cr (III) ions for active sites on the biosorbent surface at acidic pH [33]. Thus, in [32], it was reported that at a pH of 4.15, a greater adsorption capacity for Cr (III) (121.64 mg/g) was achieved. In addition, in [33], it was indicated that a pH of 5 was adequate to achieve the maximum adsorption capacity (200.25 mg/g). In both cases, the adsorption capacities obtained exceeded that of the present study (47.9 mg/g). This is probably because higher biosorbent doses were tested, for example, 70 g/L of eggshell and 20 g/L of Cymbopogon flexuosus immobilized in alginate sodium. At pH values higher than 7, hydrolysis could take place, leading to a decrease in adsorption capacity [28]. The mathematical model that relates the variables under study, with R2= 85.34%, is as follows:
This model explains 85.34% of the experimental uncertainty, demonstrating the goodness of fit.
3.3. Kinetics Study
The data from the kinetic study (Figure 4) shows that the adsorption capacity q increases with time, with a rapid increase observed at the beginning, with the first minutes, and then equilibrium being reached in less than 80 minutes (q = 41.42 mg/g).
The pseudo-second-order kinetics model best fits the experimental data (k=0.176 g/mg min), explaining 99.95% of the uncertainty. These results indicate that the biosorption process depends on the metal ion and the biosorbent [28], providing evidence that the adsorption mechanism is chemisorption. In addition, it is based on the influence of valence forces through the sharing or exchange of electrons between Cr (III) ions and the available sites on the biosorbent surface [30], which also indicates that the limiting stage is the adsorption itself, rather than mass transfer [35]. The studies developed by [28,33,36,37], which investigated pineapple plant stems, eggshells, yellow passion fruit peels, and the residual biomass of roses as biosorbents also reported pseudo-second-order kinetics as a biosorption mechanism. In comparison, the values of the pseudo-second-order rate constants (k) of these studies (0.014; 0.041x10⁻³; 4.22 x10⁻³; and 0.75 x10⁻³ g/mg∙min, respectively) were lower than of the biosorbent (BK) under study.
3.4. Biosorbent Regeneration
Through regeneration tests, it was possible to identify that the highest percentage of desorption was at a pH of 3 (Figure 5), with 81.41 % desorption. This value represents the percentage of Cr (III) that was released from the saturated biosorbent in an acidic medium, while, 18.59% was retained in the biosorbent. This result aligns with the results presented in [38], which achieved greater desorption at a pH of 4, thus corroborating the evidence that desorption of Cr (III) is more efficient at acidic pH. In contrast, the result obtained in [23] was lower, obtaining a 10% desorption rate for Cr (III) using 0.1 M NaOH. This is due to the greater retention forces between the adsorbent and the metal, coinciding with the results of the present investigation in which only 0.10% was achieved with the same treatment. Therefore, favorable results are more likely at acidic pH than at basic pH.
The regenerated biosorbent (BR) presented an adsorption capacity of 28.7 mg/g, representing an adsorption capacity of 59.92% from the unregenerated biosorbent. In the literature it was found that biosorbents could be regenerated and reused, as mentioned by the authors of [39], who reported the regeneration of saturated chitosan with Cr (VI) using sulfuric acid at a concentration of 0.1 M, achieving two regeneration cycles with a desorption percentage of 88%. In addition, in a study of cattails used to capture Cr (III) ions from synthetic waters, 10% desorption of Cr (III) was obtained, which was attributed to the greater retention force of this ion by the biosorbent at a pH of 5 [23].
3.5. Bioadsorption Tests with Fur Industry Effluent
In the biosorption tests with samples from the ASAPES fur industry, with 0.5 mg/L dose of biosorbent, a pH of 5.5, and a biosorbent size of 106 μm, an adsorption capacity of 37.6 ± 0.2 mg/g was achieved, corresponding to 78.5% of the adsorption capacity with synthetic water (47.9 mg/g). This result could be attributed to the possible interferences caused by suspended solids, salts, fats and other compounds typical of the fur industry, as well as the presence of other ions that compete for the active sites of the biosorbent. In addition, in an investigation into a native microalgae consortium used to remove Cr (III) from two different sources real tannery wastewater and synthetic water it was possible to establish that the Cr (III) adsorption capacity of real wastewater is 91.22% of the adsorption capacity with synthetic water, which is attributed to the selectivity of the Cr (III) ion by the biosorbent [21].
4. Conclusions
In conclusion, it was demonstrated that activated residual kikuyu biomass, treated with acid and basic hydrolysis, is effective for removing Cr (III) from polluted waters. FT-IR and SEM/EDS analyses identified the presence of Cr (III) in the biosorbent. In the adsorption process, the three variables under study (biosorbent dose, size, and pH) exhibited a significant influence on the adsorption capacity at a pH of 5.5, a biosorbent dose of 0.5 g/L, and a biosorbent size of 100 μm. Maximum adsorption capacities Ymáx of 47.9 mg/g and 37.6 mg/g in were achieved for synthetic water and industry effluents, respectively. The regeneration of the biomass is possible at a pH of 3. The results of our study indicate that residual biomass could be utilized for the removal of Cr (III) from tannery effluents, thereby reducing the cost of effluent treatments.
Author Contributions
Conceptualization, A.R.M.F.; Methodology, A.R.M.F., and U.R.F.B.; experiment, R.V.V.R., and J.G.V.M.; validation, A.R.M.F., and M.D.T.V.; formal analysis, A.R.M.F., and U.R.F.B.; investigation, R.V.V.R.; resources, A.R.M.F.; data curation, U.R.F.B.; writing-original draft preparation, M.D.T.V., and J.G.V.M.; writing-review and editing, U.R.F.B.; supervision; A.R.M.F. All authors have read and agreed to the published version of the manuscript.
Funding
Please add: This research was financially supported by the National Fund for Scientific and Technological Development (FONDECYT), Res. N° 059-2020-FONDECYT, and the National University of San Antonio Abad of Cusco (UNSAAC), Res. N° R-606-2020-UNSAAC.
Data Availability Statement
The data are contained within the article.
Conflicts of Interest
The authors declare no conflicts of interest. The funders had no role in the design of the study, analyses, or interpretation of data; in the writing of the manuscript; or in the decision to publish the results.
References
- H. Cheng, T. Zhou, Q. Li, L. Lu, and C. Lin, “Anthropogenic Chromium Emissions in China from 1990 to 2009,” vol. 9, no. 2, 2014. [CrossRef]
- A. Alemu, B. Lemma, N. Gabbiye, M. T. Alula, and M. T. Desta, “Removal of chromium (VI) from aqueous solution using vesicular basalt: A potential low cost wastewater treatment system,” Heliyon, no. December 2017, p. e00682, 2018. [CrossRef]
- I. Ghorbel-abid, A. Jrad, K. Nahdi, and M. Trabelsi-ayadi, “Sorption of chromium (III) from aqueous solution using bentonitic clay,” DES, vol. 246, no. 1–3, pp. 595–604, 2009. [CrossRef]
- A. Maldonado-Farfán, U. Fernandez-Bernaola, H. Salas-Cernades, O. Guillen-Zevallos, and E. Medrano- Meza, “Modeling of Chromium (III) Adsorption of Aqueous Solutions Using Residual Cassava Biomass in Fixed Bed Columns,” LACCEI iInternational Multi-Conference Eng. Educ. Technol. 2021, no. Iii, 2021.
- Á. C. Porras, “Descripción de La nocividad del cromo proveniente de la industria curtiembre y de las posibles formas de removerlo,” Rev. Ing. Univ. Medellín, vol. 9, no. 17, pp. 41–49, 2010, [Online]. Available: http://www.redalyc.org/resumen.oa?id=75017164003%5Cnhttp://www.redalyc.org/articulo.oa?id=75017164003%5Cnhttp://www.redalyc.org/pdf/750/75017164003.pdf.
- N. E. Alam, A. S. Mia, F. Ahmad, and M. Rahman, “An overview of chromium removal techniques from tannery effluent,” Appl. Water Sci., 2020. [CrossRef]
- A. Maldonado, C. Luque, and D. Urquizo, “Lead biosortion of contaminated waters using Pennisetum clandestinum Hochst (Kikuyu),” Rev. Latinoam. Metal. y Mater., no. SUPPL.4, 2012.
- E. Carvajal-flórez, L. Fernanda, and M. Giraldo, “Uso de residuos de café como biosorbente para la remoción de metales pesados en aguas residuales,” vol. 11, pp. 44–55, 2020. [CrossRef]
- C. Lavado-meza, M. R. Sun-kou, T. K. Castro-arroyo, and H. D. Bonilla-mancilla, “Química Aplicada y Analítica Biosorción de plomo (II) en de los cladodios de la tuna Biosorption of lead (II) in aqueous solution with biomass of prickly pear Resumen Resumo Introducción Materiales y métodos Preparación del biosorbente y de las disolu,” vol. 49, no. 3, pp. 36–46, 2020.
- J. De Jesús, V. Martínez, A. Milena, S. Alarcón, E. Augusto, and A. Y. El, “Kikuyu , present grass in ruminant production systems in tropic Colombian highlands El kikuyo , una gramínea presente en los sistemas de rumiantes en trópico alto colombiano Kikuyo , uma gramínea presente em sistemas de ruminantes no alto trópico colombiano,” 2018.
- I. Simona, D. Bulgariu, I. Ahmad, and L. Bulgariu, “Valorisation possibilities of exhausted biosorbents loaded with metal ions – A review,” vol. 224, no. April, pp. 288–297, 2018. [CrossRef]
- H. Qin, T. Hu, Y. Zhai, N. Lu, and J. Aliyeva, The improved methods of heavy metals removal by biosorbents: A review. Elsevier, 2020.
- U. R. Fernández-Bernaola and A. R. Maldonado-Farfán, “Lead adsorption from polluted water using Opuntia larreyi cactus,” no. July 2019, pp. 24–26, 2019. [CrossRef]
- I. Enniya, L. Rghioui, and A. Jourani, “Adsorption of hexavalent chromium in aqueous solution on activated carbon prepared from apple peels,” Sustain. Chem. Pharm., vol. 7, no. September 2017, pp. 9–16, 2018. [CrossRef]
- G. J. Perez Cuasquer, “TRATAMIENTO DE AGUAS RESIDUALES DE LA INDUSTRIA TEXTIL MEDIANTE PROCESOS ELECTROQUÍMICOS,” Universidad Central de Ecuador. pp. 1–93, 2015, [Online]. Available: http://www.ti.com/lit/ds/symlink/cc2538.html.
- Y. Li, D. Wang, Q. Xu, X. Liu, and Y. Wang, “Chemosphere New insight into modi fi cation of extracellular polymeric substances extracted from waste activated sludge by homogeneous Fe (II)/ persulfate process,” Chemosphere, vol. 247, p. 125804, 2020. [CrossRef]
- X. R. Xu, Z. Y. Zhao, X. Y. Li, and J. D. Gu, “Chemical oxidative degradation of methyl tert-butyl ether in aqueous solution by Fenton’s reagent,” Chemosphere, vol. 55, no. 1, pp. 73–79, 2004. [CrossRef]
- M. Valladares-Cisneros, C. Valerio, P. De la Cruz, and R. M. Melgoza, “Adsorbentes no-convencionales, alternativas sustentables para el tratamiento de aguas residuales,” Rev. Ing. Univ. Medellín, vol. 16, no. 31, pp. 55–73, 2017. [CrossRef]
- S. I. Mussatto, M. Fernandes, A. M. F. Milagres, and C. Roberto, “Effect of hemicellulose and lignin on enzymatic hydrolysis of cellulose from brewer’ s spent grain,” vol. 43, pp. 124–129, 2008. [CrossRef]
- S. I. Mussatto, G. Dragone, G. Jackson, D. M. Rocha, and I. Roberto, “Efecto de los tratamientos de hidrólisis ácida y hidrólisis alcalina en la estructura del bagazo de malta para liberación de fibras de celulosa,” no. January 2015, 2006.
- A. F. Moreno-García et al., “Sustainable biorefinery associated with wastewater treatment of Cr (III) using a native microalgae consortium,” Fuel, vol. 290, no. January, 2021. [CrossRef]
- M. T. H. A. Kana, “Feasibility of metal adsorption using brown algae and fungi: Effect of biosorbents structure on adsorption isotherm and kinetics,” J. Mol. Liq., no. 2017, p. #pagerange#, 2018. [CrossRef]
- T. A. Rearte, P. B. Bozzano, M. L. Andrade, and A. F. De Iorio, “Biosorption of Cr (III) and Pb (II) by Schoenoplectus californicus and Insights into the Binding Mechanism,” vol. 2013, 2013.
- M. Galbe and G. Zacchi, “Pretreatment of Lignocellulosic Materials for Efficient Bioethanol Production,” no. July, pp. 41–65, 2007.
- S. Ho, Y. Chen, W. Qu, F. Liu, and Y. Wang, Chapter 8 - Algal culture and biofuel production using wastewater, Second Edition. Elsevier B.V., 2019.
- Y. Rajesh and L. Rao, “Materials Today: Proceedings Synthesis and Characterization of Low-Cost Wood based Biosorbent,” Mater. Today Proc., vol. 57, pp. 34–37, 2022. [CrossRef]
- V. Luisa, U. M. F, G. Nancy, F. Marittza, and V. Verónica, “el bagazo de caña como biosorbente,” pp. 43–49, 2016.
- A. Jacques, E. C. Lima, S. L. P. Dias, A. C. Mazzocato, and A. Pavan, “Yellow passion-fruit shell as biosorbent to remove Cr (III) and Pb (II) from aqueous solution,” vol. 57, pp. 193–198, 2007. [CrossRef]
- S. N. Jain et al., “Nonlinear regression approach for acid dye remediation using activated adsorbent: Kinetic, isotherm, thermodynamic and reusability studies,” Microchem. J., vol. 148, no. February, pp. 605–615, 2019. [CrossRef]
- A. A. Beni and A. Esmaeili, Biosorption and efficient method for removing heavy metals from industrial effluents: A Review. Elsevier B.V., 2019.
- B. Huseyin, R. Turker, L. Mustafa, and T. Adalet, “Separation and speciation of Cr (III) and Cr (VI) with Saccharomyces cerevisiae immobilized on sepiolite and determination of both species in water by FAAS,” Talanta, vol. 51, no. 5, pp. 895–902, 2000. [CrossRef]
- A. Basu et al., “Journal of the Taiwan Institute of Chemical Engineers A study on removal of Cr (III) from aqueous solution using biomass of Cymbopogon flexuosus immobilized in sodium alginate beads and its use as hydrogenation catalyst,” J. Taiwan Inst. Chem. Eng., vol. 102, pp. 118–132, 2019. [CrossRef]
- S. Elabbas, L. Mandi, F. Berrekhis, M. N. Pons, J. P. Leclerc, and N. Ouazzani, “Removal of Cr (III) from chrome tanning wastewater by adsorption using two natural carbonaceous materials: Eggshell and powdered marble,” J. Environ. Manage., vol. 166, pp. 589–595, 2016. [CrossRef]
- I. A. Bhatti, N. Ahmad, N. Iqbal, M. Zahid, and M. Iqbal, “Chromium adsorption using waste tire and conditions optimization by response surface methodology,” J. Environ. Chem. Eng., vol. 5, no. 3, pp. 2740–2751, 2017. [CrossRef]
- J. Wang and X. Guo, “Adsorption kinetic models: Physical meanings, applications, and solving methods,” J. Hazard. Mater., vol. 390, no. January, p. 122156, 2020. [CrossRef]
- S. L. Chan, Y. P. Tan, A. H. Abdullah, and S. T. Ong, “Equilibrium, kinetic and thermodynamic studies of a new potential biosorbent for the removal of Basic Blue 3 and Congo Red dyes: Pineapple (Ananas comosus) plant stem,” J. Taiwan Inst. Chem. Eng., vol. 61, pp. 306–315, 2016. [CrossRef]
- A. R. Iftikhar, H. N. Bhatti, M. A. Hanif, and R. Nadeem, “Kinetic and thermodynamic aspects of Cu(II) and Cr(III) removal from aqueous solutions using rose waste biomass,” J. Hazard. Mater., vol. 161, no. 2–3, pp. 941–947, 2009. [CrossRef]
- R. M. Dias, J. G. Silva, V. L. Cardoso, and M. M. De Resende, “ScienceDirect Removal and desorption of chromium in synthetic effluent by a mixed culture in a bioreactor with a magnetic field,” J. Environ. Sci., vol. 91, no. 430, pp. 151–159, 2020. [CrossRef]
- M. Vakili, S. Deng, G. Cagnetta, W. Wang, and P. Meng, “Separation and Puri fi cation Technology Regeneration of chitosan-based adsorbents used in heavy metal adsorption: A review,” Sep. Purif. Technol., vol. 224, no. May, pp. 373–387, 2019. [CrossRef]
Figure 1.
FTIR spectra. (a) Kikuyu biomass (B); (b) biosorbent (BK), and (c) saturated biosorbent.
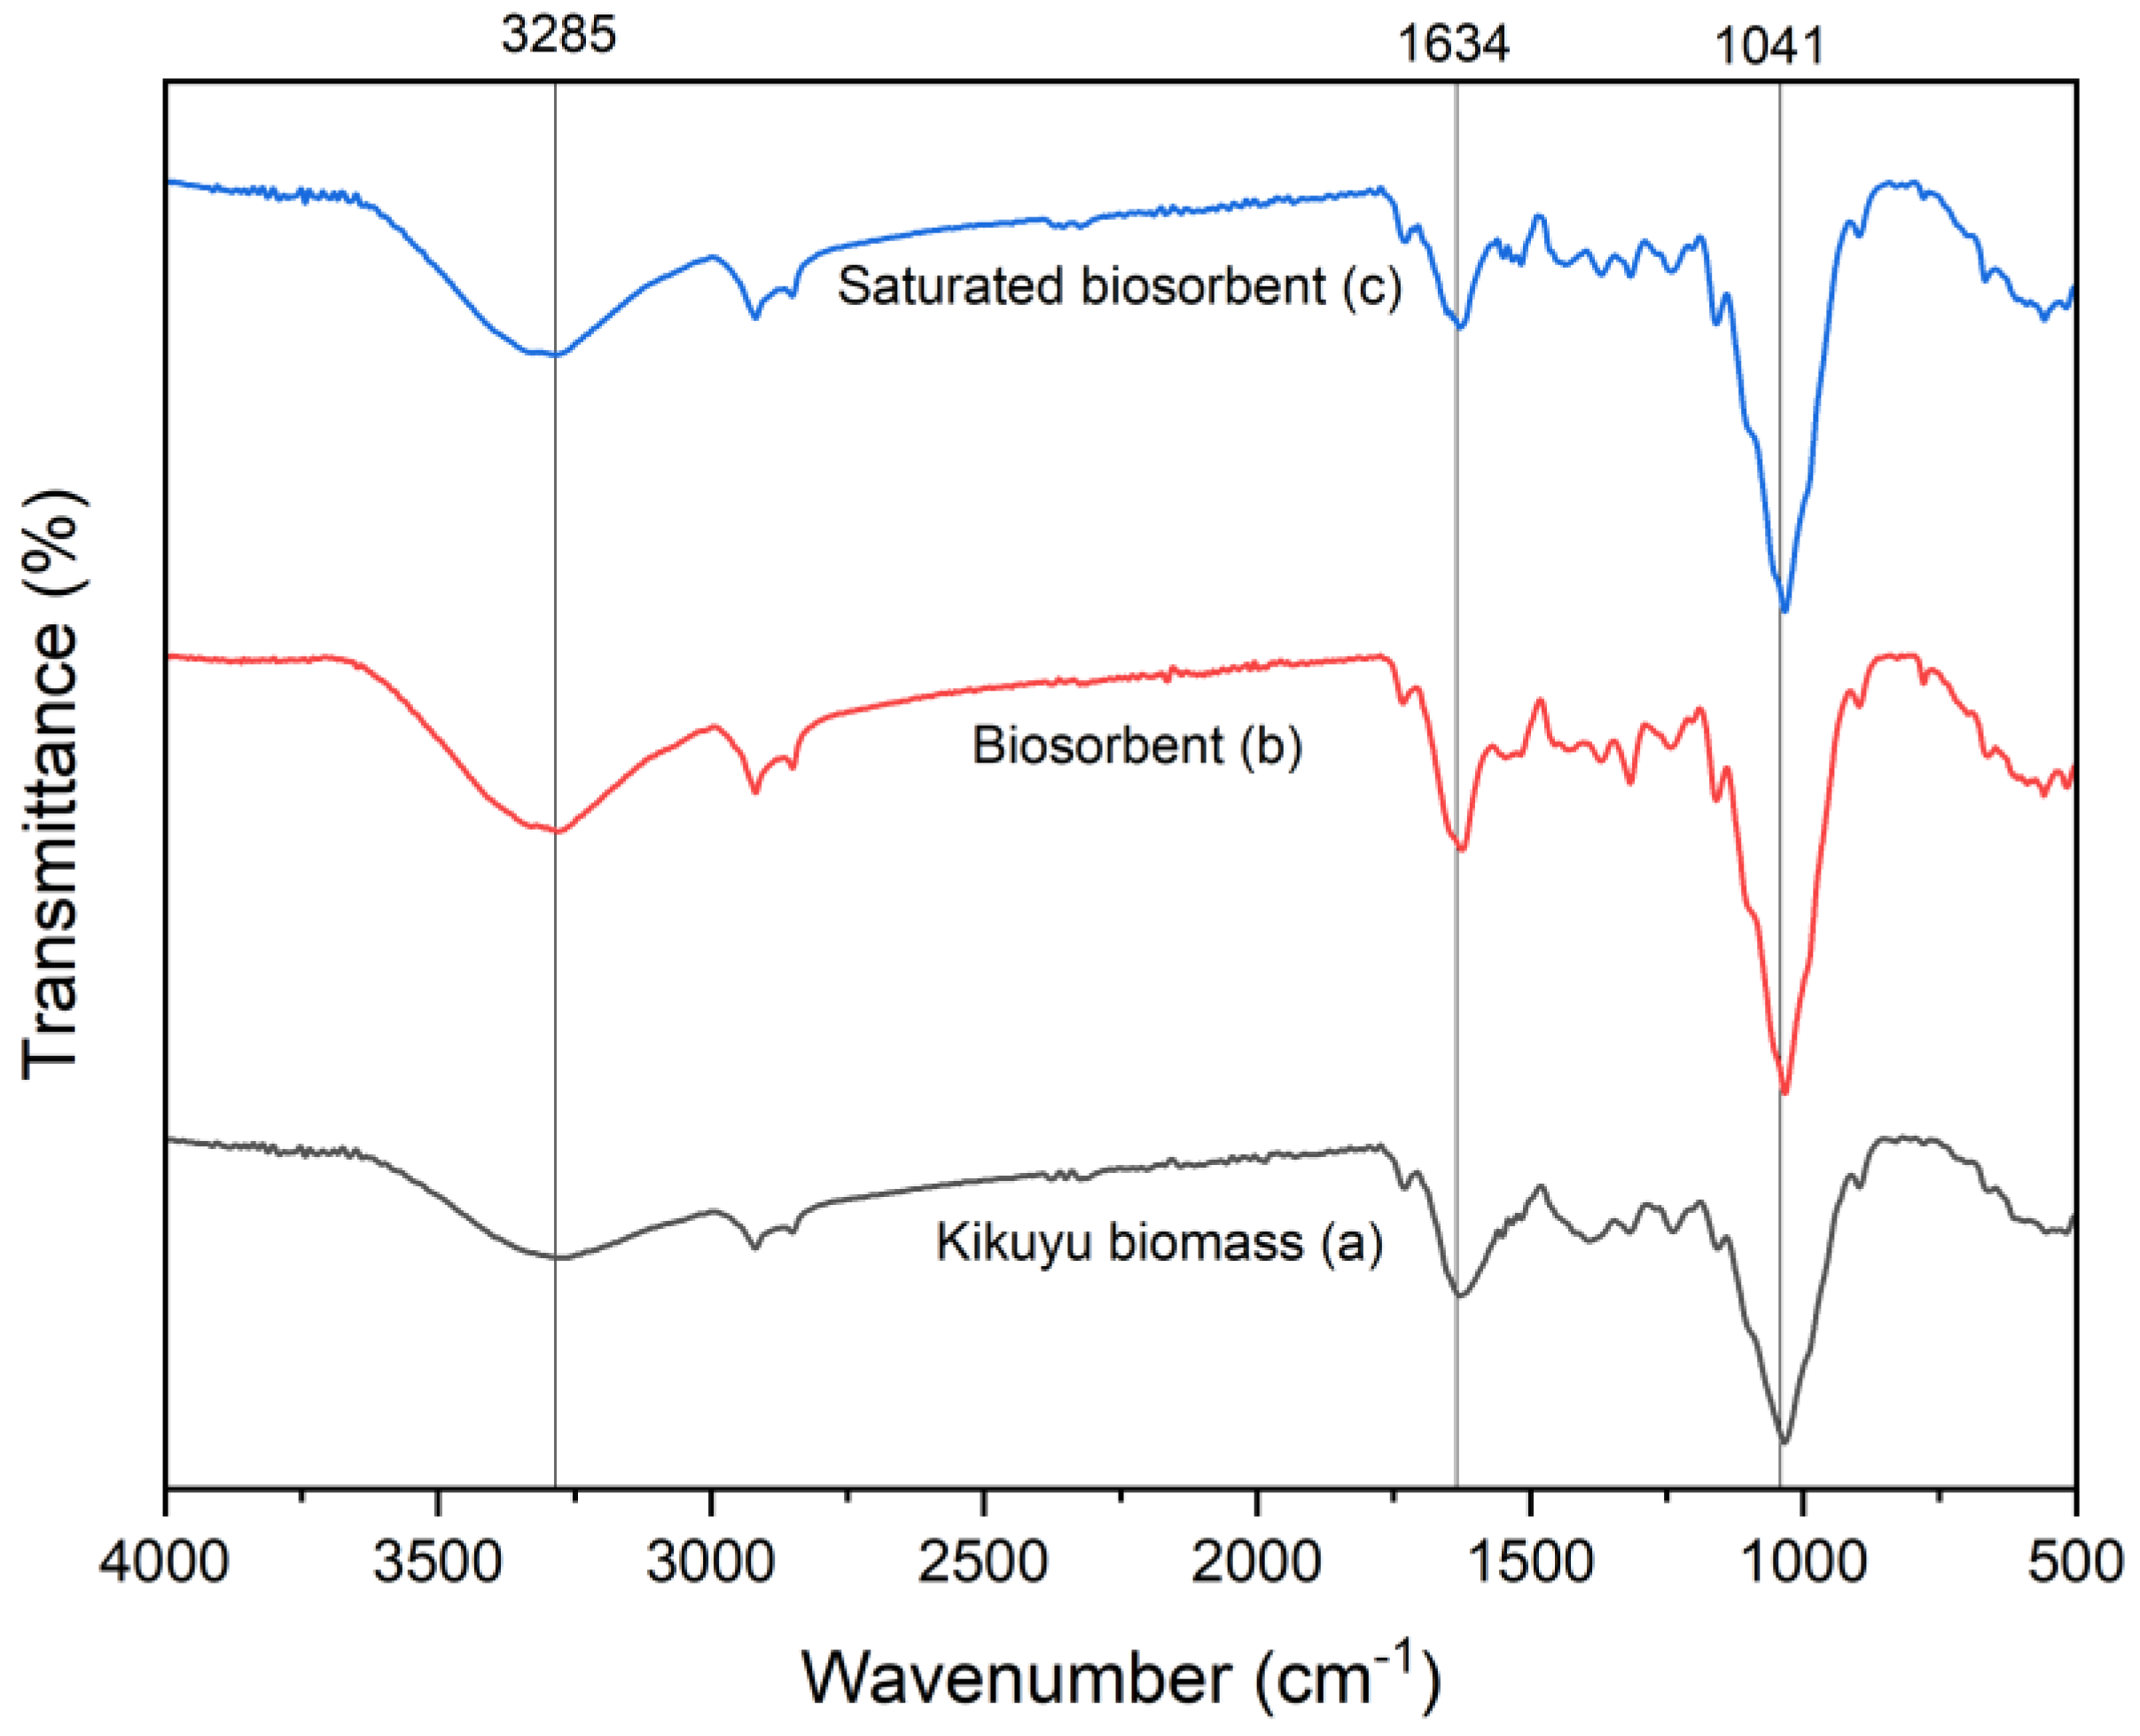
Figure 2.
FTIR spectra. (A) Biosorbent (BK); (a) saturated biosorbent (BKS).
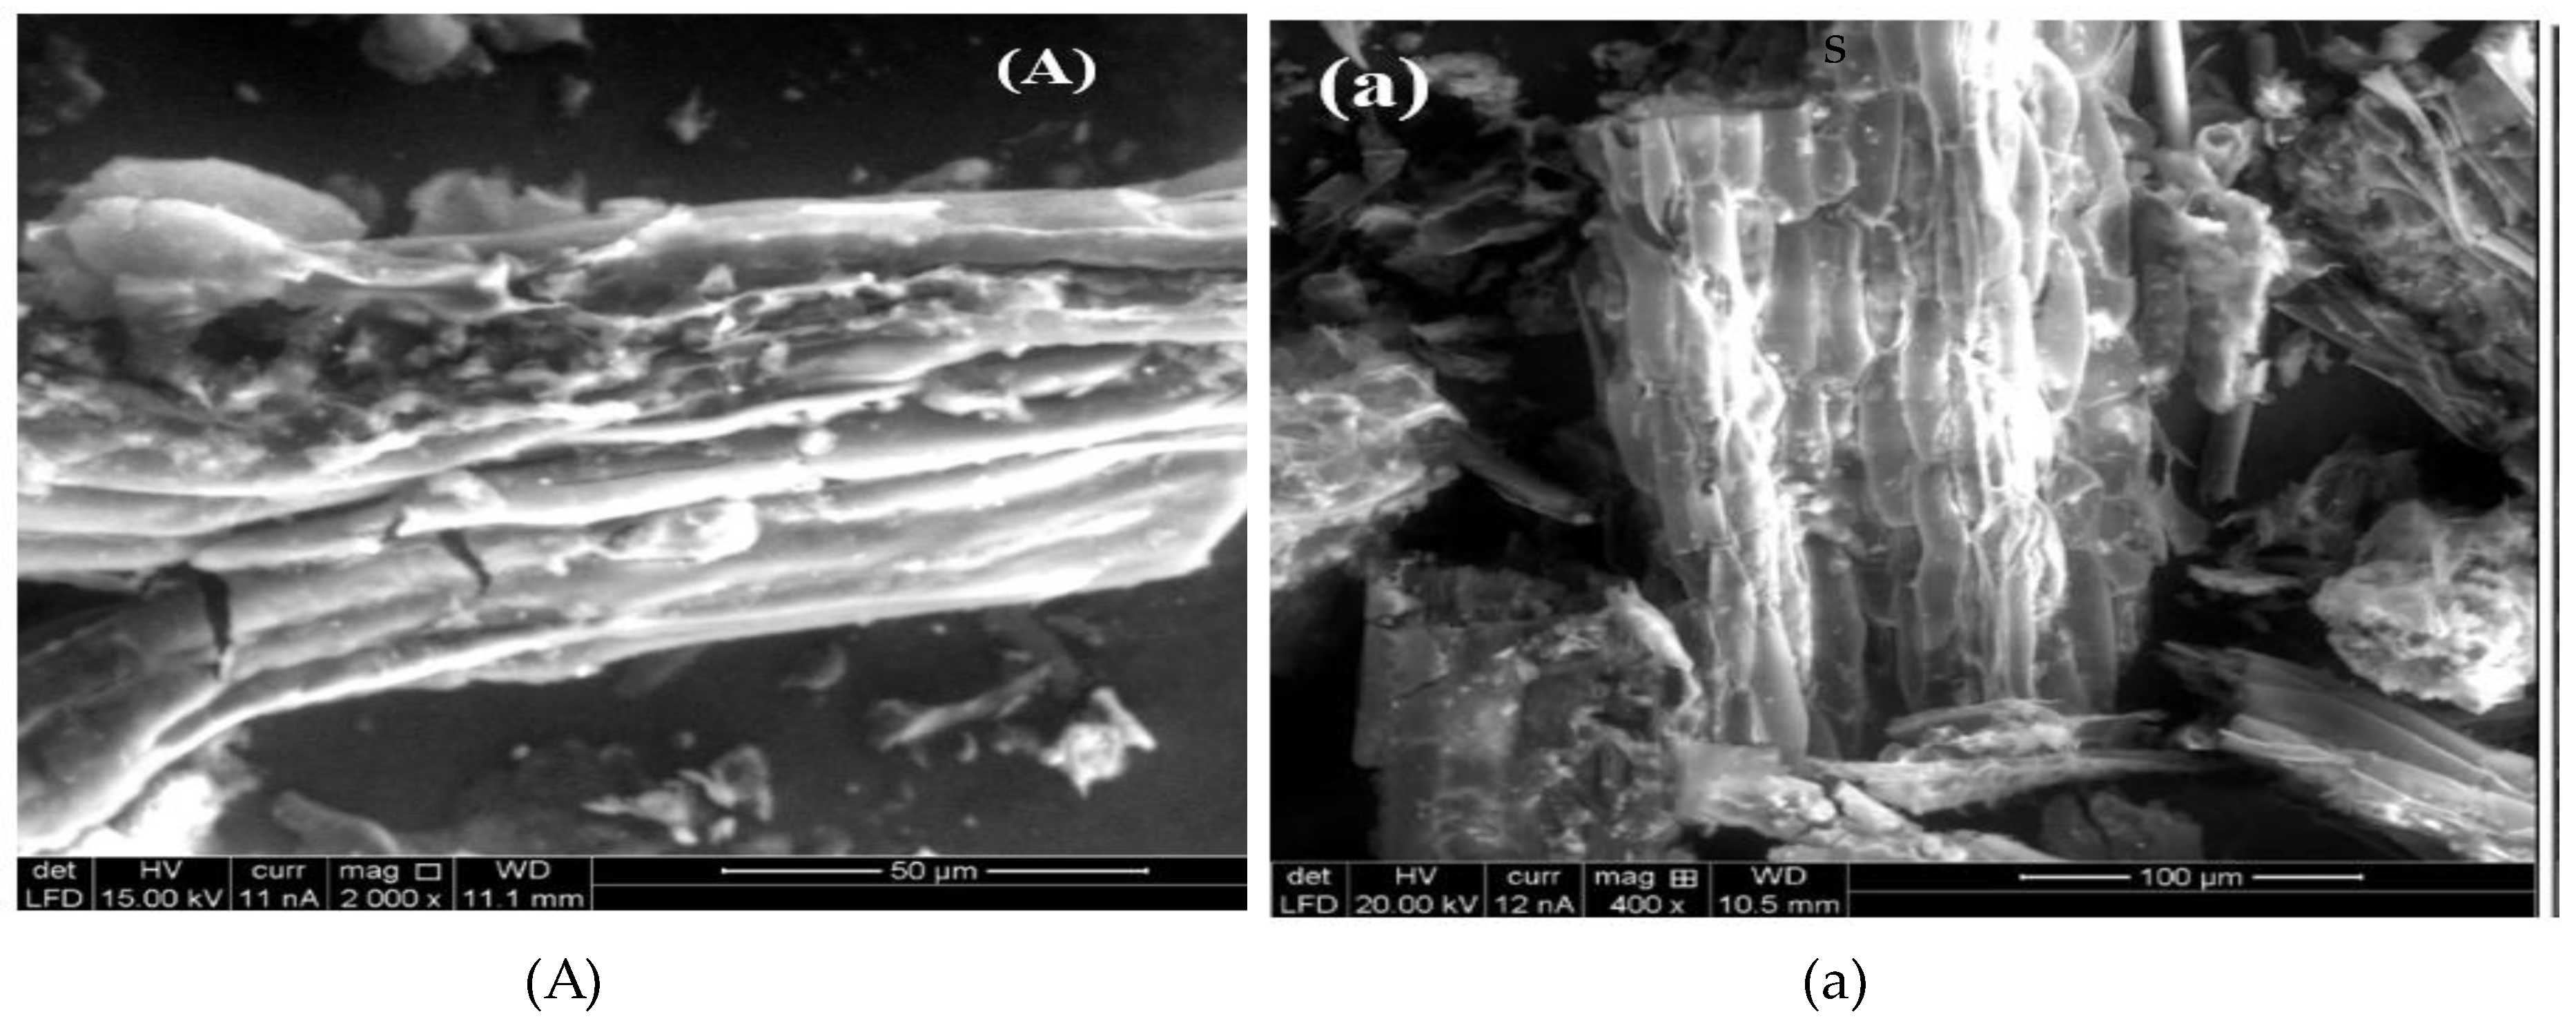
Figure 3.
Standardized Pareto diagram for q.
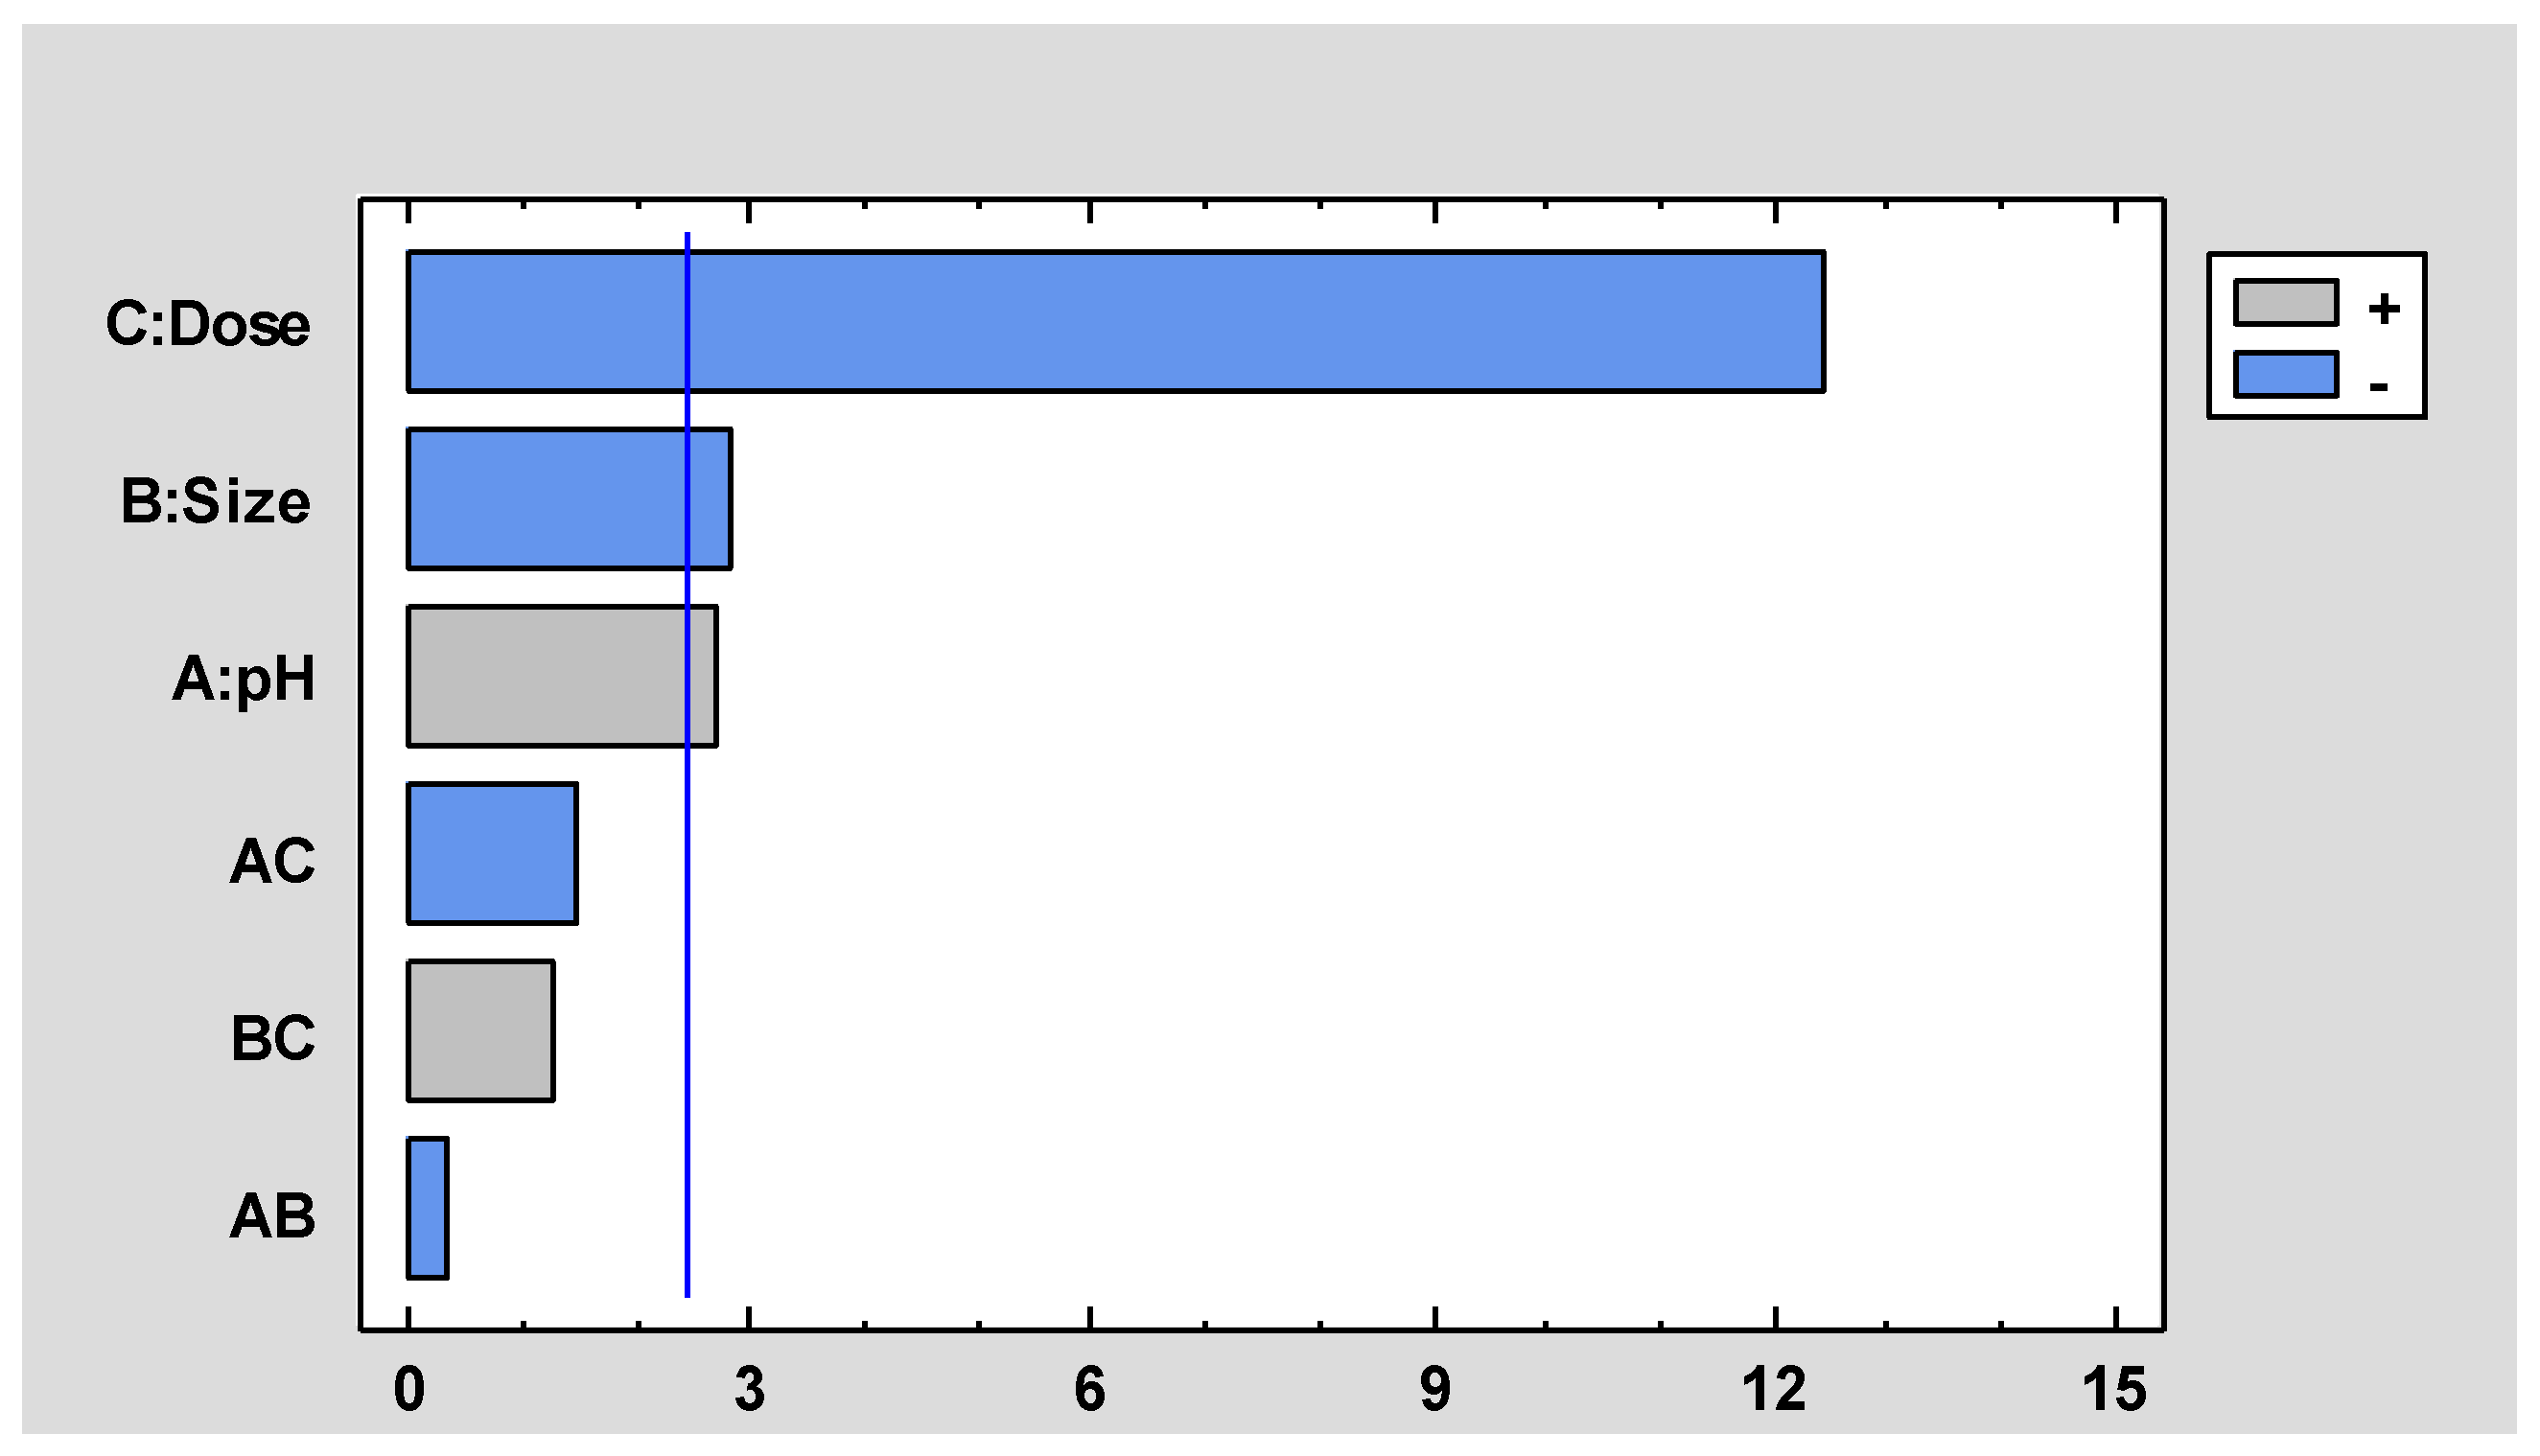
Figure 4.
Adsorption kinetics of Cr (III).
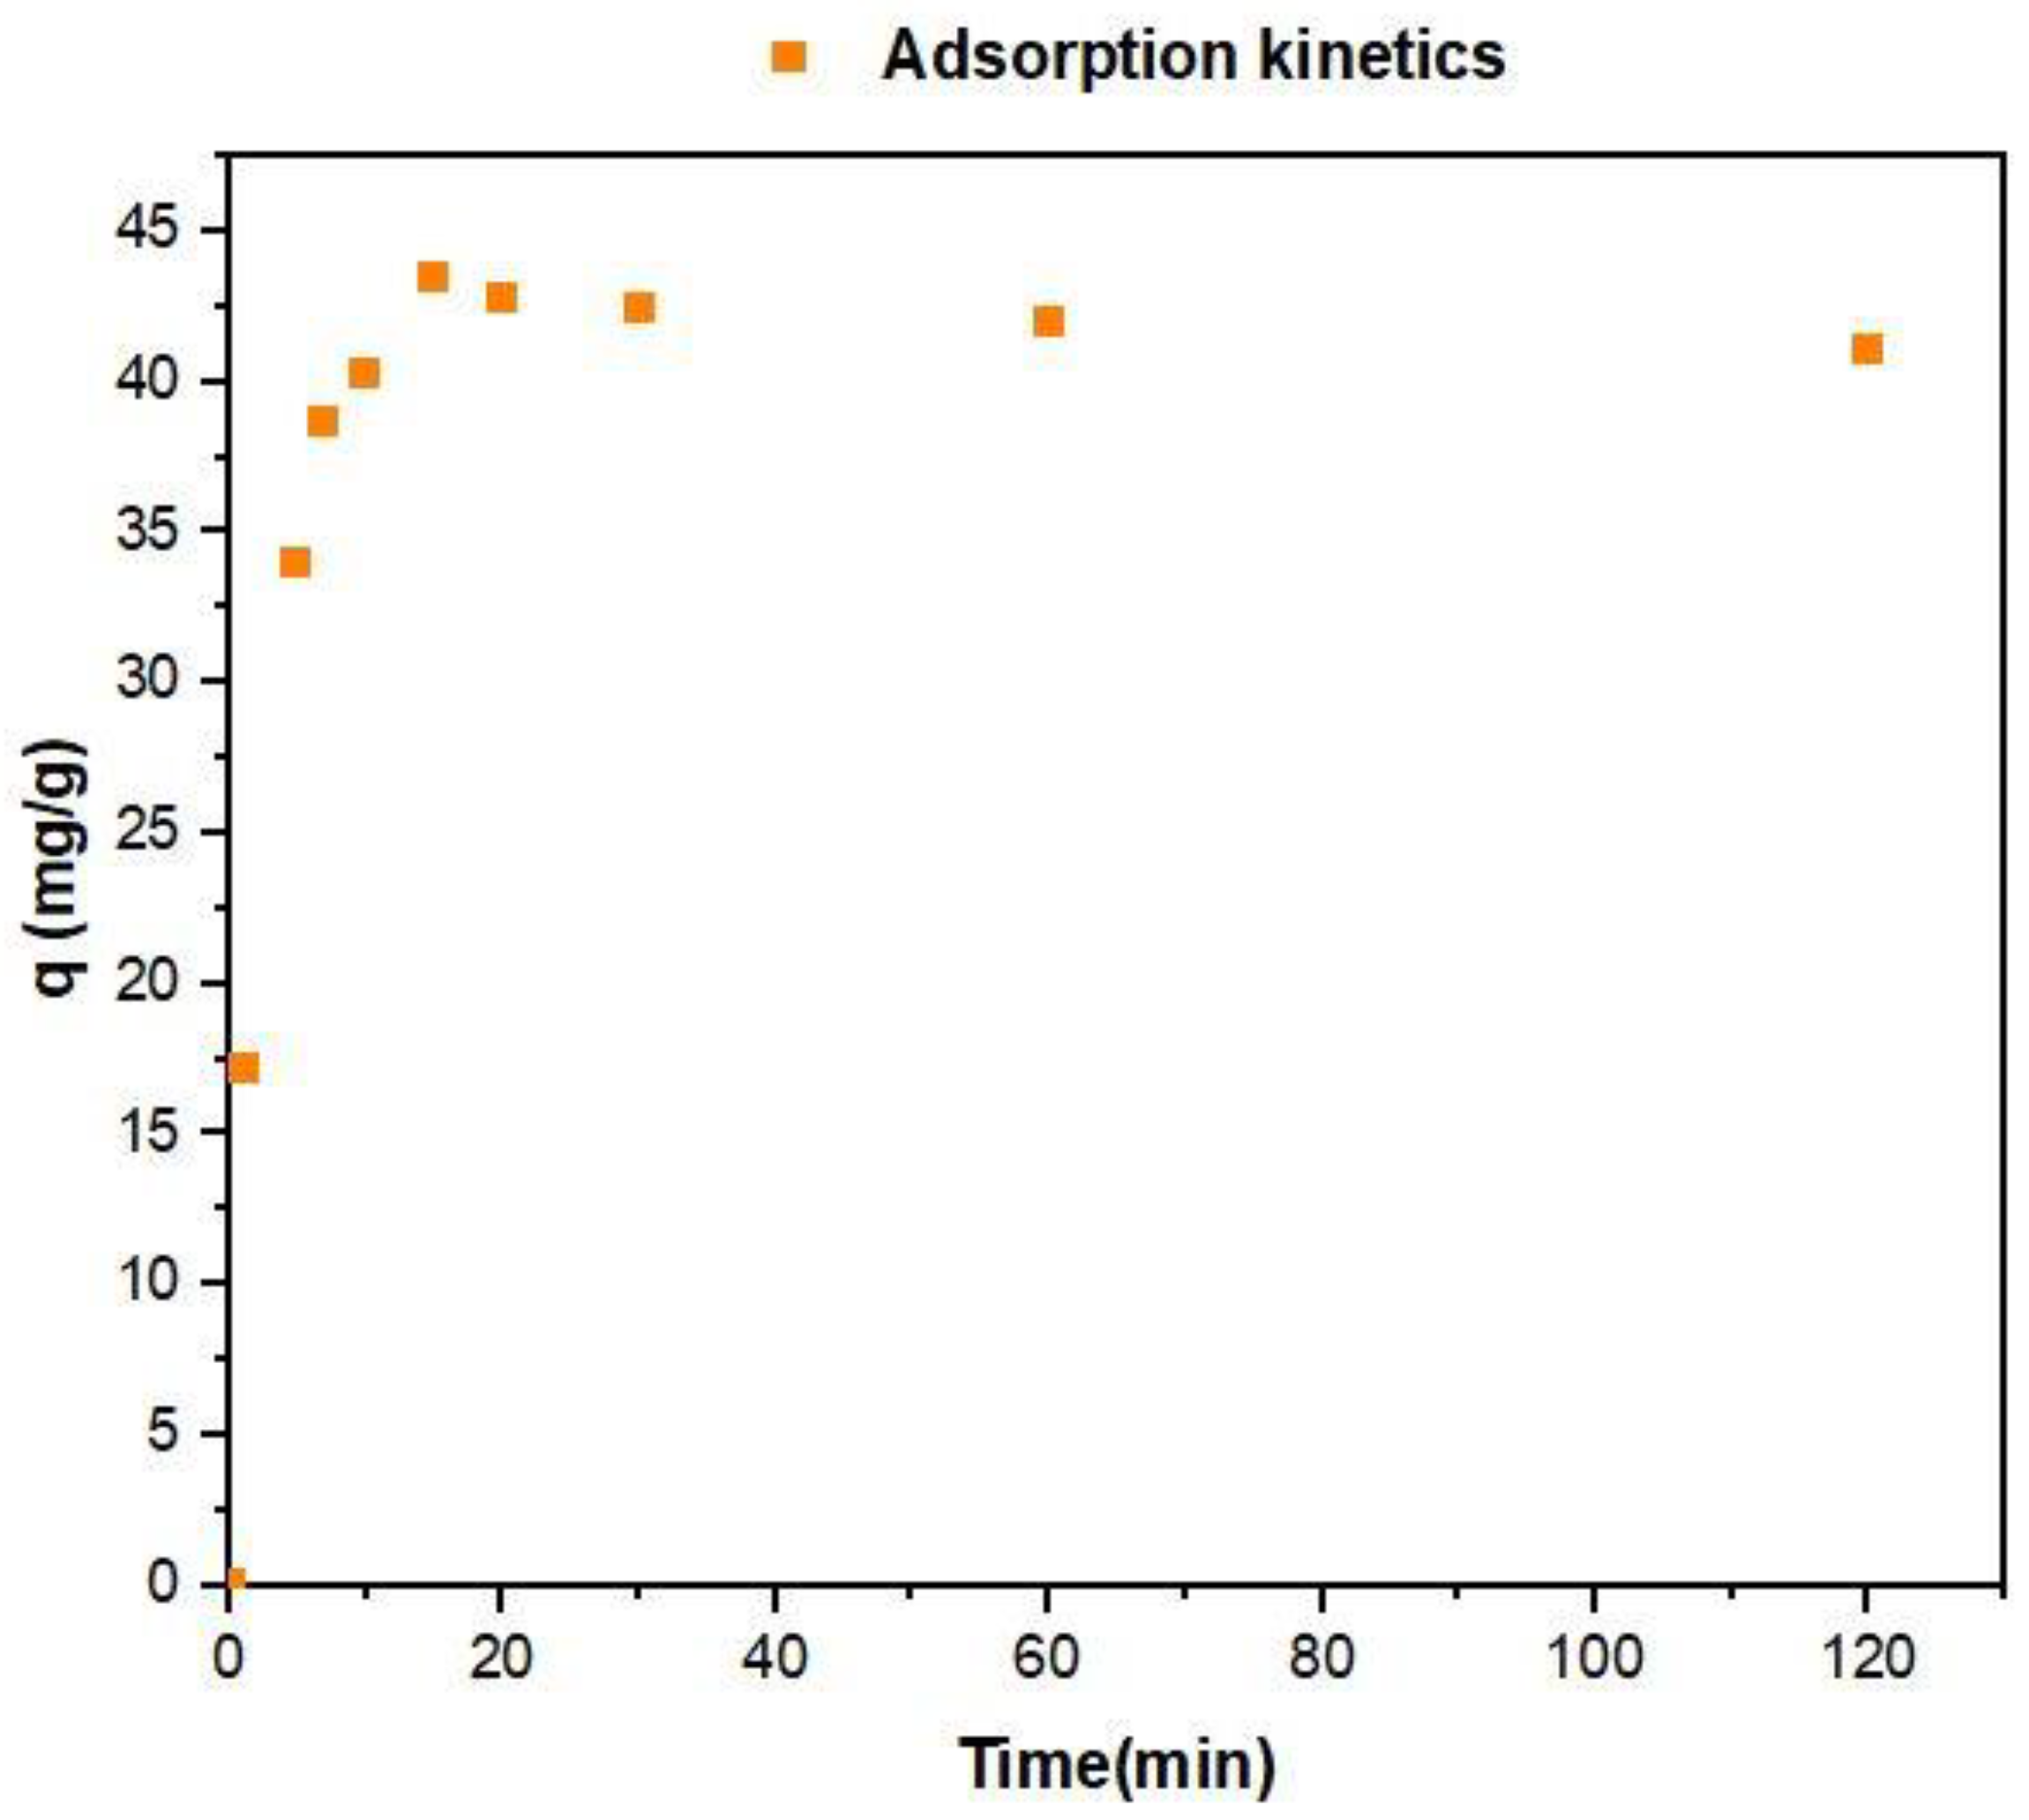
Figure 5.
Desorption of Cr (III) from saturated biosorbent.
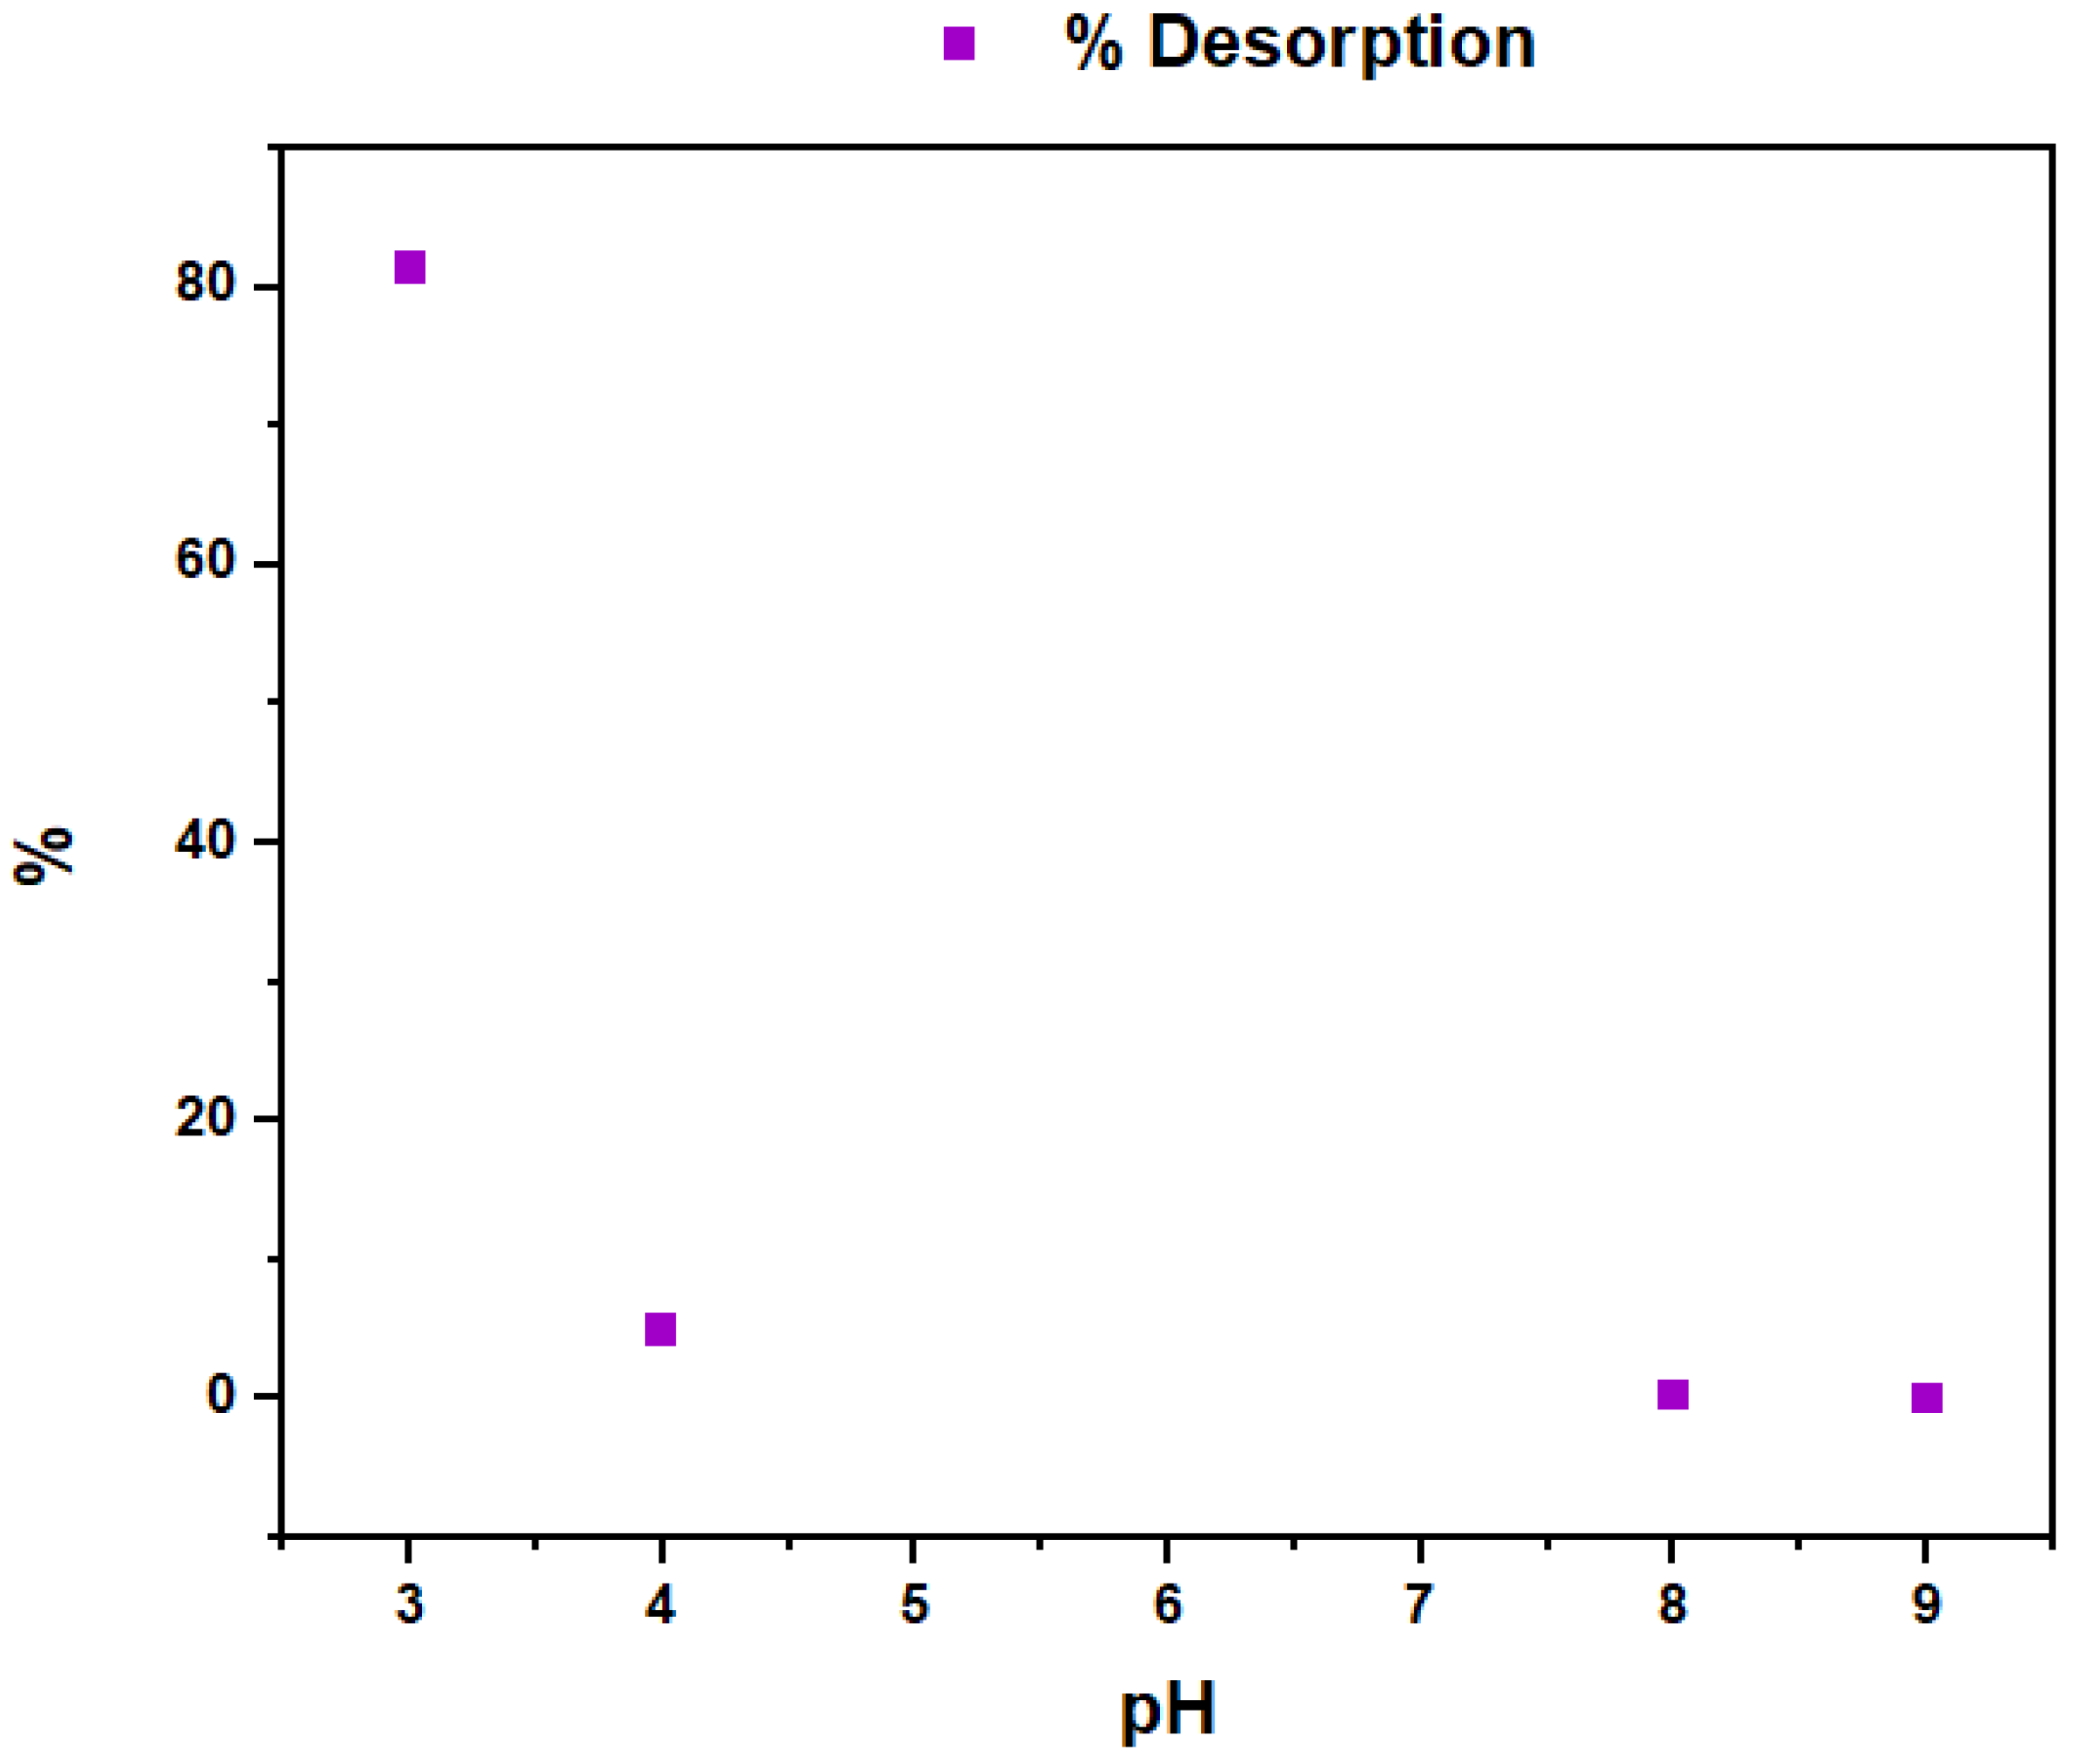

Table 1.
Variables and levels.
| Independent Variables | Levels | |
|---|---|---|
| Biosorbent size, T (μm) | 106 | 212 |
| Biosorbent dose, D (mg/L) | 0.5 | 1.0 |
| pH | 4.8 | 5.5 |
Table 2.
Elemental analysis (EDS) of the saturated biosorbent (BKS).
| Element | Unit | Zone Nº1 | Zone Nº2 | Zone Nº3 | ||
|---|---|---|---|---|---|---|
| Area 1 | Area 1 | Area 1 | Area 2 | Area 3 | ||
| Carbon, C | % | 54.11 | 55.88 | 67.85 | 68.27 | 63.73 |
| Oxigen, O | % | 42.17 | 41.27 | 30.83 | 30.47 | 33.47 |
| Chromium, Cr | % | 0.48 | 1.02 | 0.65 | 0.65 | 0.86 |
| Aluminum, Al | % | 0.41 | - | - | 0.23 | - |
| Silicon, Si | % | 2.82 | 0.49 | 0.4 | 0.39 | 1.45 |
| Calcium, Ca | % | - | 0.66 | 0.27 | - | 0.49 |
Table 3.
Adsorption capacity (mg/g).
| N º | pH | Dose (g/L) | Size (μm) | Cf (mg/L) | q (mg/g) |
|---|---|---|---|---|---|
| 1 | 5.15 | 0.75 | 150 | 28.3 2.23 | 28.9 3 |
| 2 | 5.5 | 0.5 | 212 | 29.7 1.21 | 40.6 2.4 |
| 3 | 4.8 | 0.5 | 212 | 31.91.89 | 36.1 3.8 |
| 4 | 5.5 | 1 | 106 | 24.8 3.15 | 25.2 3.2 |
| 5 | 4.8 | 1 | 106 | 26.0 0.53 | 24.0 0.5 |
| 6 | 4.8 | 1 | 212 | 28.73.62 | 21.3 3.6 |
| 7 | 5.5 | 1 | 212 | 26.5 3.86 | 23.5 3.9 |
| 8 | 4.8 | 0.5 | 106 | 29.8 2.95 | 40.4 5.9 |
| 9 | 5.15 | 0.75 | 150 | 29.4 3.03 | 27.5 4 |
| 10 | 5.5 | 0.5 | 106 | 26.12.24 | 47.9 4.5 |
| 11 | 5.15 | 0.75 | 150 | 30.7 1.49 | 25.7 2 |
Table 4.
Estimated effects on adsorption capacity (q).
| Efect | Estimated | Confidence Int. |
|---|---|---|
| Average | 31.01 | +/- 1.42921 |
| A: pH | 3.86 | +/- 3.3518 |
| B: Dose | -17.74 | +/- 3.3518 |
| C: Size | -3.99 | +/- 3.3518 |
| AB | -2.11 | +/- 3.3518 |
| AC | -0.49 | +/- 3.3518 |
| BC | 1.77 | +/- 3.3518 |
AB denotes the pH–Dose interaction, AC denotes pH–Size interaction, and BC denotes Dose– Size interaction.
Table 5.
Analysis of variance.
| Source | Sum of squares | LG | Square medium | F-Ratio | p-Value |
|---|---|---|---|---|---|
| A: pH | 89.3204 | 1 | 89.3204 | 5.64 | 0.0258 |
| B: dose | 1888.6 | 1 | 1888.6 | 119.35 | 0 |
| C: size | 95.6004 | 1 | 95.6004 | 6.04 | 0.0216 |
| AB | 26.6704 | 1 | 26.6704 | 1.69 | 0.2065 |
| AC | 1.45042 | 1 | 1.45042 | 0.09 | 0.7647 |
| BC | 18.9038 | 1 | 18.9038 | 1.19 | 0.2853 |
| Blocks | 91.1297 | 2 | 45.5648 | 2.88 | 0.0757 |
| Total error | 379.787 | 24 | 15.8245 | ||
| Total (corr.) | 2591.46 | 32 |
Disclaimer/Publisher’s Note: The statements, opinions and data contained in all publications are solely those of the individual author(s) and contributor(s) and not of MDPI and/or the editor(s). MDPI and/or the editor(s) disclaim responsibility for any injury to people or property resulting from any ideas, methods, instructions or products referred to in the content. |
© 2024 by the authors. Licensee MDPI, Basel, Switzerland. This article is an open access article distributed under the terms and conditions of the Creative Commons Attribution (CC BY) license (http://creativecommons.org/licenses/by/4.0/).
Copyright: This open access article is published under a Creative Commons CC BY 4.0 license, which permit the free download, distribution, and reuse, provided that the author and preprint are cited in any reuse.


