
Submitted:
26 November 2024
Posted:
28 November 2024
You are already at the latest version
Abstract
This work identifies and analyses from a synoptic point of view, episodes of torrential rainfall (equal to or greater than 200 mm in a single day) that occurred in the Canary Islands between 1950 and 2020. For this purpose, all daily rainfall series available in different databases were used, with a final selection, after applying various filters for the detection of errors, of 88 days on which 200 mm were exceeded. Subsequently, the isobaric configurations at the surface and at 500 hPa were analysed by applying two classification methods: the automatic one of Jenkinson and Collinson (1977) and the subjective one of Jorge Olcina (1994). Most of the selected days (63.4%) correspond to high-altitude isolated depressions (known by their initials in Spanish as DANAs), as well as troughs showing the advection of polar air of different origins (36.5%). According to the Jenkinson and Collinson classification, half of the days were classified as cyclonic or hybrid cyclonic and 37.5% as pure advective or directional (37.5%), with five days classified as undetermined. On only one day, 23 November 1954, was a tropical disturbance with cloud fronts moving from the south of the Canary Islands along the west coast of Africa observed.
Keywords:
Torrential rainfall episodes
; Canary Islands
; Synoptic weather maps
; Jenkinson and Collison classification
1. Introduction
Damage caused by torrential rainfall events associated with severe storms around the world has increased significantly in recent decades. In 2023, for example, insured losses in the US associated with severe storms reached a new record high of USD 64 billion [1]. Likewise, in the same year, many European countries suffered severe damage associated with heavy rainfall, with Italy suffering the greatest flood losses in the country's history in July. In Spain, the most significant meteorological episode in 2023, in terms of the number of fatalities, was the high-altitude isolated depression (DANA by its initials in Spanish) that affected the Iberian Peninsula between 2 and 4 September, causing heavy rainfall that was at its most intense and abundant in the east and centre of the peninsula, leaving 8 people dead [2]. However, 2024 is proving to be a truly fateful year in terms of catastrophes associated with torrential rainfall events. These include hurricanes Helen and Milton which hit the SE of the USA hard. The former, which took place between 24 and 29 September, saw 242 fatalities and caused more than $38.5 billion of losses, while the latter struck between 5 and 10 October, causing 32 fatalities and losses of over $30 billion. Outside this area, in the western Mediterranean, the DANA of 29 October 2024 affected the Spanish Levante region. This was a mesoscale convective system with maximum rainfall values of around 500 mm/24 h in various locations in the autonomous community of Valencia and with the consequent overflowing of rivers and wadis. At the time of writing, the provisional death count is 224 persons with a further 20 persons unaccounted for. The cost of damages has not yet been quantified but is expected to be many millions of euros. As the SIGMA (2024) report points out, as with other risks, increasing exposure to such events due to economic and demographic growth and urbanisation is the main driving force behind the resultant rising economic losses and fatality numbers.
In the case of the Canary Islands (Spain), the study area considered in the present paper, the Insurance Compensation Consortium paid out between 1996 and 2016 the equivalent of 270.36 million euros (estimated values as of 2018) to the victims of almost 45,934 claims of three types: floods, sea storms and atypical cyclonic storms (with wind gusts exceeding 120 km/h). Three years alone account for 72% of this amount: 2002, due to an episode of torrential rain which affected the city of Santa Cruz de Tenerife and caused eight mortalities, 2005, due to tropical storm Delta (in this case the damage is associated with high winds), and 2010, when there were three episodes of heavy rainfall in February which affected, in particular, several towns on the island of Tenerife [3].
Torrential rainfall events, and the floods and geological processes such as landslides that they cause, have resulted in multiple human and economic losses in the Canary Islands throughout their history. Numerous studies have tackled this type of phenomenon, undertaking analyses that contemplate both the hazard factor, considering the characteristics of the precipitation [4,5,6,7], and the risk factor [8,9,10,11,12,13]. Since the 1950s, many works have been published on the types of weather in the Canary Islands based on analyses of weather maps and the values of various climate-related parameters recorded at the different weather stations in the archipelago [14,15,16]. Specific studies have also been conducted on certain types of weather which affect the islands, such as Saharan air intrusions [17,18], cold depressions [19], or tropical disturbances [20,21]. However, very few studies have specifically dealt with heavy precipitation events and their relationship with the state of the atmosphere that generates them, while those that have been published are either internal reports of AEMET, the State Meteorological Agency of Spain [22], or consider specific factors affecting part of the archipelago [23] or a single island [24].
2. Aims
This work focuses on the identification and characterisation of torrential rainfall events and their relationship with the state of the atmosphere in the Canary Islands. Thus, the objectives of this work are: (i) to identify the episodes of torrential rain that occurred in this archipelago between 1950 and 2020. As also established by different authors for various areas of the Iberian Peninsula and the Balearic Islands[25,26,27,28], the value of 200 mm in 24 hours is chosen as the threshold for the selection of days of intense rainfall which are capable of generating important erosive processes, as well as floods, landslides and rockfalls; (ii) to characterise these episodes from a spatial and temporal point of view; and (iii) to catalogue these days according to the objective classification of Jenkinson and Collison [29] and the subjective classification of Olcina [30].
3. Study Area
The Canary Islands are made up of a group of islands and islets occupying a surface area of 7,474 km2 (Figure 1). To understand the uniqueness of their climate, and in particular their rainfall regime, several aspects must be considered, some related to regional atmospheric conditions and others to geographical factors. With regard to atmospheric conditions, the islands are, for most of the year, under the dominance of a subtropical high pressure system (the Azores anticyclone), whose main characteristic is the existence of a thermal inversion that varies in height (between 600 m in summer and 1,700 m in winter), in thickness (the difference between its base and peak can vary from just 50 m to more than 1,000 m) and in intensity, with the temperature difference between the base and peak sometimes only a few tenths of a degree and at other times exceeding 13ºC [18]. This atmospheric structure favours the presence of a stratocumulus cloud layer (known locally as the ‘mar de nubes’ or sea of clouds) that is frequently trapped on the northern slopes of the islands, generating drizzle that often constitutes up to 5% of the annual rainfall. The standout geographical factors are the latitudinal position of 28ºN, the proximity of the large warm surface of the African continent, the impact of the cold marine current of the Canary Islands and, above all, the altitude and orientation of the slopes, which generate very significant topoclimatic contrasts [31].
Average annual rainfall in the Canary Islands ranges from 1,300 mm in the north-east of La Palma to 100 mm in the south of Gran Canaria and Tenerife, as well as in large parts of Fuerteventura and Lanzarote [32]. These widely differing thresholds can be put down, firstly, to each island’s position with respect to the incoming Atlantic cloud fronts and, secondly, to the effects of each island’s altitude and relief orientation. In consequence, there is a wide range of environments, from very humid in some mid-altitude locations in the N and NE of the highest islands or the peaks of La Gomera and El Hierro to very dry - desert-like - in the easternmost islands and, in general, on the southern coasts of all the islands. In all cases, the seasonal rainfall pattern is clearly concentrated from mid-October to early spring. The strong inter-annual irregularity of rainfall is also noteworthy, and it is by no means unusual for a dry year to be followed by a rainy or very rainy year and for periods of severe drought, as is currently being experienced, to alternate with rainy periods [31].
The daily analysis of precipitation shows that one of the most characteristic features of rainfall in the Canary Islands is its high irregularity and concentration. The moderately high values of the daily precipitation concentration index (CI) [33] show that a very significant percentage of the total annual precipitation is accumulated in just a few days of rainfall [7]. On the most mountainous islands (those to the west, together with Gran Canaria), clear differences are found between the southern slopes, where the highest CI values of around 0.70 are recorded, and the northern slopes where the CI is more moderate and varies between 0.63 and 0.66. In this case, 25% of the rainiest days account for approximately 75% of all rainfall. Thus, in the northern mid-altitude areas, rainfall is spread over numerous rainy days which leave relatively insignificant amounts in relation to the annual total, in most cases essentially drizzle caused by the trapping of the so-called ‘sea of clouds’ at this altitude. Heavy downpours also occur on these slopes, caused by Atlantic cold fronts which are most likely to sweep through the Canary Islands from late autumn and during the winter, discharging significant amounts of water in spells of several consecutive rainy days, and which considerably increase the annual totals. Meanwhile, in the eastern and southern mid-altitude areas, the CI values are high, always above 0.68. There is another factor of significant danger on these slopes: the torrential nature of the rainfall [7].
It is therefore the intention of this present work to offer a more in-depth analysis of this aspect of the torrential nature of the rainfall by identifying and characterising the type of episode capable of causing serious damage to the Canary society and the islands’ ecosystems. The initial data, the methodology used, and the results and their discussion are presented below, with the main conclusions presented at the end.
4. Data and Methodology
We worked with two rainfall databases. The first of these includes the 944 daily rainfall series available from AEMET, distributed unevenly across the different islands and with disparate periods. Some series have only a few months of data, while others have complete data for more than 100 years, such as those provided by the observatories of Izaña, at 2,371 m above sea level, or Santa Cruz de Tenerife, at 35 m above sea level, both on the island of Tenerife. Unfortunately, in the western islands there are very few series with data between 1950 and 1970, whereas in the easternmost islands the number of series available is considerably higher. The second database includes the available 417 series held by different Island Water Boards, which are administrative bodies pertaining to the Island Councils of Gran Canaria, Lanzarote and Fuerteventura. Most of these series begin in 1950 and continue uninterrupted down to the present day. It should be noted that 35% of these series are shared with AEMET, as the observers sent the collected data to both the State and the island-based bodies.
Figure 2 shows the total number of rainfall observation points in the Canary Islands between 1950 and 2020. As can be seen, until the 1970s on islands such as La Palma, El Hierro and La Gomera the number of observatories was generally low, which implies the possibility that some episodes of heavy rainfall may not have been recorded, although their occurrence may have been reported in historical documents or be deduced through dendrogeomorphological records [34]. From 1970 onwards, and especially in the following two decades, the AEMET began to install multiple rainfall observation points, especially in the westernmost islands. However, many of these fell into disuse and in the 2000s the number of observatories was drastically reduced on islands such as La Palma, La Gomera and El Hierro.
The data were subjected to a filtering process to identify any errors with respect to the days on which the precipitation was recorded. It was common, especially in the 1950s and 1960s, for some observers to record the precipitation for the day they made the measurement and not the preceding day, as should have been the case. Thus, the maximum precipitation in 24 hours would be reported for the day after the day it actually fell. Likewise, firstly, all values greater than 200 mm/day in which there was an accumulation of precipitation from several days were eliminated. Secondly, data of more than 200 mm/24 h that were not consistent with those from nearby stations were also eliminated. This was done through a comparison with data from nearby stations. When this was not possible, the verification was carried out with stations located on the same orientation or slope.
Once the days with more than 200 mm of rainfall in 24 hours had been selected, their monthly and seasonal distribution was analysed, as well as their characterisation, to differentiate the episodes according to their local, insular or regional (several islands) nature. This serves to help determine the existence or otherwise of a relationship between these episodes and the types of weather that generate them.
Sea level pressure data were then obtained for each of the dates mentioned for a 16-point grid around the Canary Islands and the eastern mid-Atlantic area corresponding to parallels 25º, 30º, 35º and 40º N with meridians 10º, 15º, 20º and 25º W (Figure 1). These data were obtained from the NCEP/NCAR Reanalysis project at a spatial resolution of 2.5º and fields every 6 hours, and at the standard times 00:00, 00:06, 12:00 and 18:00 UTC [35].
With this information as a starting point, a weather type classification was then made using an objective classification scheme, based on circulation indices, as initially developed for the British Isles by Jenkinson and Collison [29]. The classification employed to estimate weather types is based on a set of indices or variables calculated using the sea level pressure values and associated with the direction and vorticity of geostrophic flow (westerly flow, southerly flow, total flow, westerly shear vorticity, southerly shear vorticity, and total shear vorticity). Combining these variables, 27 different weather types are established: 1 pure anticyclonic (A), 1 pure cyclonic (C), 8 advective or directional types (N, NE, E, SE, S, SW, W, NW), 8 cyclonic hybrids of directional types (CN, CNE, CE, CSE, CS, CSW, CW, CNW), 8 anticyclonic hybrids of directional types (AN, ANE, AE, ASE, AS, ASW, AW, ANW), and 1 undetermined (U). This classification has been applied to multiple regions with various objectives, including Europe [36,37,38,39,40], the Iberian Peninsula [41,42,43] and the Canary archipelago, in the latter case to identify episodes of intense rainfall in the tourist zones of Gran Canaria and Tenerife [12].
A subjective classification was also carried out based on the work of Olcina [30], who analysed the pressure configurations in the middle and upper layers of the troposphere and established his own catalogue. However, beforehand, he adopted a classification of air masses according to their continental or maritime nature and their origin or source. In this way, he drew up a catalogue that classifies atmospheric situations according to the air mass involved in the energy transfer processes between high and low latitudes. Olcina’s catalogue distinguishes: (i) high pressure ridges associated to the expansion of subtropical air masses, related to which are the northern displacements of subtropical air masses; (ii) troughs with an axis located in a different position to that of the Iberian peninsula, associated to the arrival of polar and arctic air masses, and within which cold depressions can develop; (iii) zonal circulations, with a quasi-parallel component, which transfer maritime air masses of different origins (polar and subtropical), subject to intense denaturation processes.
The initial data for the analysis of the state of the atmosphere come from the daily weather bulletins published by AEMET. Also employed was the mapping elaborated by the NOAA (USA), which can be consulted on the Wetterzentrale webiste (www.wetterzentrale.de last accessed 1 June 2024) in the maps archive section. These are maps which combine the surface and 500 hPa situation and are useful for the manual classification of synoptic situations between 1979 and 2020. Surface and 500 hPa maps from the NOAA Library historical archive, available for the period 1879-1971, were also consulted (https://library.noaa.gov/weather-climate/synoptic-map last accessed 1 June 2024). In certain cases where it was difficult to determine the origin of the atmospheric situation, other maps such as those of the Bulletin Quotidien D'Études (Météo France) and the Täglicher Wetterbericht (Wetteezentrale) were requested.
5. Results
Figure 3 a) and b) shows the location of the observatories that recorded rainfall equal to or greater than 200 mm in 24 hours, while the list of episodes is given in Appendix A, together with the types of weather according to the proposed classifications and the surface pressure values of point 9 of the grid (Figure 1). It should be noted that 125 days were initially identified as exceeding the 200 mm/day value, but that after applying the filters indicated in the methodology the final number was 88, with the dates of three others which had been incorrectly assigned shifted by one day.
Of the 88 selected days with rainfall intensities above 200 mm/24 h, 77.3% were in the range between 200.1 and 300.0 mm, 18.2% between 300.1 and 400.0 mm, 3.4% between 400.1 and 500.0 mm, and with 500.0 mm exceeded on only one occasion (1.1%), specifically on 24 February 1988 when a total of 590.0 mm was recorded at the San Andrés rainfall station in the NE of the island of El Hierro.
5.1. Spatial, Monthly and Seasonal Distribution Of Torrential Rainfalls
The 88 selected precipitation days correspond to 64 rainfall events. A rainfall episode is identified as one in which, consecutively, days with precipitation are recorded in which the threshold is exceeded, including, if applicable, a day without precipitation - or with a lower value - between two selected days. For only one of the episodes, from November 8 to 12, 1950, can two different atmospheric situations causing the downpours be distinguished, which is why they are differentiated as different episodes. A total of 70% of the episodes are single-day episodes, 24% are two-day episodes, 3% are three-day episodes and a further 3% are four-day episodes.
These episodes are generally located on one island (73.0%) and even in very localised sectors, associated with situations of convergence on the leeward side of certain mountainous enclaves. The threshold was exceeded on two islands in 13 episodes (20.6%) and on three or more islands only on 4 occasions (6.4%).
This type of episode was never recorded in the easternmost islands (Lanzarote, Fuerteventura and La Graciosa), while the western islands, more exposed to the arrival of fronts and disturbances, have the highest number of episodes: La Palma with 28 episodes is followed by Tenerife with 24, Gran Canaria 17, El Hierro 11 and La Gomera 6. Clearly, in this case, the lack of an extensive rainfall observation network, especially between 1950 and 1970, made it impossible to record torrential rainfall episodes, especially on La Palma (between 1957 and 1977 there are no records of episodes), La Gomera and El Hierro. Proof of this, in the case of the island of La Palma, is the dendrochronological record in specimens of Canary Island pine (Pinus canariensis) of episodes of torrential floods in the Caldera de Taburiente, most notably in 1962 [34].
With respect to the monthly distribution of the 64 rainfall events (Table 1), they are most likely to occur during winter (52.4%) and autumn (33.3%), with a lower frequency in spring (14.3%). It should be noted that it is during these months that the islands receive the greatest influx of tourists and should therefore be considered a risk factor [12]. Analysis of the monthly distribution reveals that February (20.6%) and November (19.0) are the months with the highest probability of this type of episode. With the exception of April, with only one episode (1.6%), the other months have a similar relative frequency (between 12.7% and 15.9%).
5.2. Types of Weather Based On Surface Analysis And Sea Level Pressure Values
After applying the algorithms of the objective classification of Jenkinson and Collison (Table 2), it can be deduced that most of the rainy days correspond to pure advective or directional situations (37.5%), especially from the E (21.6%). This contrasts with what would be expected, namely the predominance of pure cyclonic (22.7%) or hybrid cyclonic (27.3%) situations. A total of 5.7% corresponded to pure anticyclonic situations, one day was classified as hybrid anticyclonic (1.1%) and 5 days (5.7%) as undetermined.
As far as sea level pressure values are concerned, point 9 of the grid used in the Jenkinson and Collison classification (30ºN/15ºW) was taken as reference. At this point, the mean pressure for all selected days was 1013 hPa, the normal surface level pressure. However, on 56.3% of the days the sea level pressure was higher than normal, which highlights the need to use the topographies of the middle layers of the atmosphere (Table 3). The minimum pressure recorded was 997 hPa on 28/11/2014.
If we compare these values with the situations defined by Olcina [30] and shown in the following section, on days with high-altitude isolated depressions (DANAs) coinciding with low surface dynamics, the mean pressure was 1010 hPa, a slightly higher value than advections from the W with DANAs (1009 hPa). These values are considerably lower than the situations typified as troughs (1015 hPa) and E advections with DANAs (1019 hPa).
5.3. Types of Weather Considering Topography at 500 hPa
After analysing the 500 hPa weather maps, it can be deduced that, in the Canary Islands, the development of episodes of heavy rain is determined by configurations in which the expansion of cold air masses can be detected, which draw troughs or cold depressions with different locations in the Canary Islands region. These situations respond to energy transfer processes, which condition circulations of subtropical air towards high latitudes and of cold air masses (polar or arctic) towards mid-latitudes and even subtropical latitudes. This dynamic occurs when the speed of the upper tropospheric flow decreases, generating troughs and ridges that favour the aforementioned energy exchanges between high and low latitudes [30]. When this state of atmospheric circulation occurs between 30º/10º W longitude and 25º/40º N latitude, with well-defined depressions and troughs over the islands, one of the conditions favourable for precipitation of varying intensity is established. In this sense, the most numerous episodes are those with closed isobaric configurations, high-altitude isolated cold depressions (DANAs) which can also be differentiated according to their origin, especially when they are accompanied by surface squalls.
5.3.1. Polar and Maritime Arctic Air Troughs
Of the 64 rainfall events, 23 of them draw, in the 500 and 300 hPa topographies, well-defined troughs, with N-S or NE-SW axes over the European west coast, whose southern edge reaches the Canary Islands (Table 4). It is not uncommon to observe on maps of the middle layers of the atmosphere how the isohypses end up closing, and for a cold high-altitude depression to be isolated to the west of Portugal or in the vicinity of the Gulf of Cadiz and north of the Canary Islands (Figure 4a). At the surface, two types of situations can be identified: low pressure with cold fronts that leave abundant precipitation, or the presence of high pressure on the surface, with the Azores anticyclone in its usual position, in what Huetz de Lemps [15] identified as polar air advections by the eastern flank of the Azores anticyclone (Figure 4b). Finally, there are episodes of retrograding troughs [44] in which strong undulations in the jet stream are detected, favouring the advection of continental polar air over the western Mediterranean and North Africa as far as the Canary Islands (Figure 4C). One of the worst episodes in the 20th century in the Canary Islands from a social point of view (34 fatalities on the island of La Palma) is related to this type of atmospheric situation and occurred on 15-16 January 1957.
The greater frequency of the presence of troughs at the middle levels of the atmosphere in the months of October (26.1%), November, February and March (17.4%) indicates a circulation in the upper layers characterised by strong undulations in the jet stream, which transfers masses of cold air to the Canary Islands, to which can be added the weakening of the Azores anticyclone or its withdrawal towards the west (Table 5). This situation, together with the effect of the relief, favours vertical cloud development (cumulus and cumulonimbus) and the concentration of rainfall mainly on the northern slopes of the islands.
5.3.2. High-altitude isolated depressions (DANAs)
In 40 episodes (Table 6), closed circulations are observed in or near the Canary Islands region. These are determined by the existence of cold depressions defined in the 500 and 300 hPa maps between latitudes 25º-40ºN and longitudes 15º-25ºW. These depressions have different origins and different trajectories, but they are all linked to the loss of jet stream velocity. When the velocity of the jet stream is between 150 and 70 km/h, it begins to describe undulations, drawing troughs and ridges. A more pronounced decrease in speed, below 70 km/h, causes the undulations to become more pronounced, and a cold air pocket is created [30].
This type of situation, when it affects the Canary Islands, produces the heaviest hourly rainfall. In addition, the presence, in many cases, of oceanic disturbances in the vicinity of the archipelago generates strong winds, normally from the third quadrant, and strong waves that tend to cause significant damage. As can be seen in Table 7, the highest frequency of these DANA episodes is during winter (60.0%), in February (22.5%), January (20.0%) and December (17.5%), followed by autumn (27.5%), in November (20.0%) and October (7.5%), and spring (12.5%), in March (10%) and April (2.5%).
From the analysis of the synoptic situations of these episodes, two main types of tropospheric circulation can be distinguished. The first (i) can be defined as omega situations, which are characterised by a large expansion of maritime arctic or maritime polar air towards southern latitudes. On 500 hPa maps, a deep trough with a different latitudinal position (usually west of the 5º W meridian) appears in the Atlantic. This deep trough produces, at the same time, the advection of subtropical air towards high latitudes. This expansion of cold air generates a strong cyclogenesis in or near the Azores region (Figure 5a). The second type (ii) can be defined as blocking situations, which are outlined by a general circulation in which the zonal flow is interrupted in one or several sectors of the hemisphere by a strong and persistent meridional flow [45]. This model is characterised by an anticyclone in mid and high latitudes that obstructs the normal eastward movement of the squalls, and by abnormally deep depressions in low latitudes on the ascending or descending blocking branch [46]. In the Canary Islands, the effect of these situations varies, as they depend on the location of the blocking high pressures. When located in the centre and on the west coast of Europe, the depressions that form in the North Atlantic are unable to move eastwards, so they move towards southern latitudes (Figure 5b).
On the surface, the blocking situation exerted by high pressure on the oceanic disturbances formed in the Atlantic causes them to descend towards more southerly latitudes with different trajectories. Most frequently (27 episodes), they move in a N-S, NW-SE and NE-SW direction (Figure 6).
In 8 cases (Figure 7), well-defined W-E trajectories are observed. It should be noted that storms with serious social and economic consequences for the Canary Islands are related to this type of trajectory, especially those that end up centred to the NW of the archipelago. However, in exceptional cases, such as the February 1989 episode, an E-W trajectory is observed.
Finally, there are 5 episodes with isolated depressions at high levels and high pressures at the surface, as well as 4 episodes with no clear-cut situation (barometric swamp).
5.4. Tropical disturbances
Exceptionally, the Canary Islands are affected by tropical disturbances [20,21], as in the case of the episode of 23 November 1954. This situation is not clearly defined in the surface weather maps consulted, except in those of the Bulletin Quotidien D'Études. Figure 8 shows a system of fronts associated with a disturbance moving northwards from the south of the Canary Islands and the west coast of Africa, an instability that is favoured by the existence of a trough in the middle layers of the atmosphere.
6. Discussion of the Results and Conclusions
Firstly, it should be noted that the identification of heavy rainfall episodes in the Canary Islands is dependent on the existence or otherwise of rain gauges distributed homogeneously throughout the territory over the period of analysis. For many of the days on which rainfall exceeds 200 mm/24 h it is normal for that rainfall to be located on a single island (73%) and even in very localised sectors, related to the situation of instability in the middle layers together with convergence processes on the leeward side of certain mountainous reliefs. Therefore, it is highly likely that the number of days selected is somewhat lower than the actual number of days on which such events occurred. An example of this type of situation is the distribution of precipitation that affected the most northeastern sector of the island of Tenerife on 31 March 2002 (Figure 9), one of the worst episodes in terms of material damage and number of fatalities (8 in total) in the current century [9,10,11,12,13,14,15,16,17,18,19,20,21,22,23,24,25,26,27,28,29,30,31,32,33,34,35,36,37,38,39,40,41,42,43,44,45,46,47].
On the other hand, more than half of the episodes (51.6%) were recorded in the winter months, with February and November those with the highest frequency (20.3%), followed by autumn (33.4%) and spring (14.1%).
One of the main factors that determines the formation of these episodes of heavy rain in the Canary Islands is the existence of marked instability in the middle layers of the atmosphere, with two basic configurations. In first place, isolated depressions in the upper levels of the atmosphere known as DANAs (63.4%), whose origin is linked to two major types of tropospheric circulation: omega-shaped configurations, with deep troughs with different latitudinal positions (it is not uncommon to observe on maps of the middle layers of the atmosphere how the isohypses end up closing, generating a DANA). This type of configuration also includes retrograding processes [42]. On the other hand, there are blocking situations characterised by an anticyclone in mid and high latitudes that obstructs the normal eastward movement of the squalls. In the North Atlantic, this instability in the middle layers generates a marked cyclogenesis, with disturbances following different paths: the most frequent are from the first and fourth quadrants (77.5%), while those following W-E paths are more exceptional (22.5%). Only in 5 episodes were anticyclonic situations detected on the surface and in another 4 no closed circulations (barometric swamp) were identified.
In second place, troughs (36.5%), with preferential axes in the first and fourth quadrants, although there are also advections of continental polar air over the Iberian Peninsula and North Africa (retrograding troughs). On the surface, the advection of polar air over the eastern flank of the Azores anticyclone (high pressure on the surface) can be distinguished from the disturbances that form on the western coast of the Iberian Peninsula and north of the Canary Islands.
In terms of monthly distribution, DANAS are most frequent in February (22.5%), January and November (both with 20.0%); while troughs are most frequent in October (26.1%), February, March and November (17.4%).
According to the Jenkinson and Collison classification, half of the days exceeding 200 mm/24 hours were classified as cyclonic or cyclonic hybrids, 84% of them coinciding in the middle layers with DANAS, while in 14% of the cases open circulations were identified. The days classified as advective or pure directional types (37.5%) coincide in 58.8% of the cases with DANAS and 41.2% with troughs. All days classified as pure anticyclonic and hybrid anticyclonic (6.8%), except for one (where a DANA is observed) are identified as open circulations. Finally, 4 of the 5 days classified as undetermined show troughs.
As a final conclusion, the diachronic analysis of rainfall events of > 200 mm/24 h in the Canary Islands needs to consider both the isobaric configurations at the surface and the topography of the middle layers of the atmosphere. In addition, it is necessary to consider the convective processes downwind of the mountainous reliefs that generate downpours that are often difficult to predict.
Author Contributions
Conceptualization, P.M.; methodology, P.M. and A.L.; software, A.L.; validation, P.M. and A.L.; formal analysis, P.M. and A.L.; investigation, P.M.; resources, P.M. and A.L.; data curation, P.M. and A.L.; writing—original draft preparation, P.M.; writing—review and editing, P.M. and A.L.; visualization, P.M. and A.L.; supervision, P.M. and A.L.; project administration, P.M.; funding acquisition, P.M. All authors have read and agreed to the published version of the manuscript.
Funding
This research was financed by the PLANCLIMAC2 project, 1/MAC/2/2.4/0006. This project was funded at 85% by Interreg VI Madeira-Azores-Canarias (MAC) 2021-2027 Territorial Cooperation Program by the European Regional Development Fund (ERDF). The other 15% by the regional and national funds of the participating territories. This includes contributions from the regional governments of Madeira (Portugal), Azores (Portugal), and the Canary Islands (Spain).
Institutional Review Board Statement
Not applicable.
Informed Consent Statement
Not applicable.
Data Availability Statement
The data used for this study were obtained from public governmental sources. The mean sea-level pressure data employed in the Jenkinson and Collison classification [29] were adquired from the NCEP/NCAR Reanalysis project (https://psl.noaa.gov/data/gridded/data.ncep.reanalysis.html). For the subjective classification by Olcina [30], surface and 500 hPa maps were retrieved via the Wetterzentrale (https://www.wetterzentrale.de/es/reanalysis.php?model=cfsr&var=1&map=1) and NOAA (https://library.noaa.gov/weather-climate/synoptic-map) websites. Meteorological station data in the islands were provided by the Spanish State Meteorological Agency, AEMET (https://www.aemet.es/en/serviciosclimaticos), and their redistribution requires prior authorization from this institution. Products generated in this research, including files with the results of the Jenkinson and Collison [29] and Olcina [30] classifications, as well as the trajectories of the analysed depression centres, are available upon request from the authors.
Conflicts of Interest
The authors declare no conflicts of interest.
Appendix A
Days with > 200 mm of rainfall in the Canary Islands (1950-2020). The last column indicates the number/s of the corresponding weather station/s which is/are geolocated in Figure 3.

| ID | Date | Maximum Rainfall (mm) |
Station with Maximum Rainfall |
Code | Island | Station |
|---|---|---|---|---|---|---|
| 1 | 1 Feb1950 | 244.0 | Culata Risco Blanco | 082 | Gran Canaria | 114 |
| 2 | 8 Nov 1950 | 240.0 | San Sebastián-Laja | C327I | La Gomera | 13, 49, 71 |
| 3 | 9 Nov 1950 | 300.1 | Ayacata | 046 | Gran Canaria | 103, 116, 117 |
| 4 | 11 Nov 1950 | 360.0 | Izaña | C430E | Tenerife | 61 |
| 5 | 12 Nov 1950 | 262.8 | Hoya del Gamonal | 002 | Gran Canaria | 87, 116 |
| 6 | 18 Nov 1952 | 211.0 | Breña Baja-San José | C138I | La Palma | 19 |
| 7 | 30 Oct 1954 | 204.5 | Garafía | C148O | La Palma | 1 |
| 8 | 31 Oct 1954 | 219.5 | Laguna (Instituto) | C447B | Tenerife | 76 |
| 9 | 23 Nov 1954 | 228.0 | Izaña | C430E | Tenerife | 61, 112, 132, 135, 139, 141 |
| 10 | 23 Oct 1955 | 420.3 | Santa Lucía | 054 | Gran Canaria | 61, 67, 95, 103, 121, 124, 128, 129, 133, 137, 139 |
| 11 | 24 Oct 1955 | 364.6 | Madroñal | 039 | Gran Canaria | 92, 93, 97, 98, 99, 100, 112, 113, 115, 116, 117, 122, 123, 125, 126, 127, 130, 131, 132, 134, 136, 138, 141 |
| 12 | 14 Feb1956 | 272.6 | Taidia | 100 | Gran Canaria | 119 |
| 13 | 15 Feb1956 | 400.0 | Hoya del Gamonal | 002 | Gran Canaria | 101, 102, 113, 114, 116, 117, 126 |
| 14 | 16 Feb1956 | 306.0 | Cueva Grande | 166 | Gran Canaria | 113 ,117 |
| 15 | 15 Jan 1957 | 250.0 | Sauces-San Andrés | C148A | La Palma | 4, 12, 13, 14, 24 |
| 16 | 16 Jan 1957 | 250.0 | Sauces-San Andrés | C148A | La Palma | 1, 4 |
| 17 | 10 Mar 1957 | 280.2 | Erese | C927S | El Hierro | 41 |
| 18 | 10 Nov 1957 | 210.0 | San Sebastián-Faro de San Cristóbal | C329I | La Gomera | 51 |
| 19 | 3 Mar 1959 | 203.0 | Tanque-Ruigómez | C466N | Tenerife | 54, 62 |
| 20 | 17 Nov 1962 | 260.0 | Juncalillo | 056 | Gran Canaria | 94 |
| 21 | 18 Nov 1962 | 428.6 | Retamilla | 098 | Gran Canaria | 95, 99, 100, 113, 116, 117 |
| 22 | 28 Dec 1962 | 205.4 | Culata de Tejeda | 089 | Gran Canaria | 102 |
| 23 | 29 Dec 1962 | 226.5 | Cuevas Blancas | 033 | Gran Canaria | 117 |
| 24 | 30 Jan 1965 | 250.3 | Hoya del Gamonal | 002 | Gran Canaria | 116 |
| 25 | 31 Jan 1965 | 212.1 | Cortijo Huertas | 208 | Gran Canaria | 108 |
| 26 | 23 Nov 1968 | 216.5 | Vallehermoso | C319E | La Gomera | 45, 62, 96 |
| 27 | 24 Nov 1968 | 296.6 | Izaña | C430E | Tenerife | 61, 62, 102 |
| 28 | 12 Feb 1971 | 246.0 | Draguillo - San Mateo | 071 | Gran Canaria | 108, 119, 123 |
| 29 | 13 Feb 1971 | 204.0 | Orotava-Aguamansa C.F. | C455O | Tenerife | 62 |
| 30 | 20 Nov 1971 | 309.3 | Montaña de Tirma | 143 | Gran Canaria | 90 |
| 31 | 21 Nov 1971 | 300.0 | Risco de Agaete | 106 | Gran Canaria | 91 |
| 32 | 22 Nov 1971 | 203.0 | Valle Guerra-Isamar | C448U | Tenerife | 73 |
| 33 | 23 Nov 1971 | 216.1 | Furel Alto | 226 | Gran Canaria | 89 |
| 34 | 10 Apr 1977 | 290.0 | Fasnia-Sabina Alta | C436U | Tenerife | 66, 70, 72, 74, 75, 78 |
| 35 | 11 Apr 1977 | 358.9 | Vilaflor | C424E | Tenerife | 13, 58, 64, 67 |
| 36 | 12 Apr 1977 | 215.0 | Buenavista-Aeropuerto Viejo | C138O | La Palma | 15 |
| 37 | 10 Feb1978 | 399.3 | Caldera Taburiente | C106U | La Palma | 10 |
| 38 | 16 Jan 1979 | 229.3 | Izaña | C430E | Tenerife | 61, 104, 106, 117 |
| 39 | 17 Jan 1979 | 211.0 | Cuevas Blancas | 033 | Gran Canaria | 117 |
| 40 | 23 Jan 1979 | 210.0 | Caldera Taburiente | C106U | La Palma | 10 |
| 41 | 25 Jan 1980 | 243.9 | Caldera Taburiente | C106U | La Palma | 10 |
| 42 | 27 Feb1986 | 217.0 | Caldera Taburiente | C106U | La Palma | 10 |
| 43 | 23 Jan 1987 | 240.0 | Caldera Taburiente | C106U | La Palma | 10, 21 |
| 44 | 19 Oct 1987 | 202.0 | Tanque-San José de los Llanos | C465N | Tenerife | 53 |
| 45 | 23 Oct 1987 | 248.0 | Anaga-carboneras | C447R | Tenerife | 81 |
| 46 | 25 Nov 1987 | 309.0 | San Andrés | C925I | El Hierro | 37, 38 |
| 47 | 26 Nov 1987 | 278.0 | Isora | C926C | El Hierro | 32, 35 |
| 48 | 24 Feb1988 | 590.0 | San Andrés | C925I | El Hierro | 35, 38 |
| 49 | 27 Feb 1988 | 450.0 | Sauces-Espigón Atravesado | C147C | La Palma | 7, 13, 16, 20, 21, 23, 37, 41, 42, 43, 44 |
| 50 | 16 Feb1989 | 208.4 | Los Barros | 141 | Gran Canaria | 140 |
| 51 | 25 Oct 1989 | 243.0 | GuÍa Isora-Tejina Cooperativa Agrícola | C417G | Tenerife | 55 |
| 52 | 24 Nov 1989 | 270.3 | Mesas de Ana López | 067 | Gran Canaria | 48, 102, 104, 106, 107, 109, 114, 117 |
| 53 | 28 Dec 1989 | 210.8 | Realejos-Portillo Centro de Visitantes | C451V | Tenerife | 60, 66 |
| 54 | 29 Mar 1990 | 286.7 | Barlovento-C.F. | C147F | La Palma | 3, 17, 57 |
| 55 | 30 Nov 1990 | 244.0 | Derrabado | C936S | El Hierro | 28 |
| 56 | 4 Dec 1991 | 330.8 | Sauces-Marcos y Cordero | C144A | La Palma | 9, 10, 13, 16, 17, 18, 19, 56, 57, 109, 111, 119 |
| 57 | 6 Dec 1991 | 295.3 | Sauces-Marcos y Cordero | C144A | La Palma | 9, 57, 104, 109, 110, 111, 114, 117, 118, 120 |
| 58 | 17 Dec 1991 | 350.0 | Mazo-Tigalate | C137A | La Palma | 23 |
| 59 | 12 Oct 1992 | 226.0 | Isora-Llanos | C926E | El Hierro | 36 |
| 60 | 21 Oct 1992 | 243.8 | Sauces-Espigón Atravesado | C147C | La Palma | 6, 7 |
| 61 | 17 Mar 1993 | 337.0 | Izaña | C430E | Tenerife | 61 |
| 62 | 28 Oct 1993 | 236.0 | Breña Baja-San José | C138I | La Palma | 19 |
| 63 | 22 Dec 1993 | 224.7 | Sauces-Casa Monte | C144B | La Palma | 8 |
| 64 | 11 Dec 1995 | 202.6 | Frontera-Cruz los Reyes | C934O | El Hierro | 30 |
| 65 | 13 Dec 1995 | 219.0 | Buenavista-Carrizal | C467V | Tenerife | 39, 52 |
| 66 | 29 Jan 1996 | 227.0 | Binto | C915K | El Hierro | 26, 30 |
| 67 | 23 Feb1996 | 210.0 | Sauces-San Andrés Colegio Nacional | C148D | La Palma | 5 |
| 68 | 7 Jan 1999 | 216.8 | Lagunetas | 068 | Gran Canaria | 105, 106, 107, 113 |
| 69 | 11 Nov 2000 | 205.0 | Alajeró | C326C | La Gomera | 46 |
| 70 | 22 Dec 2000 | 209.5 | Caldera Taburiente | C106U | La Palma | 10 |
| 71 | 12 Mar 2001 | 290.0 | Garafía-C.F. | C145N | La Palma | 2, 29 |
| 72 | 26 Mar 2001 | 384.0 | Binto | C915K | El Hierro | 25, 26, 27, 30 |
| 73 | 31 Mar 2002 | 252.0 | Santa Cruz de Tenerife-Urb.Anaga | C449D | Tenerife | 83, 84, 85, 88 |
| 74 | 13 Dec 2004 | 305.0 | Tazacorte Pto. Naos Hoyas | C129E | La Palma | 22 |
| 75 | 16 Jan 2005 | 240.0 | Agulo-Juego Bolas | C317B | La Gomera | 47 |
| 76 | 17 Jan 2005 | 254.0 | San Sebastián (Ayudantía Marina) | C329F | La Gomera | 50 |
| 77 | 17 Feb 2005 | 208.0 | Santa Cruz de La Palma - Mirca | C139R | La Palma | 11 |
| 78 | 26 Jan 2007 | 219.0 | Pinar Roque | C916S | El Hierro | 33 |
| 79 | 27 Jan 2007 | 320.0 | Puntas-Casitas | C939D | El Hierro | 10, 16, 31, 33, 39, 40, 41, 127 |
| 80 | 18 Mar 2007 | 222.5 | Victoria Ayuntamiento | C458C | Tenerife | 63 |
| 81 | 19 Mar 2007 | 279.0 | Caldera Taburiente | C106U | La Palma | 10 |
| 82 | 15 Feb 2008 | 207.0 | Mazo-Rosas | C137F | La Palma | 20 |
| 83 | 23 Dec 2009 | 355.2 | Santa Cruz de la Palma - Velhoco | C138P | La Palma | 10, 11, 13, 15, 20 |
| 84 | 1 Feb 2010 | 270.5 | Anaga-Jardina | C447F | Tenerife | 57, 65, 68, 77, 79, 80, 82, 87 |
| 85 | 15 Feb 2010 | 241.1 | Caldera Taburiente | C106U | La Palma | 10 |
| 86 | 2 Dec 2013 | 215.4 | Pinar-Depósito | C916Q | El Hierro | 34 |
| 87 | 19 Oct 2014 | 202.0 | Anaga-Taganana Azanos | C449M | Tenerife | 86 |
| 88 | 28 Nov 2014 | 228.3 | Candelaria-Ramonas | C436L | Tenerife | 69 |
References
- Banerjee, C.; Bevere, L.; Garbers, H.; Grollimund, B.; Lechner, R.; Weigel, A. Natural catastrophes in 2023: gearing up for today’s and tomorrow’s weather risks. SIGMA 2024, 1, Swiss Re. [Google Scholar]
- Anuario Estadístico del Ministerio del Interior. España, 2024. Available online: https://www.interior.gob.es/web/servicios-al-ciudadano/documentacion-y-publicaciones/anuarios-y-estadisticas (accessed on 20 October 2024).
- López, A.; Dorta, P.; Díaz, J. Consecuencias de los eventos meteorológicos de rango extraordinario en Canarias: temporales de viento, inundaciones y fenómenos costeros. In El clima: aire, agua, tierra y fuego; Montávez, J.P., Gómez, J.J., López, J.M., Palacios, L., Turco, M., Jerez, S., Lorente, R., Jiménez, P., Ruiz, M., Eds.; AEC: Spain, 2018; pp. 749–759. [Google Scholar]
- Marzol, M.V.; Yanes, A.; Romero-Ruiz, C.; De Azevedo, E.; Prada, S. Los riesgos de las lluvias torrenciales en las islas de la Macaronesia (Azores, Madeira, Canarias y Cabo Verde). In Clima, Sociedad y Medio Ambiente; Cuadrat, J.M., Saz, M.A., Vicente, S.M., Lanjeri, S., De Luis, M., González-Hidalgo, J.C., Eds.; Asociación Española de Climatología: Spain, 2006; pp. 443–452. [Google Scholar]
- Tarife, R.; Méndez, S.; Hernández Barrera, S.; Gámiz-Fortis, S.R.; Castro-Díez, Y.; Esteban-Parra, M.J. Análisis de los extremos pluviométricos en las islas Canarias y su relación con el índice NAO. In Cambio Climático: Extremos e Impactos; Rodríguez, C., Ceballos, A., González, N., Morán, E., Hernández, A., Eds.; Asociación Española de Climatología: Spain, 2012; pp. 659–668. [Google Scholar]
- Máyer, P.; Marzol, M.V. La concentración y la agresividad de la lluvia en las islas de la Macaronesia. In Respuestas de la Geografía Ibérica a la crisis actual; Royé, D., Aldrey, J.A., Pazos, M., Piñeira, M., Valcárcel, M., Eds.; Asociación de Geógrafos Españoles: Spain, 2012; pp. 896–906. [Google Scholar]
- Máyer, P.; Marzol, M.V. La concentración pluviométrica diaria y las secuencias lluviosas en Canarias: dos factores de peligrosidad. Boletín de la AGE 2014, 65, pp. 231–247. [Google Scholar]
- Máyer, P. Desarrollo urbano e inundaciones en la ciudad de Las Palmas de Gran Canaria (1869–2000). Investigaciones Geográficas, 2002; 28, 145–159. [Google Scholar]
- Marzol, M.V. Lluvias e inundaciones en la ciudad de Santa Cruz de Tenerife. In El Agua y el Clima; Guijarro, J.A., Grimalt, M., Laita, M., Alonso, S., Eds.; Asociación Española de Climatología (AEC): Spain, 2002; pp. 36–42. [Google Scholar]
- Arranz, M. ; Riesgos catastróficos en las islas canarias. Una visión geográfica. Anales de Geografía, 2006; 26, 167–194. [Google Scholar]
- Dorta, P. Catálogo de riesgos climáticos, amenaza y vulnerabilidad. Geographicalia 2007, 51, 133–160. [Google Scholar]
- López Díez, A.; Máyer, P.; Díaz Pacheco, J.; Dorta, P. Rainfall and Flooding in Coastal Tourist Areas of the Canary Islands (Spain). Atmosphere 2019, 10(12), 809. [Google Scholar] [CrossRef]
- Dorta, P.; López Díez, A.; Díaz Pacheco, J.; Máyer, P.; Romero, C. Turismo y amenazas de origen natural en la Macaronesia. Análisis comparado. Cuadernos de Turismo, 2020; 45, 61–92. [Google Scholar] [CrossRef]
- Font, I. El tiempo atmosférico en las Islas Canarias. Servicio Meteorológico Nacional, Serie A (26), Madrid, 1956.
- Huetz de Lemps, A. Le climat de Iles Canaries. S.E.D.E.S.: Paris, France, 1969.
- Marzol, M.V. El clima: rasgos generales. In Geografía de Canarias, Tomo I; Ediciones Interinsular Canaria: Spain, 1993; pp. 101–116. [Google Scholar]
- Font, I. Las invasiones de aire caliente africano en el Archipiélago Canario. Revista de Geofísica, 1950; 56, 334–349. [Google Scholar]
- Dorta, P. Las inversiones térmicas en Canarias. Investigaciones Geográficas, 1996; 15, 109–124. [Google Scholar] [CrossRef]
- Font, I. Efectos de las depresiones frías en el tiempo de las Islas Canarias. Revista de Geofísica, 1955; 56, 347–362. [Google Scholar]
- Font, I. Perturbaciones tropicales del tiempo atmosférico de la región de Canarias y Sáhara Español. Revista de Geofísica, 1955; 54, 139–152. [Google Scholar]
- Dorta, P.; Domínguez Hernández, A.; Díaz Pacheco, J.; López Díez, A.; Martín Raya, N. Tropical disturbances in the southeastern North Atlantic. State of the art and future prospects. Investigaciones Geográficas, 2023; (79), 33–50. [Google Scholar] [CrossRef]
- Martín, F.; Alejo, C.J.; Bustos, J.J.; Calvo, F.J.; San Ambrosio, I.; Sánchez-Laulhé, J.M.; Santos, D. Estudio de la tormenta tropical Delta y su transición extratropical: efectos meteorológicos en Canarias. Publicaciones y Estudios de la AEMET.
- Máyer, P.; Romero, L. Causas meteorológicas y distribución espacial de las lluvias intensas en las Canarias orientales (1951–2000). In Clima, Sociedad y Medio Ambiente; Cuadrat, J.M., Saz, M.A., Vicente, S.M., Lanjeri, S., De Luis, M., González-Hidalgo, J.C., Eds.; Asociación Española de Climatología: Spain, 2006; pp. 453–462. [Google Scholar]
- Máyer, P. Episodios de lluvia intensa en Gran Canaria: causas meteorológicas y distribución espacial de las precipitaciones. In Primer Encuentro sobre Meteorología y Atmósfera de Canarias; Centro de Publicaciones Secretaría General Técnica Ministerio de Medio Ambiente: Madrid, Spain, 2003; pp. 86–88. [Google Scholar]
- Meseguer-Ruiz, O.; López-Bustins, J.A.; Arbiol, L.; Martin-Vide, J.; Miró, J.; Estrela, M.J. Episodios de precipitación torrencial en el este y sureste ibéricos y su relación con la variabilidad intra-anual de la Oscilación del Mediterráneo Occidental (WeMO) entre 1950 y 2016. In El Clima: Aire, Agua, Tierra y Fuego; Montávez-Gómez, J.P., Gómez-Navarro, J.J., López-Romero, J.M., Palacios-Peña, L., Turco, M., Jerez-Rodríguez, S., Lorente, R., Jiménez-Guerrero, P., Eds.; Asociación Española de Climatología: Murcia, Spain, 2018; pp. 53–63. [Google Scholar]
- Llop-Garau, J.; Alomar-Garau, G. Clasificación sinóptica automática de Jenkinson y Collison para los días de precipitación mayor o igual a 200 mm en la isla de Mallorca. Territoris 2012, 8, 143–152. [Google Scholar]
- Martin-Vide, J.; Moreno-García, M.C.; López-Bustins, J.A. Synoptic causes of torrential rainfall in South-eastern Spain (1941–2017). Cuadernos de Investigación Geográfica 2021, 47, 143–162. [Google Scholar] [CrossRef]
- Gázquez, A.; Perpinyà i Romeu, M.; Llasat, M.C.; Peña, J.C. Episodios pluviométricos superiores a los 200 mm en 24 horas en Catalunya. Catalogación y configuraciones meteorológicas asociadas. In El clima entre el mar y la montaña; García Codron, J.C., Diego Liaño, C., Fernández de Arróyabe Hernáez, P., Garmendia Pedraja, D., Rasilla Álvarez, D., Eds.; Asociación Española de Climatología: Spain, 2004; pp. 303–312. [Google Scholar]
- Jenkinson, A.F.; Collison, P. An Initial Climatology of Gales Over the North Sea. Synoptic Climatology Branch Memorandum; Meteorological Office: Bracknell, UK, 1977. [Google Scholar]
- Olcina, J. Riesgos climáticos en la Península Ibérica. Penthalón: Madrid, Spain, 1994.
- Marzol, M.V.; Máyer, P. Algunas reflexiones acerca del clima de las islas Canarias. Nimbus, 2014; 29–30, 399–416. [Google Scholar]
- Luque, A.L.; Máyer, P.; García-Hernández, F. The digital climate atlas of the Canary Islands: A tool to improve knowledge of climate and temperature and precipitation trends in the Atlantic islands. Climate Services 2024, 34. [Google Scholar] [CrossRef]
- Martín-Vide, J. Spatial distribution of a daily precipitation concentration index in peninsular Spain. International Journal of Climatology 2004, 24, 959–971. [Google Scholar] [CrossRef]
- Génova Fuster, M.; Máyer Suárez, P.; Ballesteros Cánovas, J.; Rubiales, J.M.; Saz, M.A.; Díez Herrero, A. Multidisciplinary study of flash floods in the Caldera de Taburiente National Park (Canary Islands, Spain). Catena 2015, 131, 22–34. [Google Scholar] [CrossRef]
- Kalnay, E.; Kanamitsu, M.; Kistler, R.; Collins, W.; Deaven, D.; Gandin, L.; Iredell, M.; Saha, S.; White, G.; Woollen, J.; et al. The NCEP/NCAR 40-year reanalysis project. Bulletin of the American Meteorological Society 1996, 77, 437–472. [Google Scholar] [CrossRef]
- Chen, D. A monthly circulation climatology for Sweden and its application to a winter temperature case study. International Journal of Climatology 2000, 20, 1067–1076. [Google Scholar] [CrossRef]
- Tang, L.; Chen, D.; Karlsson, P.-E.; Gu, Y.; Ou, T. Synoptic circulation and its influence on spring and summer surface ozone concentrations in southern Sweden. Boreal Environmental Research 2009, 14, 889–902. [Google Scholar]
- Linderson, M. Objective classification of atmospheric circulation over southern Scandinavia. International Journal of Climatology 2001, 21, pp. 155–169. [Google Scholar] [CrossRef]
- Post, P.; Truija, V.; Tuulik, J. Circulation weather types and their influence on temperature and precipitation in Estonia. Boreal Environmental Research 2002, 7, 281–289. [Google Scholar]
- Spellman, G. The application of an objective weather-typing system to the Iberian Peninsula. Weather 2000, 55, 375–385. [Google Scholar] [CrossRef]
- Martín Vide, J. Aplicación de la clasificación sinóptica automática de Jenkinson y Collison a días de precipitación torrencial en el este de España. In La información climática como herramienta de gestión ambiental; Cuadrat, J.M., Vicente, S.M., Saz, M.A., Eds.; Universidad de Zaragoza: Spain, 2002; pp. 123–127. [Google Scholar]
- Grimalt, M.; Tomás, M.; Alomar, G. Determination of the Jenkinson and Collinson’s weather types for the western Mediterranean basin over the 1948–2009 period. Temporal analysis. Atmósfera 2013, 26, 75–94. [Google Scholar] [CrossRef]
- Trigo, R.; DaCamara, C. Circulation weather types and their influence on the precipitation regime in Portugal. International Journal of Climatology 2000, 20, 1559–1581. [Google Scholar] [CrossRef]
- Olcina, J. Fenómenos de retrogresión estivales en el ámbito mediterráneo: desarrollos ciclogenéticos, sistemas convectivos de mesoscala y lluvias intensas. El episodio de 27 de septiembre a 7 de octubre de 1986. Investigaciones Geográficas, 1992; (10), 79–102. [Google Scholar]
- Stringer, E.T. Foundations of Climatology. W.H. Freeman: San Francisco, USA, 1972.
- Quereda, J.; Montón, E. Temporales de Levante en la fachada mediterránea española: ¿sucesos imprevisibles? Investigaciones Geográficas 1997, 18, 5–18. [Google Scholar] [CrossRef]
- Bustos, J.J.; Rus, C.; Marrero, C. La tormenta del 31 de marzo de 2002: estudio fenomenológico y pluviométrico. In Primer Encuentro sobre Meteorología y Atmósfera de Canarias; Centro de Publicaciones Secretaría General Técnica Ministerio de Medio Ambiente: Madrid, Spain, 2003; pp. 92–94. [Google Scholar]
Figure 1.
Location of the Canary Islands in the Eastern Mid-Atlantic and identification of grid points used in the Jenkinson and Collison method.
Figure 1.
Location of the Canary Islands in the Eastern Mid-Atlantic and identification of grid points used in the Jenkinson and Collison method.
Figure 2.
Number of rainfall series available for the Canary Islands between 1950 and 2020. a) La Palma, El Hierro, La Gomera, Fuerteventura and Lanzarote. b) Tenerife and Gran Canaria.
Figure 2.
Number of rainfall series available for the Canary Islands between 1950 and 2020. a) La Palma, El Hierro, La Gomera, Fuerteventura and Lanzarote. b) Tenerife and Gran Canaria.
Figure 3.
Location of the weather stations which registered days with > 200 mm of rainfall. The table below shows the number of the station on the map (Station), the geolocation (longitude and latitude), the code used by the AEMET, as well as the numbering used by the Gran Canaria Council Water Board (Code), the name of the place (Place name) and the altitude of the station (Alt). a) for La Palma, El Hierro and La Gomera islands and b) for Tenerife and Gran Canaria islands.
Figure 4.
Representative examples of three trough patterns: (a) episode of 27/02/1996, trough of maritime polar air with low surface pressure north of the Canary Islands; (b) episode of 12/03/2001 idem with high pressure in the Azores region; (c) episode of 27/02/1988, retrograding trough of continental polar air with the Azores anticyclone in its usual position. Source: www.wetterzentrale.de (accessed 01 September 2024)
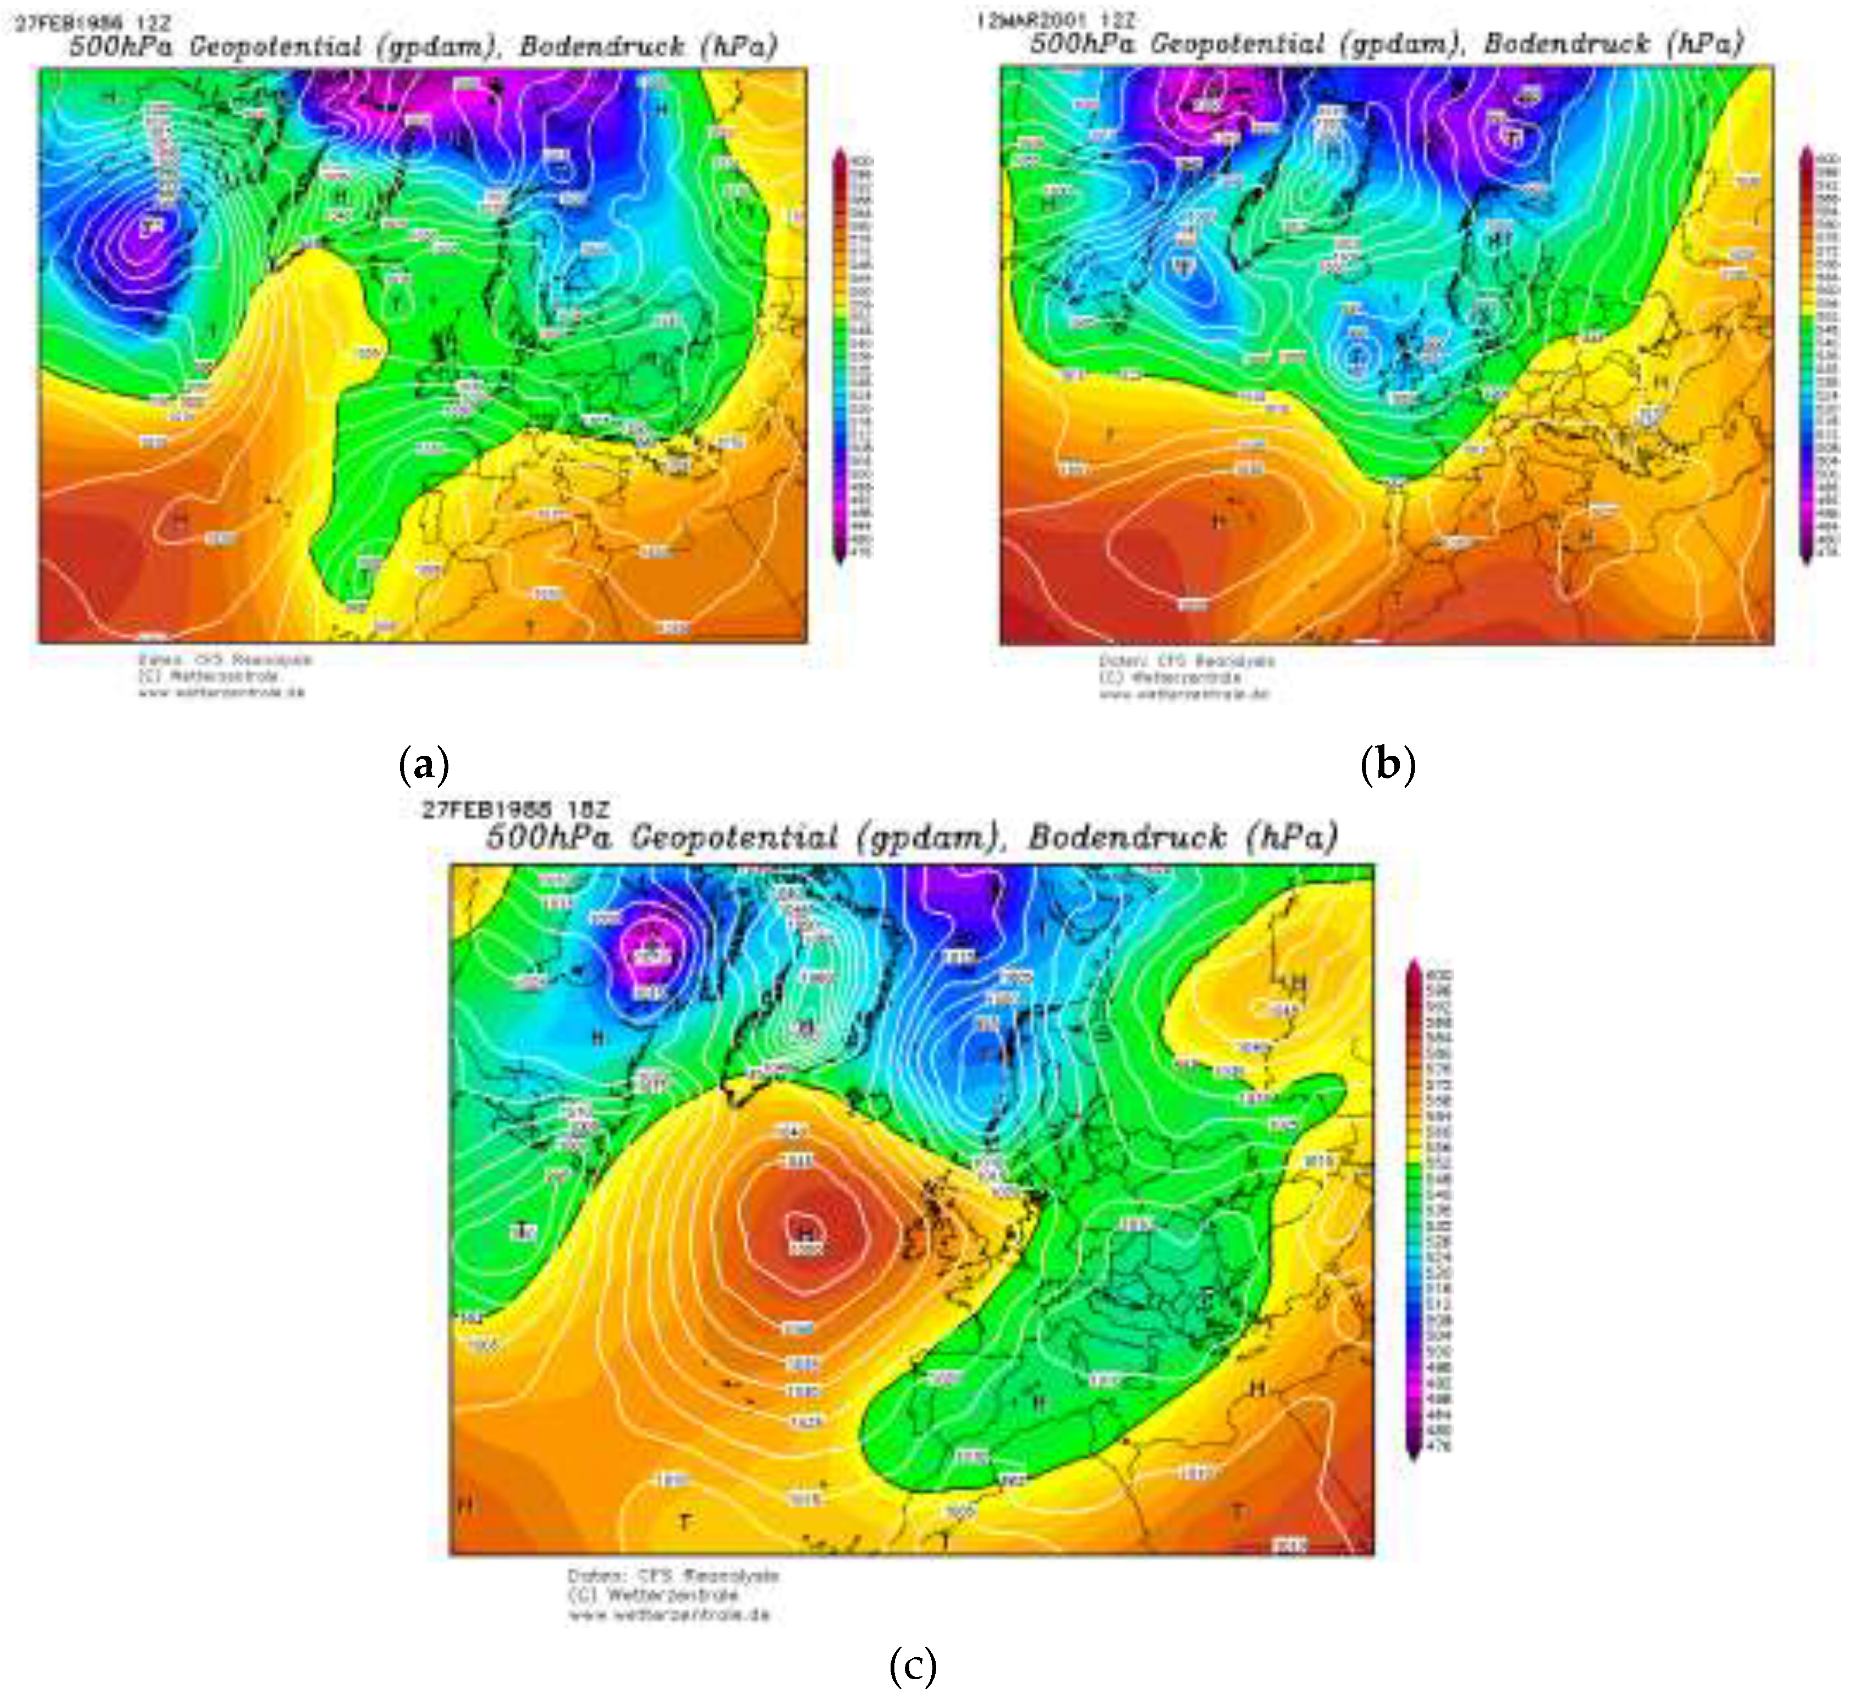
Figure 5.
Representative examples of the formation of DANAS during days with > 200 mm of rainfall close the Canary Islands. a) and b) episodes of 15 and 17 March 1993 respectively. c) and d) episodes of 12 and 13 December 1995 respectively. Source: www.wetterzentrale.de (accessed 01 September 2024).
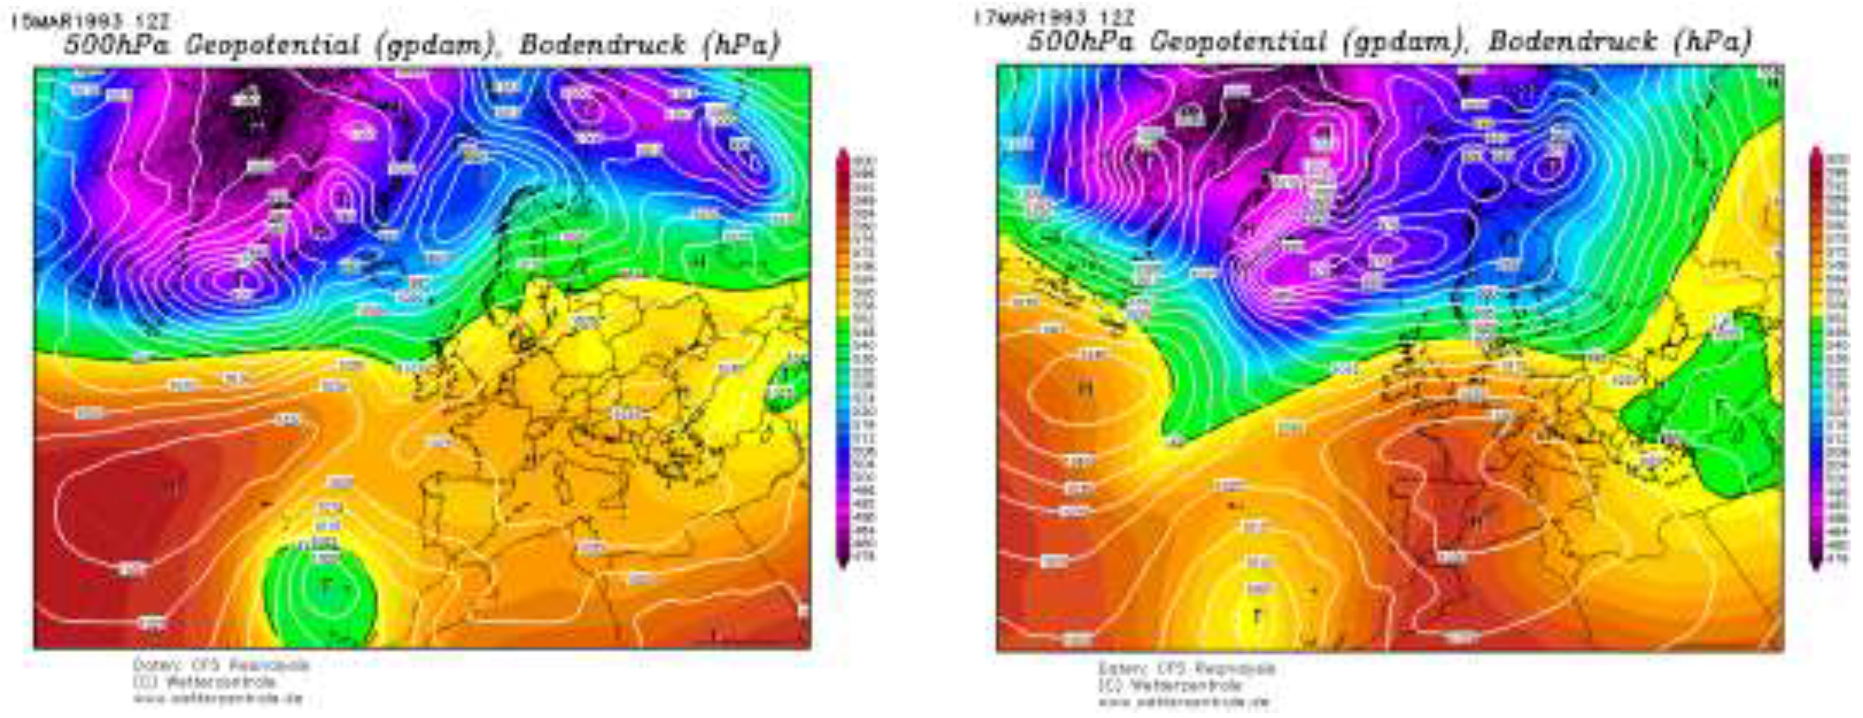
Figure 6.
Trajectories of disturbances formed in the North Atlantic from the first and fourth quadrants: initial position (blue circle) and position on the day when > 200 mm of rainfall was recorded (red circle).
Figure 6.
Trajectories of disturbances formed in the North Atlantic from the first and fourth quadrants: initial position (blue circle) and position on the day when > 200 mm of rainfall was recorded (red circle).
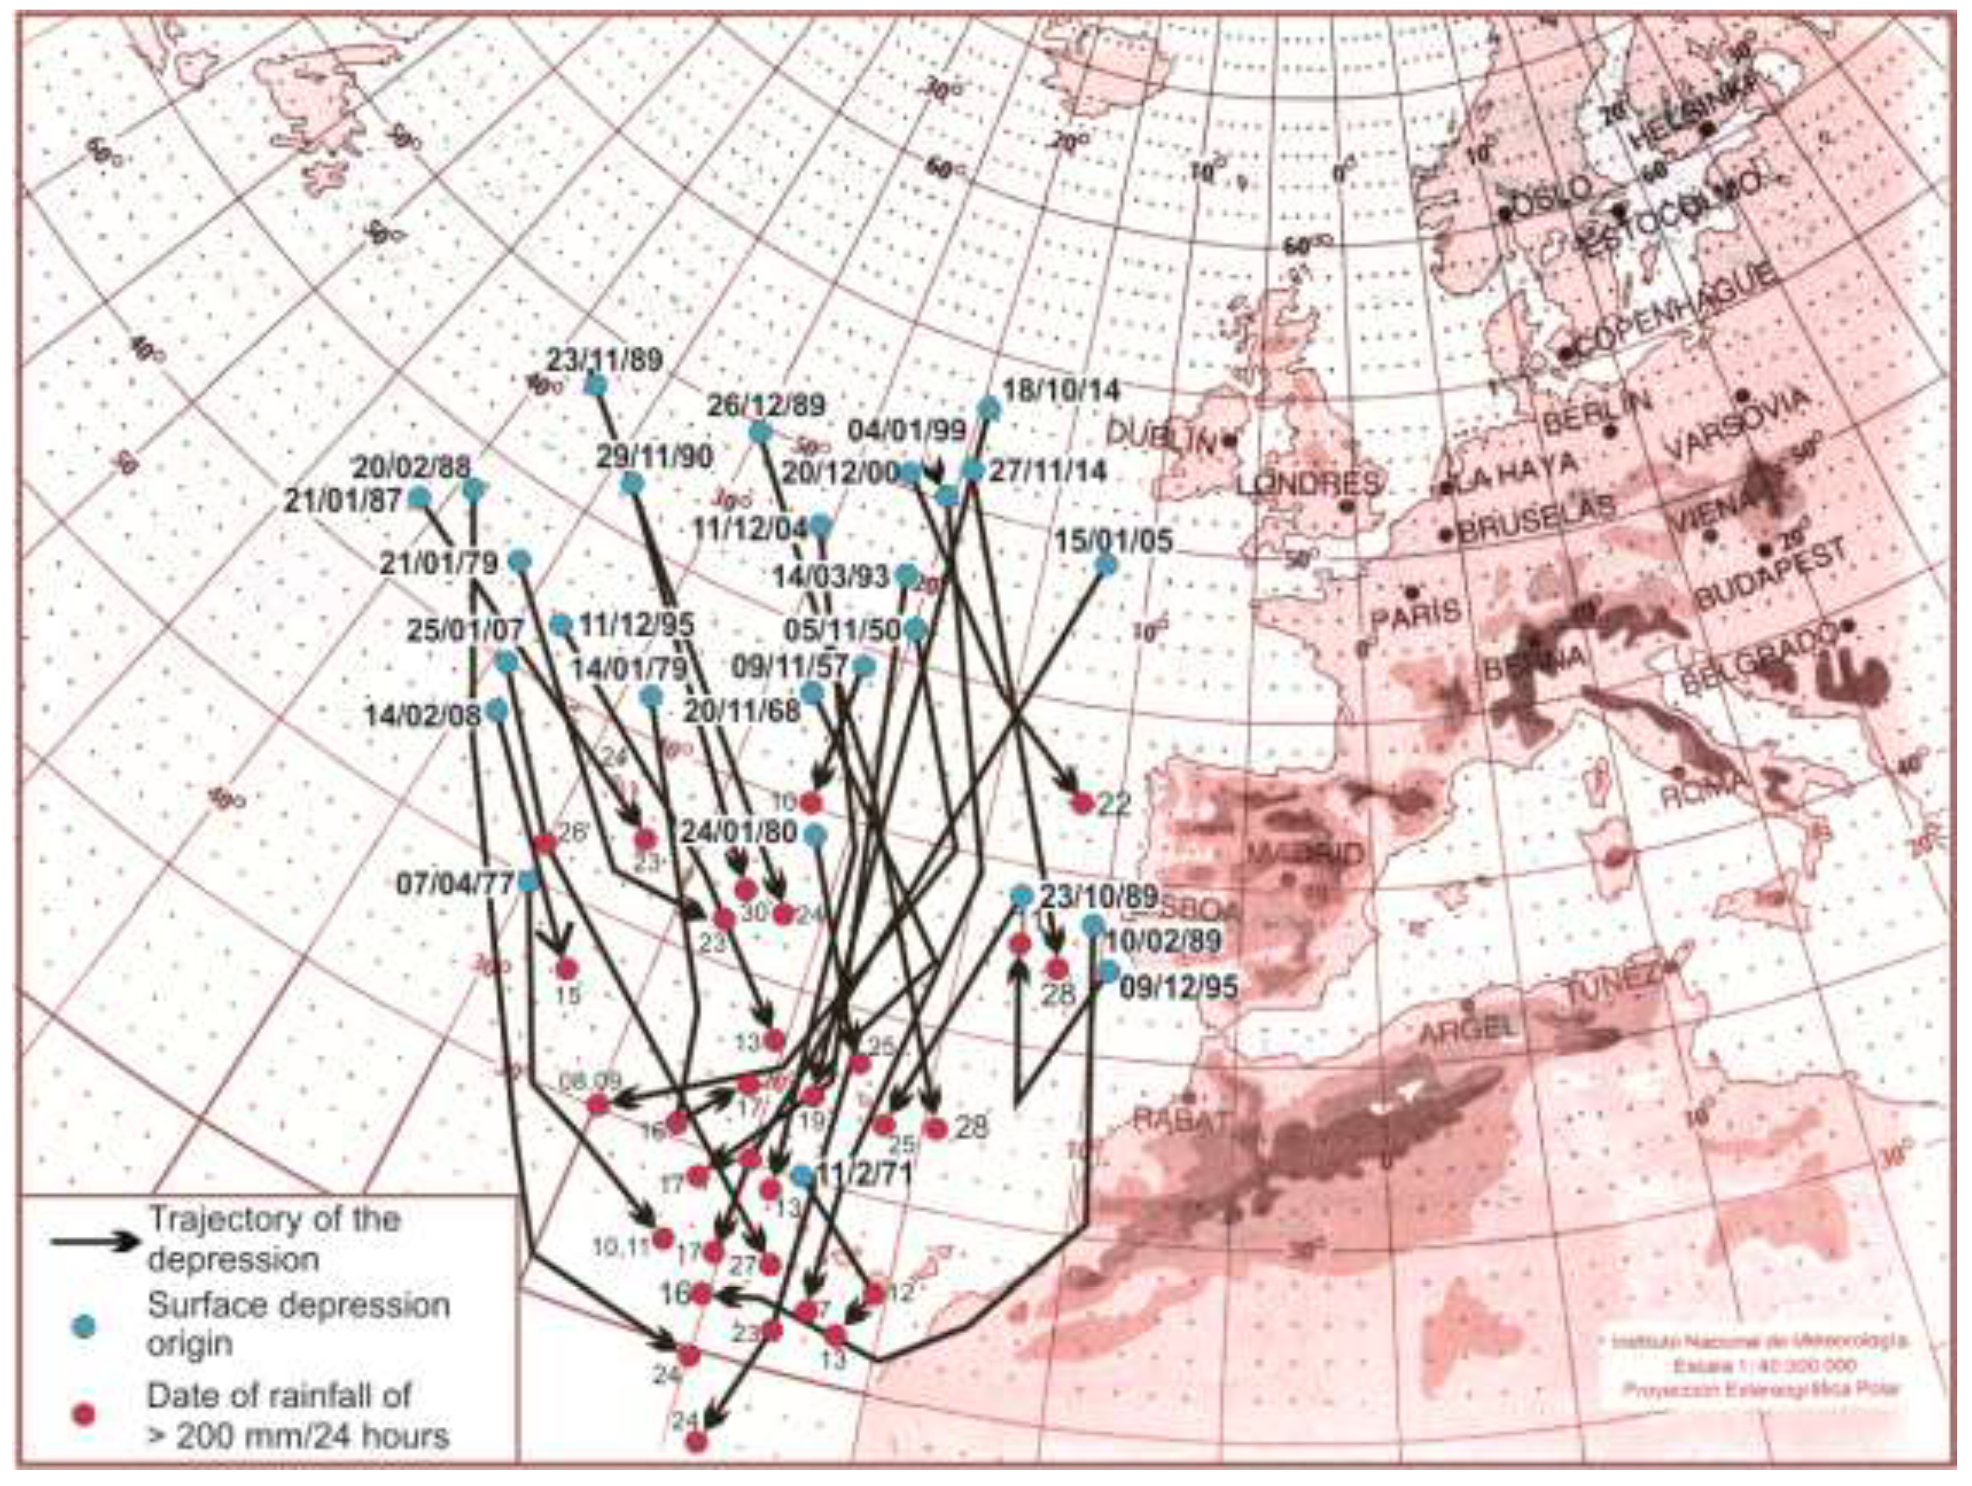
Figure 7.
W-E trajectories of disturbances formed in the North Atlantic with indication of their origin (blue circle) and position on the day with > 200 mm of rainfall (red circle).
Figure 7.
W-E trajectories of disturbances formed in the North Atlantic with indication of their origin (blue circle) and position on the day with > 200 mm of rainfall (red circle).

Figure 8.
Synoptic surface (left) and 500 hPa maps (right). a) and b) maps from 22/11/1954. c) and d) maps from 23/11/1954. Source of the surface maps, a) and c), Bulletin Quotidien D’Études. Source for the 500 hPa maps, b) and d), historical archives of the NOAA Library (available for the period 1879-1971, https://library.noaa.gov/weather-climate/synoptic-map accessed 02 October 2024)
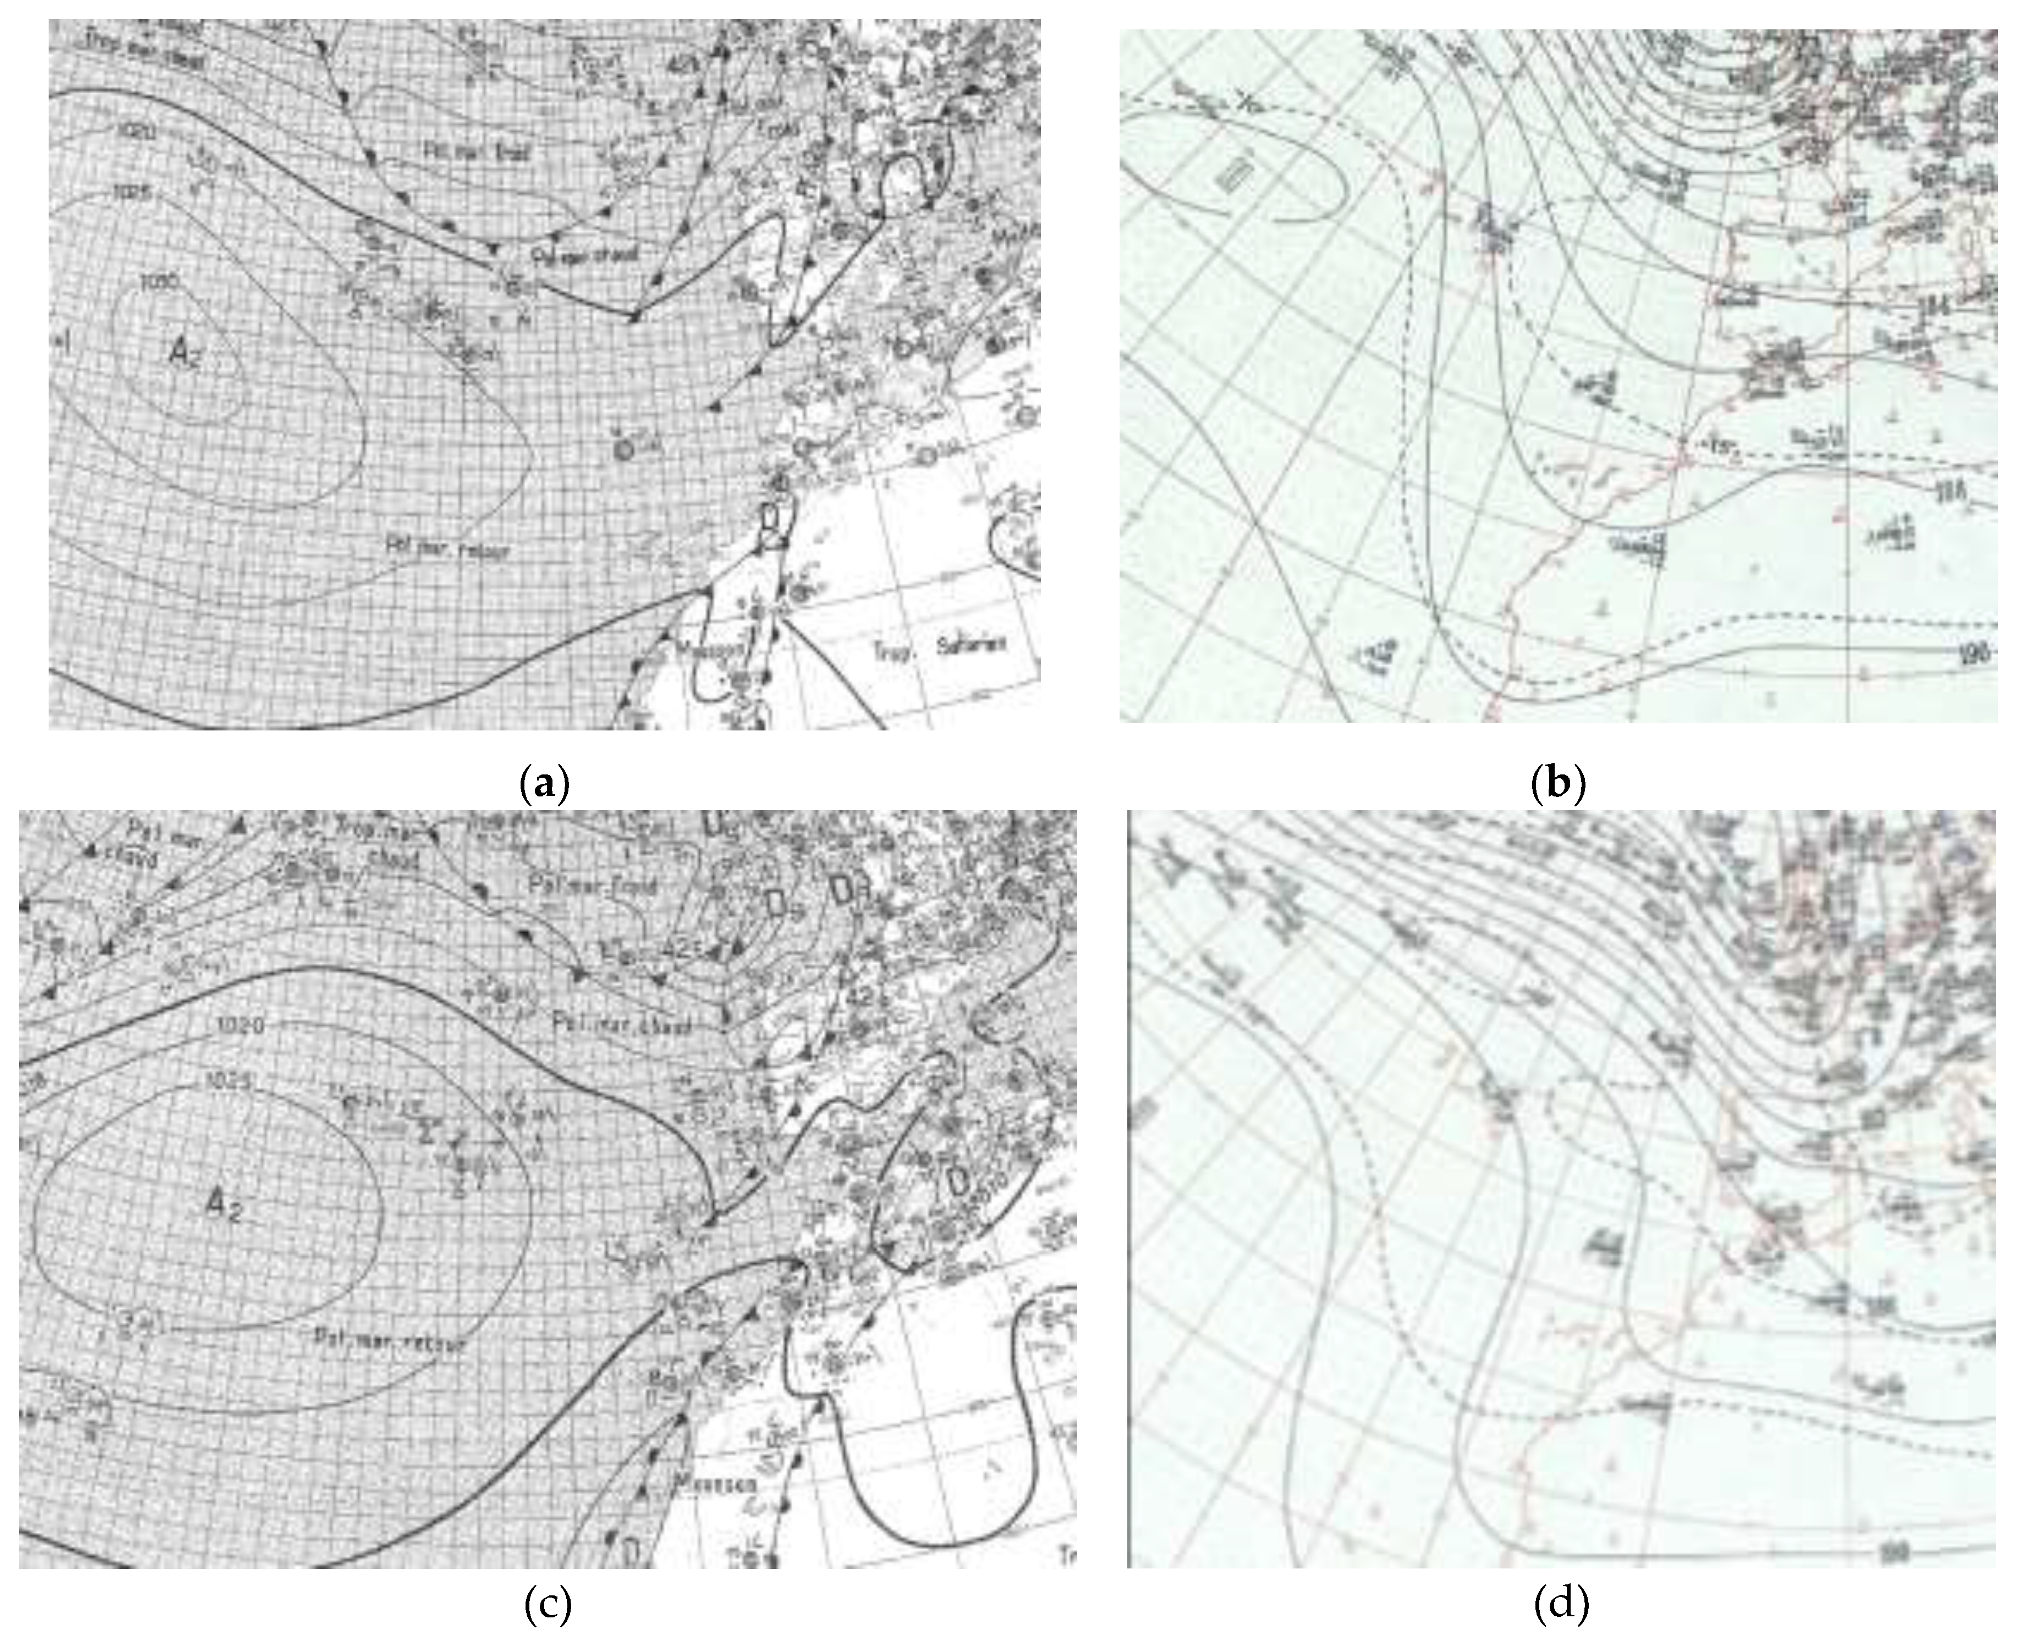
Figure 9.
Spatial distribution of rainfall in the NE of the island of Tenerife (a) and graph of hourly rainfall intensity (b) on 31 March 2002. Source: The map (a) has been obtained by interpolating daily precipitation data (IDW, with the 8 closest series points). The graph (b) has been obtained from Bustos et al (2003). [47]
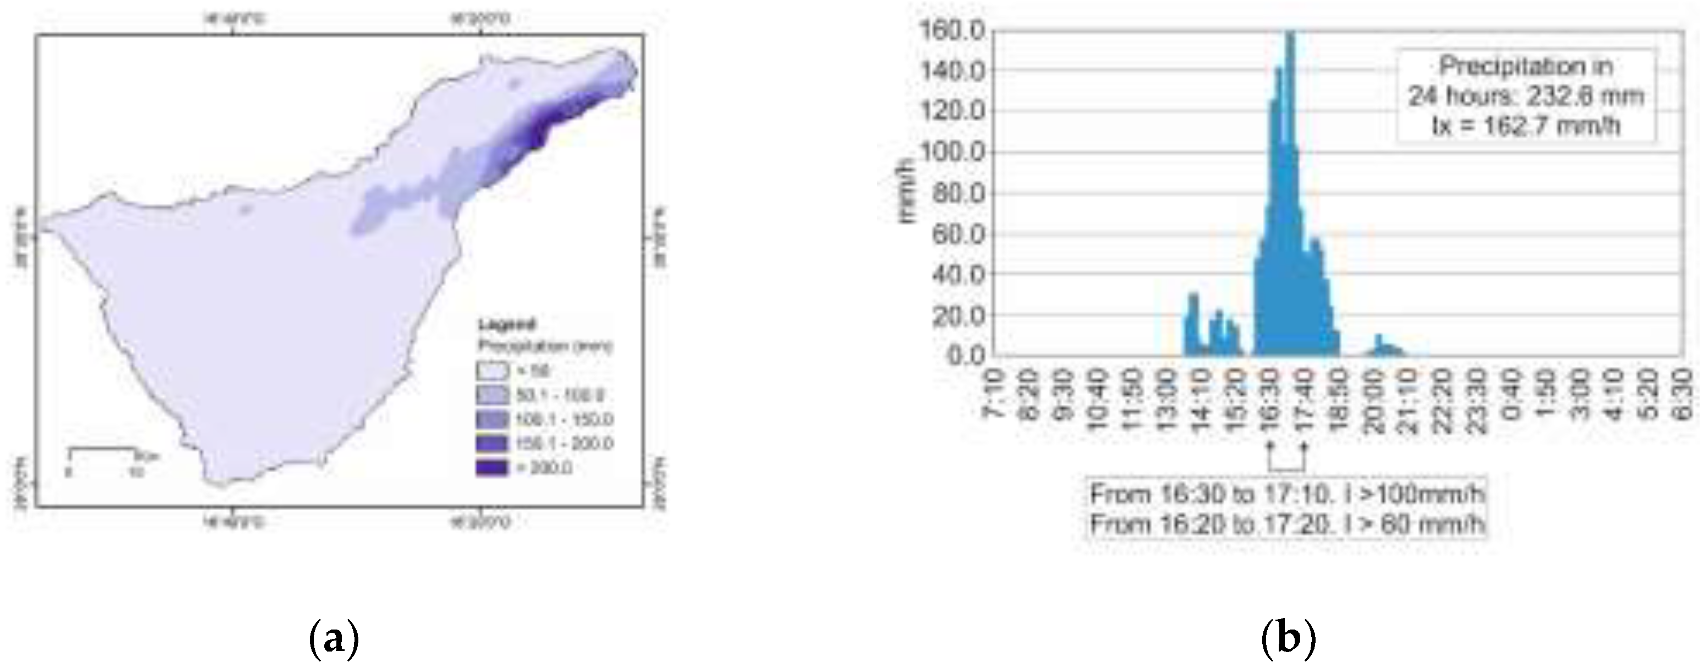
Table 1.
Monthly and seasonal distribution of rainfall events of > 200 mm/24 h in the Canary Islands (1950-2020).
Table 1.
Monthly and seasonal distribution of rainfall events of > 200 mm/24 h in the Canary Islands (1950-2020).
| Monthly | Seasonal | ||||
|---|---|---|---|---|---|
| Month | Days > 200 mm | % | Season | Days > 200 mm | % |
| January | 10 | 15.9 | Autumn | 21 | 33.3 |
| February | 13 | 20.6 | Winter | 33 | 52.4 |
| March | 8 | 12.7 | Spring | 9 | 14.3 |
| April | 1 | 1.6 | |||
| October | 9 | 14.3 | |||
| November | 12 | 19.0 | |||
| December | 10 | 15.9 | |||
Table 2.
Absolute and relative frequency of weather types according to the objective method of Jenkinson and Collison applied to days with > 200 mm of rainfall in the Canary Islands.
Table 2.
Absolute and relative frequency of weather types according to the objective method of Jenkinson and Collison applied to days with > 200 mm of rainfall in the Canary Islands.
| Type | Absolute value | % | Group |
|---|---|---|---|
| A | 5 | 5.7 | Pure anticyclonic |
| AW | 1 | 1.1 | Anticyclonic hybrids of directional types |
| C | 20 | 22.7 | Pure cyclonic |
| CE | 11 | 12.5 | Cyclonic hybrids of directional types |
| CNE | 2 | 2.3 | |
| CNW | 2 | 2.3 | |
| CS | 2 | 2.3 | |
| CSE | 2 | 2.3 | |
| CSW | 5 | 5.7 | |
| E | 19 | 21.6 | Pure directional |
| NE | 2 | 2.3 | |
| SE | 1 | 1.1 | |
| SW | 2 | 2.3 | |
| W | 9 | 10.2 | |
| U | 5 | 5.7 | Undetermined |
Table 3.
Sea level pressure values for days with > 200 mm of rainfall in the Canary Islands (1950-2024).
Table 3.
Sea level pressure values for days with > 200 mm of rainfall in the Canary Islands (1950-2024).
| Surface pressure (hPa) | Number of days | % |
|---|---|---|
| < 1000 | 2 | 2.3 |
| 1000-1005 | 13 | 14.8 |
| 1006-1010 | 13 | 14.8 |
| 1011-1015 | 24 | 27.3 |
| 1016-1020 | 27 | 30.7 |
| 1021-1025 | 8 | 9.1 |
| >1025 | 1 | 1.1 |
Table 4.
Episodes of rainfall of > 200 mm/24 h in which troughs are observed in the middle layers of the atmosphere (1950-2020).
Table 4.
Episodes of rainfall of > 200 mm/24 h in which troughs are observed in the middle layers of the atmosphere (1950-2020).
| 01/02/1950 | 03/03/1959 | 27/02/1988 | 11/11/2000 |
| 11-12/11/1950 | 28-29/12/1962 | 12/10/1992 | 12/03/2001 |
| 18/11/1952 | 27/02/1986 | 21/10/1992 | 26/03/2001 |
| 23-24/10/1955 | 19/10/1987 | 28/10/1993 | 17/02/2005 |
| 15-16/01/1957 | 23/10/1987 | 22/12/1993 | 02/12/2013 |
| 10/03/1957 | 25-26/11/1987 | 29/01/1996 |
Table 5.
Monthly and seasonal distribution of episodes of rainfall > 200 mm/24 h in which polar and maritime arctic air troughs are observed on the 500 hPa maps (1950-2020).
Table 5.
Monthly and seasonal distribution of episodes of rainfall > 200 mm/24 h in which polar and maritime arctic air troughs are observed on the 500 hPa maps (1950-2020).
| Monthly | Seasonal | ||||
|---|---|---|---|---|---|
| Month | Days > 200 mm | % | Season | Days > 200 mm | % |
| January | 2 | 8.7 | Autumn | 10 | 43.5 |
| February | 4 | 17.4 | Winter | 9 | 39.1 |
| March | 4 | 17.4 | Spring | 4 | 17.4 |
| October | 6 | 26.1 | |||
| November | 4 | 17.4 | |||
| December | 3 | 13.0 | |||
Table 6.
Episodes of rainfall of > 200 mm/24 h with isolated depressions in the middle layers of the atmosphere (1950-2020).
Table 6.
Episodes of rainfall of > 200 mm/24 h with isolated depressions in the middle layers of the atmosphere (1950-2020).
| 8-10/11/1950 | 10/02/1978 | 29/03/1990 | 13/12/2004 |
| 30-31/10/1954 | 16-17/01/1979 | 30/11/1990 | 16-17/01/2005 |
| 14-16/02/1956 | 23/01/1979 | 4-6/12/1991 | 26-27/01/2007 |
| 10/11/1957 | 25/01/1980 | 17/12/1991 | 18-19/03/2007 |
| 17-18/11/1962 | 23/01/1987 | 17/03/1993 | 15/02/2008 |
| 30-31/01/1965 | 24/02/1988 | 11-13/12/1995 | 23/12/2009 |
| 23-24/11/1968 | 16/02/1989 | 23/02/1996 | 01/02/2010 |
| 12-13/02/1971 | 25/10/1989 | 07/01/1999 | 15/02/2010 |
| 20-23/11/1971 | 24/11/1989 | 22/12/2000 | 19/10/2014 |
| 10-12/04/1977 | 28/12/1989 | 31/03/2002 | 28/11/2014 |
Table 7.
Monthly and seasonal distribution of episodes of rainfall > 200 mm/24 h with isolated depressions on the 500 hPa maps (1950-2020).
Table 7.
Monthly and seasonal distribution of episodes of rainfall > 200 mm/24 h with isolated depressions on the 500 hPa maps (1950-2020).
| Monthly | Seasonal | ||||
|---|---|---|---|---|---|
| Month | Days > 200 mm | % | Season | Days > 200 mm | % |
| January | 8 | 20.0 | Autumn | 11 | 27.5 |
| February | 9 | 22.5 | Winter | 24 | 60.0 |
| March | 4 | 10.0 | Spring | 5 | 12.5 |
| April | 1 | 2.5 | |||
| October | 3 | 7.5 | |||
| November | 8 | 20.0 | |||
| December | 7 | 17.5 | |||
Disclaimer/Publisher’s Note: The statements, opinions and data contained in all publications are solely those of the individual author(s) and contributor(s) and not of MDPI and/or the editor(s). MDPI and/or the editor(s) disclaim responsibility for any injury to people or property resulting from any ideas, methods, instructions or products referred to in the content. |
© 2024 by the authors. Licensee MDPI, Basel, Switzerland. This article is an open access article distributed under the terms and conditions of the Creative Commons Attribution (CC BY) license (http://creativecommons.org/licenses/by/4.0/).
Copyright: This open access article is published under a Creative Commons CC BY 4.0 license, which permit the free download, distribution, and reuse, provided that the author and preprint are cited in any reuse.


