
Submitted:
27 November 2024
Posted:
28 November 2024
You are already at the latest version
Abstract
Shrimp farming has increasingly taken over coastal areas in Mexico, particularly in the protected regions of Sonora and Sinaloa. Over the past 30 years, the economic activity associated with these farms has grown so much that the amount of shrimp produced in these ponds now exceeds that harvested from traditional shrimp fisheries. Establishing shrimp ponds has led to significant land changes and environmental contamination, introducing organic matter, heavy metals, bacteria, and viruses into the coastal ecosystem of the Gulf of California. The construction of these ponds has fragmented local ecosystems, resulting in permanent alterations to areas such as floodplains, mangrove forests, and dunes, many of which are protected zones. This study aimed to investigate the long-term growth of shrimp farms from 1993 to 2022 and their impact on land-use changes in surrounding ecosystems, focusing on protected areas in the Sinaloa and Sonora coastal regions. We analyzed Landsat images using the Google Earth Engine (GEE) platform. Our findings indicate that shrimp farm development over the past three decades has been extensive, with protected areas experiencing fragmentation and changes. Remote sensing and platforms like GEE enable the effective monitoring of these spatiotemporal changes and their impacts, helping to identify the most affected areas.
Keywords:
Ramsar sites
; Biosphere reserves
; Land cover change
; Remote sensing
; Google Earth Engine
1. Introduction
Shrimp farms in the Gulf of California currently occupy a significant portion of the Mexican coastal areas in Sonora and Sinaloa. During the last few decades (1993 to 2022), this economic activity has surpassed that of the shrimp fisheries in these regions (CONAPESCA, 2020, 2019, 2018, 2017, 2016, 2015, 2014, 2013, 2012, 2011, 2010, 2009, 2008, 2007, 2006, 2005, 2004, 2003, 2002, 2001, 2000, 1999, 1998, 1997, 1996, 1995, 1994, 1993). Researchers (Barraza-Guardado et al., 2013; Gámez-Bayardo et al., 2021; Martínez-Durazo et al., 2019a; Valenzuela-Sanchez et al., 2021) have linked the development of aquaculture farms in this region to various environmental issues, including water pollution from organic matter, heavy metals, bacteria, and viruses. The contaminants enter the coastal ecosystem through the farm's water exchange. Crop cycles and the periodicity of water exchange regulate the volume and timing of these discharges. Additionally, the farms' latitudes influence the water exchange; those in the northern region experience greater evaporation and more significant water exchange than those in the southern region (Páez-Osuna & Ruiz-Fernández, 2005a). Although Mexican environmental legislation prohibits the expansion of shrimp farms due to the resulting extensive loss of natural habitats, the impact on natural vegetation, and the pollution of coastal and marine habitats, it has been observed even in protected areas along the Gulf of California.
Remote sensing (RS) is a powerful tool for analyzing changes in different types of land cover, including shrimp farms (Jayanthi et al., 2018; Dorber et al., 2020). Furthermore, RS can help evaluate the entry of contaminants, such as nitrogen and phosphorus, from farming activities (González-Rivas et al., 2020). It can also help monitor the effects of farm growth in coastal zones, particularly in areas without field measurements, such as the Gulf of California.
This manuscript addresses aquaculture development over areas cataloged as Biosphere Reserves or Ramsar sites. The objective of this study was to investigate the long-term growth of shrimp farms (from 1993 to 2022), their impact on land-use changes generated in the surrounding ecosystems located in the coastal and protected areas of the Gulf of California, and how researchers and decision-makers can apply tools such as GEE (Gorelick et al., 2017) for quick estimation and knowledge of farm activities and their effects.
2. Materials and Methods
2.1. Study Area
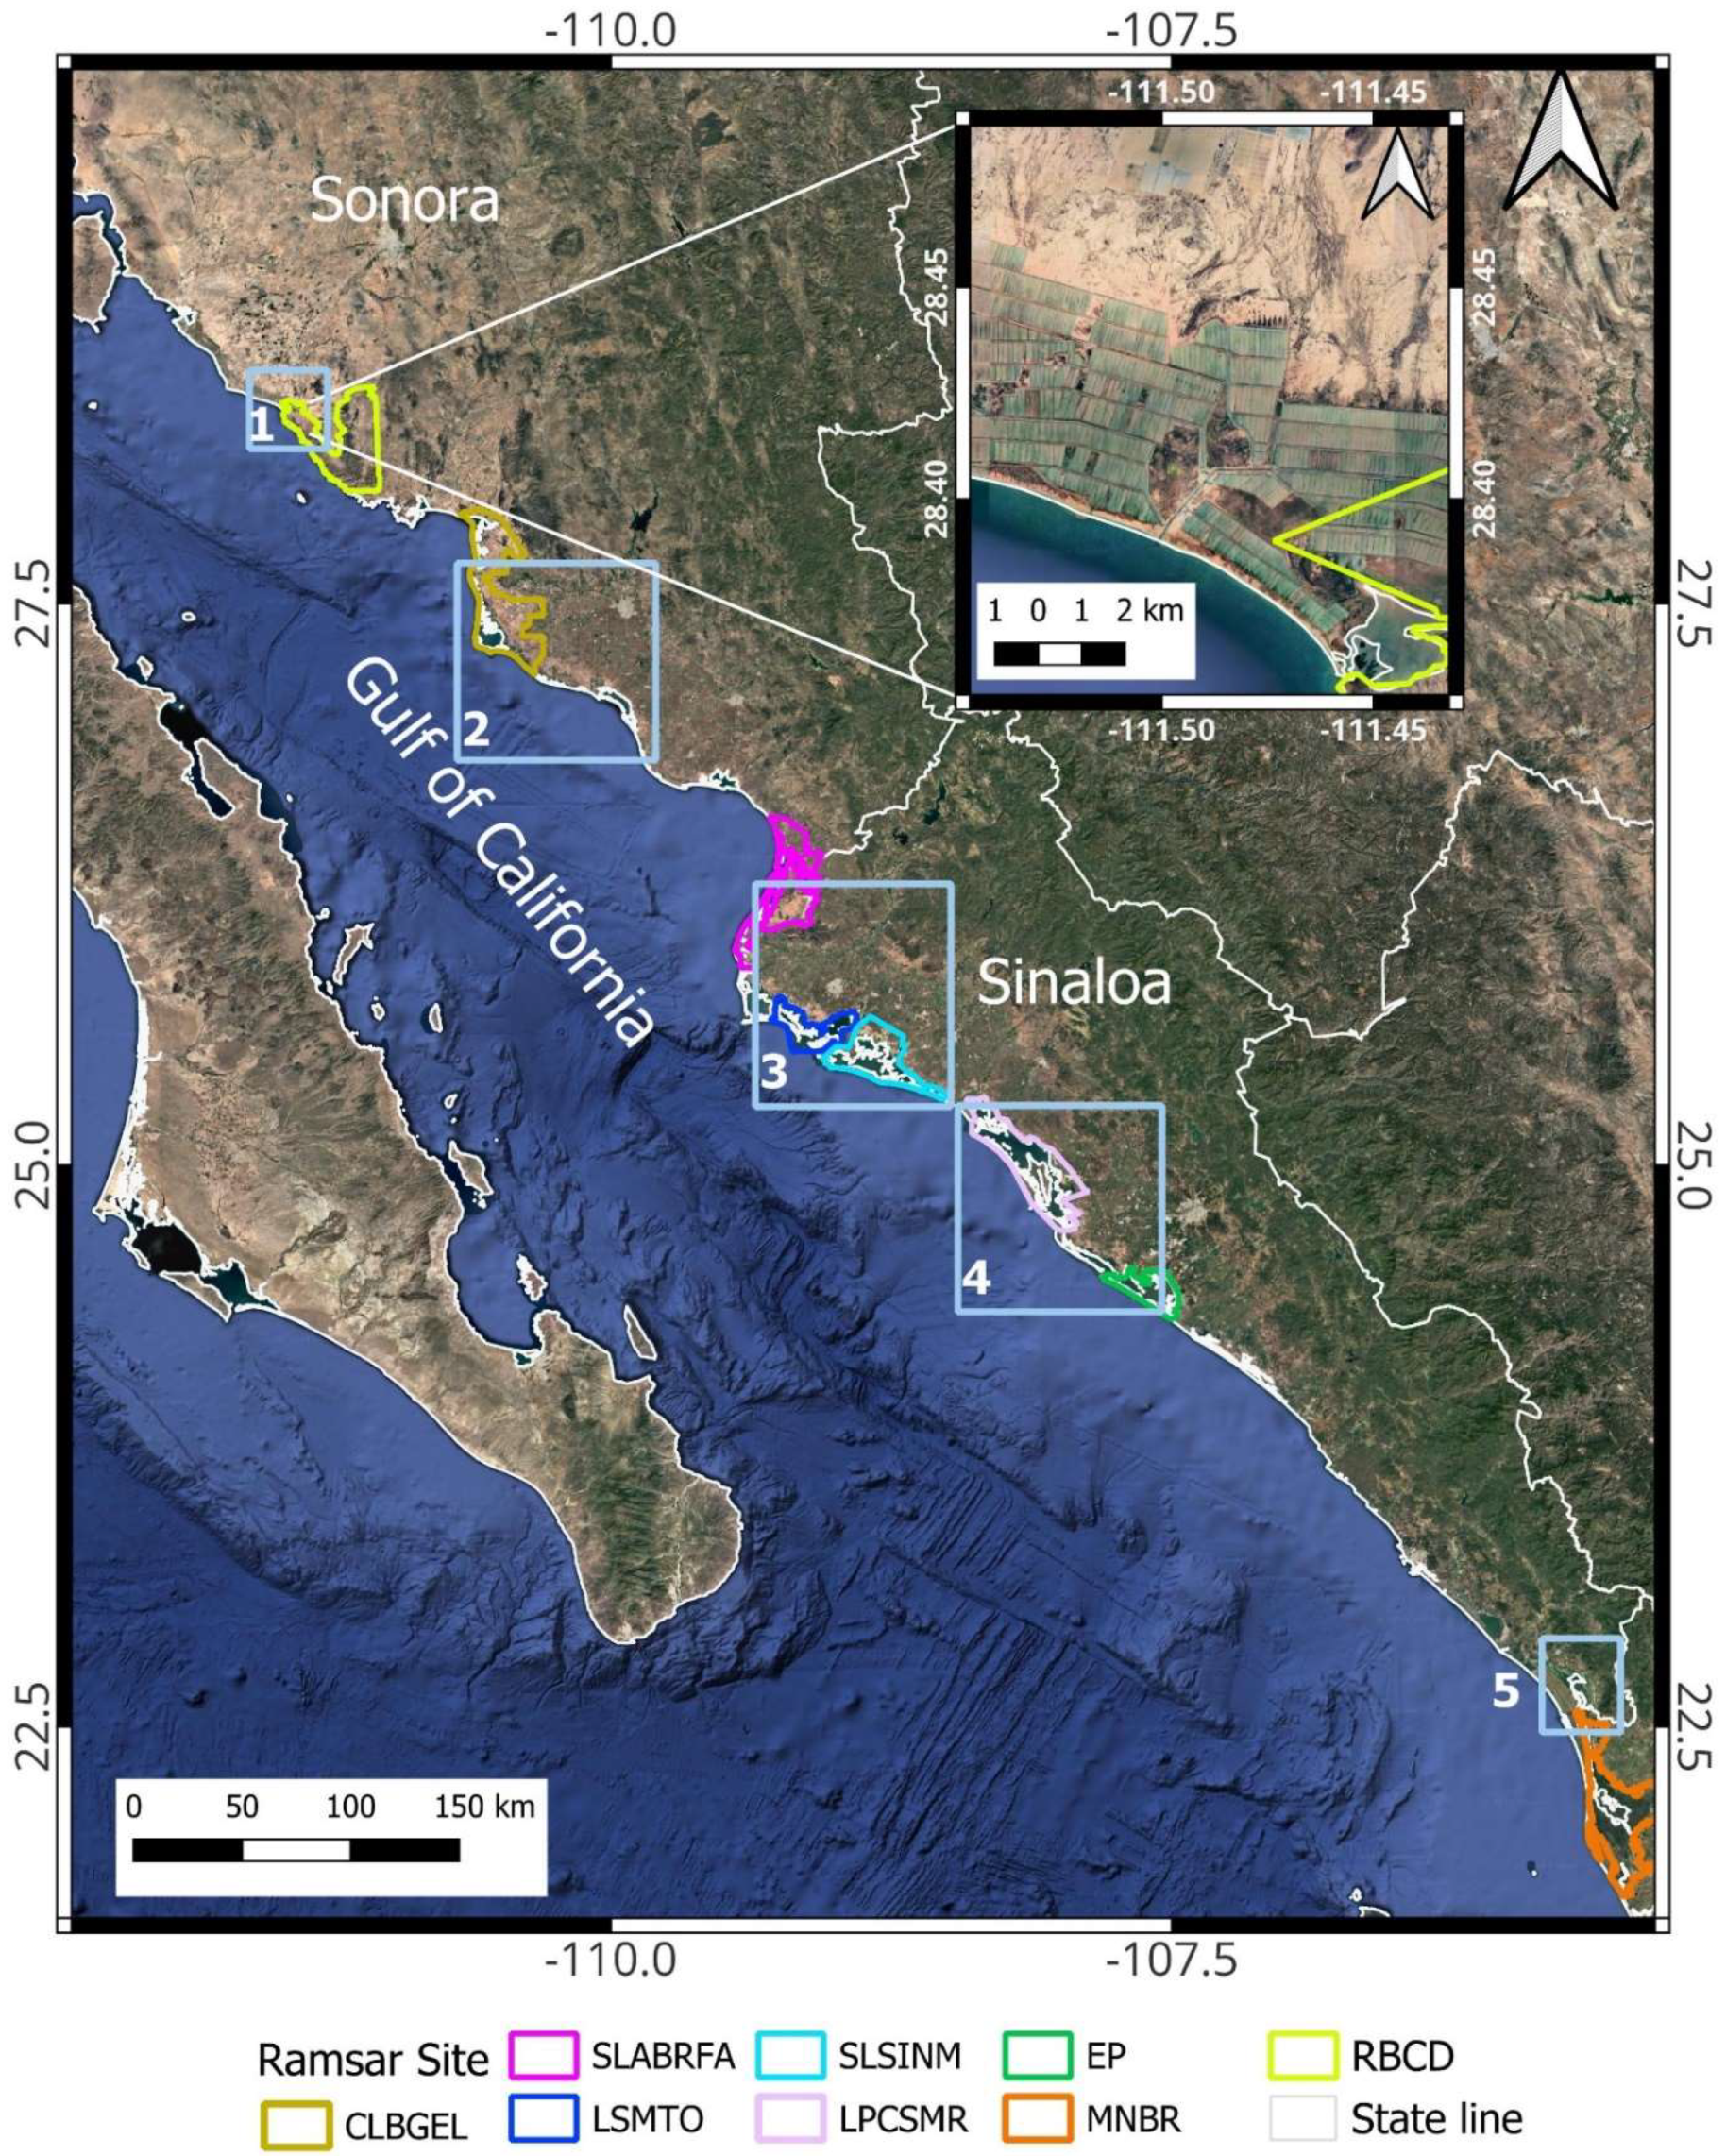
Located east of the Gulf of California (northeastern Mexico), the study area (fig. 1) comprised the coastal areas of Sonora and Sinaloa. These states have a coastline of 1848 km (INEGI, 1991). The area's extreme coordinates are 31.559° N, 115° W, and 23.6° N, 106.61° W. Our study analyzed the expansion of shrimp farms inside and outside the Biosphere Reserves Marismas Nacionales (MNBR, square 5 in Fig. 1) and Cajón del Diablo (CDBR, square 1 in Fig. 1). MNBR is a Ramsar site and, since 2010, a Biosphere Reserve (DOF, 2010). Its management program divided the reserve into ten areas within two core zones. The area near Sinaloa, named the "subzone of human settlement El Roblito" allows different human activities, including aquaculture. The CDBR in the Sonora State was decreed in 1937 (DOF, 1937) and does not have a management program. Currently, the limits and polygons of CDBR do not appear in the data catalog (CONABIO, 2022) or the list of Biosphere Reserves. However, in 2000, it was part of Mexico's Priority Regions Project (CONABIO, 2000).
Our study also included the following Ramsar zones experiencing aquaculture expansion inside and outside their limits: Complejo Lagunar Bahía Guásimas–Estero Lobos (CLBGEL) (square 2 in Fig. 1) in the Sonora State; Sistema Lagunar Agiabampo–Bacorehuis–Rio Fuerte Antiguo (SLABRFA), along the border of Sonora and Sinaloa; and Lagunas de Santa María–Topolobampo–Ohuira (LSMTO) (square 3 in Fig. 1), Sistema Lagunar San Ignacio–Navachiste–Macapule (SLSINM), Laguna Playa Colorada Santa Maria Reforma (LPCSMR), and Ensenada Pabellones (EP) (square 4 in Figure 1) in the Sinaloa State.
Figure 1.
Study area. The figure shows a close-up of the pond areas around the CDBR. The numbered boxes (with figure numbers) indicate the location of the Ramsar sites or Biosphere Reserves where we analyzed their pond expansion.
Figure 1.
Study area. The figure shows a close-up of the pond areas around the CDBR. The numbered boxes (with figure numbers) indicate the location of the Ramsar sites or Biosphere Reserves where we analyzed their pond expansion.
2.2. Satellite Data Processing
We chose images from June to October for each classified year from 1993 to 2022, focusing on the active periods of the farms. We processed them using the GEE (Gorelick et al., 2017). For the 1993 to 2010 land cover classifications, we used the averaged reflectance of Landsat 5 Surface Reflectance Tier 1 (T1_SR), which was atmospherically corrected using the Landsat Ecosystem Disturbance Adaptive Processing System (LEDAPS) with clouds, shadows, water, and snow masks. For the 2003, 2004, 2011, and 2012 land cover classifications, we used the averaged reflectance of Landsat 7 Surface Reflectance Tier 1 (T1_SR). For the 2013 to 2021 classifications, we used Landsat 8 Atmospherically Corrected Surface Reflectance Tier 1 (T1_SR) using the 1 Land Surface Reflectance Code (LaSRC). For the 2022 classification, we used the Landsat 9 Collection 2 Tier 1 TOA Reflectance. Because of extreme cloudiness in certain areas, we could not estimate most of the shrimp pond areas in 2012. For these years, we estimated the areas using the equation for shrimp pond area estimation as a function of time (in years), published by González-Rivas and Tapia-Silva (2023).
We implemented a supervised approach using random forest classification (RFC, Breiman, 1999). RFC is a powerful method that works well under various circumstances (Maxwell et al., 2018). The resulting categories were shrimp ponds, soil, and vegetation. We implemented RFC in a region of interest that involved a mask created using QGIS 3.16. software (QGIS, 2022) to filter out all coastal lagoons and permanent water bodies unrelated to shrimp ponds. The mask had a maximum width of 5 km from the sea to the continent, covering the shrimp farm locations. The land classification area covered an average of 1,482,936 ha. We applied another mask each year to the RFC to filter out temporary water bodies mixed in the farms' ecosystems and to ensure high accuracy when assessing the total shrimp pond area. A GEE example script is linked here: (https://code.earthengine.google.com/82b0944f4e414bec0b376fb2b34526ec).
We applied the methodology proposed by Olofsson et al. (2014) to assess the accuracy and validate the classification results. This methodology generated several sampling points to define five allocations of the calculated sample size. We selected the allocation with the lowest error and randomly generated the sampling points for these allocations for each class. Table 1 lists the standard errors of the selected sample allocation and the estimated commission errors by class. We used a standard error of the selected estimated overall accuracy S(ÔN) of 0.15. The sample consisted of 400 points divided into three classes (pond, soil, and vegetation) and distributed randomly within their polygons. Because the shrimp ponds class had the smallest area among the three categories, it was considered the rarest class.
3. Results
Figure 2 shows the assessed area value in the center of the 95 percent confidence intervals for each classified year (plot (a), as indicated by the legend in the upper right corner). We estimated 6741 ha of active shrimp farms in 1993, whereas, by 2022, the total active area of the shrimp farms was more than 102906 ha. Figure 2 shows the shrimp pond area growth as a percentage of the previous year (plot (a), as indicated by the legend in the upper left corner). We observed peaks for the years 1997, 2011, 2013, and 2014, indicating an increase of more than 100% and a decrease of less than 25% for 1998 and 2010, respectively. During the studied period, the pond area increased at an annual average of 19.5% compared to the prior year. Thus, the entire area of shrimp farms grew by more than 1400% during the studied period compared to the 1993 value (see Figure 2, plot (b)). These results highlight the significant development of shrimp ponds over the thirty years considered in the study.
Shrimp Pond Expansion from 1993 to 2022 in the Coastal and Protected Areas
Figure 3 shows the long-term invasion of shrimp farms in the MNBR. For 1993, we did not detect ponds inside the MNBR. The expansion of ponds in the MNBR began in 2000. For this year, we detected approximately 15 ha (see Table A2 in annexes, which shows the annual growth of farms in ha for reserves and Ramsar sites inside and on the outer limits of their polygons). Twenty-two years later, the construction of ponds inside the reserve reached more than 473 ha, representing a growth of 3128% compared to 2000.
Figure 4 shows the same process for the CDBR. Farms first appeared inside the reserve in 2004 with the development of approximately 4 ha. By 2005, we detected the construction of 816 ha, indicating a massive increase of 21658% with regard to the previously constructed ponds (see Table A2 in annexes). By 2022, we detected the construction of 1236 ha inside the reserve (see Table A2 in annexes).
Figure 5 shows the process for the CLBGEL. In the case of this Ramsar zone and its periphery, we observed different moments of non-intensive growth inside the Ramsar zone during the years 1996, 2000, 2004, 2009, and 2016. In terms of newly constructed ponds inside the site, the corresponding areas for these years were 390, 799, 1022, 2142, and 2727 ha (see Table A2 in annexes).
Figure 6 shows the results of the pond expansion for the Ramsar sites LSMTO, SLSINM, and SLABRF. We observed two main periods of explosive growth for these sites, from 1995 to 1999. In the SLBARFA, we estimated 471 ha of ponds in 1994. In 1997, we detected the highest growth, with 2106 ha (a 113% increase in the maximum development compared to previous years). SLSINM behaved similarly. In 1995, we estimated the pond area inside the Ramsar site to be 363 ha; by 1997, this value was 1265 ha (a 248% increase in the maximum development compared to previous years). Meanwhile, for the LSMTO Ramsar site, we observed an increase of 34 ha of newly constructed ponds in 2014. By 2017, this value was 107 ha, representing a 200% growth. The shrimp ponds within the Ramsar site continued growing until 2022, when the area reached more than 940 ha. (see Table 2, B, and C in annexes).
Shrimp farm development has steadily increased across all studied areas (see Figure 3, Figure 4, Figure 5, Figure 6 and Figure 7 and Table A1 and Table A2 in the annexes). Notably, in specific years, the construction of new farms surged, with new pond areas exceeding the previous maximums by over 100%. For instance, in the Ramsar area LPCSMR, the shrimp pond area was 363 ha in 1996; by the following year, it grew to 1422 ha, representing a 291% increase (see Table 2).
The growth rate observed in the study area, which includes all protected regions, was nearly 20 percent higher than the previous year (see Table A1 and Table A2 in the annexes). Furthermore, we identified peak growth periods across the protected areas studied, taking the highest values from prior years as a reference. For instance, MNBR grew by 840% in 2009, CBDR grew by 21658% in 2009, CLBGEL grew by 105% in 2000, LSMTO grew by 696% in 2006, SLABRFA grew by 100% in 1994, SLSINM grew by 248% in 1997, EP grew by 49% in 2005, and LPCSMR grew by 291% in 1997 (see Table 2).
4. Discussion
We studied the long-term growth of shrimp farms from 1993 to 2022 and their impact on land change generated in the protected areas located in the coastal areas of the Gulf of California. In the following paragraphs, we discuss aspects related to the following topics: image classification and accuracy assessment, shrimp farm expansion and its effects on protected areas, and the use of GEE in similar studies.
The confidence intervals of the shrimp pond areas obtained using the methodology of Olofsson et al. (2014) and applied to the classified Landsat images could be affected by temporary water bodies that vary each year. Data were missing (NA in Table A2 in annexes) due to cloud cover for specific periods, such as 2013, 2015, and 2022. Nevertheless, applying the Oloffson et al. (2014) method confirmed the accuracy of our estimated long-term expansion from 1993 to 2022.
The rapid growth of aquaculture farms over protected areas has attracted our attention. The total area of shrimp farms has continuously increased. In particular, the total area of shrimp ponds increased significantly in 1997, 2001, 2008, 2016, and 2022. The area obtained for 2022 in our work exceeded the value estimated by González-Rivas and Tapia-Silva (2023). This difference can be explained by various factors, such as the effect of white spot disease and other diseases that cause the inactivation of ponds (Muniesa et al., 2017) or the masking of ponds by clouds, which could generate noise in our estimates.
One of the main concerns of shrimp pond development is the debris entering the water column of the lagoons and marine areas through the water exchange and pond cleaning, which generates and increases nutrients, organic matter, and sediments in these ecosystems (Alonso-Rodrı́guez & Páez-Osuna, 2003; Páez-Osuna & Ruiz-Fernández, 2005a; Martínez-Durazo et al., 2019a; Jara-Marini et al., 2020; Molina-García et al., 2021). Concurrently with these nutrient increases in water bodies, other sources of nutrients must be considered, such as agriculture, livestock, urban zones, and other types of industries in the region (Ahrens et al., 2008). Researchers (Arreola-Lizárraga et al., 2016; Martínez-Durazo et al., 2019b; Miranda et al., 2017; Páez-Osuna & Ruiz-Fernández, 2005b) have observed different compounds and biomass discharged into the surrounding ecosystems from the ponds during the study period, as well as increases in organic matter, pathogens, nutrients, heavy metals, and water with different salinities. In addition, it is worth noting that some of the soil excavated to create the ponds could increase sediments, which enter the water column instead of being swept away by rain or wind.
The 2022 shrimp pond area we detected in the coastal lagoons of Sinaloa comprises 81% of the total estimated shrimp pond area in Sinaloa and Sonora. In Sinaloa, almost 55% of the shrimp ponds are located near a Ramsar site, and in Sonora, this value is 26%, indicating that most shrimp farm development has taken place along the coastal lagoons of Sinaloa.
The development of aquaculture industry in protected areas such as the MNBR affects mangroves, coastal vegetation, and coastal water bodies. In the case of the MNBR, shrimp farm development began in 2009 and continued to grow until 2022. The decree and the management program do not specify whether the construction of new ponds is allowed after the year of the decree (2010); however, the management program stipulates that it is not permitted to "Interrupt, fill, drain or divert hydraulic flows, and modify the natural conditions of aquifers, hydrological basins, natural stream channels, springs, riverbanks, and basins" (CONANP, 2013). This regulation needs to be implemented, given the observed development of aquaculture farms, which could modify the conditions of the aquifer and fragment the environment.
Shrimp pond development in the CDBR began in 2005 and continued until 2014. The situation of this reserve is critical because, as previously mentioned, it does not have a management program, and its limits and polygons need to be precisely defined and well-managed. Parra (1993b), in INECC (2007), commented that "the reserve does not receive attention or management for prolonged periods, the limits have been lost, and it is difficult to locate it precisely".
Another example of land change due to shrimp ponds in Sinaloa is the coastal lagoon EP. The shrimp ponds have altered the peripheral ecosystems near this complex lagoon, leading to the development of overflood areas and vegetation such as mangles, bushes, and marshes, which partially contribute to the fragmentation of these ecosystems. Alonso-Pérez et al. (2003) and Valderrama-Landeros et al. (2017) have reported related land changes due to aquaculture farms.
It is worth noting that farms grew explosively within the studied protected areas and in their peripheries. For example, in 2009, new ponds were created within the MNBR polygon; these ponds represent a peak of more than 800% of what was previously built, i.e., during 2008. That year, there were about 16 ha of shrimp ponds, and by 2009, there was an increase of more than 157 ha.
Regarding Ramsar zones, farms occupied areas around LSMTO from 1997 to 2001. In 2006, the construction of ponds within the Ramsar site reached its first peak, and the construction of new shrimp ponds continued from 2017 to 2022. In the case of SLABRFA and SLSINM, the development of ponds began in 1994 and continued until the early 2000s.
As discussed, shrimp farms have expanded along the east coast of the Gulf of California over subtropical and desertic zones and into several coastal lagoons, cataloged as Ramsar sites. We observed the construction of new farms inside Ramsar areas and in their margins. This expansion implies that these areas must be managed appropriately as naturally protected areas, and management plans should be established for each site, as pointed out by Morzaria-Luna et al. (2014). These wetlands function as carbon sinks, fish nurseries, passages for migratory birds (Ramsar, 2022), and refuges for endangered species, such as jaguar (Lujan et al, 2022).
Finally, the legacy of Landsat 5, 8, and 9 on the GEE platform allowed us to quickly assess the expansion of this economic activity in the coastal zone of the Gulf of California (Duan et al., 2020). Although we could not estimate the areas for some in 2012 because of a lack of images or cloudiness, land change near and inside the coastal protected areas was detected. Regarding our results, it is possible to monitor the growth and effects of this industry on coastal ecosystems using remote sensing platforms such as GEE.
5. Conclusions
Despite the Mexican environmental legislation forbidding the extensive loss of natural habitats due to the impact on natural vegetation in protected areas, vast shrimp farm development has occurred over the last 30 years. Aquaculture farms were continuously developed and expanded by almost 1400% along the Gulf of California between 1993 and 2022. Consequently, different ecosystems have been reduced, fragmented, or altered, even in protected areas. In addition, this type of aquaculture generates the entry of various compounds and pathogens into the ecosystems supporting these ponds. Finally, RS and new platforms, such as GEE, allow us to monitor these changes. They can help identify where ecosystems are threatened and require more supervision. These tools can help improve, at a low cost, the understanding and monitoring of these economic activities and other factors affecting ecosystems.
Supplementary Materials
The following supporting information can be downloaded at: Preprints.org.
Author Contributions
DG-R: Conceptualization, methodology, software, validation, formal analysis, investigation, data curation, and environmental analysis. AO-R: Supervision, conceptualization, legislative research, and environmental analysis; AP-M: Investigation, legislative research, and environmental analysis, All the authors contributed to the manuscript and approved the submitted version. FT-S: Writing, supervision, conceptualization, methodology, software, validation, formal analysis, and investigation.
Funding
This research was funded by CONAHCYT whit the postdoctoral scholarship number 419362.
Acknowledgments
I We acknowledge CONAHCYT for providing the postdoctoral scholarship number 419362, the UAM-I postgraduate program of “Energía y Medio Ambiente,” and the CIBNOR doctoral program in science “Uso, Manejo y Preservación de los Recursos Naturales.” The authors also thank editors at MDPI services.
Conflicts of Interest
authors declare no conflicts of interest.
Appendix A

| Year | Area (ha) | Percentage concerning 1993 | Percentage concerning last year |
|---|---|---|---|
| 1993 | 6741.9 | NA | NA |
| 1994 | 5852.3 | -13.2 | -13.2 |
| 1995 | 7950.5 | 17.9 | 35.9 |
| 1996 | 9665.2 | 43.4 | 21.6 |
| 1997 | 20117.6 | 198.4 | 108.1 |
| 1998 | 15026.6 | 122.9 | -25.3 |
| 1999 | 25094.6 | 272.2 | 67.0 |
| 2000 | 26993.5 | 300.4 | 7.6 |
| 2001 | 30436.5 | 351.5 | 12.8 |
| 2002 | 29002.4 | 330.2 | -4.7 |
| 2003 | 30535.4 | 352.9 | 5.3 |
| 2004 | 36849.4 | 446.6 | 20.7 |
| 2005 | 39531.7 | 486.4 | 7.3 |
| 2006 | 41655.5 | 517.9 | 5.4 |
| 2007 | 54283.9 | 705.2 | 30.3 |
| 2008 | 58794.6 | 772.1 | 8.3 |
| 2009 | 48570.4 | 620.4 | -17.4 |
| 2010 | 22067.3 | 227.3 | -54.6 |
| 2011 | 49642.5 | 636.3 | 125.0 |
| 2012 | 11438.4 | 69.7 | -77.0 |
| 2013 | 23187.2 | 243.9 | 102.7 |
| 2014 | 52628.7 | 680.6 | 127.0 |
| 2015 | 51433.7 | 662.9 | -2.3 |
| 2016 | 68478.0 | 915.7 | 33.1 |
| 2017 | 77129.7 | 1044.0 | 12.6 |
| 2018 | 82563.5 | 1124.6 | 7.0 |
| 2019 | 86573.7 | 1184.1 | 4.9 |
| 2020 | 87550.3 | 1198.6 | 1.1 |
| 2021 | 89747.3 | 1231.2 | 2.5 |
| 2022 | 102906.0 | 1426.4 | 14.7 |
| Average | 44334.7 | NA | 19.5 |
| Year | MNBR | CDBR | CLBGEL | SLABRFA | LSMTO | SLSINM | LPCSMR | EP | ||||||||
|---|---|---|---|---|---|---|---|---|---|---|---|---|---|---|---|---|
| FLIL* | FLOL** | FLIL | FLOL | FLIL | FLOL | FLIL | FLOL | FLIL | FLOL | FLIL | FLOL | FLIL | FLOL | FLIL | FLOL | |
| 1993 | 0 | 433.66 | 0 | 197.17 | NA | 575 | 235 | NA | NA | 41 | 227 | 351 | 354 | 1558 | NA | 959 |
| 1994 | 0 | 213.16 | 0 | 219.62 | 287 | 580 | 471 | 142 | NA | 45 | 56 | 478 | 210 | 1155 | 43 | 474 |
| 1995 | 0 | 178.15 | 0 | 235.16 | NA | 657 | 824 | 190 | NA | NA | 293 | 989 | 245 | 1237 | 49 | 995 |
| 1996 | 0 | 146.29 | 0 | 260.7 | 390 | 672 | 990 | 463 | 0 | 53 | 363 | 624 | 363 | 1779 | 177 | 581 |
| 1997 | 0 | 718.79 | 0 | 249.89 | NA | 973 | 2106 | 484 | NA | 135 | 1265 | 1998 | 1422 | 3863 | 304 | 2967 |
| 1998 | 0 | NA | 0 | 267.02 | NA | 2263 | 2656 | 790 | 1 | 274 | 468 | 1705 | 1045 | 3801 | NA | NA |
| 1999 | 0 | 932.84 | 0 | 291.16 | 362 | 4080 | 3543 | 826 | 1 | 387 | 592 | 2037 | 1043 | 2954 | 285 | 3040 |
| 2000 | 14.67 | 700.71 | 0 | 151.8 | 799 | 3860 | 3908 | 691 | 1 | 428 | 1155 | 2360 | 1223 | 4535 | 354 | 2864 |
| 2001 | NA | 769.69 | 0 | 281.14 | 576 | 5343 | 5410 | 988 | 1 | 626 | 999 | 2006 | 1056 | 4054 | 213 | 2322 |
| 2002 | 8.31 | 1166.32 | 0 | 225.22 | 633 | 3446 | 3455 | 1049 | 4 | 577 | 850 | 1405 | 1791 | 3398 | 361 | 2582 |
| 2003 | NA | 829.82 | NA | 341.57 | 493 | 2293 | 7910 | 1128 | 1 | 651 | 1074 | 2093 | 1169 | 5177 | 152 | 1211 |
| 2004 | NA | 580.99 | 3.75 | 508.59 | 1022 | 4739 | 7833 | 719 | 1 | 712 | 689 | 2271 | 1033 | 4758 | 393 | 1937 |
| 2005 | 2.28 | 1753.1 | 816.35 | 1423.94 | 1223 | 4312 | 3297 | 778 | 1 | 637 | 1183 | 2252 | 1813 | 3652 | 586 | 3191 |
| 2006 | 14.13 | 2156.15 | 740.83 | 1585.99 | 1374 | 5529 | 4980 | 959 | 29 | 971 | 1191 | 2331 | 1927 | 4266 | 418 | 3134 |
| 2007 | NA | 1064.73 | 471.6 | 2072.36 | 1254 | 6083 | 8785 | 1196 | 2 | 1159 | 1524 | 3456 | 1152 | 6021 | 500 | 5085 |
| 2008 | 16.79 | 3180.68 | 851.09 | 1956.38 | 1298 | 6501 | 7201 | 1282 | 2 | 1344 | 1690 | 3609 | 1301 | 5951 | 608 | 4396 |
| 2009 | 157.92 | 1930.4 | 648.62 | 1007.14 | 2142 | 6439 | 6744 | 1213 | 8 | 1261 | 1360 | 3426 | 1831 | 4838 | 654 | 4883 |
| 2010 | 233.15 | 2235.13 | 743.87 | 1525.94 | 1326 | 2586 | 2082 | 259 | 5 | 804 | 1133 | 1084 | 512 | 980 | 70 | 904 |
| 2011 | 3.95 | 1261.89 | 777.26 | 1746.83 | 2124 | 6022 | 6160 | 1122 | 12 | 1410 | 1240 | 2227 | 1391 | 4830 | 387 | 3594 |
| 2012 | NA | NA | 913.24 | 1536.66 | NA | NA | NA | NA | NA | NA | NA | NA | NA | NA | NA | NA |
| 2013 | 5.69 | 541.38 | 448.51 | 162.74 | 1160 | 1333 | 1690 | 652 | 22 | 648 | 981 | 1604 | 1368 | 3087 | 394 | 3467 |
| 2014 | NA | 781.57 | 383.44 | 1272.26 | 1925 | 5203 | 8291 | 1540 | 34 | 1126 | 1907 | 3934 | 1665 | 6062 | 618 | 5289 |
| 2015 | NA | NA | 735.8 | 2006.16 | 1986 | 4493 | 7056 | 1477 | 8 | 1128 | 1806 | 3761 | 3044 | 5881 | 905 | 5740 |
| 2016 | NA | 712.75 | 1099.12 | 2792.82 | 2727 | 6115 | 9089 | 1864 | 14 | 1653 | 2222 | 4618 | 3263 | 7386 | 722 | 6051 |
| 2017 | 449.59 | 1414.77 | 1213.26 | 2911.3 | 2427 | 6578 | 11489 | 2145 | 102 | 1820 | 2558 | 4764 | 4871 | 8889 | 944 | 5877 |
| 2018 | 234.03 | 1591.85 | 1075.79 | 3020.02 | 2723 | 6319 | 11317 | 1955 | 204 | 2098 | 2723 | 5201 | 5410 | 10179 | 1353 | 7477 |
| 2019 | 91.62 | 988.25 | 1190.68 | 3435.02 | 2883 | 6828 | 12069 | 2144 | 368 | 2142 | 3449 | 5665 | 5866 | 10752 | 1433 | 8149 |
| 2020 | 417.93 | 953.4 | 1147.85 | 3532.06 | 2771 | 6459 | 13811 | 2358 | 611 | 2271 | 4052 | 5679 | 5197 | 10367 | 1554 | 8368 |
| 2021 | 418.37 | 1311.88 | 1083.53 | 3337.83 | 2538 | 6169 | 13408 | 2139 | 787 | 2383 | 4660 | 6015 | 6280 | 11362 | 1750 | 8721 |
| 2022 | 473.35 | 2513.87 | 1236.77 | 3696.79 | 2748 | 6699 | 15241 | 2266 | 944 | 2439 | 5702 | 6876 | 6648 | 12683 | 1954 | 10484 |
References
- Ahrens, T.D., Beman, J.M., Harrison, J.A., Jewett, P.K., Matson, P.A., 2008. A synthesis of nitrogen transformations and transfers from land to the sea in the Yaqui Valley agricultural region of northwest Mexico. Water Resources Research 44. [CrossRef]
- Alonso-Pérez, F., Ruiz-Luna, A., Turner, J., Berlanga-Robles, C.A., Mitchelson-Jacob, G., 2003. Land cover changes and impact of shrimp aquaculture on the landscape in the Ceuta coastal lagoon system, Sinaloa, Mexico. Ocean & Coastal Management 46, 583–600. [CrossRef]
- Alonso-Rodrı́guez, R., Páez-Osuna, F., 2003. Nutrients, phytoplankton and harmful algal blooms in shrimp ponds: a review with special reference to the situation in the Gulf of California. Aquaculture 219, 317–336. [CrossRef]
- Arreola-Lizárraga, J.A., Padilla-Arredondo, G., Medina-Galván, J., Méndez-Rodríguez, L., Mendoza-Salgado, R., Cordoba-Matson, M.V., 2016. Analysis of hydrobiological responses to anthropogenic and natural influences in a lagoon system in the Gulf of California. Oceanological and Hydrobiological Studies 45, 112–120. [CrossRef]
- Barraza-Guardado, R.H., Arreola-Lizárraga, J.A., López-Torres, M.A., Casillas-Hernández, R., Miranda-Baeza, A., Magallón-Barrajas, F., Ibarra-Gámez, C., 2013. Effluents of Shrimp Farms and Its Influence on the Coastal Ecosystems of Bahía de Kino, Mexico. The Scientific World Journal 2013, 306370. [CrossRef]
- Breiman, L., 1999. 1 RANDOM FORESTS--RANDOM FEATURES (Technical Report No. 567). University of California Berkeley, USA.
- CONABIO, C.N. para el C. y U. de la B., 2000. Regiones terrestres prioritarias de México.
- CONABIO, C.N. para el C. y U. de la B., 2022. PORTAL DE GEOINFORMACIÓN 2022. SISTEMA NACIONAL DE INFORMACIÓN SOBRE BIODIVERSIDAD (SNIB).
- CONANP, C.N. de Á.N.P., 2013. Programa de Manejo Reserva de la Biosphere Marismas Nacionales Nayarit. Méxcio.
- CONAPESCA, 1993. Anuario Estadístico de Acuacultura y Pesca. Comisión Nacional de Acuacultura y Pesca.
- CONAPESCA, 1994. Anuario Estadístico de Acuacultura y Pesca. Comisión Nacional de Acuacultura y Pesca.
- CONAPESCA, 1995. Anuario Estadístico de Acuacultura y Pesca. Comisión Nacional de Acuacultura y Pesca.
- CONAPESCA, 1996. Anuario Estadístico de Acuacultura y Pesca. Comisión Nacional de Acuacultura y Pesca.
- CONAPESCA, 1997. Anuario Estadístico de Acuacultura y Pesca. Comisión Nacional de Acuacultura y Pesca.
- CONAPESCA, 1998. Anuario Estadístico de Acuacultura y Pesca. Comisión Nacional de Acuacultura y Pesca.
- CONAPESCA, 1999. Anuario Estadístico de Acuacultura y Pesca. Comisión Nacional de Acuacultura y Pesca.
- CONAPESCA, 2000. Anuario Estadístico de Acuacultura y Pesca. Comisión Nacional de Acuacultura y Pesca.
- CONAPESCA, 2001. Anuario Estadístico de Acuacultura y Pesca. Comisión Nacional de Acuacultura y Pesca.
- CONAPESCA, 2002. Anuario Estadístico de Acuacultura y Pesca. Comisión Nacional de Acuacultura y Pesca.
- CONAPESCA, 2003. Anuario Estadístico de Acuacultura y Pesca. Comisión Nacional de Acuacultura y Pesca.
- CONAPESCA, 2004. Anuario Estadístico de Acuacultura y Pesca. Comisión Nacional de Acuacultura y Pesca.
- CONAPESCA, 2005. Base de Datos de Producción Anuarios. Comisión Nacional de Acuacultura y Pesca.
- CONAPESCA, 2006. Base de Datos de Producción Anuarios. Comisión Nacional de Acuacultura y Pesca.
- CONAPESCA, 2007. Base de Datos de Producción Anuarios. Comisión Nacional de Acuacultura y Pesca.
- CONAPESCA, 2008. Base de Datos de Producción Anuarios. Comisión Nacional de Acuacultura y Pesca.
- CONAPESCA, 2009. Base de Datos de Producción Anuarios. Comisión Nacional de Acuacultura y Pesca.
- CONAPESCA, 2010. Base de Datos de Producción Anuarios. Comisión Nacional de Acuacultura y Pesca.
- CONAPESCA, 2011. Base de Datos de Producción Anuarios. Comisión Nacional de Acuacultura y Pesca.
- CONAPESCA, 2012. Base de Datos de Producción Anuarios. Comisión Nacional de Acuacultura y Pesca.
- CONAPESCA, 2013. Base de Datos de Producción Anuarios. Comisión Nacional de Acuacultura y Pesca.
- CONAPESCA, 2014. Base de Datos de Producción Anuarios. Comisión Nacional de Acuacultura y Pesca.
- CONAPESCA, 2015. Base de Datos de Producción Anuarios. Comisión Nacional de Acuacultura y Pesca.
- CONAPESCA, 2016. Base de Datos de Producción Anuarios. Comisión Nacional de Acuacultura y Pesca.
- CONAPESCA, 2017. Base de Datos de Producción Anuarios. Comisión Nacional de Acuacultura y Pesca.
- CONAPESCA, 2018. Base de Datos de Producción Anuarios. Comisión Nacional de Acuacultura y Pesca.
- CONAPESCA, 2019. Base de Datos de Producción Anuarios. Comisión Nacional de Acuacultura y Pesca.
- CONAPESCA, 2020. Base de Datos de Producción Anuarios. Comisión Nacional de Acuacultura y Pesca.
- DOF, D.O. de la F., 1937. ACUERDO que declara Reserva de Caza, los terrenos denominados “Cajón del Diablo” en el Estado de Sonora.
- DOF, D.O. de la F., 2010. DECRETO por el que se declara como área natural protegida, con el carácter de reserva de la Biosphere, la región conocida como Marismas Nacionales Nayarit, localizada en los municipios de Acaponeta, Rosamorada, Santiago Ixcuintla, Tecuala y Tuxpan en el Estado de Nayarit.
- Dorber, M., Verones, F., Nakaoka, M., Sudo, K., 2020. Can we locate shrimp aquaculture areas from space? – A case study for Thailand. Remote Sensing Applications: Society and Environment 20, 100416. [CrossRef]
- Duan, Y., Li, X., Zhang, L., Chen, D., Liu, S., Ji, H., 2020. Mapping national-scale aquaculture ponds based on the Google Earth Engine in the Chinese coastal zone. Aquaculture 520, 734666. [CrossRef]
- Gámez-Bayardo, S., Castañeda-Ruelas, G.M., Espinosa-Plascencia, A., Bermúdez-Almada, M. del C., Jiménez-Edeza, M., 2021. Characterization of Vibrio parahaemolyticus strains and evaluation of shrimp cultivation conditions in a farm at the northwestern of Mexico, as risk predictors for its adaptation and dissemination. Latin american journal of aquatic research 49, 75–85. [CrossRef]
- González-Rivas, D.A., Tapia-Silva, F.O., 2023. Estimating the shrimp farm’s production and their future growth prediction by remote sensing: Case study Gulf of California. Frontiers in Marine Science 10. [CrossRef]
- González-Rivas, D.A., Tapia-Silva, F.O., Bustillos-Guzmán, J.J., Revollo-Fernández, D.A., Beltrán-Morales, L.F., Lluch-Cota, D.B., Ortega-Rubio, A., 2020. Estimating Nitrogen Runoff From Agriculture to Coastal Zones by a Rapid GIS and Remote Sensing-Based Method for a Case Study From the Irrigation District Río Mayo, Gulf of California, México. Frontiers in Marine Science 7, 316.
- Gorelick, N., Hancher, M., Dixon, M., Ilyushchenko, S., Thau, D., Moore, R., 2017. Google Earth Engine: Planetary-scale geospatial analysis for everyone. Remote Sensing of Environment. [CrossRef]
- INECC, I.N. de E. y C.C., 2007. Reserva Espacial de la Biosphere Cajón del Diablo.
- INEGI, I.N. de E. y G., 1991. Datos Básicos de la Geograffa de México, segunda. ed. Instituto Nacional de Estadística y Geografía, México.
- Jara-Marini, M.E., Molina-García, A., Martínez-Durazo, Á., Páez-Osuna, F., 2020. Trace metal trophic transference and biomagnification in a semiarid coastal lagoon impacted by agriculture and shrimp aquaculture. Environmental Science and Pollution Research 27, 5323–5336. [CrossRef]
- Jayanthi, M., Thirumurthy, S., Muralidhar, M., Ravichandran, P., 2018. Impact of shrimp aquaculture development on important ecosystems in India. Global Environmental Change 52, 10–21. [CrossRef]
- Luja VH, Guzmán-Báez DJ, Nájera O, Vega-Frutis R. Jaguars in the matrix: population, prey abundance and land-cover change in a fragmented landscape in western Mexico. Oryx. 2022;56(4):546-554. [CrossRef]
- Martínez-Durazo, A., García-Hernández, J., Páez-Osuna, F., Soto-Jiménez, M.F., Jara-Marini, M.E., 2019a. The influence of anthropogenic organic matter and nutrient inputs on the food web structure in a coastal lagoon receiving agriculture and shrimp farming effluents. Science of The Total Environment 664, 635–646. [CrossRef]
- Martínez-Durazo, A., García-Hernández, J., Páez-Osuna, F., Soto-Jiménez, M.F., Jara-Marini, M.E., 2019b. The influence of anthropogenic organic matter and nutrient inputs on the food web structure in a coastal lagoon receiving agriculture and shrimp farming effluents. Science of The Total Environment 664, 635–646. [CrossRef]
- Maxwell, A.E., Warner, T.A., Fang, F., 2018. Implementation of machine-learning classification in remote sensing: an applied review. International Journal of Remote Sensing 39, 2784–2817. [CrossRef]
- Miranda, A., Voltolina, D., Frías-Espericueta, M.G., Izaguirre-Fierro, G., Rivas-Vega, M.E., 2017. Budget and discharges of nutrients to the Gulf of California of a semi-intensive shrimp farm (NW Mexico). RH 19, 43–48.
- Molina-García, A., García-Hernández, J., Soto-Jiménez, M.F., Páez-Osuna, F., Jara-Marini, M.E., 2021. Mercury and selenium biomagnification in a coastal food web from the Gulf of California influenced by agriculture and shrimp aquaculture. Environmental Science and Pollution Research. [CrossRef]
- Morzaria-Luna, H.N., Castillo-López, A., Danemann, G.D., Turk-Boyer, P., 2014. Conservation strategies for coastal wetlands in the Gulf of California, Mexico. Wetlands Ecology and Management 22, 267–288. [CrossRef]
- Muniesa, A., Perez-Enriquez, R., Cabanillas-Ramos, J., Magallón-Barajas, F.J., Chávez-Sánchez, C., Esparza-Leal, H., de Blas, I., 2017. Identifying risk factors associated with White Spot Disease outbreaks of shrimps in the Gulf of California (Mexico) through expert opinion and surveys. Reviews in Aquaculture 9, 257–265. [CrossRef]
- Olofsson, P., Foody, G.M., Herold, M., Stehman, S.V., Woodcock, C.E., Wulder, M.A., 2014. Good practices for estimating area and assessing accuracy of land change. Remote Sensing of Environment 148, 42–57. [CrossRef]
- Páez-Osuna, F., Ruiz-Fernández, A.C., 2005a. Environmental Load of Nitrogen and Phosphorus from Extensive, Semiintensive, and Intensive Shrimp Farms in the Gulf of California Ecoregion. Bulletin of Environmental Contamination and Toxicology 74, 681–688. [CrossRef]
- Páez-Osuna, F., Ruiz-Fernández, A.C., 2005b. Environmental Load of Nitrogen and Phosphorus from Extensive, Semiintensive, and Intensive Shrimp Farms in the Gulf of California Ecoregion. Bulletin of Environmental Contamination and Toxicology 74, 681–688. [CrossRef]
- QGIS, A., 2022. QGIS Geographic Information System.
- Ramsar, 2022. Servicio de Información sobre Sitios Ramsar.
- Valderrama-Landeros, L., Flores-de-Santiago, F., Kovacs, J.M., Flores-Verdugo, F., 2017. An assessment of commonly employed satellite-based remote sensors for mapping mangrove species in Mexico using an NDVI-based classification scheme. Environmental Monitoring and Assessment 190, 23. [CrossRef]
- Valenzuela-Sanchez, C.G., Pasten-Miranda, N.M.A., Enriquez-Ocaña, L.F., Barraza-Guardado, R.H., Holguin, J.E.V., Martinez-Cordova, L.R., 2021. Phytoplankton composition and abundance as indicators of aquaculture effluents impact in coastal environments of mid Gulf of California. Heliyon 7, e06203. [CrossRef]
Figure 2.
Expansion of the shrimp pond area, from 1993 to 2022, along the Gulf of California. Plot (a) shows bars with the total area in Ha per year of the ponds in the region, while the line graph indicates the percentage growth in the previous year. Plot (b) shows the percentage growth in the year 1993.
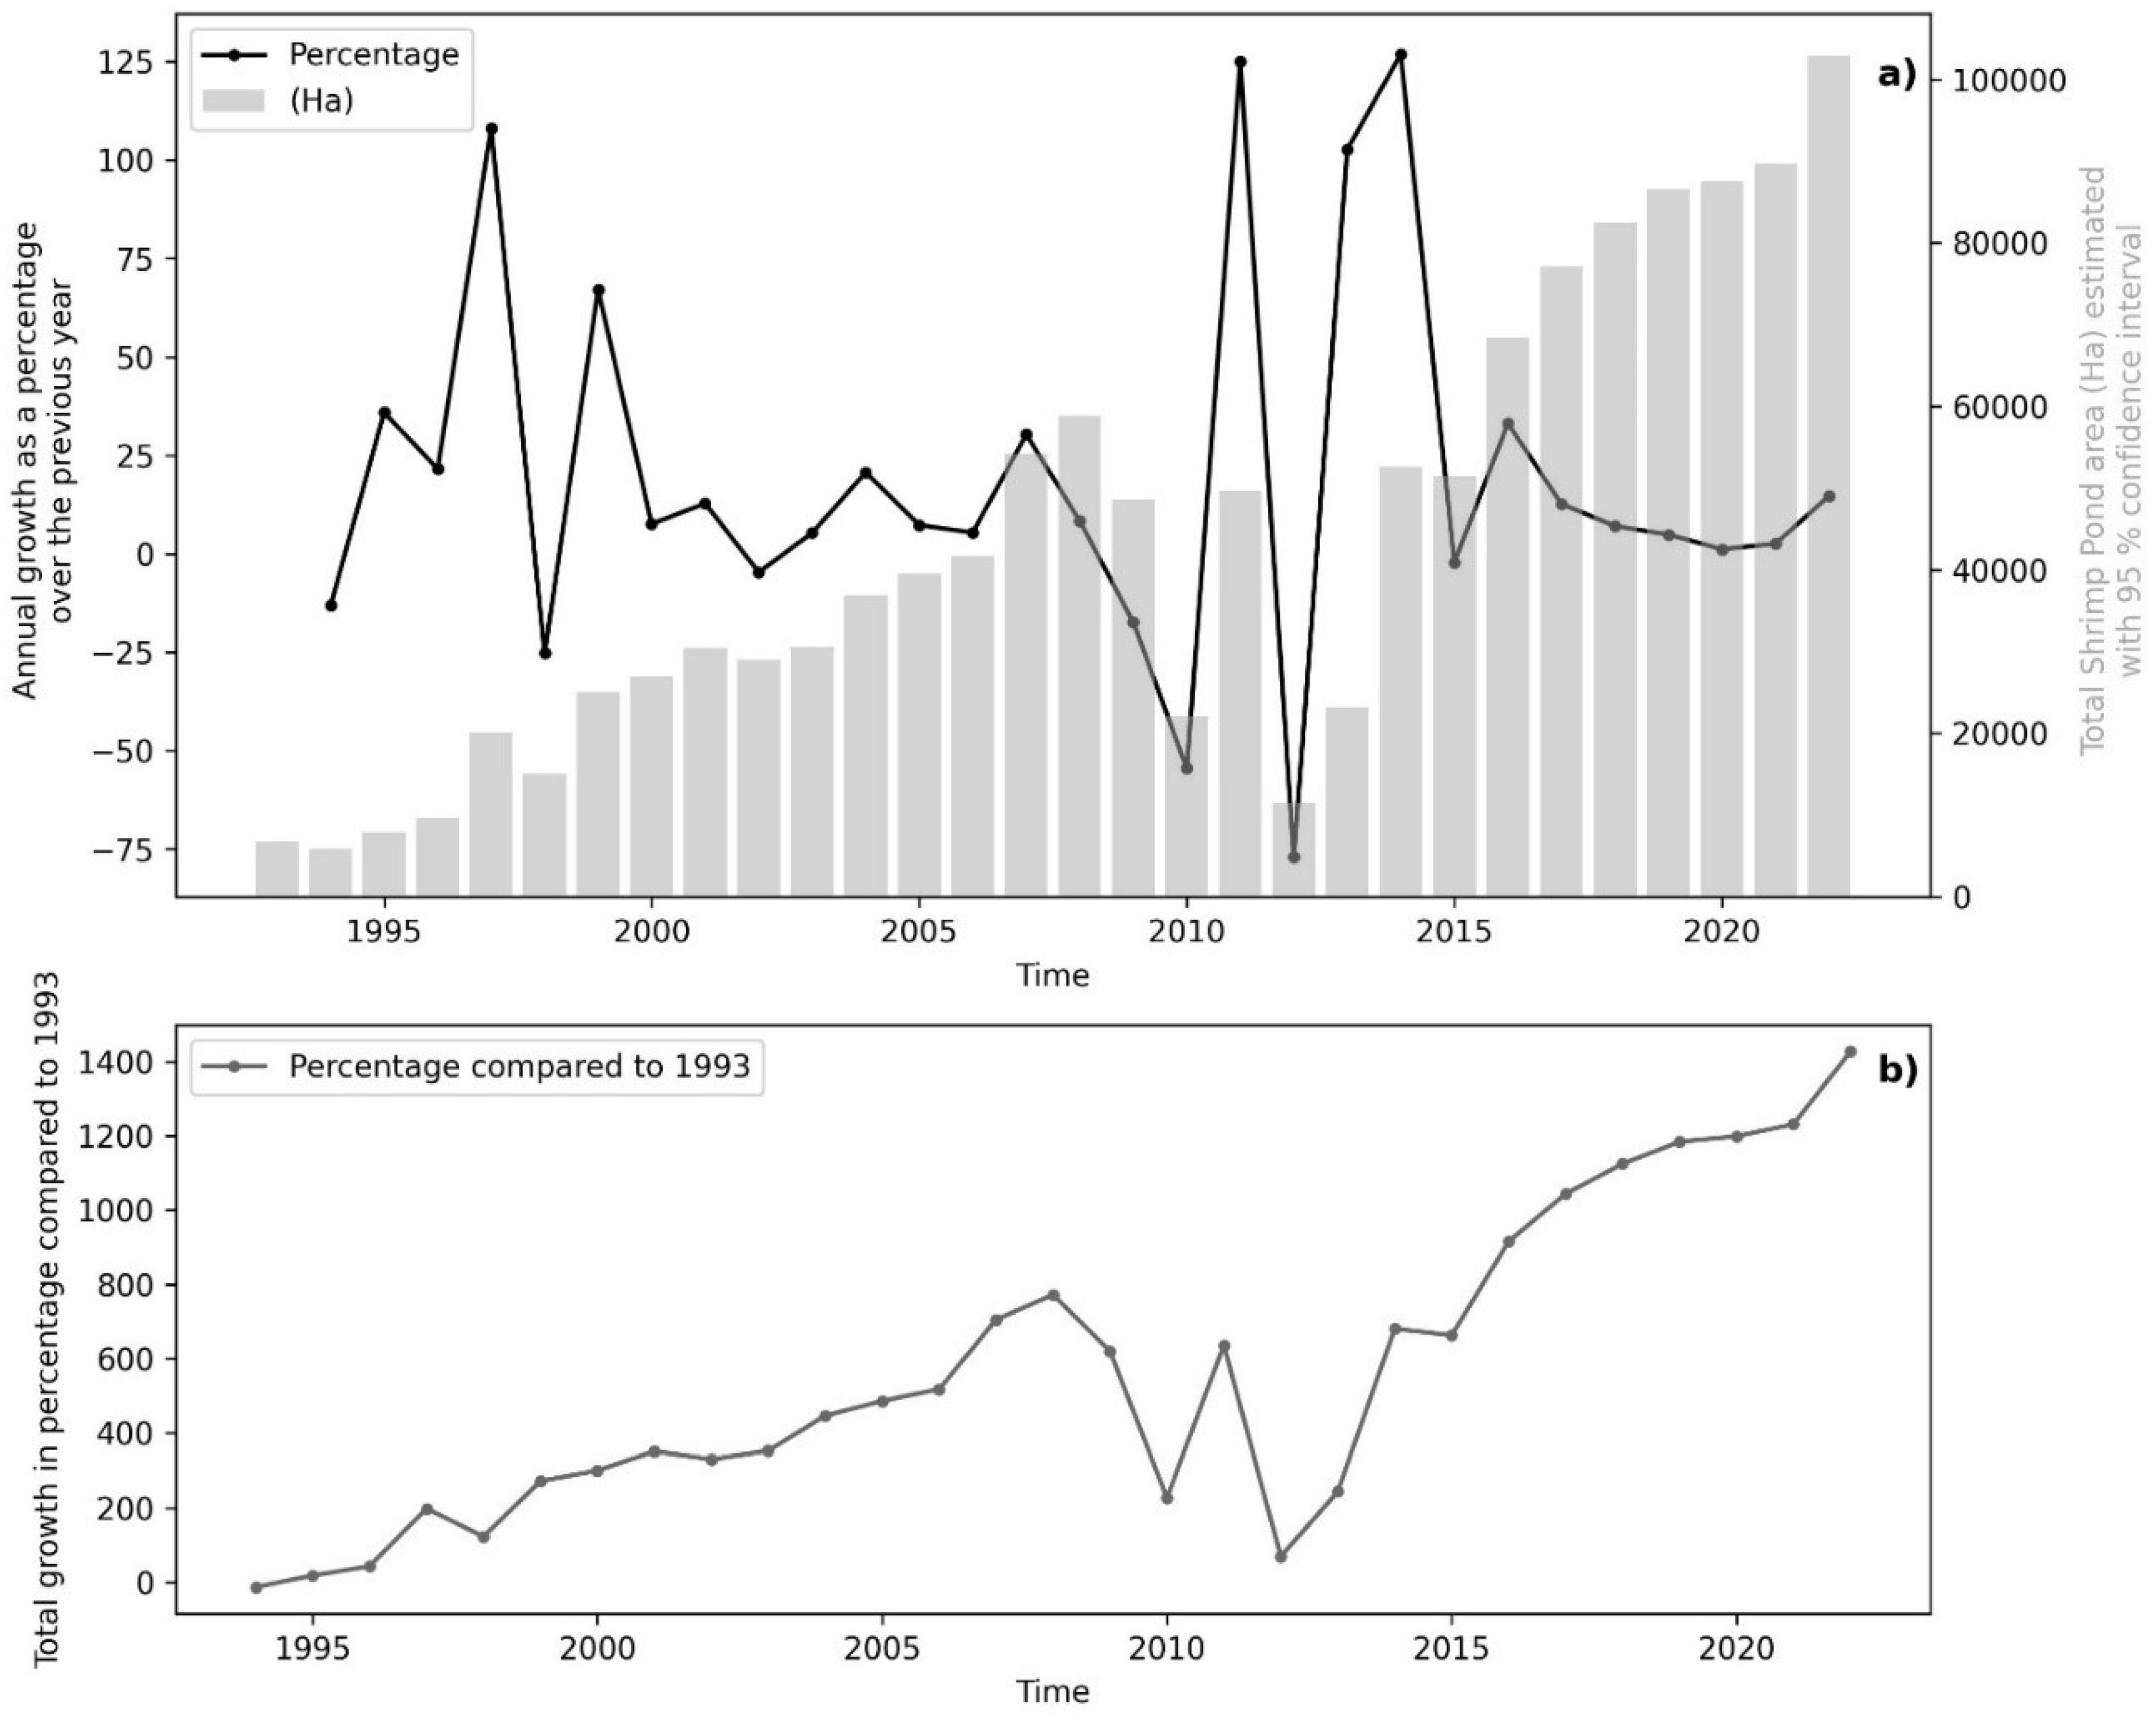
Figure 3.
The long-term expansion of the shrimp ponds in the MNBR. The arrows indicate the locations of the new ponds constructed in the indicated year.
Figure 3.
The long-term expansion of the shrimp ponds in the MNBR. The arrows indicate the locations of the new ponds constructed in the indicated year.
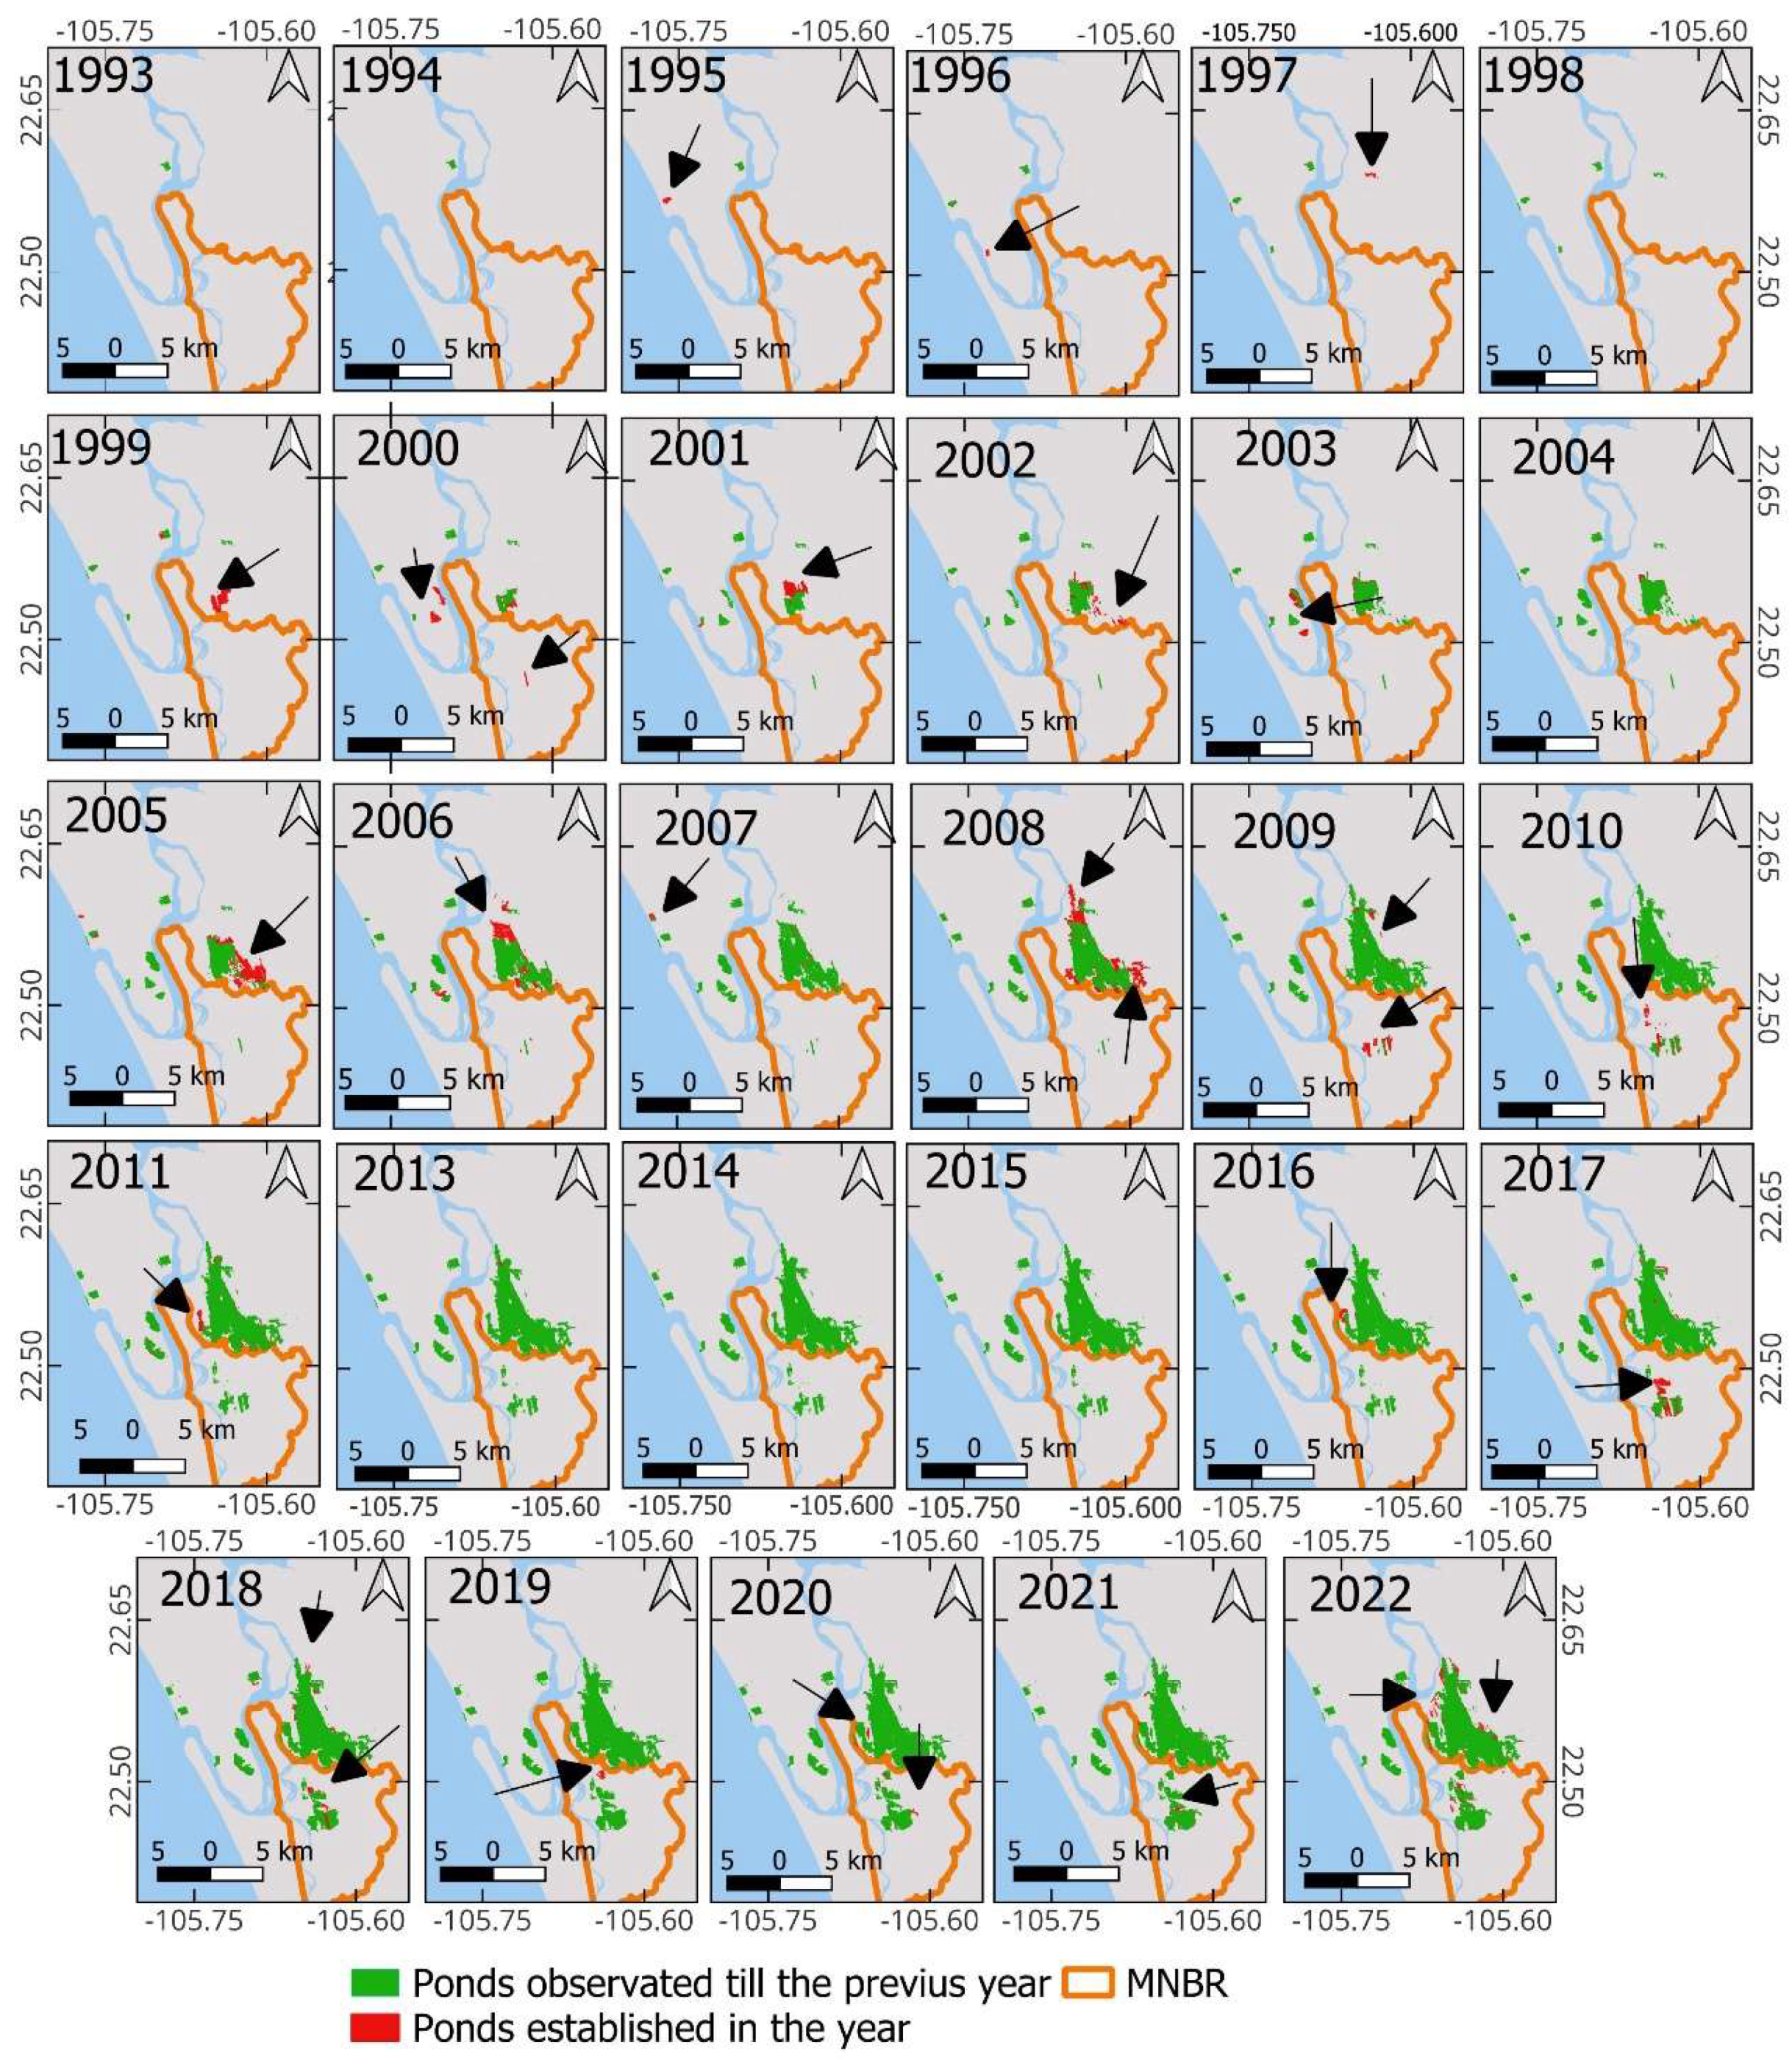
Figure 4.
The long-term expansion of shrimp ponds in the CDBR. The arrows indicate the locations of the new ponds constructed in the indicated year.
Figure 4.
The long-term expansion of shrimp ponds in the CDBR. The arrows indicate the locations of the new ponds constructed in the indicated year.
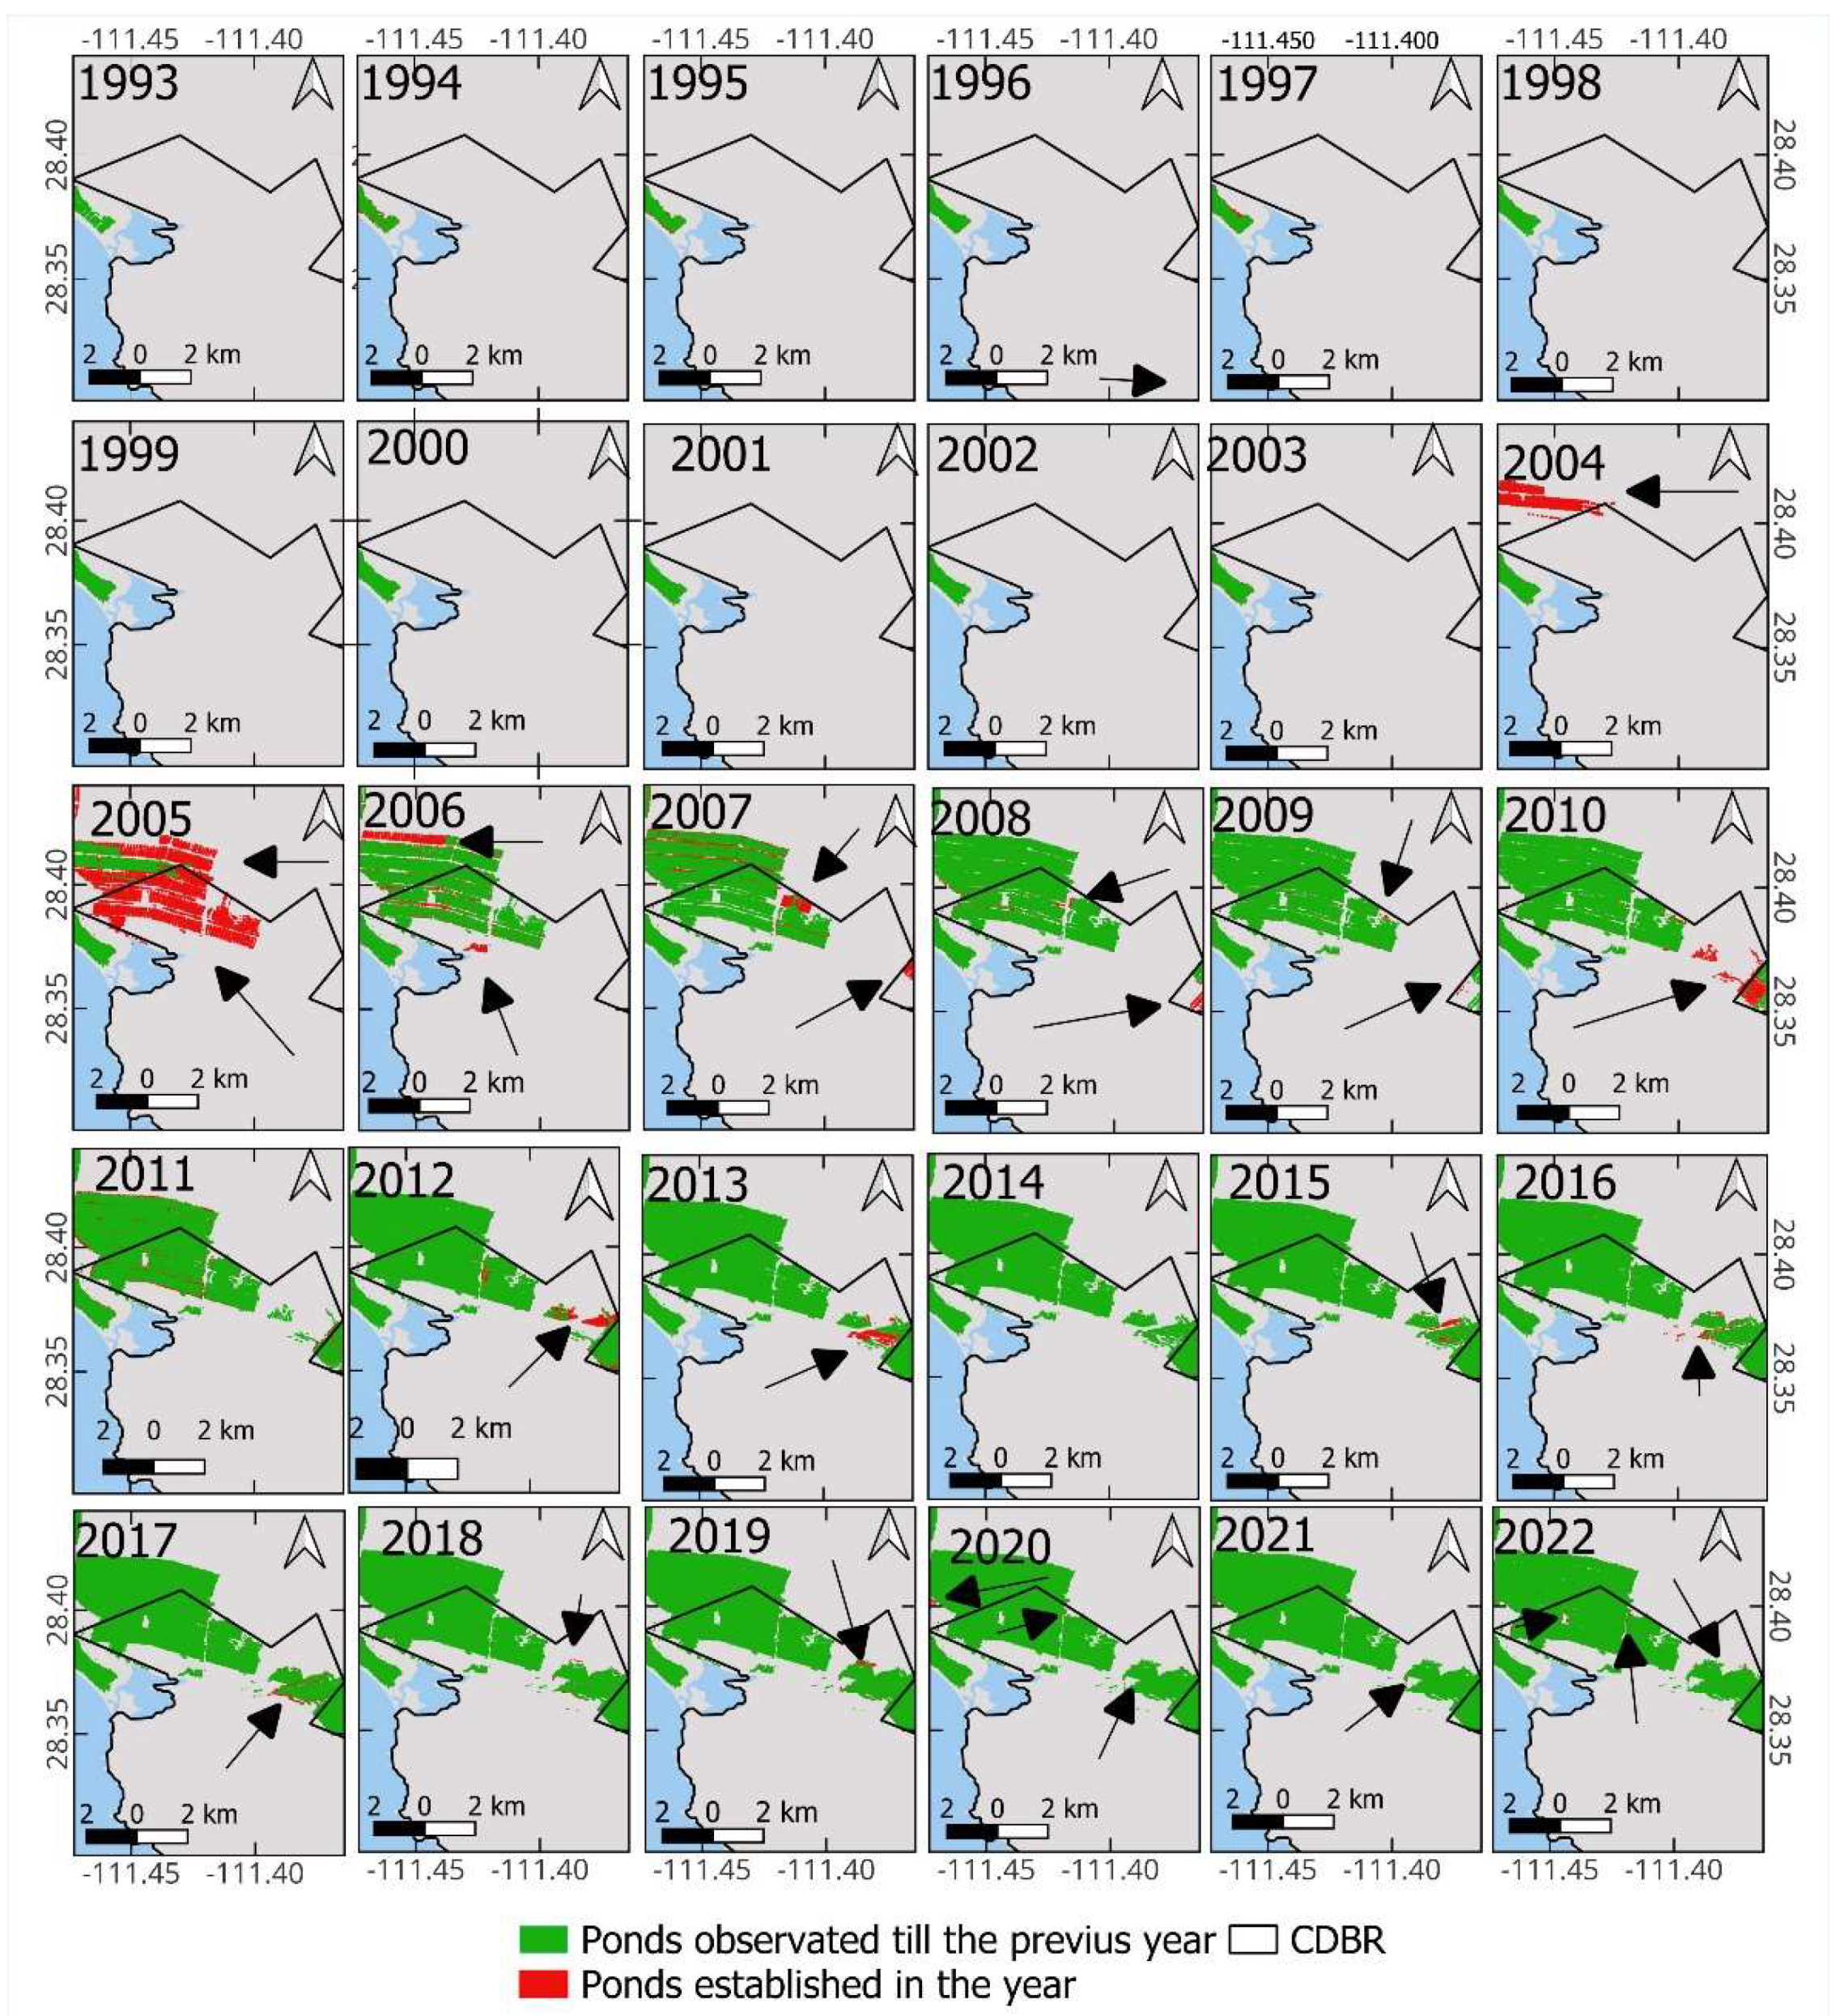
Figure 5.
The long-term expansion of shrimp ponds in the CLBGEL. The arrows indicate the locations of the new ponds constructed in the indicated year.
Figure 5.
The long-term expansion of shrimp ponds in the CLBGEL. The arrows indicate the locations of the new ponds constructed in the indicated year.
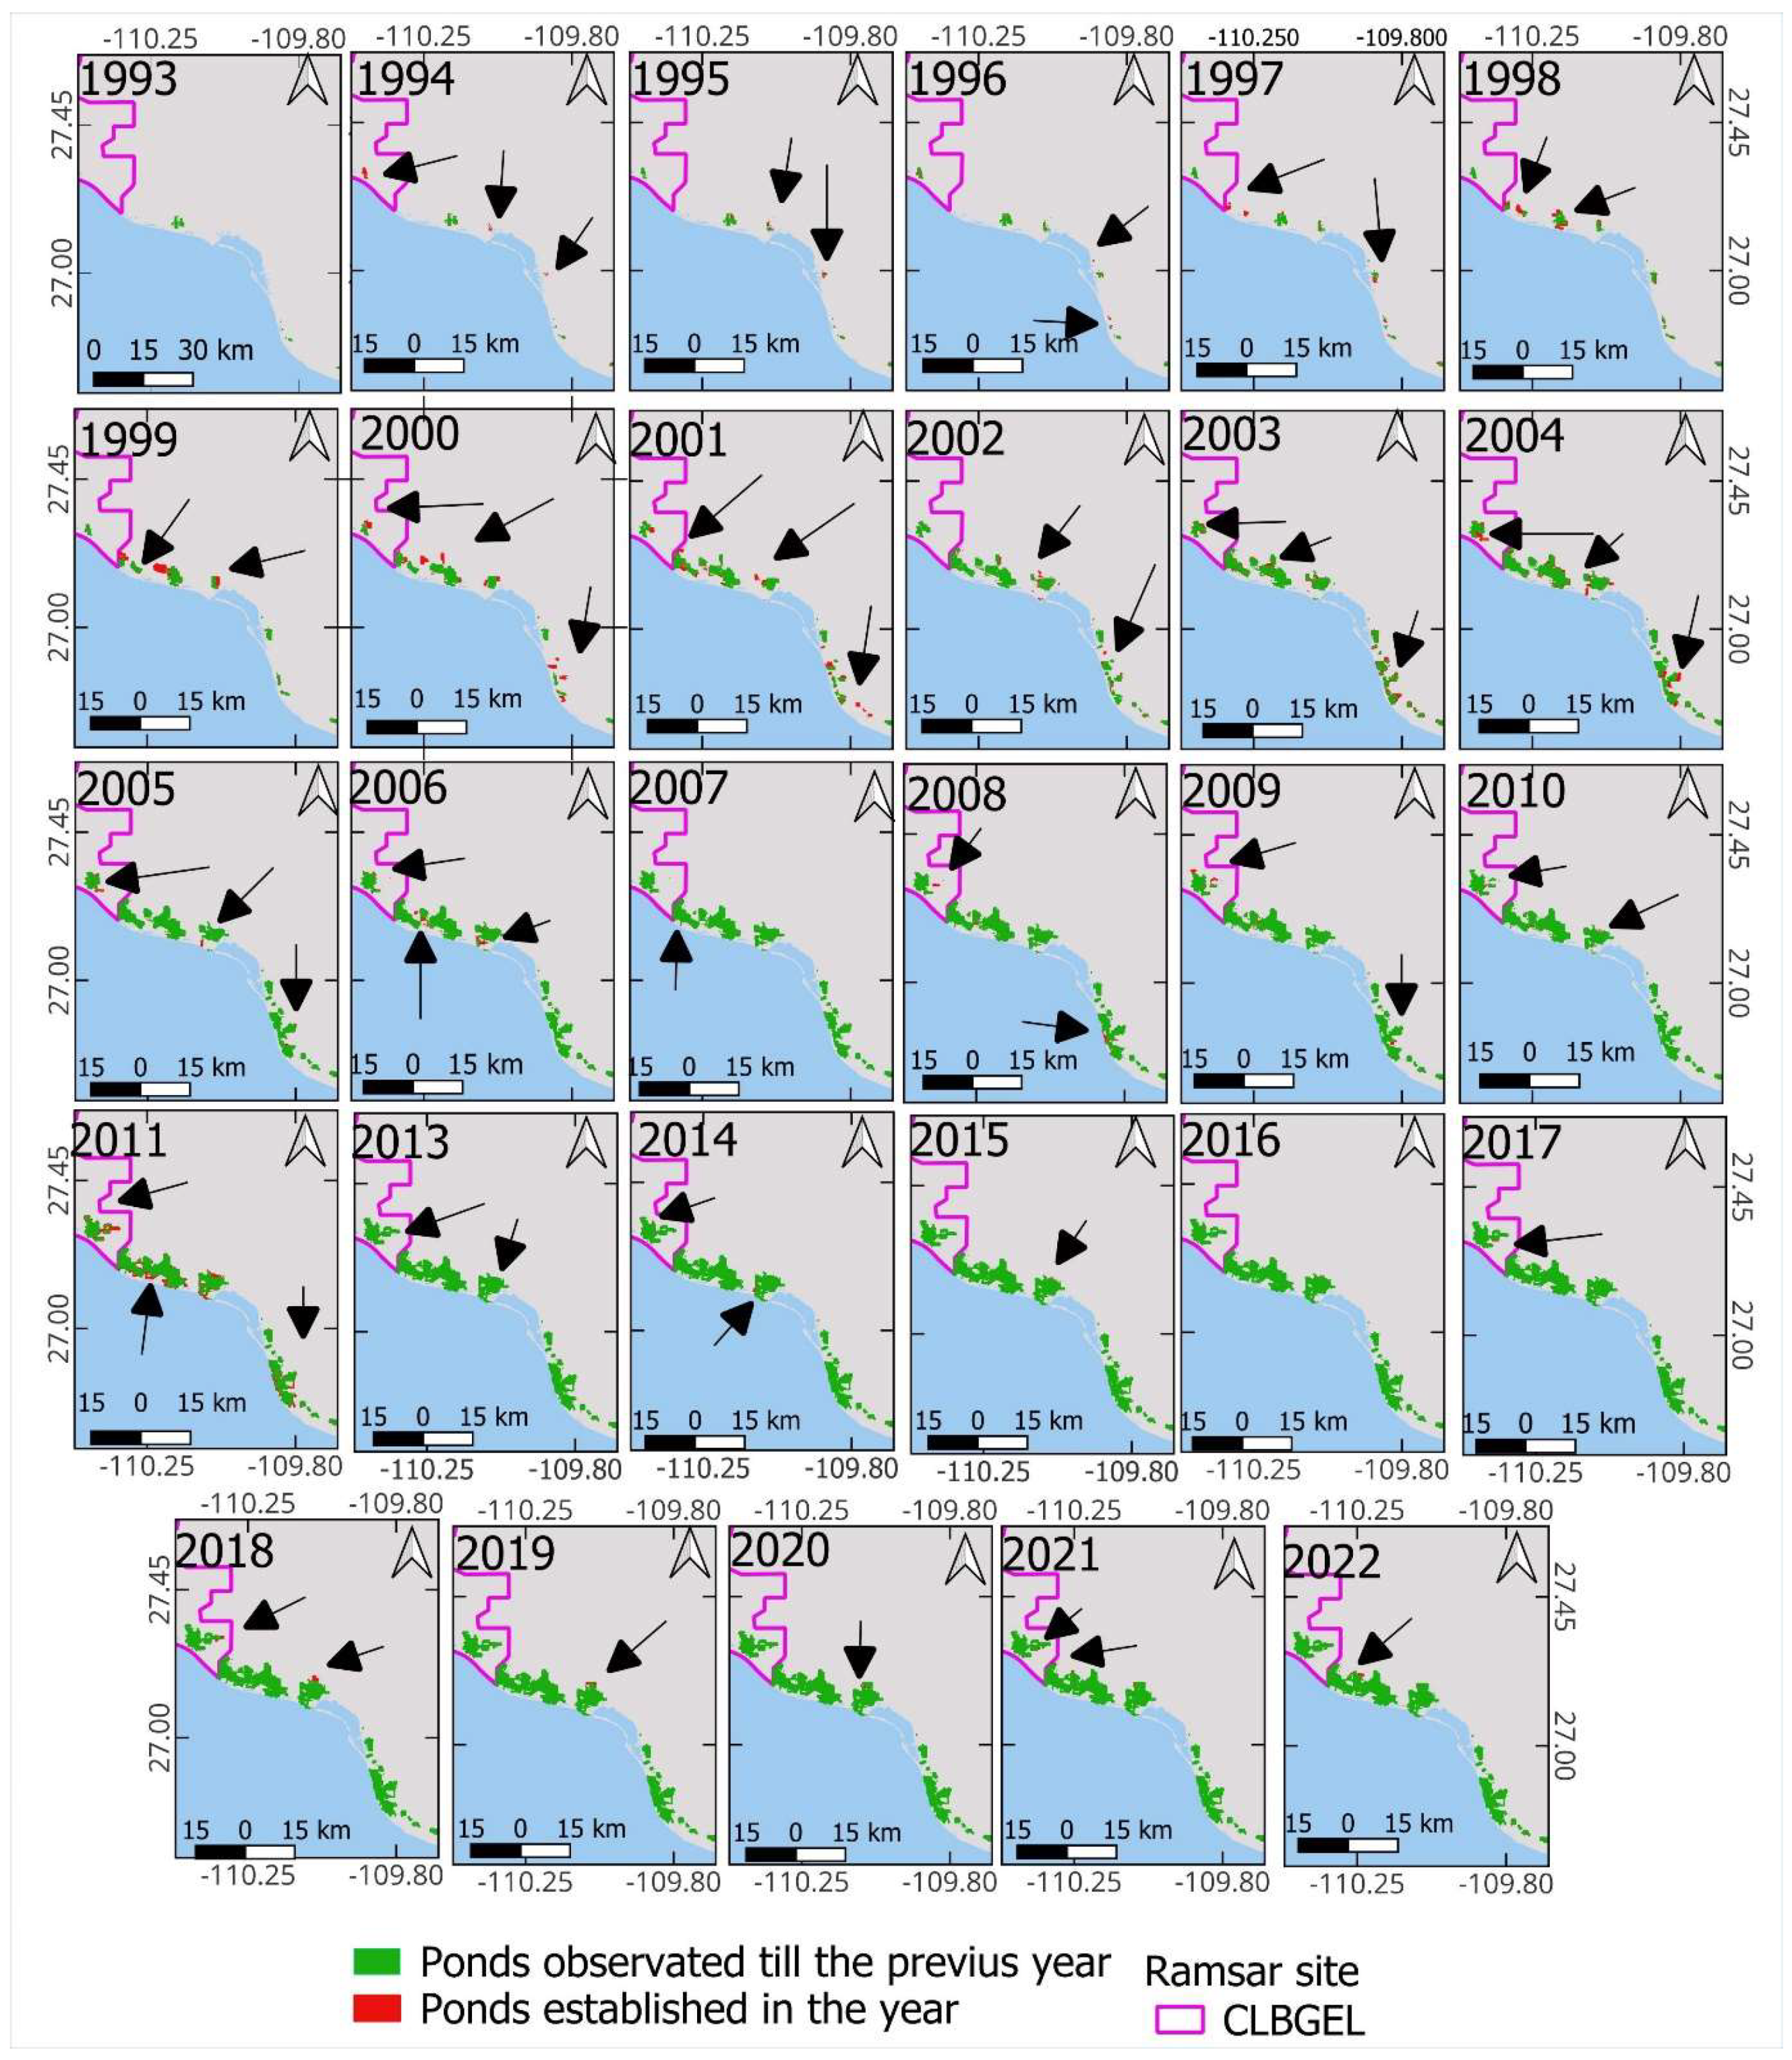
Figure 6.
The long-term expansion of shrimp ponds within the sites of SLAMBRFA, LSMTO, and SLSIM. The arrows indicate the locations of the new ponds constructed in the indicated year.
Figure 6.
The long-term expansion of shrimp ponds within the sites of SLAMBRFA, LSMTO, and SLSIM. The arrows indicate the locations of the new ponds constructed in the indicated year.
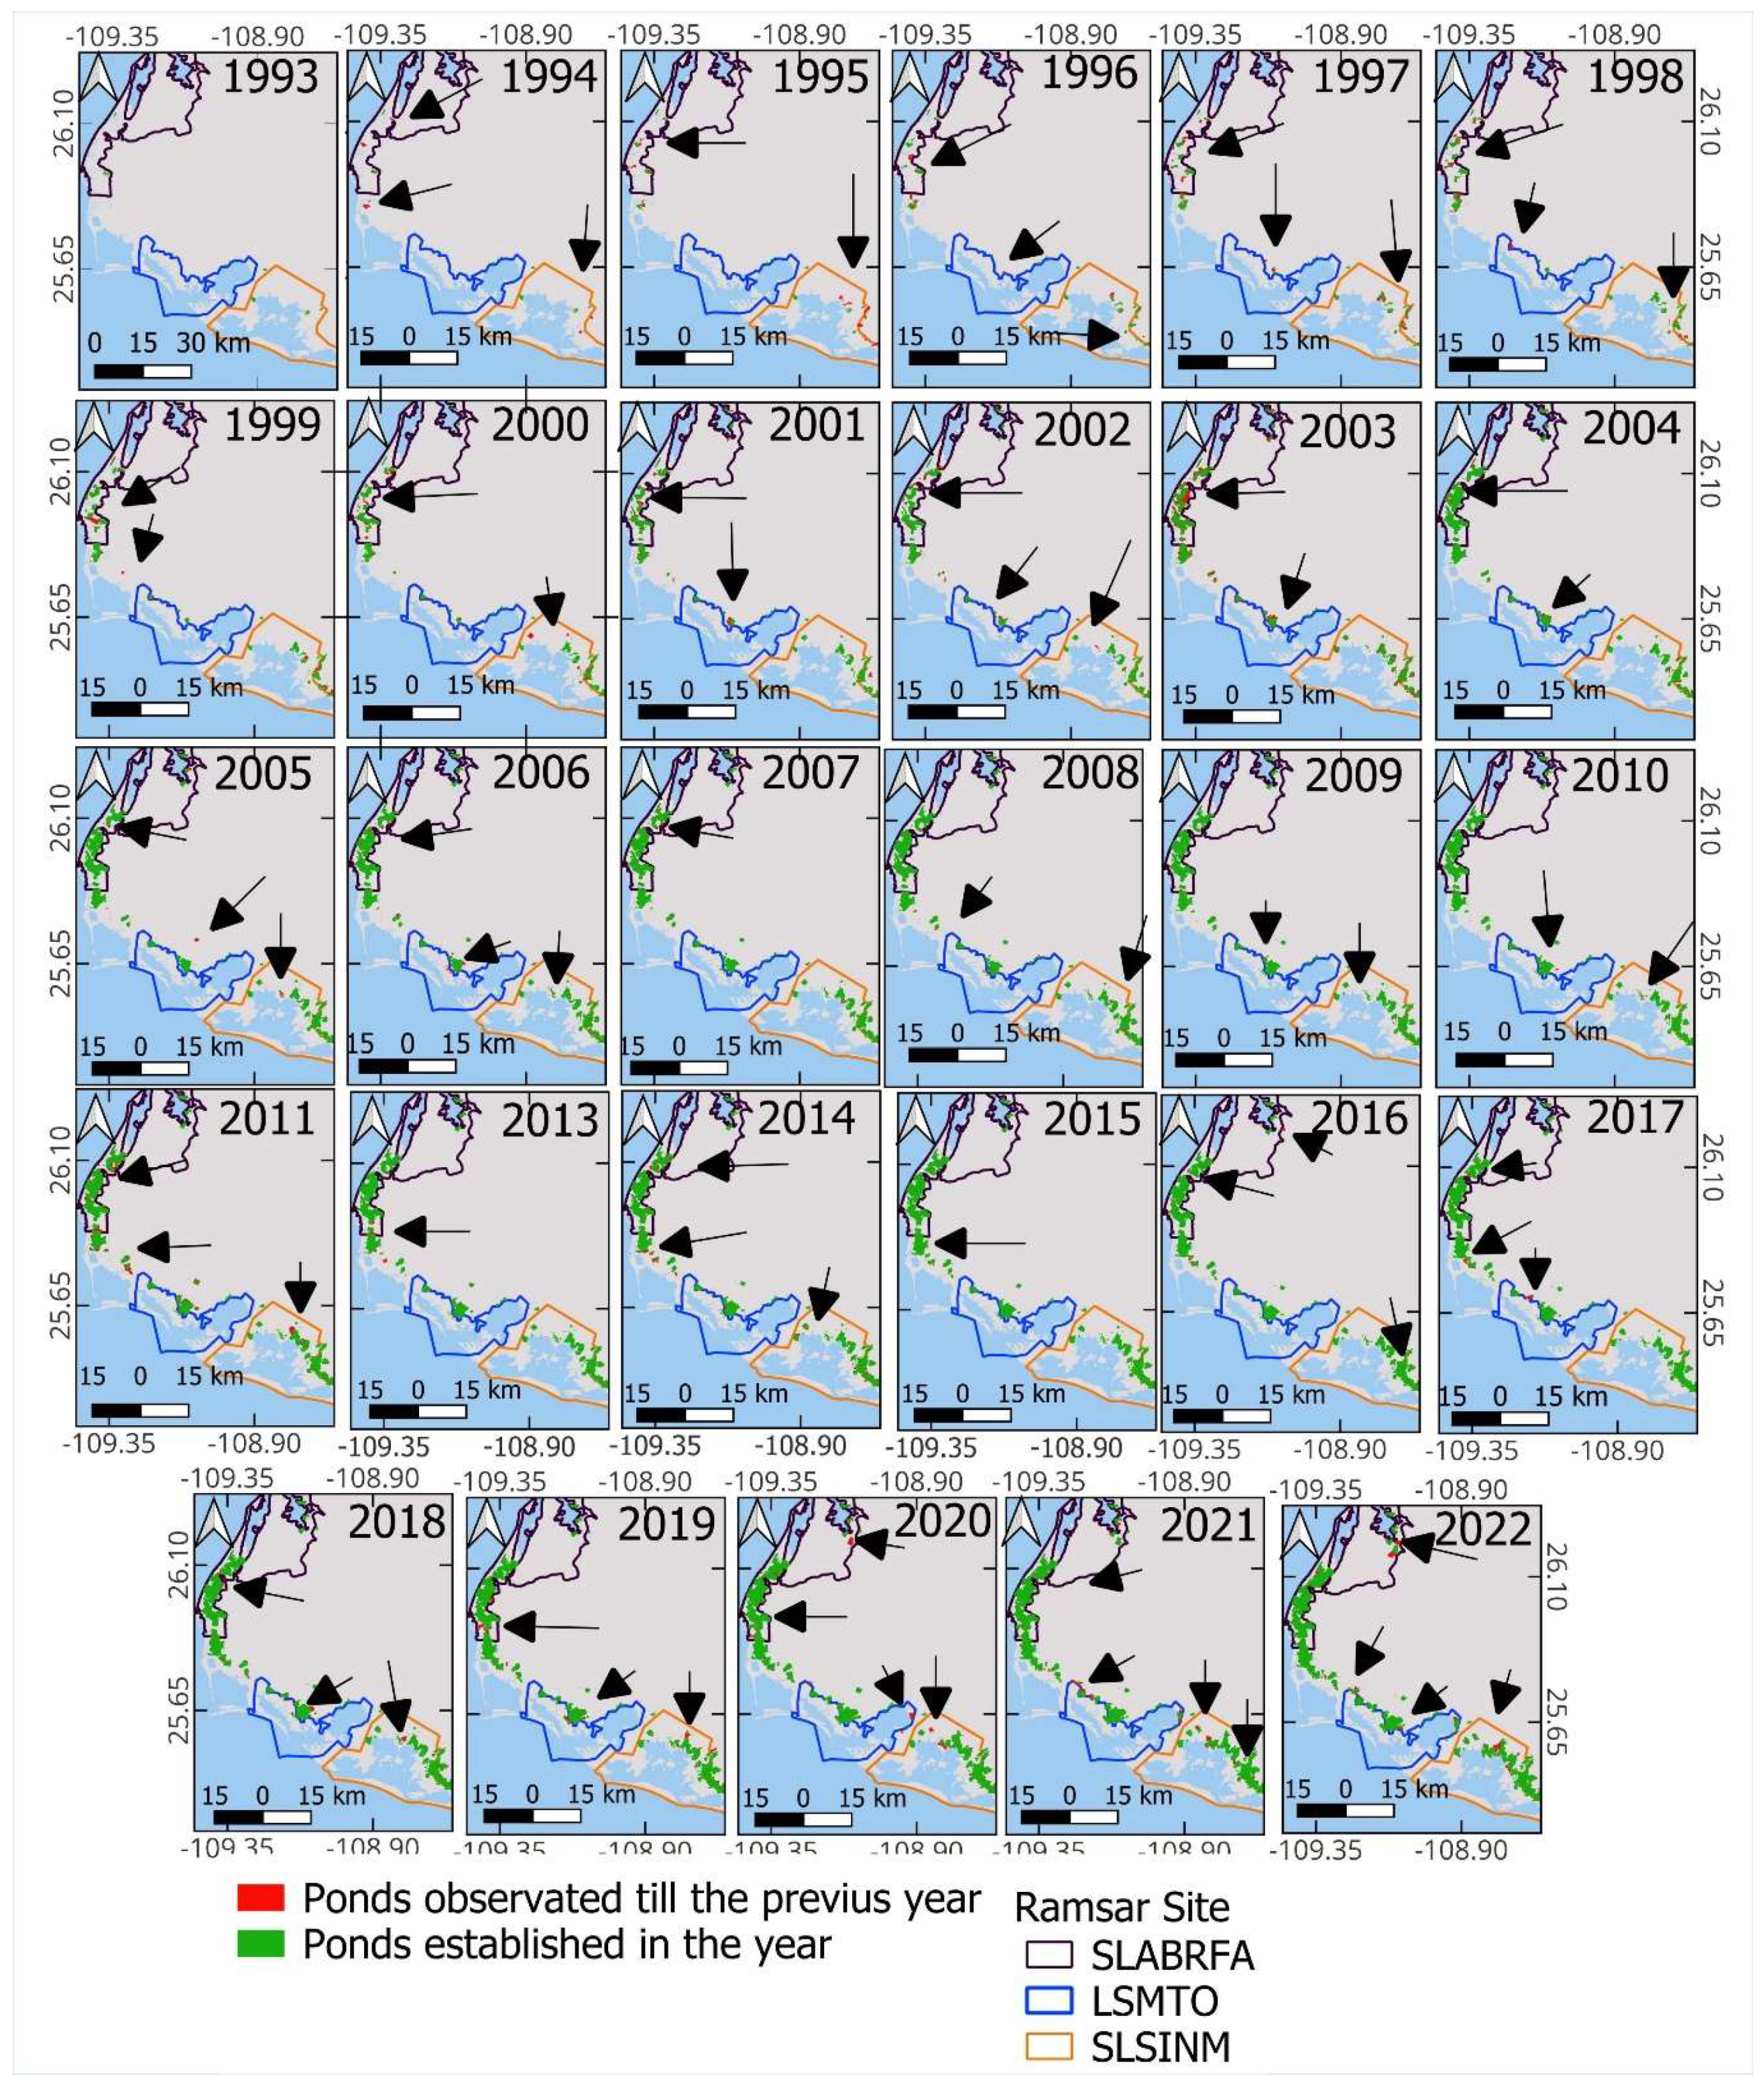
Figure 7.
The long-term expansion of shrimp ponds within the sites LPCSMR and EP. The arrows indicate the locations of the new ponds constructed in the indicated year.
Figure 7.
The long-term expansion of shrimp ponds within the sites LPCSMR and EP. The arrows indicate the locations of the new ponds constructed in the indicated year.
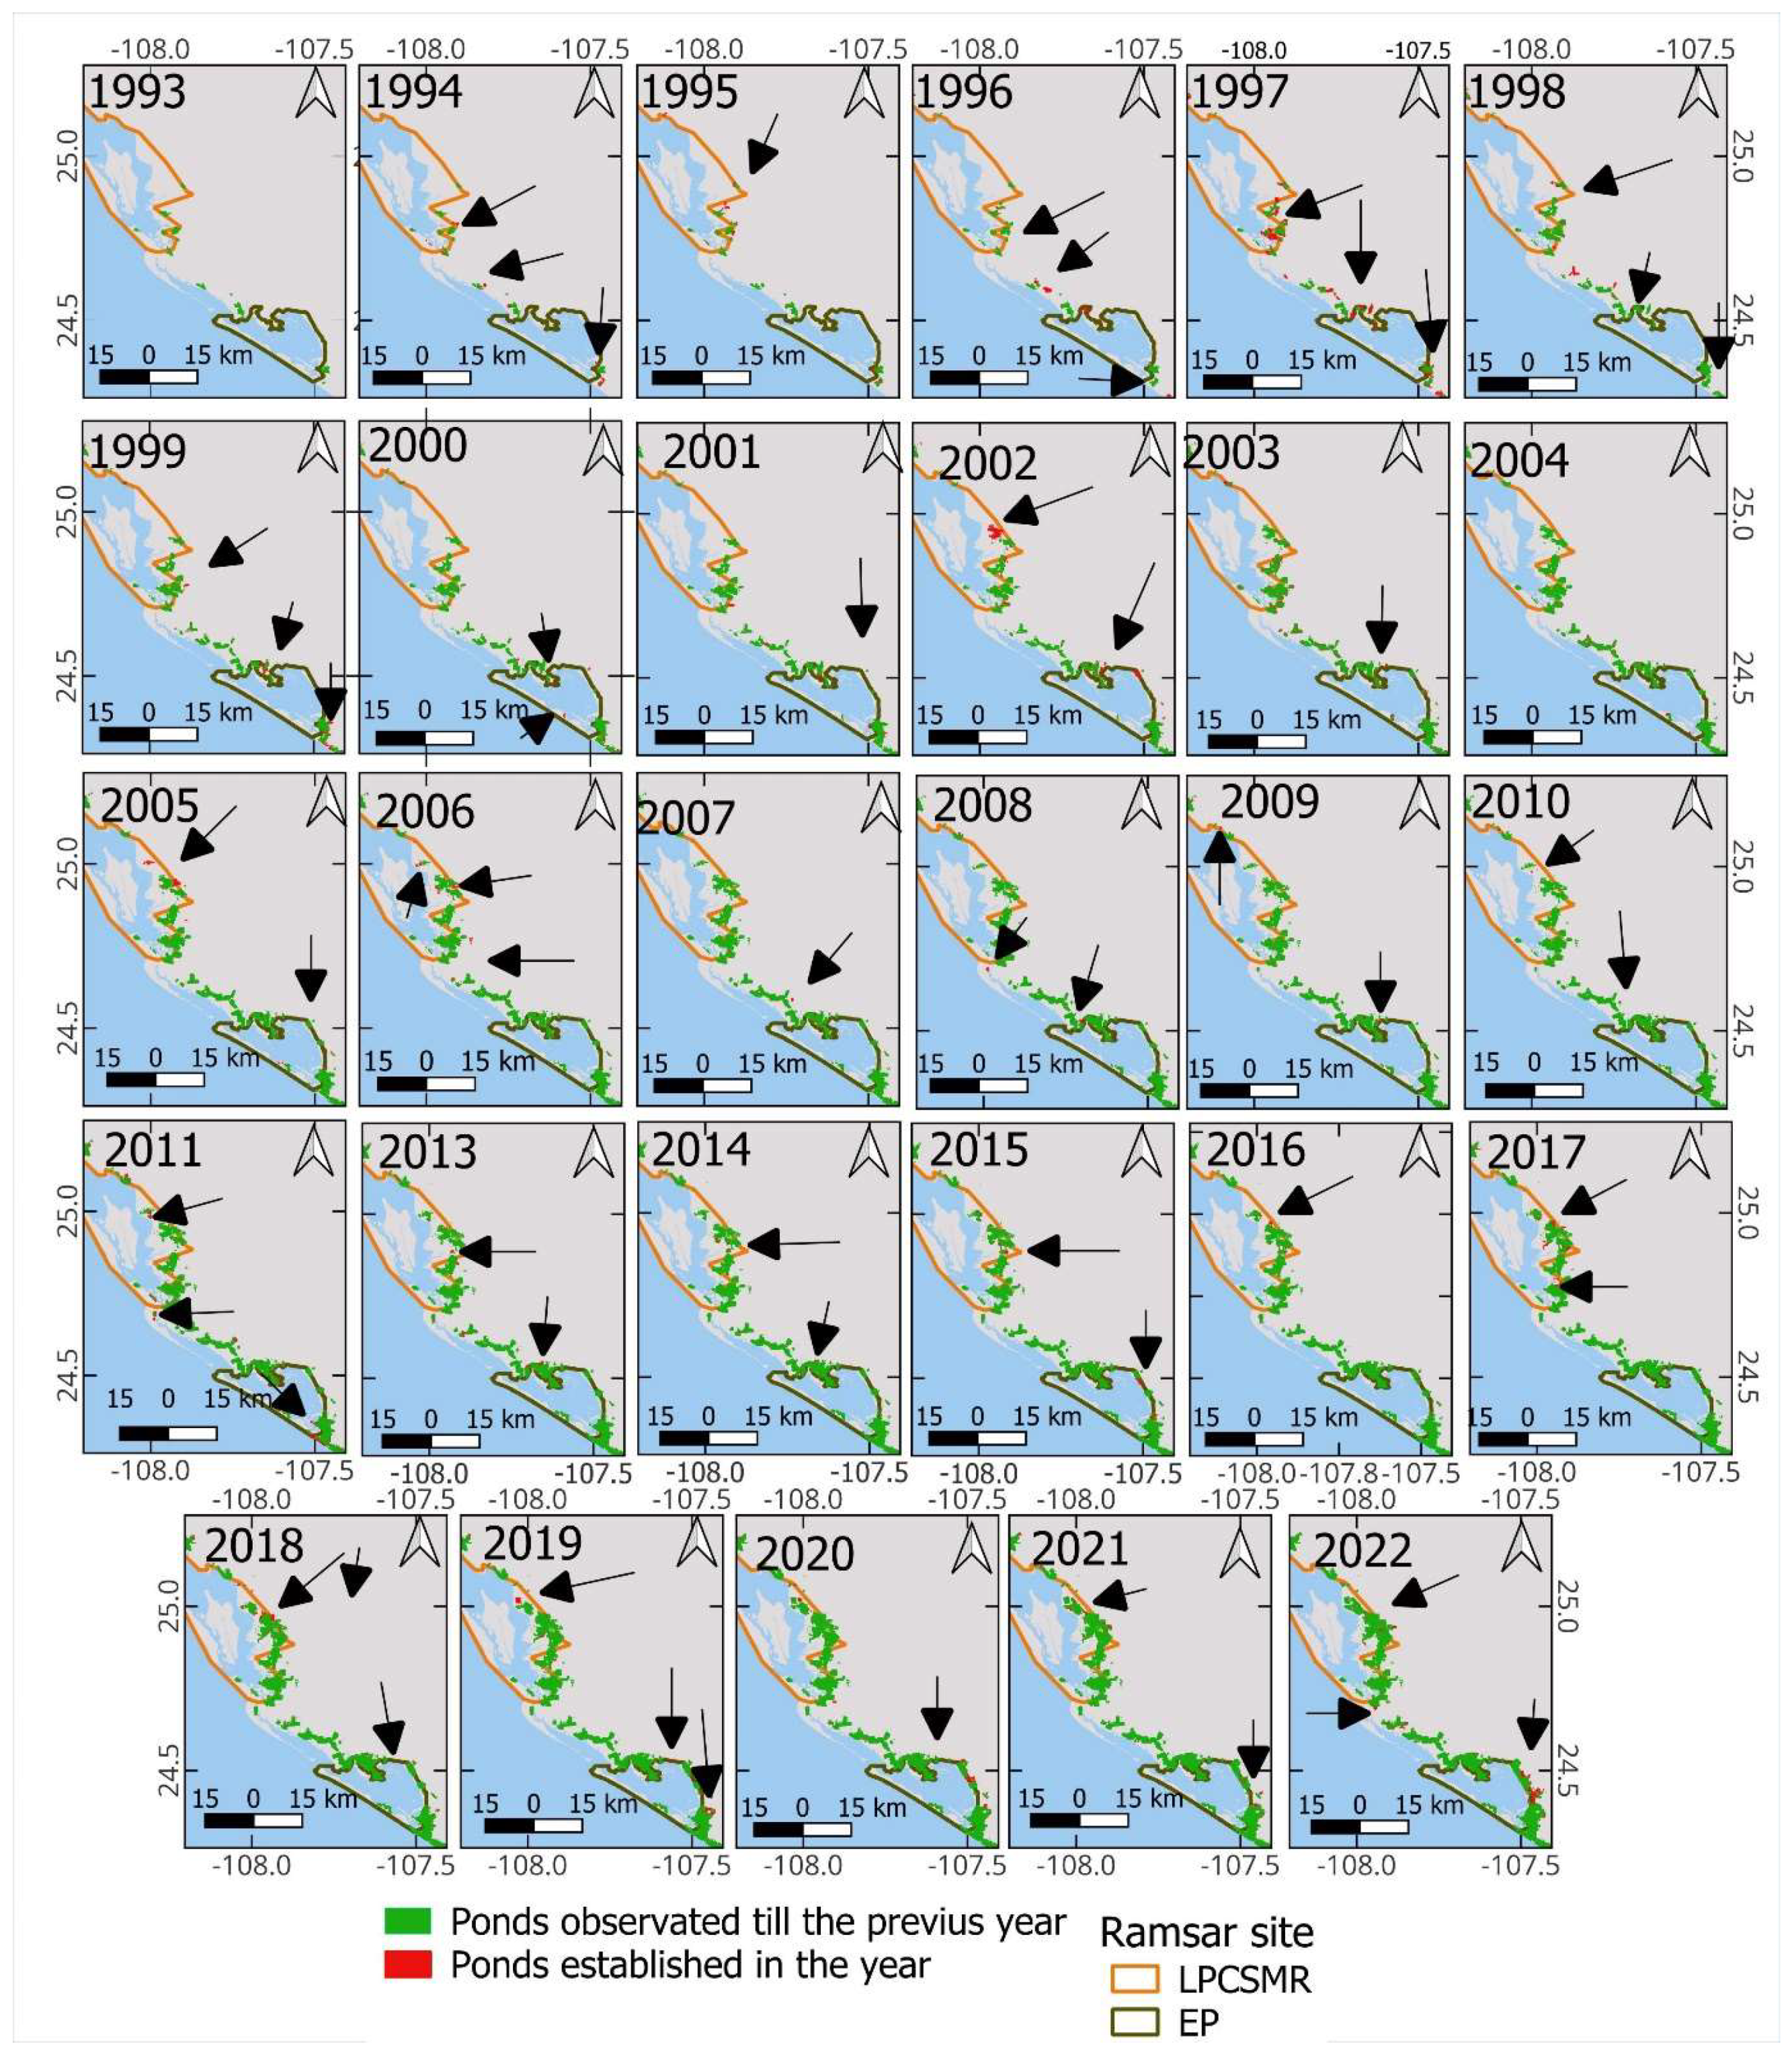
Table 1.
Estimated standard errors S(ÔSA) of the selected allocations for each classified year and the estimated commission errors for each class: S(ÛP) for shrimp pond, S(ÛS) for soil, and S(ÛV) for vegetation.
Table 1.
Estimated standard errors S(ÔSA) of the selected allocations for each classified year and the estimated commission errors for each class: S(ÛP) for shrimp pond, S(ÛS) for soil, and S(ÛV) for vegetation.
| Year | S(Ộsa) | S(Ûp) | S(Ûs) | S(Ûv) |
|---|---|---|---|---|
| 1993 | 0.0185327 | 0.027501 | 0.0254457 | 0.0254457 |
| 1994 | 0.0186531 | 0.0254457 | 0.024577 | 0.0287348 |
| 1995 | 0.0193838 | 0.024577 | 0.0224231 | 0.0361158 |
| 1996 | 0.0178544 | 0.027501 | 0.0212664 | 0.0337526 |
| 1997 | 0.0190717 | 0.024577 | 0.0224231 | 0.0361158 |
| 1998 | 0.0183226 | 0.027501 | 0.0254457 | 0.0254457 |
| 1999 | 0.0188459 | 0.024577 | 0.0224231 | 0.0361158 |
| 2000 | 0.0183717 | 0.0254457 | 0.0254457 | 0.027501 |
| 2001 | 0.019122 | 0.024577 | 0.0224231 | 0.0361158 |
| 2002 | 0.0182602 | 0.0254457 | 0.024577 | 0.0287348 |
| 2005 | 0.0181647 | 0.0254457 | 0.024577 | 0.0287348 |
| 2006 | 0.0192668 | 0.024577 | 0.0224231 | 0.0361158 |
| 2007 | 0.0173769 | 0.027501 | 0.0212664 | 0.0337526 |
| 2008 | 0.0185983 | 0.024577 | 0.0224231 | 0.0361158 |
| 2009 | 0.0179573 | 0.0254457 | 0.0254457 | 0.027501 |
| 2010 | 0.0187727 | 0.0254457 | 0.024577 | 0.0287348 |
| 2013 | 0.0185095 | 0.0254457 | 0.024577 | 0.0287348 |
| 2014 | 0.0188619 | 0.024577 | 0.0224231 | 0.0361158 |
| 2015 | 0.0181858 | 0.0254457 | 0.024577 | 0.0287348 |
| 2016 | 0.0173426 | 0.027501 | 0.0212664 | 0.0337526 |
| 2017 | 0.0172606 | 0.027501 | 0.0212664 | 0.0337526 |
| 2018 | 0.017472 | 0.0254457 | 0.024577 | 0.0287348 |
| 2019 | 0.0169542 | 0.027501 | 0.0212664 | 0.0337526 |
| 2020 | 0.0174175 | 0.0254457 | 0.024577 | 0.0287348 |
| 2021 | 0.0174555 | 0.0254457 | 0.024577 | 0.0287348 |
| 2022 | 0.0174022 | 0.0254457 | 0.024577 | 0.0287348 |
Table 2.
Years and percentages of intensive growth in the maximum development of previous years for the Biosphere Reserves and Ramsar sites.
Table 2.
Years and percentages of intensive growth in the maximum development of previous years for the Biosphere Reserves and Ramsar sites.
| Name | Year | Perrcentage | ||
|---|---|---|---|---|
| Inside/ Surrounding | Inside/ Surrounding | |||
| BRMN | 2009,2010, 2017 | 1997,1999, 2002, 2008 | 840,47, 92 | 66,29, 25, 48 |
| CDBR | 2005, 2016 | 2004, 2005, 2007, 2016 | 21658, 20 | 49, 178, 30, 34 |
| CDBR to Bahía Kino | 1998,1999, 2001, 2002, 2003, 2004, 2005, 2007, 2016 | 24, 24, 156, 107, 35, 69, 73, 38, 23 | ||
| CLBGEL | 1996, 2000, 2004, 2009, 2016 | 1997,1998,1999, 2001 | 36,105,28,56,27 | 44, 133, 80, 31 |
| LSMTO | 2006,2017, 2018, 2019, 2021, 2022 | 1997,1998,1999, 2001, 2006 | 696, 196, 100, 80, 65, 28, 19 | 157,103,41,46,36 |
| SLABRFA | 1994, 1996, 1997, 1998, 1999, 2001, 2003, 2017 | 1995, 1996, 1998, 2014, 2016 | 100, 75, 20, 113, 26, 33,38, 46, 26 | 33, 144, 71, 20, 21 |
| SLSINM | 1995, 1996, 1997, 2007, 2019, 2022 | 1994, 1995, 1997, 2007, 2016 | 29, 24,248,20,26,22 | 36, 107, 102, 48, 23 |
| EP | 1997, 2005, 2015, 2018 | 2005, 201, 2018 | 72, 49, 38, 43 | 49, 38, 43 |
| LPCSMR | 1997, 2002, 2015, 2017, 2021 | 1997, 2016,2018 | 291,35,58,49,20 | 117,22,20 |
*FLIL: farms located inside the protected area; **FLOL: farms located on the outer limits of the protected area. The abbreviations of the protected areas' names are defined in Fig. 1. Bold numbers indicate growth higher than the previous maximum growth.
Disclaimer/Publisher’s Note: The statements, opinions and data contained in all publications are solely those of the individual author(s) and contributor(s) and not of MDPI and/or the editor(s). MDPI and/or the editor(s) disclaim responsibility for any injury to people or property resulting from any ideas, methods, instructions or products referred to in the content. |
© 2024 by the authors. Licensee MDPI, Basel, Switzerland. This article is an open access article distributed under the terms and conditions of the Creative Commons Attribution (CC BY) license (http://creativecommons.org/licenses/by/4.0/).
Copyright: This open access article is published under a Creative Commons CC BY 4.0 license, which permit the free download, distribution, and reuse, provided that the author and preprint are cited in any reuse.


