1. Introduction
Growing demand of animal protein has supposed to face many challenges for managing the large amounts of manure from livestock farms in Bangladesh. In Bangladesh, 432.38 million livestock annually produce about 216.97 million tons of fresh manure where most of the manure are kept as solid storage, used for burning fuel in rural area of Bangladesh and a few percentages are used as biogas production by anaerobic digestion at small scale level [
1,
2]. Though, biogas production by anaerobic digestion (AD) is an efficient way to transform waste into resources and it is a biological process to convert waste materials into biogas as a clean biofuel and digestate as nutrient-rich byproduct [
3,
4,
5,
6]. Anaerobic digestion not only produces energy and biofertilizer but also reduces greenhouse gas emissions [
7]. A study found that Bangladesh had 486.77 million tons/year of animal waste which can be used for 27,923.72 million m
3/year biogas production and about 29.232 million tons/year of biofertilizer can be produced in 2018–19 [
8]. Another study estimated that approximately 229 million tons of livestock waste can produce a total of 16988.97 million m
3 biogas which could be converted into 16.68×10
7 MWh of electricity with 29 million tons of biofertilizer in 2016 [
9]. Afterwords, the government has also emphasized generating renewable resources from agricultural waste for low carbon emissions. National 3R strategy for waste management refers to recycling, reduction, and reuse-based waste management policy to get renewable energy from natural resources and reduces the dependency on fossil fuels for energy generation [
10]. Excessive consumption of fossil fuels for energy production is also a threat to sustain the development and finding alternative energy resources such as biogas is necessary to resolve this issue [
11]. Biogas based electricity generation is also stated as only renewable energy production process which has the major GHG emissions reduction potential compared to others such as solar energy, hydro power and wind power [
12]. Hence, disposal and recycling of livestock manure to bioenergy is an important option to reduce the total waste amount at landfills along with to keep our environment safe and resource recovery [
11]. Livestock manure also causes pollution in water when applied to the soil or stored in open space for long time [
13,
14].
For developing biogas plants, identification of suitable locations is a primary step for the sustainable livestock manure management. GIS and AHP (analytical hierarchy process) analysis has been considered as a suitable approach for evaluating spatial distribution of livestock manure potentials for biogas production, identification of suitable locations for biogas plants and allocation of ingredients to selected plants [
15]. To enhance renewable energy production, the spatial modeling for sustainable biogas-based electricity generation was solved by this study.
However, many studies worked on manure management [
16,
17]; renewable energy from livestock waste with emissions mitigation strategies [
6,
18,
19,
20,
21]; biogas generation scenario from animal waste [
4,
8,
9,
22,
23]; GIS model for biogas plant using land suitability [
11,
24,
25], biogas plants siting based on allocation of feedstock sources or network analysis [
26,
27] etc. but the suitable locations identification for potential biogas plants by using both land suitability and location-allocation analysis is very less in the context of Bangladesh. This research focused on comprehensive GIS based scenarios for selecting locations of large-scale biogas plant which is very important for sustainable manure management in Bangladesh. Therefore, this study also estimated the environmental and socio-economic benefits of different scenarios from livestock manure.
2. Materials and Methods
A stepwise spatial analysis was made to get suitable locations for biogas plants. Firstly, spatial distribution of livestock manure and rice residue (straw) were performed. After that, land suitability was done through restriction and suitability analysis. From the final land suitability map, the high and moderate suitable parcels were exported to use in further scenarios analysis.
2.1. Data Sources and Processing
The number of different livestock reared; rice production at district level was collected from the statistical data of a survey by the department of livestock and agricultural extension of Bangladesh in 2023. Then district-wise data were converted into upazila-wise (subdistrict-wise) by collaborating the data of the district statistics of Bangladesh in 2019 [
28]. The data on electrification coverage was also converted and projected up to 2024 by considering the number of households using electricity in each upazila of district statistics. Prior to spatial analysis, the collected survey data was processed on spreadsheets to make shapefile data by using GIS (ArcMap 10.8) software. However, the shape file related to geological criteria (river and water resources, protected areas, wetland), physical criteria (road and railway network, airports, hospitals, important developed places) and social criteria (residential area, villages) were collected from ArcGIS online websites [
29]. To integrate the geological data with the collected database, all data sets were projected to a global datum WGS84 latitude and longitude. From this data integration, the livestock manure production spatial database was used to interpret the spatial analysis results. For environmental modeling, the equations and related data were collected from different literature which is mentioned in specific sections.
2.2. Theoretical Assessment
2.2.1. Livestock Manure Generation
The volume of manure from livestock differs according to animal type, feeding process, body size, breeding type [
30]. It is estimated that cattle and buffalo produce 10-22.5 kg/day while sheep and goat produce 1.6-2 kg/day, and poultry produces 0.08-0.1 kg/day manure [
8,
30,
31]. However, the amount of manure has been calculated based on 10%, 4% and 3% of body weight of large animals, small animals, and poultry respectively [
32,
33]. The average body weight accounted for livestock in Bangladesh were 190 kg (large animals), 20 kg (small animals) and 1.5 kg (poultry) [
34]. This study considered cattle and buffalo as large animal, sheep and goat as small animal, chicken and duck as poultry because of these six species are the major livestock species raised in the country [
2]. So, the estimated manure per day was 19 kg, 0.8 kg and 0.045 kg for large animals, small animals, and poultry accordingly. Though it is not possible to collect all manure so, the availability coefficient was factored when measuring total biogas potentiality from livestock manure. The availability coefficient is assumed 50%, 13%, and 90% for a large animal, small animal, and poultry, respectively [
30,
33]. The available manure for all upazilas was estimated by considering the number and types of livestock in each upazila of Bangladesh. To generate a uniform spatial distribution, the available livestock manure intensity was calculated by dividing the available manure with the area of that upazila.
2.2.2. Rice Residues Generation
The available rice residues were calculated by using the equations (1) which is modified from [
35]:
where, Ac is available crop residue; P is annual crop production; Yc is residue to crop yield mass ratio; Cc is residue collection factor; Dc is residue dryness factor and Sc is Surplus residue factor. The factors used were Yc (1.5), Cc (0.6), Dc (0.873) and Sc (0.5) for the estimation of rice straw production by this study [
36,
37,
38].
2.2.3. Biogas Production
Diverse factors such as animal size, body weight, total solids (TS) percentage, and availability influence the total biogas production from animal wastes [
30]. TS is a significant factor in animal waste biogas production and the distribution of TS in manure is 25-30% for large animals, 18-25% for small animals and 10-29% for poultry [
30,
33]. Again, the biogas yield based on TS also varied according to the animal types and it is estimated that biogas yield is 0.5-0.8 m
3 kg
-1 TS (large animals), 0.3-0.4 m
3 kg
-1 TS (small animals) and 0.3-0.8 m
3 kg
-1 TS (poultry) [
8,
9,
30,
33,
39]. All values for different factors which are used to calculate biogas potential in this study are shown in
Table 1. The equation (2) was used to estimate the potential of biogas production [
18,
19,
32].
2.2.4. Electricity Generation from Biogas
The study estimated electricity generation from biogas by using Equation (3) [
32].
Here, η represents the efficiency percentage of biogas to electricity conversion. Power generation plant types can influence the variation of efficiency value and the η value varies from 35 to 42% (large turbine system) and 25% (small generators) [
32,
40]. This study assumed η value as 25%. Energy content in biogas was computed as 6 kWh m
− 3 (based on 21.8 MJ/m
3 biogas calorific value and 1 kWh = 3.6 MJ) [
32,
41].
2.2.5. Biofertilizer Production Potential
Biogas and biofertilizer are the two main products of biogas technology. Biofertilizer potential was calculated by using Equation (4) [
39,
42].
where DM = Dry mass is the solid component of organic waste while VS = Volatile solid is the portion of dry mass that can be converted to gas. The percentage of DM in manure are 25%, 18% and 10% whereas the VS are 80%, 80% and 70% of DM for large animals, small animals, and poultry respectively [
43].
2.3. Land Suitability Analysis
This study processed land suitability analysis through restriction and suitability modelling to select suitable parcels from different geo-databases for sitting biogas plants by using the Equation (5):
where,
Wii = Weights for Criteria
i
Ci = Criteria for Suitability
(i includes road distance, river distance and elevation)
Rj = Restricted Areas
(j include transport networks, surface water, protected area, residential area, important places and vulnerable area)
Here, the Boolean intersection procedure was used in the restriction model (
and restriction criteria were classified into Boolean suitable or unsuitable images in restriction map whereas the AHP was applied to get the factors for relative importance weights in the weighted suitability model
. The AHP was employed to estimate appropriate weights to the preference factors based on their relative importance which systematically combines qualitative and quantitative criteria for multi-criteria complex decisions [
44].
2.3.1. Restriction Modeling
The restriction modeling was designed to find out the restricted area including both natural and artificial areas that should be conserved. The technically and legally restricted or unsuitable areas were excluded for the development of biogas plants. The restricted areas, including the buffered regions, cannot be used for further development, many of which are protected by laws and rules. In Bangladesh, the use of natural areas and protected zones are restricted by the Forest Act, 1927 which mentioned the reserve forests, protective forests and village forests to be conserved. ‘Bangladesh Wild Life (Preservation) Act, 1974’ desires the preservation of protected areas for providing wildlife safety zone, ‘Natural Water Bodies Protection Act, 2000’ clarifies the character of different types of water bodies such as rivers, canals or floodplains and states that their natural characteristics shall not be changed [
45,
46]. The developed areas, for example, roads and rail networks, settlements, airports, helipads etc. are not possible to use for further development and it is necessary to maintain a minimum distance from those developed areas. The buffer area for different restriction criteria used in different articles for biogas and other types of waste disposal sites and the buffer areas considered by this study are given in
Table 2. All buffered restricted criteria were made union with the study area and after that features were changed to raster file. Finally cons of geological processing tools in GIS software was applied to get restriction map where a binary GIS grid was created for each constraint feature, with cells falling within a constrained area assigned “0’ and cells falling outside the buffer area assigned “1’ [
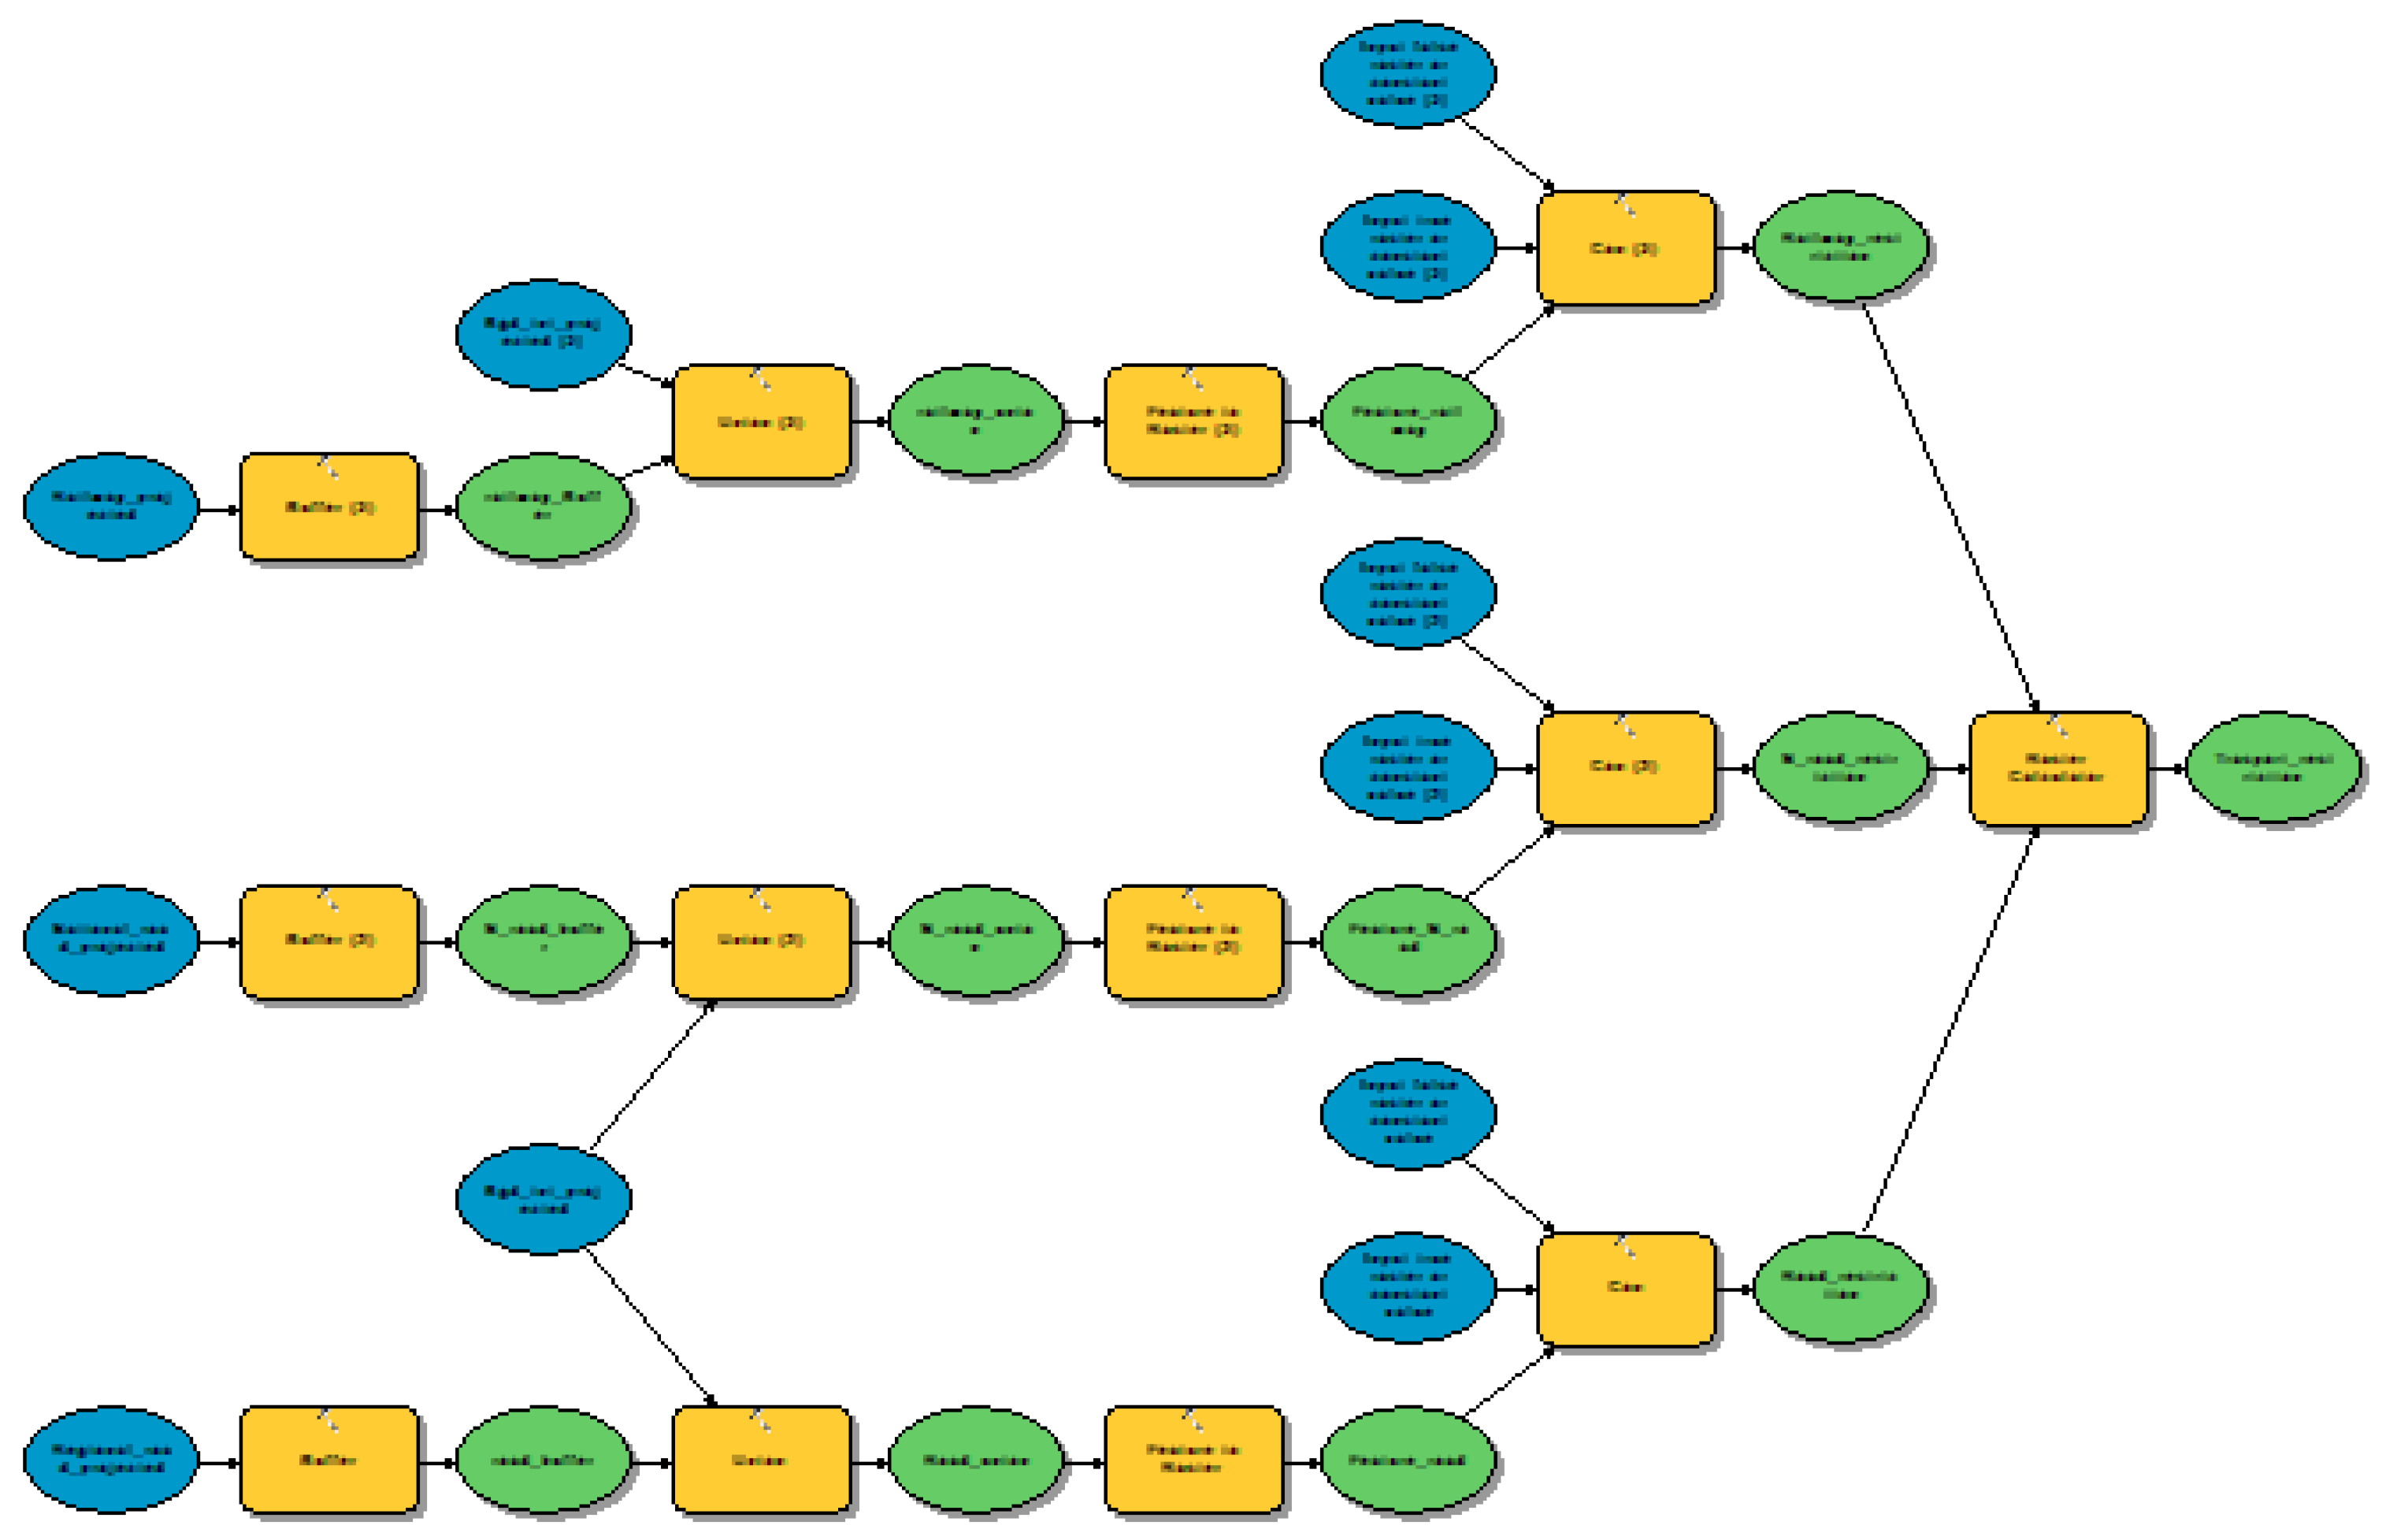
24]. The restriction model is given in
Figure A1. In restriction mapping all the restricted layers of different factors were multiplied to get final restriction map.
2.3.2. Suitability Modeling
Many factors have effects in the selection of biogas plant locations, but it is not possible to evaluate all of them due to the data availability. For suitability modeling in this study, three criteria (road distance, flood prone area and elevation) were reclassified into four categories (highly suitable, moderately suitable, low suitable, not suitable) according to their appropriateness in case of new plants construction (
Table 3). For road network, it is easy to determine whether the places are better which are closer to the road due to the transport facility. The Euclidean distance of road network was used instead of real road network in suitability modeling. In case of flood prone area, preferences are given to not or less flood prone area. The slope is not even throughout the country. However, hilly high lands and very low land near the sea are not suitable for biogas and other types of waste disposal plants. For this reason, the elevation feature was reclassified based on efficient and low-cost residue collection facilities all over the country. However, the importance of all criteria is not equal for site identification. To determine the comparative weights of each criteria reflecting their relative importance, this study considered principles such as collection efficiency, safety and cost minimization. AHP is made up of four major steps: (1) breakdown of a specific issue into some sub-problems or issues, features, and elements; (2) pair-wise comparison of specific elements in a pre-defined mathematical scale; (3) evaluating the consistency of the values given during comparison and (4) calculating the results to obtain a final ranking [
53]. AHP is used to determine the values for different criteria of any comparative analysis where consistency ratio (CR) is important. If CR is less than 0.10 then it signifies a strong consistency of the weights recommended by [
44]. The CR values for different suitability criteria were estimated (0.0565, 0.0107, 0.0563) by this study which is less than 0.10 (detailed calculations are shown in
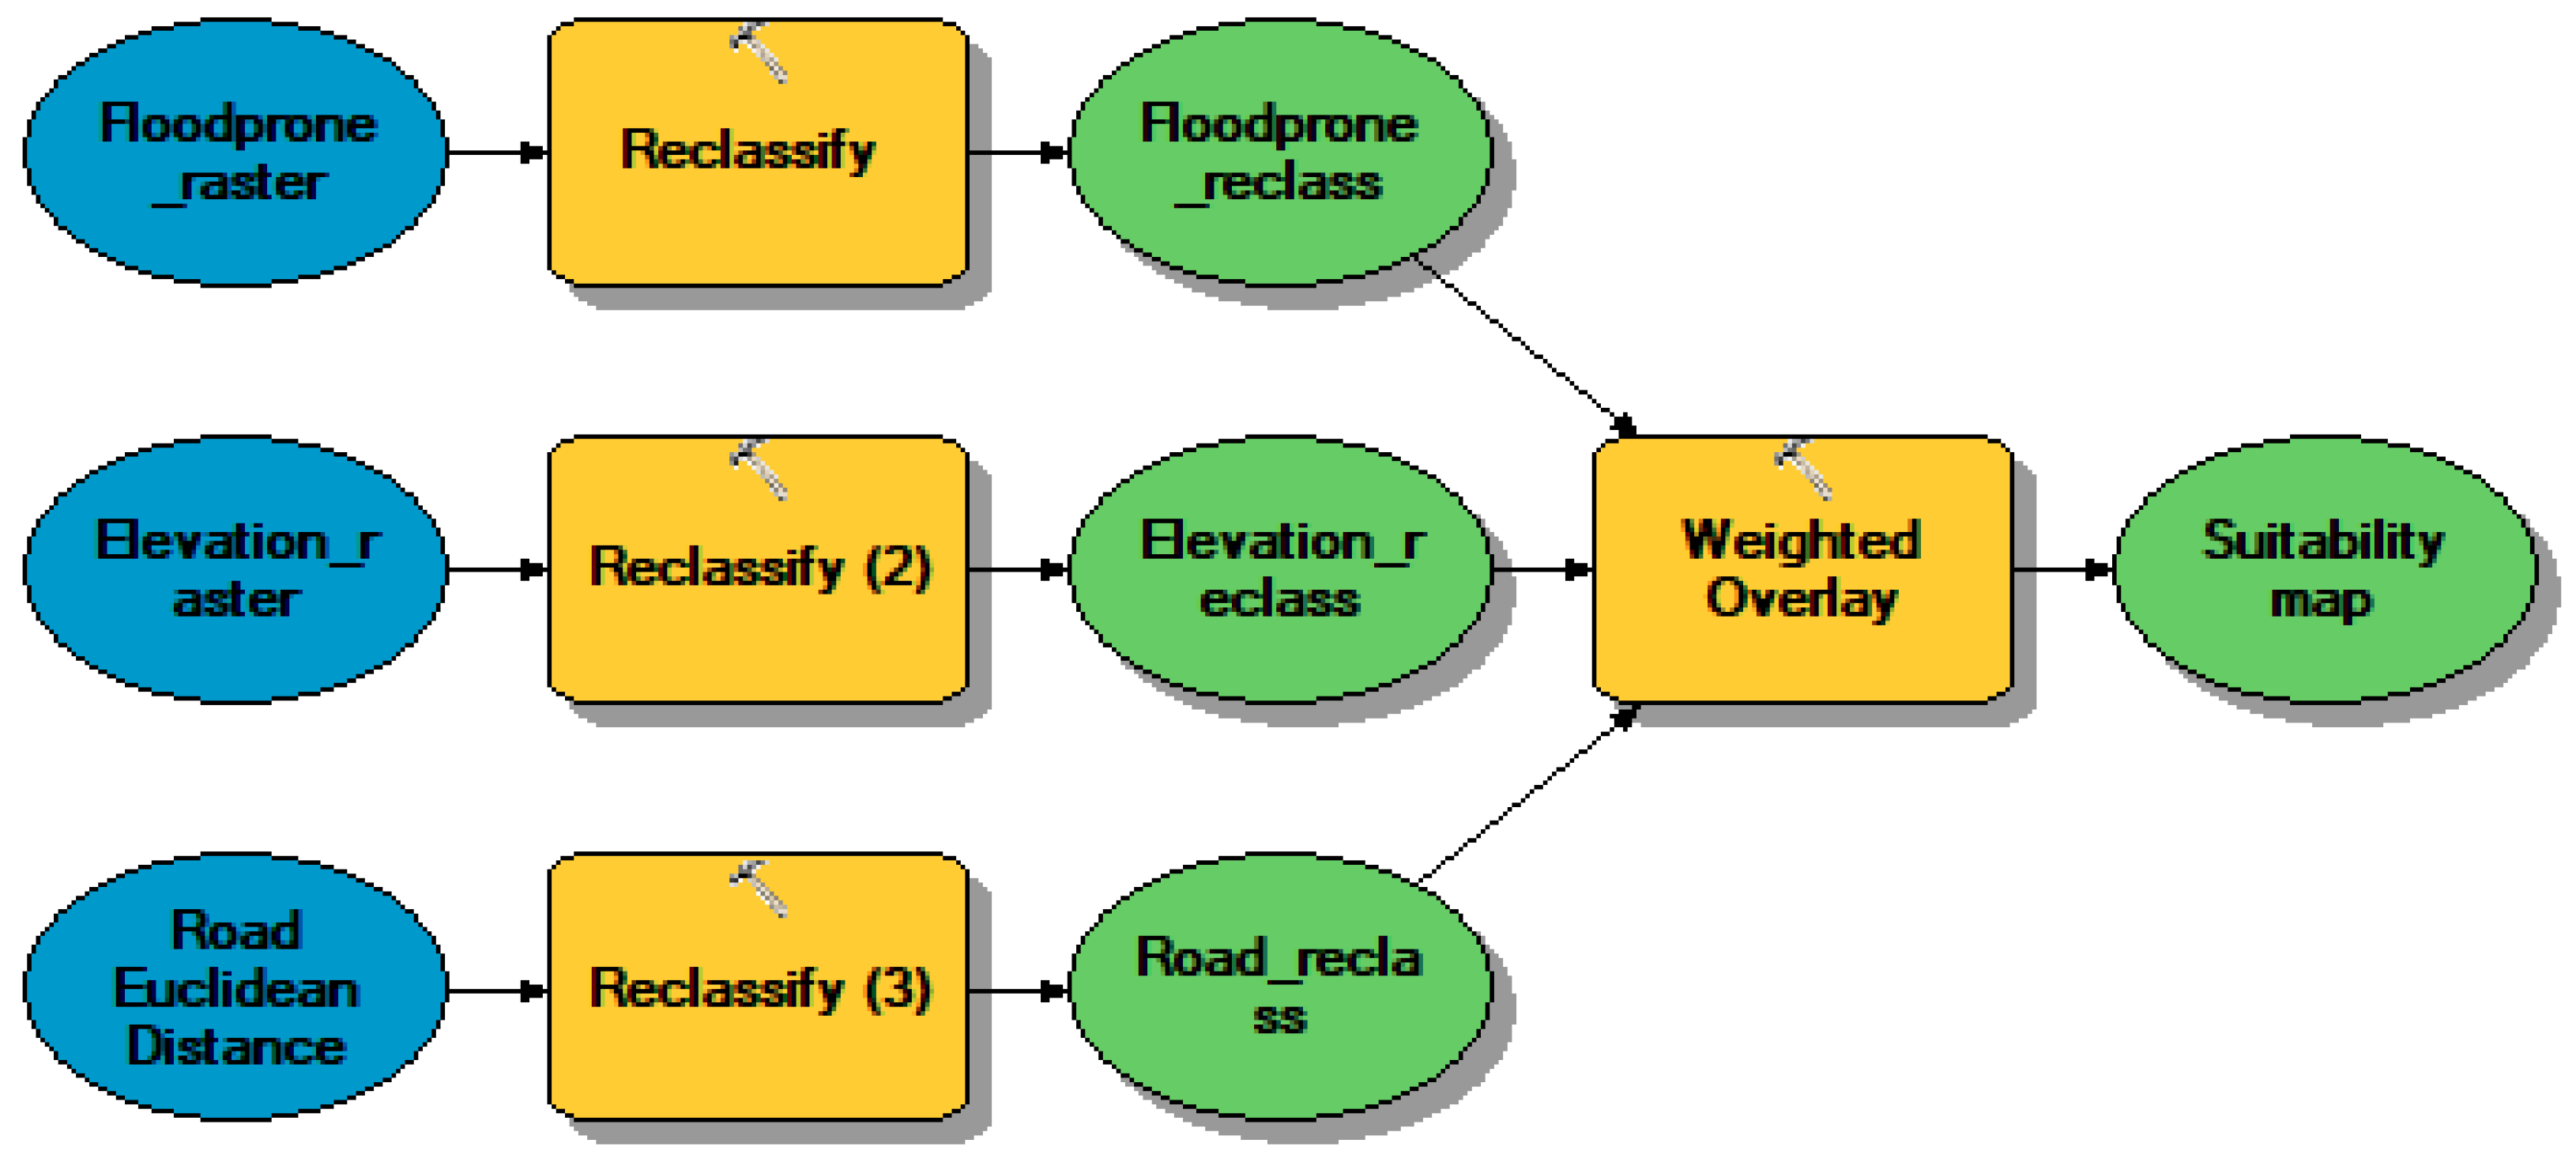
Table A1-A3). After that the final weighted preferences were calculated and used to design the suitability map using reclassify and weighted overlay tools of GIS software. All the comprehensive weights of three criteria with their final weights are given in
Table 4. The suitability model is shown in
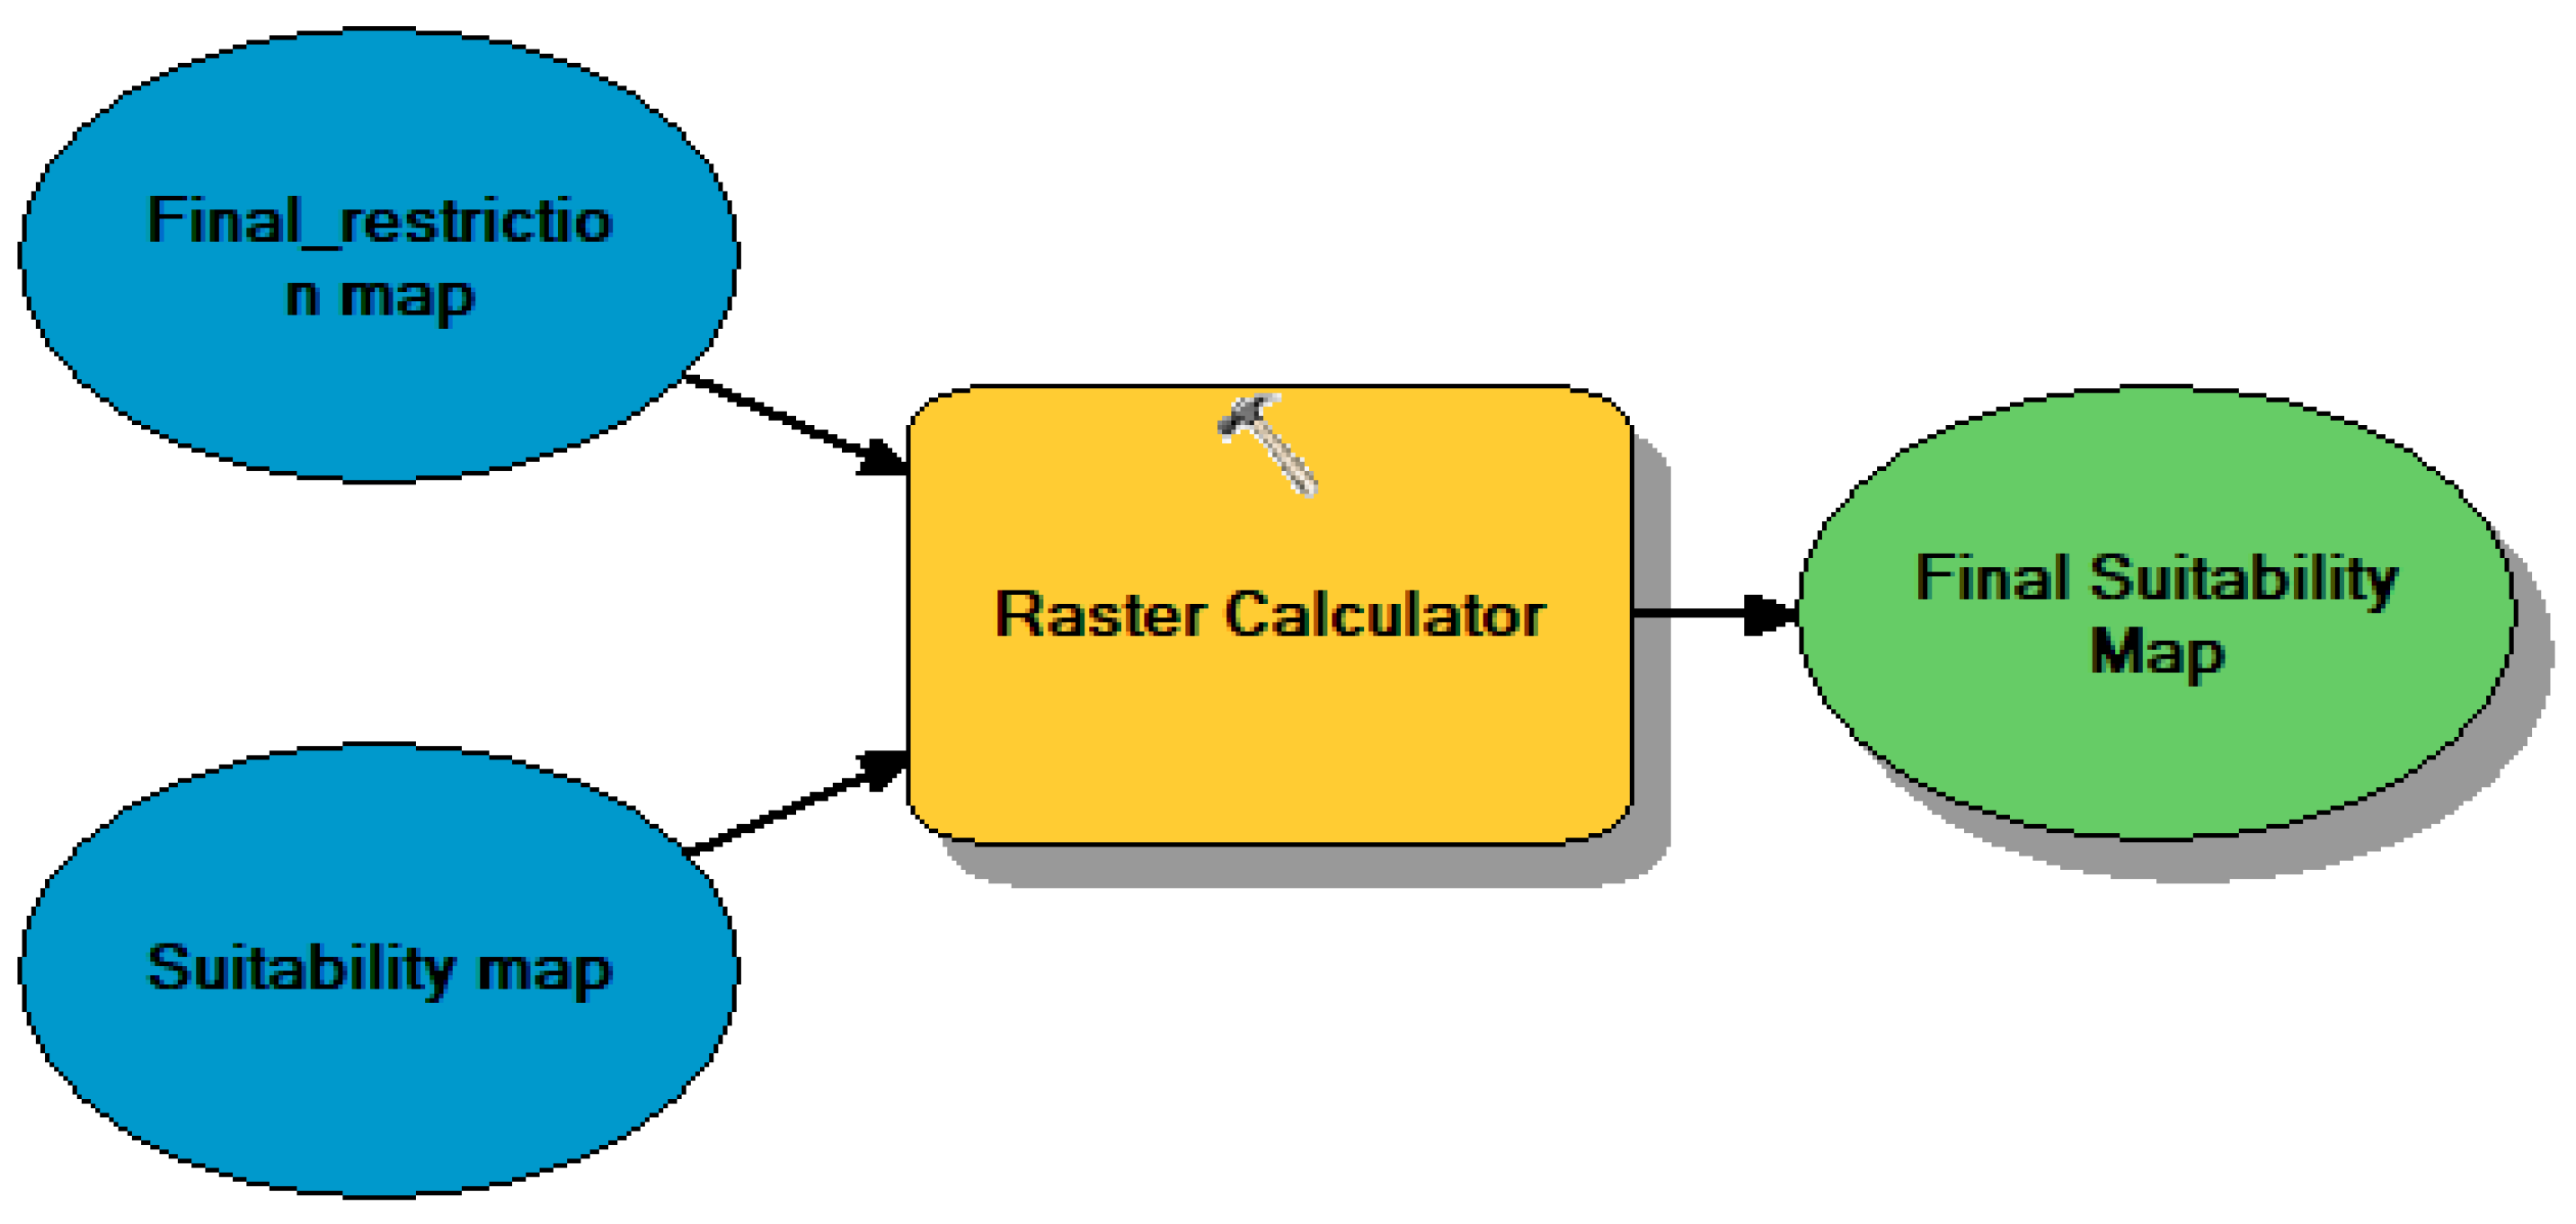
Figure A2. The final suitability map was formed by multiplying restrictions and suitability map by using a raster calculator of GIS software (
Figure A3).
2.4. Scenario Analysis
Three scenarios were anticipated for biogas production according to the types of livestock manure and plant capacity such as large animals (2 MW), small animals (1 MW) and poultry (1.5 MW) and explored through spatial and network analysis consecutively.
2.4.1. Spatial Analysis
For biogas production, carbon nitrogen ratio (C:N) is very important factor [
54,
55,
56]. Manure is a rich source of nitrogen, but the percentage of carbon content is comparatively low. Rice straw was considered as carbon source for biogas production as rice is the main crop produced in Bangladesh and are cultivated widely throughout the country [
57]. The optimum range of C:N for biogas is 20–30:1 [
58]. However, the C:N ratio ranges as 18-20:1 for large animal manure, 16-18:1 for small animal manure, 6-7:1 for poultry manure and 80-120:1 for rice straw respectively [
59,
60]. This study assumed that the C:N ratio for biogas production was 30:1. Depending on the lower values of C:N in manure and rice straw, the co-digestion ratio was considered as 4:1 for large and small animal manure and rice straw whereas 2:1 for poultry manure and rice straw to analyze by this study. The average intensity of large animal manure, small animal manure, poultry manure and rice straw were found as 542-676, 6-8, 31-53 and 162-216 ton/km
2 in 2023 respectively. This study selected the upazilas which have more than 500, 6, 30 and 150 ton/km
2 large animal manure, small animal, poultry manure and rice straw intensity respectively as the primary upazilas which were coupled with electricity coverage of the upazilas (less than 75% electrification coverage) for optimizing the locations of biogas plants.
The factors such as potential power plant capacity, required area for plant installation and the operating days in a year were determined to secure optimum biogas generation from plants. This study assumed that 2 MW (megawatt), 1 MW and 1.5 MW power plant’s operations were performed continuously for 24 hours for 300 days in a year for biogas production from large, small and poultry manure separately. Thus, a 2 MW, 1 MW and 1.5 MW power plants can produce 48, 24, and 36 MWh electricity per day correspondingly. To get the optimum number of large-scale biogas plants, total electricity generation (in MWh/day) potentiality was estimated from total available manure generation in primarily selected upazilas which was divided by plant capacity (48 or 24 or 36 MWh/day).
The available suitable parcels found from suitability analysis should have a minimum required area for plant development. A study states that the minimum area required to construct a 200 kW, 500 kW plants and 1 MW biogas plant are 1 ha, 1.5 ha and 2.5 ha respectively [
50]. As suitable parcels from land suitability analysis have more than 2.5 ha area, all of them have the possibility to develop biogas plants. But for more clarification, this study considered suitable parcels more than 5 ha area as potential sites for biogas plants.
2.4.2. Network Analysis
Network analysis gives the exact location based on the set criteria. In this study, location-allocation tool of network analysis was used to finalize the chosen sites for biogas plants among many candidate places to maximize collection efficiency for cost effectiveness within the shortest routes. In addition, it was also used to select the optimum locations considering the manure and rice straw availability within a specific range of transportation network in different scenarios. It helps to choose specific facilities having required characteristics from a few different facilities based on their preferred interaction with demand locations [
61]. The existing shape file of road network was used to create a network dataset using ArcGIS network analyst extension tools. The required facilities (Chosen sites for biogas plants) were selected from all the locations of demand point (manure and rice straw sources) by maximum coverage within 10 km distance.
2.5. Environmental Modeling
2.5.1. GHG Emissions from AD System During Biogas Production
There are no noticeable levels of methane (CH
4) and nitrous oxide (N
2O) production in biogas-based power generation plants [
62], hence, the estimation of them is not necessary [
63]. However, the bioreactor can suffer some leakages of CH
4 as such this study presumed a 5% leakage of CH
4 from biodigester [
64]. Equation (6) was used to estimate the GHG emissions because of methane leakages [
9,
21,
64].
The CH
4 contents in biogas derived from large livestock, small livestock, and poultry manure were estimated between 50-70%, 40–50% and 50–70% respectively [
32,
65,
66]. The study considered CH
4 value as 60%, 45% and 60% of biogas for large animal, small animal and poultry manure respectively. The equivalent of CH
4 can be estimated using Equation (7) [
8,
64].
2.5.2. Avoided Emissions for Biogas by Replacing Natural Gas
For the GHG emissions reduction potential of biogas, it was compared with the effects of fossil fuels (natural gas). Economic review states that maximum electricity generation in 2023 in Bangladesh was from natural gas-based generation (about 50.32% of the total grid generation) [
57]. Equation (8) [
31,
64] can be used to estimate the CO
2eq emission reduction by replacing natural gas with biogas.
Where, the SEF for natural gas is 2.75 kg CO
2/liter [
64] and natural gas contained 90% CH
4 [68,69], the quantity of natural gas equivalent to methane in liters was in the ratio of 1:1.11. The quantity of natural gas equivalent to CH
4 in liters = total amount of CH
4 in biogas × equivalent factor (1.11). Net GHG emissions reduction is calculated by using Equation (9).
3. Results
3.1. Spatial Distribution of Manure and Rice Residue
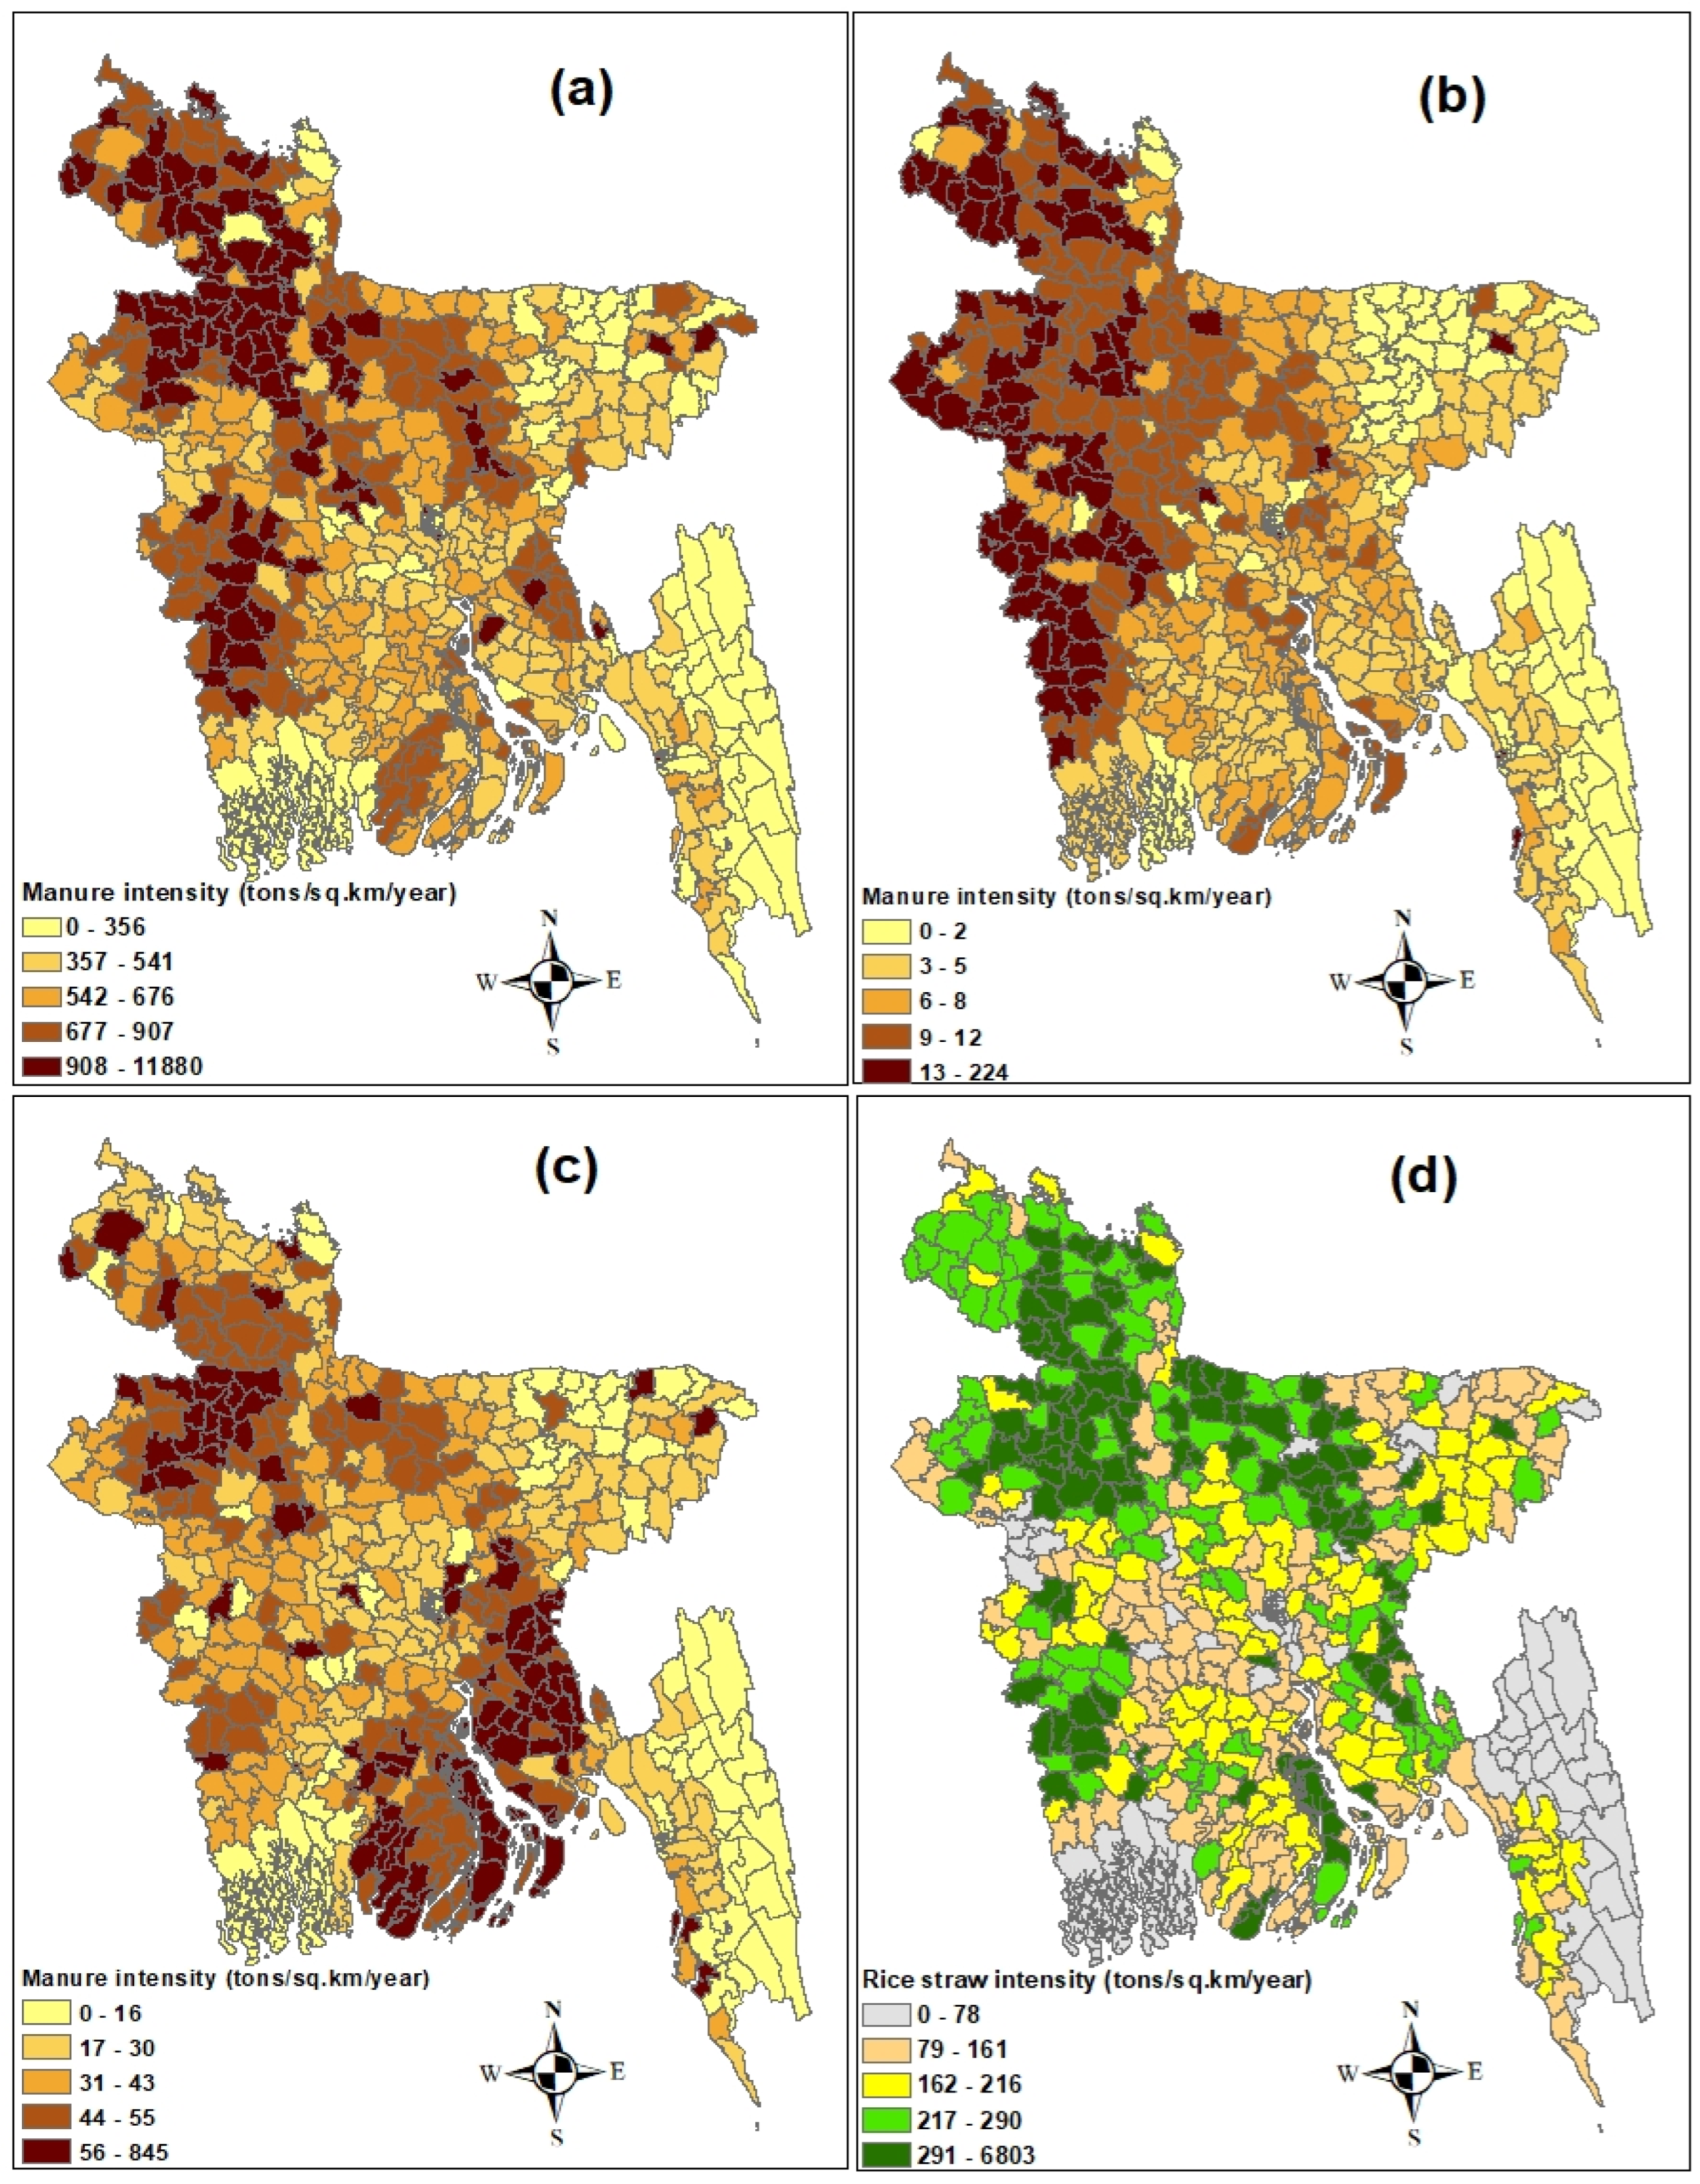
The spatial distribution of manure and rice residue in 2023 was presented by spatial analysis at the upazila level of Bangladesh (
Figure 1). The upazilas were classified into five categories with an equal interval range based on the maximum and minimum value of manure and rice straw production. Manure and rice residue generation both had a wide range of intensities such as 0-11,880; 0-224; 0-845 and 0-6803 ton/km
2 for large animal manure, small animal manure, poultry manure and rice straw respectively. Some of the upazilas, especially the sadar upazilas of each district, have zero livestock and rice production where some upazilas have a very high concentration of livestock population. For large animals, manure intensity is greater in the northern part of the country where the western part has very high concentration due to small animal manure intensity compared to the rest of the area. Mymensingh, Dhaka and Barisal division are comparatively high in manure intensity from poultry sector.
3.2. Suitable Areas for Biogas Plants
3.2.1. Restriction and Suitability Maps
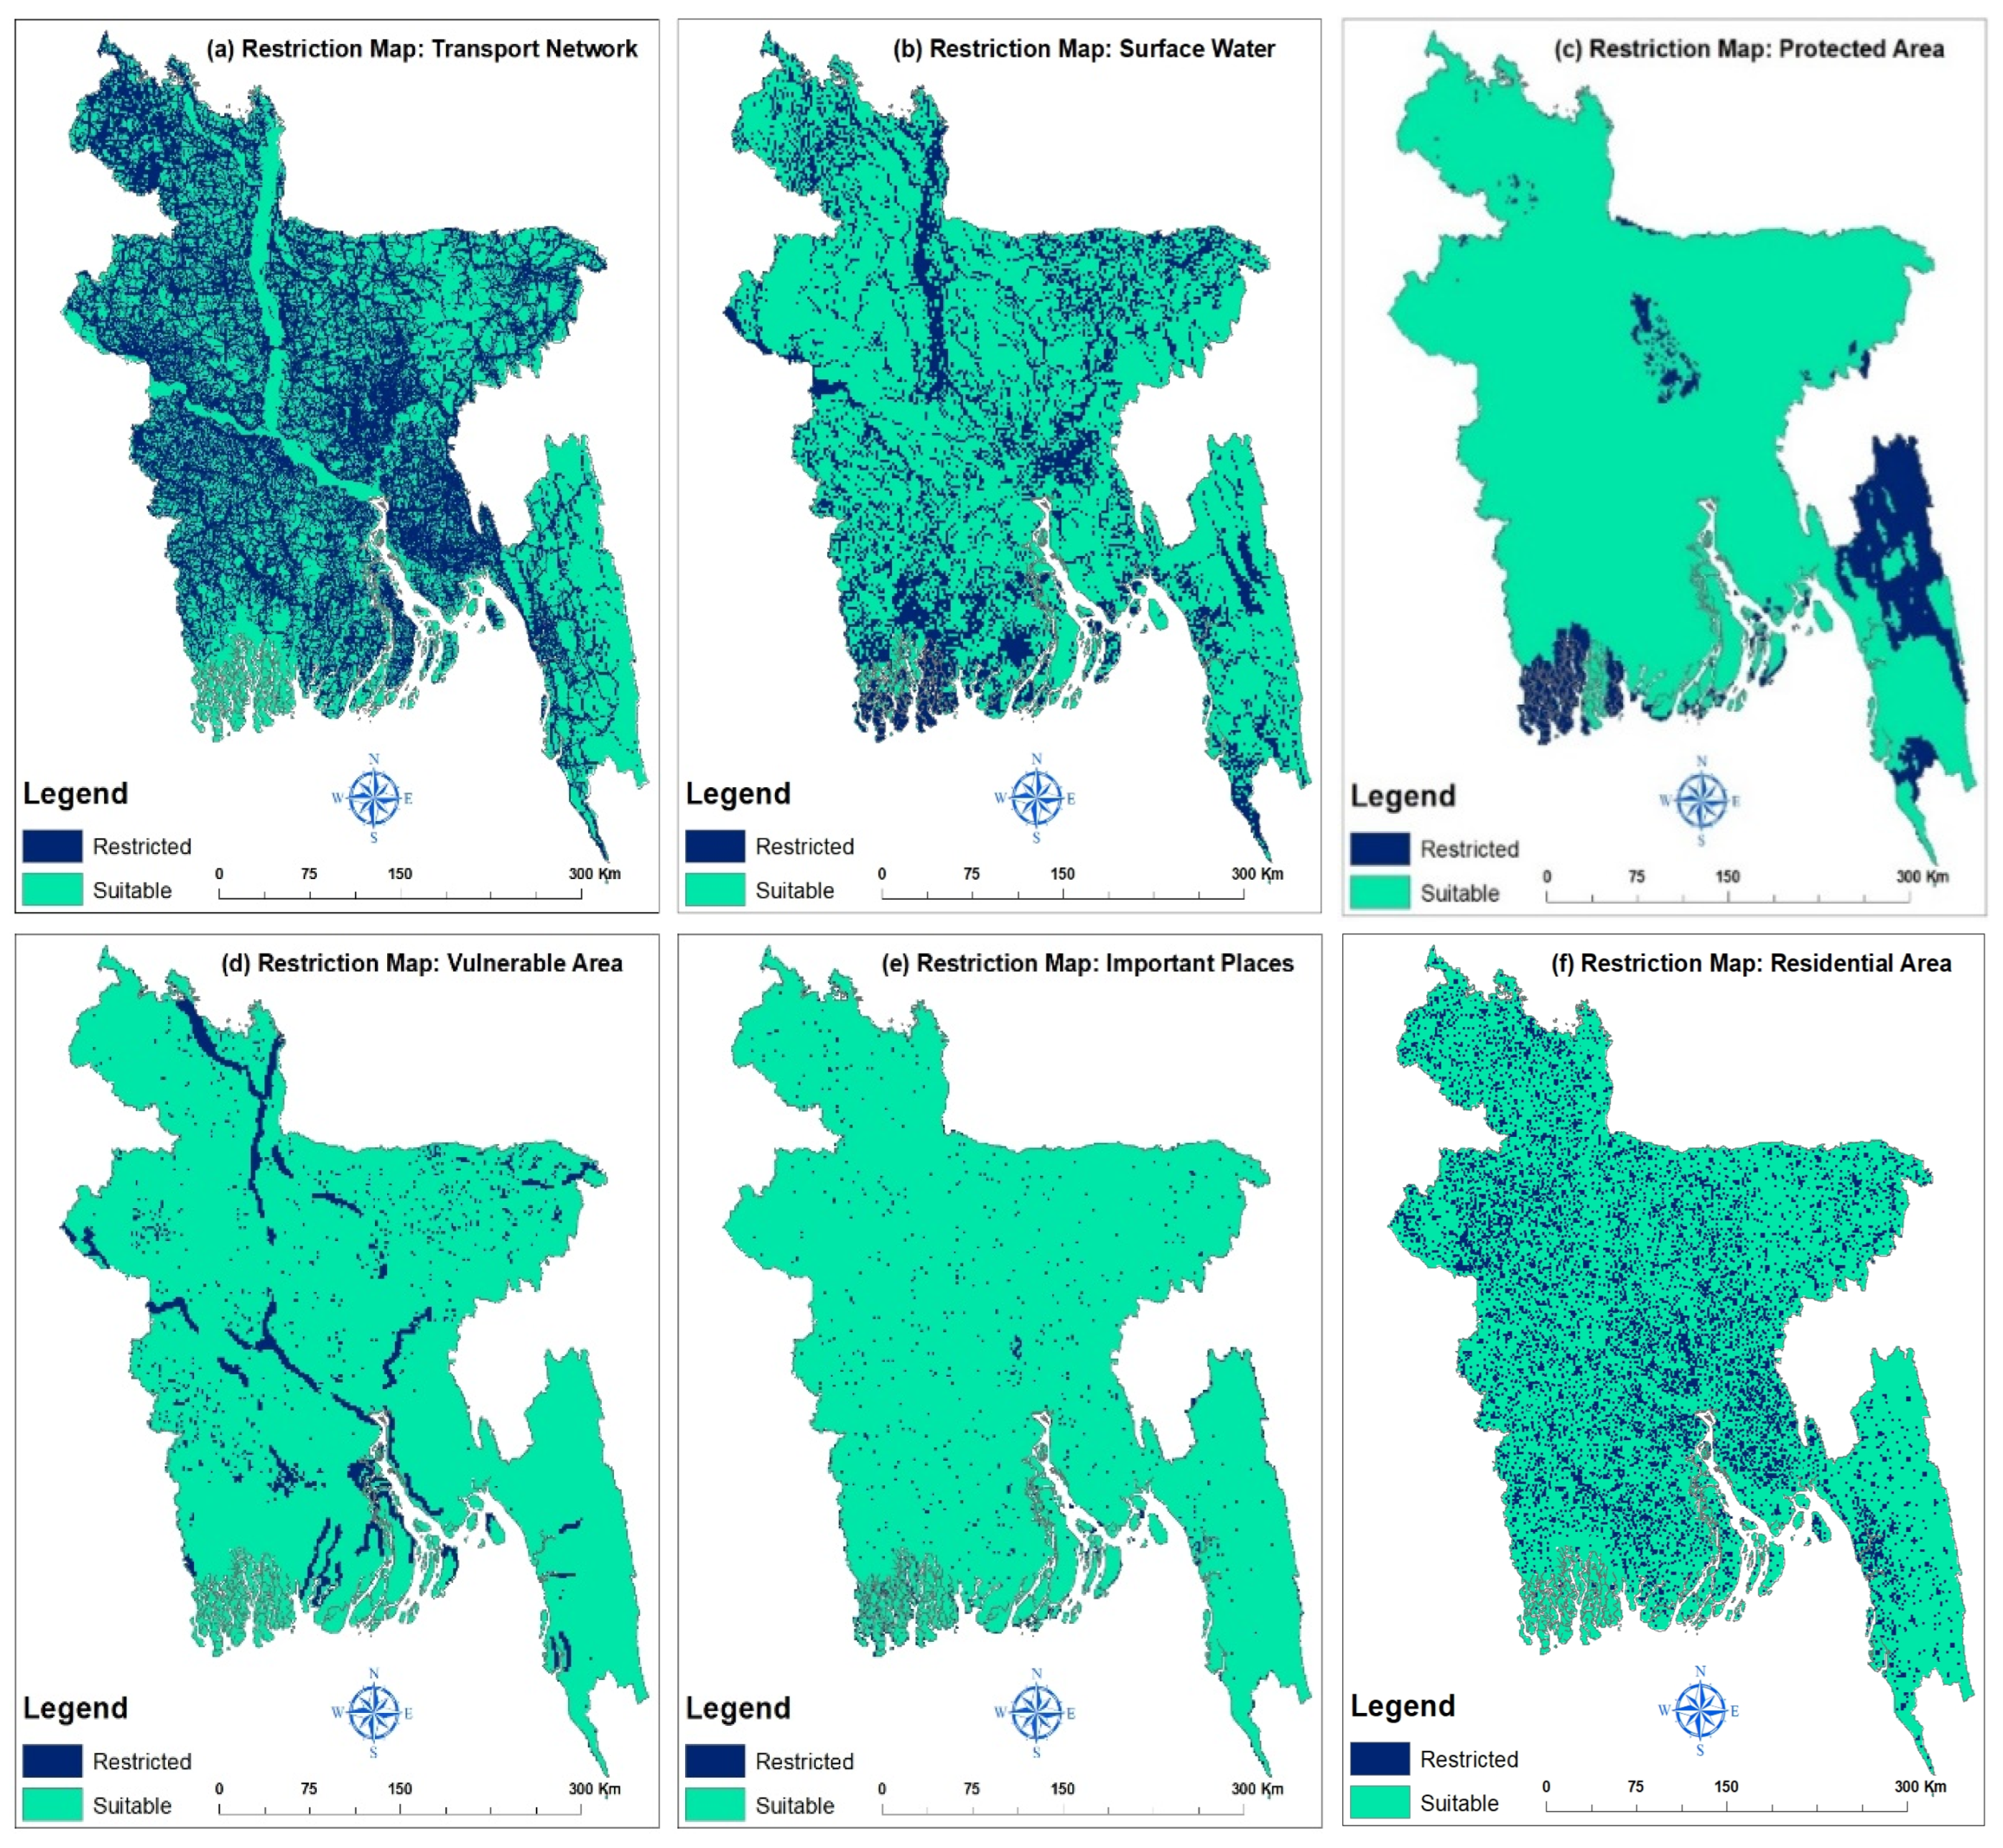
A restriction model was performed to ensure that any restricted area should not be included in the final suitability map. Six restricted features (transport network, surface water, protected area, vulnerable area, important places, and residential area) including their buffer areas were excluded from the country map. The maps for different restricted criteria are shown in
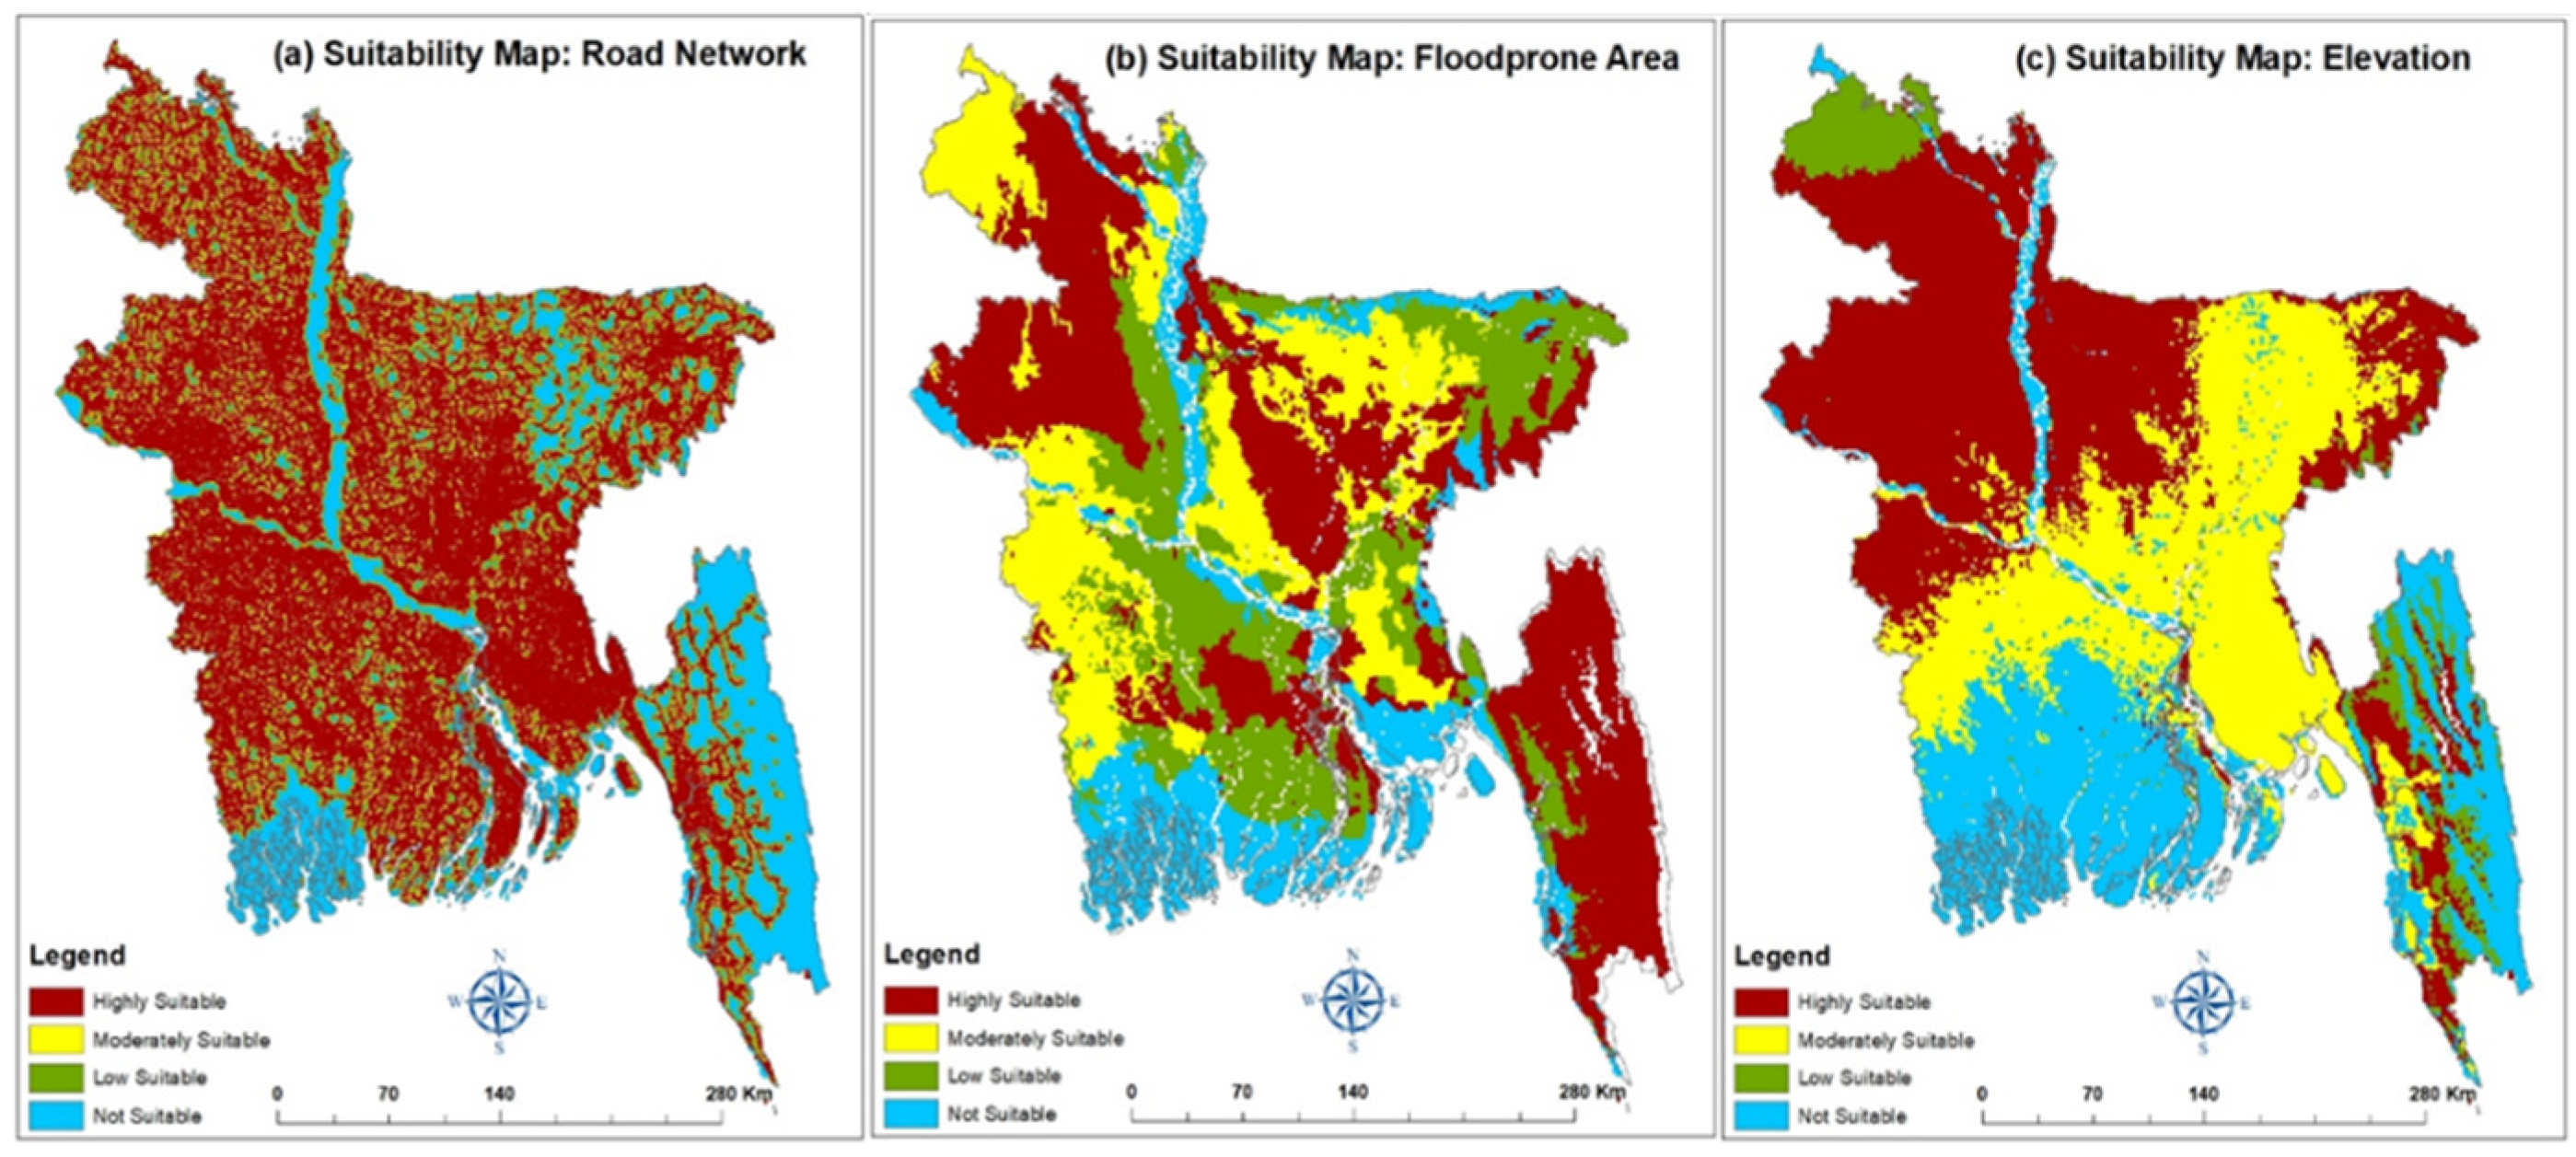
Figure 2. Suitability analysis commenced on the suitability of three features: road distance, flood prone area and elevation of the country. The separate suitability maps for these features are shown in
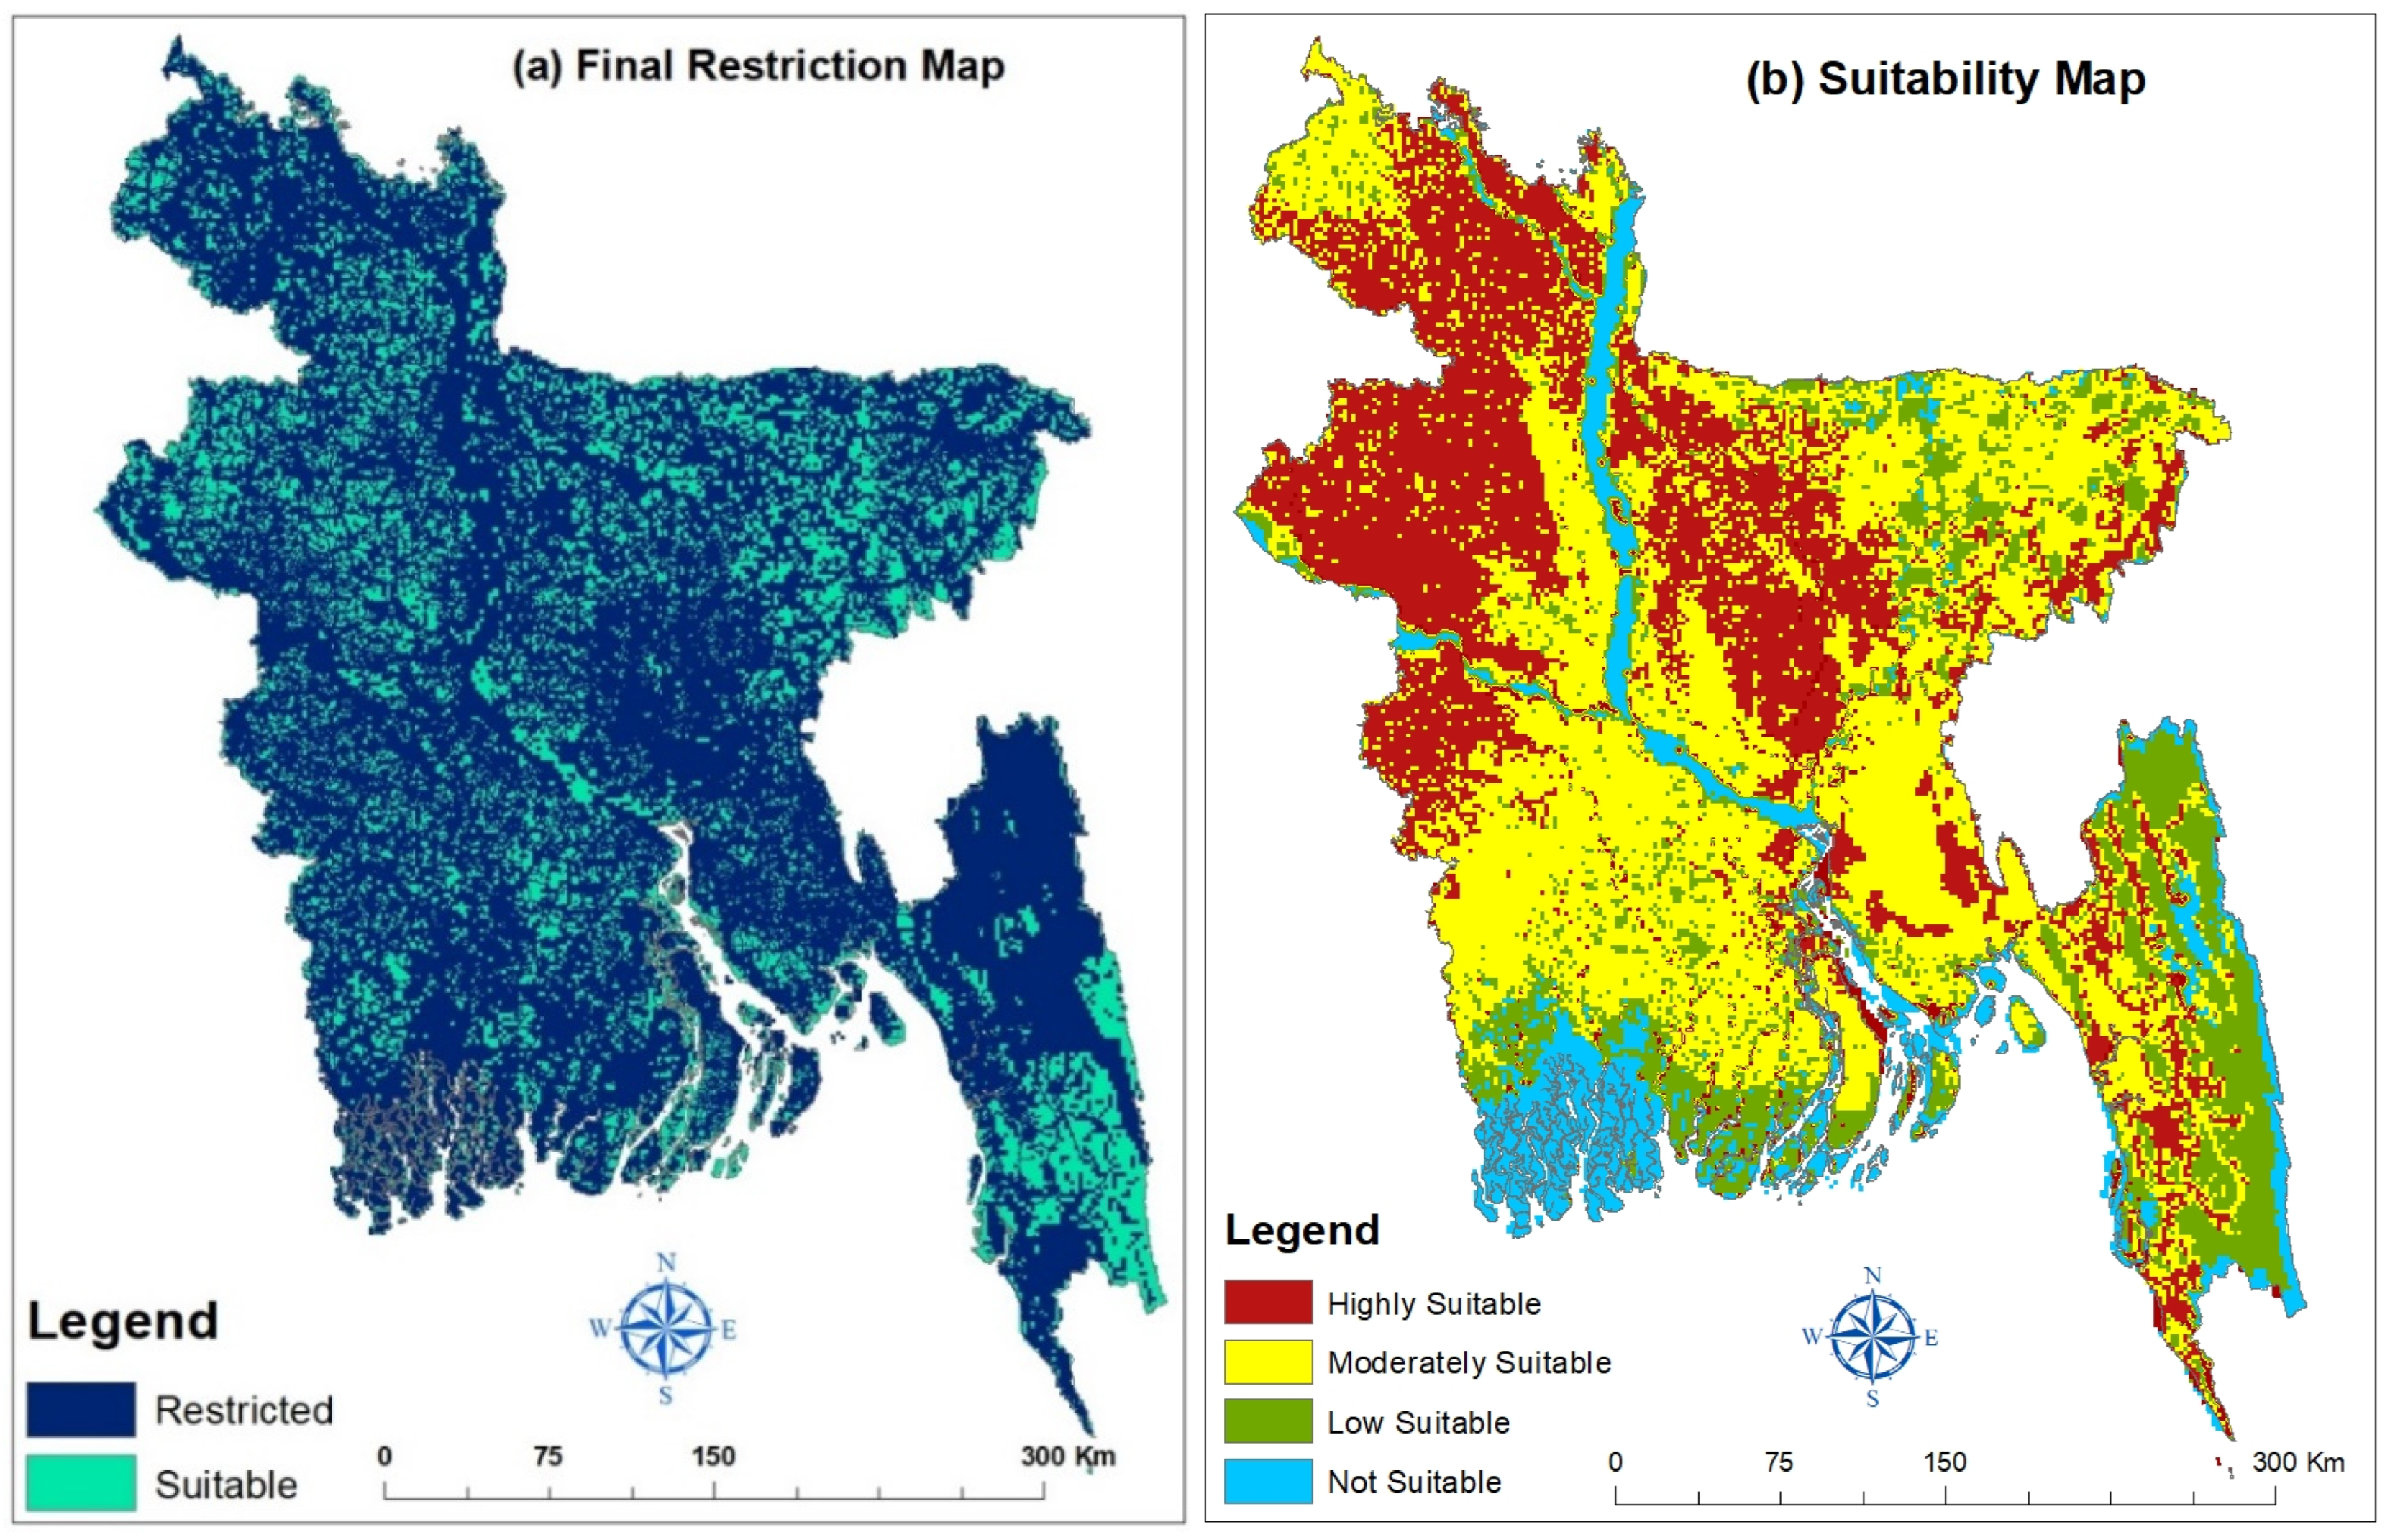
Figure 3. The six restriction criteria were multiplied to get the final restriction map where blue colored areas indicated as restricted and green colored areas were counted as suitable for further development (
Figure 4a). After that three suitability criteria were multiplied to get suitability map where the red, yellow, green and light blue colors are used to identify the highly, moderate, low and not suitable areas respectively. by using AHP model (
Figure 4b).
3.2.2. Final Suitability Maps
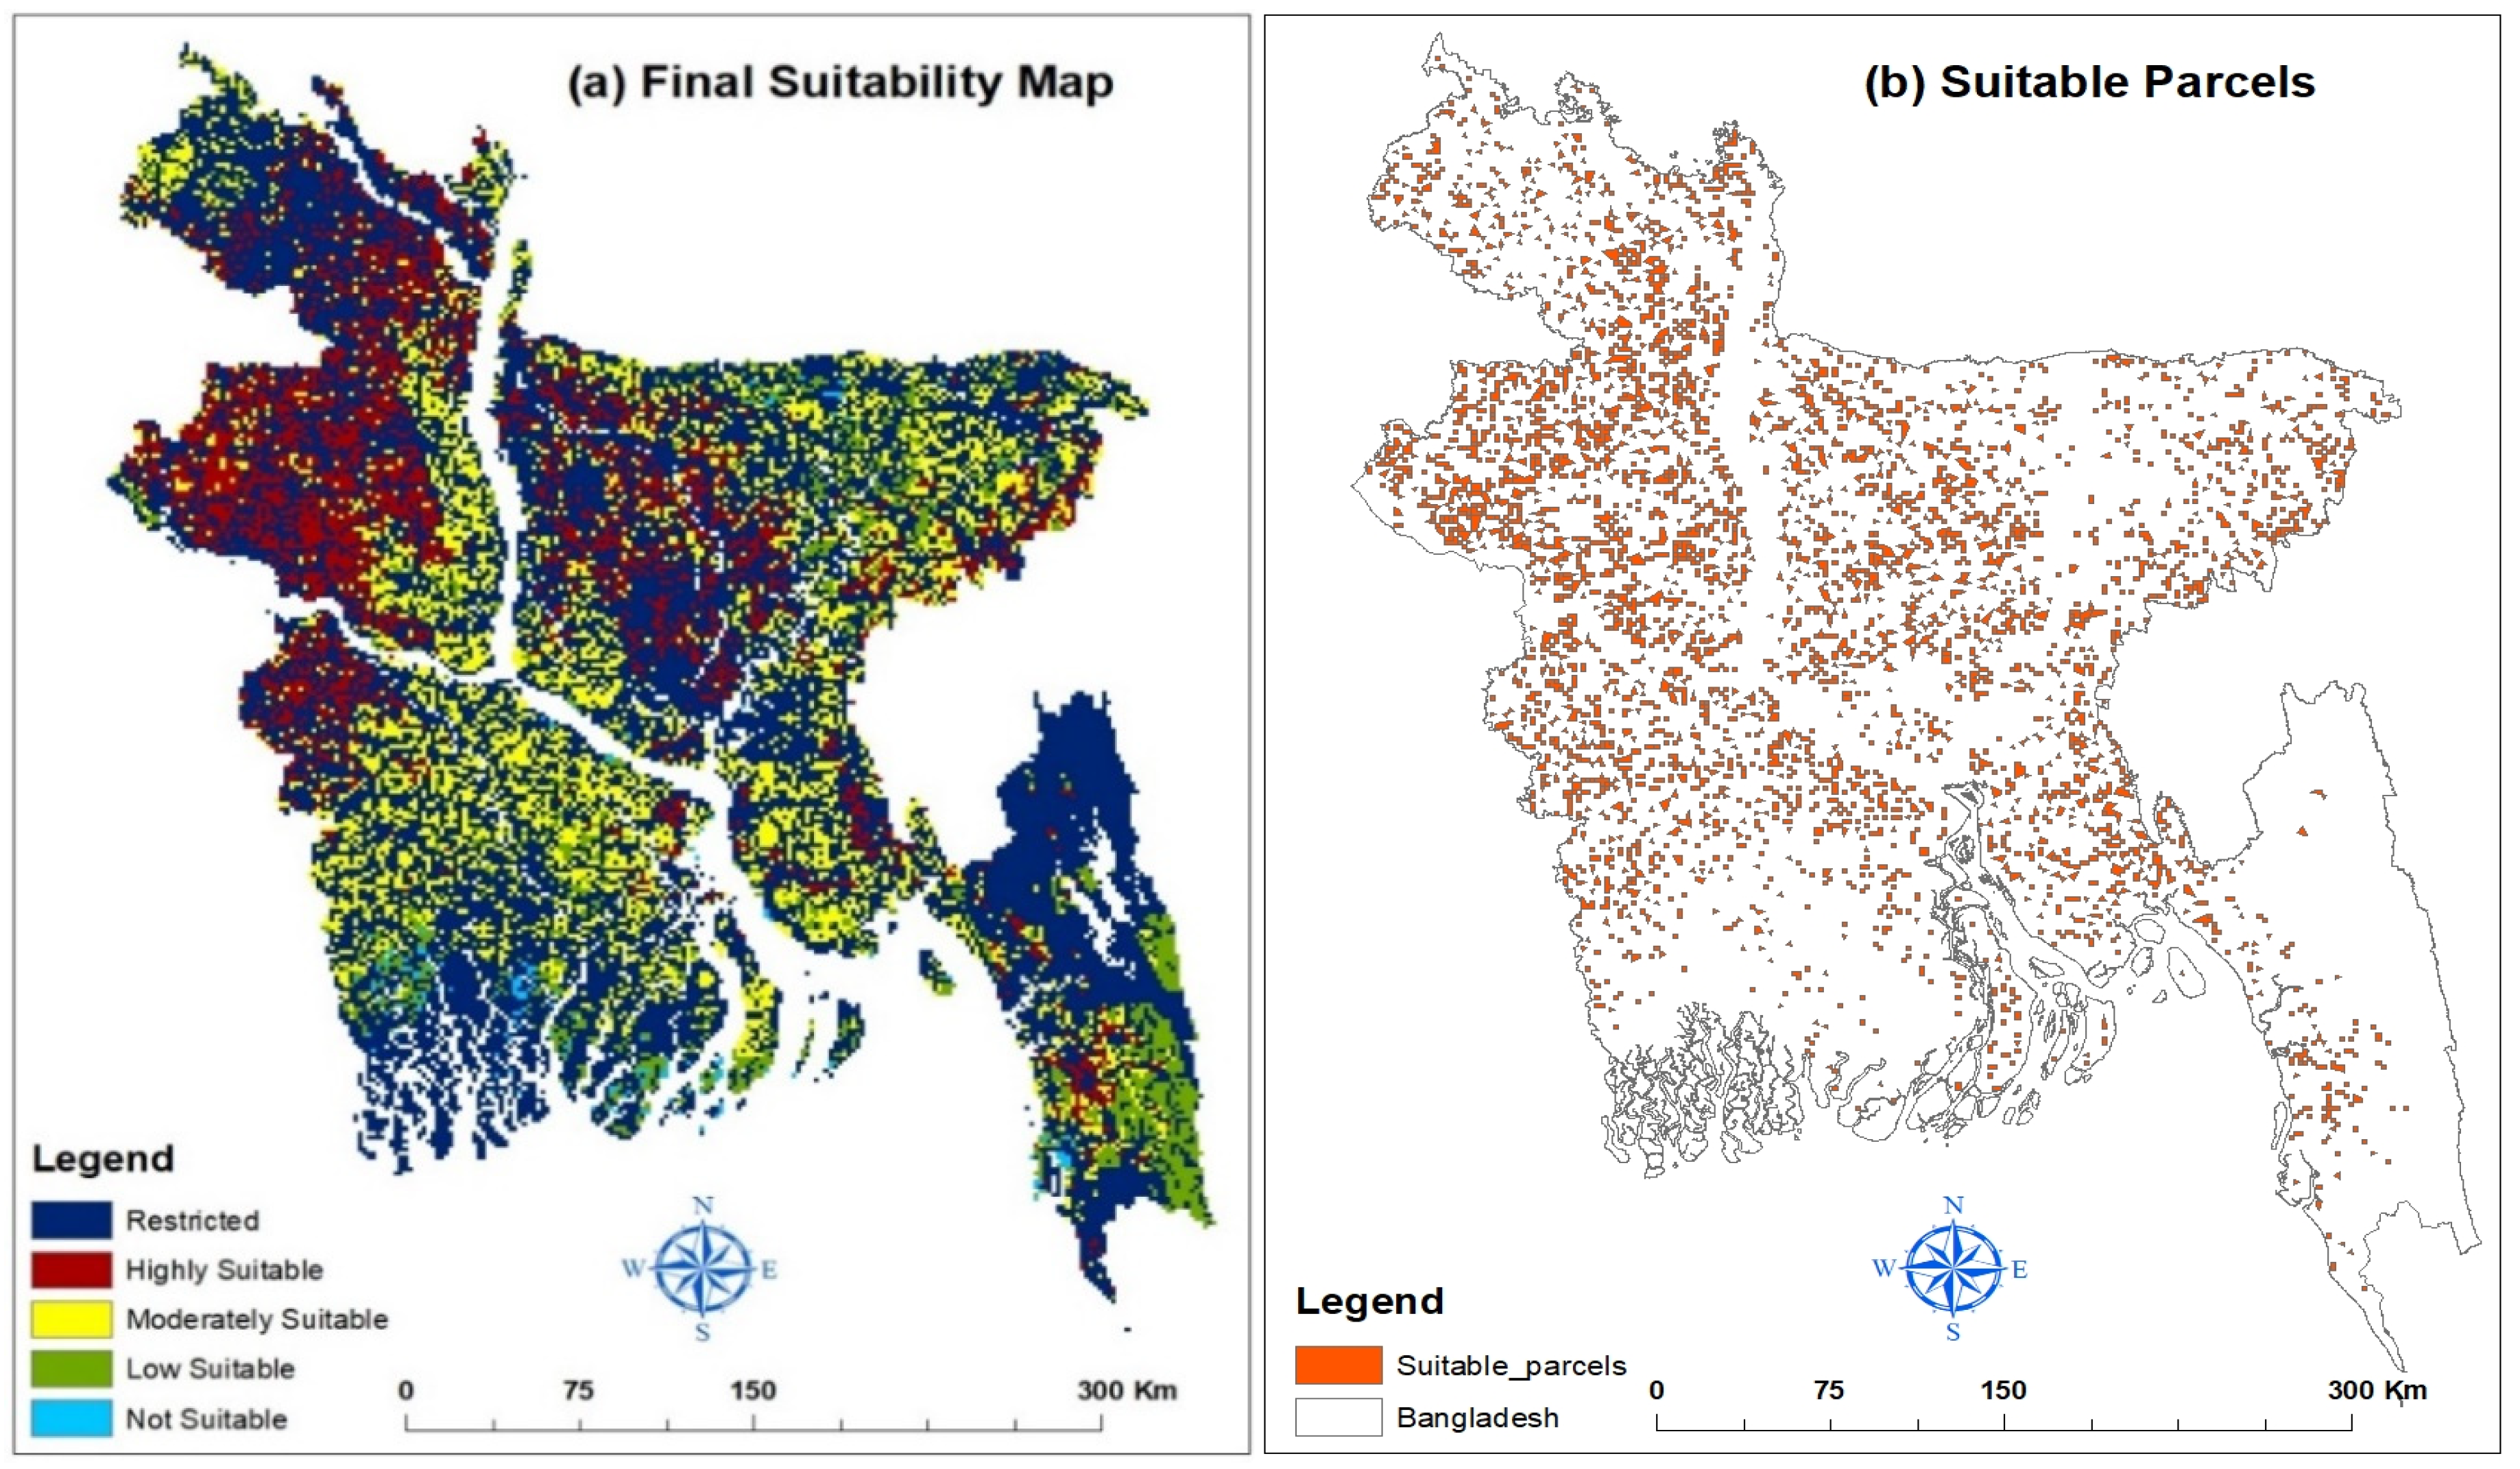
The final restriction map and suitability map were combined to generate the final suitability map (
Figure 5a). In the final suitability map, the suitable zones are clearly distinguished from the restricted zones in a single map. It shows the different zones of suitability (highly suitable, moderately suitable, low suitable, not suitable) areas along with the restricted zone. The final suitability map where the highly and moderately suitable areas were extracted as suitable parcels (
Figure 5b) which were used in network analysis for biogas plant’s location identification in Bangladesh. There are adequate suitable parcels in the western, central and eastern part of the country but there is a limited number of suitable parcels in the southern part due to low land topography and in the Chittagong division due to hilly area.
3.3. Locations for Biogas Plants
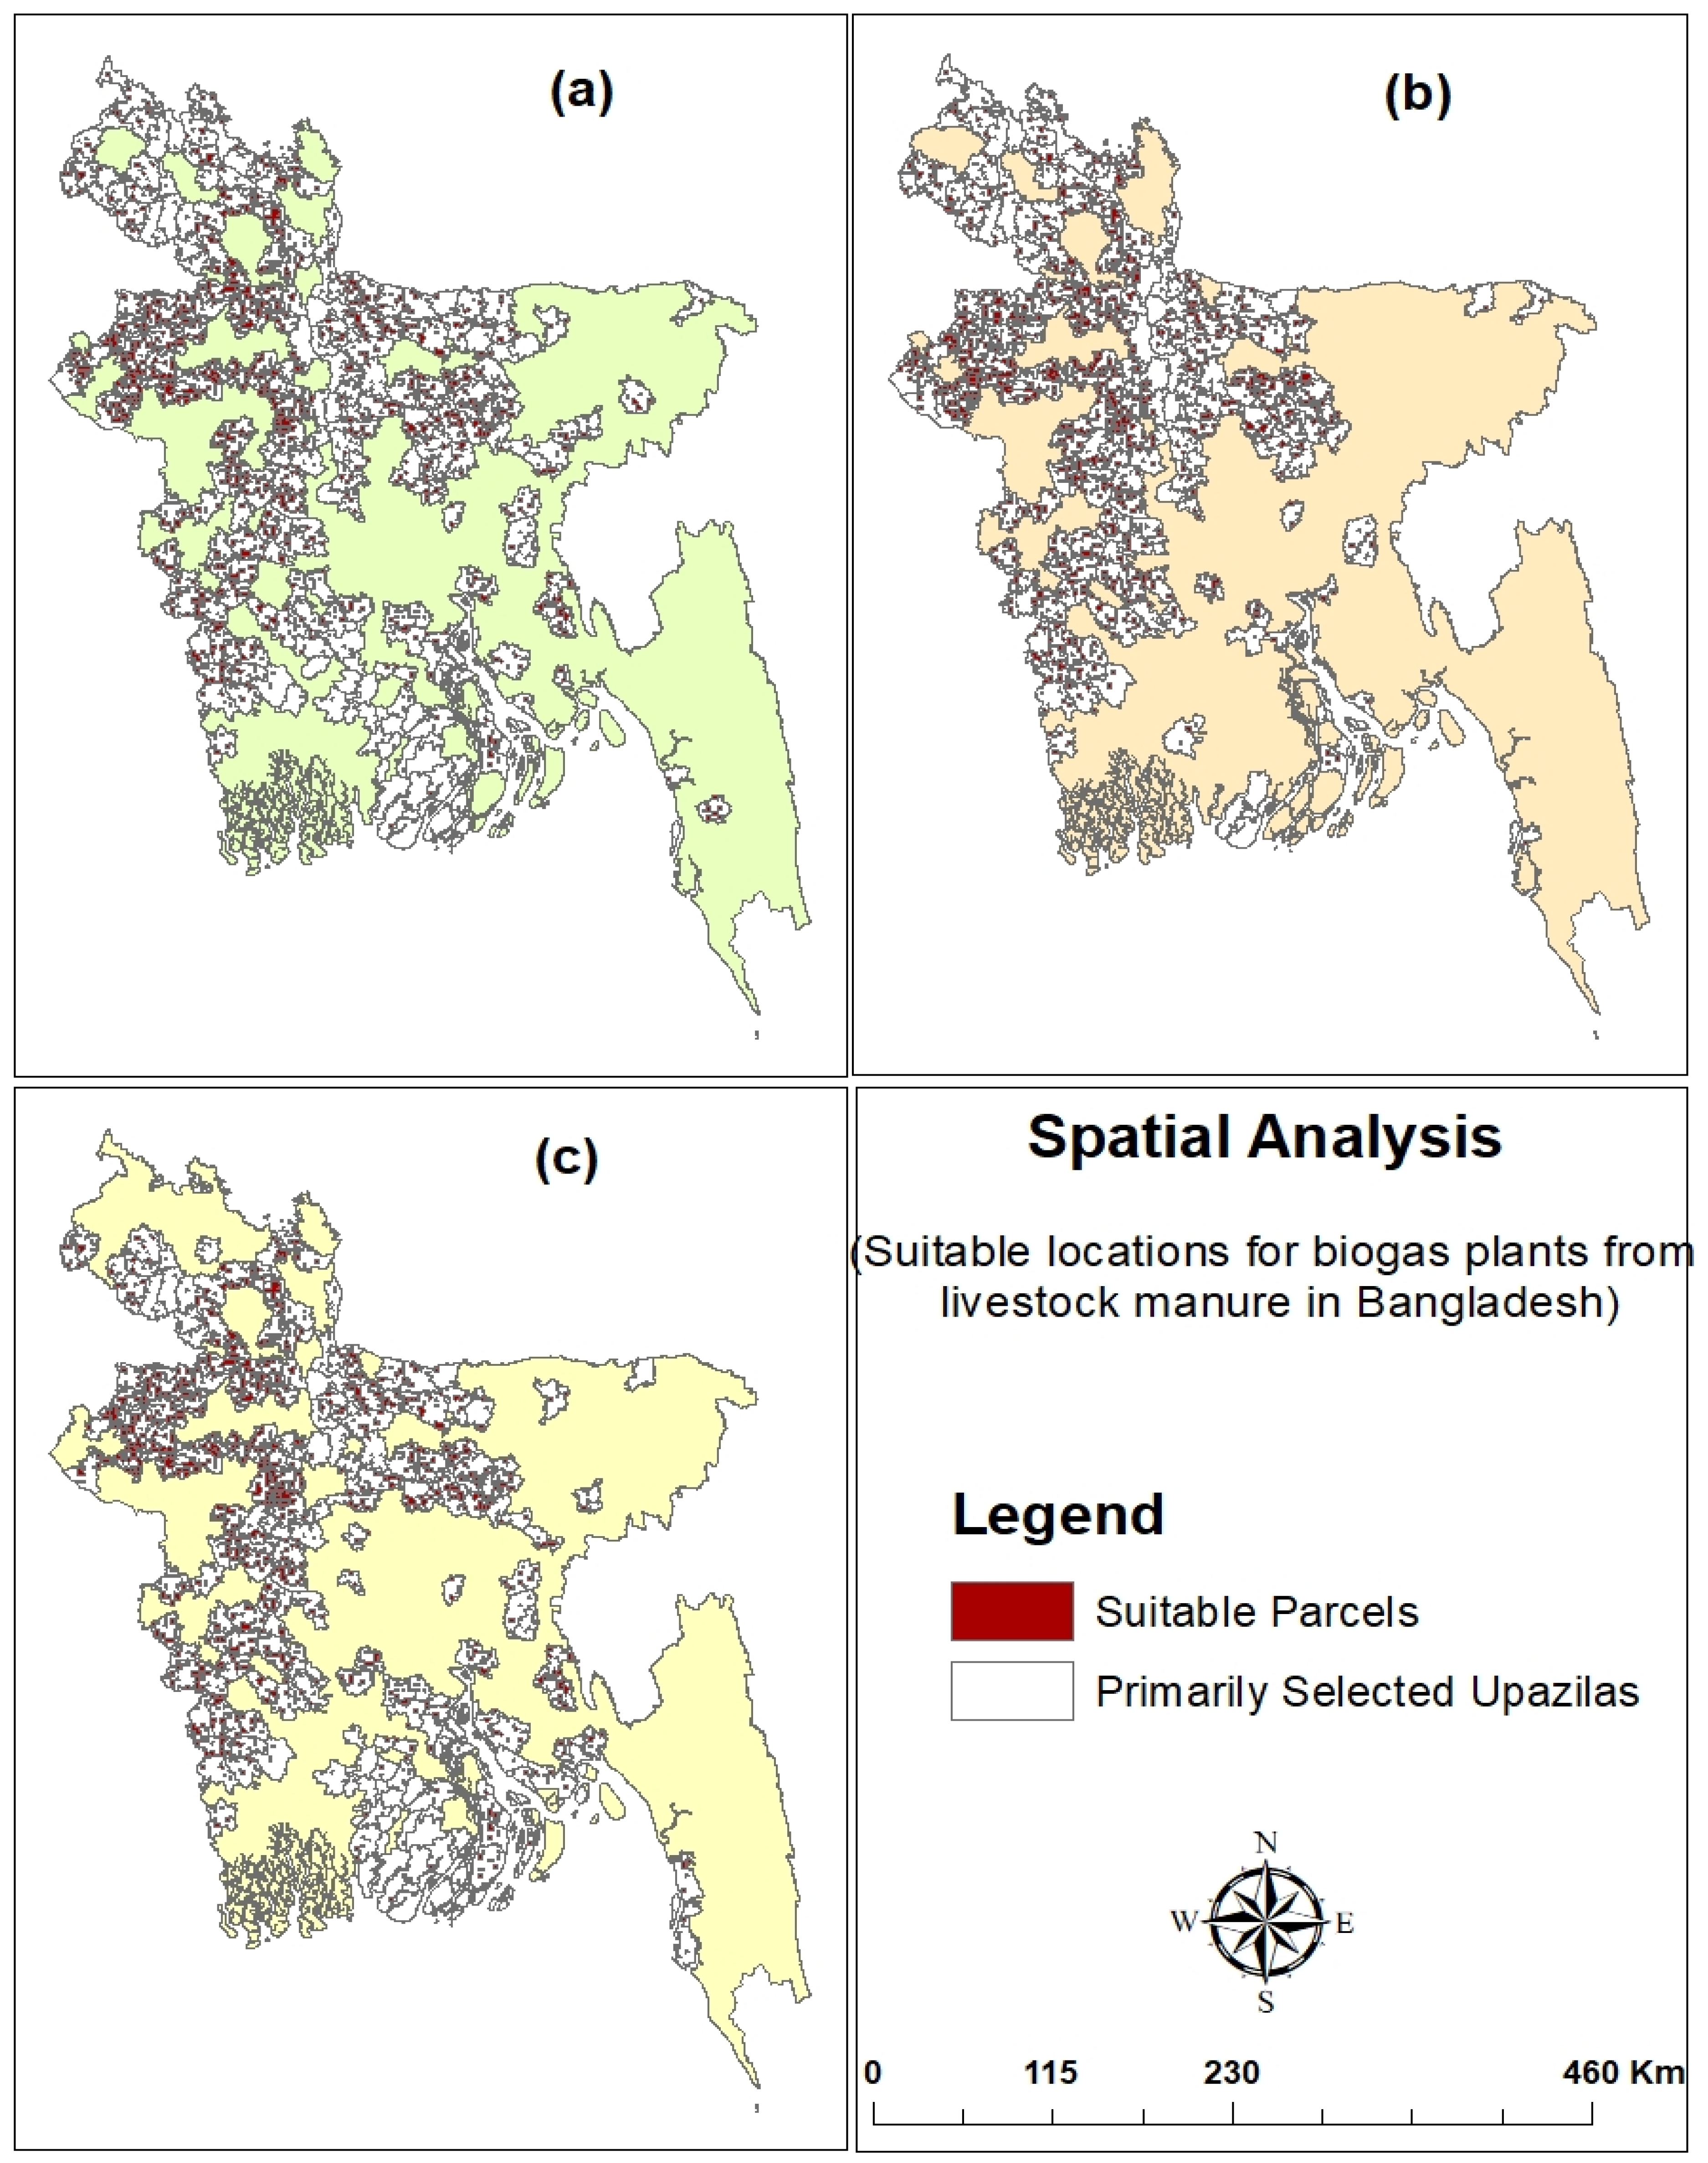
About 227, 175 and 198 upazilas were selected as primary upazilas after spatial analysis. The total available manure generation from primary selected upazilas were 1,34,124 tons/day, 2,897 tons/day and 8,937 tons/day for large animals, small animals and poultry respectively. However, it is found that all the primary selected upazilas have not sufficient suitable places to develop biogas plants. The suitable parcels with the primary selected upazilas are shown in
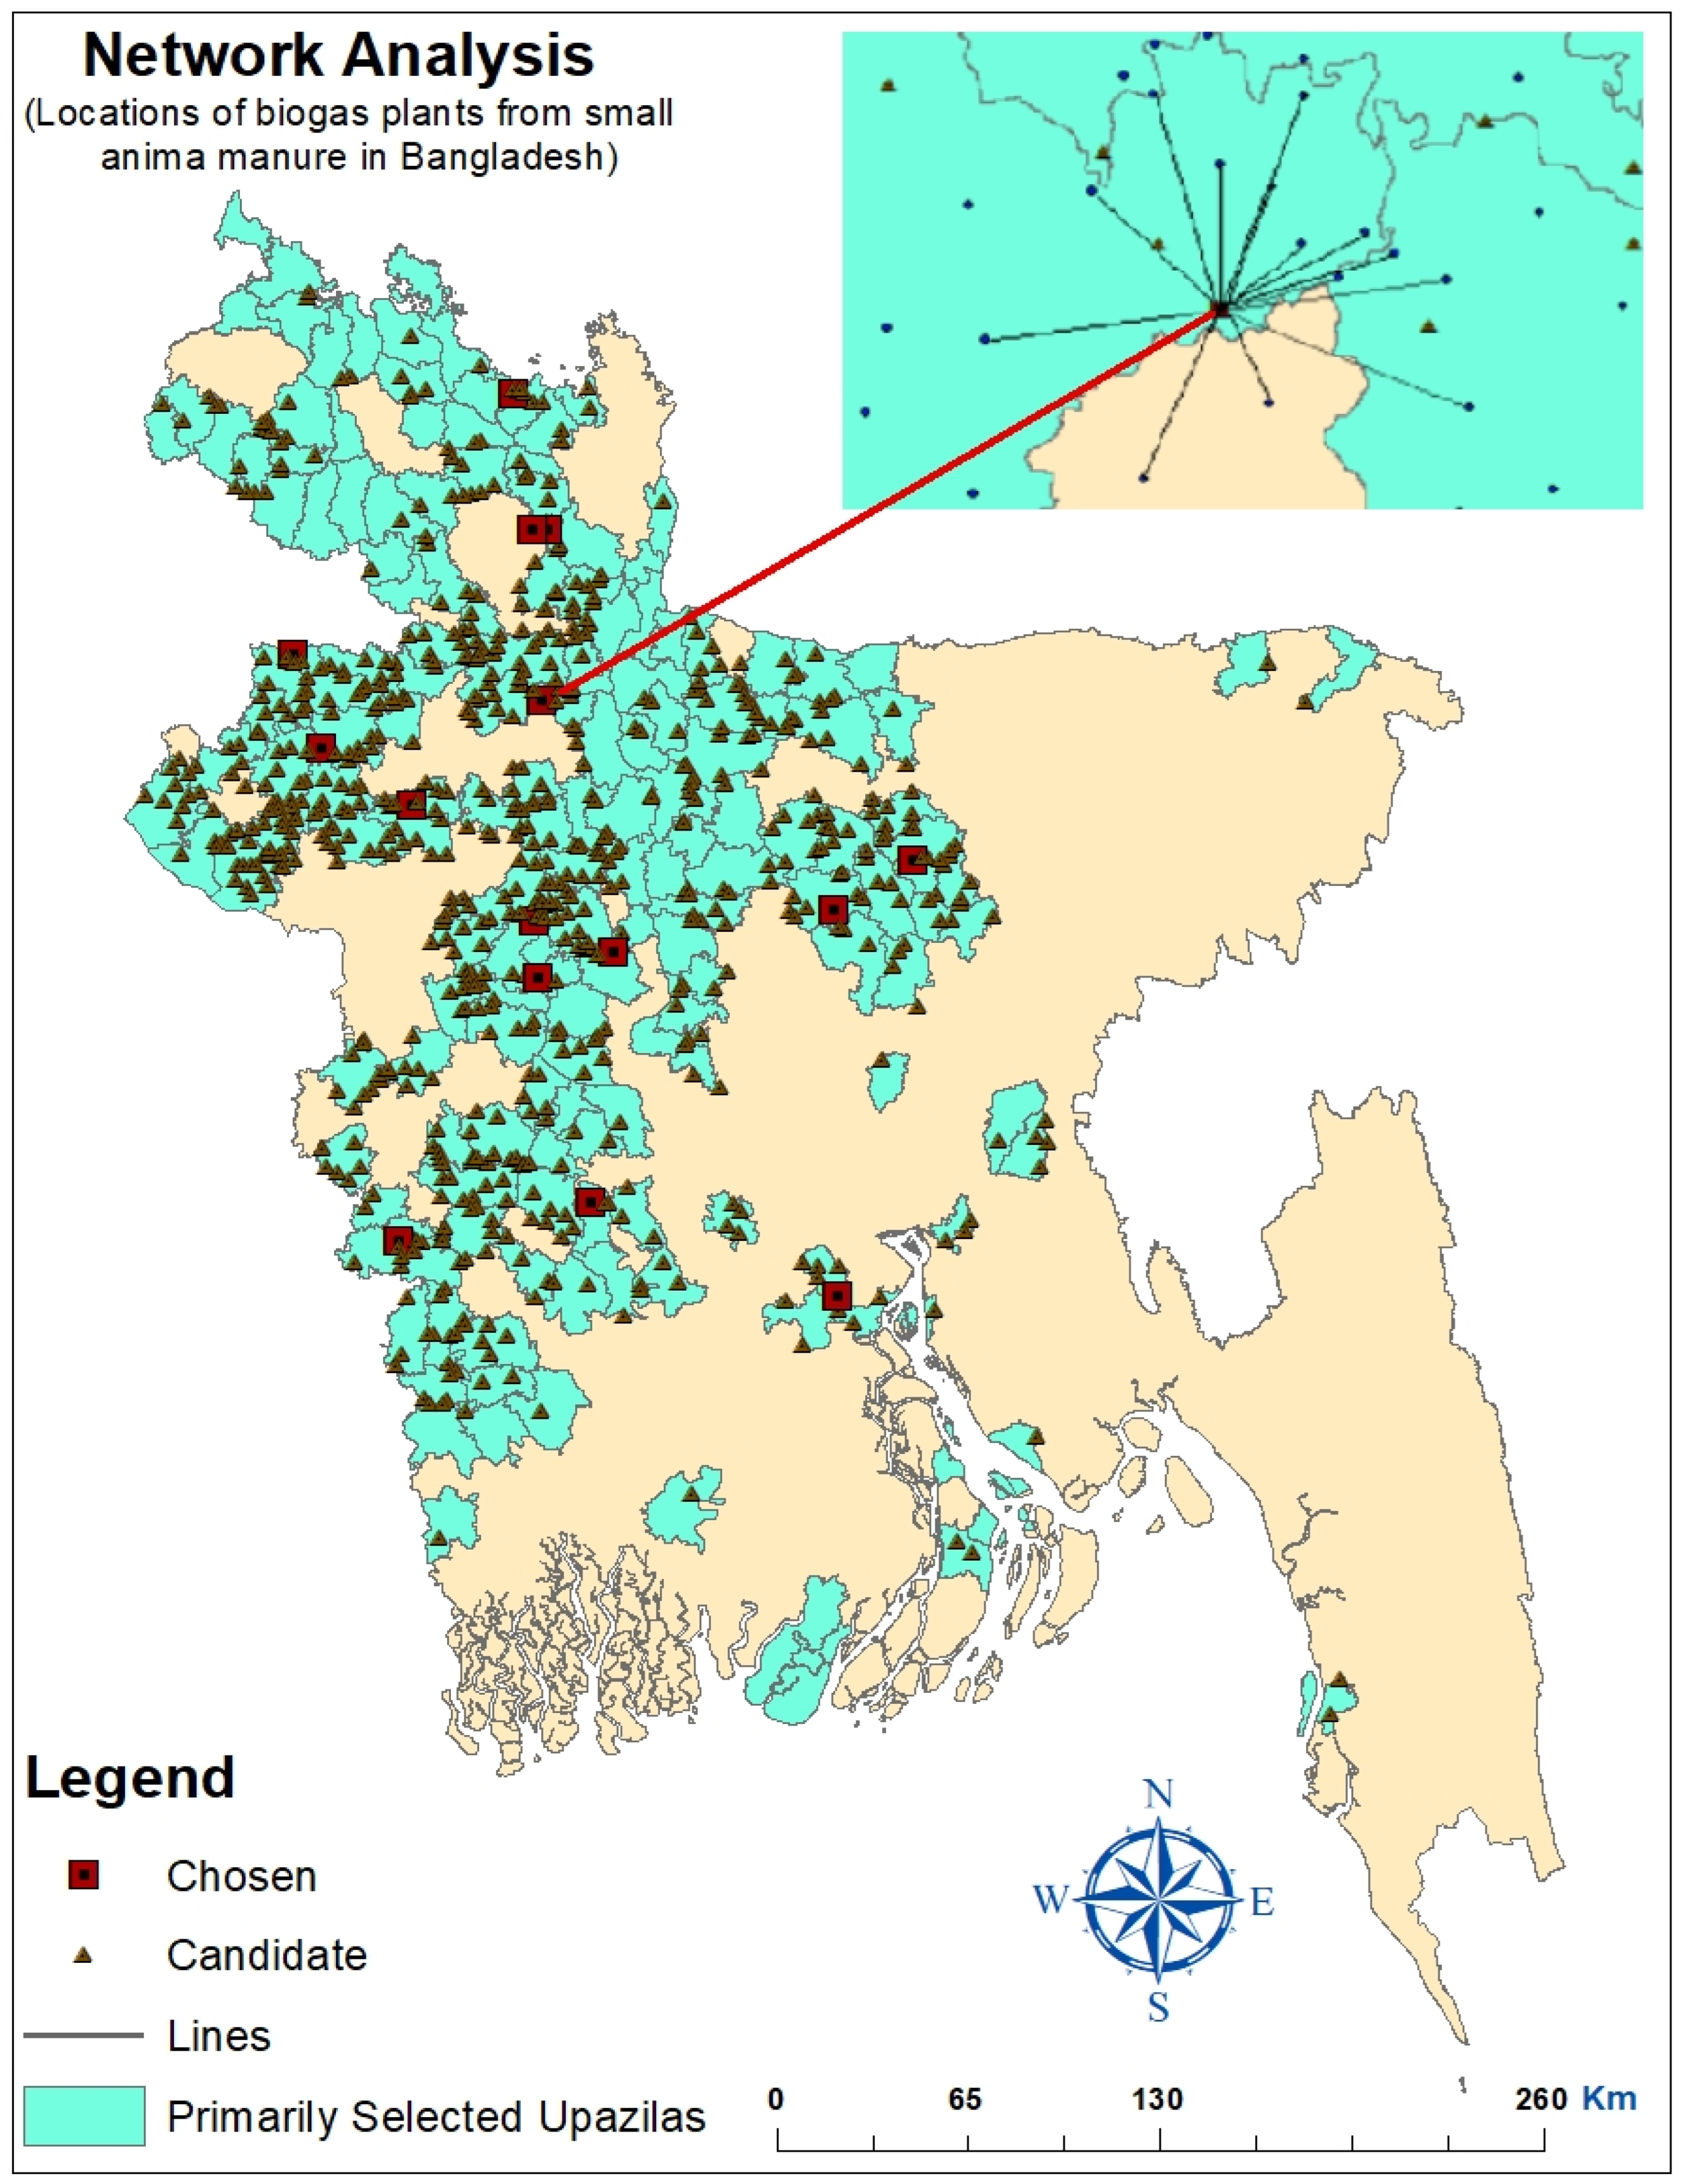
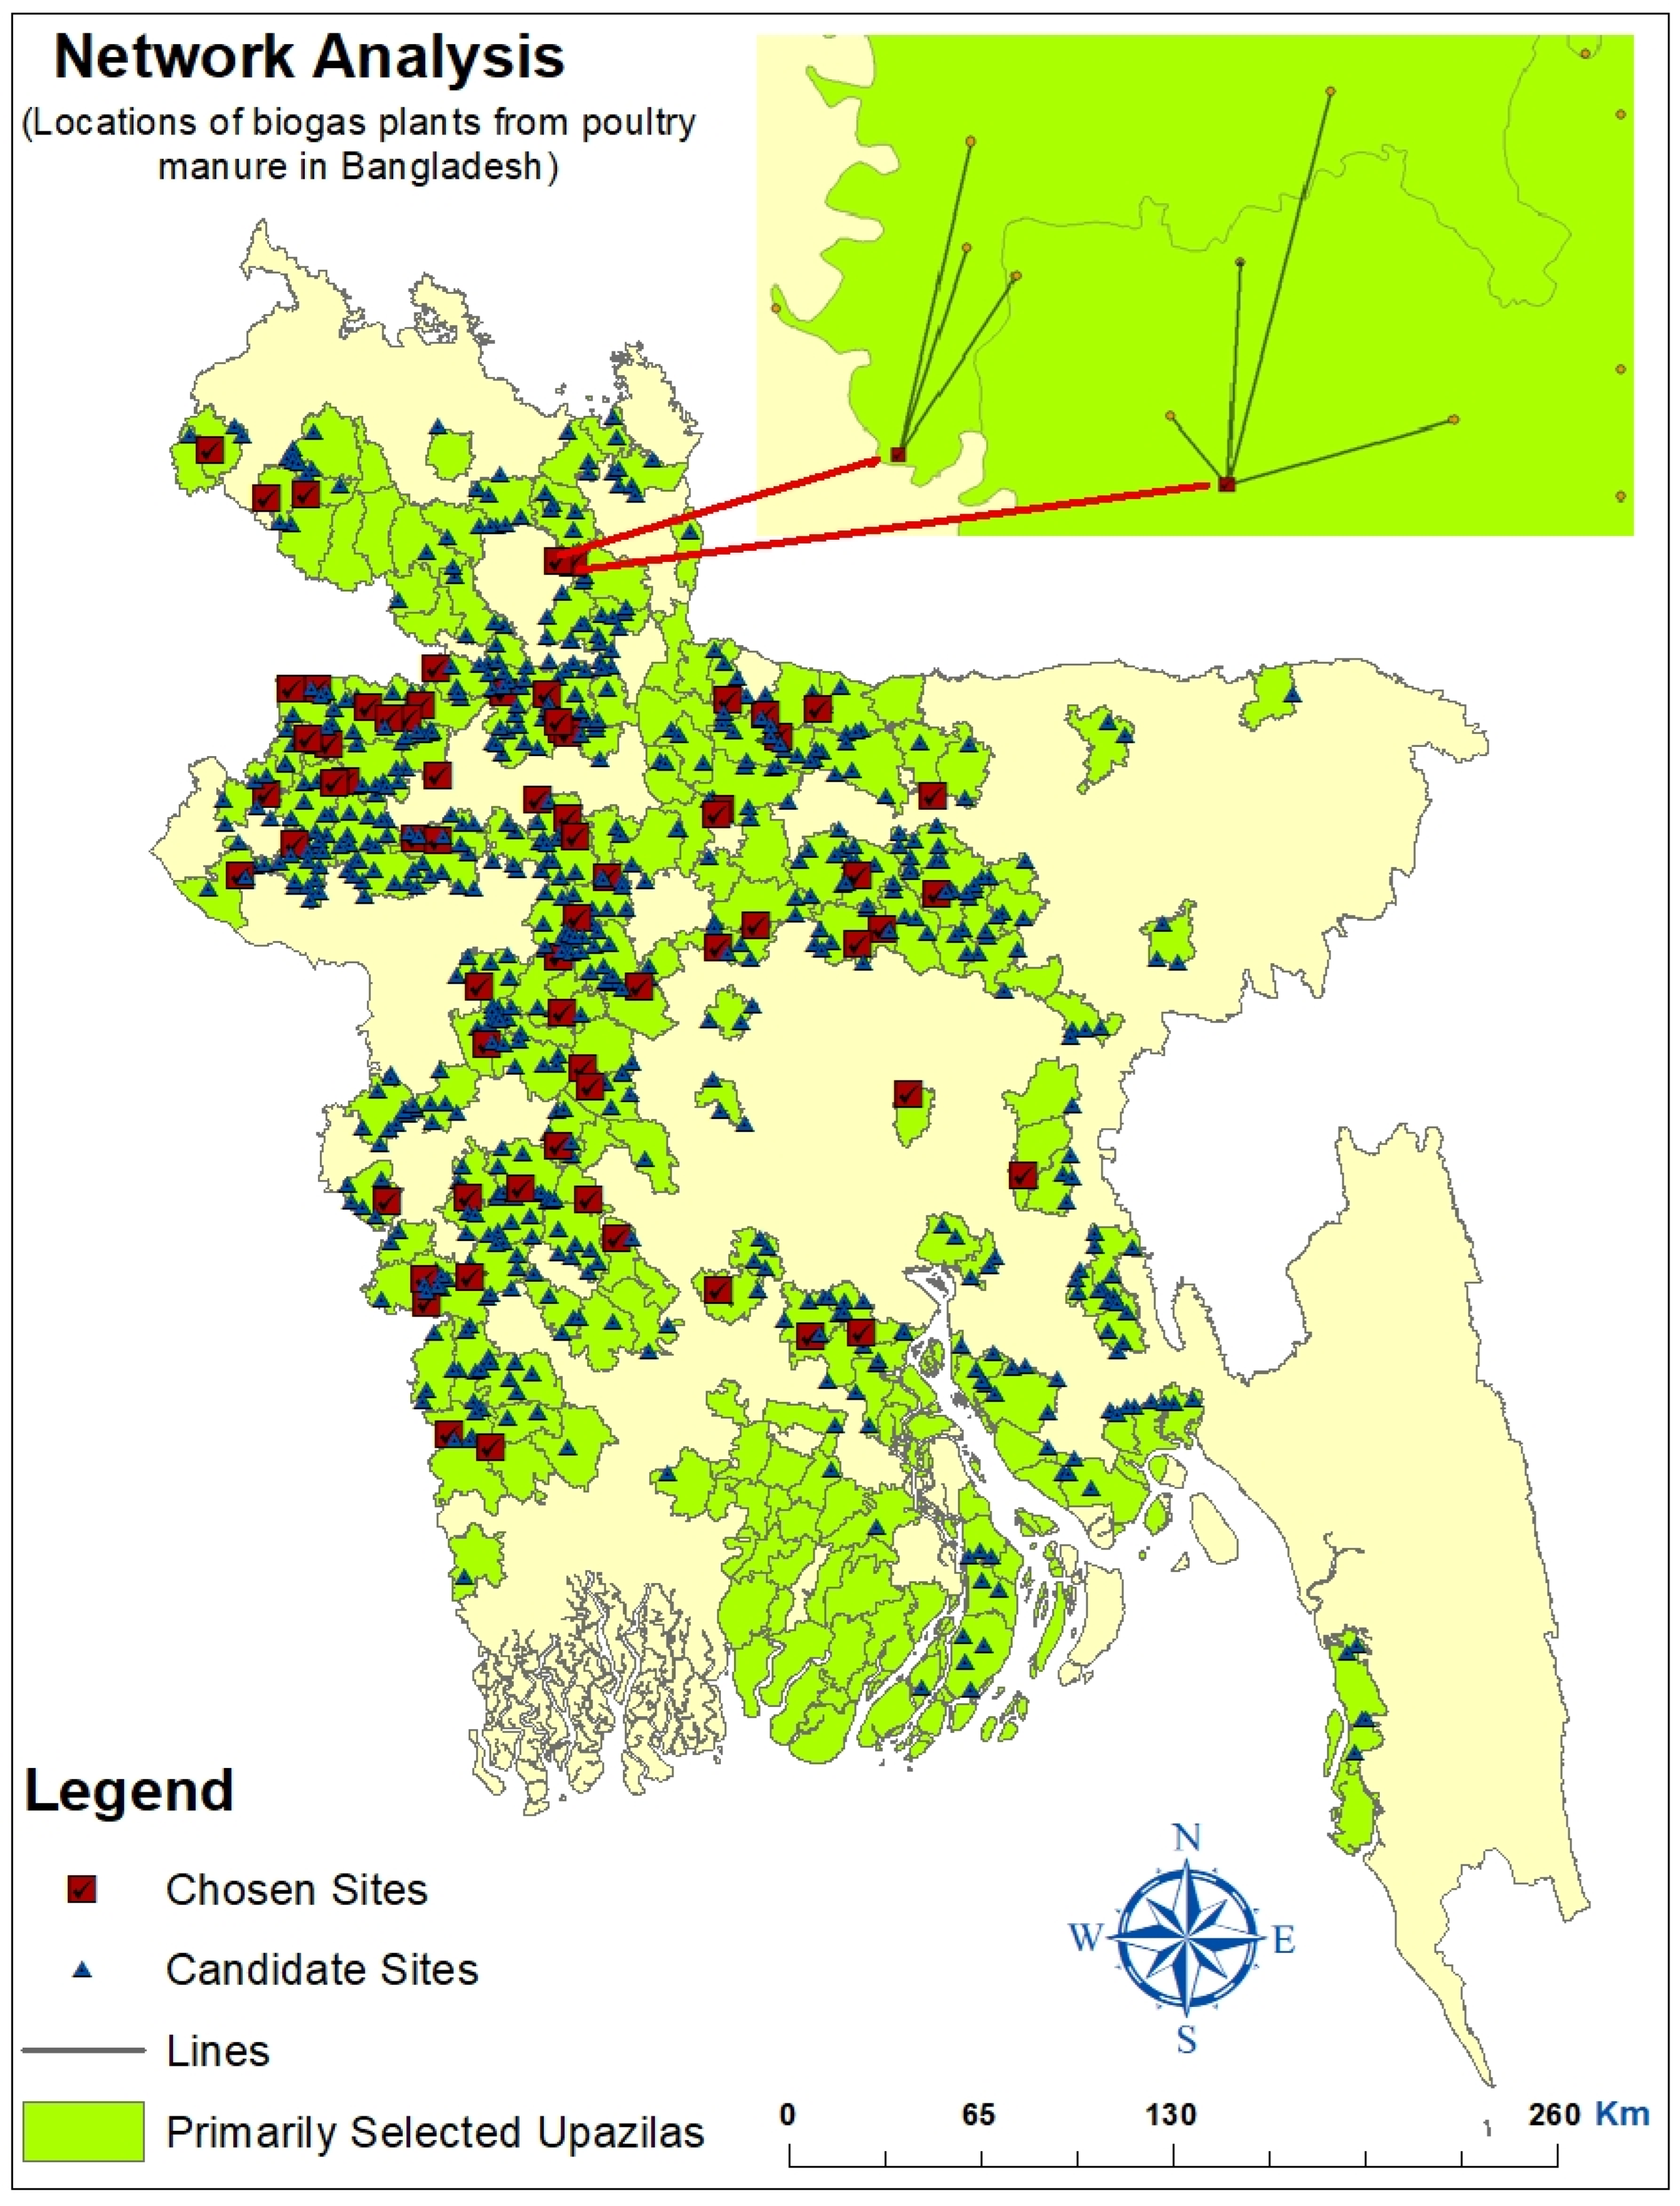
Figure 6 where the red color indicates the suitable places for biogas plants. Again, the chosen sites within all suitable places were selected among many candidate sites depending on the distance from available manure and rice straw sources, transportation facility, maximum coverage etc. through location allocation tools of network analysis. After applying the network analysis, the results show that a total of 558 large-scale biogas plants will be feasible in terms of transport cost and large volume of manure production from total livestock within primarily selected upazilas. Specifically, about 475 large-scale plants can be built to produce biogas from large animal manure in Bangladesh (
Figure 7). On the other hand, only 15 and 68 locations were counted as chosen sites for large-scale biogas production from small animal manure (
Figure 8), and poultry manure (
Figure 9) respectively.
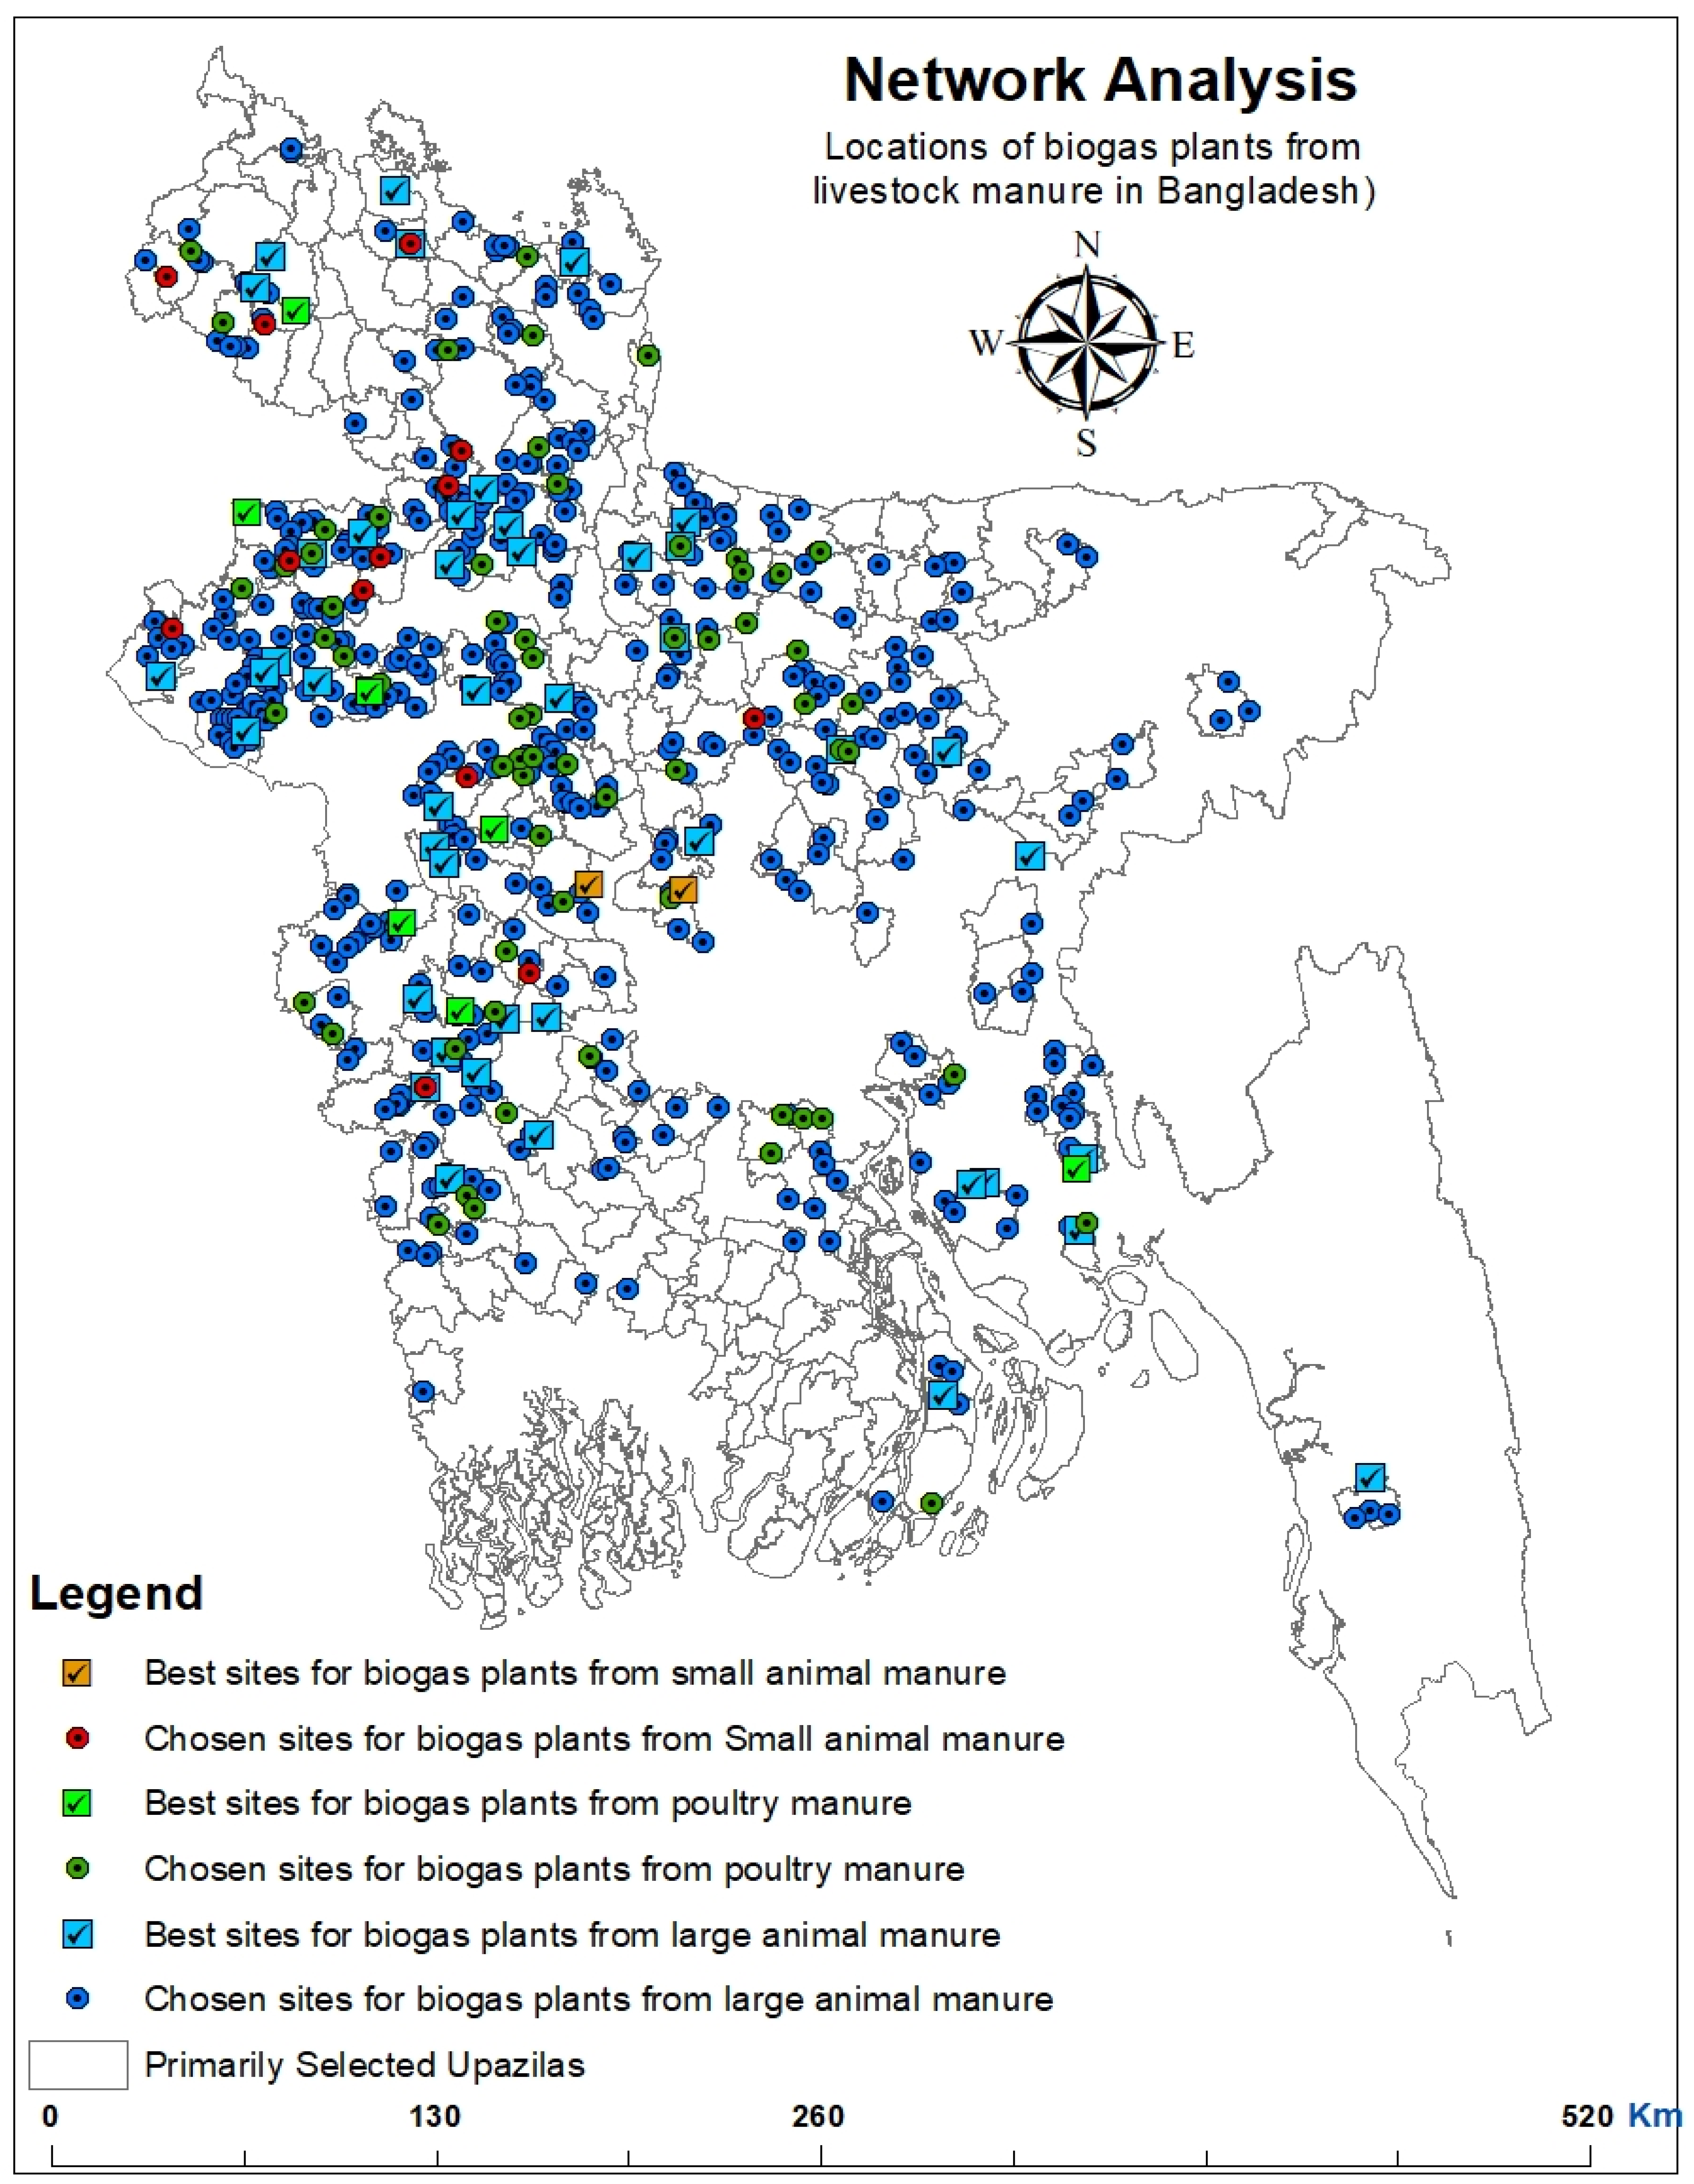
Figure 10 denoted the final chosen sites with their best sites for large-scale biogas production from different livestock manure in Bangladesh. The best sites were estimated based on top 10% of chosen sites correspondingly.
The socio-economic and environmental benefits were also computed from all scenarios which are shown in
Table 5. Scenario-B1 suggested 475 large-scale biogas-based electricity generation plants from large animal manure could be implemented with a total 2,85,000 MW capacity to produce electricity about 6,844.23 GWh annually. However, only 15 locations were selected as chosen sites for large-scale biogas plants from scenario-B2 with a potentiality to produce 72.53 million m
3 biogas which can be converted into 108.81 GWh electricity in a year. Scenario-B3 proposed 68 large-scale biogas plant’s location to produce 486.45 million m
3 biogas and 729.68 GWh electricity per year.
The total GHGs emissions reduction potential from different scenarios was estimated where scenario-B1 can reduce a total of 5,903.15 gigagram CO2eq/year GHG emissions by replacing fossil fuels for electricity generation. In the case of scenario-B2 and scenario-B3, biogas plants from small animal and poultry manure can reduce 103.59 and 629.34 gigagram CO2eq/year GHG emissions separately. Moreover, the biogas plants from all scenarios are sufficient to produce 5,230.84, 81.35 and 155.51 kilotons biofertilizer respectively by reducing a total of 90,138.78 kilotons of manure annually to dispose in landfill or any other way.
4. Discussion
Many literatures studied about livestock manure management through different statistical methods but suitable locations selection for developing livestock manure management plant using GIS spatial modeling is a new perception for this study area. Proper site selection is an important step for any type of waste management where suitability analysis and network analysis easily guide the development of waste management plants with better profitability and sustainability. The spatial analysis in this research shows a significant land-use idea to take the decision of implementing biogas plants based on the most suitable parcels judging various natural and socio-economic criteria. This analysis also combined restriction and suitability models to get a final suitability map which ensures more relevance and accuracy of the analysis. Afterwards, land suitability analysis was combined with scenario analysis through network analysis to get optimum number of plants, size and locations for large-scale biogas production which highlights the magnitude of this work.
The spatial analysis of scenarios for bioenergy production based on existing legislation and local demand of electricity in rural area of Bangladesh. All scenarios were analyzed based on the availability of different types of livestock manure and rice residues which optimized considering the maximum coverage of manure and cost effectiveness through network analysis. Specifically, this study used location allocation tools of network analysis to get optimum number of plants and selected the chosen sites for large-scale biogas plants in Bangladesh. However, to implement the proposed scenarios, the government policy, available technology, and other facilities for operating plants are important issues. Though the electricity demand can be solved by producing electricity from these biogas plants in rural areas of Bangladesh and at the same time it will produce sludge which can be used as organic fertilizer for the crop production.
Sustainable social and economic development depends on power generation which pressure the demand to increase to 34,708 MW total capacity by 2030 in Bangladesh including 2,800 MW capacity from renewable sources [70]. Though the targets to produce electricity from renewable sources was 10% of total electricity generation by 2020, this is obtained only 2.17% electricity from renewable sources in 2024 [
57] where the share of biogas from renewable sources is only 0.31% including biomass sources. This study estimated a total of 1,067 MW capacity biogas-based electricity generation plants from total livestock manure to support electricity to the farms and local area of Bangladesh. However, natural gas has contributed maximum generation of electricity in Bangladesh where replacing fossil fuels by renewable energy sources may improve energy efficiency and sustain bioenergy production for a long time. In Bangladesh, total electricity generation about 88,450 million kWh in 2024 where 1,919.37 million kWh electricity were produced from renewable sources. By installation of these proposed plants can produce 7,682.72 million kWh electricity which will enhance the contribution of biogas means renewable energy to 8.69% in the total energy production in Bangladesh.
Though undesirable economic and other issues associated with operational feasibility, and low biogas yield from manure discouraged many farmers from implementing this technology but it has positive impacts in environmental aspect by reducing GHG emissions to combat climate change. Livestock manure biogas can reduce about 7,236.12 gigagrams CO2eq GHG emissions to produce electricity by replacing fossil fuels which is about 54.46% and 5.87% of total GHG emissions from livestock manure and energy sector (GHG emissions from livestock manure in 2022 was 13,288 and 123,316 kilotons CO2eq respectively) [71].
5. Conclusions
The potential locations identification for biogas plants by this study will be effective to formulate policy for sustainable livestock manure management and contribute to improve the environmental and socio-economic situation in Bangladesh. Depending on the budget and policy, the government can take initiatives to gradually implement the biogas plants suggested by the scenarios based on capacity, location and local demand of the area. Moreover, this type of spatial analysis can also be applied for site selection of other types of waste recycling plants in future. This requires research, development and extension work focusing on strategies, systems and techniques that allow maximization of the benefits of waste uses by minimizing the impact on natural resources and ecosystems.
Some challenges always have existed to establish any concepts. The development of the scenarios also has problems such as economic cost-benefits and social impacts. These types of challenges of this study can be mitigated by co-ordinate management among different institutions. Before implementing any plants details feasibility study and existing guidelines, legislation pursuing is also recommended. The government of Bangladesh have worked on livestock extension policy that has many recommended actions for sustainable livestock production and improved manure management. Though specific strategies and schemes of manure management which will be suitable for sustainable livestock sector have not yet been analyzed. This study will assist in choosing effective planning for manure management to produce clean energy and reduce environmental pollutions.
Author Contributions
Z.M.: Conceived and designed the methodology; Investigated and interpreted the data; Performed formal analysis; Wrote the original paper. H.Y.: Visualized and supervised; Reviewed and edited the paper; Contributed materials, analysis tools, or information.
Funding
This research received no external funding.
Data Availability Statement
The original contributions presented in the study are included in the article, and further inquiries can be directed to the corresponding author.
Acknowledgments
The first author is grateful for Professor Helmut Yabar’s supervision and guidance. I am also gratefully acknowledged the support from the Graduate School of Environmental Sciences and Technology, University of Tsukuba, Japan.
Conflicts of Interest
The authors declare no conflicts of interest.
Appendix A
Table A1.
Suitability criteria ranking for AHP analysis (Initial matrix).
Table A1.
Suitability criteria ranking for AHP analysis (Initial matrix).
| Criteria-1 Collection Efficiency |
|---|
| |
Roads |
Flood Prone Area |
Elevation |
| Roads |
1 |
7 |
5 |
| Flood Prone Area |
1/7 |
1 |
1/3 |
| Elevation |
1/5 |
3 |
1 |
| Criteria-2 Safety |
| |
Roads |
Flood Prone Area |
Elevation |
| Roads |
1 |
1/7 |
1 |
| Flood Prone Area |
7 |
1 |
5 |
| Elevation |
1 |
1/5 |
1 |
| Criteria-3 Cost Minimization |
| |
Roads |
Flood Prone Area |
Elevation |
| Roads |
1 |
7 |
3 |
| Flood Prone Area |
1/7 |
1 |
1/5 |
| Elevation |
1/3 |
5 |
1 |
Table A2.
Normalized matrix for suitability criteria AHP analysis.
Table A2.
Normalized matrix for suitability criteria AHP analysis.
| Criteria 1 Collection efficiency |
|---|
| |
Roads |
Flood prone area |
Elevation |
Criteria weights |
| Roads |
0.744713 |
0.636364 |
0.789478 |
0.723518 |
| Flood prone area |
0.106345 |
0.090909 |
0.052627 |
0.083294 |
| Elevation |
0.148943 |
0.272727 |
0.157896 |
0.193188 |
| Criteria 2 Safety |
| |
Roads |
Flood prone area |
Elevation |
Criteria weights |
| Roads |
0.111111 |
0.106345 |
0.142857 |
0.120104 |
| Flood prone area |
0.777778 |
0.744713 |
0.714286 |
0.745592 |
| Elevation |
0.111111 |
0.148943 |
0.142857 |
0.134304 |
| Criteria 3 Cost minimization |
| |
Roads |
Flood prone area |
Elevation |
Criteria weights |
| Roads |
0.677461 |
0.538462 |
0.714286 |
0.643403 |
| Flood prone area |
0.096741 |
0.076923 |
0.047619 |
0.073761 |
| Elevation |
0.225798 |
0.384615 |
0.238095 |
0.282836 |
Table A3.
Calculation of consistency index (CI) and consistency ratio (CR) for suitability criteria AHP analysis.
Table A3.
Calculation of consistency index (CI) and consistency ratio (CR) for suitability criteria AHP analysis.
| Criteria 1 Collection efficiency |
|---|
| |
Roads |
Flood prone area |
Elevation |
Weighted (sum value) |
Criteria weights |
Ratio |
Average (λmax) |
CI = (λmax-n)/n-1 |
CR = CI/RI
(RI = 0.58) |
| Roads |
0.723518 |
0.583055 |
0.965942 |
2.272515 |
0.723518 |
3.140924 |
3.065622 |
0.03281 |
0.05657< 0.1 |
| Flood prone area |
0.103318 |
0.083294 |
0.06439 |
0.251002 |
0.083294 |
3.013458 |
| Elevation |
0.144704 |
0.249881 |
0.193188 |
0.587773 |
0.193188 |
3.042484 |
| Criteria 2 Safety |
| |
Roads |
Flood prone area |
Elevation |
Weighted (sum value) |
Criteria weights |
Ratio |
Average (λmax) |
CI |
CR |
| Roads |
0.120104 |
0.106471 |
0.134304 |
0.360879 |
0.120104 |
3.004707 |
3.012514 |
0.00625 |
0.01078< 0.1 |
| Flood prone area |
0.840731 |
0.745592 |
0.671518 |
2.257841 |
0.745592 |
3.028252 |
| Elevation |
0.120104 |
0.149118 |
0.134304 |
0.403526 |
0.134304 |
3.004584 |
| Criteria 3 Cost minimization |
| |
Roads |
Flood prone area |
Elevation |
Weighted (sum value) |
Criteria weights |
Ratio |
Average (λmax) |
CI |
CR |
| Roads |
0.643403 |
0.516328 |
0.848508 |
2.008239 |
0.643403 |
3.121279 |
3.065315 |
0.03265 |
0.05630< 0.1 |
| Flood prone area |
0.091878 |
0.073761 |
0.056567 |
0.222206 |
0.073761 |
3.01251 |
| Elevation |
0.214446 |
0.368806 |
0.282836 |
0.866088 |
0.282836 |
3.062155 |
Appendix B
Figure A1.
Restriction modeling for restriction mapping (Transport network).
Figure A1.
Restriction modeling for restriction mapping (Transport network).
Figure A2.
Suitability modeling for suitability mapping.
Figure A2.
Suitability modeling for suitability mapping.
Figure A3.
Final suitability map modeling from restriction and suitability maps.
Figure A3.
Final suitability map modeling from restriction and suitability maps.
References
- BBS. Bangladesh Bureau of Statistics-Government of the People’s Republic of Bangladesh [Internet]. 2023 [cited 2024 Apr 24]. Available online: http://bbs.portal.gov.bd/site/page/6b4c2697-452b-4bc6-9ee2-1fb5e0fc66c0/-.
- DLS. Livestock Economy at a Glance [Internet]. Bangladesh: Department of Livestock Services; 2023. Available online: http://dls.portal.gov.bd/sites/default/files/files/dls.portal.gov.bd/page/ee5f4621_fa3a_40ac_8bd9_898fb8ee4700/2023-07-23-12-04-afbcccb96f8b27d4bab6501aa8c2c2ff.pdf.
- Ai P, Jin K, Alengebawy A, Elsayed M, Meng L, Chen M, et al. Effect of application of different biogas fertilizer on eggplant production: Analysis of fertilizer value and risk assessment. Environmental Technology & Innovation [Internet]. 2020 Aug [cited 2024 May 22];19:101019. Available online: https://linkinghub.elsevier.com/retrieve/pii/S2352186420306088.
- Li J, Wei L, Duan Q, Hu G, Zhang G. Semi-continuous anaerobic co-digestion of dairy manure with three crop residues for biogas production. Bioresource Technology [Internet]. 2014 Mar [cited 2024 May 1];156:307–13. Available online: https://linkinghub.elsevier.com/retrieve/pii/S0960852414000893.
- Mathew AK, Bhui I, Banerjee SN, Goswami R, Chakraborty AK, Shome A, et al. Biogas production from locally available aquatic weeds of Santiniketan through anaerobic digestion. Clean Techn Environ Policy [Internet]. 2015 Aug [cited 2024 May 1];17(6):1681–8. Available online: http://link.springer.com/10.1007/s10098-014-0877-6.
- Whiting A, Azapagic A. Life cycle environmental impacts of generating electricity and heat from biogas produced by anaerobic digestion. Energy [Internet]. 2014 Jun [cited 2024 May 1];70:181–93. Available online: https://linkinghub.elsevier.com/retrieve/pii/S0360544214003673.
- Burg V, Bowman G, Haubensak M, Baier U, Thees O. Valorization of an untapped resource: Energy and greenhouse gas emissions benefits of converting manure to biogas through anaerobic digestion. Resources, Conservation and Recycling [Internet]. 2018 Sep [cited 2024 Sep 11];136:53–62. Available online: https://linkinghub.elsevier.com/retrieve/pii/S0921344918301356.
- Siddiki SkYA, Uddin MN, Mofijur M, Fattah IMR, Ong HC, Lam SS, et al. Theoretical calculation of biogas production and greenhouse gas emission reduction potential of livestock, poultry and slaughterhouse waste in Bangladesh. Journal of Environmental Chemical Engineering [Internet]. 2021 Jun [cited 2024 May 1];9(3):105204. Available online: https://linkinghub.elsevier.com/retrieve/pii/S2213343721001810.
- Chowdhury T, Chowdhury H, Hossain N, Ahmed A, Hossen MS, Chowdhury P, et al. Latest advancements on livestock waste management and biogas production: Bangladesh’s perspective. Journal of Cleaner Production [Internet]. 2020 Nov [cited 2024 May 1];272:122818. Available online: https://linkinghub.elsevier.com/retrieve/pii/S0959652620328638.
- DoE. Bangladesh Standards and Guidelines for Sludge Management [Internet]. Dhaka, Bangladesh: Department of Environment, Ministry of Environment and Forest; 2015 Feb. Available online: https://doe.portal.gov.bd/sites/default/files/files/doe.portal.gov.bd/publications/2398e6c5_c300_472d_9a0c_0385522748f3/Bangladesh%20Standards%20and%20Guideline%20for%20sludge%20management-%20September%202016.pdf.
- Venier F, Yabar H. Renewable energy recovery potential towards sustainable cattle manure management in Buenos Aires Province: Site selection based on GIS spatial analysis and statistics. Journal of Cleaner Production [Internet]. 2017 Sep [cited 2024 May 1];162:1317–33. Available online: https://linkinghub.elsevier.com/retrieve/pii/S0959652617312696.
- Pehnt, M. Dynamic life cycle assessment (LCA) of renewable energy technologies. Renewable Energy [Internet]. 2006 Jan [cited 2024 Nov 20];31(1):55–71. Available online: https://linkinghub.elsevier.com/retrieve/pii/S0960148105000662.
- Cheng H, Ouyang W, Hao F, Ren X, Yang S. The non-point source pollution in livestock-breeding areas of the Heihe River basin in Yellow River. Stoch Environ Res Ris Assess [Internet]. 2007 Jan 9 [cited 2024 Apr 21];21(3):213–21. Available online: http://link.springer.com/10.1007/s00477-006-0057-2.
- Mahal Z, Yabar H, Mizunoya T. Spatial Assessment of Greenhouse Gas Emissions and Eutrophication Potential from Livestock Manure in Bangladesh. Sustainability [Internet]. 2024 Jun 27 [cited 2024 Nov 22];16(13):5479. Available online: https://www.mdpi.com/2071-1050/16/13/5479.
- Yalcinkaya, S. A spatial modeling approach for siting, sizing and economic assessment of centralized biogas plants in organic waste management. Journal of Cleaner Production [Internet]. 2020 May [cited 2024 Sep 11];255:120040. Available online: https://linkinghub.elsevier.com/retrieve/pii/S0959652620300871.
- Amon B, Kryvoruchko V, Amon T, Zechmeister-Boltenstern S. Methane, nitrous oxide and ammonia emissions during storage and after application of dairy cattle slurry and influence of slurry treatment. Agriculture, Ecosystems & Environment [Internet]. 2006 Feb [cited 2024 May 16];112(2–3):153–62. Available online: https://linkinghub.elsevier.com/retrieve/pii/S0167880905004135.
- FAO. Livestock and environment statistics: manure and greenhouse gas emissions. Global, regional and country trends, 1990-2018. [Internet]. Rome; 2020. Report No.: FAOSTAT Analytical Brief Series No. 14. Available online: https://openknowledge.fao.org/server/api/core/bitstreams/f0cebfdd-725e-4d7a-8e14-3ba8fb1486a7/content.
- Afotey B, Sarpong GT. Estimation of biogas production potential and greenhouse gas emissions reduction for sustainable energy management using intelligent computing technique. Measurement: Sensors [Internet]. 2023 Feb 1 [cited 2024 May 1];25:100650. Available online: https://www.sciencedirect.com/science/article/pii/S2665917422002847.
- Islam KN, Sarker T, Taghizadeh-Hesary F, Atri AC, Alam MS. Renewable energy generation from livestock waste for a sustainable circular economy in Bangladesh. Renewable and Sustainable Energy Reviews [Internet]. 2021 Apr [cited 2024 Apr 21];139:110695. Available online: https://linkinghub.elsevier.com/retrieve/pii/S1364032120309795.
- Miranda DS, Kulay L. A prospective study on the environmental feasibility of supplying electricity to the Brazilian Amazon through biogas power generation. Sustainable Energy Technologies and Assessments [Internet]. 2023 Feb 1 [cited 2024 May 1];55:102962. Available online: https://www.sciencedirect.com/science/article/pii/S2213138822010104.
- Nehra M, Jain S. Estimation of renewable biogas energy potential from livestock manure: A case study of India. Bioresource Technology Reports [Internet]. 2023 Jun 1 [cited 2024 May 1];22:101432. Available online: https://www.sciencedirect.com/science/article/pii/S2589014X23001032.
- Alengebawy A, Mohamed BA, Ghimire N, Jin K, Liu T, Samer M, et al. Understanding the environmental impacts of biogas utilization for energy production through life cycle assessment: An action towards reducing emissions. Environmental Research [Internet]. 2022 Oct [cited 2024 May 22];213:113632. Available online: https://linkinghub.elsevier.com/retrieve/pii/S0013935122009598.
- Paolini V, Petracchini F, Segreto M, Tomassetti L, Naja N, Cecinato A. Environmental impact of biogas: A short review of current knowledge. Journal of Environmental Science and Health, Part A [Internet]. 2018 Aug 24 [cited 2024 May 1];53(10):899–906. Available online: https://www.tandfonline.com/doi/full/10.1080/10934529.2018.1459076.
- Ma J, Scott NR, DeGloria SD, Lembo AJ. Siting analysis of farm-based centralized anaerobic digester systems for distributed generation using GIS. Biomass and Bioenergy [Internet]. 2005 Jun [cited 2024 Sep 12];28(6):591–600. Available online: https://linkinghub.elsevier.com/retrieve/pii/S0961953405000164.
- Sharma B, Birrell S, Miguez FE. Spatial modeling framework for bioethanol plant siting and biofuel production potential in the U.S. Applied Energy [Internet]. 2017 Apr [cited 2024 Sep 12];191:75–86. Available online: https://linkinghub.elsevier.com/retrieve/pii/S0306261917300168.
- O’Shea R, Wall D, Kilgallon I, Murphy JD. Assessment of the impact of incentives and of scale on the build order and location of biomethane facilities and the feedstock they utilise. Applied Energy [Internet]. 2016 Nov [cited 2024 Sep 12];182:394–408. Available online: https://linkinghub.elsevier.com/retrieve/pii/S0306261916311503.
- Bojesen M, Birkin M, Clarke G. Spatial competition for biogas production using insights from retail location models. Energy [Internet]. 2014 Apr [cited 2024 Sep 12];68:617–28. Available online: https://linkinghub.elsevier.com/retrieve/pii/S0360544213010967.
- BBS. District-Statistics [Internet]. Bangladesh Bureau of Statistics-Government of the People\’s Republic of Bangladesh. 2019 [cited 2024 Sep 12]. Available online: https://bbs.gov.bd/site/page/2888a55d-d686-4736-bad0-54b70462afda/District-Statistics.
- ArcGIS Online [Internet]. 2024 [cited 2024 Nov 13]. Available online: https://www.google.com/search?client=firefox-b-d&q=arcgis+online.
- Avcioğlu AO, Türker U. Status and potential of biogas energy from animal wastes in Turkey. Renewable and Sustainable Energy Reviews [Internet]. 2012 Apr [cited 2024 Apr 21];16(3):1557–61. Available online: https://linkinghub.elsevier.com/retrieve/pii/S1364032111005235.
- Kaygusuz, K. Kaygusuz K. Renewable and sustainable energy use in Turkey: a review. Renewable and Sustainable Energy Reviews [Internet]. 2002 Aug [cited 2024 Apr 21];6(4):339–66. Available online: https://linkinghub.elsevier.com/retrieve/pii/S1364032101000077.
- Abdeshahian P, Lim JS, Ho WS, Hashim H, Lee CT. Potential of biogas production from farm animal waste in Malaysia. Renewable and Sustainable Energy Reviews [Internet]. 2016 Jul 1 [cited 2024 Apr 24];60:714–23. Available online: https://www.sciencedirect.com/science/article/pii/S1364032116001477.
- Afazeli H, Jafari A, Rafiee S, Nosrati M. An investigation of biogas production potential from livestock and slaughterhouse wastes. Renewable and Sustainable Energy Reviews [Internet]. 2014 Jun [cited 2024 Apr 21];34:380–6. Available online: https://linkinghub.elsevier.com/retrieve/pii/S1364032114001737.
- MoEFCC. Second National Communication of Bangladesh to the United Nations Framework on Convention on Climate Change. Bangladesh: Ministry of Environment and Forest; 2012.
- Rahman MdM, Paatero JV. A methodological approach for assessing potential of sustainable agricultural residues for electricity generation: South Asian perspective. Biomass and Bioenergy [Internet]. 2012 Dec [cited 2024 Sep 12];47:153–63. Available online: https://linkinghub.elsevier.com/retrieve/pii/S0961953412003868.
- Abraham A, Mathew AK, Sindhu R, Pandey A, Binod P. Potential of rice straw for bio-refining: An overview. Bioresource Technology [Internet]. 2016 Sep [cited 2024 Sep 12];215:29–36. Available online: https://linkinghub.elsevier.com/retrieve/pii/S0960852416304837.
- Hiloidhari M, Baruah DC. Crop residue biomass for decentralized electrical power generation in rural areas (part 1): Investigation of spatial availability. Renewable and Sustainable Energy Reviews [Internet]. 2011 May [cited 2024 Sep 12];15(4):1885–92. Available online: https://linkinghub.elsevier.com/retrieve/pii/S1364032110004454.
- Singh, J. Identifying an economic power production system based on agricultural straw on regional basis in India. Renewable and Sustainable Energy Reviews [Internet]. 2016 Jul [cited 2024 Sep 12];60:1140–55. Available online: https://linkinghub.elsevier.com/retrieve/pii/S1364032116002070.
- Deublein D, Steinhauser A. Biogas from Waste and Renewable Resources. In: Biogas from Waste and Renewable Resources [Internet]. John Wiley & Sons, Ltd; 2010 [cited 2024 May 24]. p. 85–95. Available online: https://onlinelibrary.wiley.com/doi/abs/10.1002/9783527632794.ch8.
- Benito M, Ortiz I, Rodríguez L, Muñoz G. Ni–Co bimetallic catalyst for hydrogen production in sewage treatment plants: Biogas reforming and tars removal. International Journal of Hydrogen Energy [Internet]. 2015 Nov [cited 2024 May 1];40(42):14456–68. Available online: https://linkinghub.elsevier.com/retrieve/pii/S0360319915016924.
- Garcia AP. Techno-economic feasibility study of a small-scale biogas plant for treating market waste in the city of El Alto [Internet]. KTH School of Industrial Engineering and Management Energy Technology EGI-2014-083MSC Division of Energy and Climate SE-100 44 STOCKHOLM; 2014. Available online: http://kth.diva-portal.org/smash/get/diva2:741758/FULLTEXT01.pdf.
- Halder PK, Paul N, Joardder MUH, Khan MZH, Sarker M. Feasibility analysis of implementing anaerobic digestion as a potential energy source in Bangladesh. Renewable and Sustainable Energy Reviews [Internet]. 2016 Nov [cited 2024 May 24];65:124–34. Available online: https://linkinghub.elsevier.com/retrieve/pii/S1364032116303276.
- Ngumah C, Ogbulie J, Orji J, Amadi E. Potential of Organic Waste for Biogas and Biofertilizer Production in Nigeria. Environmental Research, Engineering and Management [Internet]. 2013 Mar 28 [cited 2024 May 24];63(1):60–6. Available online: https://erem.ktu.lt/index.php/erem/article/view/2912.
- Saaty TL. Decision making with the analytic hierarchy process. IJSSCI [Internet]. 2008 [cited 2024 Sep 12];1(1):83. Available online: http://www.inderscience.com/link.php?id=17590.
- Laws of Bangladesh [Internet]. Legislative and Parliamentary Affairs Division Ministry of Law, Justice and Parliamentary Affairs. 2024 [cited 2024 Sep 12]. Available online: http://bdlaws.minlaw.gov.bd/laws-of-bangladesh.html?lang=en.
- Adroit Environment Consultants Ltd. Adroit Environment Consultants Ltd [Internet]. Bangladesh: Reliance Bangladesh LNG and Power Limited; 2017. Available online: https://www.adb.org/sites/default/files/project-documents/50253/50253-001-esia-en_1.pdf.
- Union of BC Municipalities. Landfill Guidelines [Internet]. 2016 [cited 2024 Nov 22]. Available online: https://www.ubcm.ca/convention-resolutions/resolutions/resolutions-database/landfill-guidelines.
- Berisa G, Birhanu Y. Municipal Solid Waste Disposal Site Selection of Jigjiga Town Using GIS and Remote Sensing Techniques, Ethiopia [Internet]. ResearchGate. 2015 [cited 2024 Nov 22]. Available online: https://www.researchgate.net/publication/283265396_Municipal_Solid_Waste_Disposal_Site_Selection_of_Jigjiga_Town_Using_GIS_and_Remote_Sensing_Techniques_Ethiopia.
- Thompson E, Wang Q, Li M. Anaerobic digester systems (ADS) for multiple dairy farms: A GIS analysis for optimal site selection. Energy Policy [Internet]. 2013 Oct [cited 2024 Nov 22];61:114–24. Available online: https://linkinghub.elsevier.com/retrieve/pii/S030142151300520X.
- Silva S, Alçada-Almeida L, Dias LC. Multiobjective programming for sizing and locating biogas plants: A model and an application in a region of Portugal. Computers & Operations Research [Internet]. 2017 Jul [cited 2024 Sep 12];83:189–98. Available online: https://linkinghub.elsevier.com/retrieve/pii/S0305054817300564.
- Perpiña C, Martínez-Llario JC, Pérez-Navarro Á. Multicriteria assessment in GIS environments for siting biomass plants. Land Use Policy [Internet]. 2013 Mar [cited 2024 Nov 22];31:326–35. Available online: https://linkinghub.elsevier.com/retrieve/pii/S026483771200138X.
- Chukwuma E, Chukwuma G, Orakwe L. GIS Suitability Analysis for Anaerobic Treatment Facility for Slaughter Houses in Anambra State of Nigeria. ACRI [Internet]. 2016 Jan 10 [cited 2024 Nov 22];4(4):1–10. Available online: https://journalacri.com/index.php/ACRI/article/view/51.
- Nikou S, Mezei J. Evaluation of mobile services and substantial adoption factors with Analytic Hierarchy Process (AHP). Telecommunications Policy [Internet]. 2013 Nov [cited 2024 Apr 21];37(10):915–29. Available online: https://linkinghub.elsevier.com/retrieve/pii/S0308596112001772.
- De Guardia A, Petiot C, Rogeau D, Druilhe C. Influence of aeration rate on nitrogen dynamics during composting. Waste Management [Internet]. 2008 Jan [cited 2024 May 24];28(3):575–87. Available online: https://linkinghub.elsevier.com/retrieve/pii/S0956053X07000633.
- Maeda K, Morioka R, Hanajima D, Osada T. The Impact of Using Mature Compost on Nitrous Oxide Emission and the Denitrifier Community in the Cattle Manure Composting Process. Microb Ecol [Internet]. 2010 Jan [cited 2024 May 24];59(1):25–36. Available online: http://link.springer.com/10.1007/s00248-009-9547-3.
- Velásquez Piñas JA, Venturini OJ, Silva Lora EE, Calle Roalcaba OD. Technical assessment of mono-digestion and co-digestion systems for the production of biogas from anaerobic digestion in Brazil. Renewable Energy [Internet]. 2018 Mar [cited 2024 Sep 12];117:447–58. Available online: https://linkinghub.elsevier.com/retrieve/pii/S0960148117310467.
- Economic Review. Finance Division, Ministry of Finance. [Internet]. 2023 [cited 2024 May 2]. Available online: https://mof.portal.gov.bd/site/page/28ba57f5-59ff-4426-970a-bf014242179e/Bangladesh-Economic-Review.
- Deublein D, Steinhauser A, editors. Biogas from Waste and Renewable Resources: An Introduction [Internet]. 1st ed. Wiley; 2008 [cited 2024 Sep 12]. Available online: https://onlinelibrary.wiley.com/doi/book/10.1002/9783527621705.
- Mary AK. Composting Animal Manures: A guide to the process and management of animal manure compost | NDSU Agriculture [Internet]. 2022 [cited 2024 May 24]. Available online: https://www.ndsu.edu/agriculture/extension/publications/composting-animal-manures-guide-process-and-management-animal-manure-compost.
- Rynk R, van de Kamp M, Willson GB, Singley ME, Richard TL, Kolega JJ, et al. On-Farm Composting Handbook (NRAES 54). 1992 Jun [cited 2024 May 24]. Available online: https://hdl.handle.net/1813/67142.
- ESRI E. Types of network analysis layers—ArcMap | Documentation [Internet]. 2024 [cited 2024 Sep 12]. Available online: https://desktop.arcgis.com/en/arcmap/latest/extensions/network-analyst/types-of-network-analyses.htm.
- Szabo G, Fazekas I, Szabo S, Szabo G, Buday T, Paladi M, et al. THE CARBON FOOTPRINT OF A BIOGAS POWER PLANT. Environ Eng Manag J [Internet]. 2014 [cited 2024 May 1];13(11):2867–74. Available online: http://www.eemj.icpm.tuiasi.ro/pdfs/vol13/no11/22_692_Szabo_14.pdf.
- De Vries JW, Vinken TMWJ, Hamelin L, De Boer IJM. Comparing environmental consequences of anaerobic mono- and co-digestion of pig manure to produce bio-energy – A life cycle perspective. Bioresource Technology [Internet]. 2012 Dec 1 [cited 2024 May 24];125:239–48. Available online: https://www.sciencedirect.com/science/article/pii/S0960852412013193.
- Ayodele TR, Ogunjuyigbe ASO, Alao MA. Economic and environmental assessment of electricity generation using biogas from organic fraction of municipal solid waste for the city of Ibadan, Nigeria. Journal of Cleaner Production [Internet]. 2018 Dec 1 [cited 2024 May 1];203:718–35. Available online: https://www.sciencedirect.com/science/article/pii/S0959652618326337.
- Nasir IM, Mohd Ghazi TI, Omar R. Anaerobic digestion technology in livestock manure treatment for biogas production: A review. Engineering in Life Sciences [Internet]. 2012 Jun [cited 2024 May 1];12(3):258–69. Available online: https://onlinelibrary.wiley.com/doi/10.1002/elsc.201100150.
- Noorollahi Y, Kheirrouz M, Asl HF, Yousefi H, Hajinezhad A. Biogas production potential from livestock manure in Iran. Renewable and Sustainable Energy Reviews [Internet]. 2015 Oct [cited 2024 May 28];50:748–54. Available online: https://linkinghub.elsevier.com/retrieve/pii/S1364032115004980.
- IPCC. IPCC Guidelines for National Greenhouse Gas Inventories Agriculture, Forestry and Other Land Use [Internet]. 2006 [cited 2024 May 28]. Available online: https://www.ipcc-nggip.iges.or.jp/public/2006gl/vol4.html.
- Viswanathan, B. Chapter 3 - Natural Gas. In: Viswanathan B, editor. Energy Sources [Internet]. Amsterdam: Elsevier; 2017 [cited 2024 May 30]. p. 59–79. Available online: https://www.sciencedirect.com/science/article/pii/B9780444563538000034.
- Lebel ED, Finnegan CJ, Ouyang Z, Jackson RB. Methane and NOx Emissions from Natural Gas Stoves, Cooktops, and Ovens in Residential Homes. Environ Sci Technol [Internet]. 2022 Feb 15 [cited 2024 May 30];56(4):2529–39. Available online: https://doi.org/10.1021/acs.est.1c04707.
- BPDB. - - Bangladesh Power Development Board- [Internet]. 2024 [cited 2024 Nov 12]. Available online: http://www.bpdb.gov.bd/site/page/d2d5afd4-9f20-4c05-9102-a7c7de13798e/-.
- FAO. FAOSTAT [Internet]. Food and Agriculture Organization of the United Nations. 2023 [cited 2024 Apr 23]. Available online: https://www.fao.org/faostat/en/#data/EK.
Figure 1.
Spatial distribution of livestock manure and rice residue intensity (tons/sq.km/year): (a) large animal manure, (b) small animal manure, (c) poultry manure, (d) rice straw.
Figure 1.
Spatial distribution of livestock manure and rice residue intensity (tons/sq.km/year): (a) large animal manure, (b) small animal manure, (c) poultry manure, (d) rice straw.
Figure 2.
Restriction maps for different restriction criteria: (a) transport network, (b) surface water, (c) protected area, (d) vulnerable area, (e) important places, (f) residential area.
Figure 2.
Restriction maps for different restriction criteria: (a) transport network, (b) surface water, (c) protected area, (d) vulnerable area, (e) important places, (f) residential area.
Figure 3.
Suitability maps for different suitability criteria: (a) road distance, (b) flood prone area (c) elevation.
Figure 3.
Suitability maps for different suitability criteria: (a) road distance, (b) flood prone area (c) elevation.
Figure 4.
The final restriction and suitability map based on all restriction and suitability criteria: (a) final restriction map; (b) suitability map.
Figure 4.
The final restriction and suitability map based on all restriction and suitability criteria: (a) final restriction map; (b) suitability map.
Figure 5.
The final suitability map for biogas plants: (a) final suitability map, (b) suitable parcels.
Figure 5.
The final suitability map for biogas plants: (a) final suitability map, (b) suitable parcels.
Figure 6.
Primarily selected upazilas with suitable places for biogas plants from livestock manure: (a) large animal manure, (b) small animal manure, (c) poultry manure.
Figure 6.
Primarily selected upazilas with suitable places for biogas plants from livestock manure: (a) large animal manure, (b) small animal manure, (c) poultry manure.
Figure 7.
Chosen sites for large-scale biogas plants from large animal (cattle and buffalo) manure in Bangladesh.
Figure 7.
Chosen sites for large-scale biogas plants from large animal (cattle and buffalo) manure in Bangladesh.
Figure 8.
Chosen sites for large-scale biogas plants from small animal (sheep and goat) manure in Bangladesh.
Figure 8.
Chosen sites for large-scale biogas plants from small animal (sheep and goat) manure in Bangladesh.
Figure 9.
Chosen sites for large-scale biogas plants from poultry (chicken and duck) manure in Bangladesh.
Figure 9.
Chosen sites for large-scale biogas plants from poultry (chicken and duck) manure in Bangladesh.
Figure 10.
Chosen sites for large-scale biogas plants with their best locations (top 10% of chosen locations) from different livestock in Bangladesh.
Figure 10.
Chosen sites for large-scale biogas plants with their best locations (top 10% of chosen locations) from different livestock in Bangladesh.
Table 1.
Factors to calculate biogas production potentiality in this study.
Table 1.
Factors to calculate biogas production potentiality in this study.
| Livestock types |
Manure generation rate (kg/head/day) |
Availability coefficient (%) |
TS of manure (%) |
Biogas yield (m3 kg-1 TS) |
DM (% of manure) |
VS (% of DM) |
| Large animal |
19 |
50 |
25 |
0.50 |
25 |
80 |
| Small animal |
0.8 |
13 |
23 |
0.40 |
18 |
80 |
| Poultry |
0.045 |
90 |
25 |
0.80 |
10 |
70 |
Table 2.
Restriction criteria with buffer areas for restriction modeling.
Table 2.
Restriction criteria with buffer areas for restriction modeling.
|
Transport Network [Road, Railways] |
Surface Water [River, Lake, Pond] |
Protected Area [National Park and Forest] |
Residential Area [Cities, Towns, Villages] |
Important Places [Airports, Helipads, Hospital, Education Facilities] |
Vulnerable Area [River Erosion Area, Wetland] |
References |
| 100m |
100m |
100m |
500m |
100m |
100m |
[47] |
| 100m |
200m |
- |
300m |
300m |
- |
[48] |
| 30m |
100m |
500m |
1km |
500m |
- |
[24] |
| - |
200m |
- |
500m |
- |
- |
[49] |
| 70m |
150m |
- |
200m |
- |
- |
[50] |
| 100m |
500m |
500m |
600m |
500m |
300m |
[51] |
| 30m |
200m |
500m |
1km |
- |
500m |
[52] |
Road: 200 m
Railway: 300 m |
River: 500 m
Lake & pond: 300 m |
500 m |
Cities and Towns: 2 km
Villages:1 km |
Airports and Helipads: 1 km
Others: 500 m |
500 m |
This study |
Table 3.
Reclassification criteria for suitability modeling.
Table 3.
Reclassification criteria for suitability modeling.
| Features |
Comments |
Highly Suitable |
Moderately Suitable |
Low Suitable |
Not Suitable |
| Road Network |
The closer to road has higher suitability. |
500 m |
1 km |
2 km |
> 2 km |
| Flood Prone Area |
The higher the sensitivity of flood occurrence, the lower in suitability. |
No flooding |
Low flooding |
Moderate flooding |
Severe flooding |
| Elevation |
The higher and lower elevation both have lower suitability. |
8-50 m |
4-7 m |
51-79 m |
0-3 m
80-940 m |
Table 4.
Suitability criteria with their detailed weighted preferences.
Table 4.
Suitability criteria with their detailed weighted preferences.
| Criteria |
Comparative Preferences of Each Criteria |
Final Weighted Preferences |
| Collection efficiency |
Safety |
Cost minimization |
| Road Network |
72.35 % |
12.01 % |
64.34 % |
48.9 % |
| Flood Prone Area |
8.33 % |
74.56 % |
7.38 % |
30.1 % |
| Elevation |
19.32 % |
13.43 % |
28.28 % |
21 % |
Table 5.
Results from different scenarios.
Table 5.
Results from different scenarios.
| Items |
Scenario-B1 |
Scenario-B2 |
Scenario-B3 |
Total |
| Manure types |
Large animal |
Small animal |
Poultry manure |
- |
| Primary selected upazilas |
227 |
175 |
198 |
- |
| Number of biogas plants |
0475 |
15 |
68 |
558 |
| Total capacity of plants, MW/year |
2,85,000 |
4,500 |
30,600 |
3,20,100 |
| Total biogas production, million m3/year |
4,562.82 |
72.53 |
486.45 |
5,121.81 |
| Energy, GWh/year |
6,844.23 |
108.81 |
729.68 |
7,682.72 |
| Total GHG reduction, gigagram CO2eq/year |
5,903.15 |
103.59 |
629.34 |
6,636.08 |
| Total biofertilizer production, kilotons/year |
5,230.80 |
81.35 |
155.51 |
5,467.66 |
| Required amount of available livestock manure, kilotons/year |
40,237.21 |
869.12 |
2,681.12 |
43,787.45 |
| Disposed amount of livestock manure, kilotons/year |
80,474.41 |
6,685.39 |
2,979.02 |
90,138.82 |
|
Disclaimer/Publisher’s Note: The statements, opinions and data contained in all publications are solely those of the individual author(s) and contributor(s) and not of MDPI and/or the editor(s). MDPI and/or the editor(s) disclaim responsibility for any injury to people or property resulting from any ideas, methods, instructions or products referred to in the content. |
© 2024 by the authors. Licensee MDPI, Basel, Switzerland. This article is an open access article distributed under the terms and conditions of the Creative Commons Attribution (CC BY) license (https://creativecommons.org/licenses/by/4.0/).
