Submitted:
29 November 2024
Posted:
02 December 2024
You are already at the latest version
Abstract
Sea level rise (SLR) poses significant risks to coastal regions worldwide, with over one billion people living in low-lying areas already experiencing its effects. Mozambique, with a population of 32.97 million and an extensive coastline, is particularly vulnerable to extreme events. This study examines the past and future dynamics of sea level rise along the Mozambican coast, focusing on the cities of Maputo, Inhambane, Beira, and Pemba. Using a combination of historical sea level data (2010-2020) and future projections (2021-2050) derived from global climate models (CMIP6) and oceanographic databases, the study analyzes regional variations in sea level behavior through time series and spatial distribution using Matlab for image visualization.
The results highlight that Pemba and Maputo are the most vulnerable areas to rising sea levels. Therefore, integrated adaptation strategies are recommended, prioritizing nature-based solutions within disaster risk management frameworks to protect Mozambique's coastal communities and ecosystems, ensuring greater resilience to the ongoing and projected impacts of sea level rise.
Keywords:
Sea Level Rise (SLR)
; Mozambique Coastal Vulnerability
; Disaster Risk Reduction
; Adaptation Strategies
; Nature-based Solutions
1. Introduction
The recent projections on global sea level rise indicate significant risks for about one billion people living in low-lying coastal areas [1]. Globally the urban population will increase from 2.8 billion in 2000 to 5 billion in 2030, and urban land cover will triple from 2000 to 2030 [2].
Mozambique has a population of 34,858,402, with 14,201,743 living in urban areas, accounting for 40.2%, and this number of people living in urban areas is expected to increase (Worldormeter, 2024).
Therefore, we can see that projections indicate both sea levels and urban populations are rising, which may have devastating impacts on biodiversity and human populations. To mitigate these impacts, nature-based solutions offer a promising path. The [4] present mangroves as a solution to reduce flooding in coastal zones, which can also be referred to as green infrastructure.
According Gijón Mancheño et al., (2024) mangroves not only reduce flooding impacts but also cut infrastructure costs by up to $65 billion USD annually, potentially saving between $71 billion and $168 billion USD by 2080. Mangroves can counteract sea level rise up to 7 mm per year [6]. Paradoxically, mangroves are decreasing due to the impacts of climate change (sea level rise) and anthropogenic actions [7]. Recent rates of sea level rise have doubled from 1.8 mm to 3.4 mm per year [8]. Nonetheless, numerous studies support the role of mangroves as a vital adaptation strategy for addressing sea level rise of up to 7 mm per year. (Woodroffe et al., 2016; Saintilanet al., 2020).
The study of Santos et al., (2024) show that Mozambique has potential of bring multi-level approach to reduce impacts of sea level and others events extreme, and paradoxically the study of Mucova et al., (2021) show that Mozambique has coming register mean of sea level above the mean globally. Urban development in Mozambique contributes to natural disaster risks, with over 1,000 people migrating from rural to urban areas annually, impacting the hydrologic cycle. Mitigation and adaptation strategies include Disaster Risk Management (DRM) and Disaster Risk Reduction (DRR), focusing on financial protection, risk identification, preparedness, and resilient construction. Prioritizing preparedness is crucial for effective disaster response and for 'Building Back Better' during recovery and reconstruction [12].
The goals of this study are to understand the current and future behavior of sea level rise along the coast of Mozambican cities (Maputo, Inhambane, Beira, and Pemba) using time series analysis and spatial distribution analysis. This will help identify adaptation and mitigation approaches to address sea level rise, with a focus on recommending nature-based solutions.
2. Material and Methods
2.1. Study Area
This study focuses particularly on the four stations marked in Figure 1 (Maputo, Inhambane, Beira, and Pemba). This coast is located in Eastern Africa between latitudes 10° and 27°S, spanning approximately 2700 km in length. This area coincides with the Mozambique Channel, whose narrowest part is 100 km wide at 16.11°S, and the widest part is 420 km wide at 20°S.
Tides are periodic oscillations in sea level caused by the gravitational attraction of the Earth-Sun-Moon system, along with centripetal acceleration and the Earth's rotation. Based on the differences in levels between consecutive high and low tides, tides are classified into three groups: Micro-tidal (a < 2 m), Meso-tidal (2 < a < 4 m), and Macro-tidal (a > 4 m) [13]
The dominant tide in Mozambican coast can be classified by the form factor, F, which is the ratio between the sum of the diurnal amplitudes (K1+O1) and (M2+S2), using equation
F=k1+O1/M2+S2
2.2. Datasets and Method
Sea level elevation data were sourced from climate and oceanographic repositories, including projections derived from reanalysis and high-resolution CMIP6 climate models (Global sea level change indicators from 1950 to 2050 derived from reanalysis and high-resolution CMIP6 climate projections (copernicus.eu). These projections, covering the period 2021–2050, were calculated using best-fit climate models, with the main variables comprising geographic coordinates of monitoring stations and mean sea level changes.
For the spatial distribution of sea level changes between 2021 and 2050, MATLAB was employed for data processing and visualization, focusing on four key coastal cities—Maputo, Inhambane, Beira, and Pemba.
Additionally, Sea Surface Height (SSH) data for 2009–2019, obtained from; https://marine.copernicus.eu/ with a spatial resolution of 1/4°, were analyzed. MATLAB facilitated calculations of temporal arithmetic averages and spatial interpolation to smooth data distribution. A mean SSH distribution map was generated to identify patterns and assess coastal vulnerabilities in the study region.
The time series of the average SSH and projections for the selected cities were visualized through line and bar charts to highlight the evolution of sea level between 2010 and 2020. This process aids in the analysis of the projections for the average sea level rise from 2021 to 2050. The data provides insights into sea level elevation in the key study areas, serving as a foundation for assessing coastal vulnerabilities and the risks associated with sea level rise up to 2050.
3. Results
3.1. Past Behaviour of Sea Level in Cities Coast Mozambican
The Figure 2 below illustrates the spatial distribution of the mean sea level from 2010 to 2020. Based on the colour bar and the polygons representing the studied cities (Maputo, Inhambane, Beira, and Pemba), it is evident that the mean levels varied across the stations. During this period, the recorded mean levels were 0.3 m in Maputo, 0.4 m in Inhambane, 0.45 m in Beira, and 0.54 m in Pemba. These data highlight the spatial variation of mean sea level, with Pemba emerging as the station with the highest average values throughout the analysed period.
The Figure 3 below presents the temporal variation of mean sea level from 2010 to 2020 for four stations: Maputo, Inhambane, Beira, and Pemba. During this period, it is observed that the Pemba station recorded the most extreme mean levels, with a peak of 0.6 m in 2016. The city of Beira also showed significant levels, with records exceeding 0.5 m. On the other hand, the stations of Inhambane and Maputo recorded mean sea levels below 0.5 m. Inhambane showed relatively stable variation throughout the period, while Maputo exhibited greater variability, including extreme events. In 2011, a mean level below 0.3 m was recorded in Maputo, while in 2013, this value increased to 0.4 m.
Of all the stations, Maputo stands out for recording the most extreme events, alternating between means below and above normal levels. Pemba emerges as the second station with records of extreme events, although its fluctuations were more stable over the years.
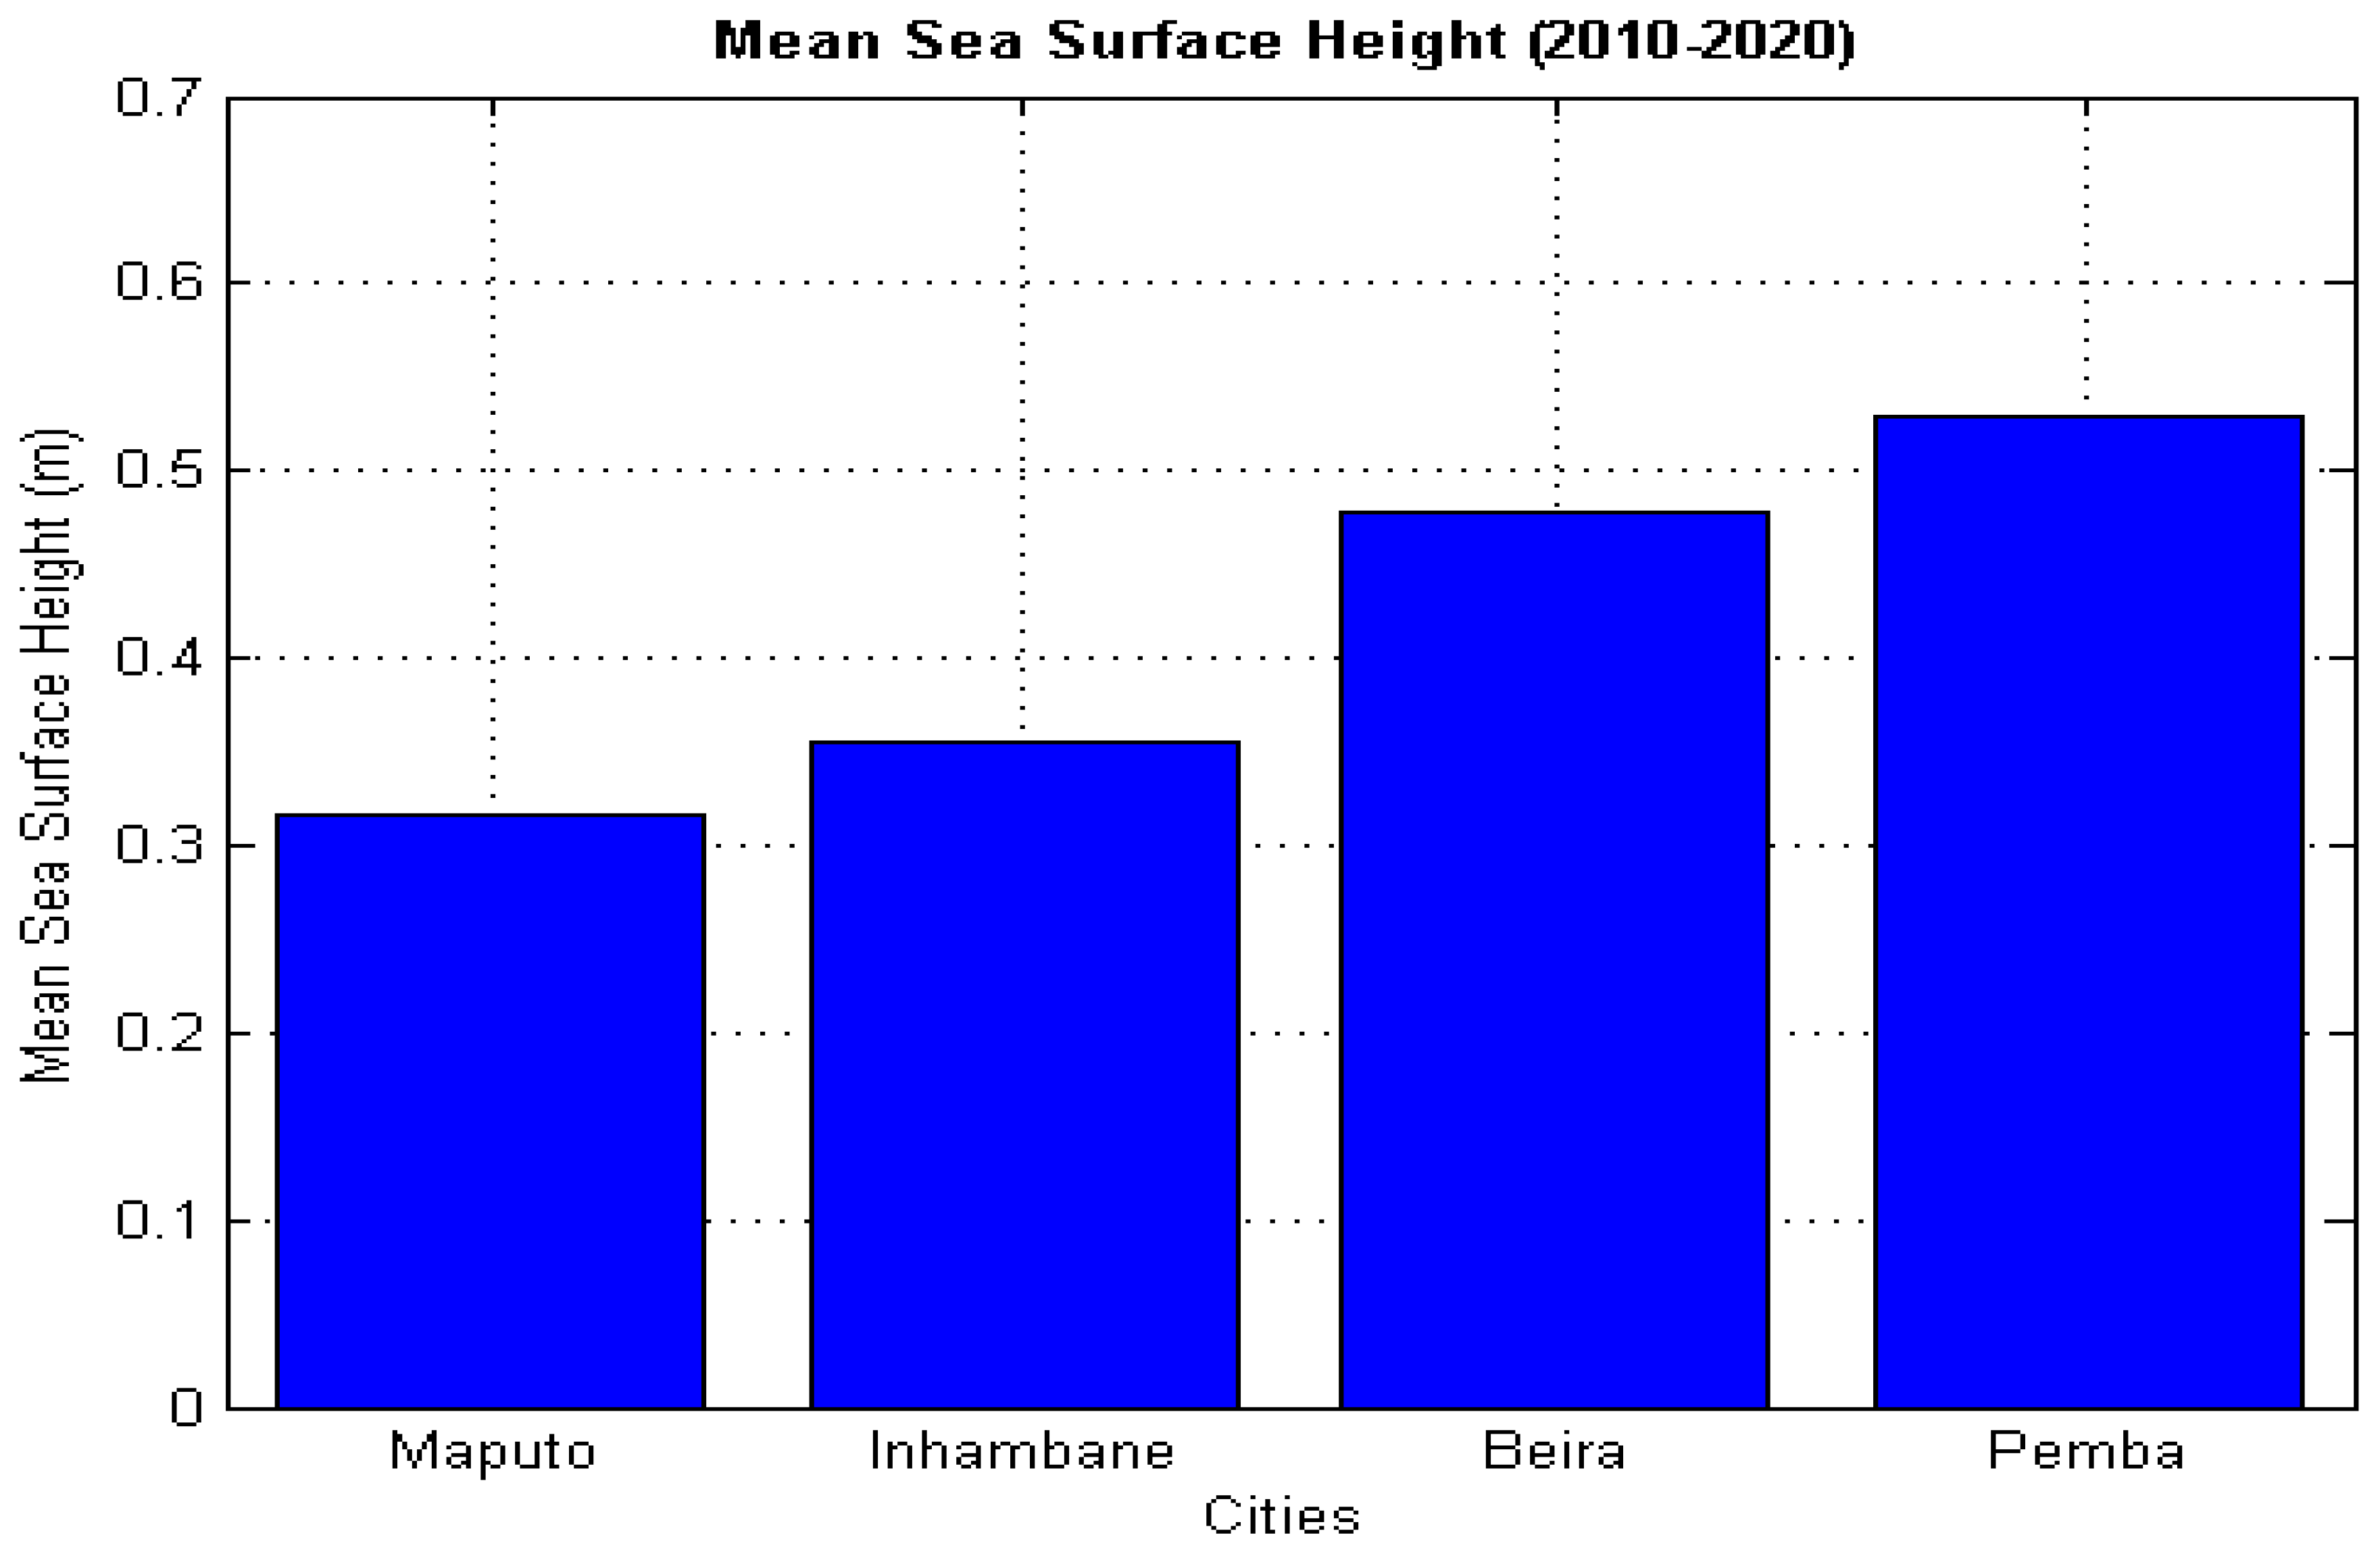
The Figure 4, below is the variation in sea level across the four stations, presented in a bar chart that provides a clear and detailed summary. This representation facilitates the observation of differences in the mean sea level recorded in each city, with values consistent with those described in the map and time series chart.
The mean sea levels recorded were 0.32 m in Maputo, 0.36 m in Inhambane, 0.48 m in Beira, and 0.54 m in Pemba. These results reflect the spatial and temporal variation in sea level, highlighting Pemba as the station with the highest average values and Maputo with the lowest.
3.2. Furure Behaviour of Sea Level in Cities Coast Mozambican
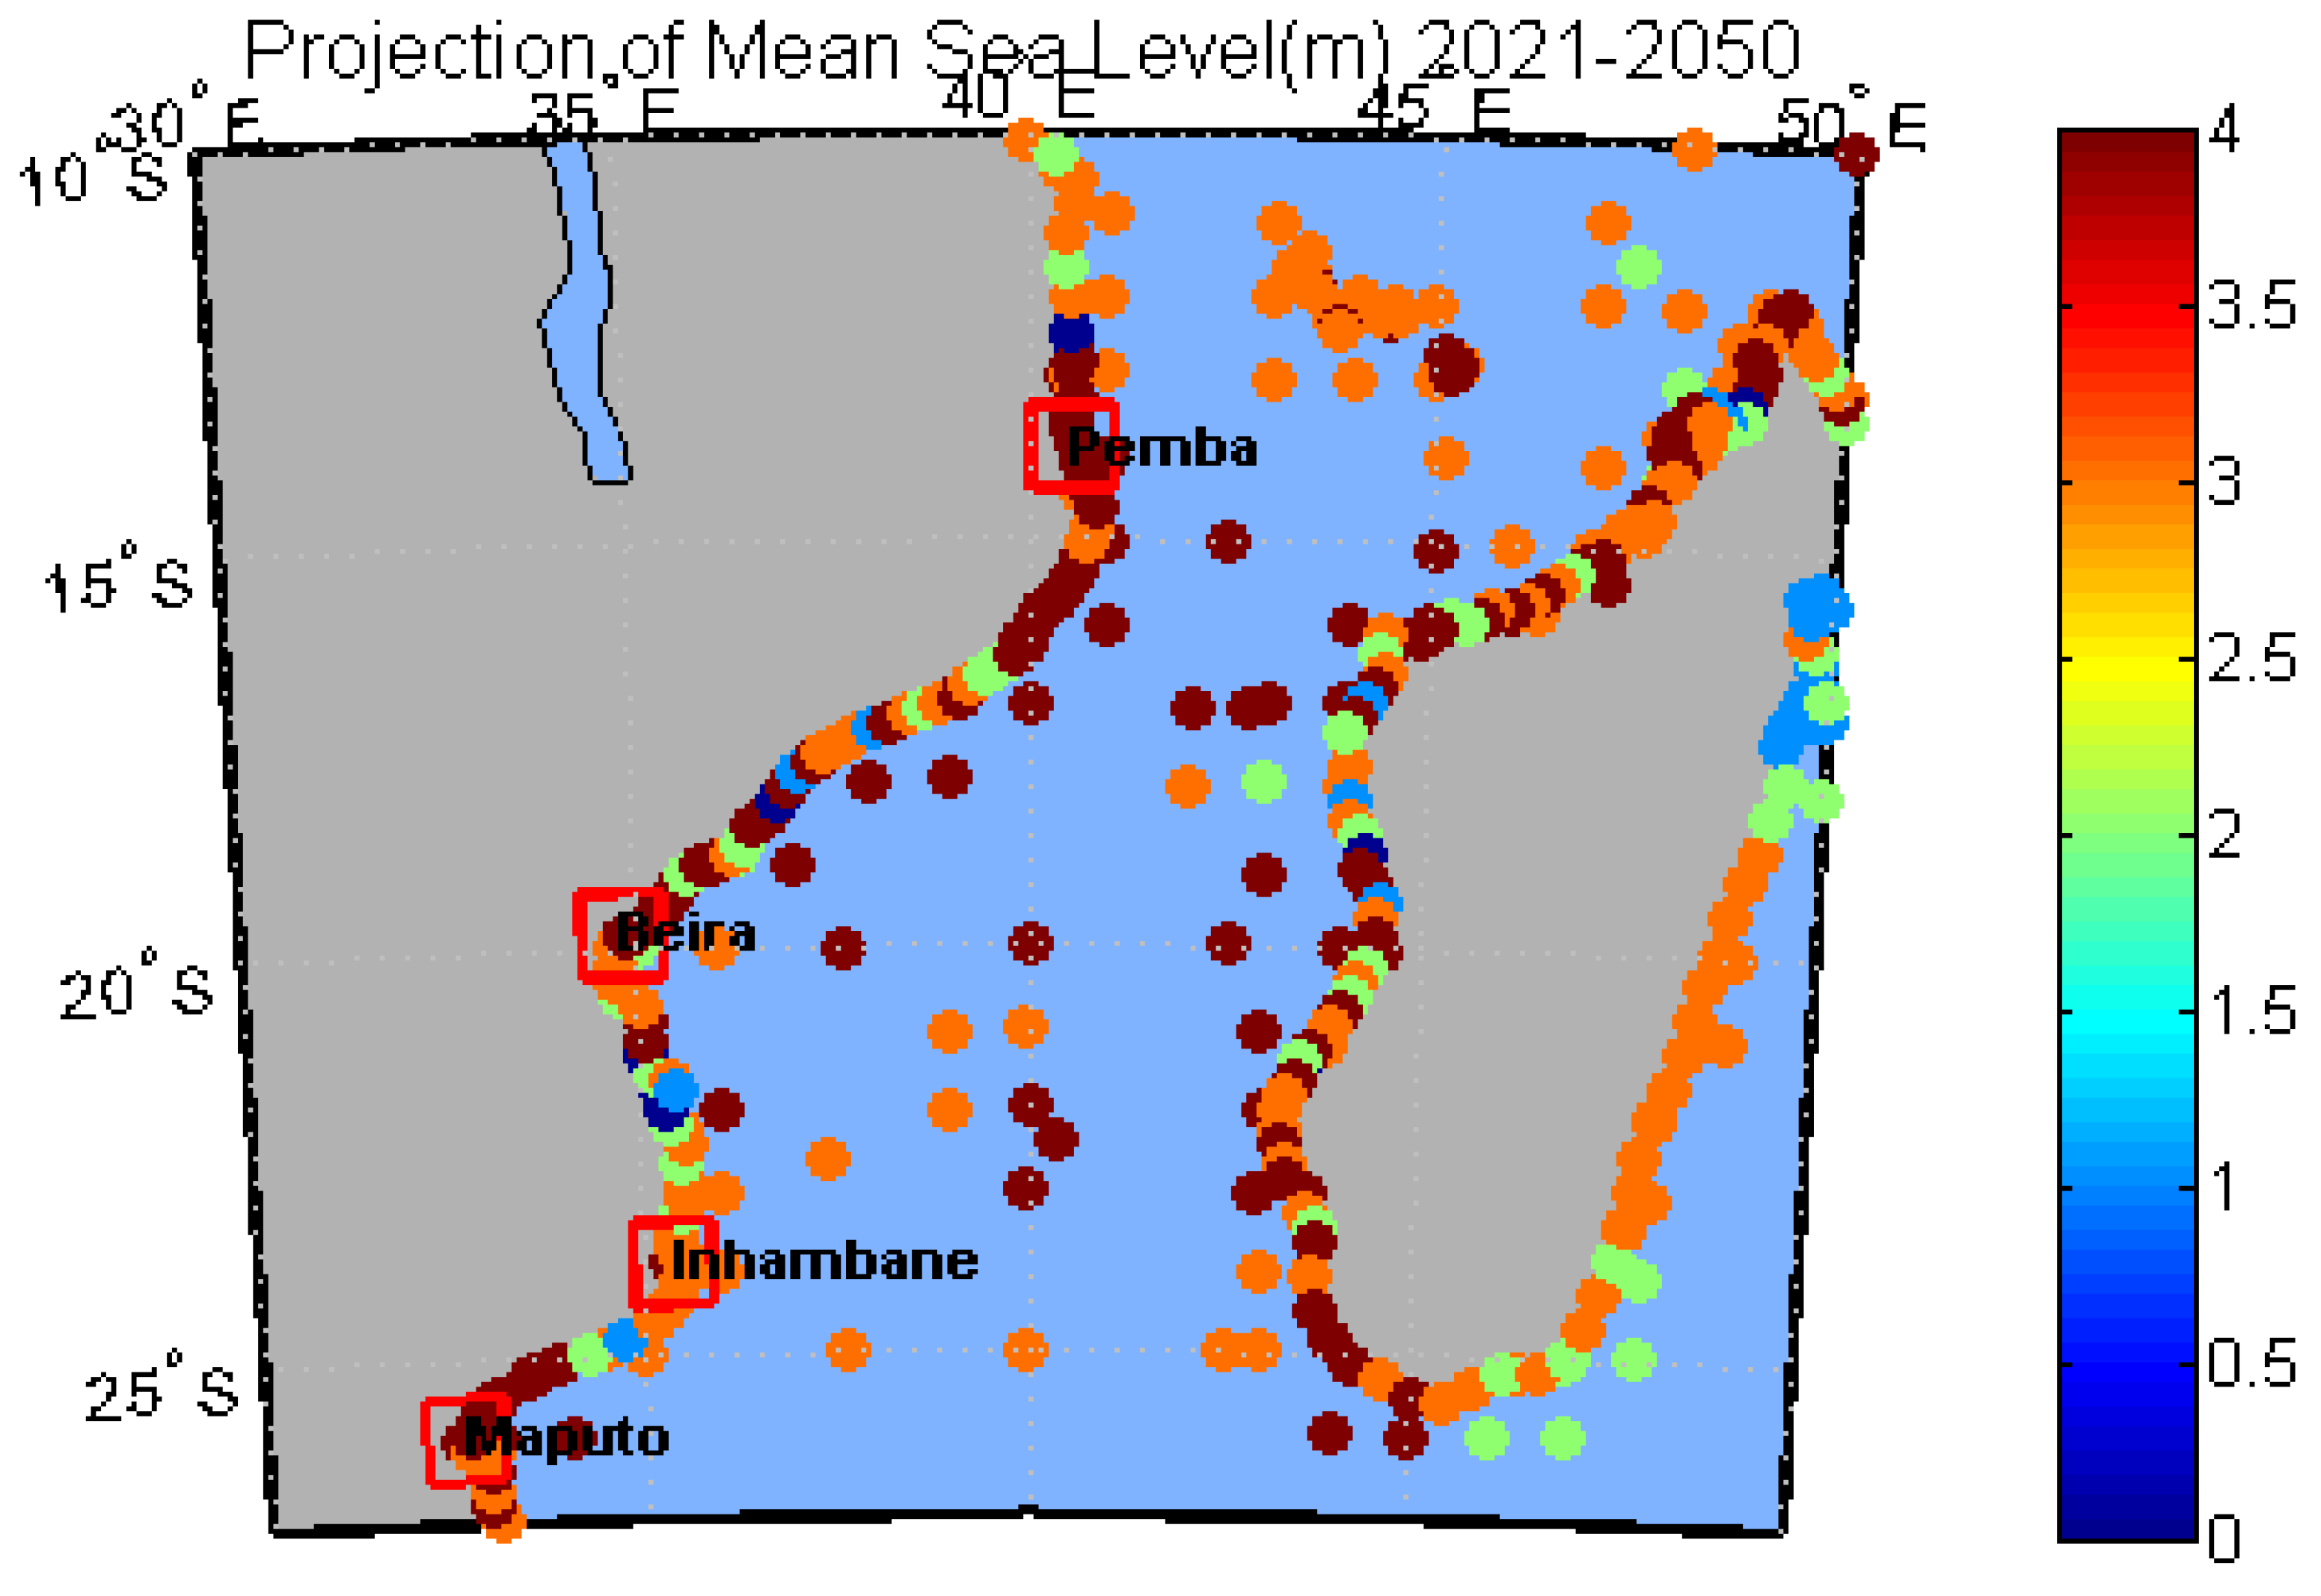
The Figure 6; presents the spatial distribution of mean sea level for the period 2021 to 2050 at the stations of Maputo, Inhambane, Beira, and Pemba. Using the colour bar and the polygons representing the cities, significant regional differences were observed. Pemba recorded the highest mean level, reaching 4 m, while Beira showed a mean of 3 m. In Inhambane, the average value was 2 m, demonstrating greater stability compared to the other stations. In Maputo, spatial variation was identified between 2.5 m and 4 m.
These results highlight the influence of local factors on sea level behaviour, with Pemba standing out as the most affected area. The wide variation observed in Maputo may be linked to specific regional characteristics, reflecting a more complex sea level dynamic compared to the other cities analysed.
Figure 5.
Spatial Distribution of Mean Sea Level, 2021-2050.
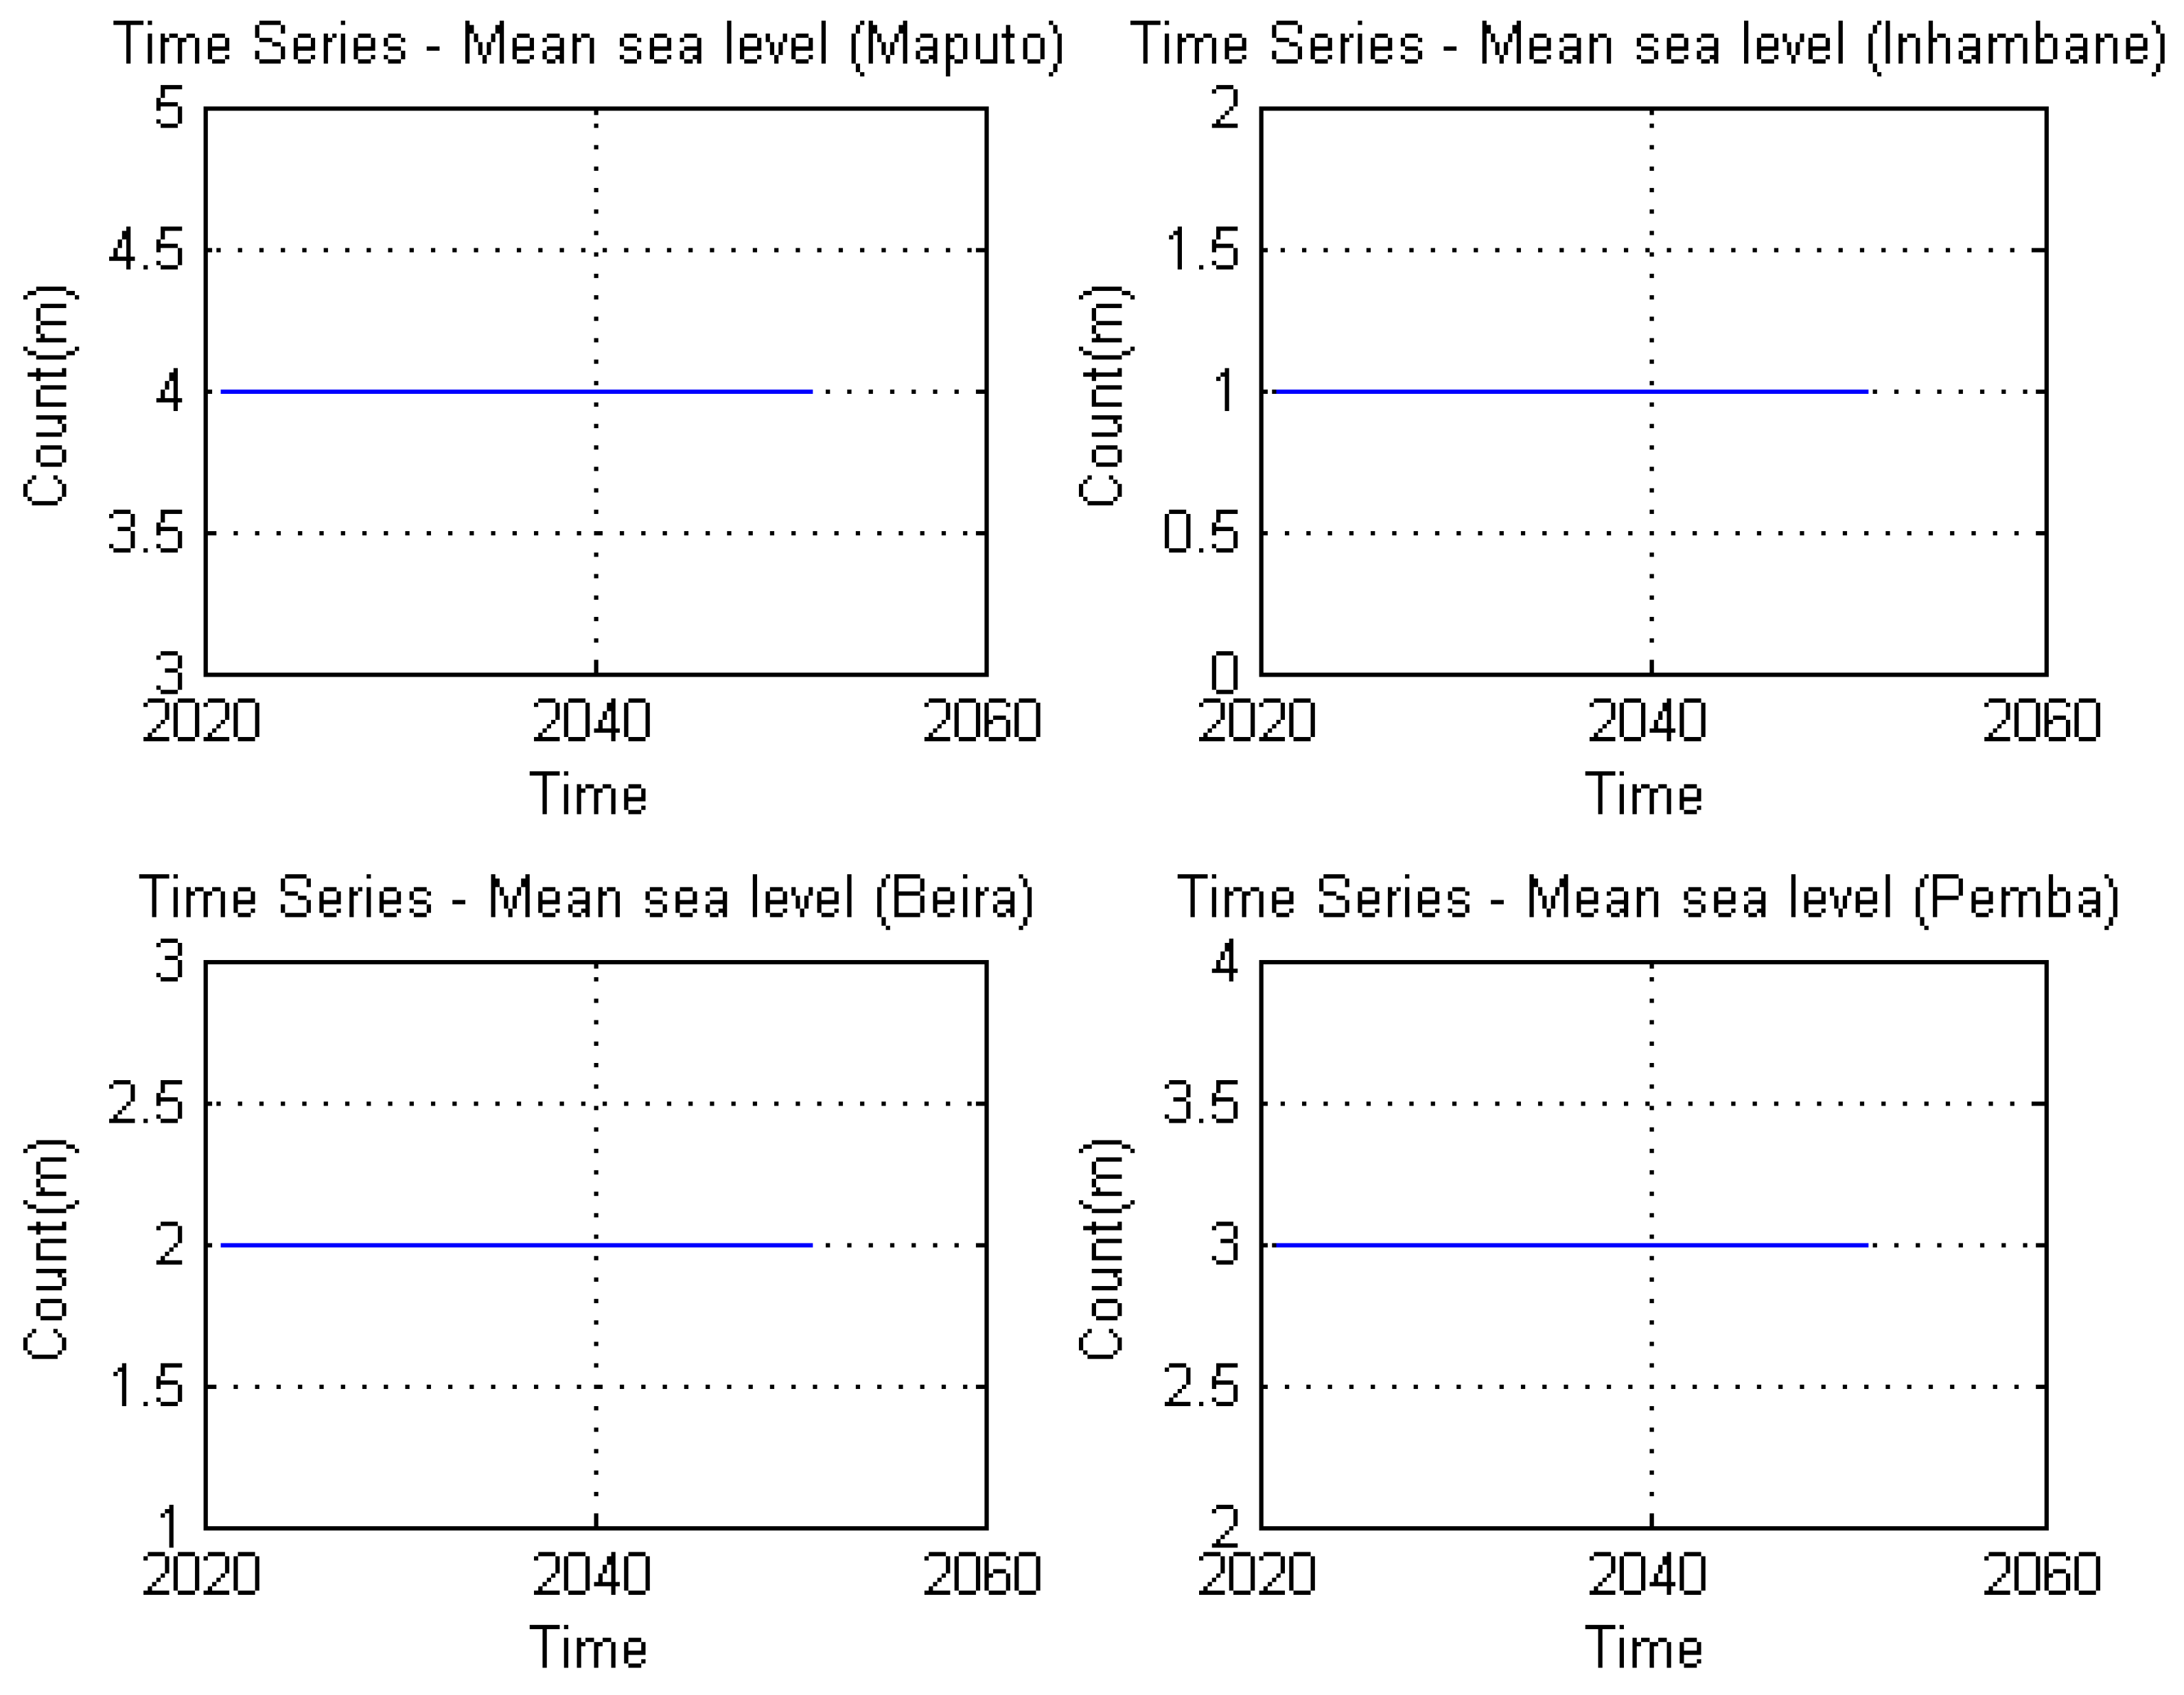
The Figure 6: illustrates the variation in mean sea level across the four stations (Maputo, Inhambane, Beira, and Pemba) for the period 2021 to 2050. The figure reveals that Maputo has the highest mean sea level, with a value of 4 m, followed by Pemba, which records an average of 3 m. Beira's mean level was 2 m, while Inhambane shows the lowest value, with only 1 m.
These data highlight Maputo as the most impacted station, with the highest records throughout the period, followed by Pemba. On the other hand, Inhambane displayed the lowest average values, suggesting greater stability compared to the other regions. These patterns reinforce the importance of considering regional variations when planning adaptive strategies to mitigate the impacts of sea level rise.
Figure 6.
Variation of Mean Sea Level from 2020 to 2050.
4. Discussion
Climate change is one of the most pressing challenges of our time [14]. Recent studies on sea level rise (SLR) highlight its significant impacts, which are consistent with the findings of this study. Historical data shows a global SLR trend of 1.6 mm/year from 1900 to 2015. This rate has accelerated to 3.15 ± 0.3 mm/year between January 1993 and February 2019, with an observed acceleration of 0.10 ± 0.04 mm/year² [15].
One of the most profound impacts of SLR is on biodiversity. For instance, mangroves a critical coastal ecosystem face both opportunities and threats. While some areas may expand due to rising sea levels, habitat coverage is expected to decline significantly by the end of the century [16]. Well-preserved mangroves can adapt to moderate SLR through soil accretion, but drastic losses are likely under significant SLR scenarios [17]. Protecting and conserving mangroves through reforestation and promoting soil accretion are critical to enhancing their resilience.
Mozambique, with the majority of its population residing along the coast, is particularly vulnerable to the effects of SLR. Coastal communities heavily depend on marine resources and agriculture, both of which are threatened by saline intrusion. This not only diminishes soil productivity but also impacts fishing yields, thereby posing significant economic challenges. Infrastructure in low-lying areas, such as Beira, faces heightened risk from SLR and associated hazards. As a result, urgent mitigation measures, particularly nature-based solutions, are essential to address these vulnerabilities.
The vulnerability of Mozambique's coastline is often highlighted in studies as among the highest in Africa [18]. However, this vulnerability is more accurately attributed to a lack of adaptive capacity, including insufficient resilient infrastructure and robust adaptation plans, rather than the geographical or environmental features alone. In comparison to other coastal regions globally, Mozambique’s challenges stem largely from socioeconomic and infrastructural limitations.
Globally, climate change exacerbates risks such as floods, coastline erosion, freshwater contamination, and threats to food security [19]. These impacts further emphasize the urgency of conserving biodiversity and implementing adaptive measures. Reforestation, mangrove restoration, and robust coastal management strategies are crucial steps for mitigating the effects of SLR and enhancing resilience in vulnerable regions.
Notably, [11] highlight that Mozambique experiences mean sea level values above the global average, reflecting its heightened vulnerability. [20] further establish a strong correlation between tide gauge and satellite altimetry data, validating the reliability of these measurement methods. Satellite data has been instrumental in providing a comprehensive understanding of sea level variations, aiding in policy and adaptation planning.
5. Conclusions
This study underscores the significant impact of climate change on Mozambique's coast, particularly in terms of rising sea levels. Historical data (2010–2020) indicates that Pemba recorded the highest SLR values, followed by Beira, while Maputo and Inhambane showed relatively lower vulnerability. However, projections for 2021–2050 illustrate a shift, with Maputo expected to experience the highest SLR levels, followed by Pemba at 3 m, and Inhambane and Beira at 1 m.
The anticipated impacts include severe damage to coastal infrastructure and marine biodiversity. Mozambique’s coastline, known for its coral reefs, mangroves, dunes, and sandy beaches, supports biodiversity and attracts millions of tourists annually. These ecosystems are pillars of economic development and are at risk from SLR.
Urgent adaptation and mitigation measures are needed to address these challenges. Nature-based solutions, such as mangrove reforestation and promoting soil accretion, can play a vital role in enhancing resilience. Additionally, robust coastal management and strategic planning are essential to protect livelihoods, biodiversity, and infrastructure along Mozambique’s coast.
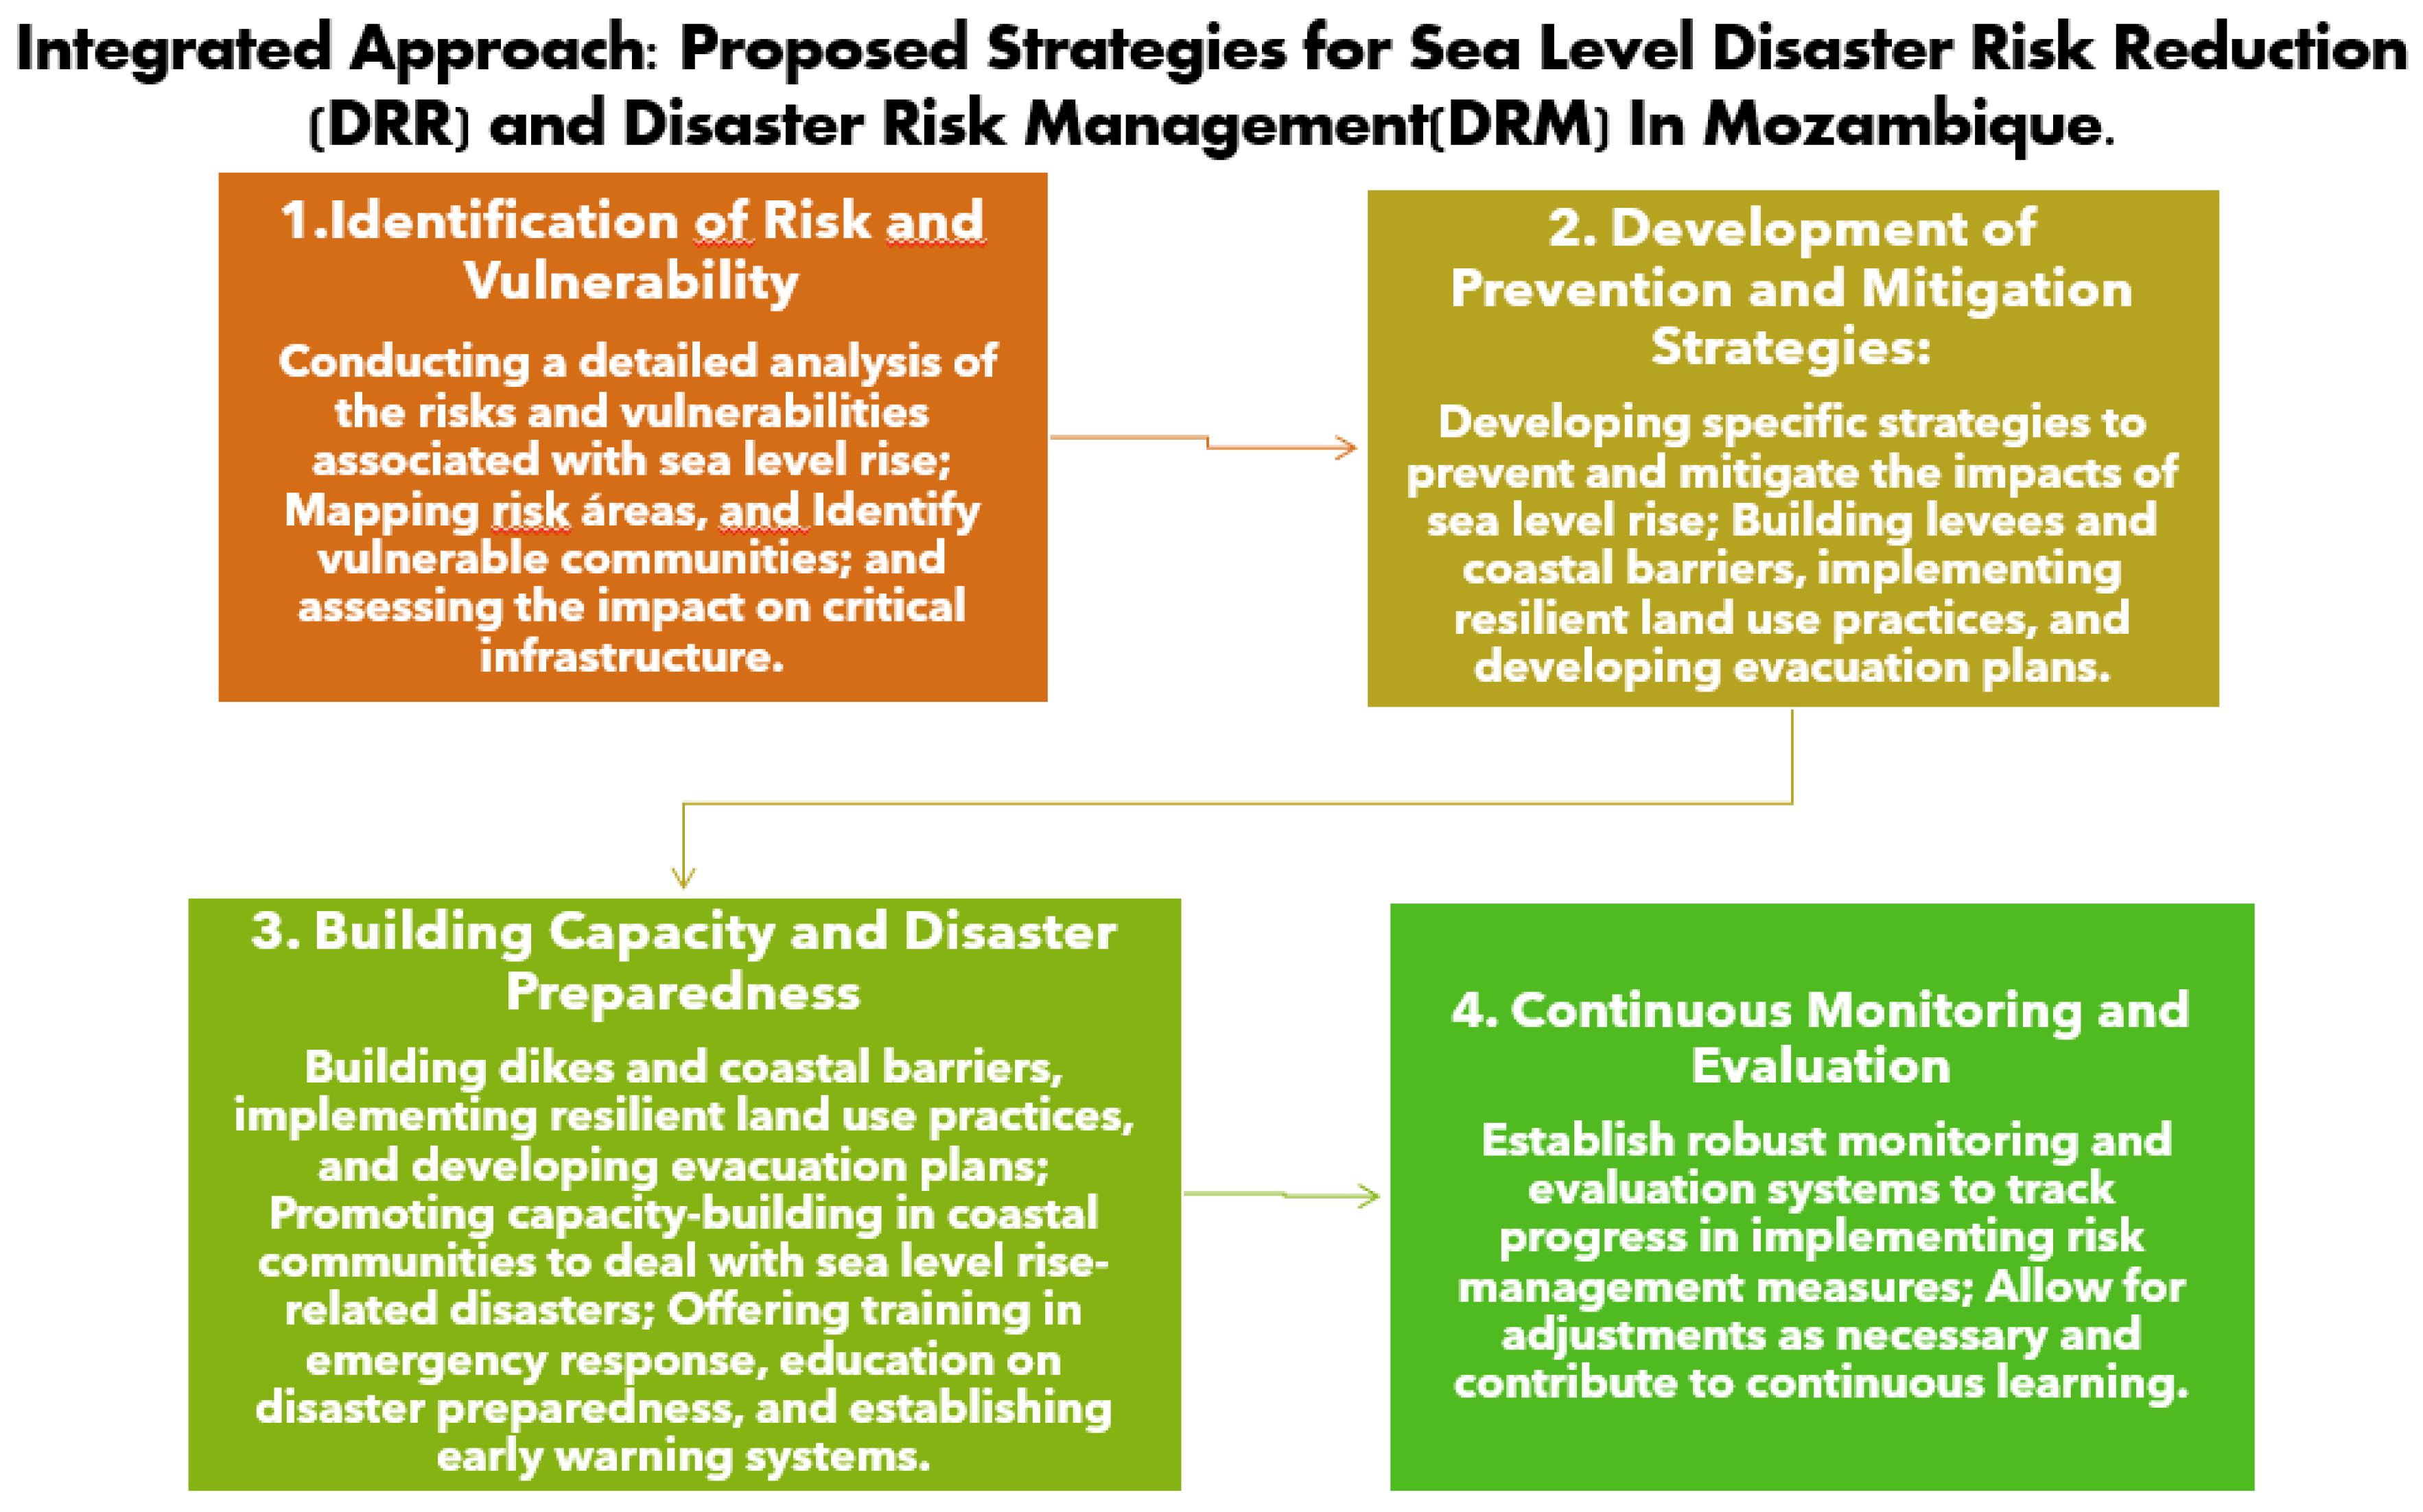
Proposal for Adaptation and Mitigation
The central and northern regions of Mozambique's coast, particularly Beira and Pemba, stand out for their rich biodiversity and marine protected areas. These regions have greater mangrove biomass compared to the southern region. However, the southern region, especially Maputo, plays a central role in the country's development and, by 2050, is projected to be the most impacted by rising sea levels, with values surpassing those of other stations. This scenario demands greater attention, as it could affect critical infrastructure and biodiversity along the entire Mozambican coast.
Based on the findings of this study and the need to reduce disaster risk, the following adaptation and mitigation measures are recommended:
Figure 7.
Integrated Approach: Proposed Strategies for Sea Level Rise to Disaster Risk Reduction (DRR) and Disaster Risk Management (DRM) in Mozambique.
Figure 7.
Integrated Approach: Proposed Strategies for Sea Level Rise to Disaster Risk Reduction (DRR) and Disaster Risk Management (DRM) in Mozambique.
Declaration of Generative AI and AI-assisted technologies in the writing process
The authors did not use any AI tools in the preparation of this work.
Data Availability
Data will be made available on request.
References
- S. A. Kulp and B. H. Strauss, “Author Correction: New elevation data triple estimates of global vulnerability to sea-level rise and coastal flooding,” Nature Communications 2019 10:1, vol. 10, no. 1, pp. 1–2, Dec. 2019. [CrossRef]
- K. C. Seto, B. Güneralp, and L. R. Hutyra, “Global forecasts of urban expansion to 2030 and direct impacts on biodiversity and carbon pools,” Proc Natl Acad Sci U S A, vol. 109, no. 40, pp. 16083–16088, Oct. 2012. [CrossRef]
- “Mozambique Population (2024) - Worldometer.” Accessed: May 25, 2024. [Online]. Available: https://www.worldometers.info/world-population/mozambique-population/.
- T. Tiggeloven et al., “The benefits of coastal adaptation through conservation of foreshore vegetation,” in Journal of Flood Risk Management, John Wiley and Sons Inc, Sep. 2022. [CrossRef]
- A. Gijón Mancheño et al., “Integrating mangrove growth and failure in coastal flood protection designs,” Sci Rep, vol. 14, no. 1, Dec. 2024. [CrossRef]
- C. D. Woodroffe, K. Rogers, K. L. McKee, C. E. Lovelock, I. A. Mendelssohn, and N. Saintilan, “Mangrove Sedimentation and Response to Relative Sea-Level Rise,” Ann Rev Mar Sci, vol. 8, pp. 243–266, Jan. 2016. [CrossRef]
- X. Lv et al., “Physiological and ecological responses of typical mangrove plants to rising sea levels in Hainan, China,” 2024. [CrossRef]
- M. Shariot-Ullah and M. Shariot-Ullah, “Sea-level rise and sustainable shore protection strategies in the low-lying delta: A case study of Bangladesh,” 2024. [CrossRef]
- N. Saintilan et al., “Thresholds of mangrove survival under rapid sea level rise,” Science (1979), vol. 368, no. 6495, pp. 1118–1121, Jun. 2020. [CrossRef]
- M. M. Santos et al., “Heritage & Socio-economic Dimensions Rhodes Island,” Heritage & Socio-economic Dimensions Rhodes Island. [Online]. Available: https://www.researchgate.net/publication/381854480.
- S. A. R. Mucova, U. M. Azeiteiro, W. L. Filho, C. L. Lopes, J. M. Dias, and M. J. Pereira, “Approaching Sea-Level Rise (SLR) Change: Strengthening Local Responses to Sea-Level Rise and Coping with Climate Change in Northern Mozambique,” Journal of Marine Science and Engineering 2021, Vol. 9, Page 205, vol. 9, no. 2, p. 205, Feb. 2021. [CrossRef]
- N. Etinay, C. Egbu, and V. Murray, “Building Urban Resilience for Disaster Risk Management and Disaster Risk Reduction,” in Procedia Engineering, Elsevier Ltd, 2018, pp. 575–582. [CrossRef]
- M. O. Hayes, “Tide-Dominated Coasts,” pp. 1–4, 2018. [CrossRef]
- S. Prakash and A. K. Verma, “ANTHROPOGENIC ACTIVITIES AND BIODIVERSITY THREATS,” International Journal of Biological Innovations, vol. 04, no. 01, pp. 94–103, 2022. [CrossRef]
- A. Cazenave et al., “Observational requirements for long-term monitoring of the global mean sea level and its components over the altimetry era,” Front Mar Sci, vol. 6, no. SEP, 2019. [CrossRef]
- N. T. H. Nguyen et al., “Maximising resilience to sea-level rise in urban coastal ecosystems through systematic conservation planning,” Landsc Urban Plan, vol. 221, p. 104374, May 2022. [CrossRef]
- K. M. Thorne and K. J. Buffington, “FS 2021–3030: Sea-level Rise Vulnerability of Mangrove Forests on the Micronesian Island of Pohnpei,” 2021, Accessed: May 07, 2024. [Online]. Available: https://islandatlas.org.
- A. F. Mavume, B. E. Banze, O. A. Macie, and A. J. Queface, “Analysis of climate change projections for mozambique under the representative concentration pathways,” Atmosphere (Basel), vol. 12, no. 5, 2021. [CrossRef]
- M. Oppenheimer et al., “Sönke Dangendorf (Germany), Petra Döll (Germany),” 2019.
- F. P. J. Nehama, Z. D. H. Veriua, C. Maueua, A. Hibbert, F. Calafat, and P. D. Cotton, “Validating Sea-Level Altimetry Data against Tide Gauge for Coastal Risk Analysis in Mozambique,” J Mar Sci Eng, vol. 10, no. 11, Nov. 2022. [CrossRef]
Figure 1.
Location map of the study area. The ocean, including the Mozambique Channel, is shown in blue. The red points represent the locations of the tide gauge stations. The gray area on the left side of the figure represents part of the African continent, and Madagascar can also be seen. The white area within the continent represents Lake Niassa. The black lines within the continent depict the Licungo and Cuácua rivers.
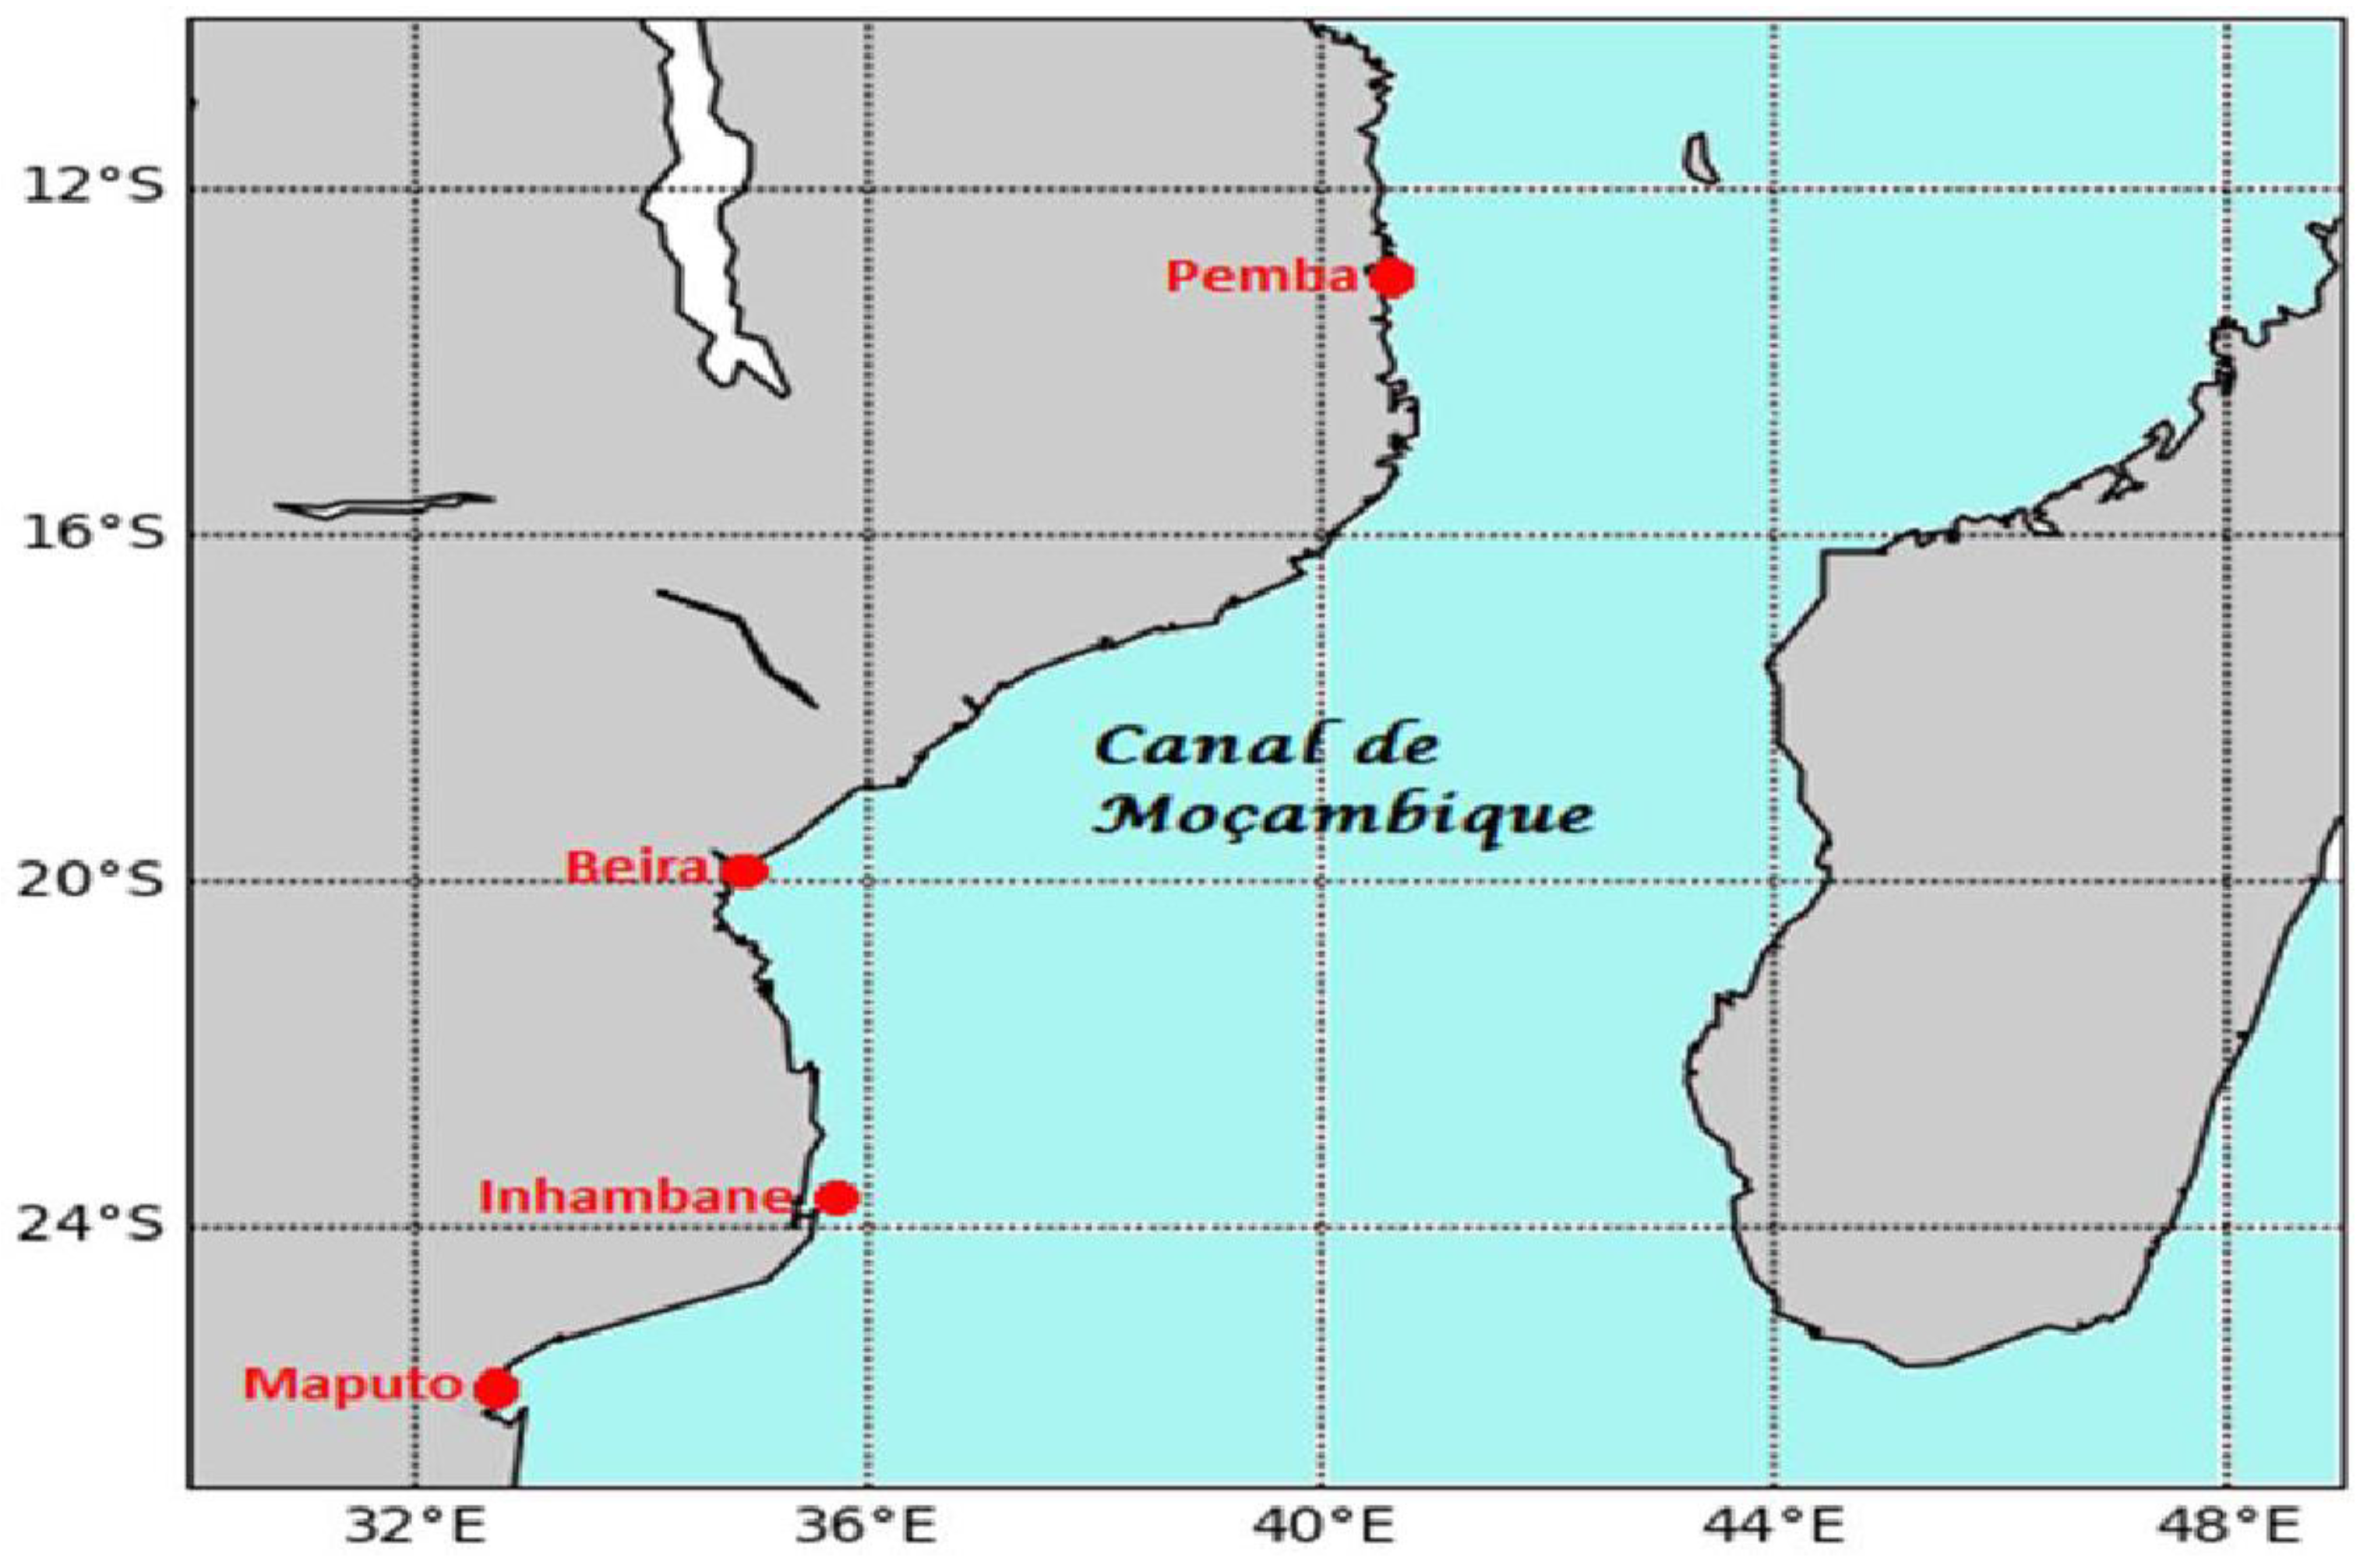
Figure 2.
Spatial Distribution of Mean Sea Level, 2010–2020.
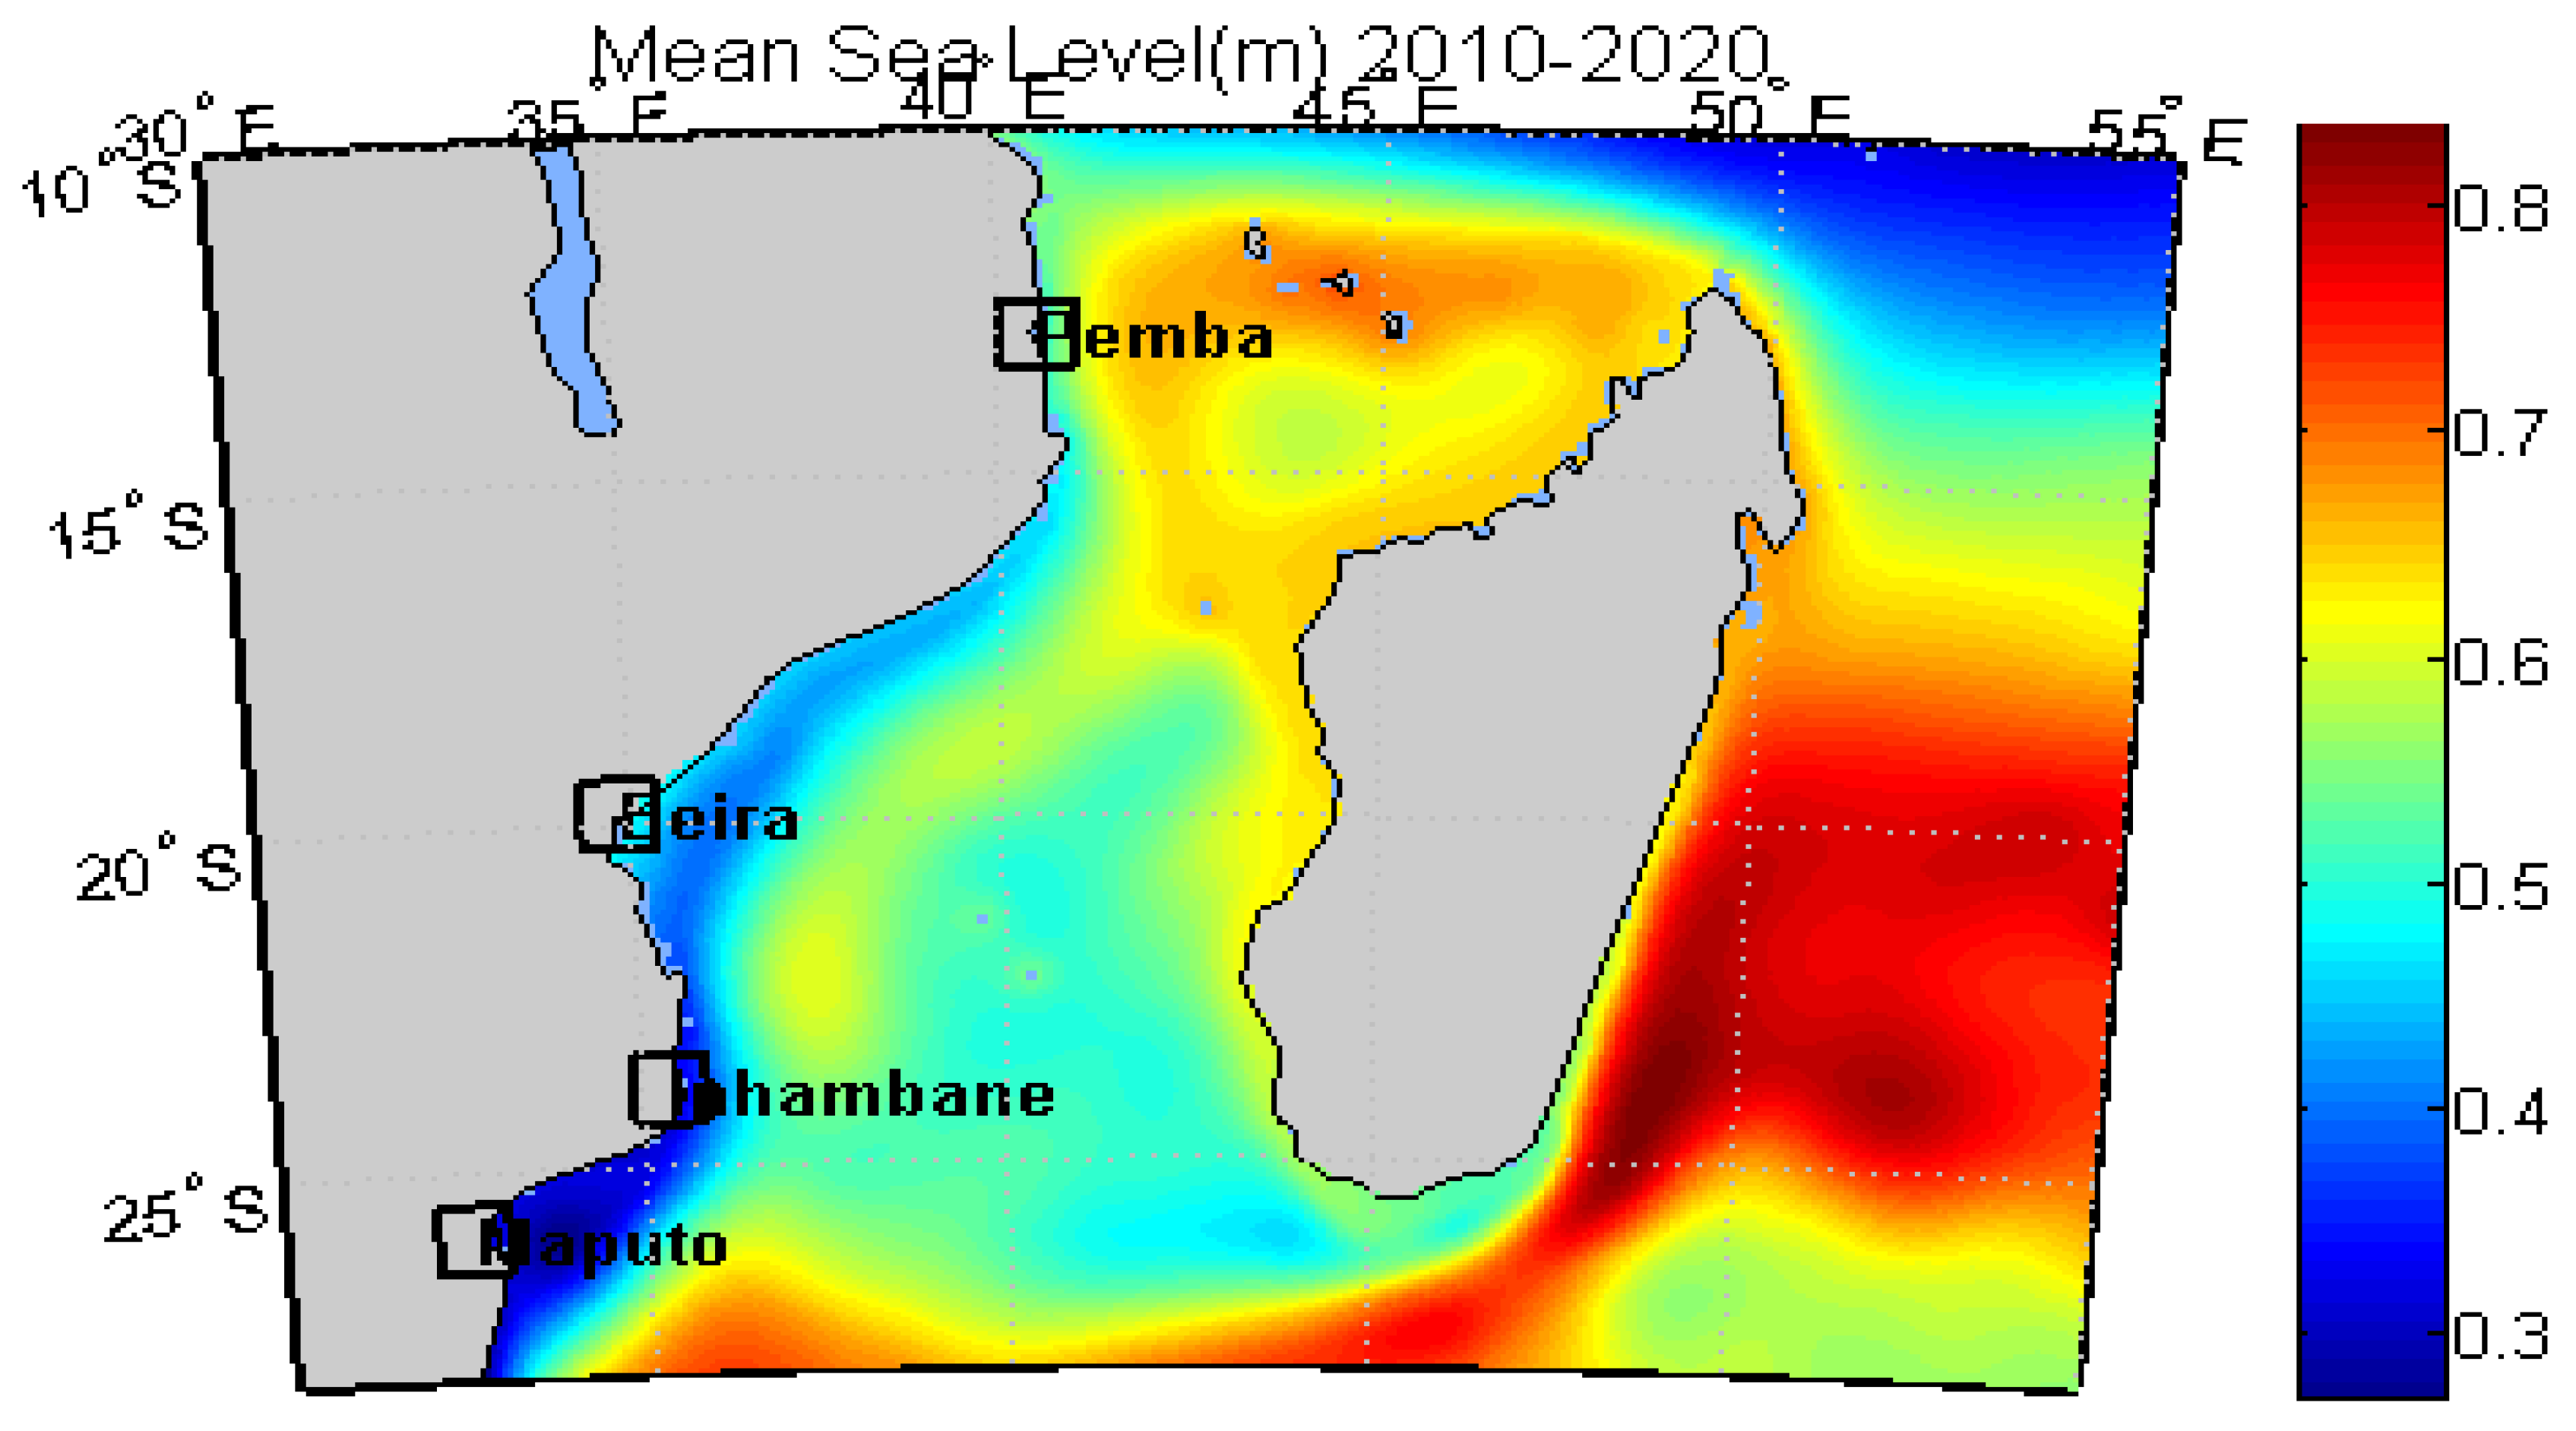
Figure 3.
Time series of Mean Sea Level, 2010–2020.
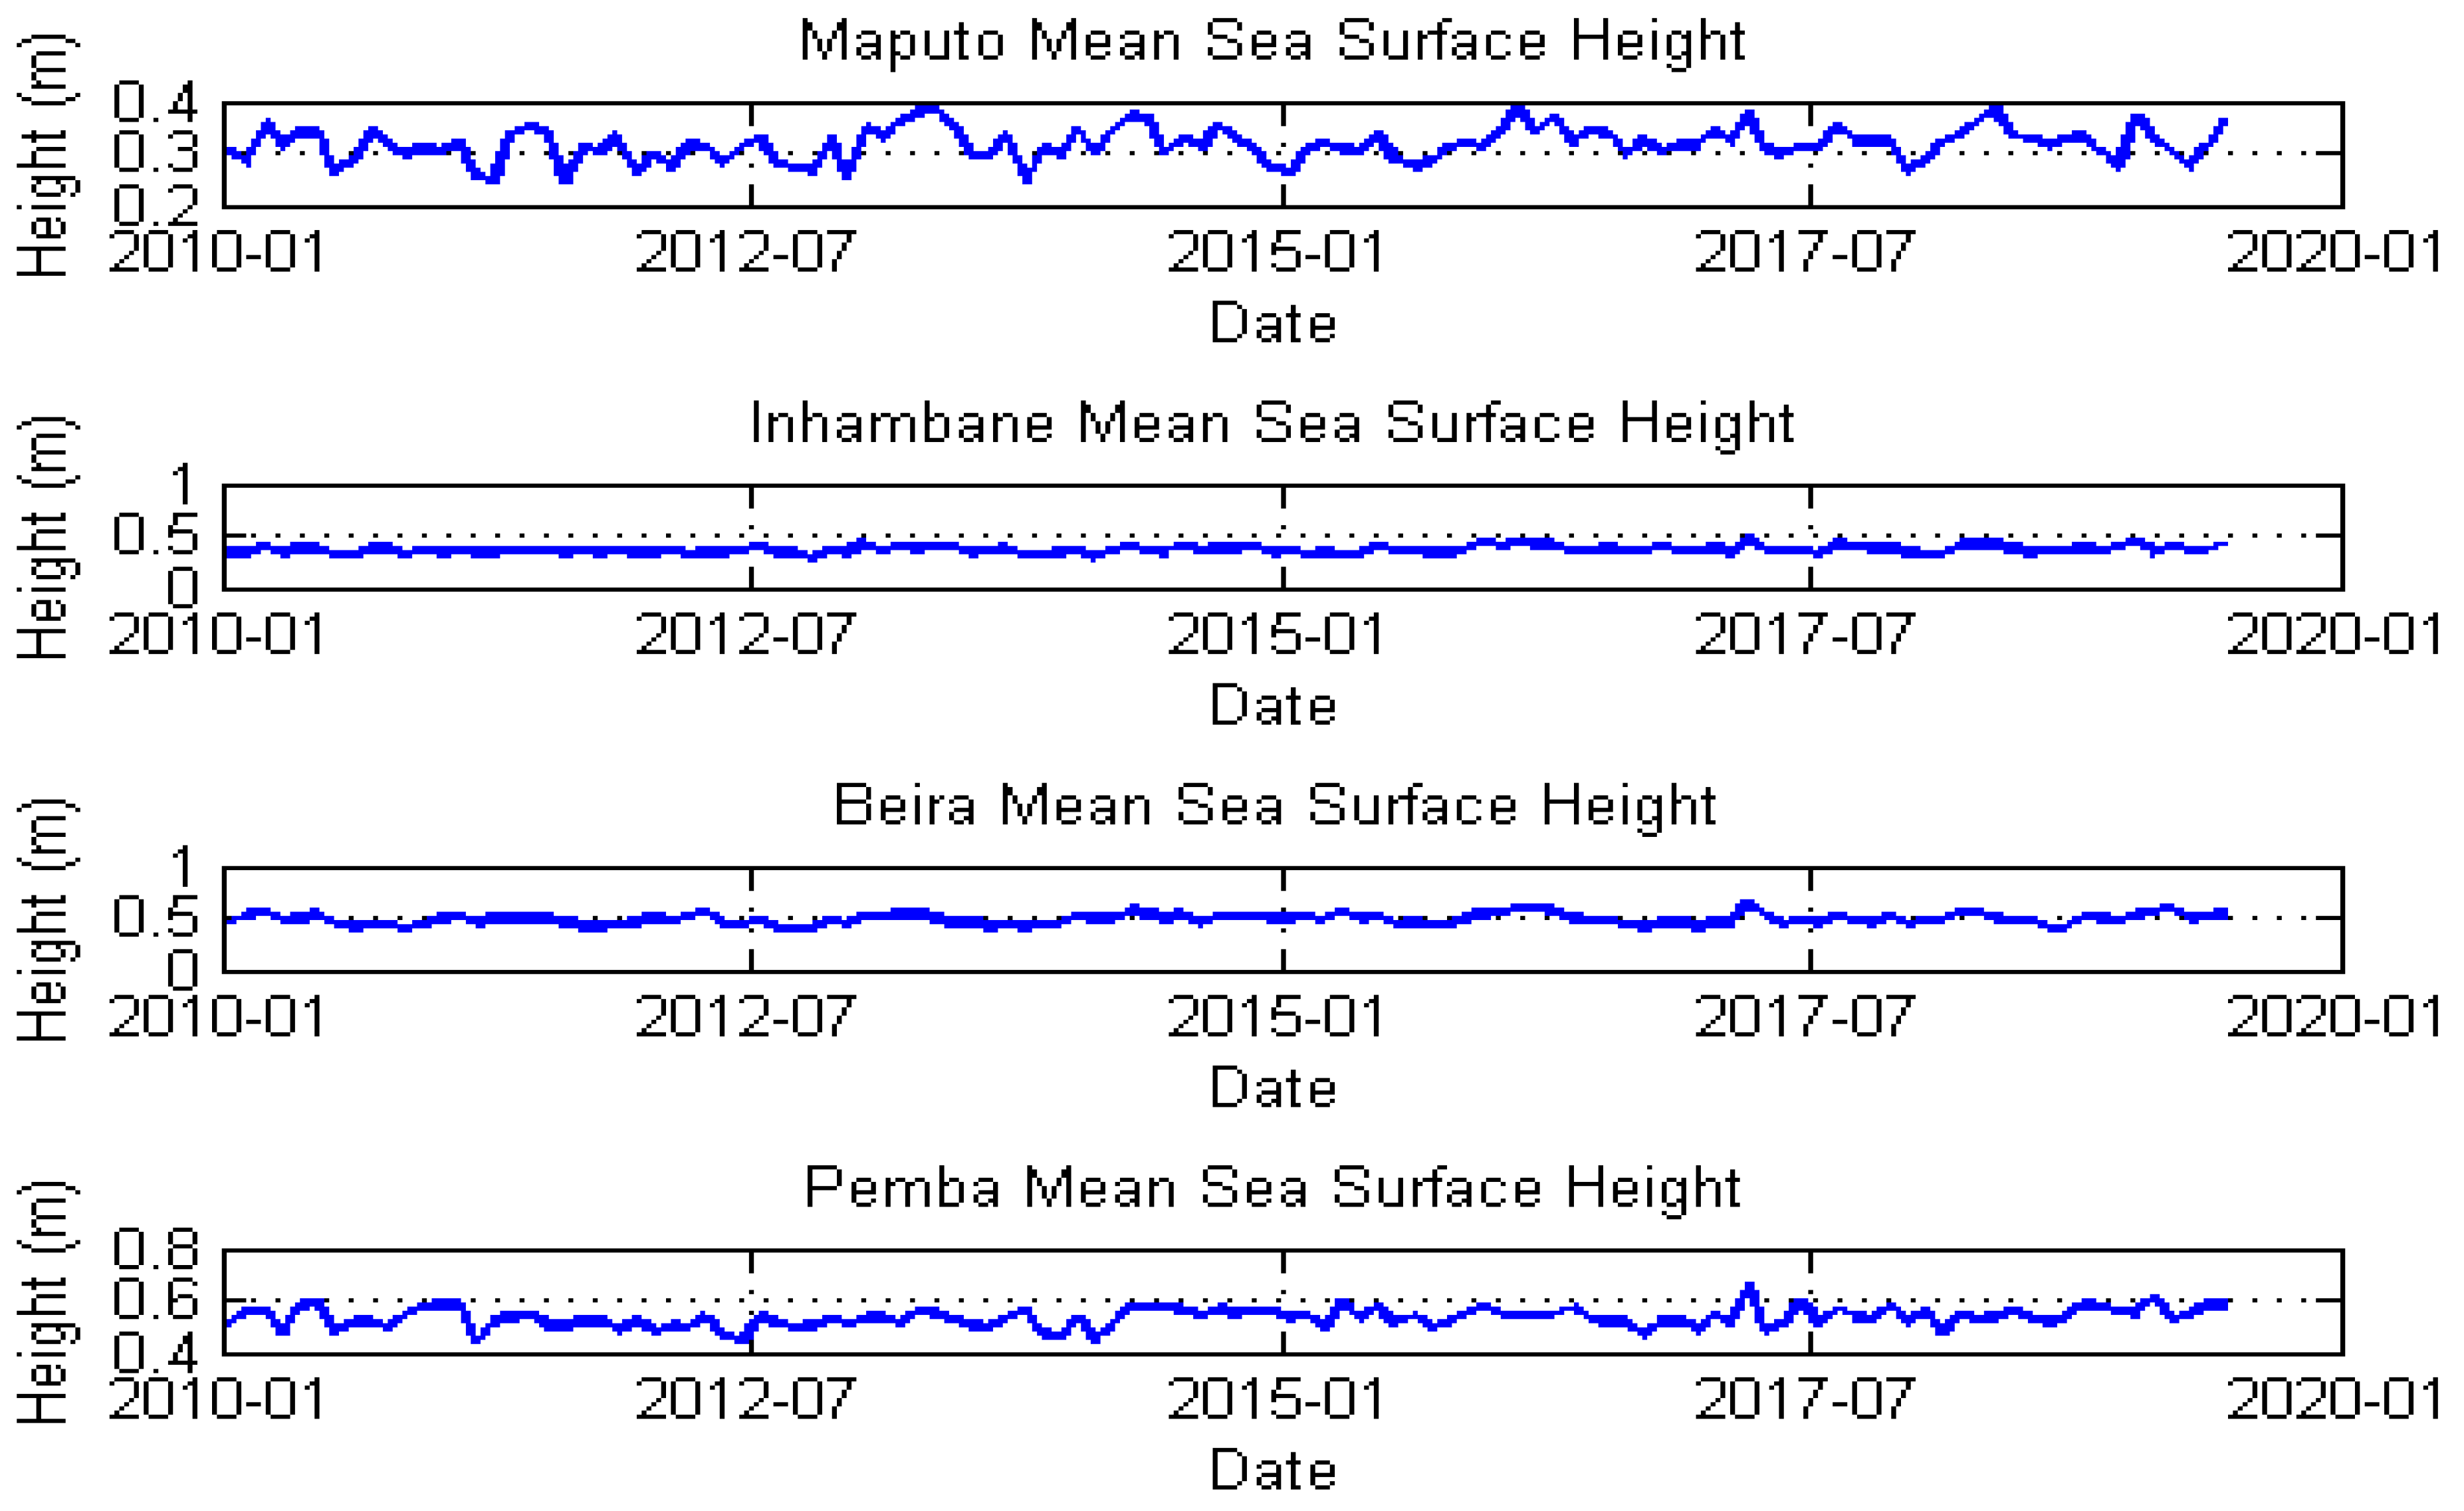
Figure 4.
Variation of Mean Sea Level at the Stations of Maputo, Inhambane, Beira, and Pemba.
Disclaimer/Publisher’s Note: The statements, opinions and data contained in all publications are solely those of the individual author(s) and contributor(s) and not of MDPI and/or the editor(s). MDPI and/or the editor(s) disclaim responsibility for any injury to people or property resulting from any ideas, methods, instructions or products referred to in the content. |
© 2024 by the authors. Licensee MDPI, Basel, Switzerland. This article is an open access article distributed under the terms and conditions of the Creative Commons Attribution (CC BY) license (http://creativecommons.org/licenses/by/4.0/).
Copyright: This open access article is published under a Creative Commons CC BY 4.0 license, which permit the free download, distribution, and reuse, provided that the author and preprint are cited in any reuse.


