1. Introduction
The impact of external shocks on the price of live pig industry chain is an important basis for governments to formulate agricultural policies and carry out international trade. China is the largest producer and consumer of pork globally (Oh & Whitley, 2011). Price fluctuations in agricultural products such as live pigs have consistently attracted attention across various sectors (Xie & Wang, 2017; Y. Wang, 2023), and are closely tied to factors such as the Consumer Price Index (CPI), inflation, and other market prices (Liu, 2005; Vu et al., 2020; J. Li et al., 2020; Barkan et al., 2023; Soliman et al., 2023). However, recent global uncertainties have significantly disrupted the stability of pig industry prices, presenting new challenges for producers, consumers, and government market interventions. Consequently, studying the impact of external shocks on the live pig industry chain is of considerable practical significance.
Systems theory suggests that all systems are influenced by their external environment, and the live pig industry chain is no exception. After absorbing external shocks, prices adjust, accompanied by cyclical and persistent fluctuations (Luo, 2011). The concept of the "pig cycle," first introduced by Benner in 1895, has been observed globally (Longmire & Rutherford, 1993; Griffith, 1977; Fliessbach & Ihle, 2020). The rising frequency of uncertain events, coupled with external shocks with market structural changes, has contributed to significant price fluctuations within the "pig cycle"(Dawson, 2009; J. Wang et al., 2023).
External shocks encompass economic, social, and policy-related factors, emphasize the necessity of a systematic analytical framework for thorough examination. This study argues that external shocks are not part of the live pig industry chain, they can affect production, circulation, consumption, and price fluctuations. These shocks have been observed and recorded. On a macro level, uncertainties arising from global economic conditions and government fiscal and monetary policies can affect all sectors within the system (Gao et al., 2019; Xiao et al., 2019; Wang et al., 2024). At the micro level, factors such as pig diseases, food safety concerns, and technological innovations have a profound impact on the price dynamics and thestructure of the live pig chain industry (Isengildina et al., 2006; Isengildina-Massa et al., 2021; Xiong et al., 2021; Pang et al., 2023; L. Wu & Xiong, 2024). Existing literature has typically relied on newspaper data to identify external shocks, constructing uncertainty indices related to economic policy, geopolitics, and trade, yielding positive results (Gopinath & M, 2021; Jiang et al., 2022; Jiao et al., 2023). The impact of external shocks on prices is often analyzed using VAR models, such as the TVP-VAR model, which effectively explains price fluctuations and their time-varying characteristics (Gao et al., 2019; Zhang & Zhang, 2024). However, research on external shocks in the live pig industry is still insufficient, particularly in terms of identifying and measuring the impact of specific events, such as epidemics and food safety. Moreover, the dynamic impact and underlying mechanisms of external shocks on pig industry chain prices remain unclear.
This study addresses two core issues: first, the identifying and measuring of external shocks affecting the live pig industry chain, and second, analyzing the time-varying characteristics and underlying mechanisms through which external shocks influence pig industry chain prices. The study makes several marginal contributions. First, the study defines and classifies the external shocks affecting the live pig industry, effectively identifying and measuring these shocks across different levels. This framework is critical for investigating how external shocks influence industrial prices at both macro and micro levels. Second, by creating indices based on news and disease data related to the pig industry, the study examines the dynamic effects of these uncertainties on industry chain prices over time using the TVP-SV-VAR model. This approach not only validates prior research on the direct impacts of animal diseases and food safety concerns on prices (Huang et al., 2021; L. Ma & Teng, 2022) but also provides valuable insights into price fluctuations in other industries. Third, the study establishes and analyzes the transmission mechanism linking external shocks to industry chain prices. It tests the "external shocks – market supply and demand – industry chain price" pathway through robustness checks (Ward, 1999; Ben-Kaabia & Gil, 2007), confirming both the validity and effectiveness of this mechanism.
The structural framework of this study can be outlined as follows:
Section 2 reviews relevant literature and establishes a theoretical framework for understanding the impact of external shocks on the live pig industry chain's prices.
Section 3 details the data sources, processing methods, and fluctuation characteristics considered in this paper and introduces the TVP-SV-VAR model.
Section 4 analyzes and discusses the empirical results.
Section 5 further discusses the results, including robustness tests and potential mechanism analysis. Finally, the study concludes with a summary and suggestions in section 6.
2. Literature Review and Theoretical Framework
2.1. Literature Review
2.1.1. Influencing Factors of Price Fluctuations in the Live Pig Industry Chain
Price volatility in the hog market is characterized by high variability and general contraction, distinguishing it from other types of meat (Calvia, 2024). The causes of price fluctuations in the live pig industry have been analyzed extensively in existing literature. Early studies primarily focused on the dynamic transmission relationships between different segments of the industry chain. For example, feed costs, which constitute the largest component of pig production and breeding expenses, directly influence market prices (Babovidic et al., 2011). Consequently, upstream and midstream segments of the chain typically exert the greatest impact (Xu et al., 2012). Other scholars have highlighted the long-term co-integration between retail pork prices and live pig prices, facilitating price transmission between these two levels (Bakucs & Ferto, 2005). In recent years, with increasing uncertainty, external factors affecting the industry chain—such as policies, epidemics, and public opinion—have garnered growing attention. These external shocks indirectly impact prices by influencing the behaviors and expectations of stakeholders (Yu & Bai, 2023).
2.1.2. The Impact of Economic Policies on Price Fluctuations in the Live Pig Industry Chain
Macro-level factors, such as economic events, policies, and regulations, are a focal point in studies of external shocks. Economic policies can disrupt the production and transportation of the live pig industry chain, restrict market supply, and cause short-term price surges (Y. Wang et al., 2020; Balcilar et al., 2022). For instance, tight monetary policies increase the capital costs for producers, compelling them to curtail production plans, which exacerbates price volatility (Tan et al., 2018). Simultaneously, reduced consumption expectations amplify market uncertainty (Shi et al., 2021). Some scholars advocate active price regulation policies to stabilize short-term fluctuations in the hog market (Y. Li et al., 2021). Conversely, others argue that most external shocks do not fundamentally alter the structure of the live pig market; supply and prices often revert to expected levels in a relatively short time (Ramsey et al., 2021). They propose minimizing government intervention and allowing market mechanisms to regulate prices to avoid potential policy distortions (De & Koemle, 2015; Tan & Zeng, 2019).
2.1.3. The Impact of Industry News on Price Fluctuations in the Live Pig Industry Chain
Industry news has become a key focus in studies of external shocks, particularly regarding animal diseases and food safety. For example, during the outbreak of African swine fever in China in 2018, the large-scale culling of infected pigs led to a significant reduction in hog numbers and a sharp rise in prices (J. Wang et al., 2022). The dissemination of this news intensified market panic, creating an asymmetry between production and consumption adjustments. Retail price increases far outpaced production price increases (Acosta et al., 2023). Wang et al. (2023) observed that following the swine fever outbreak, incomplete public information hindered the spatial integration of the industry chain and slowed the recovery of inter-provincial price linkages. While regional differences in food culture influence purchasing behavior (H. Zhang et al., 2023), there is a growing consensus on food safety issues, which directly affect consumer decisions (McCarthy et al., 2004; Cicia et al., 2016). Negative news reports about food safety significantly deter consumers' purchasing intentions and behaviors (Soroka, 2006; Beach et al., 2008). Some studies have also noted that media reports amplify emotional responses, potentially triggering panic buying or selling, which further drives price volatility (C. Ma et al., 2023; Wan & Tao, 2023).
Price fluctuations in the live pig industry chain have been a long-standing research focus. The influence of external shocks on price volatility in this sector has been widely studied. However, effective methods for identifying the external impacts of industry news remain unclear. Furthermore, empirical tests are necessary to validate the potential mechanisms of these external shocks, particularly in terms of market supply and demand and stakeholder decision-making.
2.2. Theoretical Framework
2.2.1. Static Theoretical Framework
External shocks encompass various factors, such as the economic environment, policy regulation, and news events, generating uncertainties that directly impact the supply and demand functions of the live pig industry chain (Pan et al., 2022). Producers adjust production and operation modes based on market conditions and economic policy orientation, while factors like purchasing power, risk appetite, and external information interventions influence consumer behavior. In theory, market adjustments ideally lead to a dynamic equilibrium between supply and demand in response to external shocks. However, achieving complete balance requires the exchange of supply, demand, and price information. Price is generally considered the key determinant of the live pig supply-demand relationship (Wang et al., 2011). However, imbalances in supply and demand caused by external shocks such as economic policies and animal epidemics indirectly lead to abnormal price fluctuations in the live pig industry chain (Wang & Xiao, 2012).
2.2.2. Dynamic Theoretical Framework
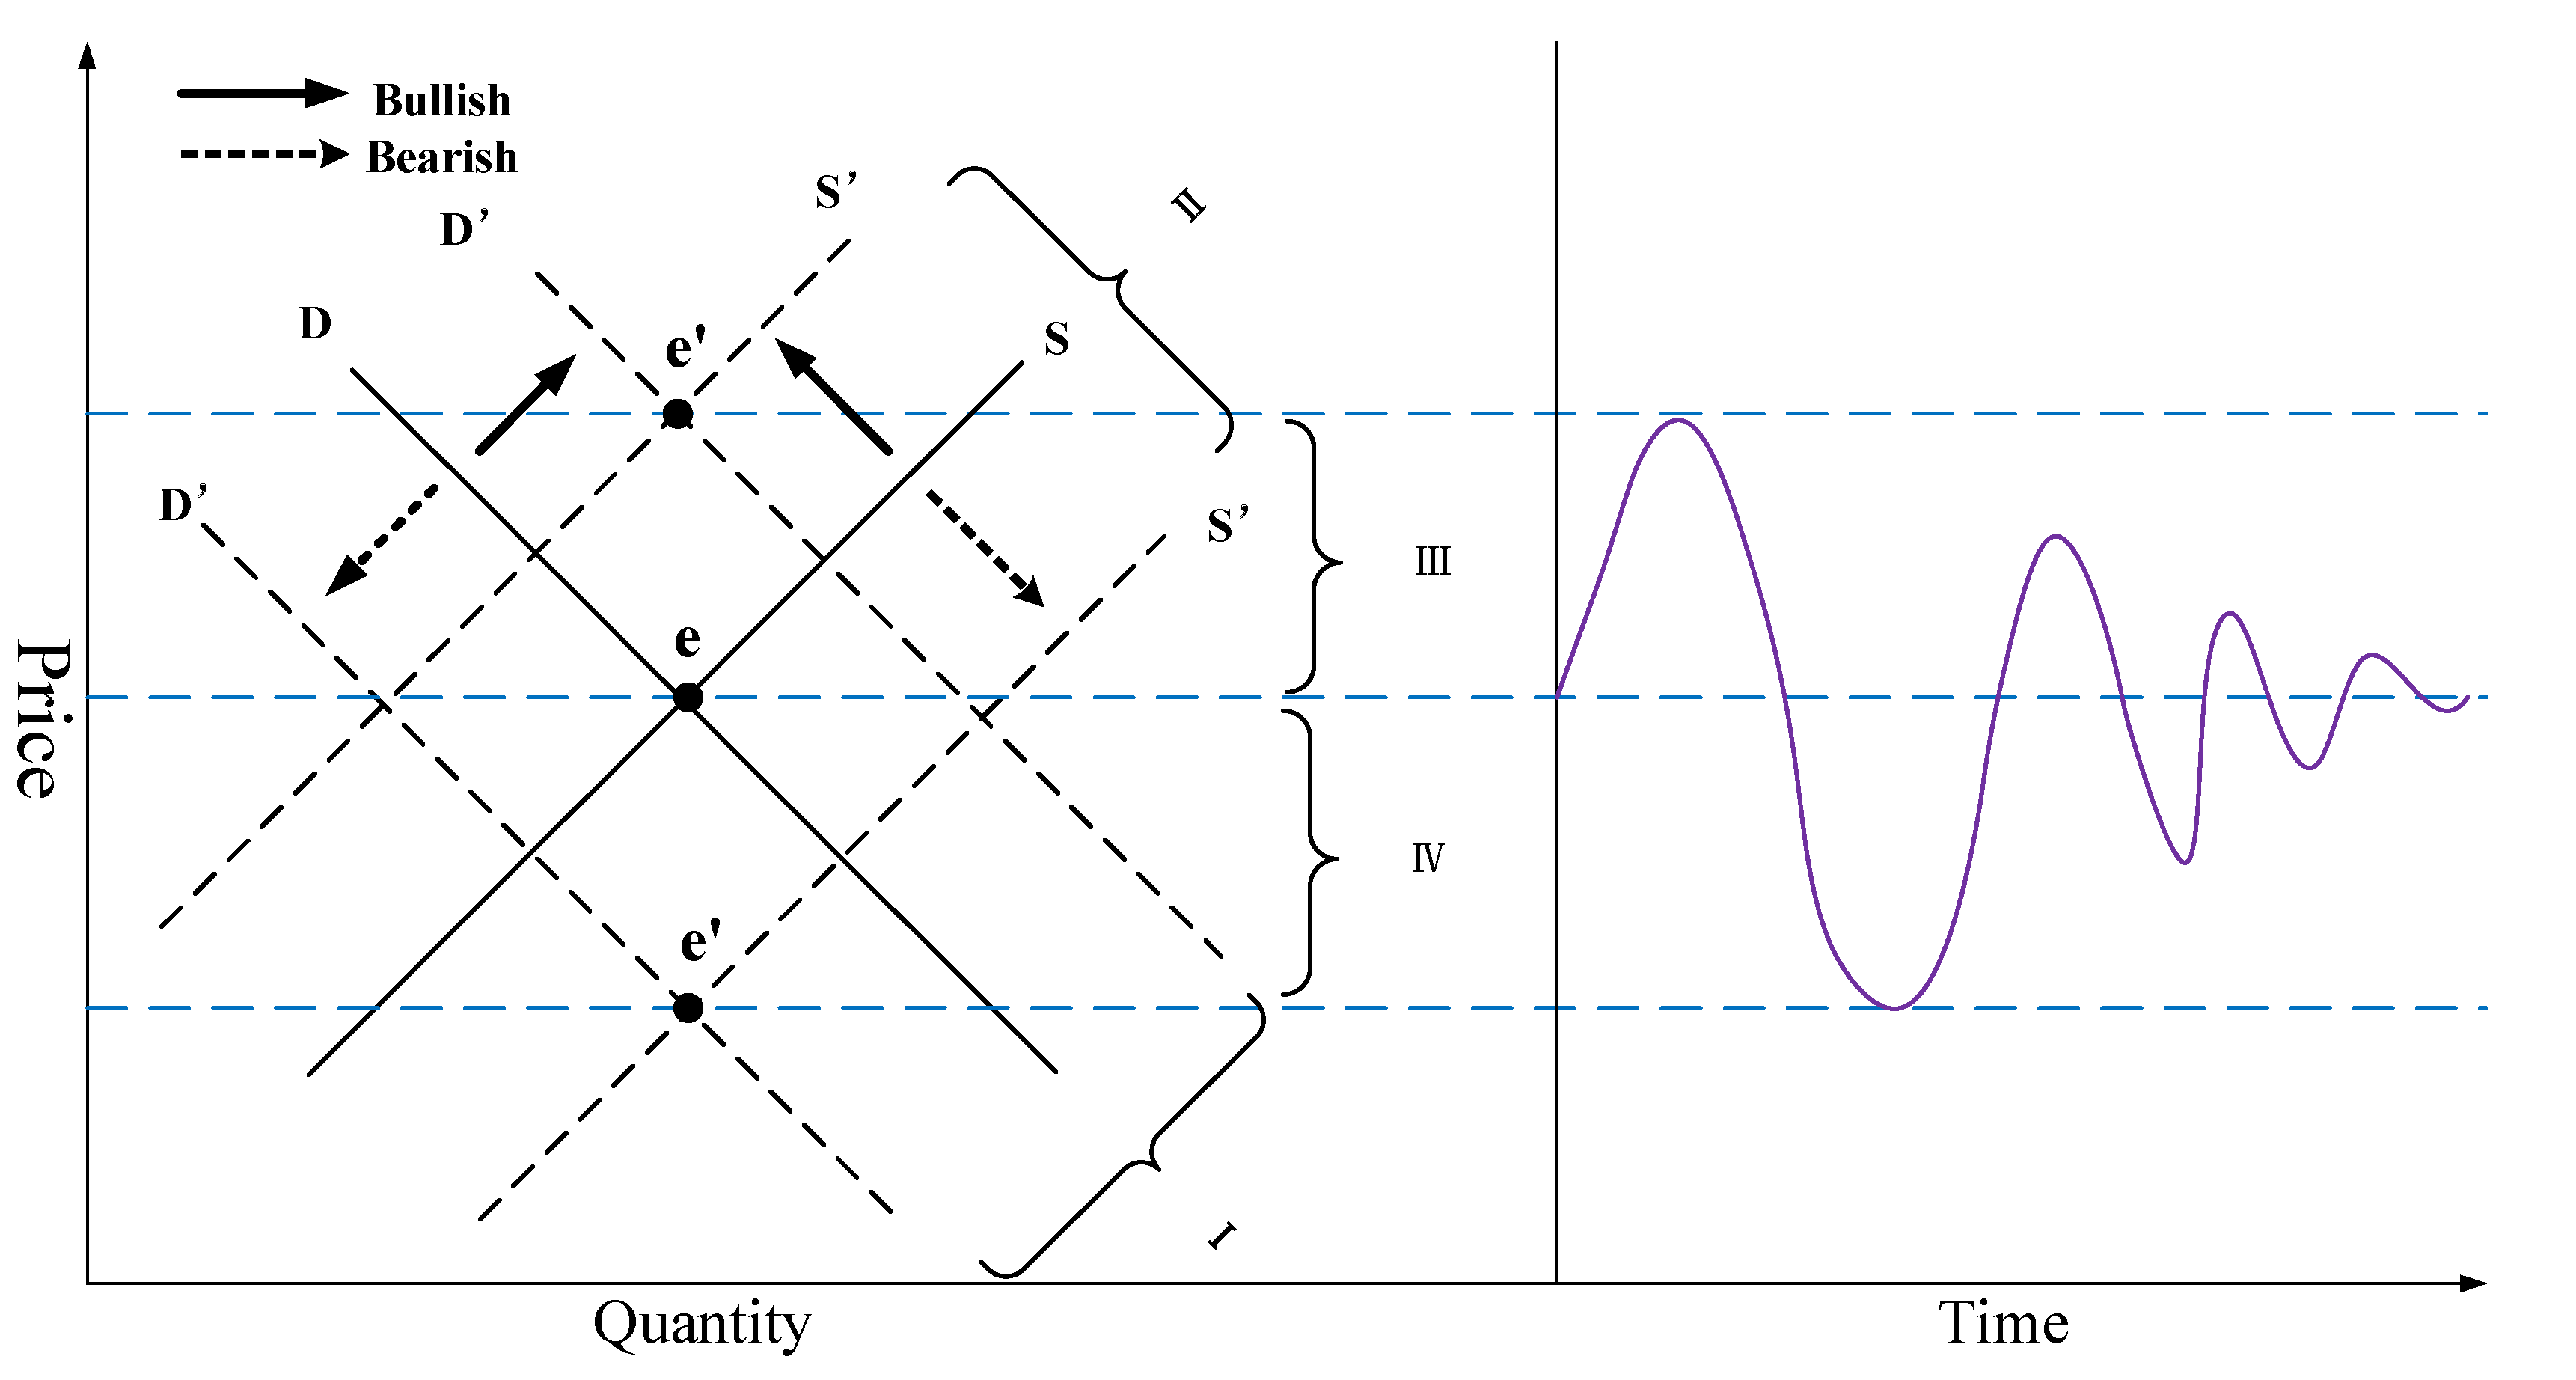
The static supply and demand model is inadequate for explaining the shift of the pig market from one equilibrium to another. Therefore, to effectively illustrate the dynamic process of price fluctuations and market behavior, we employ graphical techniques to depict the stable condition prior to and following market alterations, as depicted in
Figure 1.
From a dynamic analysis perspective, we examine both ends of the live pig industry chain. On the supply side, changes in economic policy and industrial news influence live pig supply by affecting production cost factors, market expectations, and commodity support plans. Favorable external impacts typically lead farmers and enterprises to expand production, increasing market supply (H. Wu et al., 2012), while negative shocks result in production capacity reductions (Dai et al., 2017). Strong market interventions, such as government reserve meat delivery or pig purchases, can directly alter market structures, causing sharp supply fluctuations (Chen & Yu, 2018; Delgado et al., 2021).
On the demand side, consumer demand for pork is influenced by substitutes, consumer income levels, and consumption preferences. Although price declines in substitutes like chicken, cattle, and sheep may reduce pork consumption, pork remains a staple in Chinese meat consumption, limiting this substitution effect (H.-S. Li et al., 2021). Consumer income levels are a key factor affecting pork demand, with consumer willingness to consume playing a significant role. Negative news impacts consumer willingness to buy pork products, reducing market demand for live pigs (Yao et al., 2022). As consumer confidence is restored, market demand gradually recovers (Jia et al., 2022).
However, the simple movement of supply and demand curves cannot fully capture the continuous fluctuation of the pork market. The dynamic transmission process of supply and demand relationships in the pork market is ongoing. As new price points are formed in the live pig industry chain, they are communicated back to producers and consumers, leading to further adjustments in supply and demand curves. This iterative process continues as both sides of the transaction adjust their activities based on industry information and new policies, ultimately leading to price convergence to a new stable state in the short term. The fluctuation of this equilibrium state is characterized by rapid changes in the equilibrium point, gradually stabilizing over time.
2.2.3. Potential Mechanism Analysis
Our theoretical framework posits that external shocks ultimately shape the equilibrium price in the pig industry chain through dynamic adjustments in market supply and demand. We hypothesize that certain mechanism variables mediate these adjustments, such as logistics and structural configurations. These variables influence thereby driving the impact of external uncertainties on pricing within the live pig industry chain. To illustrate this, we use pig slaughter volume as a representative mechanism variable.
Pig slaughter serves as a pivotal mechanism for two main reasons: Firstly, it acts as an indicator of market supply and demand balance. The hog slaughtering industry in China, which possesses market influence, can significantly affect the industry's overall hog demand (Chen & Yu, 2018). A reduced supply in the hog market typically results in lower slaughtering activity, leading to higher pork prices in the consumer market. In contrast, an abundant supply tends to stabilize or lower prices by increasing slaughtering. Secondly, pig slaughter volume serves as a regulatory indicator of supply. Manufacturers may adjust slaughter volumes in response to reduced supply or shifts in demand, aiming either to maintain high prices or to clear inventory based on market conditions. Similarly, governmental interventions in slaughter volums can help stabilize market dynamics.
The interaction between external shocks and pricing, mediated by pig slaughter volumes, unfolds as follows: External uncertainties, such as epidemic outbreaks, reduce production incentives for manufacturers, while temporary government policies on environmental protection and land use can constrain farm expansion, indirectly leading to a supply shortage in pig production. Therefore, if market demand remains constant, this shortage leads to a decline in slaughter volume, driving pork prices upward(Assefa et al., 2017). This model assumes that changes in pig slaughter volumes precede and drive market price fluctuations.
3. Data and Model Construction
3.1. Data Source and Processing
The China Economic Policy Uncertainty (EPU) Index is utilized in this study to measure changes in economic policy. The EPU data is sourced from the official website of Policy Uncertainty
1. Initially measured by scholars such as Baker and Steven (Baker et al., 2016), the index is calculated based on the frequency of keywords like "economy and finance," "uncertainty," and "policy" in news reports from the South China Morning Post. (The index, originally developed by scholars such as Baker and Steven (Baker et al., 2016), is calculated based on the frequency of keywords like "economy and finance," "uncertainty," and "policy" in news reports published by the South China Morning Post.)
To gauge changes in the pig industry news, this paper develops the Pig Industry News Uncertainty Index (INU) using the People's Daily as its primary source. The INU encompasses opinions and measures related to pig industry development within a specific period, along with news reports on public diseases and market prices. This index primarily reflects the uncertainty surrounding pig industry news during the specified period. People's Daily was chosen as the newspaper source due to its status as the most authoritative media outlet in China. Reports published by People's Daily are indicative of the government's attention to news events and play a crucial role in shaping public opinion across various sectors of society.
In this study, the keywords "pig" and "live pig" were identified in news reports from the People's Daily spanning January 2010 to August 2023. Duplicate results were eliminated, and articles relevant to the live pig market were retained, resulting in a total of 1137 articles. Following the optimization algorithm proposed by Baker et al. (Zhu, 2017) for uncertainty index measurement, the calculation of the Pig Industry News Uncertainty Index (INU) in this paper is determined by Eq.(1), where
represents the frequency of news reports about the pig industry in People's Daily,
represents each month,
represents the monthly frequency within the selected range, totaling 164. The calculation method is as follows: the frequency of hog-related news reports in People's Daily each month is tallied, multiplied by the number of months, and expanded by 100 times compared to the cumulative sum number. This yields the current Pig Industry News Uncertainty Index (
).
The independent variables in this study are the Economic Policy Uncertainty Index and the Industrial News Uncertainty Index, while the dependent variables are the average prices of piglets, pigs, and pork across 22 provinces and cities in China. All variables cover monthly data from January 2010 to August 2023. The statistics mentioned are sourced from the official website of Policy Uncertainty and the National Bureau of Statistics of China.
3.2. Analysis of Data Fluctuation Characteristics
Table 1 summarizes the statistical indicators of various variables. The mean and standard deviation of the Economic Policy Uncertainty (EPU) index are 207.0847 and 123.425, respectively. These figures surpass those of the Live Pig Industry News Uncertainty (INU) index, which are 99.9998 and 71.5722, indicating a more pronounced fluctuation in EPU over time. The calculation base period of the two indexes is different, and the calculation time of INU is relatively late, which is of more reference value for the business decision of manufacturers. Among the piglet price, live pig price, and pork price in the pig industry chain, the standard deviation of the piglet price is the highest at 25.3819, suggesting that it is the most volatile component, followed by pork price and live pig price. The skewness values for all time series are positive, illustrating characteristics of a right-skewed distribution. All series exhibit kurtosis values greater than 3, indicating peaked distributions. Moreover, the Jarque-Bera test results for EPU, live pig, piglet, and pork prices confirm non-normal distributions at the 1% significance level. To normalize scale differences across datasets, the empirical analysis employs the natural logarithm of the variables.
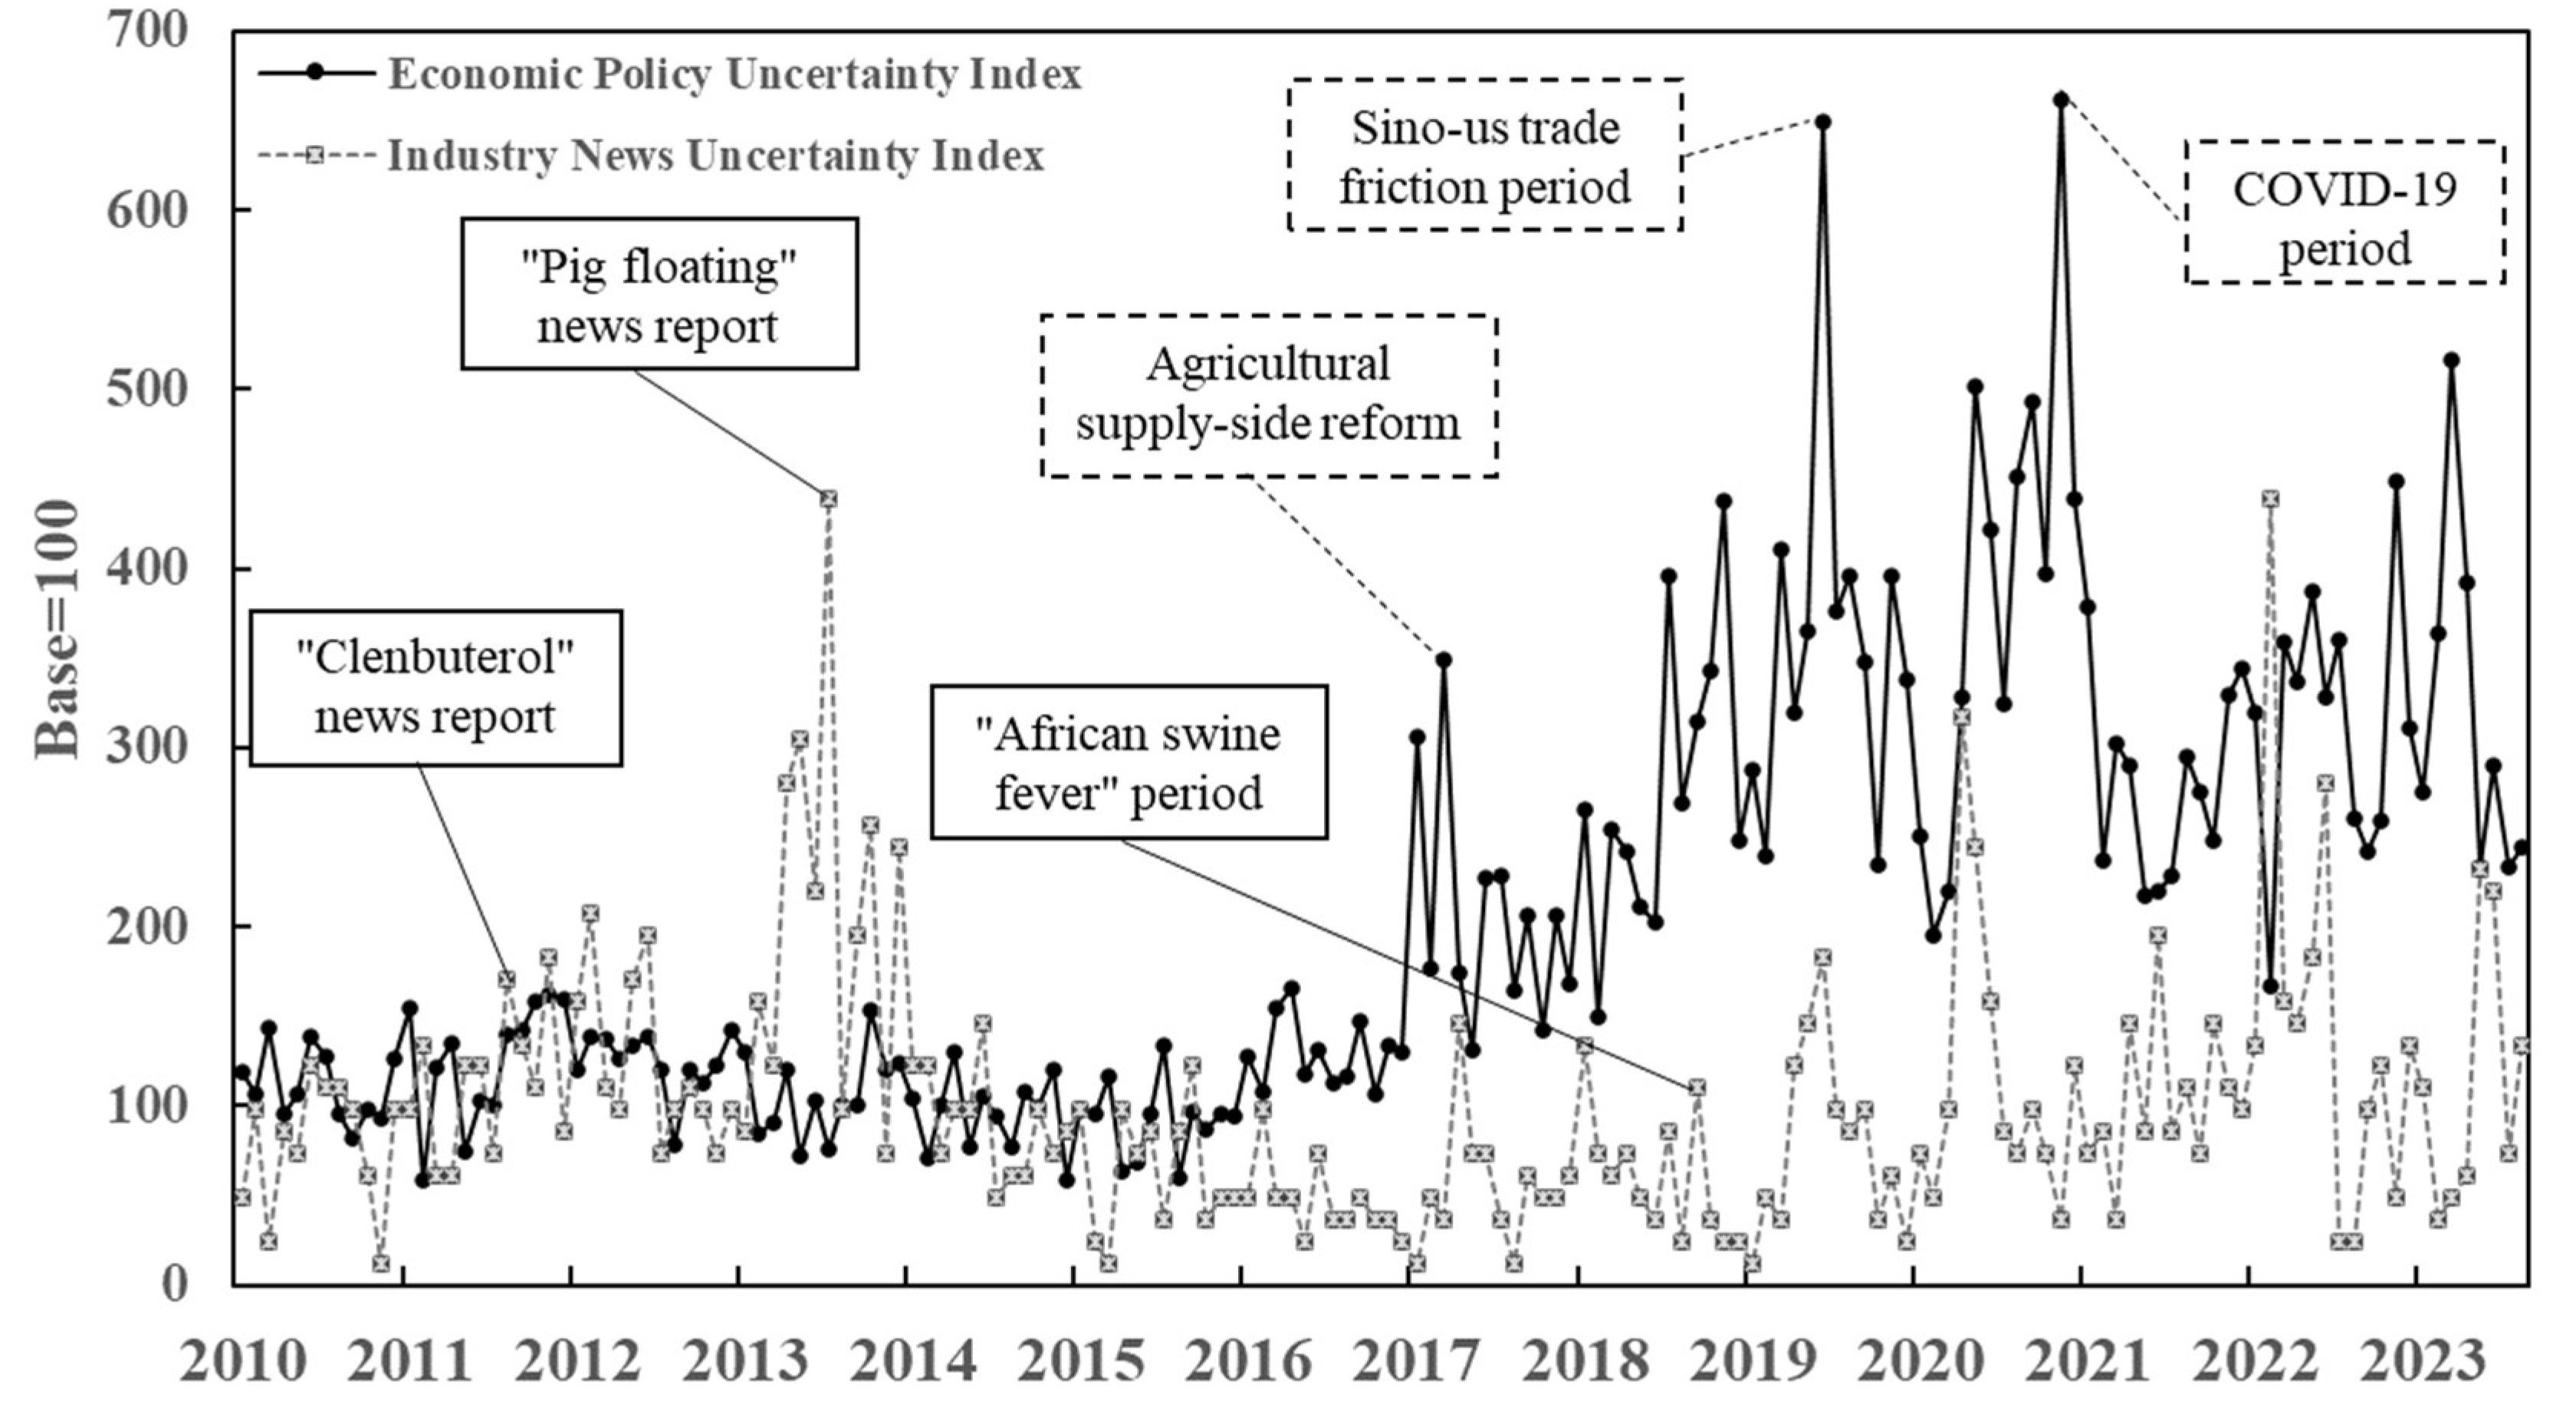
Figure 2 shows the trend characteristics of the uncertainty index. The economic policy uncertainty index exhibited a relatively stable trend before 2017, but sharp fluctuations occurred after 2017, particularly peaking during the Sino-US trade war and the COVID-19 epidemic. These fluctuations indicate significant changes in China's economic operating environment, with uncertainty's impact on the economy becoming more pronounced. Three specific time nodes highlight these trends:(1) In 2017, China's agricultural supply-side reform emphasized high-quality production in animal husbandry, guiding efforts to stabilize pig production, optimize breeding structures, and upgrade the industry. (2) During the Sino-US trade war from 2018 to 2019, China implemented tariff measures in response to trade frictions. The resulting increase in trade tariffs led to rising commodity prices, significantly impacting the domestic agricultural economy. (3) In early 2020, the COVID-19 epidemic caused a global economic downturn, disrupting agricultural production and causing large fluctuations in agricultural product prices. China responded with various monetary and fiscal policies to promote economic recovery.
The uncertainty index of pig industry policy news exhibits peak volatility during major news or policy regulation periods, with notable mentions of pigs in the Chinese government's work report in March. From specific historical periods: (1) The "clenbuterol incident" in 2011 raised widespread concerns about food safety
2, significantly affecting short-term pork consumption. Consumers' willingness to purchase dropped sharply, leading to continuous reductions in pork prices. (2) In 2013, improper disposal of sick and dead pigs by pig farmers in Zhejiang caused a large-scale "pig floating" phenomenon in the Huangpu River waters
3, impacting water quality safety. This incident prompted the issuance of policies and regulations to address environmental issues in livestock and poultry breeding. (3) The 2018 outbreak of African swine fever resulted in the culling of more than 1 million pigs, leading to a significant decline in pig stocks. Cross-provincial embargoes due to supply shortages exacerbated soaring pork prices. The government implemented policy measures to contain the spread of swine fever and gradually restore production capacity.
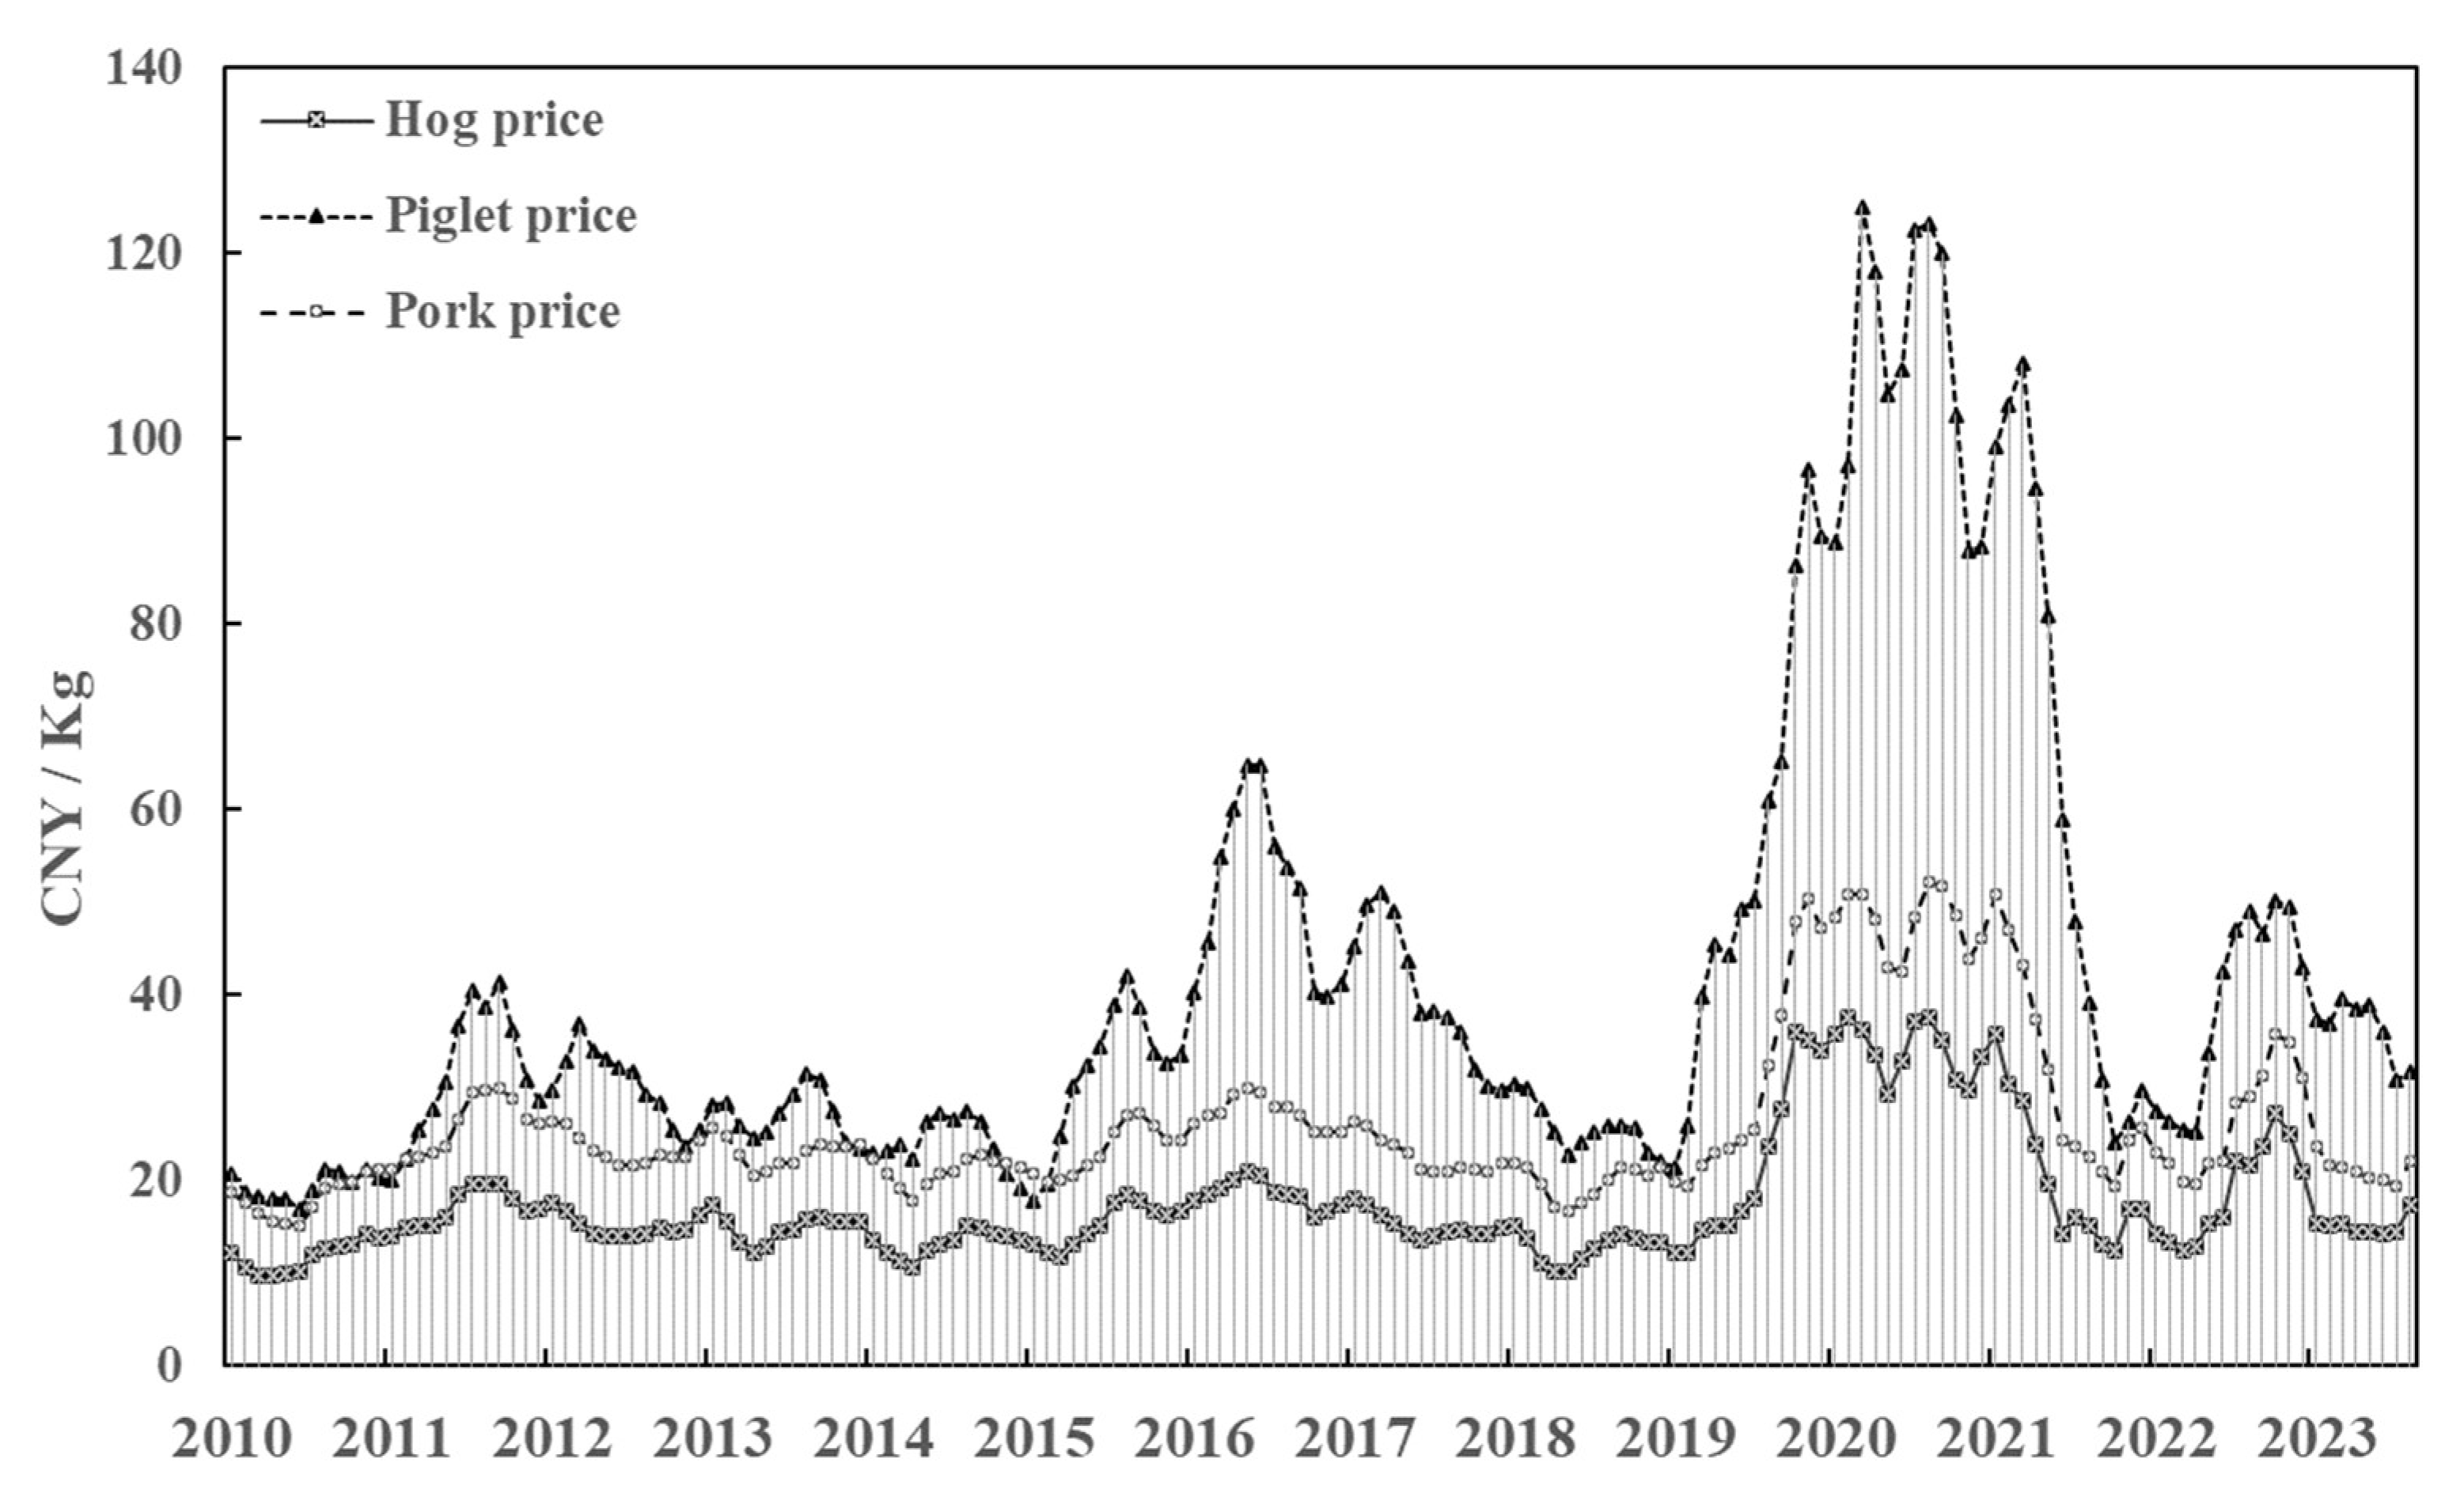
In this study, piglet, pig, and pork prices are used to depict the pig industry chain, representing different positions within the chain with good representation.
Figure 3 illustrates the price fluctuation trend of the pig industry chain. The prices of piglets, pigs, and pork exhibit a high degree of consistency in their trends, with relatively stable fluctuations before 2018. However, there was a significant change after 2018, showing a marked difference in fluctuation intensity. Their independence from one another leads to significant variation in the extent of fluctuation. Given the close connection between the live pig and pork markets, the price of pork tends to be higher than that of live pigs, maintaining a reasonable price spread. Both prices demonstrate a trend of simultaneous rise and fall. The price fluctuation trend of piglets and pigs, which belong to the supply side, is consistent.
From a demand perspective, farmers typically purchase piglets in advance to ensure sustainable production and operation. However, the growth of piglets requires a certain amount of time and cannot be quickly converted into supply. During disease outbreaks such as African swine fever, the growth environment of piglets faces greater risks, leading to unusually volatile piglet prices. Despite these factors, when the supply and demand sides of the pig industry chain encounter external shocks, the overall trend tends to display a high degree of consistency.
3.3. Model Construction
The TVP-VAR model is characterized by its ability to adjust the analysis of each time point in the time series based on the time variability of the parameters. This allows for the dynamic depiction of the time-varying relationship between variables. The model was first proposed by Primiceri (Primiceri, 2005) and further applied and improved by Nakajima (Nakajima et al., 2011).
First, the general VAR model coefficients and covariance are constant (Sims, 1980):
t=1,2,...,
n
In Eq.(2),
is an observable endogenous vector of
;
is the coefficient vector of
;
is an unobservable shock vector with a covariance matrix
, expressed by the following equation:
In Eq.(3), the matrices
and
are expressed as follows:
Combining Eq.(3) and Eq.(4), Eq.(2) can be written as Eq.(5):
Among them, is converted to vector ,, is kronecker product.
Let
be the vector of the matrix
of non-0 and 1, and
be the vector of the symmetric matrix
, the concrete expression of the TVP-VAR model is as Eq.(6)~Eq.(8):
The parameters
and
are assumed to follow the random walk process. Suppose
follows a geometric random walk; And suppose that
obey:
In Eq.(9), is a 3-dimensional identity matrix, and are positive definite matrices. The Bayesian method is employed to estimate the model, and the Markov chain Monte Carlo method is used to estimate the posterior values of the parameters. The initial setting of model parameters in this paper is adopted from Nakajima (Nakajima, 2011):,. The total number of MCMC sampling is set to 10,000 times, and the samples from the first 1,000 times are considered pre-burned values and discarded.
4. Empirical Results and Analyses
4.1. Stationarity Test and Parameter Setting
To ensure data stability and avoid "pseudo-regression," the Augmented Dickey-Fuller (ADF) test (Dickey & Fuller, 1981) is first applied. Additionally, the Phillips-Perron (PP) test (Phillips & Perron, 1988) and the Kwiatkowski-Phillips-Schmidt-Shin (KPSS) test (Kwiatkowski et al., 1992) are used to determine whether EPU, INU, Hogp, Piglet, and Porkp contain unit roots. As shown in
Table 2, the results indicate that these variables are nonstationary, but become stationary after first-order differencing, with significance at the 1% level. Therefore, the first-differenced sequences are deemed suitable for further analysis, including MCMC sampling and TVP-SV-VAR model construction.
The construction of the TVP-SV-VAR model requires consideration of the lag order. Too few lags may result in ineffective model estimation, while too many lags may lead to model equation redundancy. Therefore, determining the optimal lag order is crucial for the overall results. In this paper, the TVP-SV-VAR model, with lag periods ranging from 1 to 6, is evaluated based on the logarithmic likelihood estimate. A lag period of 2 is ultimately selected.
4.2. Model Estimation Results
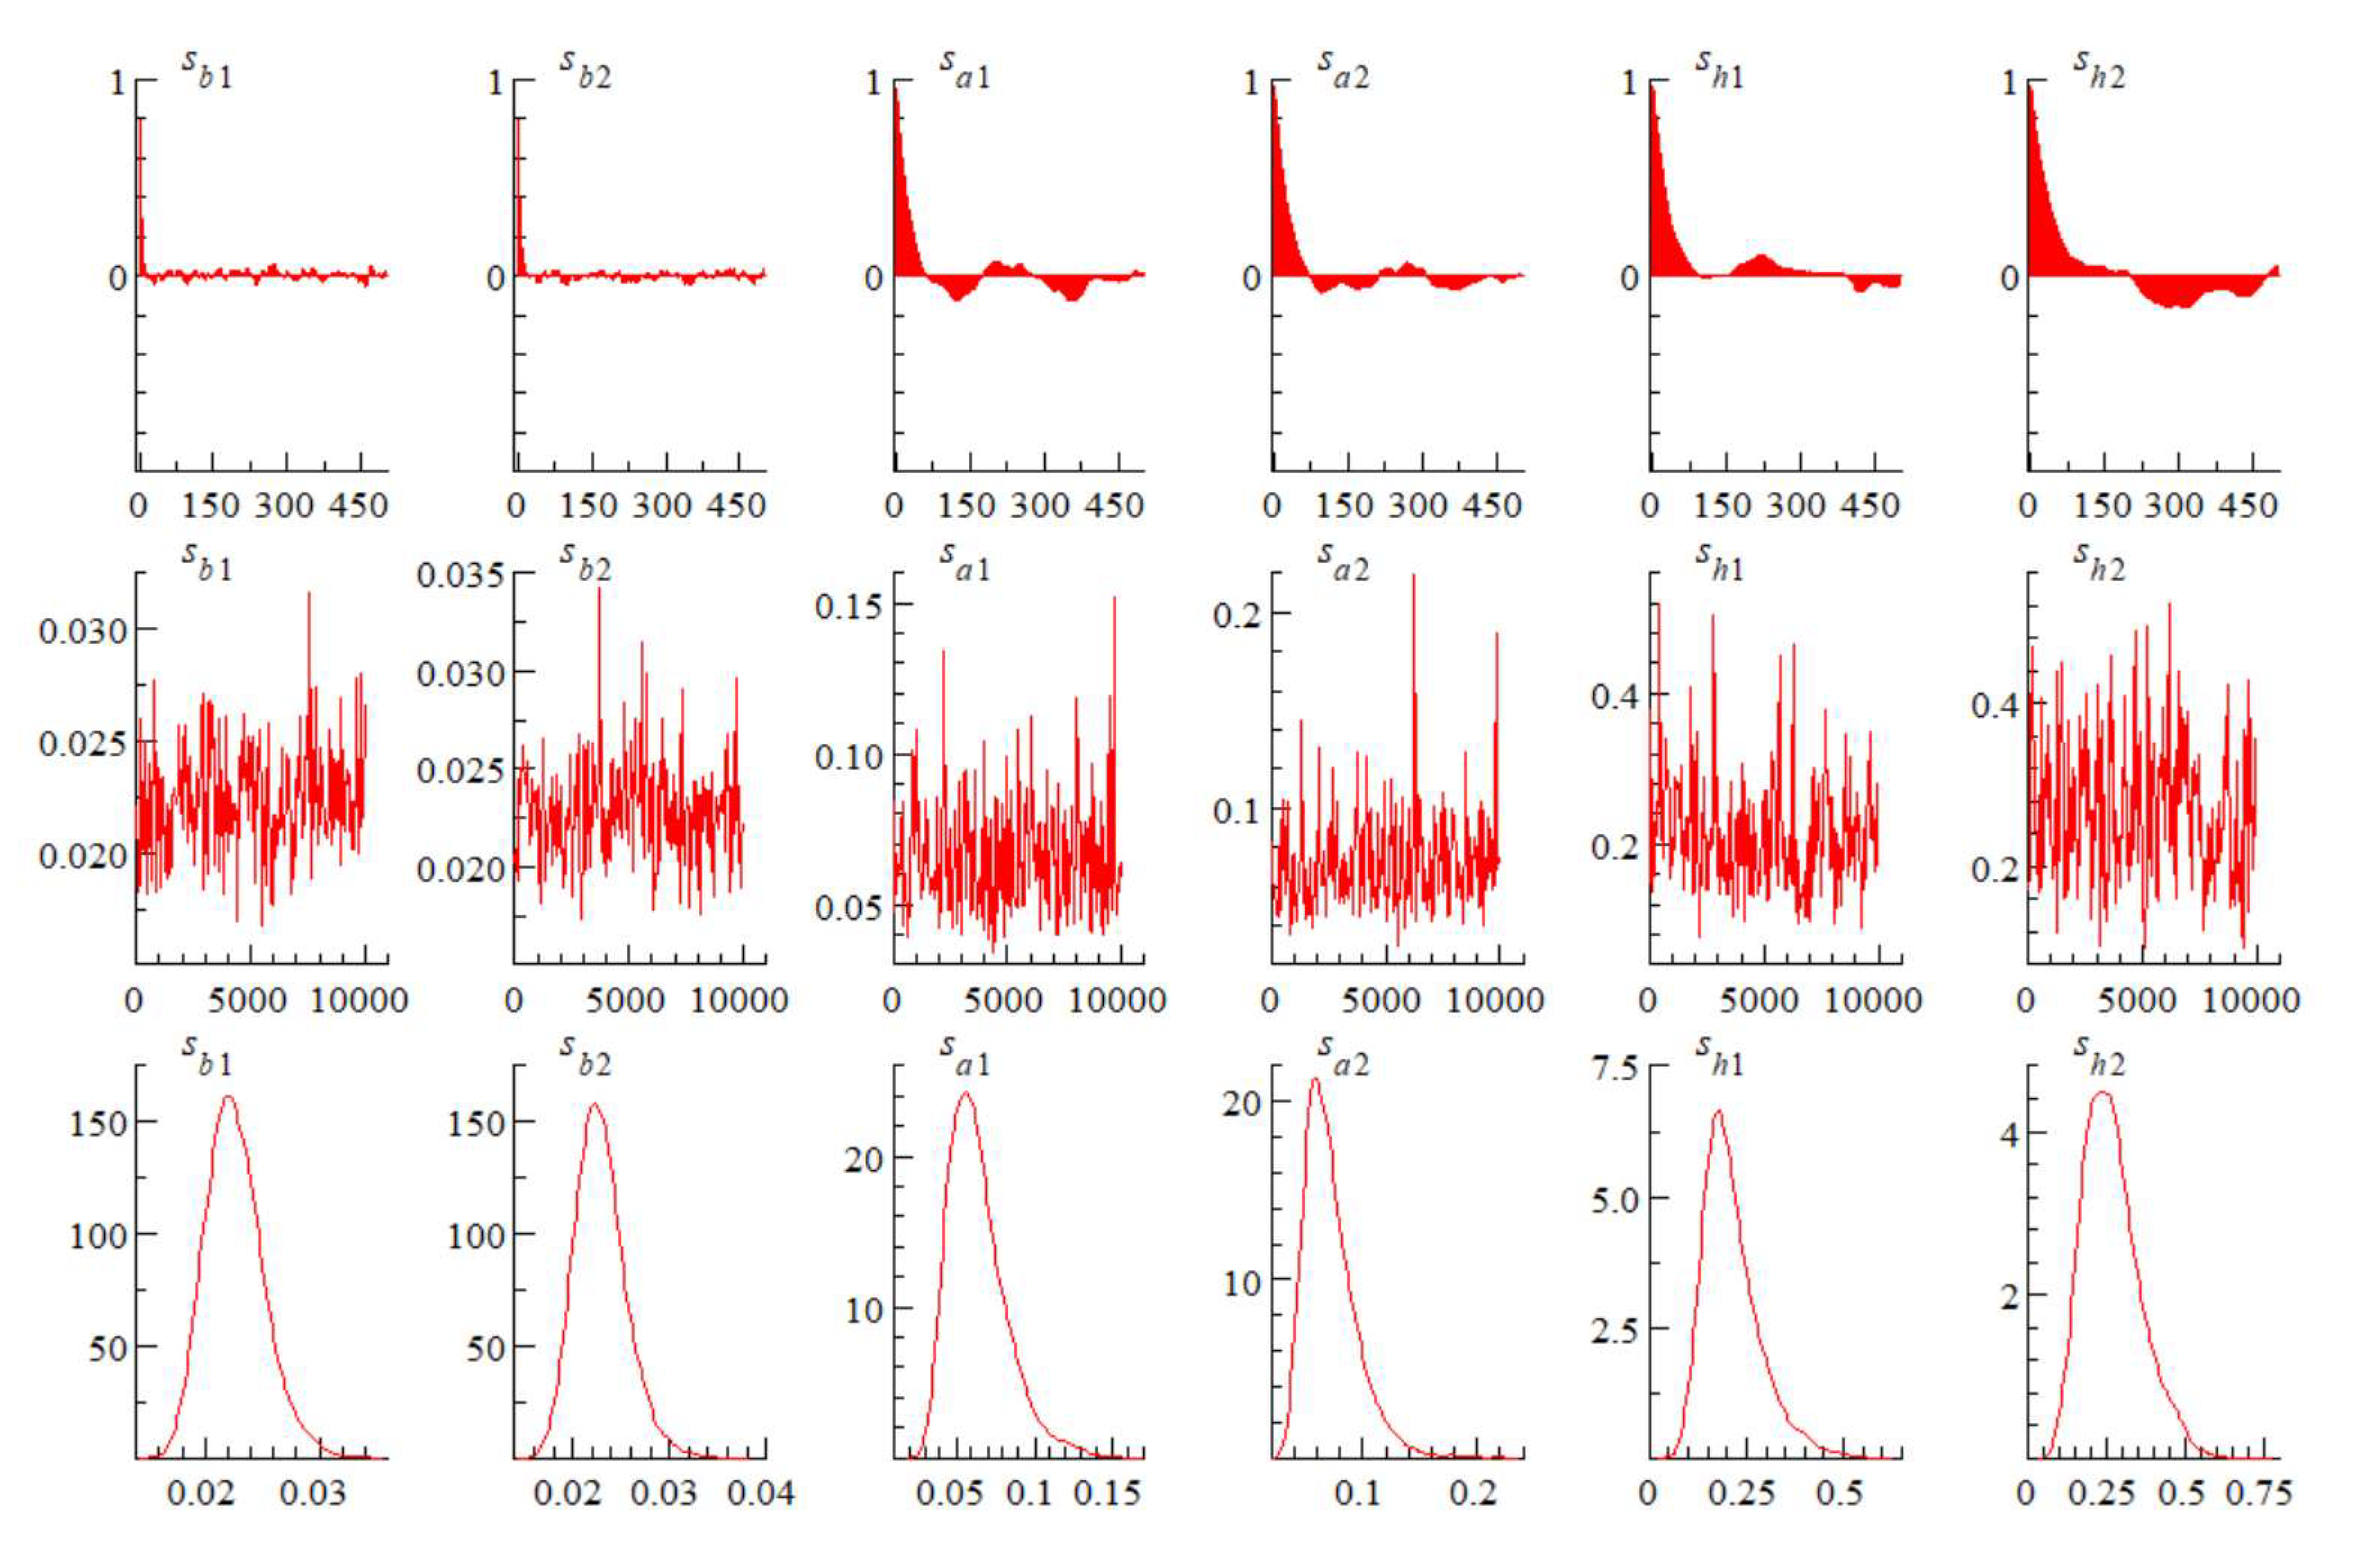
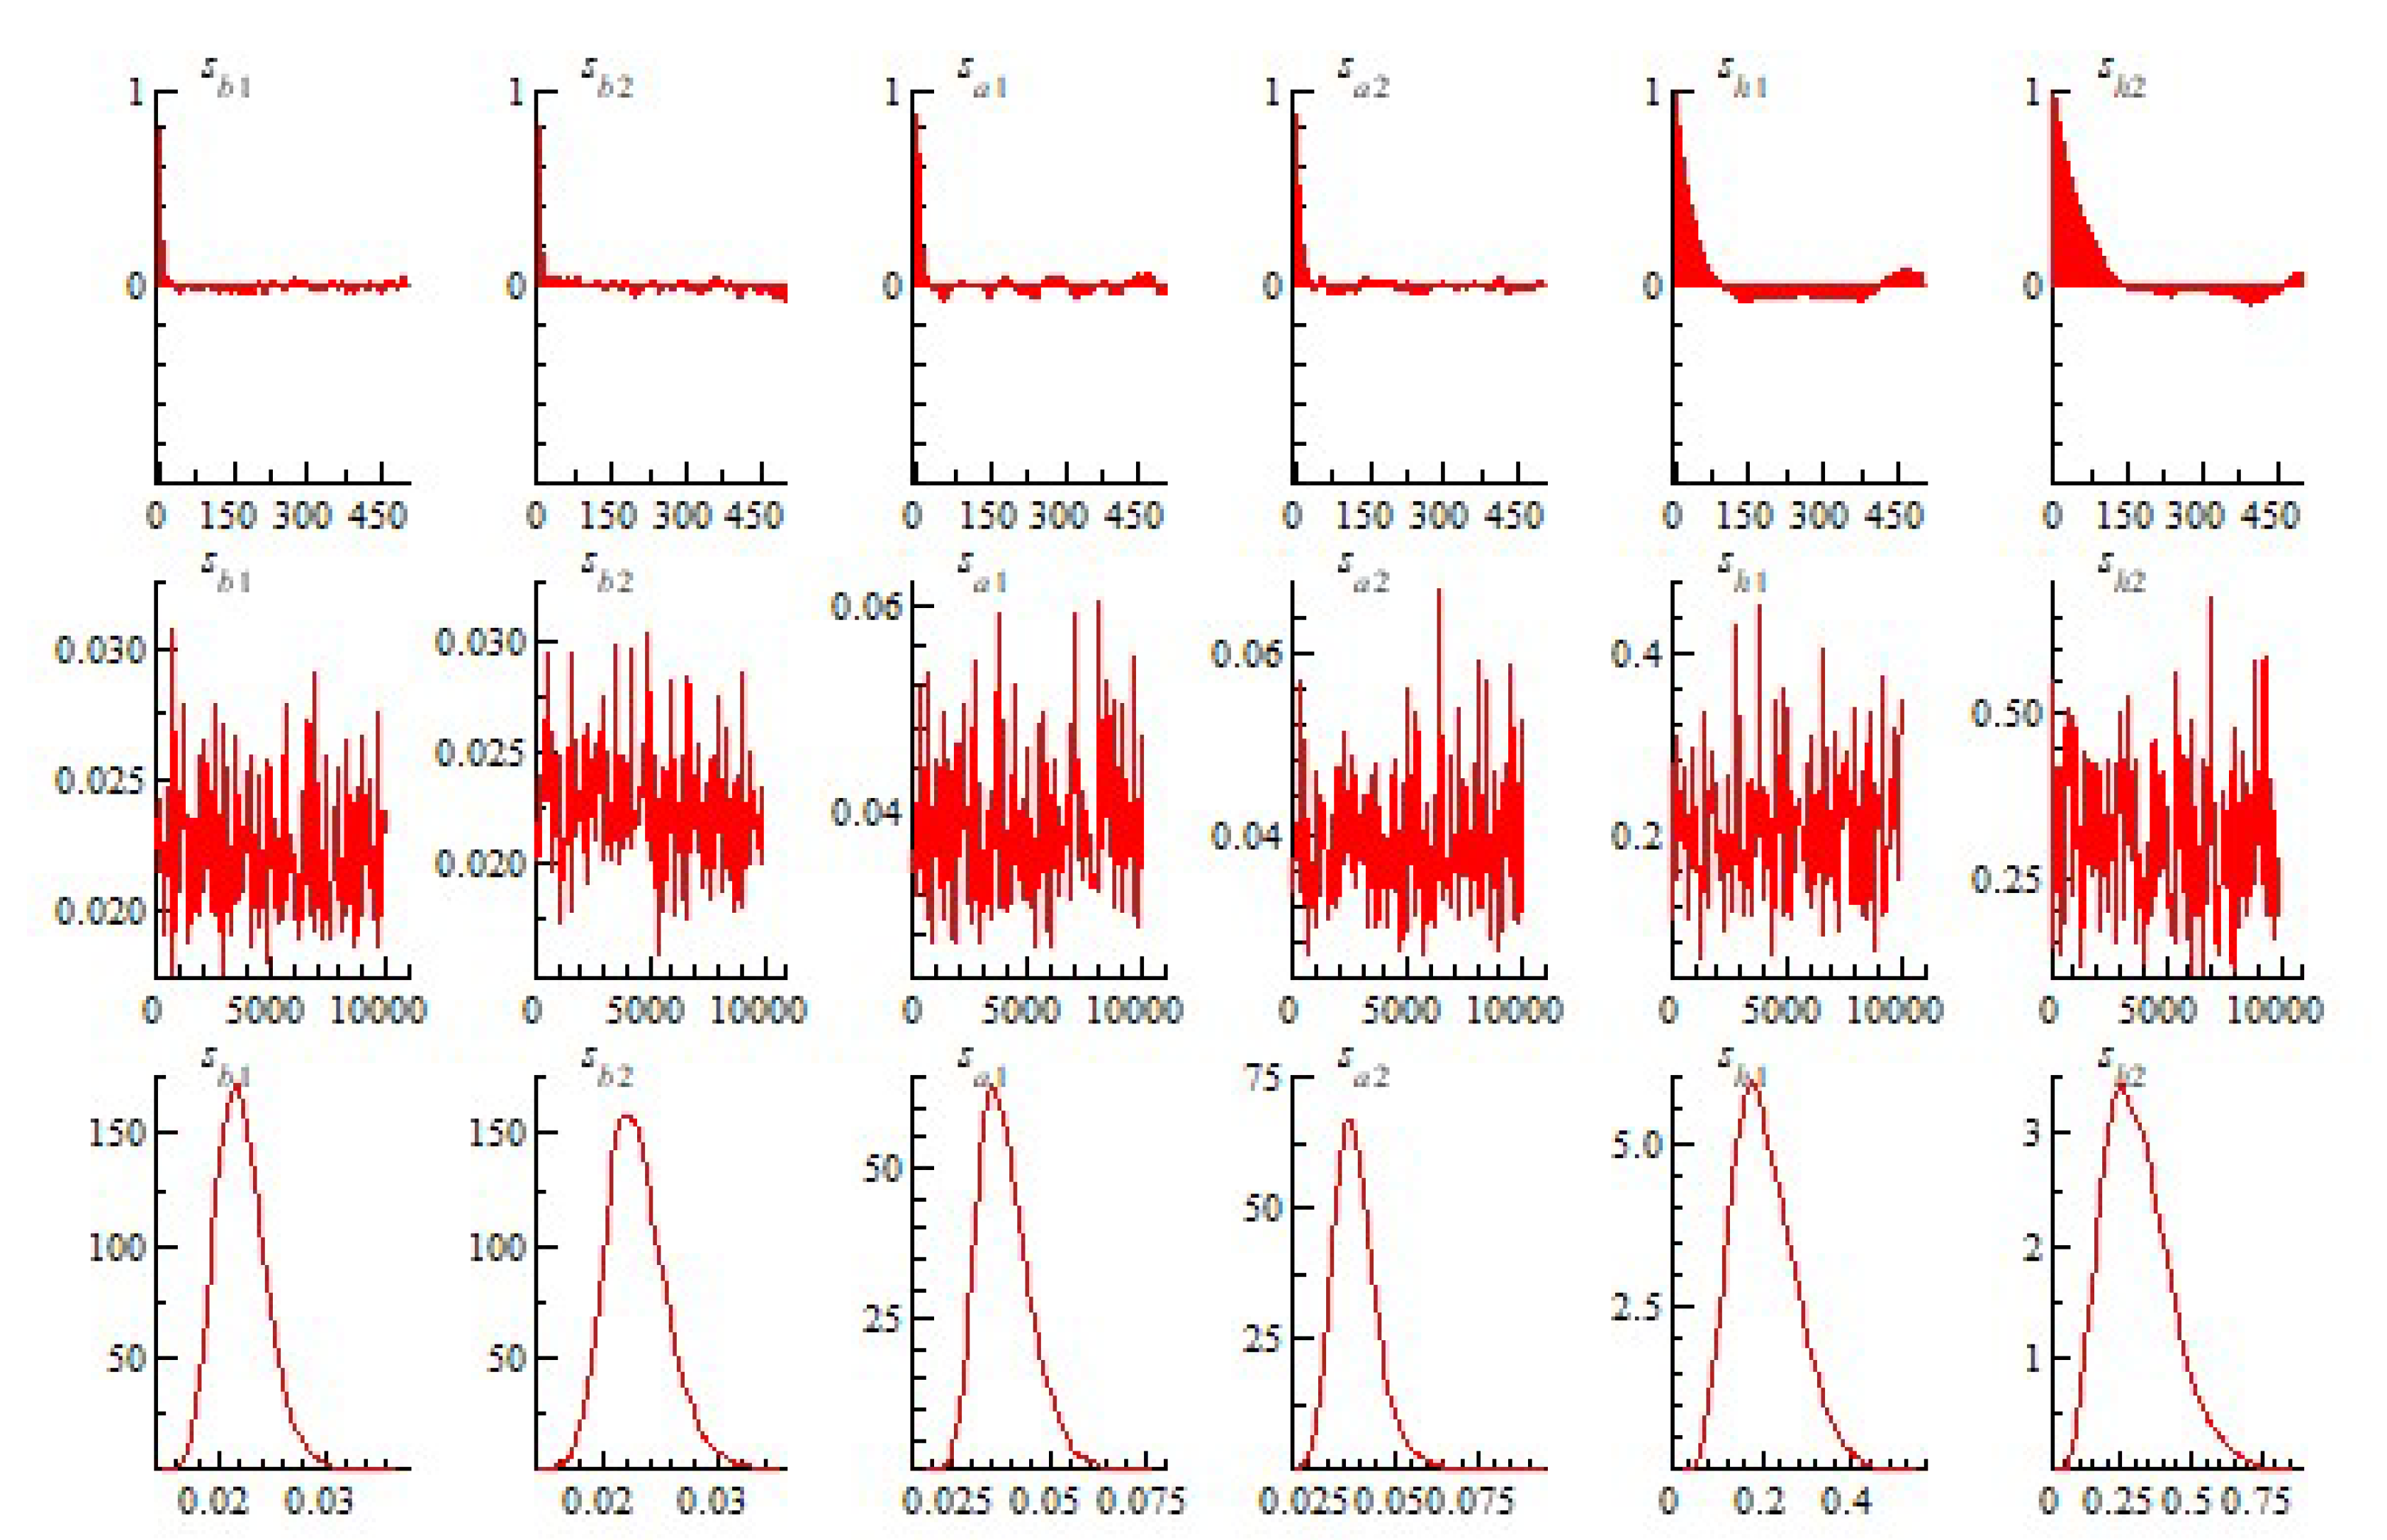
Figure 4 presents the results of the MCMC estimation, including the sample autocorrelation, sample path, and posterior density distribution of the parameters
, shown from top to bottom. The sample autocorrelation decreases rapidly as the number of samples increases, indicating that MCMC sampling effectively reduces autocorrelation. The sample path fluctuates around the mean, demonstrating relative stability without any discernible trend. The sample density converges to the posterior density of the parameter, indicating good convergence. Therefore, the results in
Figure 4 further validate the parameters of the TVP-SV-VAR model constructed by EPU, INU, Hogp, Piglet, and Porkp, enabling the study of their dynamic relationship through the TVP-SV-VAR model.
The numerical characteristics of parameters estimated by MCMC are summarized in
Table 3, which includes the mean value, standard deviation, confidence interval, Geweke value, and inefficiency factor. The mean values of the parameters fall within the 95% confidence interval, and the standard deviations are low, indicating parameter stability. The Geweke values are all below 1.96, suggesting that the null hypothesis of backward density convergence of parameters cannot be rejected (Geweke, 1992). The inefficiency factors are all below 100, meaning that at least 113 samples (10,000/88.49) can be obtained from 10,000 samples, indicating the effectiveness of the MCMC sampling process and parameter estimation of the TVP-SV-VAR model.
4.3. Time-Varying Impulse and Response Results
This chapter examines the dynamic effects of Economic Policy Uncertainty (EPU) and Live Pig Industry News Uncertainty (INU) on the prices within the pig industry chain. The analysis includes impulse responses over various lag periods and specific historical points. In equidistant lagged impulse responses, lag periods are fixed at three, six, and nine intervals to evaluate the persistence of the impacts from EPU and INU. For impulse responses at specific historical points, three periods with significant fluctuations in the uncertainty indices were selected to explore whether the impacts of EPU and INU on the prices of the live pig industry chain differ across distinct historical contexts.
4.3.1. Impulse Response of Pig Industry Chain Price to Economic Policy Uncertainty
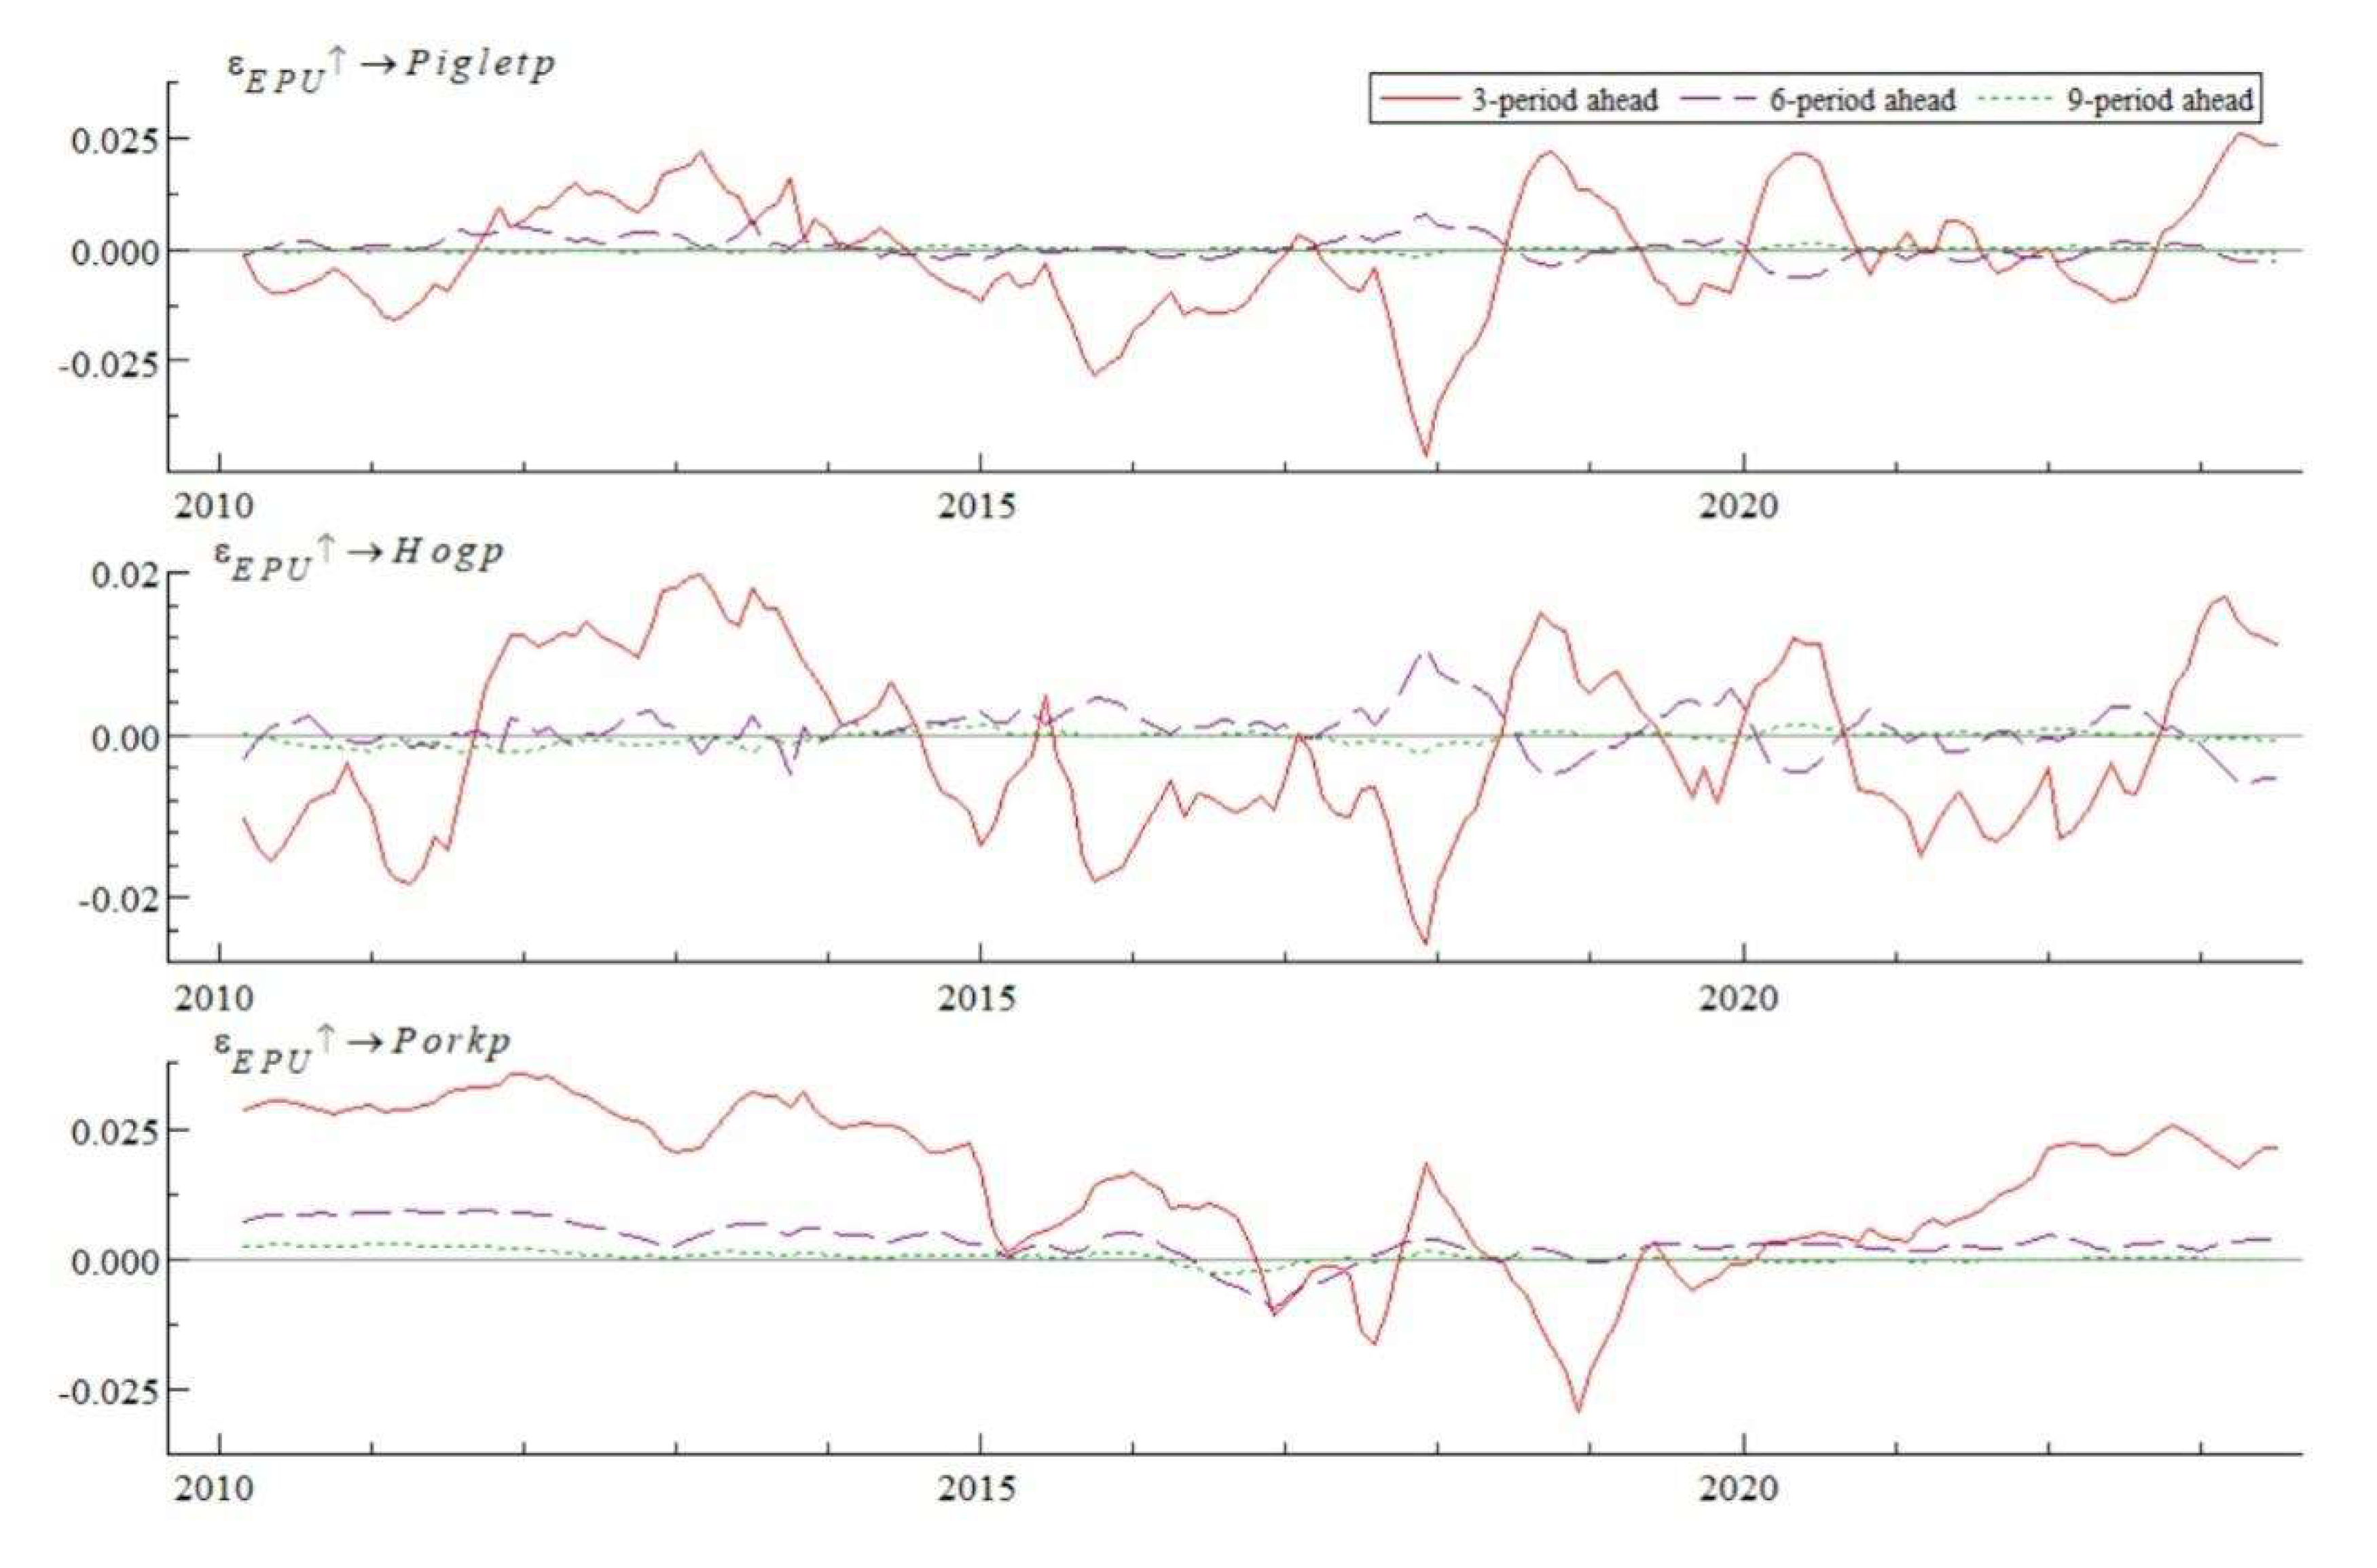
The impulse response results of the live pig industry chain prices to Economic Policy Uncertainty (EPU) are depicted in
Figure 5. The response curves at lag periods of six and nine are nearly zero, indicating that EPU's fluctuations do not sustainably impact the prices within the live pig industry chain. Hence, analyzing the impulse responses at a lag of three periods provides insight into how the supply and demand sides of the live pig industry chain react to EPU.
(1) EPU and Supply-Side Prices: Across the entire interval, a standard deviation's positive shock from EPU on supply-side prices exhibits a cyclic pattern of positive to negative to positive shifts, with impact intensity fluctuating between [-0.02, 0.02]. The impulse response trends for piglet and live pig prices are consistent, although the impact on live pig prices is generally more pronounced than on piglet prices. This is mainly due to the different life-cycle stages of piglets and live pigs; fluctuations in live pig market prices are more complex. For instance, the surge in live pig prices in 2019 was primarily due to a significant reduction in live pig stocks earlier, leading to insufficient market supply. Under substantial profit margins and policies supporting production capacity recovery, farmers rapidly adjusted breeding scales and increased live pig stocks, only for subsequent overcapacity to drive prices down.
(2) EPU and Demand-Side Prices: A standard deviation's positive EPU shock on the demand side also alternates between positive and negative impacts, with the overall trend shifting from positive to negative to positive again, and the intensity varying within [-0.025, 0.025]. These fluctuations display periodicity and stability, with positive responses from 2010 to 2017 and after 2020, and negative responses from 2017 to 2020. The predominance of positive impacts suggests that the market's demand for pork remains relatively stable, minimally affected by economic policy changes. The main reasons are economic fluctuations that increase production costs and reduce capacity, leading to excessively high pork prices in the market. However, Chinese residents' dietary preferences strongly favor pork, and they are unlikely to switch to alternatives simply due to price changes.
(3) Differences Between Supply and Demand Responses: While the overall trends of EPU's impact on prices at the supply and demand sides are consistent, the impulse response curves for pork prices on the demand side are more stable. This indicates that prices on the supply side of the live pig industry chain are more susceptible to economic policy uncertainty. In response to economic environmental changes and policy adjustments, pig farmers tend to adjust their production scales, thereby affecting production-end prices. For example, during the enactment of the "Pig Slaughter Regulation" policy, the government required farmers and enterprises to gradually phase out outdated pig production capacities to ensure the high-quality development of the pig industry. Additionally, economic pressures from Federal Reserve rate hikes led some pig farmers to voluntarily reduce their stocks, causing a market reduction in live pig stocks and an increase in prices.
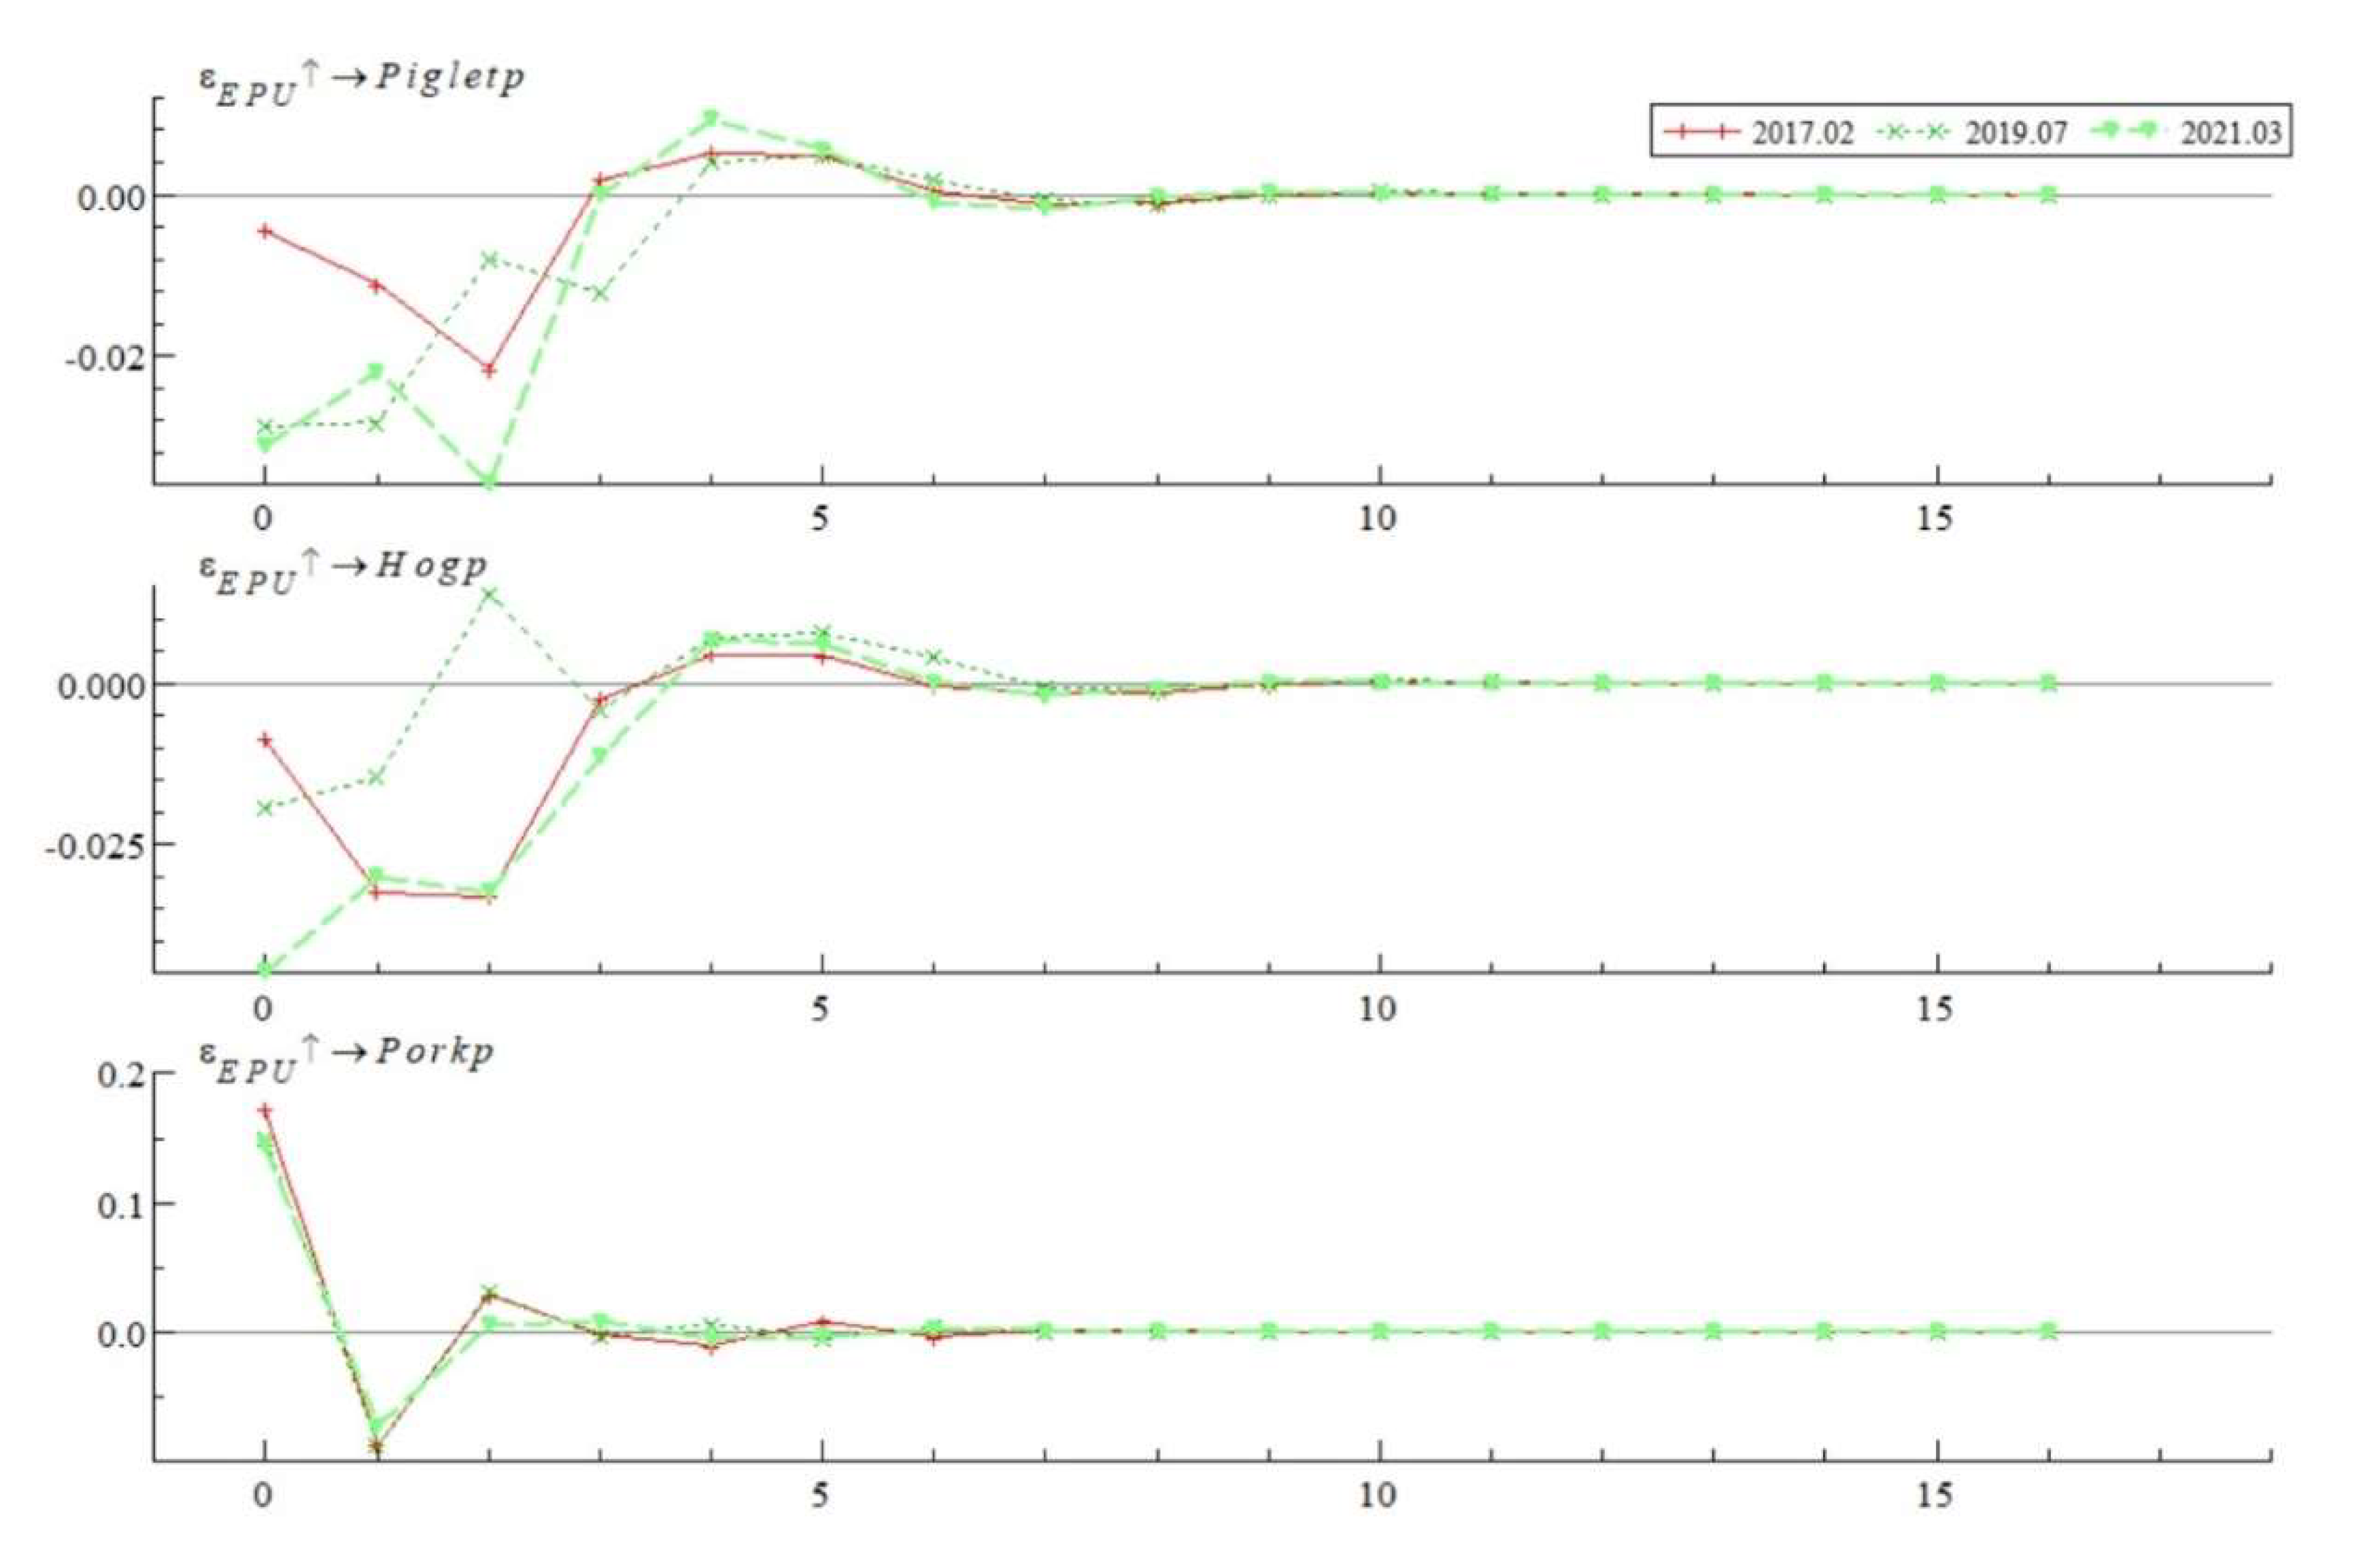
The impulse response results of the live pig industry chain prices to Economic Policy Uncertainty (EPU) at specific historical points are illustrated in
Figure 6. The selected historical points include February 2017, July 2019, and March 2021, corresponding to significant events such as China's agricultural supply-side reform, the US-China trade war, and the COVID-19 pandemic, respectively. The impact of EPU on the prices of the live pig industry chain at these specific points exhibits several distinctive features:
(1) Direction of Impact: EPU has a negative impact on supply-side prices, but its effect on demand-side prices is initially positive and then turns negative. The main reasons for these varied impacts relate to the distinct historical contexts of the periods under consideration: the agricultural supply-side reforms in 2017, which eliminated much of the outdated pig production capacity; the rise in feed prices during the US-China trade war in 2019, which affected breeders' profit expectations; and the dampening of pig breeders' enthusiasm for production due to COVID-19 pandemic controls in 2021. These events illustrate how reductions in stock levels and breeding expectations can lead to negative price adjustments for piglets and live pigs.
(2) Duration of Impact: The impact of EPU on supply-side prices lasts for six periods, whereas its impact on demand-side prices lasts only three periods. The changes in economic policy have a longer-lasting effect on supply-side prices than on demand-side prices, primarily because prices on the supply side are influenced by stock levels, and breeders need time to adjust their production capacities. In contrast, pork prices on the demand side are tied to the normal development of the national economy. When market prices fluctuate, the government often releases reserve meat to stabilize prices, making demand-side prices easier to control in the short term.
(3) EPU and Demand Side: The impact of EPU on pork prices shows a pattern of initially positive followed by negative effects, with the response curves at all three points highly overlapping. The primary reason is that economic policy uncertainty predominantly leads to a shortage in supply, as pig stock levels are often reduced under the influence of EPU. Consumer demand for pork remains unchanged, but the insufficient supply leads to successive price increases. As market supply eventually increases, the price trend gradually shifts downward.
4.3.2. Impulse Response of Pig Industry Chain Price to Industrial News Uncertainty
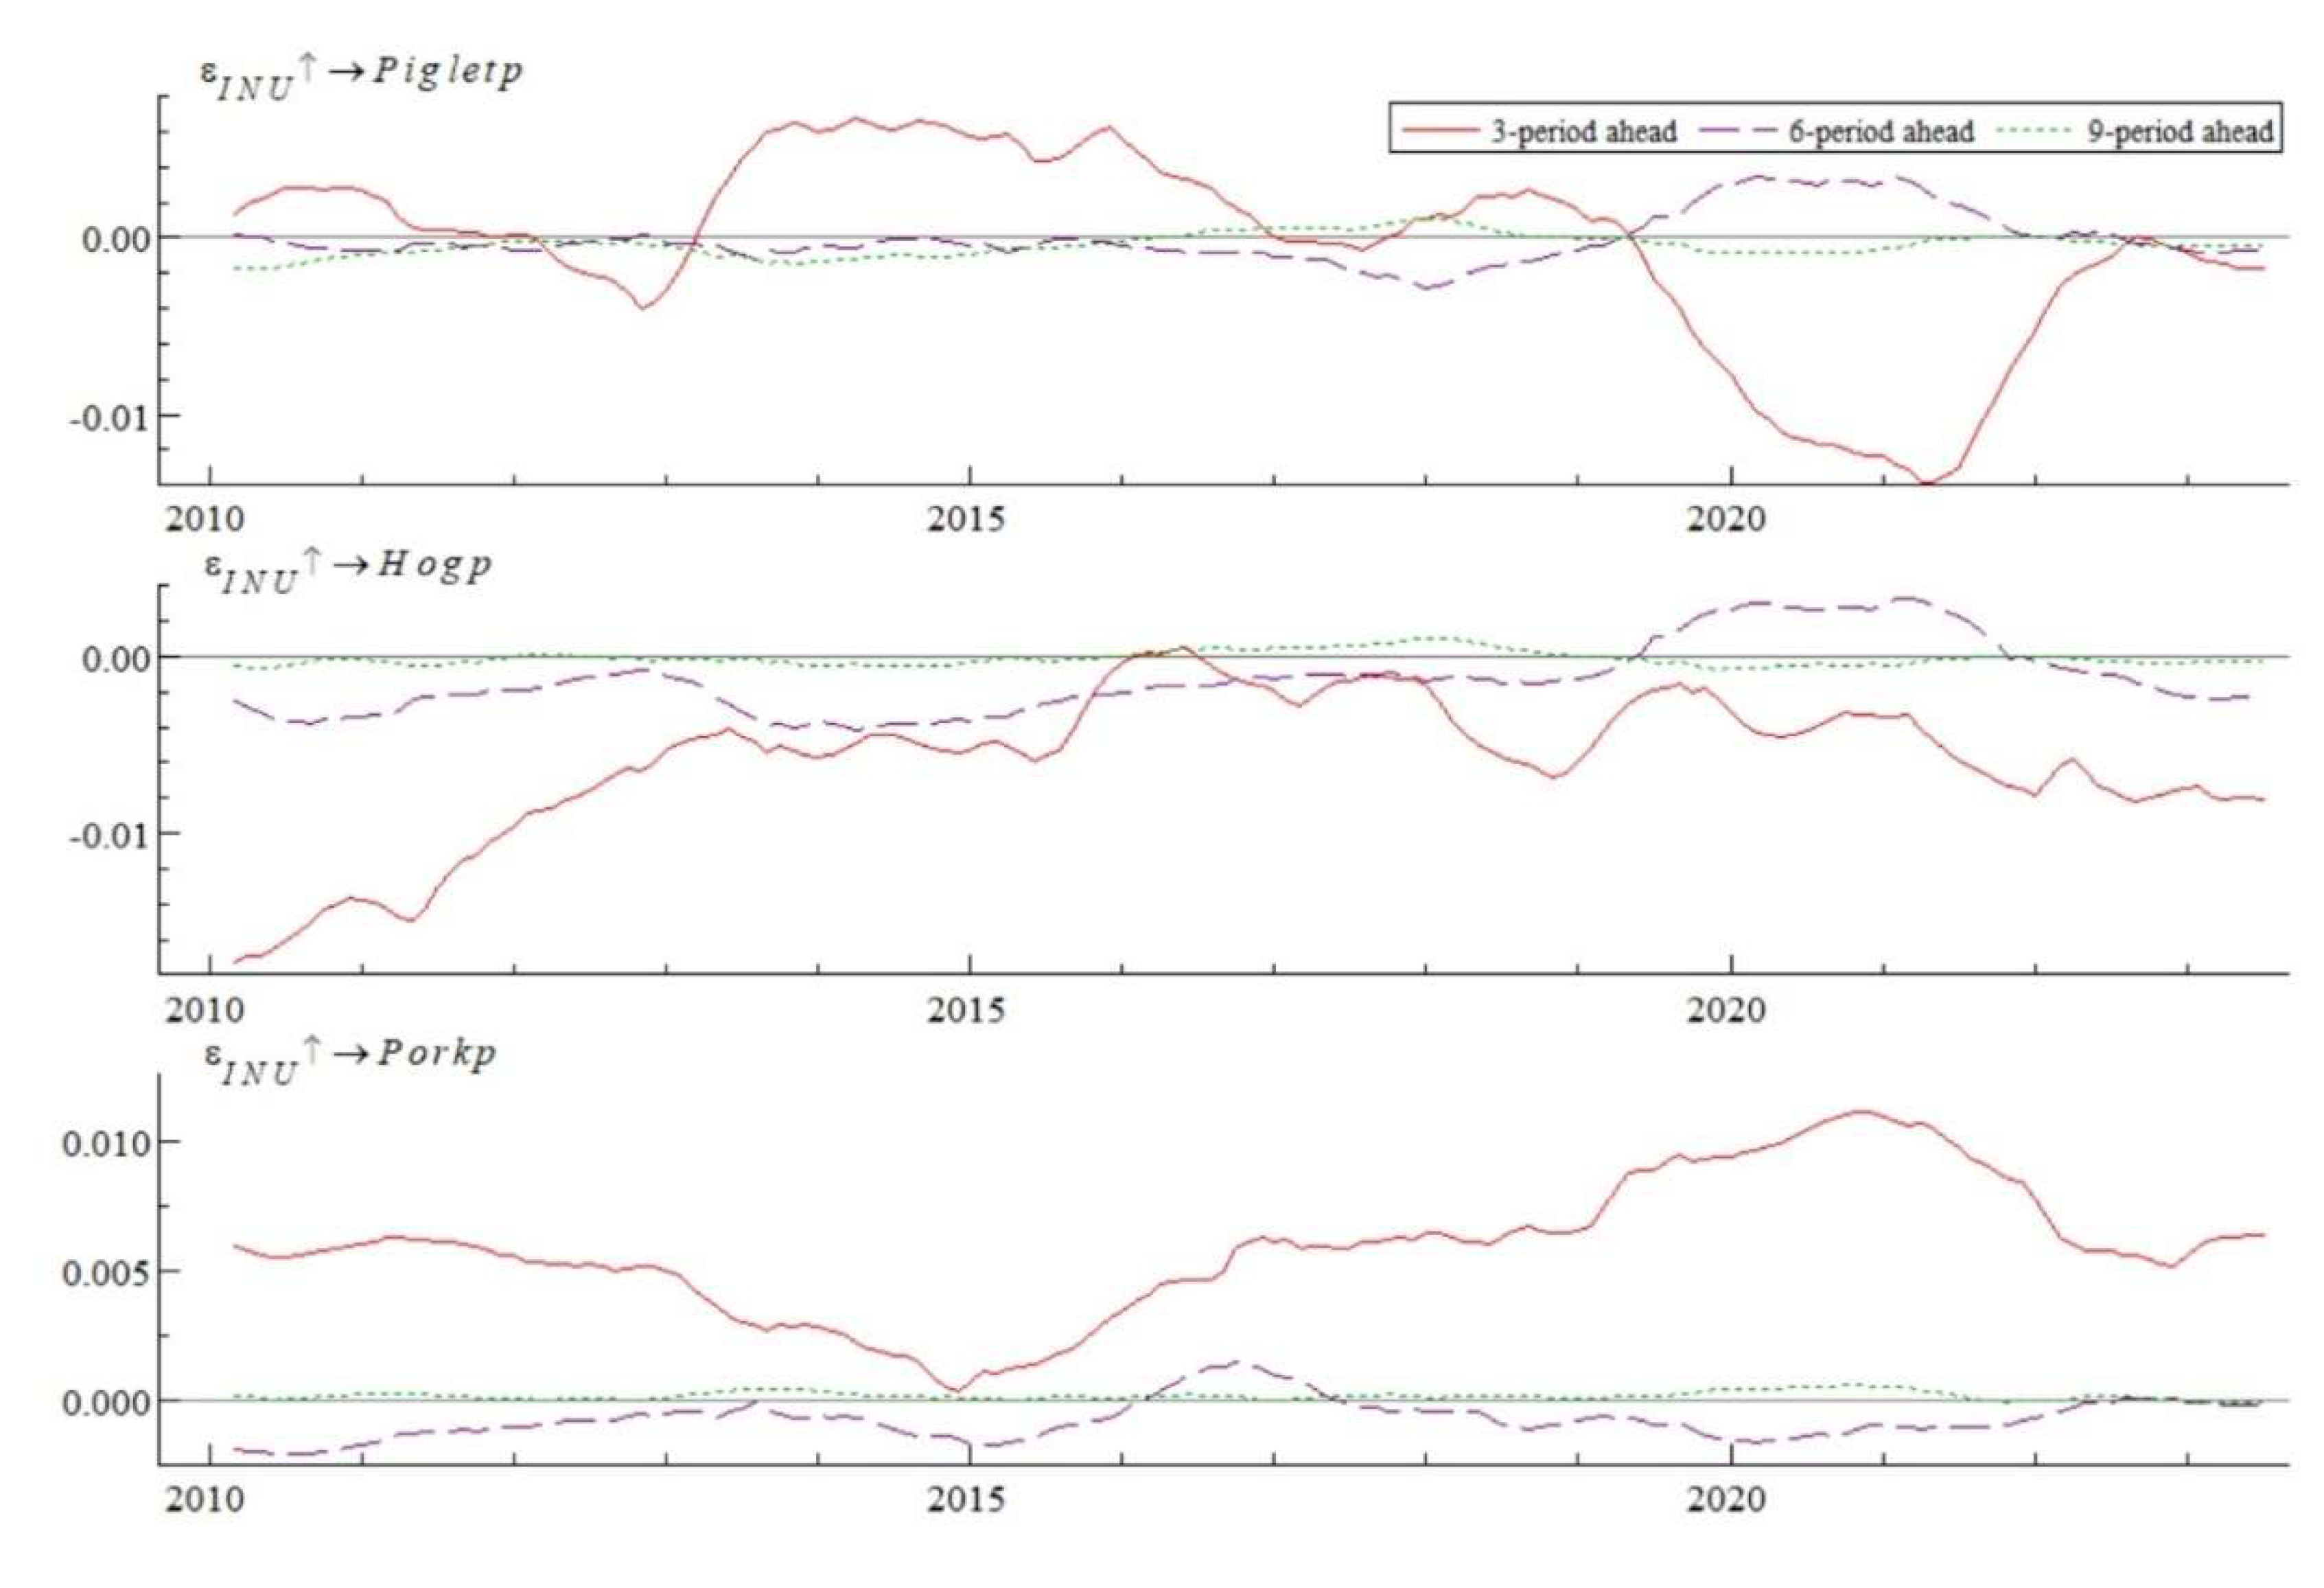
The impulse response results of the live pig industry chain prices to Live Pig Industry News Uncertainty (INU) are illustrated in
Figure 7. The response curves at lag periods of six and nine tend towards zero, indicating that INU's fluctuations do not have a lasting impact on the prices within the live pig industry chain. Hence, analyzing the impulse responses at a lag of three periods provides insight into how the supply and demand sides of the live pig industry chain react to INU.
(1) INU and Supply-Side Prices: Across the entire interval, a standard deviation's positive INU shock causes alternating positive and negative impacts on piglet prices, with the intensity fluctuating between [-0.01, 0.01]. In 2019, the impact shifted from positive to negative. INU consistently exerts a negative influence on live pig prices, with the intensity ranging from [-0.016, 0], gradually weakening from 2010 to 2015. The primary reason for this pattern in piglet prices is their susceptibility to INU shocks, accentuated by changes in live pig stocks. The outbreak of negative news leads breeders to reduce their production capacities, decreasing the demand for piglets. As government measures such as the "Lean Meat Essence Special Rectification Plan" and the "Live Pig Production Capacity Control Implementation Plan" come into effect, increasing regulatory intensity gradually mitigates the negative impact of the news. This results in an increase in breeders' enthusiasm to expand their pens, boosting the demand for piglets.
(2) INU and Demand-Side Prices: A standard deviation's positive INU shock has a positive impact on pork prices on the demand side, with the intensity fluctuating between [0, 0.01]. After 2015, the positive impact trends upwards, reaching its peak in 2021. Under the influence of INU, the prices on the demand side are also affected by the production side. Historical events related to food safety and epidemics show that when negative news about the pig industry arises, breeders typically adopt a pessimistic outlook on future market trends. As a result, they often reduce production capacity to mitigate losses from market price risks, which in turn leads to a rise in pork prices due to insufficient market supply.
(3) Difference in Impact Between INU and EPU: The impact of INU on industry chain prices is less significant than that of EPU, mainly due to consumer behavior. Changes in the economic environment influence consumers' expectations for the future, their income, and their willingness to consume, and the extent of these influences determines the overall consumer demand for pork. However, industry-specific news, such as pig slaughtering standards and environmental regulations, has a more pronounced effect on pig breeders. We can reasonably infer that negative news related to live pigs is unlikely to structurally impact China's demand for pork, as consumers are unlikely to alter their long-established dietary culture and consumption preferences.
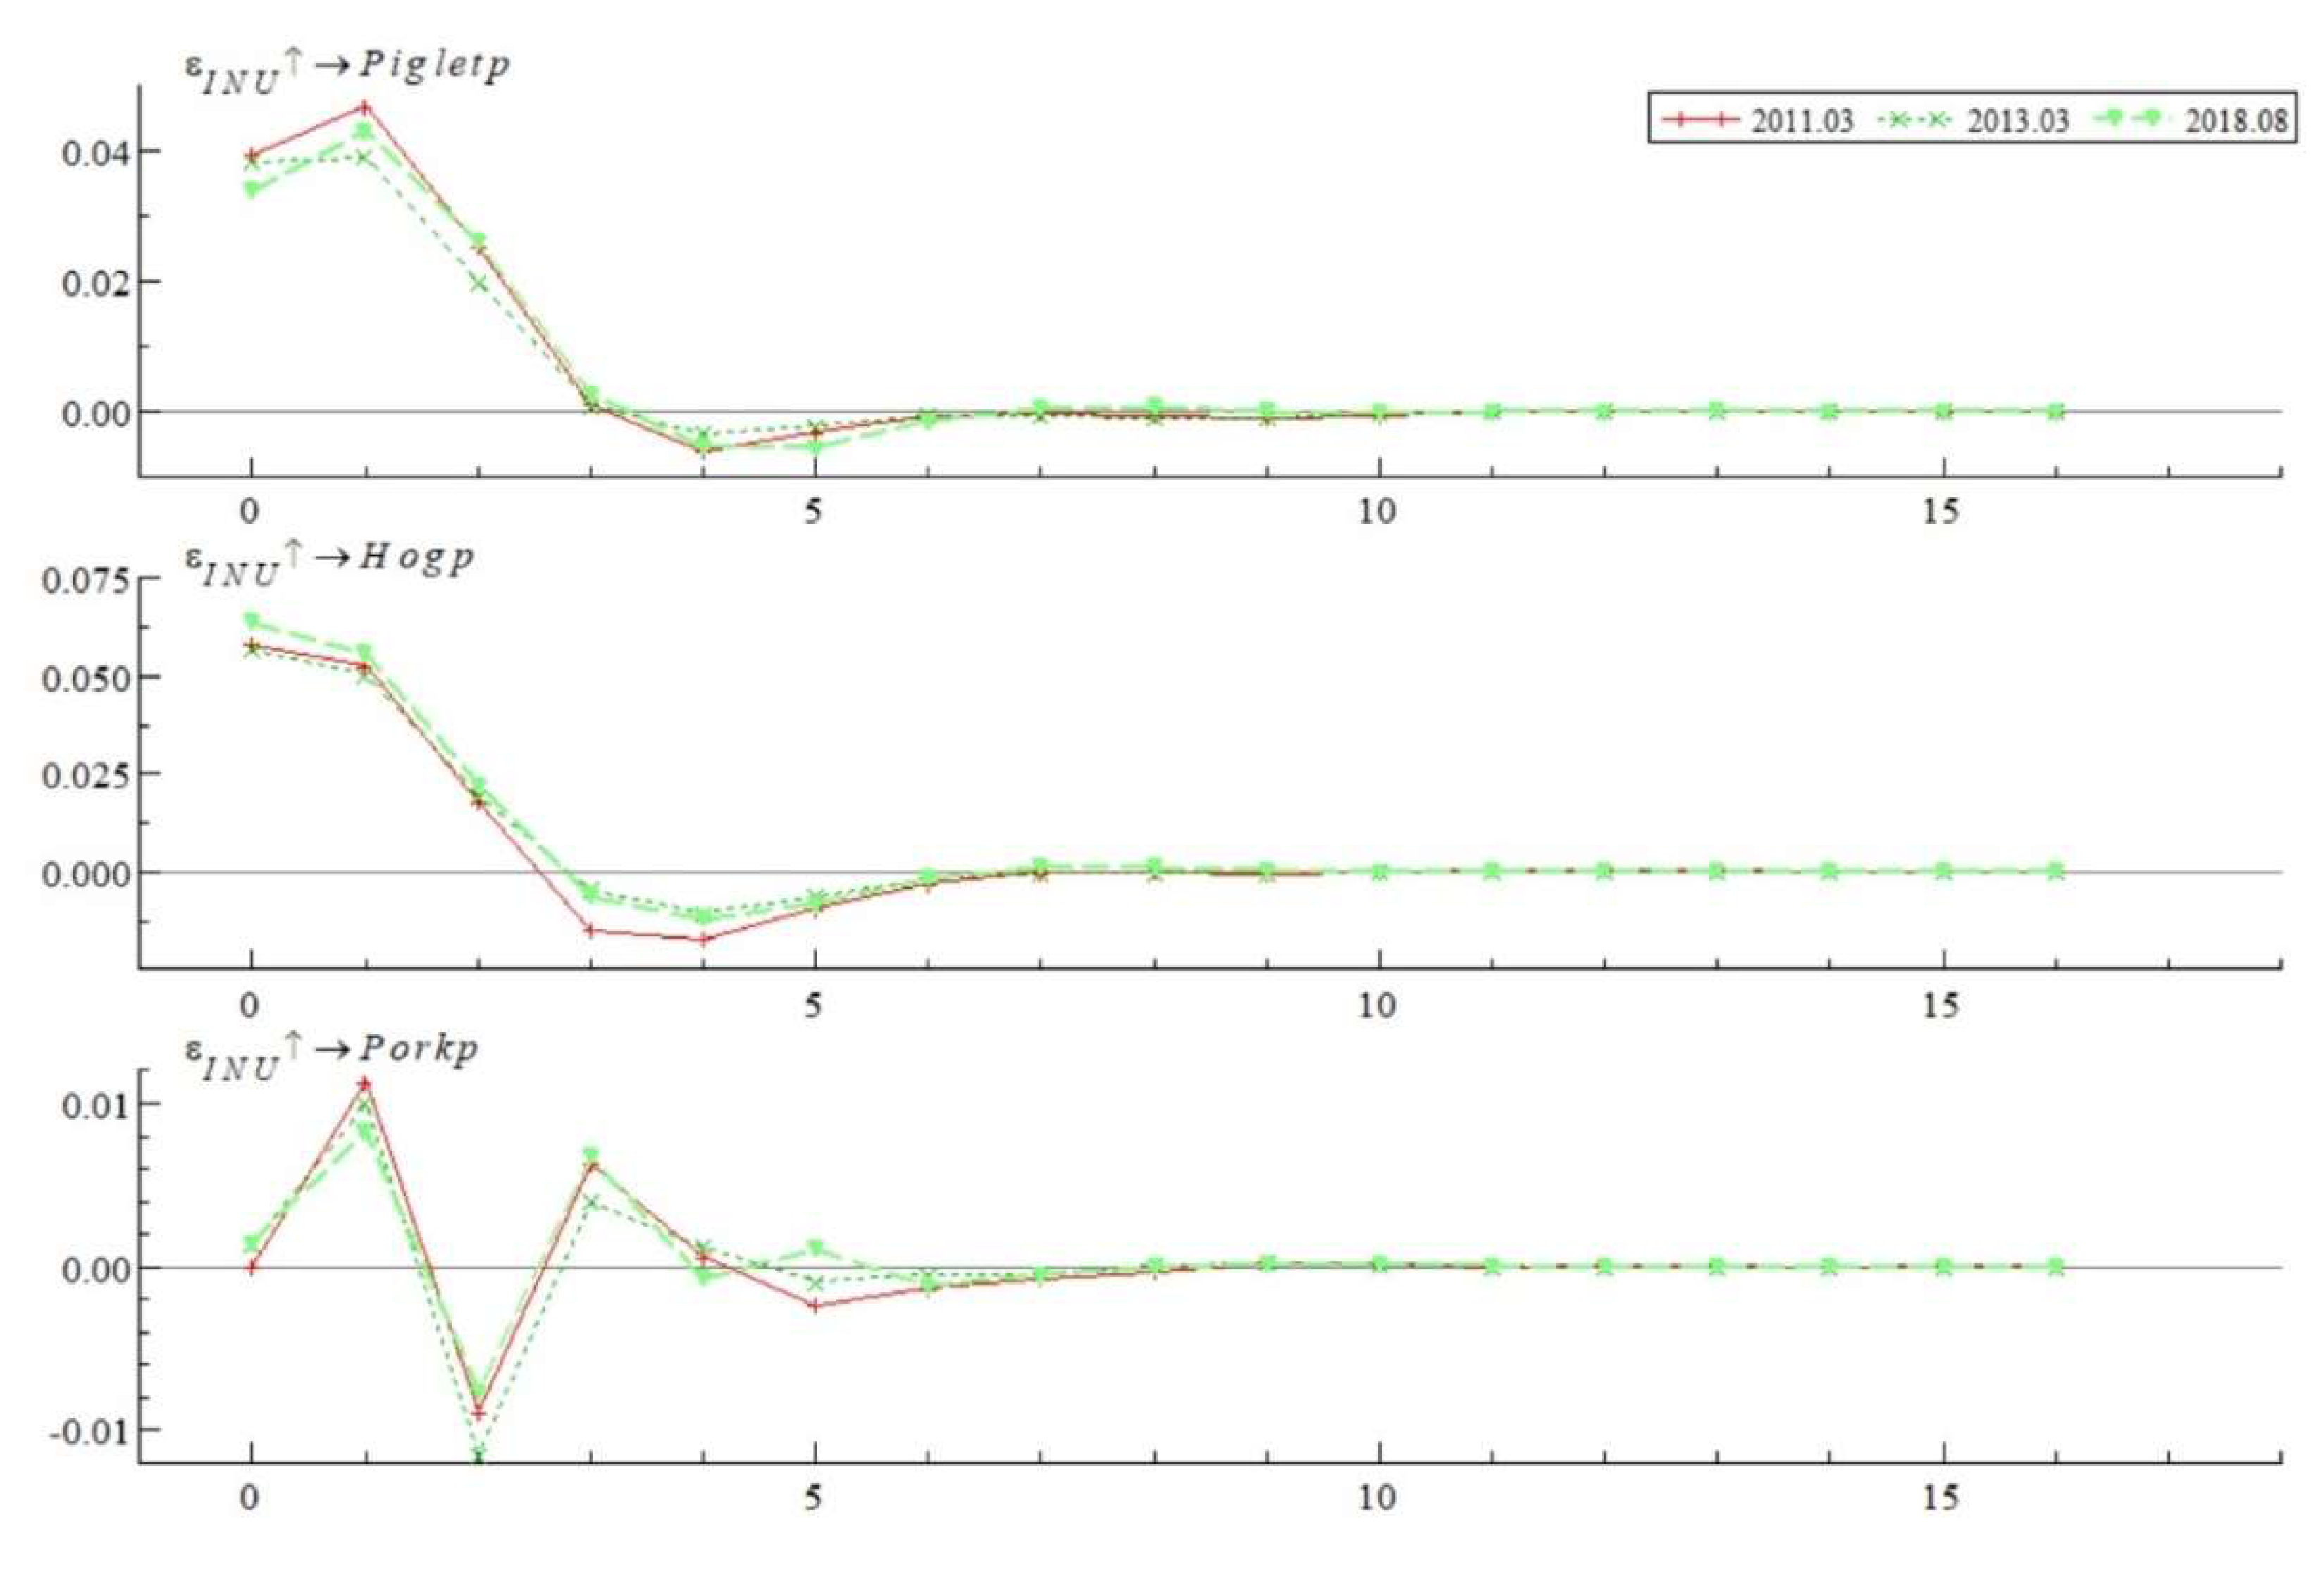
The impulse response results of the live pig industry chain prices to Industry News Uncertainty (INU) at specific historical points are shown in
Figure 8. The selected points include March 2011, January 2013, and August 2018, corresponding to major news events such as the "Clenbuterol incident," "pig drifting incident," and the outbreak of "African swine fever," respectively. The impact of INU on the live pig industry chain prices at these points exhibits several notable characteristics:
(1) Variability in Impact Strength: At these specific points, the impact of INU on supply-side prices is more significant than on the demand side. The impact on the prices of piglets and live pigs exceeds 0.04, while the impact on pork prices is less than 0.01. The more substantial impact on the supply side might lead to structural adjustments within the industry chain. For instance, following the "pig drifting" and "African swine fever" incidents, the state intensified environmental regulations for pig breeding and slaughtering, leading to the elimination of numerous outdated capacities. This structural adjustment caused a severe short-term shortage in market production capacity, adversely affecting later market price fluctuations. The results are consistent with the above analysis conclusions.
(2) Direction of Impact: INU impacts the prices of piglets and live pigs positively, while its impact on demand-side pork prices alternates between positive and negative. Typically, following major pig news outbreaks, breeders cull diseased and unqualified pigs, leading to a rapid decrease in supply-side capacity, which causes an initial rise in live pig prices. On the demand side, pork prices also initially rise due to the supply shortage, but as consumers increasingly focus on the news and reduce their consumption out of concern for food safety, pork prices then decline. This alternating pattern of impact suggests a potential "intergenerational" effect of industry news uncertainty on pork prices, where changes in current market prices lead to subsequent adjustments in market supply and demand, thus adversely affecting price fluctuations.
(3) Consistency Across Historical Points: The impulse responses of INU on live pig industry chain prices at these three historical points highly overlap, yet none exhibit long-term sustainability. This indicates that the impact of INU on industry chain prices follows a certain historical pattern during major pig industry news outbreaks, suggesting a high degree of consistency in its mechanism of action. The experiences from earlier events provide valuable insights. Additionally, the impact of INU on industry chain prices tends to approach zero after five periods, indicating that the effects of pig-related news do not sustainably influence prices over extended periods.
5. Further Discussion
We build upon the initial empirical analysis by exploring three key dimensions: Firstly, we conduct a robustness test by replacing the source of the news uncertainty index compilation for the pig industry. This modification demonstrates that the findings regarding the impact of news uncertainty on the industry chain's pricing remain robust. Secondly, in order to verify whether the uncertainty impact of specific events is robust, the uncertainty index of live pig epidemic is constructed to investigate its impact on the price of the industrial chain. Thirdly, we incorporate the variable of pig slaughter volume into our empirical analysis to elucidate the mechanisms through which uncertainty-induced shocks affect the industry chain's pricing.
5.1. Robustness Test
Firstly, in the robustness test segment of this research, we substituted the original source of the index from the People's Daily to the Farmers' Daily, aligning with the previously described method for compiling the pig industry news uncertainty index. Although Farmers' Daily is less prominent and well-known compared to People's Daily, its strong relevance to agricultural activities and significant coverage of pig-related news justify its selection as a more comprehensive source for compiling the uncertainty index of pig industry news. Over 152 months, from the inception of the digital edition of Farmers' Daily in December 2010 to August 2023, We crawled all the daily data following the electronic release of Farmers' Daily and manually screened 2,083 industry news reports related to "pig" and "live pig" through word frequency analysis. We utilized the measurement method established in
Section 3 and constructed the pig industry news uncertainty index (INU_F) from Farmers' Daily.
Secondly, utilizing the newly compiled pig industry news uncertainty index (INU_F), we developed a Time-Varying Parameter - Stochastic Volatility - Vector Autoregression (TVP-SV-VAR) model to assess its impact on pig industry chain prices. According to the results detailed in
Table A1 and
Table A2 and
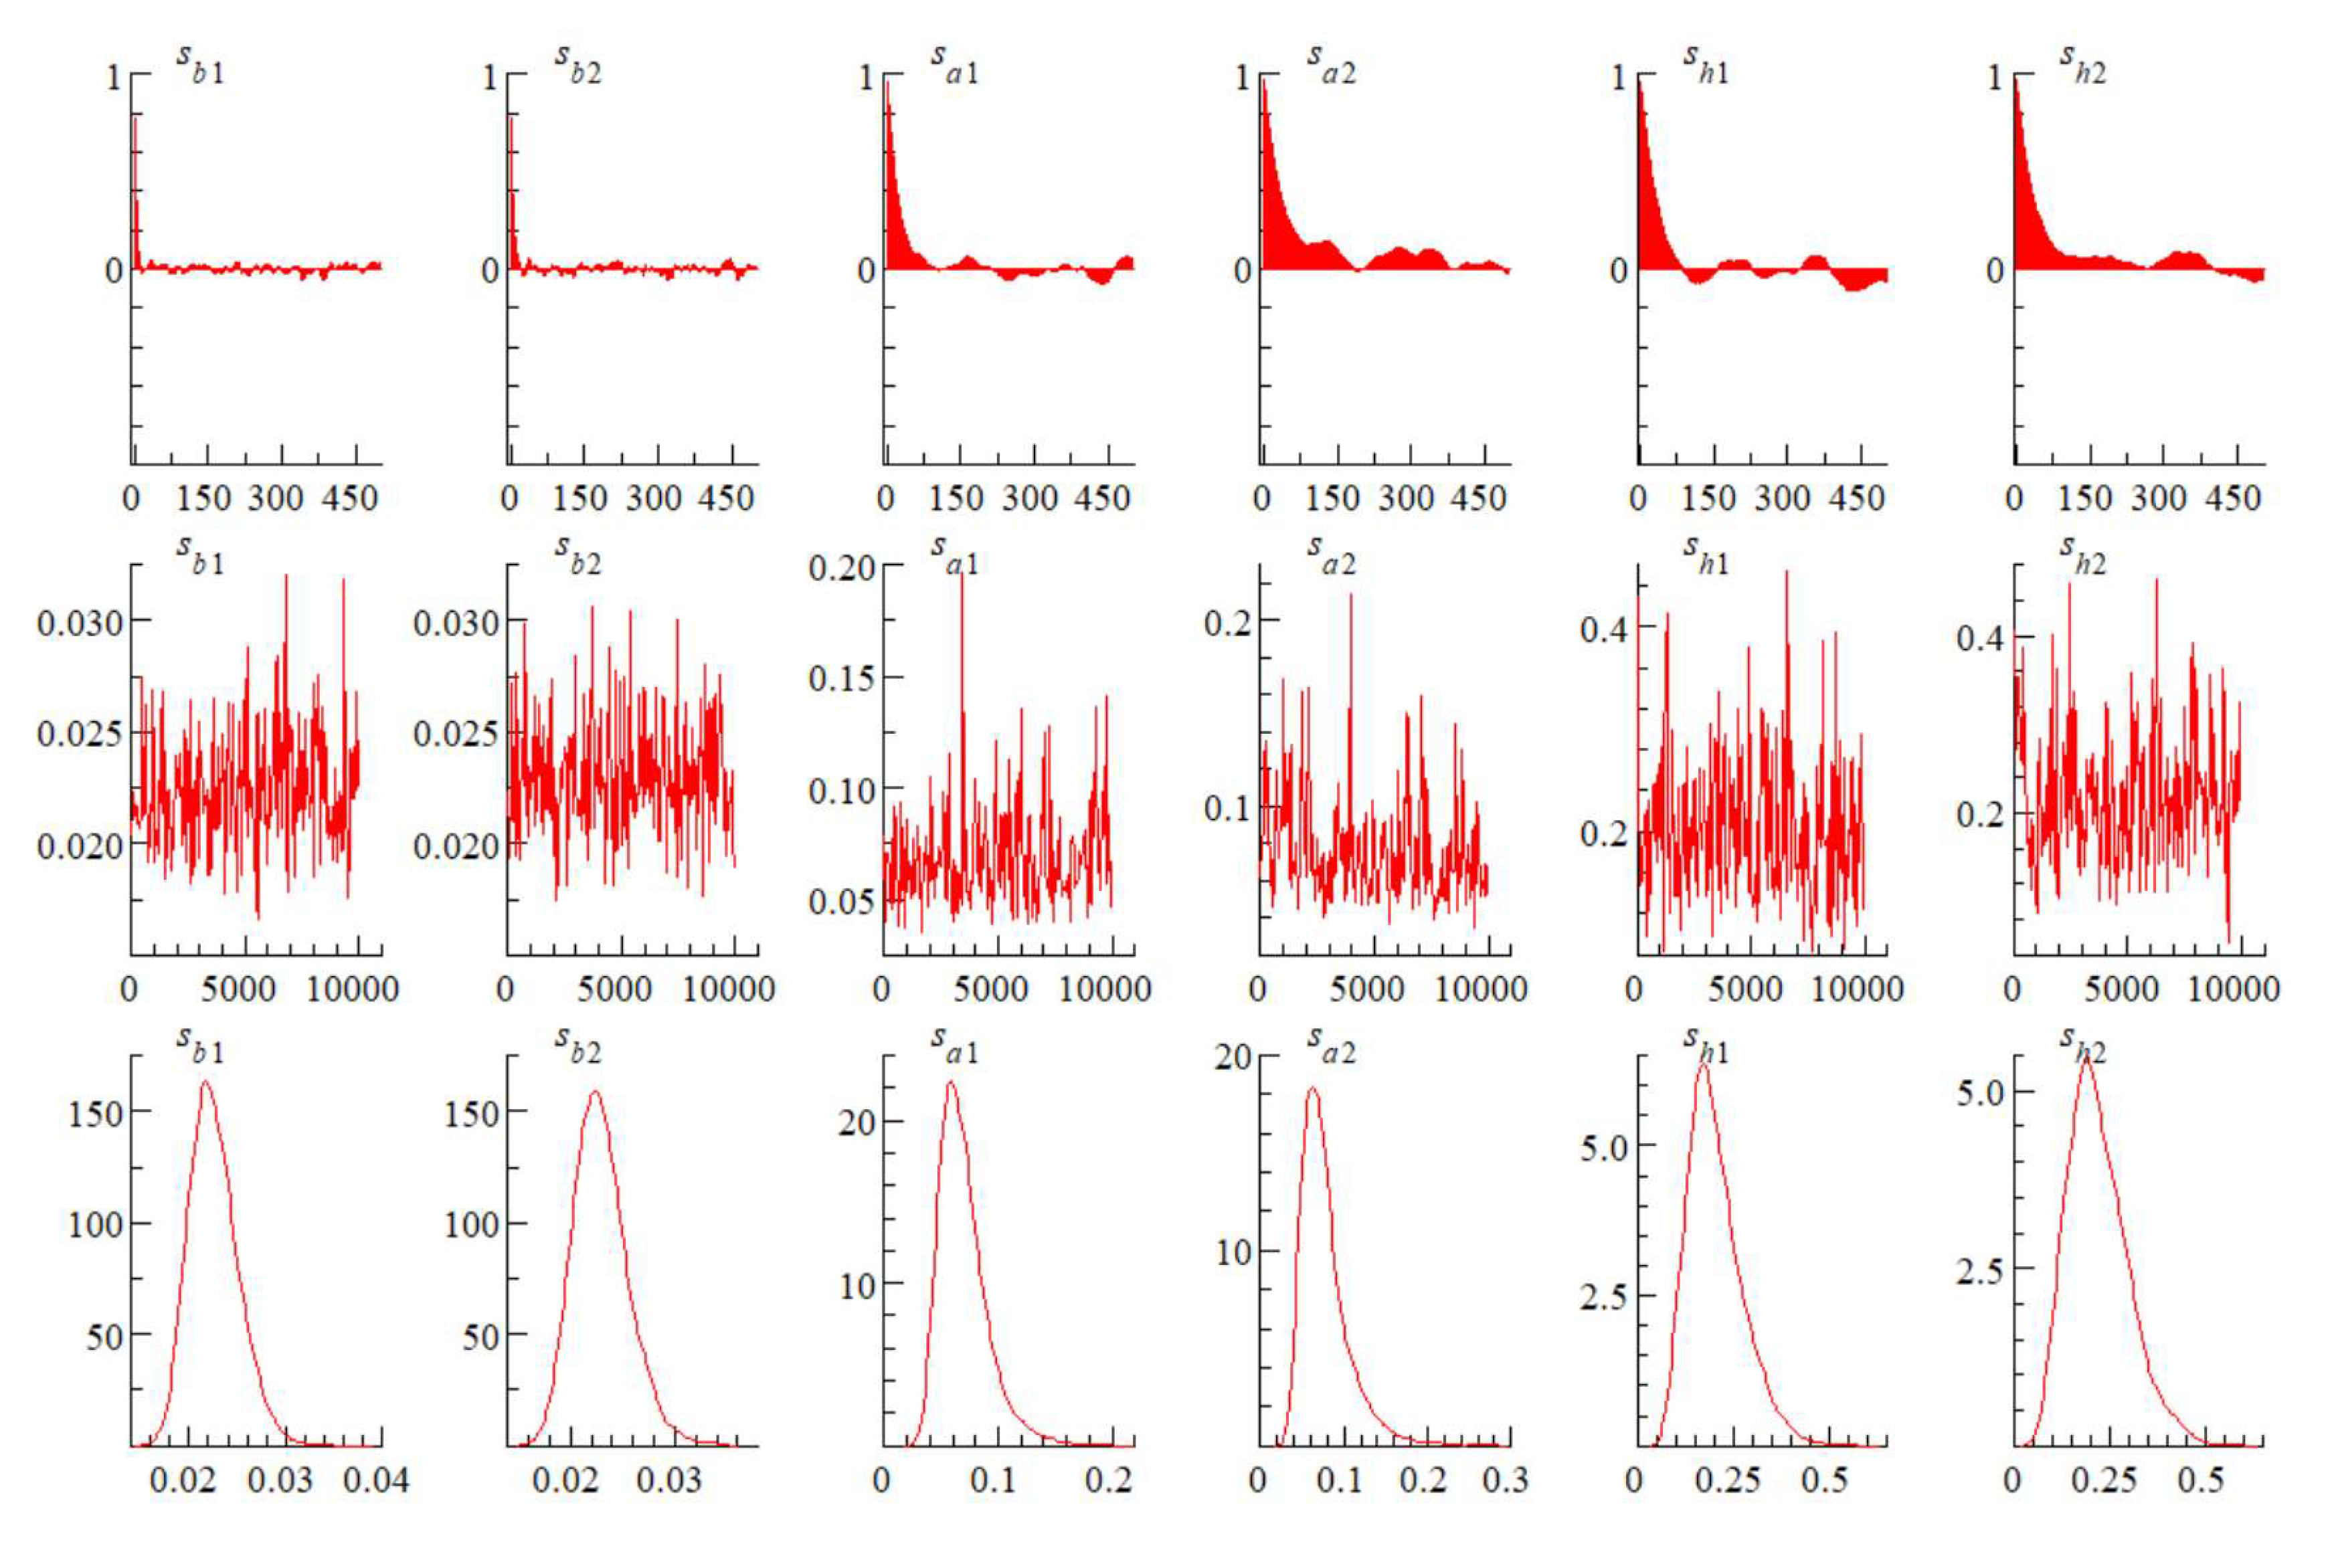
Figure A1 in the Appendix, the log-difference series of INU_F has passed the 1% significance test, confirming its status as a stationary time series. Additionally, the Markov Chain Monte Carlo (MCMC) test results indicate a Geweke's value of less than 1.96, with at least 153 valid samples from 10,000, underscoring the robustness of the TVP-SV-VAR model incorporating INU_F, Piglet, Hogp, and Porkp variables. Following, we present the results of the impulse responses analyzed at equal intervals and at specific time points:
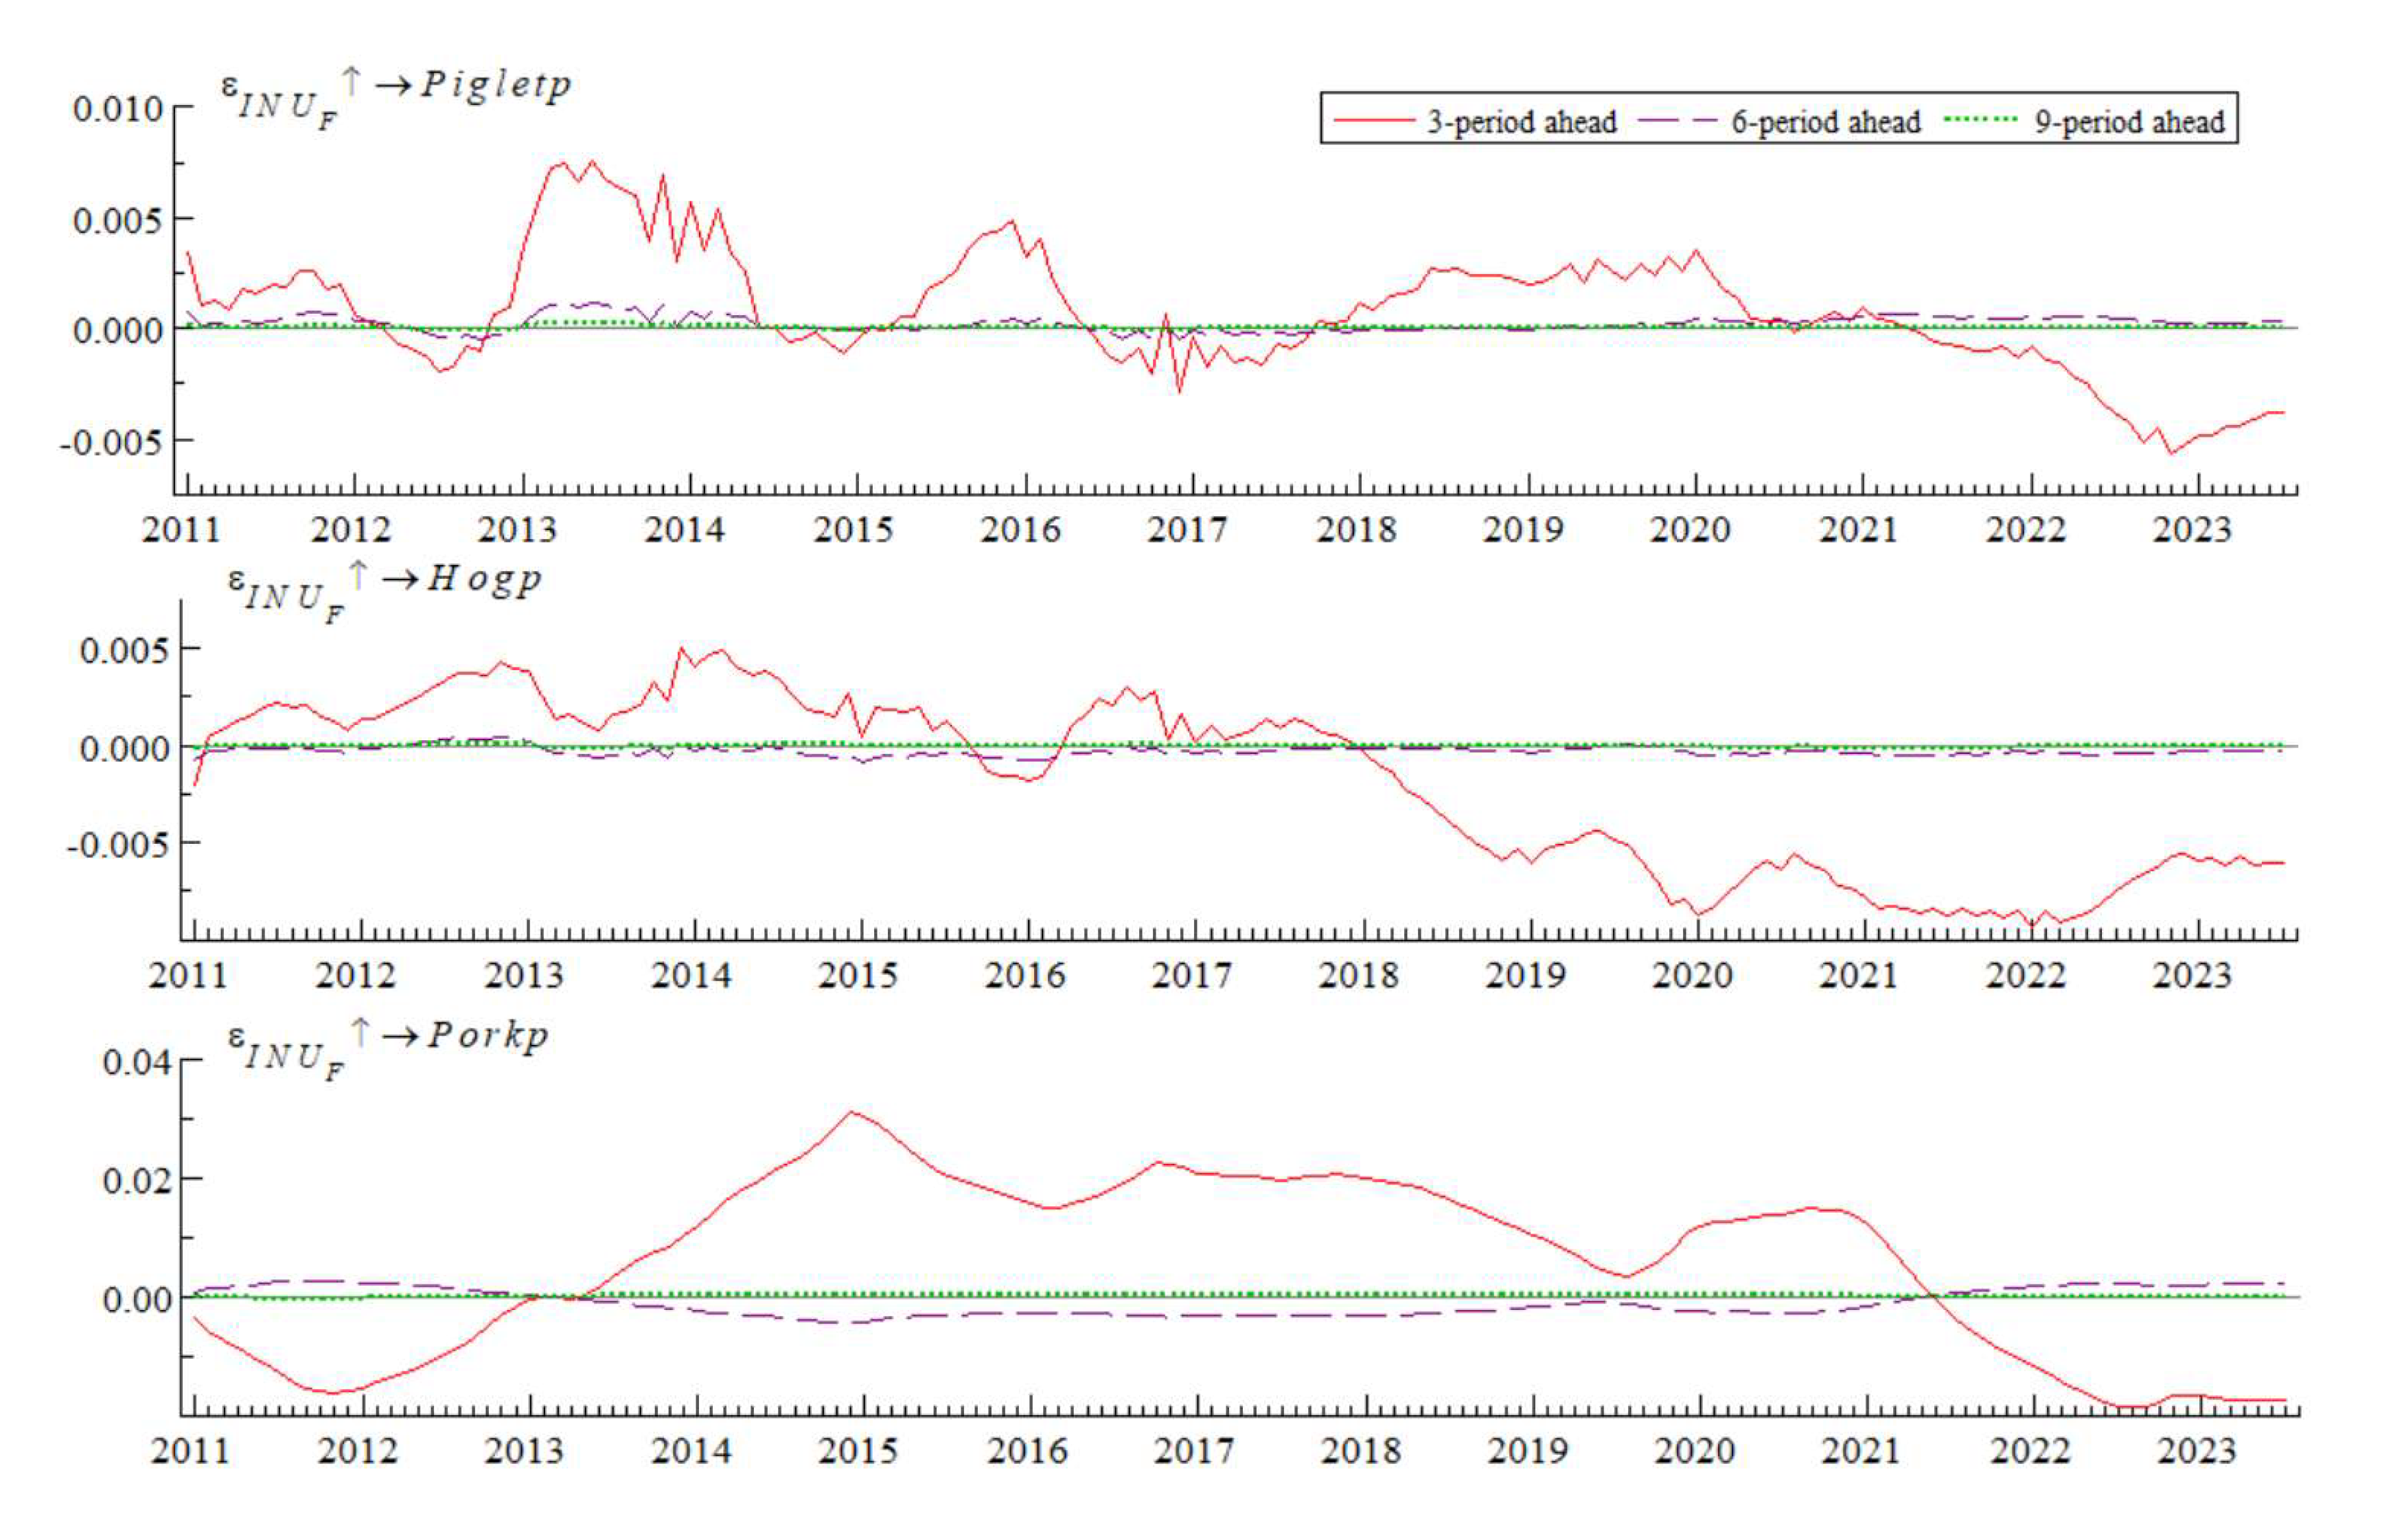
The equidistant impulse response results, depicted in
Figure 9, illustrate the reaction of the live pig industry chain's pricing to INU_F, with impulse response curves at lag periods of 6 and 9 approaching zero. This suggests that the impact of the newly constructed INU_F on the industry's pricing lacks long-term sustainability. Hence, while the impulse responses lagged by three periods demonstrated a high degree of consistency with the original impacts on the supply and demand sides of the live pig industry chain, notable differences are observed: (1) The impact of INU_F on piglet prices alternates between positive and negative, with intensity fluctuating within the range of [−0.005, 0.01]. (2) A significant divergence is noted in the effect of INU_F on pig prices around 2018; the impact is positive prior to 2018 and transitions to negative thereafter. (3) The influence of INU_F on pork prices predominantly remains positive from 2013 to 2021 but shifts to negative during other periods.
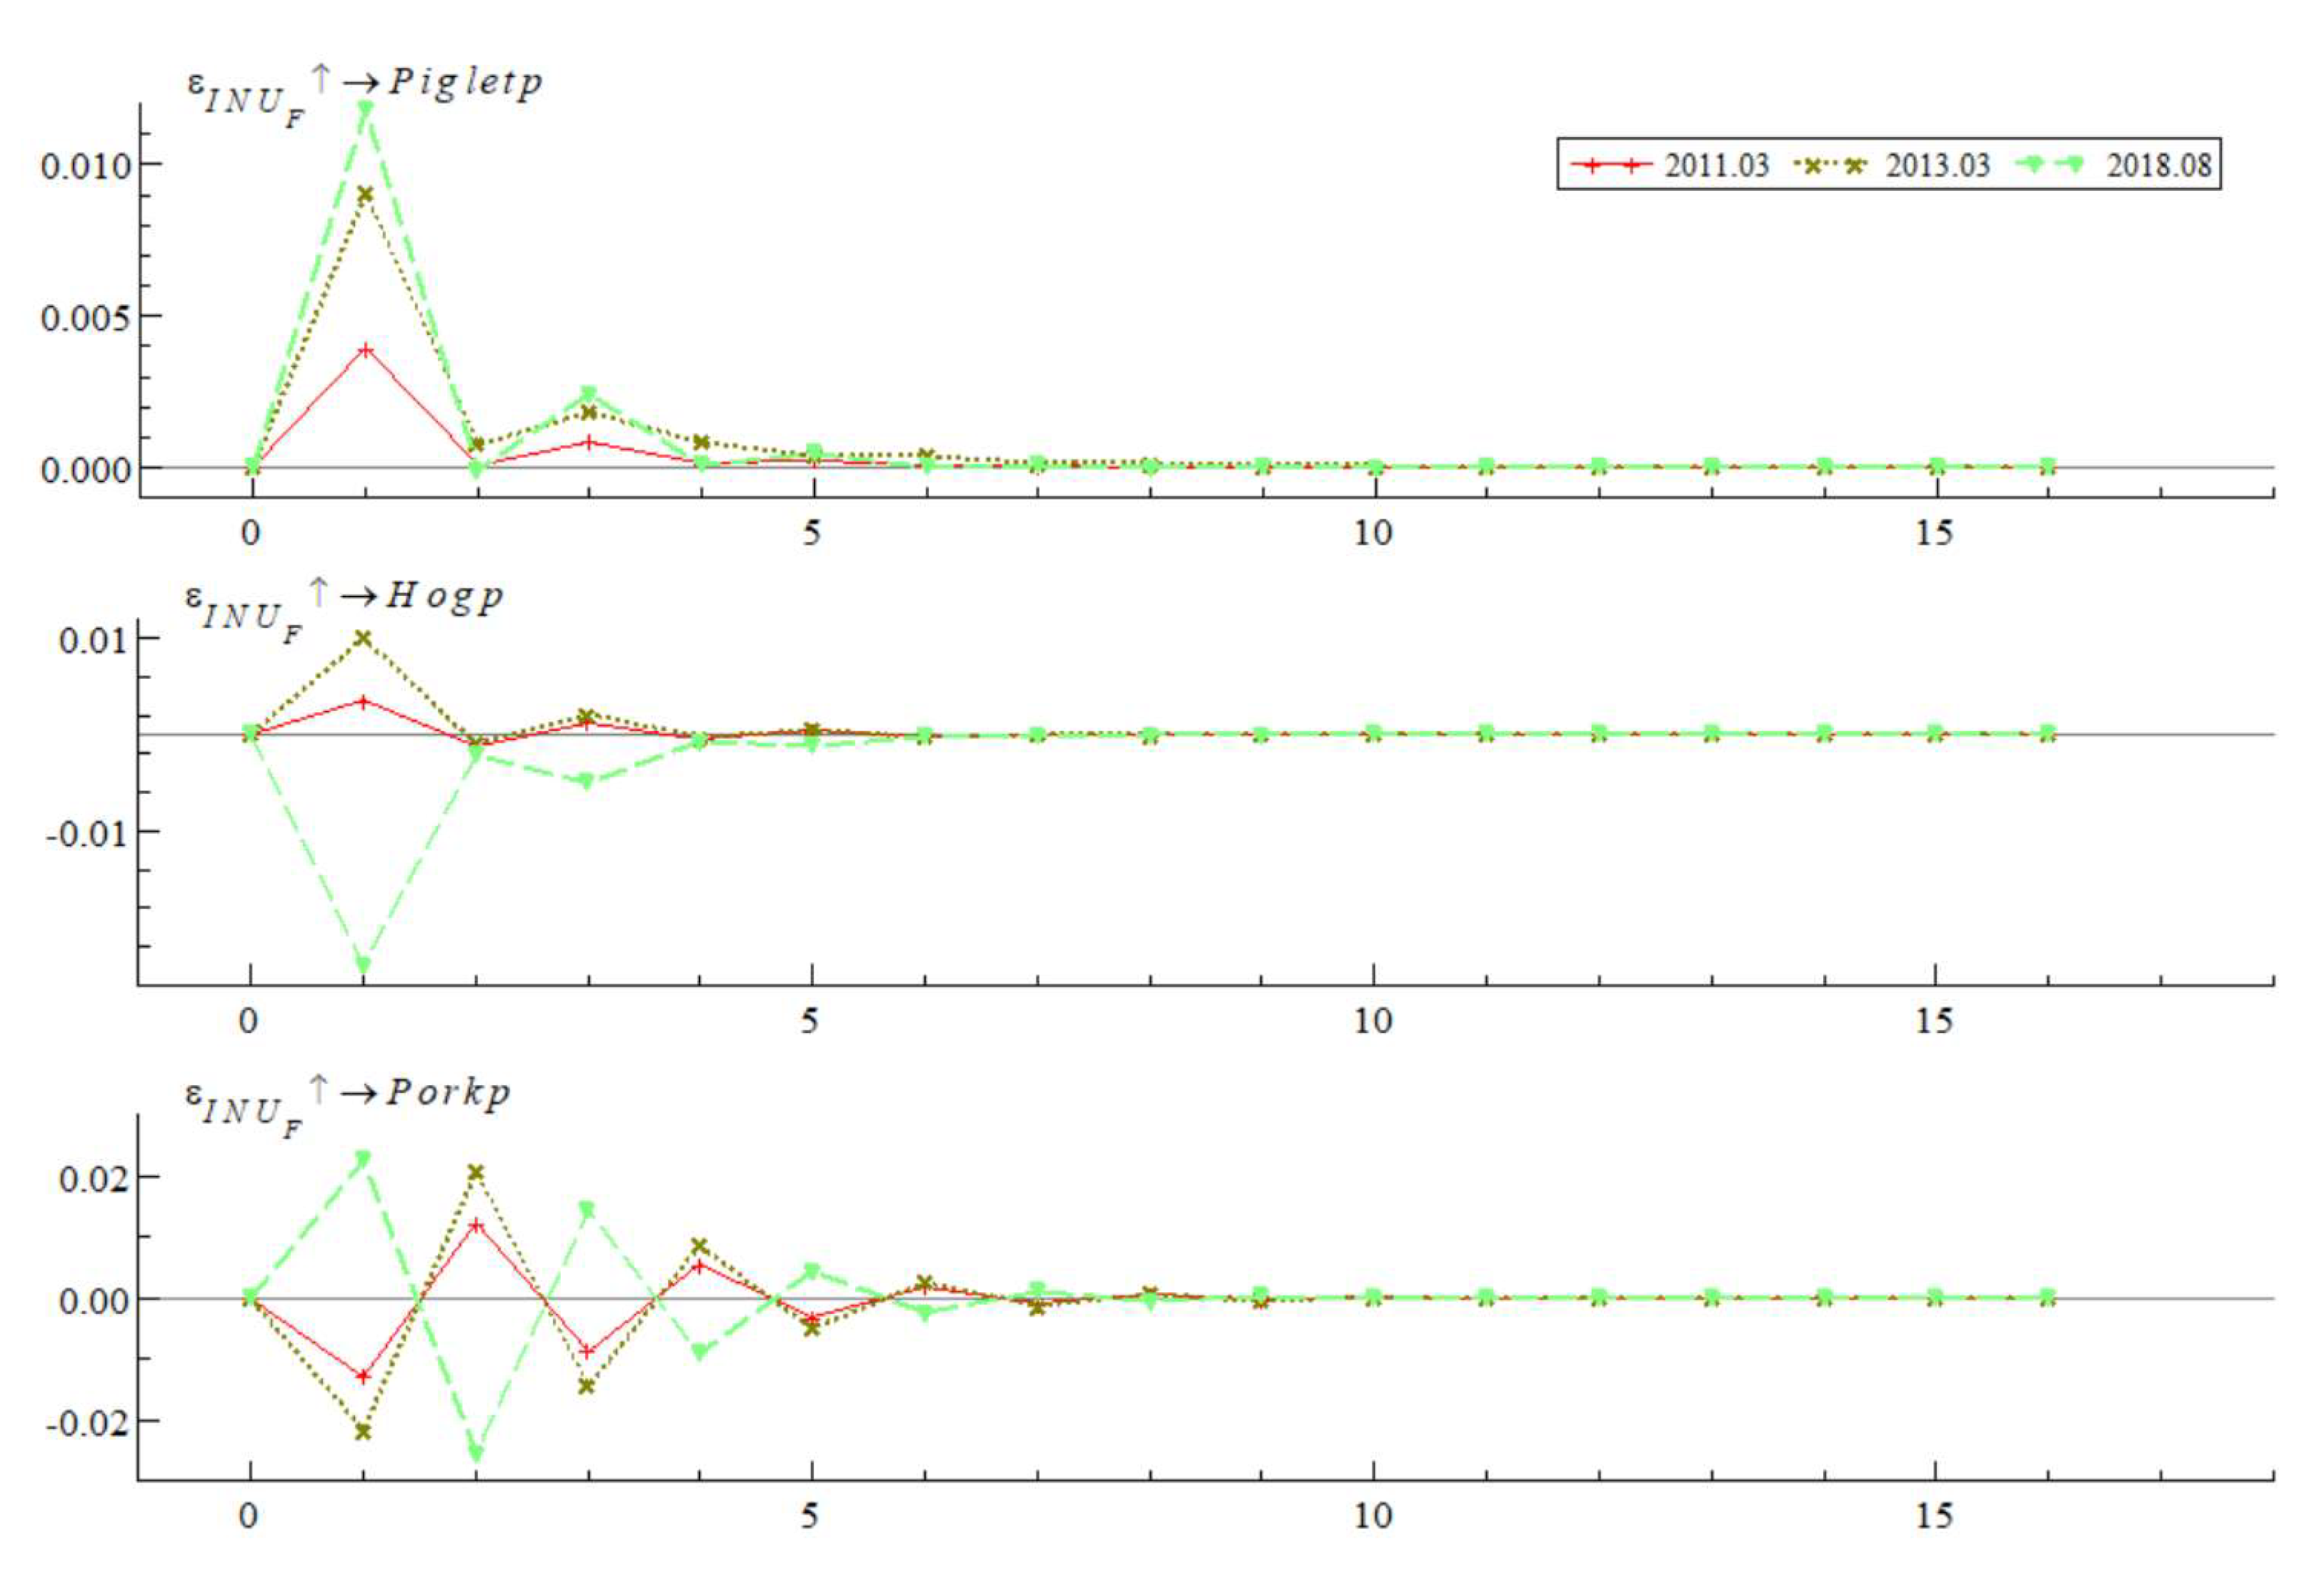
The impulse response results of the pig industry chain prices to INU_F at specific time points are illustrated in
Figure 10, focusing on March 2011, March 2013, and August 2018. The impulse responses reveal that INU_F exerts a positive influence on both piglet and live pig prices, while its impact on pork prices alternates between positive and negative. Notably, the impact results for live pig and pork prices in August 2018 exhibit opposite trends.
Employing the news uncertainty index of the pig industry compiled from Farmers' Daily, the TVP-SV-VAR model outputs for the pig industry chain prices show high consistency with those derived from the index compiled by People's Daily. This consistency underscores the robustness of the study's findings. Nonetheless, some nuanced differences in the impulse response results are observed, primarily attributable to variances in the reporting of pig-related events between People's Daily and Farmers' Daily, which serve as the sources for index compilation. Specifically, Farmers' Daily tends to include more detailed reports on pig production, management, and technology, resulting in slight discrepancies in the trends indicated by the indexes from the two newspapers. However, the trends reflected in the empirical results from both sources are relatively consistent. This outcome further demonstrated that indexes derived from more comprehensive information sources could consistently represent the impact on the industrial chain and offered more effective guidance.
5.2. Impact of Pig Epidemic on the Price of the Industrial Chain
Pig epidemic disease represents a significant component of the uncertainty surrounding the pig industry. Prior research has highlighted that outbreaks such as pig blight are crucial drivers of the cyclical fluctuations observed in pig prices. By concentrating on the impact of pig epidemic disease on the price dynamics within the industrial chain, this research not only narrows down the effects of uncertainty to specific critical points but also assesses the robustness of previous discussions concerning pig epidemic diseases.
For this purpose, we developed the Pig Disease Uncertainty Index (PDU) based on a compilation of statistical data covering deaths and culls from swine fever, porcine reproductive and respiratory syndrome, swine erysipelas, and other pig diseases. This data was collected by the Ministry of Agriculture and Rural Affairs of China over a period spanning 140 months, from January 2010 to August 2021. The method of compiling the uncertainty index of pig epidemic disease also referred to the content of
Section 3.
A Time-Varying Parameter - Stochastic Volatility - Vector Autoregression (TVP-SV-VAR) model was then constructed to examine the relationship between pig epidemics and price fluctuations within the industrial chain. According to the results depicted in
Table A1 and
Table A3 and
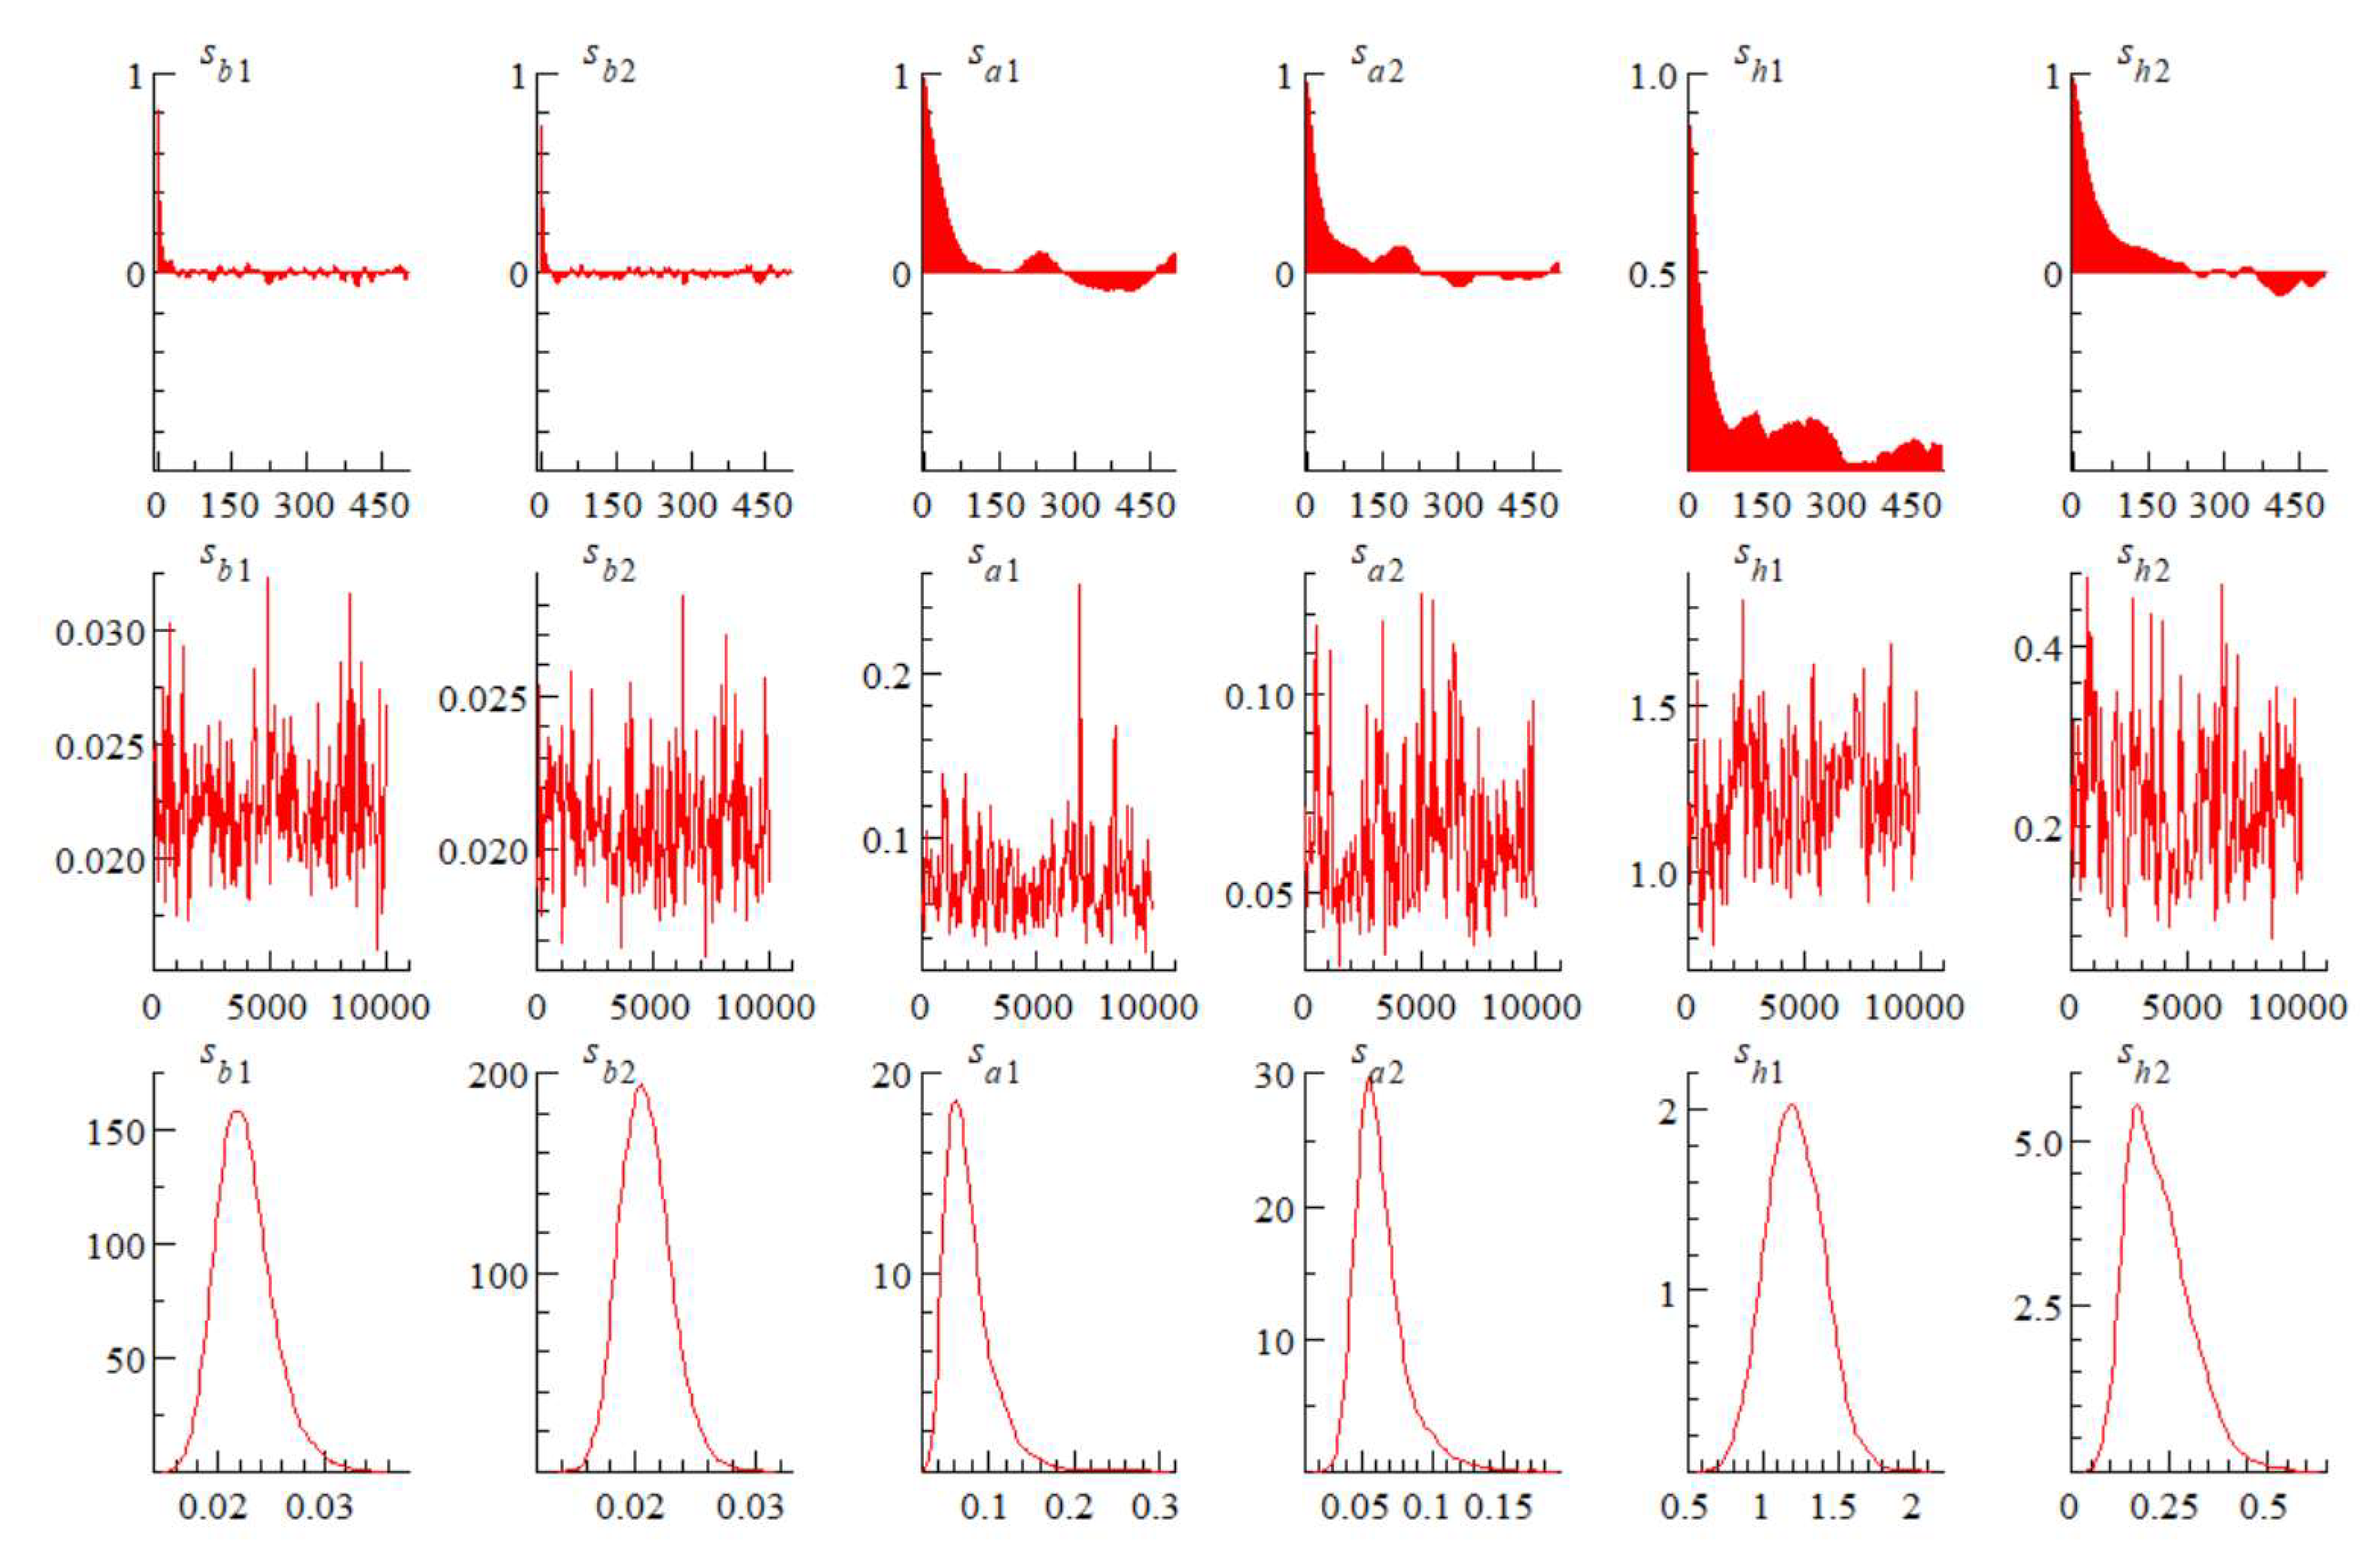
Figure A2 in the
Appendix A, the log-difference series of the newly constructed PDU is stationary and passes the 1% significance test. Moreover, the Markov Chain Monte Carlo (MCMC) test results reveal that Geweke's value is less than 1.96, indicating at least 137 valid samples out of 10,000. These findings affirm the robustness of the TVP-SV-VAR model incorporating PDU, Piglet, Hogp, and Porkp. Below, we detail the outcomes of impulse responses analyzed at equal intervals and specific time points:
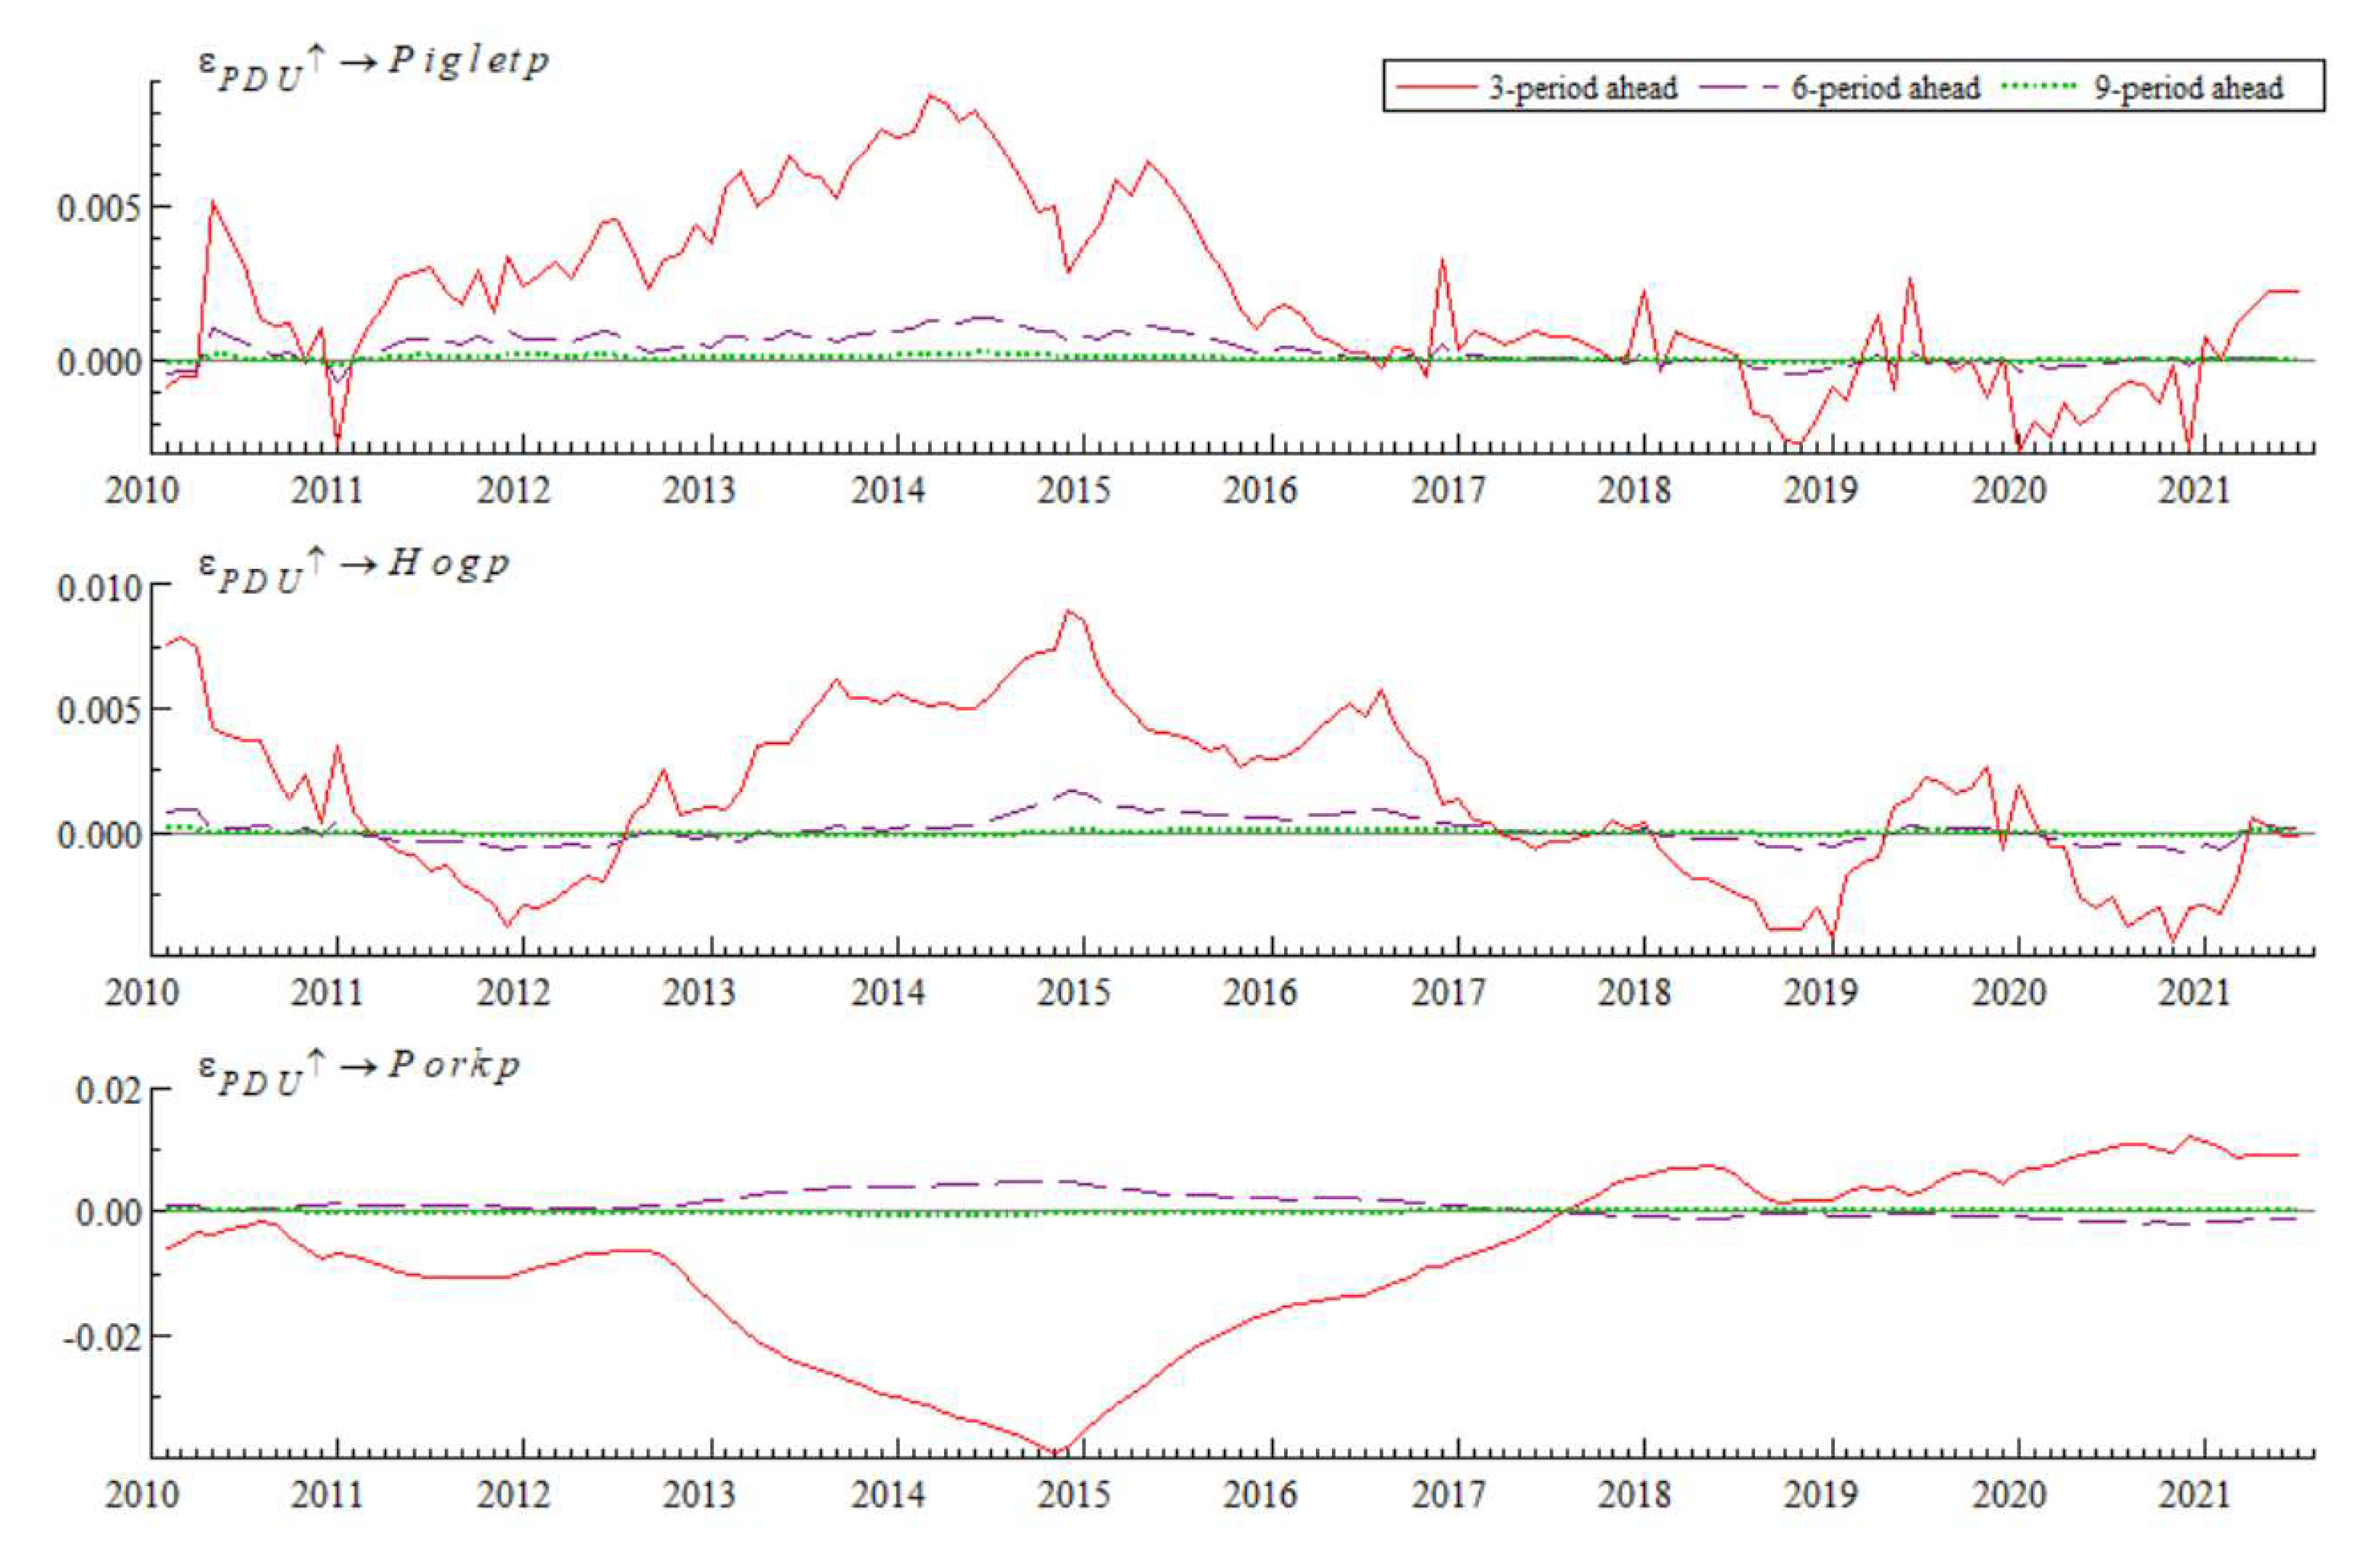
The equidistant impulse response results of the pig industry chain prices to the Pig Disease Uncertainty Index (PDU) are displayed in
Figure 11. Here, the impulse response curves with lag periods of 6 and 9 approach zero, suggesting that the impact of the newly constructed PDU on the industry's pricing lacks long-term sustainability. From the results obtained with an impulse response lagged by three periods, it is evident that the impact of PDU on both the supply and demand sides of the live pig industry chain differs in positive and negative directions. However, the overall trend of these impacts remains highly consistent. Specifically:
(1) The impact of PDU on the prices of piglets and live pigs at the supply end shows a high consistency in trend and direction, indicating that the effects of pig epidemic disease are universally felt across all production stages. This may be attributed to the substantial impact that outbreaks have on the entire production and breeding chain, compelling farmers to adjust their overall production plans rather than targeting specific segments.
(2) PDU exhibited a negative impact on pork prices on the demand side prior to 2018, with the most significant negative impact occurring in 2015. After 2018, the impact turned positive. This shift suggests that before 2018, outbreaks of pig disease tended to depress pork prices due to increasing concerns over pork food safety, which diminished consumer demand. Despite a short-term reduction in pig market supply, the drop in consumer demand was more pronounced, leading to lower prices. After 2018, however, the trend reversed, reflecting changes in market dynamics or consumer perceptions regarding food safety and supply stability.
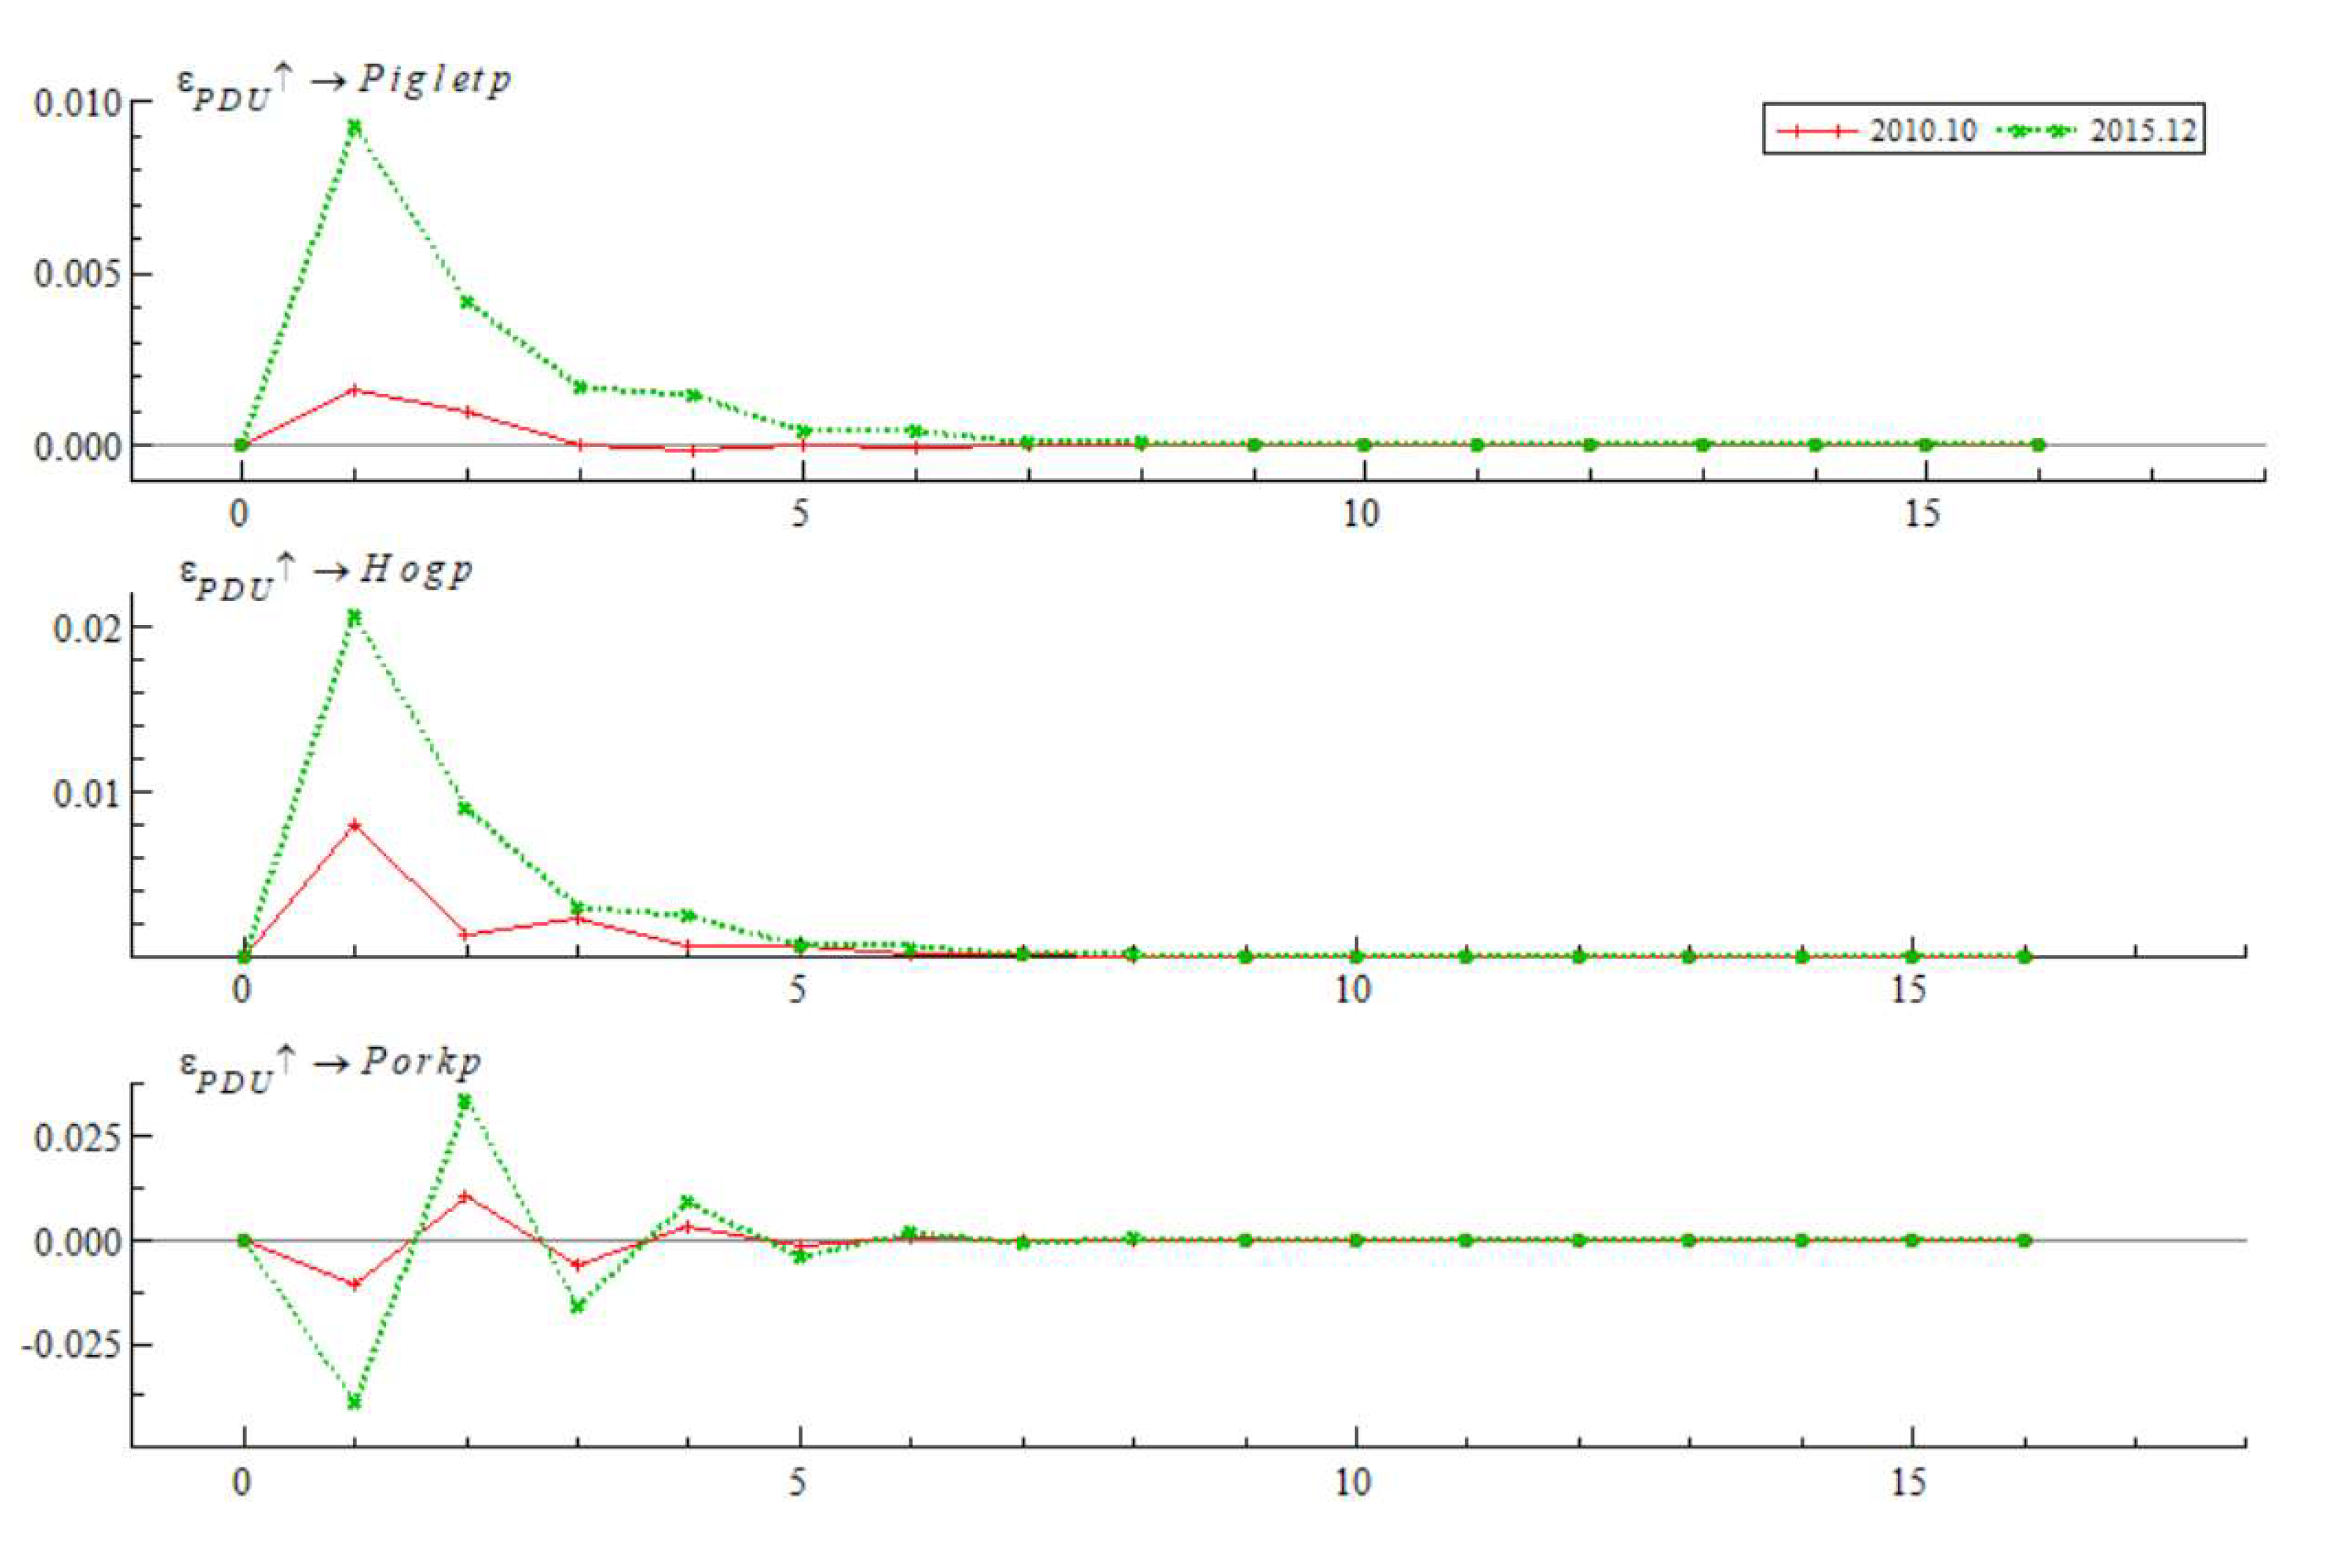
The impulse response results of the live pig industry chain prices to the Pig Disease Uncertainty Index (PDU) at specific time points are depicted in
Figure 12, focusing on October 2010 and December 2015. These periods were selected due to the severity of swine fever in 2010 and porcine reproductive and respiratory syndrome in 2015, both of which significantly influenced the industrial chain. While other time points also experienced serious pig epidemics, they were accompanied by other unobservable factors that could lead to biased empirical results. The findings are as follows:
(1) The pig epidemics in 2010 and 2015 demonstrated significant differences in the impacts on the prices at the supply side and demand side of the industrial chain, aligning with the results from the equally spaced impulse response analysis.
(2) The impact of the pig epidemic on the prices of piglets and pigs at the supply end is initially positive but trends towards zero as the lag period increases. This indicates that the epidemic led to a decrease in the number of piglets and pigs at the supply end, consequently driving up the prices due to reduced supply.
(3) The impact of the pig epidemic disease on the price of pork on the demand side initially shows a negative response, which then alternates but eventually trends to be positive. This pattern suggests that consumer concerns about food safety initially drove prices down. However, as the severity of the epidemic alleviated over time and the realities of market supply became apparent, the impact on prices turned positive and eventually stabilized.
The findings on the impact of the pig epidemic uncertainty index on the industrial chain's prices reveal that the constructed uncertainty index for this specific event, despite its relatively limited informational depth, can still reliably represent price fluctuations. This also validates the broad applicability of the uncertainty analysis framework for hogs that we have developed.
5.3. Potential Mechanism
In our analysis, we conceptualize the impact of uncertainty on price fluctuations within the industrial chain as being mediated by the dual forces of supply and demand. To quantitatively elucidate this mechanism, we introduce pig slaughter volume as a mechanistic variable. By examining how uncertainty influences pig slaughter volumes, we elucidate the operational dynamics of the "uncertainty - pig slaughter volume - industry chain price" mechanism.
The data for the number of pigs slaughtered, sourced from the Ministry of Agriculture and Rural Affairs, is transformed into a time series denoted as NPS, achieved by taking the natural logarithm and then differencing the data. Utilizing this transformed data, we construct a Time-Varying Parameter - Stochastic Volatility - Vector Autoregression (TVP-SV-VAR) model incorporating Economic Policy Uncertainty (EPU), Live Pig Industry News Uncertainty (INU), and NPS to investigate the impact of uncertainty on the quantity of pig slaughters.
The test results for the variables and the model are presented in
Table A1, A4, and
Figure A3 in the
Appendix A. The analyses confirm that the time series data are stationary and that the Markov Chain Monte Carlo (MCMC) results uphold the reliability of the findings. This robust approach allows for a detailed understanding of how fluctuations in uncertainty metrics affect critical operational variables within the pig industry, providing insights into broader economic dynamics.
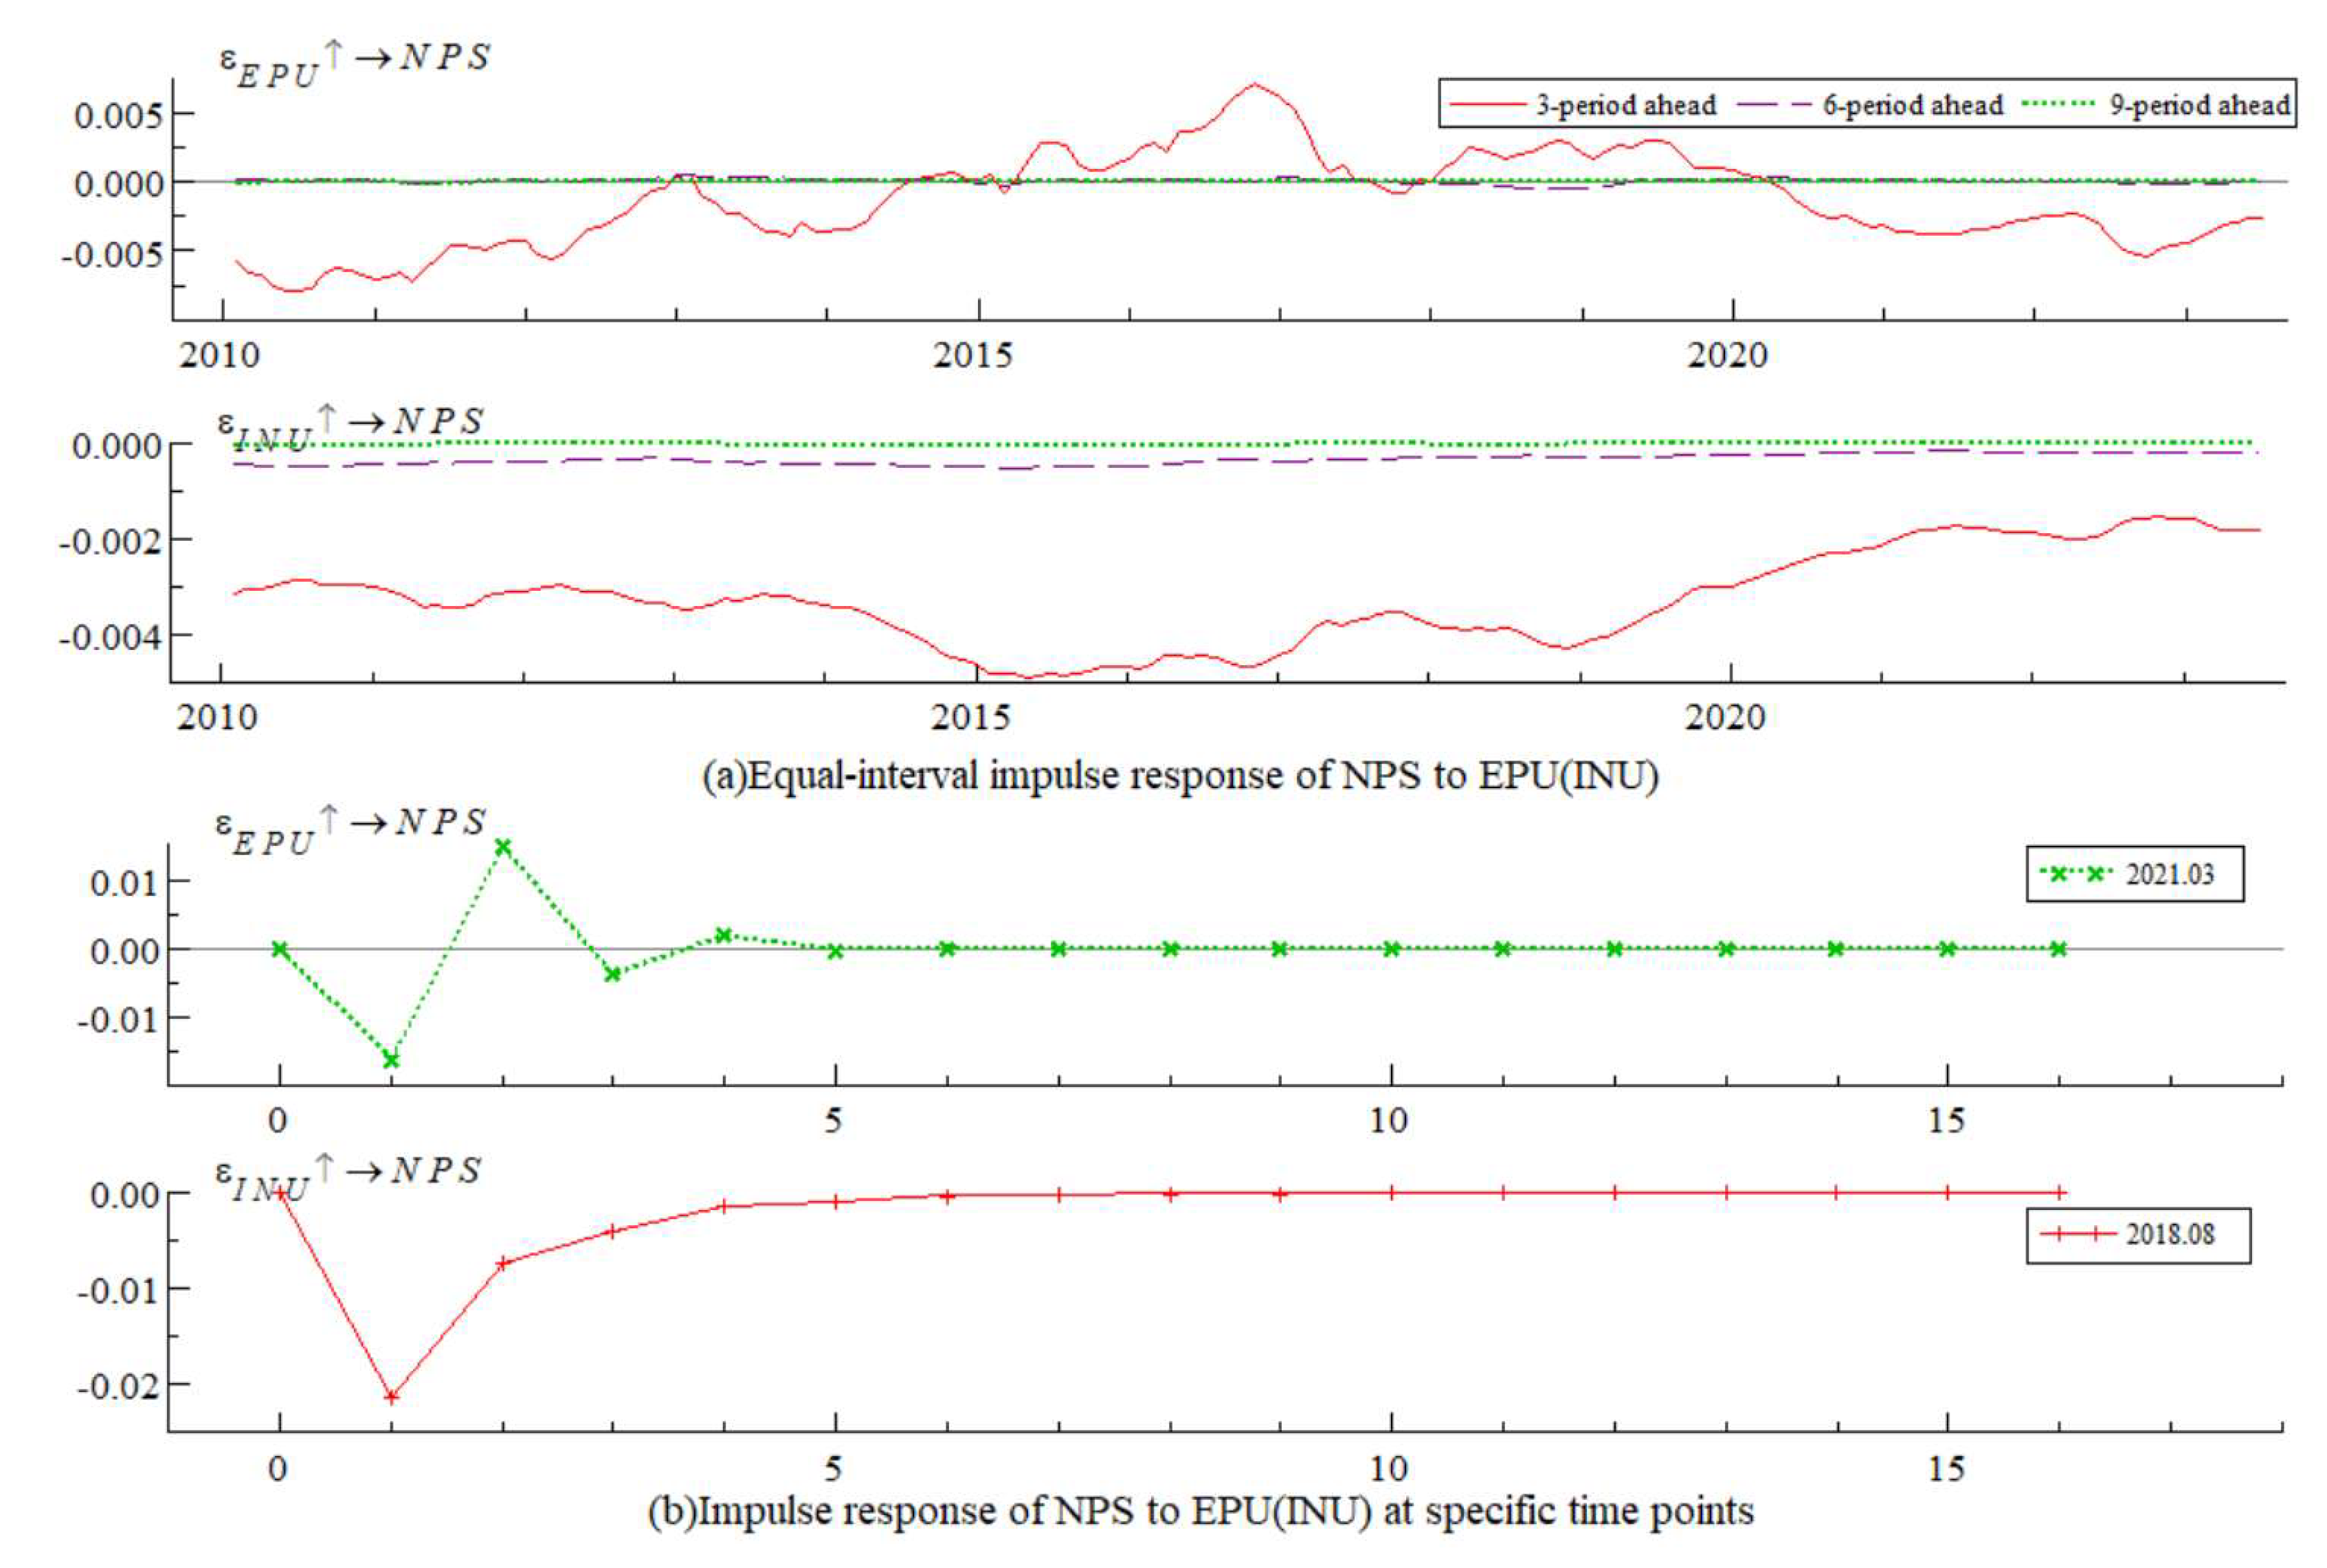
The impulse response results of pig slaughter quantity to uncertainty are depicted in
Figure 13, which includes (a) results for equidistant impulse responses and (b) results for impulse responses at specific time points. The findings are detailed as follows:
(1) Equal-interval Impulse Responses: The response curves at lag 6 and lag 9 periods approach zero, suggesting that uncertainty does not exert a long-term sustainable impact on the quantity of pigs slaughtered. This indicates that the immediate effects of uncertainty are more pronounced than their prolonged influences.
(2) Differential Impacts of EPU and INU: The effects of Economic Policy Uncertainty (EPU) and Live Pig Industry News Uncertainty (INU) on the slaughter quantity are markedly distinct. EPU had a positive impact on the number of pigs slaughtered from 2010 to 2015 and again after 2020, but a negative impact from 2015 to 2020. Conversely, INU consistently had a negative impact on the number of pigs slaughtered throughout the period under review. Theoretically, the influence of uncertainty on slaughter volumes is expected to inversely correlate with its impact on the demand-side price of pork.
(3) Specific Time Points Analysis: August 2018 and March 2021 were selected as specific time points to assess the impact of uncertainty on pig slaughter quantities, coinciding with the African swine fever epidemic (related to INU) and the COVID-19 pandemic (related to EPU), respectively. The findings reveal that the impact of EPU on pig slaughter quantities was initially negative and then turned positive, which contrasts with the impact of EPU on pork prices. On the other hand, the impact of INU on pig slaughter quantity remained negative, suggesting a corresponding rise in pork prices during this period, aligning with the empirical results observed for INU's impact on pork prices.
The empirical findings regarding pig slaughter volume and uncertainty demonstrate that the potential mechanism variable of pig slaughter volume effectively sustains the relationship between uncertainty and industry chain price. Concurrently, this evidence further corroborates the theory presented in
Section 2.
6. Conclusions and Recommendations
6.1. Conclusions
This paper employs the TVP-SV-VAR model to examine the dynamic effects of economic policy uncertainty and industrial news uncertainty on the price of the live pig industry chain. The analysis is based on data from January 2010 to August 2023, incorporating the economic policy uncertainty index, industrial news uncertainty index, and price data of the live pig industry chain. The main findings are summarized as follows:
(1) The impact of economic policy uncertainty on the price of the supply side and the demand side of the live pig industry chain exhibits obvious time-varying characteristics, with the impact curve alternately positive and negative across the overall range. The shock to pork prices has been more stable than that of piglets and pigs, indicating that the supply side of pigs is more susceptible to economic policy changes. Economic policy uncertainty has exacerbated the volatility of pig prices and increased the risks faced by farmers.
(2) The impact of industrial news uncertainty varies significantly between the supply and the demand sides of the pig industry chain. The price of piglets and pigs are primarily negatively affected, while on the demand side, pork prices are positively impacted. Negative industrial news lowers producers' market expectations, prompting them to reduce production capacity. Meanwhile, the short-term inelasticity of market demand makes it difficult to replace pork consumption, leading to higher pork prices.
(3) The impulse response at a specific time point reveals distinct impacts of economic policy uncertainty and industrial news uncertainty on prices across the supply and demand sides of the pig industry chain. On the supply side, economic policy uncertainty negatively affects prices due to its differing intervention capacity in regulating market supply, while industrial news uncertainty has the opposite effect. On the demand side, both uncertainties initially lead to a positive impact on prices, followed by a negative effect. This pattern reflects the relatively stable demand for pork among Chinese consumers over a considerable period. Therefore, to better guide production practices within the pig industry, it is essential to develop and measure an uncertainty index specific to industry-related news.
(4) The uncertainty index derived from various information sources reliably captures the effects on the price of the industrial chain, with pig slaughter volume serving as a key mechanistic link. Whether it is the news uncertainty index of the live pig industry chain compiled from the Farmers' Daily, which utilizes more comprehensive information sources, or the uncertainty index focused on specific events like the live pig epidemic, both indices effectively elucidate the impact on the prices within the live pig industry chain. Additionally, pig slaughter volume acts as a potential mechanism between uncertainty and price, where the shocks from uncertainty influence the industry chain price through changes in pig slaughter volumes. This relationship is corroborated by both the theoretical framework and empirical analysis results previously discussed.
6.2. Recommendations
(1) Enhancing information sources and establishing a robust risk monitoring and early warning system for the live pig market are essential to enhance the industry chain's resilience against external threats. Relevant agencies must intensify their monitoring and early warning efforts for risks such as pig diseases and food safety issues. Utilizing big data, cloud computing, and other technologies enables the real-time collection and monitoring of early warning indicators, facilitating ongoing assessments of potential risks and the extent of damage within the pig market. Furthermore, it is critical to evaluate and refine emergency response plans, mitigate the effects of unpredictable risks through coordinated policy actions, and provide clear guidance to the public through effective communication strategies. (2) Relevant departments must be precise, moderate, and consistent in policy adjustments for the live pig market, focusing on the fundamental goal of ensuring stable supply and guaranteed prices, in order to reduce the impact of external shocks on the industrial chain. Policies regulating the pig market should be released gradually, with control efforts ensuring moderation and emphasizing sustainability. This approach can prevent policies from exerting excessive force or being mismatched, thereby reducing market price volatility. Policy regulation should also consider market players' sentiments, prioritize counter-cyclical regulation, and gradually establish a normal regulatory mechanism for the pig market.
(3) Strengthen the dynamic monitoring of public sentiment within the live pig industry chain, supported by robust and consistent industrial policies to mitigate the impact of uncertainty on market consumption. Agricultural, health, and market regulation authorities should establish rapid-response mechanisms for public opinion to prevent and address the adverse effects of negative news on market consumption. During periods of weak market demand, measures such as price support and subsidies for industry practitioners or consumers should be implemented to restore consumer confidence and stimulate demand growth.
Author Contributions
Data curation, Jing Zhang; Investigation, Yinqiu Li; Methodology, Dapeng Zhou; Resources, Jinhua Cheng; Supervision, HongHua Huan; Writing – original draft, Dapeng Zhou; Writing – review & editing, Jing Zhang; review & editing,Nanyan Hu
Funding
This paper was supported by the Chinese National Pig Industry Technology System (CARS-PIG-35) and the Basic Scientific Research Business Special Fund of Jiangsu Academy of Agricultural Sciences, China [ZX(23)3032].
Data Availability Statement
The raw data supporting the conclusions of this article will be made available by the authors on request.
Conflicts of Interest
The authors declare no conflict of interest.
Appendix A
Table A1.
Results of unit root test.
Table A1.
Results of unit root test.
| Variable |
ADF |
PP |
KPSS |
Verdict |
| INU_F |
-11.4401(2)*** |
-24.9629(3)*** |
0.051379(6) |
stationary |
| NPS |
-3.0286(11)*** |
-24.9331(23)*** |
0.1488(26) |
stationary |
| PDU |
-16.8981(0)*** |
-17.6459(5)*** |
0.0514(14) |
stationary |
Figure A1.
Sample autocorrelation, path, and posterior density estimated by MCMC. Notes: The six columns from left to right reveal the sample auto-correlation, path and posterior density of
Figure A1.
Sample autocorrelation, path, and posterior density estimated by MCMC. Notes: The six columns from left to right reveal the sample auto-correlation, path and posterior density of
Table A2.
Parameter estimation results in the TVP-SV-VAR model.
Table A2.
Parameter estimation results in the TVP-SV-VAR model.
| Parameter |
Mean |
Std.Dev. |
95%L |
95%U |
Geweke |
Inefficiency |
|
0.0226 |
0.0025 |
0.0182 |
0.0282 |
0.370 |
8.37 |
|
0.0229 |
0.0026 |
0.0184 |
0.0288 |
0.663 |
7.05 |
|
0.0641 |
0.0186 |
0.0373 |
0.1110 |
0.541 |
32.88 |
|
0.0718 |
0.0231 |
0.0402 |
0.1278 |
0.078 |
37.85 |
|
0.2123 |
0.0728 |
0.1054 |
0.3946 |
0.024 |
59.92 |
|
0.2670 |
0.0902 |
0.1212 |
0.4741 |
0.054 |
65.14 |
Figure A2.
Sample autocorrelation, path, and posterior density estimated by MCMC. Notes: The six columns from left to right reveal the sample auto-correlation, path and posterior density of
Figure A2.
Sample autocorrelation, path, and posterior density estimated by MCMC. Notes: The six columns from left to right reveal the sample auto-correlation, path and posterior density of
Table A3.
Parameter estimation results in the TVP-SV-VAR model.
Table A3.
Parameter estimation results in the TVP-SV-VAR model.
| Parameter |
Mean |
Std.Dev. |
95%L |
95%U |
Geweke |
Inefficiency |
|
0.0226 |
0.0025 |
0.0184 |
0.0281 |
0.343 |
8.97 |
|
0.0229 |
0.0026 |
0.0185 |
0.0287 |
0.568 |
8.58 |
|
0.0695 |
0.0212 |
0.0399 |
0.1230 |
0.045 |
44.39 |
|
0.0770 |
0.0291 |
0.0408 |
0.1510 |
0.018 |
83.15 |
|
0.2033 |
0.0709 |
0.0947 |
0.3697 |
0.962 |
52.71 |
|
0.2198 |
0.0783 |
0.0939 |
0.4012 |
0.766 |
72.66 |
Figure A3.
Sample autocorrelation, path, and posterior density estimated by MCMC. Notes: The six columns from left to right reveal the sample auto-correlation, path and posterior density of
Figure A3.
Sample autocorrelation, path, and posterior density estimated by MCMC. Notes: The six columns from left to right reveal the sample auto-correlation, path and posterior density of
Table A4.
Parameter estimation results in the TVP-SV-VAR model.
Table A4.
Parameter estimation results in the TVP-SV-VAR model.
| Parameter |
Mean |
Std.Dev. |
95%L |
95%U |
Geweke |
Inefficiency |
|
0.0225 |
0.0026 |
0.0181 |
0.0285 |
0.254 |
9.96 |
|
0.0209 |
0.0021 |
0.0173 |
0.0253 |
0.554 |
4.23 |
|
0.0762 |
0.0294 |
0.0409 |
0.1496 |
0.548 |
70.97 |
|
0.0634 |
0.0178 |
0.0390 |
0.1097 |
0.826 |
65.63 |
|
1.2152 |
0.1901 |
0.8614 |
1.5978 |
0.001 |
71.79 |
|
0.2237 |
0.0793 |
0.1066 |
0.4033 |
0.134 |
88.84 |
References
- Acosta, A., Lloyd, T., McCorriston, S., Lan, H., 2023. The ripple effect of animal disease outbreaks on food systems: The case of African Swine Fever on the Chinese pork market. Preventive Veterinary Medicine 215, 105912. [CrossRef]
- Assefa, T.T., Meuwissen, M.P.M., Gardebroek, C., Oude Lansink, A.G.J.M., 2017. Price and Volatility Transmission and Market Power in the German Fresh Pork Supply Chain. Journal of Agricultural Economics 68, 861–880. [CrossRef]
- Babović, J., Carić, M., Djordjević, D., Lazić, S., 2011. Factors influencing the economics of the pork meat production. Agricultural economics 57, 203. [CrossRef]
- Baker, S.R., Bloom, N., Davis, S.J., 2016. Measuring economic policy uncertainty. The quarterly journal of economics 131, 1593–1636. [CrossRef]
- Bakucs, L.Z., Fertõ, I., 2005. Marketing margins and price transmission on the Hungarian pork meat market. Agribusiness 21, 273–286. [CrossRef]
- Balcilar, M., Sertoglu, K., Agan, B., 2022. The COVID-19 effects on agricultural commodity markets. Agrekon 61, 239–265. [CrossRef]
- Barkan, O. 7. Barkan, O., Benchimol, J., Caspi, I., Cohen, E., Hammer, A., Koenigstein, N., 2023. Forecasting CPI inflation components with hierarchical recurrent neural networks. International Journal of Forecasting 39, 1145–1162. [CrossRef]
- Beach, R.H., Kuchler, F., Leibtag, E.S., Zhen, C., 2008. The effects of avian influenza news on consumer purchasing behavior: a case study of Italian consumers' retail purchases. [CrossRef]
- Ben-Kaabia, M., Gil, J.M., 2007. Asymmetric price transmission in the Spanish lamb sector. European Review of Agricultural Economics 34, 53–80. [CrossRef]
- Benner, S., 1895. Benner's prophecies of future ups and downs in prices.
- Cai, J., Hong, Y., Zhou, M., Hu, R., Ding, F., 2023. Farmer field school participation and exit decisions in hog production: A case study from Beijing. Agribusiness 39, 549–563. [CrossRef]
- Calvia, M., 2024. Beef, lamb, pork and poultry meat commodity prices: Historical fluctuations and synchronisation with a focus on recent global crises. ZEMEDELSKA EKONOMIKA 70, 24–33. [CrossRef]
- Chen, Y., Yu, X., 2018. Does the centralized slaughtering policy create market power for pork industry in China? China Economic Review 50, 59–71. [CrossRef]
- Cicia, G., Caracciolo, F., Cembalo, L., Del Giudice, T., Grunert, K.G., Krystallis, A., Lombardi, P., Zhou, Y., 2016. Food safety concerns in urban China: Consumer preferences for pig process attributes. Food Control 60, 166–173. [CrossRef]
- Dai, J., Li, X., Wang, X., 2017. Food scares and asymmetric price transmission: the case of the pork market in China. Studies in Agricultural Economics 119, 98–106. [CrossRef]
- Dawson, P.J., 2009. The UK pig cycle: a spectral analysis. British Food Journal 111, 1237–1247. [CrossRef]
- De, Z., Koemle, D., 2015. Price transmission in hog and feed markets of China. Journal of Integrative Agriculture 14, 1122–1129. [CrossRef]
- Delgado, M., Ma, M., Wang, H.H., 2021. Risk, Arbitrage, and Spatial Price Relationships: Insights from China's Hog Market under the African Swine Fever. [CrossRef]
- Dickey, D.A., Fuller, W.A., 1981. Likelihood ratio statistics for autoregressive time series with a unit root. Econometrica: journal of the Econometric Society 1057–1072. [CrossRef]
- Fliessbach, A., Ihle, R., 2020. Cycles in cattle and hog prices in South America. Australian Journal of Agricultural and Resource Economics 64, 1167–1183. [CrossRef]
- Gao, C., You, D., & Chen, J. (2019). Dynamic response pattern of gold prices to economic policy uncertainty. Transactions of Nonferrous Metals Society of China, 29(12), 2667–2676. [CrossRef]
- Geweke, J., 1992. [Statistics, probability and chaos]: Comment: Inference and prediction in the presence of uncertainty and determinism. Statistical Science 7, 94–101. [CrossRef]
- Gopinath, M. (2021). Does trade policy uncertainty affect agriculture? Applied Economic Perspectives and Policy, 43(2), 604–618. [CrossRef]
- Griffith, G.R., 1977. A note on the pig cycle in Australia. Australian Journal of Agricultural Economics 21, 130–139. [CrossRef]
- Hamulczuk, M., Stańko, S., 2014. Factors affecting changes in prices and farmers' incomes on the Polish pig market. Problems of Agricultural Economics/Zagadnienia Ekonomiki Rolnej 135–157. [CrossRef]
- Huang, Y., Li, J., Zhang, J., Jin, Z., 2021. Dynamical analysis of the spread of African swine fever with the live pig price in China. Math. Biosci. Eng 18, 8123–8148. [CrossRef]
- Ijaz, M., Yar, M.K., Badar, I.H., Ali, S., Islam, M.S., Jaspal, M.H., Hayat, Z., Sardar, A., Ullah, S., Guevara-Ruiz, D., 2021. Meat production and supply chain under COVID-19 scenario: Current trends and future prospects. Frontiers in Veterinary Science 8, 660736. [CrossRef]
- Isengildina, O., Irwin, S.H., Good, D.L., 2006. The value of USDA situation and outlook information in hog and cattle markets. Journal of Agricultural and Resource Economics 262–282. [CrossRef]
- Isengildina-Massa, O., Cao, X., Karali, B., Irwin, S.H., Adjemian, M., Johansson, R.C., 2021. When does USDA information have the most impact on crop and livestock markets? Journal of Commodity Markets 22, 100137. [CrossRef]
- Jia, Y., Sun, W., Su, G., Hua, J., He, Z., 2022. The Threshold Effect of Swine Epidemics on the Pig Supply in China. Animals 12, 2595. [CrossRef]
- Jiang, Q., Cheng, S., Cao, Y., & Wang, Z. (2022). The asymmetric and multi-scale volatility correlation between global oil price and economic policy uncertainty of China. Environmental Science and Pollution Research, 29(8), 11255–11266. [CrossRef]
- Jiao, J.-W., Yin, J.-P., Xu, P.-F., Zhang, J., & Liu, Y. (2023). Transmission mechanisms of geopolitical risks to the crude oil market——A pioneering two-stage geopolitical risk analysis approach. Energy, 283, 128449. [CrossRef]
- Kwiatkowski, D., Phillips, P.C., Schmidt, P., Shin, Y., 1992. Testing the null hypothesis of stationarity against the alternative of a unit root: How sure are we that economic time series have a unit root? Journal of econometrics 54, 159–178. [CrossRef]
- Li, H.-S., Hu, C.-P., Zheng, L., Li, M.-Q., Guo, X.-Z., 2021. African swine fever and meat prices fluctuation: An empirical study in China based on TVP-VAR model. Journal of Integrative Agriculture 20, 2289–2301. [CrossRef]
- Li, J., Liu, W., Song, Z., 2020. Sustainability of the Adjustment Schemes in China's Grain Price Support Policy—An Empirical Analysis Based on the Partial Equilibrium Model of Wheat. Sustainability 12, 6447. [CrossRef]
- Li, Y., He, R., Liu, J., Li, C., Xiong, J., 2021. Quantitative evaluation of China's pork industry policy: a PMC index model approach. Agriculture 11, 86. [CrossRef]
- Liu, Q. "Wilson," 2005. Price relations among hog, corn, and soybean meal futures. Journal of Futures Markets: Futures, Options, and Other Derivative Products 25, 491–514. [CrossRef]
- Longmire, J.L., Rutherford, A., 1993. Cattle and Pig Cycles in Australia-Do They Still Exist. [CrossRef]
- Lu, C., Fang, J., Fu, S., 2020. A new equilibrium strategy of supply and demand for the supply chain of pig cycle. Mathematical Problems in Engineering 2020, 1–13. [CrossRef]
- Luo, 2011. The impact of external shocks on China's agricultural price fluctuations—— empirical research based on SVAR model. Journal of Agrotechnical Economics 4–11. [CrossRef]
- Ma, C., Tao, J., Tan, C., Liu, W., Li, X., 2023. Negative Media Sentiment about the Pig Epidemic and Pork Price Fluctuations: A Study on Spatial Spillover Effect and Mechanism. Agriculture 13, 658. [CrossRef]
- Ma, L., Teng, Y., 2022. Decision-making behaviour evolution among pork supply and demand subjects under normalisation of COVID-19 prevention and control: a case study in China. Frontiers in Public Health 10, 784668. [CrossRef]
- Ma, M., Wang, H.H., Hua, Y., Qin, F., Yang, J., 2021. African swine fever in China: Impacts, responses, and policy implications. Food Policy 102, 102065. [CrossRef]
- McCarthy, M., O'Reilly, S., Cotter, L., de Boer, M., 2004. Factors influencing consumption of pork and poultry in the Irish market. Appetite 43, 19–28. [CrossRef]
- Nakajima, J., 2011. Monetary policy transmission under zero interest rates: An extended time-varying parameter vector autoregression approach. The BE Journal of Macroeconomics 11. [CrossRef]
- Nakajima, J., Kasuya, M., Watanabe, T., 2011. Bayesian analysis of time-varying parameter vector autoregressive model for the Japanese economy and monetary policy. Journal of the Japanese and International Economies 25, 225–245. [CrossRef]
- Oh, S.H., Whitley, N.C., 2011. Pork production in China, Japan and South Korea. Asian-Australasian journal of animal sciences 24, 1629–1636. [CrossRef]
- Pan, F.-H., Wang, N., Deng, H.-N., 2022. Time-varying supply response of feeding sows based on the TVP-VAR-SV model. [CrossRef]
- Pang, J., Yin, J., Lu, G., Li, S., 2023. Supply and Demand Changes, Pig Epidemic Shocks, and Pork Price Fluctuations: An Empirical Study Based on an SVAR Model. Sustainability 15, 13130. [CrossRef]
- Phillips, P.C., Perron, P., 1988. Testing for a unit root in time series regression. biometrika 75, 335–346. [CrossRef]
- Primiceri, G.E., 2005. Time varying structural vector autoregressions and monetary policy. The Review of Economic Studies 72, 821–852. [CrossRef]
- Ramsey, A.F., Goodwin, B.K., Hahn, W.F., Holt, M.T., 2021. Impacts of COVID-19 and price transmission in US meat markets. Agricultural Economics 52, 441–458. [CrossRef]
- 53. Shi, Wang, Hu, 2021. Economic policy uncertainty and livestock product price fluctuation in China. Chinese Rural Economy 42–55.
- Sims, C.A., 1980. Macroeconomics and reality. Econometrica: journal of the Econometric Society 1–48. [CrossRef]
- Soliman, A.M., Lau, C.K., Cai, Y., Sarker, P.K., Dastgir, S., 2023. Asymmetric effects of energy inflation, agri-inflation and CPI on agricultural output: evidence from NARDL and SVAR models for the UK. Energy Economics 126, 106920. [CrossRef]
- Soroka, S.N., 2006. Good news and bad news: Asymmetric responses to economic information. The journal of Politics 68, 372–385. [CrossRef]
- Tan, Hu, Li, 2018. The Impact of Economic Uncertainty on the Price of Agricultural Products from Perspective of Industrial Chain. Journal of Agrotechnical Economics 80–92. [CrossRef]
- Tan, Y., Zeng, H., 2019. Price transmission, reserve regulation and price volatility. China Agricultural Economic Review 11, 355–372. [CrossRef]
- Vu, T.N., Ho, C.M., Nguyen, T.C., Vo, D.H., 2020. The determinants of risk transmission between oil and agricultural prices: An IPVAR approach. Agriculture 10, 120. [CrossRef]
- Wang, J., Dai, P.-F., Chen, X. H., & Nguyen, D. K. (2024). Examining the linkage between economic policy uncertainty, coal price, and carbon pricing in China: Evidence from pilot carbon markets. Journal of Environmental Management, 352, 120003. [CrossRef]
- Wan, W., Tao, J., 2023. The impact of food safety scandals on pork prices from consumer concern perspective: evidence from China. Frontiers in Sustainable Food Systems 7, 1270705. [CrossRef]
- Wang, G., Wang, J., Chen, S., Zhao, C. e, 2023. Vertical integration selection of Chinese pig industry chain under African swine fever-From the perspective of stable pig supply. Plos one 18, e0280626. [CrossRef]
- Wang, J., Shen, M., Gao, Z., 2018. Research on the irrational behavior of consumers' safe consumption and its influencing factors. International Journal of Environmental Research and Public Health 15, 2764. [CrossRef]
- Wang, J., Wang, G., Cui, Y., Zhang, J., 2022. How does imported pork regulate the supply and demand of China's pig market during the epidemic?—based on the analysis of African swine fever and COVID-19. Frontiers in Veterinary Science 9, 1028460. [CrossRef]
- Wang, J., Wang, X., Yu, X., 2023. Shocks, cycles and adjustments: The case of China's Hog Market under external shocks. Agribusiness 39, 703–726. [CrossRef]
- Wang, Lu, Liu, Li, Shan, 2011. Game Analysis of Contract Pricing Based on Supply and Demand of Pig. On Economic Problems 77–81. [CrossRef]
- Wang, Xiao, 2012. Analysis on the reasons of the fluctuation of pig production in china. Issues in Agricultural Economy 28–32. [CrossRef]
- Wang, Y., 2023. 68. Wang, Y., 2023. Agricultural products price prediction based on improved RBF neural network model. Applied artificial intelligence 37, 2204600. [CrossRef]
- Wang, Y., Wang, J., Wang, X., 2020. COVID-19, supply chain disruption and China's hog market: a dynamic analysis. China Agricultural Economic Review 12, 427–443. [CrossRef]
- Ward, C.E., 1999. Comparative Analysis of Slaughter Lamb Prices. [CrossRef]
- Wu, H., Qi, Y., Chen, D., 2012. A dynamic analysis of influencing factors in price fluctuation of live pigs-based on statistical data in Sichuan province, China. Asian Social Science 8, 256. [CrossRef]
- Wu, L., Xiong, T., 2024. News Textual Sentiment and Hog Firms' Performance Under African Swine Fever. Emerging Markets Finance and Trade 1–15. [CrossRef]
- Xiao, X., Tian, Q., Hou, S., & Li, C. (2019). Economic policy uncertainty and grain futures price volatility: Evidence from China. China Agricultural Economic Review, 11(4), 642–654. [CrossRef]
- Xie, H., Wang, B., 2017. An empirical analysis of the impact of agricultural product price fluctuations on China's grain yield. Sustainability 9, 906. [CrossRef]
- Xiong, T., Zhang, W., Chen, C.-T., 2021. A Fortune from misfortune: Evidence from hog firms' stock price responses to China's African Swine Fever outbreaks. Food Policy 105, 102150. [CrossRef]
- XU, S., LI, Z., CUI, L., DONG, X., KONG, F., LI, G., 2012. Price transmission in China's swine industry with an application of MCM. Journal of Integrative Agriculture 11, 2097–2106. [CrossRef]
- Yao, H., Zang, C., Zuo, X., Xian, Y., Lu, Y., Huang, Y., Li, X., 2022. Tradeoff analysis of the pork supply and food security under the influence of African swine fever and the COVID-19 outbreak in China. Geography and Sustainability 3, 32–43. [CrossRef]
- Yu, Z., Bai, H., 2023. Risk preference, risk perception, and purchase recovery period: Empirical evidence from salmon contamination of COVID-19 in China. Aquaculture Economics & Management 27, 96–123. [CrossRef]
- Zhang, H., Shi, Z., Zhou, H., Hu, X., 2023. Pork Consumption Patterns among Rural Residents in China: A Regional and Cultural Perspective (2000–2020). Agriculture 13, 1888. [CrossRef]
- Zhang, L. xiang, Zhang, X. cai, 2011. A study on the impact of emergencies on the fluctuation of the agricultural produce prices. Journal of Management World 71–81. [CrossRef]
- Zhu, 2017. Index construction and features of china's fiscal policy uncertainty and its causes. Finance & Trade Economics 38, 15.
Figure 1.
Dynamic price model of live pig industry chain.
Figure 1.
Dynamic price model of live pig industry chain.
Figure 2.
Trends of economic policy uncertainty index and pig industry news uncertainty index. Source: Policy Uncertainty official website, People's Daily statistics.
Figure 2.
Trends of economic policy uncertainty index and pig industry news uncertainty index. Source: Policy Uncertainty official website, People's Daily statistics.
Figure 3.
Price fluctuation trend of live pig industry chain. Source: National Bureau of Statistics of China.
Figure 3.
Price fluctuation trend of live pig industry chain. Source: National Bureau of Statistics of China.
Figure 4.
Sample autocorrelation, path, and posterior density estimated by MCMC. Notes: The six columns from left to right reveal the sample auto-correlation, path and posterior density of
Figure 4.
Sample autocorrelation, path, and posterior density estimated by MCMC. Notes: The six columns from left to right reveal the sample auto-correlation, path and posterior density of
Figure 5.
Equal-interval impulse response of pig industry chain price to economic policy uncertainty.
Figure 5.
Equal-interval impulse response of pig industry chain price to economic policy uncertainty.
Figure 6.
Impulse response of live pig industry chain price to economic policy uncertainty at specific time points.
Figure 6.
Impulse response of live pig industry chain price to economic policy uncertainty at specific time points.
Figure 7.
Equal-interval impulse response of pig industry chain price to industrial news uncertainty.
Figure 7.
Equal-interval impulse response of pig industry chain price to industrial news uncertainty.
Figure 8.
Impulse response of live pig industry chain price to industrial news uncertainty at specific time points.
Figure 8.
Impulse response of live pig industry chain price to industrial news uncertainty at specific time points.
Figure 9.
Equal-interval impulse response of pig industry chain price to industrial news uncertainty (INU_F).
Figure 9.
Equal-interval impulse response of pig industry chain price to industrial news uncertainty (INU_F).
Figure 10.
Impulse response of live pig industry chain price to industrial news uncertainty at specific time points (INU_F).
Figure 10.
Impulse response of live pig industry chain price to industrial news uncertainty at specific time points (INU_F).
Figure 11.
Equal-interval impulse response of pig industry chain price to swine disease uncertainty.
Figure 11.
Equal-interval impulse response of pig industry chain price to swine disease uncertainty.
Figure 12.
Impulse response of live pig industry chain price to swine disease uncertainty at specific time points.
Figure 12.
Impulse response of live pig industry chain price to swine disease uncertainty at specific time points.
Figure 13.
Results of the impulse response of pig slaughter quantity to uncertainty shock.
Figure 13.
Results of the impulse response of pig slaughter quantity to uncertainty shock.
Table 1.
Statistical description of time series variables.
Table 1.
Statistical description of time series variables.
| Variable |
Mean |
SD |
Min |
MAX |
Skewness |
Kurtosis |
J-B |
| EPU |
207.0847 |
123.4125 |
58.8992 |
661.8280 |
1.1095 |
3.8948 |
39.1155*** |
| INU |
99.9998 |
71.5722 |
12.2024 |
439.2846 |
1.9747 |
8.5779 |
319.1866*** |
| Piglet |
41.6433 |
25.3819 |
16.8400 |
125.0400 |
1.7894 |
5.3934 |
126.6678*** |
| Hogp |
17.4283 |
6.6048 |
9.7000 |
37.6600 |
1.7446 |
5.1994 |
116.2483*** |
| Porkp |
25.9491 |
8.675918 |
15.21000 |
52.2500 |
1.7581 |
5.1930 |
117.3520*** |
Table 2.
Results of unit root test.
Table 2.
Results of unit root test.
| Variable |
ADF |
PP |
KPSS |
Verdict |
| EPU |
-0.2605(3) |
-0.2508(15) |
0.2639(8)*** |
Nonstationary |
| INU |
0.0121(1) |
-0.0568(2) |
0.4368(10)** |
Nonstationary |
| Hogp |
-0.0265(2) |
-0.0877(4) |
0.6224(10)* |
Nonstationary |
| Piglet |
-0.0217(1) |
-0.0864(3) |
0.3731(10)** |
Nonstationary |
| Porkp |
-0.1246(6) |
-0.0724(24) |
0.2686(8)*** |
Nonstationary |
| △(EPU) |
-13.1008(1)*** |
-43.5993(22)*** |
0.0933(22) |
stationary |
| △(INU) |
-8.6022(0)*** |
-8.4833(4)*** |
0.0425(2) |
stationary |
| △(Hogp) |
-7.5117(1)*** |
-6.8130(9)*** |
0.0781(4) |
stationary |
| △(Piglet) |
-7.6490(0)*** |
-7.3132(7)*** |
0.0645(3) |
stationary |
| △(Porkp) |
-9.0713(5)*** |
-45.8966(31)*** |
0.1068(32) |
stationary |
Table 3.
Parameter estimation results in the TVP-SV-VAR model.
Table 3.
Parameter estimation results in the TVP-SV-VAR model.
| Parameter |
Mean |
Std.Dev. |
95%L |
95%U |
Geweke |
Inefficiency |
|
0.0221 |
0.0024 |
0.0181 |
0.0275 |
1.000 |
5.52 |
|
0.0229 |
0.0026 |
0.0185 |
0.0288 |
0.030 |
13.48 |
|
0.0384 |
0.0067 |
0.0278 |
0.0536 |
0.412 |
10.32 |
|
0.0388 |
0.0067 |
0.0281 |
0.0545 |
0.345 |
15.74 |
|
0.2053 |
0.0693 |
0.0919 |
0.3585 |
0.728 |
47.89 |
|
0.3103 |
0.1194 |
0.1222 |
0.5884 |
0.349 |
88.49 |
|
Disclaimer/Publisher’s Note: The statements, opinions and data contained in all publications are solely those of the individual author(s) and contributor(s) and not of MDPI and/or the editor(s). MDPI and/or the editor(s) disclaim responsibility for any injury to people or property resulting from any ideas, methods, instructions or products referred to in the content. |
© 2024 by the authors. Licensee MDPI, Basel, Switzerland. This article is an open access article distributed under the terms and conditions of the Creative Commons Attribution (CC BY) license (http://creativecommons.org/licenses/by/4.0/).
