1. Introduction
Breast cancer is the most common cancer worldwide and triple-negative breast cancer (TNBC) accounts for 15-20% of the diagnosed cases [
1]. TNBC lacks estrogen, progesterone and human epidermal growth factor 2 (HER2) receptor [
2]. As a consequence, TNBC is the only breast cancer subtype which does not benefit from standard hormones and HER2 targeted therapies [
3]. Surgery and chemotherapy are the reference treatment for TNBC patients, however the high rate of recurrency and the low median of overall survival (OS) indicates the need for additional therapies [
4,
5]. PARP inhibitors, and immune-checkpoint (IC) inhibitors are novel opportunities for TNBC treatment [
6] but they are only partially applicable. PDL-1 protein is, in fact, present in about 1 over 5 TBNC [
7] and only 15 to 25% of all TNBC patients harbor germline BRCA (gBRCA) 1/2 mutations [
8]. Moreover, the effectiveness of PARP and IC inhibitors in improving OV is significant in early but not in advanced TNBC [
6].
These observations highlight the importance of further efforts in identifying alternative approaches for TNBC treatment.
By using a mice model of hepatocellular carcinoma (HCC), we recently identified a novel target to induce cancer regression: Na+ homeostasis of hepatocarcinoma cells [
9]. We found that HCC had significantly higher levels of Na+ in comparison to normal tissues and that the antibiotic cation ionophore Monensin further increased them. HCC cells showed to be, unlike normal cells, specifically sensitive to the toxic action of Monensin and such an effect was inhibited by preventing the increase of intracellular Na+ induced by the cation ionophore. Mice systemic treatment with Monensin caused necrosis and shrinkage of the HCC tumor but did not affect the integrity of healthy organs [
9]. This indicated that the pharmacological treatment with the sodium ionophore Monensin induced a selective increase of sodium in only HCC cells and that this was the cause of the cancer-specific toxic effect of Monensin.
The above research was based on our early studies on the mechanisms of cell death and endogenous protection of primary not-transformed rodent hepatocytes. We showed that following mitochondrial dysfunction, an irreversible increase of intracellular Na+ precedes and causes the death of the hepatocytes and that prevention of Na+ load increases hepatocyte resistance to damage [
10,
11,
12]. A general feature of cancer is the shift from mitochondrial to aerobic glycolytic metabolism (Warburg effect) [
13]. The consequent accumulation of the acidic end products of glycolysis is then paradoxically associated with the alkaline pH of cancer cells[
14]. Cancer alkaline pH depends on the increased activity or expression of pH-regulatory proteins that, notably, are mostly Na+ transporters, able to induce a net sodium entrance into the cells[
14]. On this basis, we recently hypothesized and demonstrated [
9] that HCC cells owing to a higher intracellular Na+ concentration compared to healthy cells, were unable to compensate for a further and cytotoxic Na
+ load.
Aerobic glycolytic metabolism and alkaline intracellular pH are two of the few features virtually common to all cancer tissues and an increase of intracellular sodium is the likely consequence of these conditions [
13,
14]. In this regard, essential findings were obtained by 23Na-Magnetic Resonance Imaging analysis of several human cancers [
15,
16,
17,
18,
19,
20] including breast cancers (BC) [
18,
19]. These analyses demonstrated an aberrantly elevated [Na
+]
i in cancer tissues compared to the surrounding normal tissues. These results, besides evidencing cancer sodium level as a novel diagnostic biomarker for human tumors [
20], offer a solid rationale for exploring Na+ homeostasis as an innovative target for the therapy of also extra-hepatic tumors like TNBC.
Our study with the mice model of HCC, was the first research demonstrating a specific sensitivity of cancer cells to a pharmacologically induced sodium load induced by Monensin. Several preclinical studies, however, previously reported a powerful anticancer activity of the antibiotic Monensin [
21,
22,
23,
24,
25]. Monensin was in fact shown to induce apoptosis of numerous types of cancer cells including those displaying multidrug resistance [
21] and including breast cancer cells [
25]. None of these studies, however, related the anticancer activity of Monensin to its main chemical property of sodium ionophore: Monensin is, in fact, a polyether cation ionophore able to reversibly bind and move Na+ from the extracellular fluid to the cytoplasm along its concentration gradient [
26].
First aim of the present Research is analyzing the anticancer effect of Monensin by using not only in vitro but also, in vivo model of mice TNBC and investigating the relation of such effect to the activity of Monensin as Na+ ionophore. To this purpose we will employ mice TBNC cells (4T1 cells) to study by in vivo imaging techniques, sodium accumulation and appearance of cell death in cultured 4T1 cells exposed or not to Monensin and cancer sodium content and inhibition of tumor mass formation in mice injected with 4T1 cells and i.p. treated with Monensin or vehicle.
A main harmful side effect of the conventional chemotherapy treatments of TNBC is their general cytostatic action affecting not only the transformed but also the normal proliferating tissues [
27]. The previously published studies on the anticancer activity of Monensin in extra-hepatic cells reported that the cytotoxic action of the ionophore was associated with an inhibition of cancer cell proliferation [
21,
22,
23,
24,
25]. Such observations might represent a limit for translating to clinics the studies on Monensin as an anticancer agent. In our Research with the mice model of HCC, however, we obtained clear
in vivo evidence regarding the capacity of Monensin to specifically affect cancer cells without inhibiting the proliferating activity of both transformed and normal tissues [
9]. In the present Research we will further address this issue evaluating
in vivo the effects of Monensin on the proliferating activity of breast cancer and healthy tissue. Additionally, to clarify the discrepancy of results regarding the cytostatic action of the sodium ionophore, we will assess,
in vitro, the effects on Monensin on the expression of the proliferating marker PCNA employing TNBC cells in comparison with other cancer cell types and evaluating, as potential confounding parameter, the employment differential treatment conditions.
2. Materials and Methods
2.1. Chemicals and Reagents
Fetal bovine serum (FBS), penicillin (P), streptomycin (S), Monensin, trypan blue, 2-hydroxypropyl-β-cyclodextrin (HBCD), Acrylamide/Bis-acrylamide (30% solution), Amersham Hybond PVDF Blotting Membrane, Anti-PCNA (Ab-1) Mouse mAb (PC10) 1:100, monoclonal Anti-β-actin Mouse antibody 1:1000 and all chemicals for buffer and reagent preparations were purchased from Sigma-Aldrich (Missouri, USA). PierceTM RIPA Buffer, NovexTM Tris-Glycine Transfer Buffer, PierceTM BCA Protein Assay, PierceTM ECL Western Blotting Substrate and all chemicals for buffer and reagent preparations for western blot analysis were purchased from Thermo Fisher Scientific (Massachusetts, USA). Roswell Park Memorial Institute medium (RPMI), Dulbecco’s modified Eagle medium culture medium (DMEM) and custom-modified Na+ - free DMEM (DMEM - Na+) without any Na+ components, were obtained from GIBCO (S.I.A.L group, Rome, Italy). CoroNa™ Green, AM was obtained from Thermo Fisher Scientific (Massachusetts, USA). Ultra Rediject Salt D-Luciferin from Perkin Elmer (Massachusetts, USA).
2.2. Cell Culture
Murine 4T1-Luc2 (4T1) mammary tumor cells, murine B16-F10-Luc (B16) melanoma tumor cells, human SK-OV-3 (SKOV3) ovarian tumor cells and murine Hepa-1c1c7 (C1C7) were supplied by LGC Ltd (Middlesex, UK). The 4T1, B16 and SKOV3 cells were routinely cultured in RPMI supplemented with 10% FBS, 100 U/mL penicillin (P), 100 μg/ml streptomycin (S). Murine C1C7 cells were cultured in DMEM w/o glutamine, supplemented with 10% FBS, 100 U/mL P, 6mM Gln, 100 μg/ml S. Cells were maintained in a humidified chamber at 5% CO2 / 95% air at 37°C and split every 1 to 3 days. All materials were purchased from Lonza (Basel, Switzerland). All cells tested negative for mycoplasma using the MycoAlert™ Mycoplasma Detection Kit.
2.3. Cell Treatments
For in vitro cell imaging analysis, 4T1 cells were seeded (1.5*105/mL cell density) in RPMI and treated with 1 μM monensin (or vehicle) after 24 hours in DMEM with normal (145 mM) sodium concentration ( + Na+), or without any sodium component (-Na+) (GIBCO, S.I.A.L, Rome, Italy) in absence of serum.
For WB analysis, 4T1-Luc2 (4T1), B16, SKOV3 and C1C7 cells were seeded (1.25*105/mL cell density) in RPMI or DMEM (C1C7) and treated with 5 μM monensin (or vehicle) after 16-24 hours in DMEM/RPMI supplemented or not with fetal bovine serum (FBS, 10%).
2.4. In Vitro Cell Imaging Analysis of CoroNa Green, AM/ Cytotox NIR Dye Fluorescence
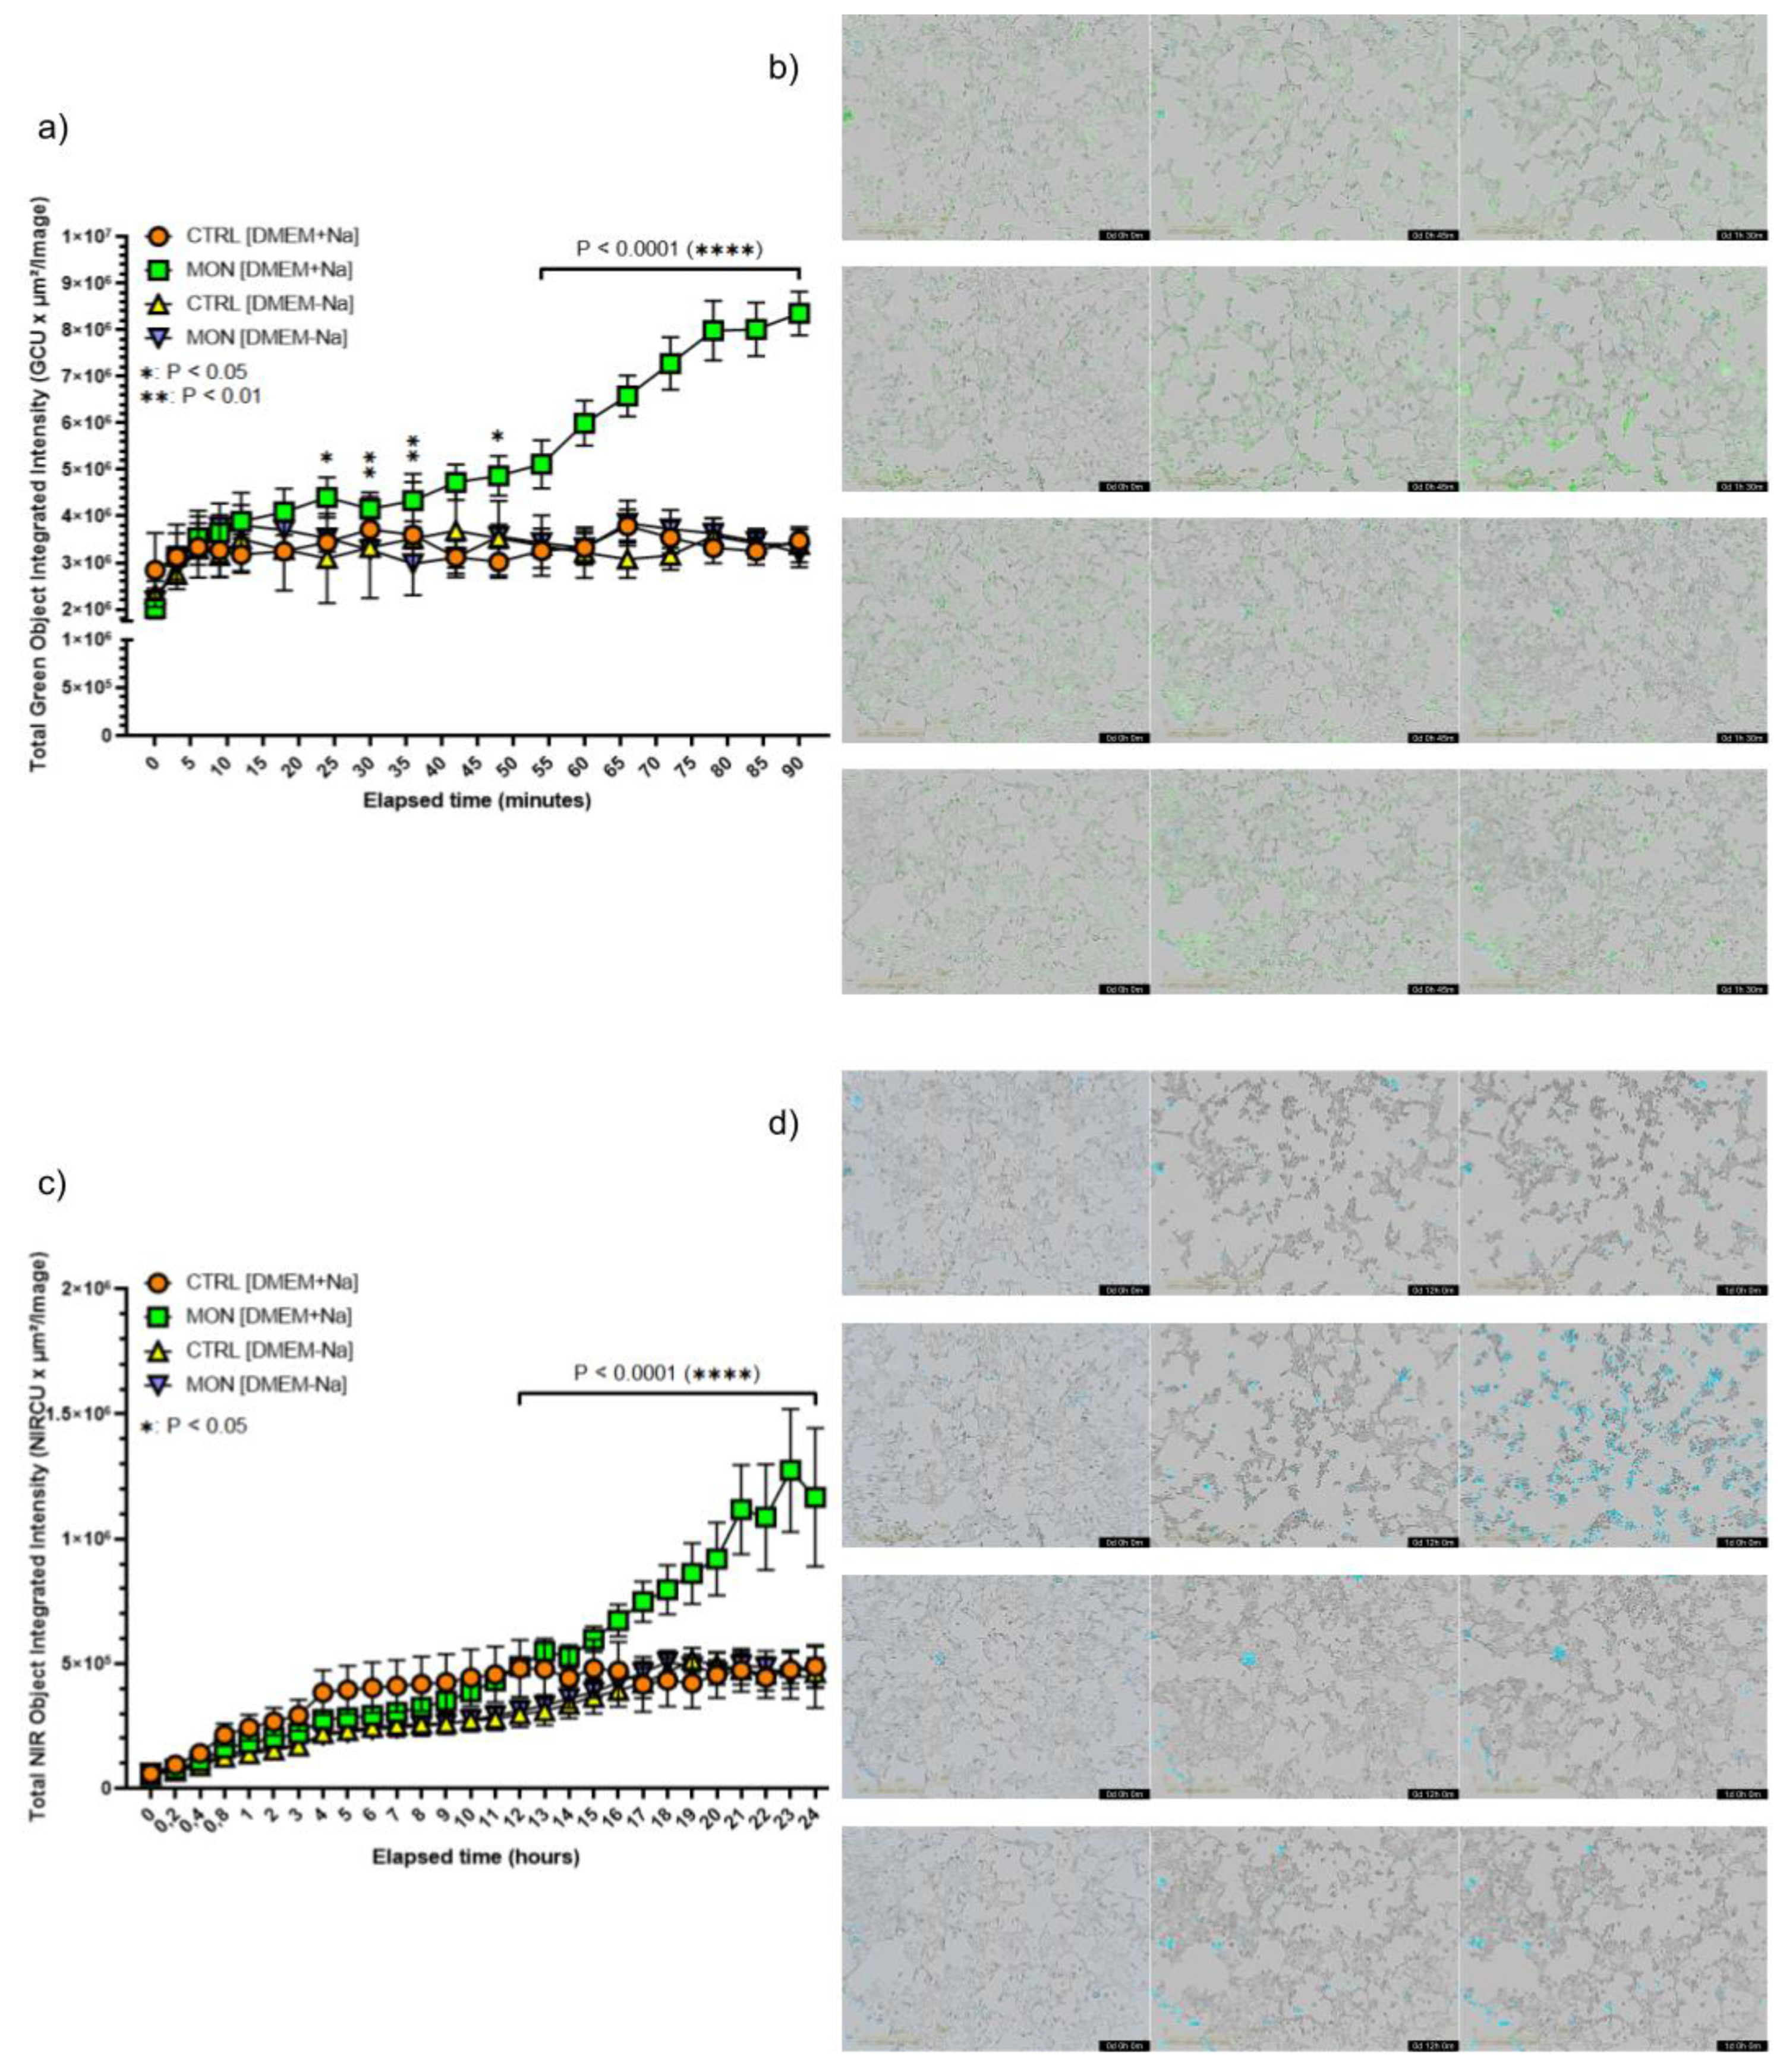
The 4T1 cells were seeded in a 96-well plate for 24 h in DMEM supplemented with 10% FBS and loaded with the fluorescent dye CoroNa Green, AM. CoroNa Green, AM dye is a sodium ion indicator that exhibits an increase in green fluorescence emission intensity upon binding Na+, with little shift in wavelength. 4T1 cells were incubated with the fluorescent probe (5 μM) in HBSS with BSA (4%) and Pluronic acid (0.02%) at 37°C for 1 hour and then washed twice with HBSS. After washing the cells were treated with Monensin (1 μM) in presence of the cell-impermeant Cytotox NIR Dye (0.6 μM) to selectively stain nuclei of dead cells and maintained in controlled atmosphere (5% CO2; 37 °C) for 20 h in DMEM ( + Na+) or in DMEM (-Na+) in the incubator of the IncuCyte SX5 Live® Cell Analysis System. The Na+ intracellular variations were recorded every 3 minutes while the cytotoxicity was recorded every hour by employing a semi-automated analysis protocol of the IncuCyte SX5 Live® Cell Analysis System. Negative controls were performed using samples loaded with the singular dyes. Brightfield and fluorescent multi-channel images were acquired using a 20X objective. Different combinations of LED excitation light and fluorescent filters were used to visualize the fluorescent probes. The use of Sartorius® probe in the same company’s imaging system allowed for the use of the pre-given setting for the best fluorescent outputs: Incucyte® Cytotox NIR Dye (Ex: 665nm, Em: 695 nm; near infrared channel). The CoroNa green probe, having an Ex. 492 nm, Em: 516 nm, was acquired using the green channel. Identical parameters were applied for all the quantified images. All data were saved as .CSV files until further processing.
2.5. Quantitative Expression of Proliferating Cell Nuclear Antigen (PCNA)
Protein extracts from 4T1, C1C7, B16 and SKOV3 cells were electrophoresed by SDS/PAGE (10% gel) and, after blotting them onto the PVDF membranes, the membranes were probed with antibodies against PCNA (Sigma). The β-actin monoclonal antibody (Sigma) was used to assess equal protein loading. The antigens were detected by ECL Western Blotting Substrate (Thermo Fisher Scientific, Massachusetts, USA) and ChemiDoc MP quantitative imaging system (BioRad Laboratories, Milan, Italy). The results were expressed as ratios.
2.6. In Vivo Experiments
Animals
Six-to-eight-weeks-old adult female BALB/cOlaHsd (Envigo, Inc., Indiana, USA) (BALB/c) were maintained under pathogen-free conditions in the animal facility of Università del Piemonte Orientale, Department of Health Sciences, and treated in accordance with the University Ethical Committee and European guidelines (Experimental protocol authorization n. 1001/2024-PR, released on 24/10/2024 from Italian Ministry of Health for protocol n. DB064.91).
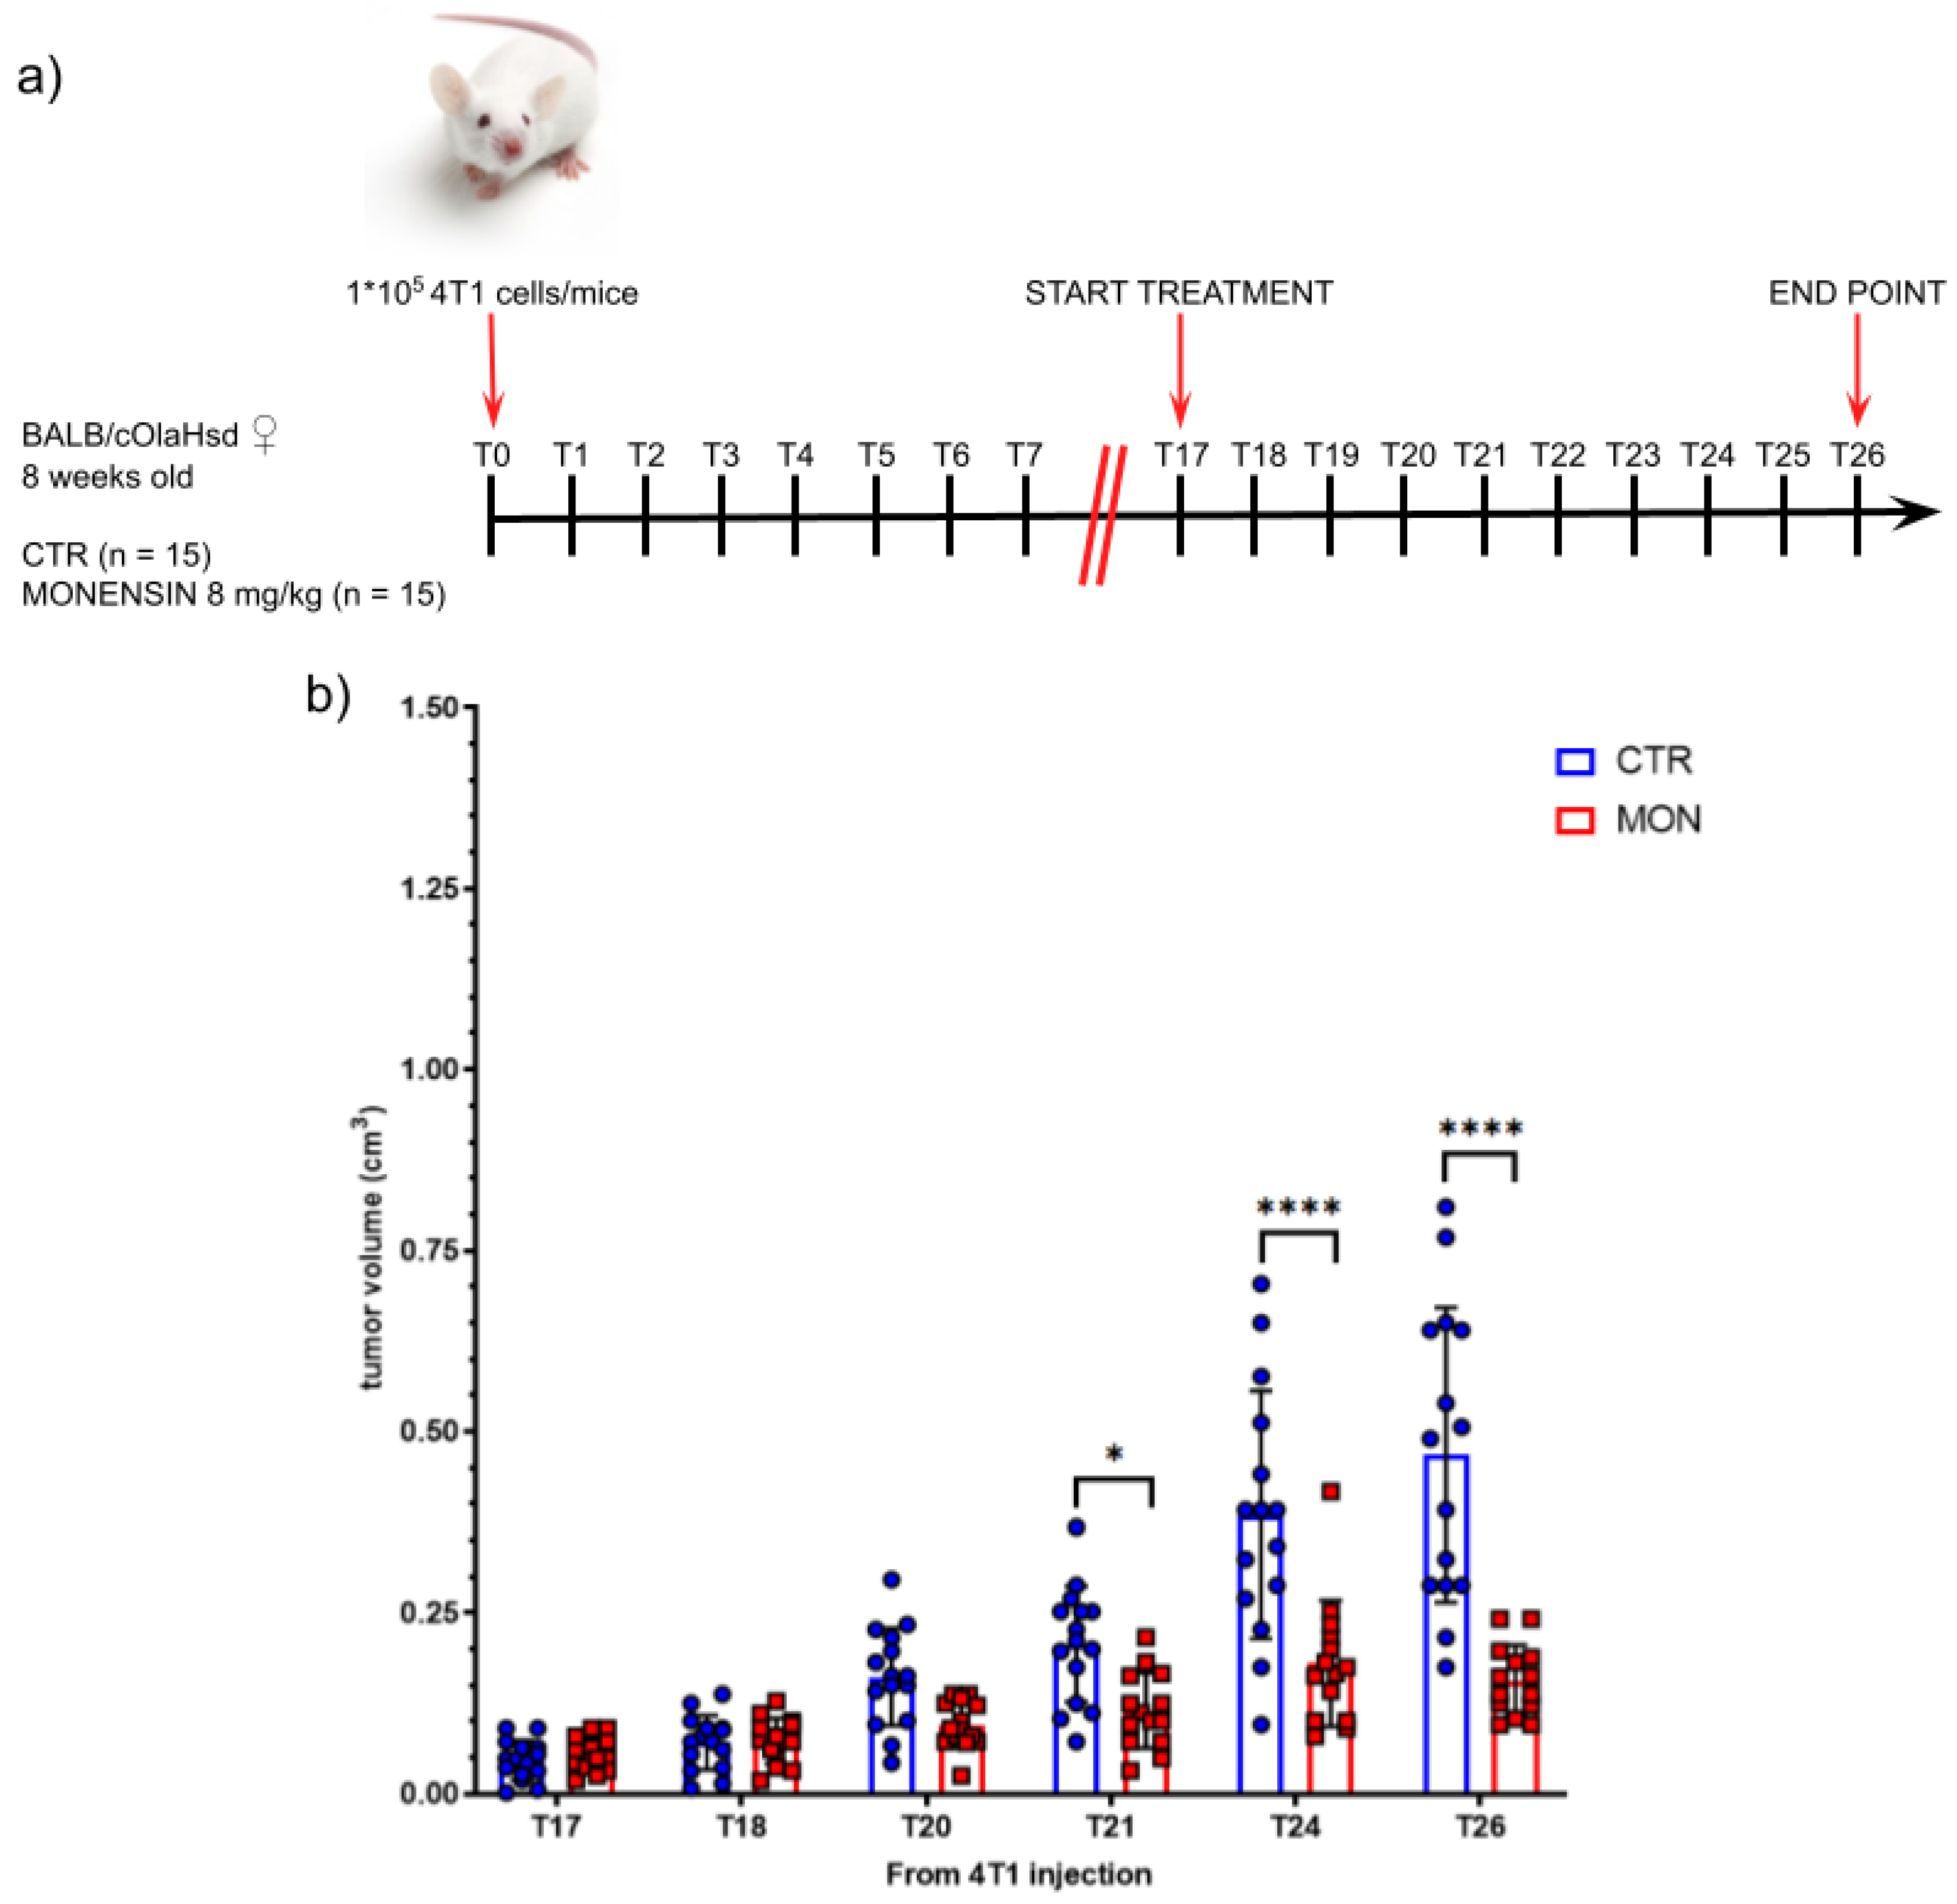
4T1-Luc2 tumor cells were injected orthotopically (100,000 cells in 100 μL of NaCl 0.9%/mouse) in the fourth mammary fat pad of female BALB/c mice. The tumor growth was monitored daily and when its size was ~80 mm3 (about 17 days after the cancer cell injection), the mice were treated daily with i.p. injection of 8 mg/kg Monensin, dissolved in DMSO/HBCD 10% in NaCl 0.9% (1:9, v/v), or with vehicle alone (DMSO/HBCD 10% in NaCl 0.9% - 1:9, v/v). 15 animals per group were employed. Palpable tumors were measured in two dimensions with an analog caliper to estimate the tumor volume according to the equation V = (L × W x W)/2.
The treatments were administered for 10 days and the mice were sacrificed 2 h after the last administration or when they displayed sufferance. At the end of the experiment, before organ harvesting, mice were perfused with Krebs w/o Na+ to eliminate possible contaminations arising from the intravascular Na+.
2.7. In Vivo Imaging Analysis of Tumor Development and Intratumoral Na+ Content
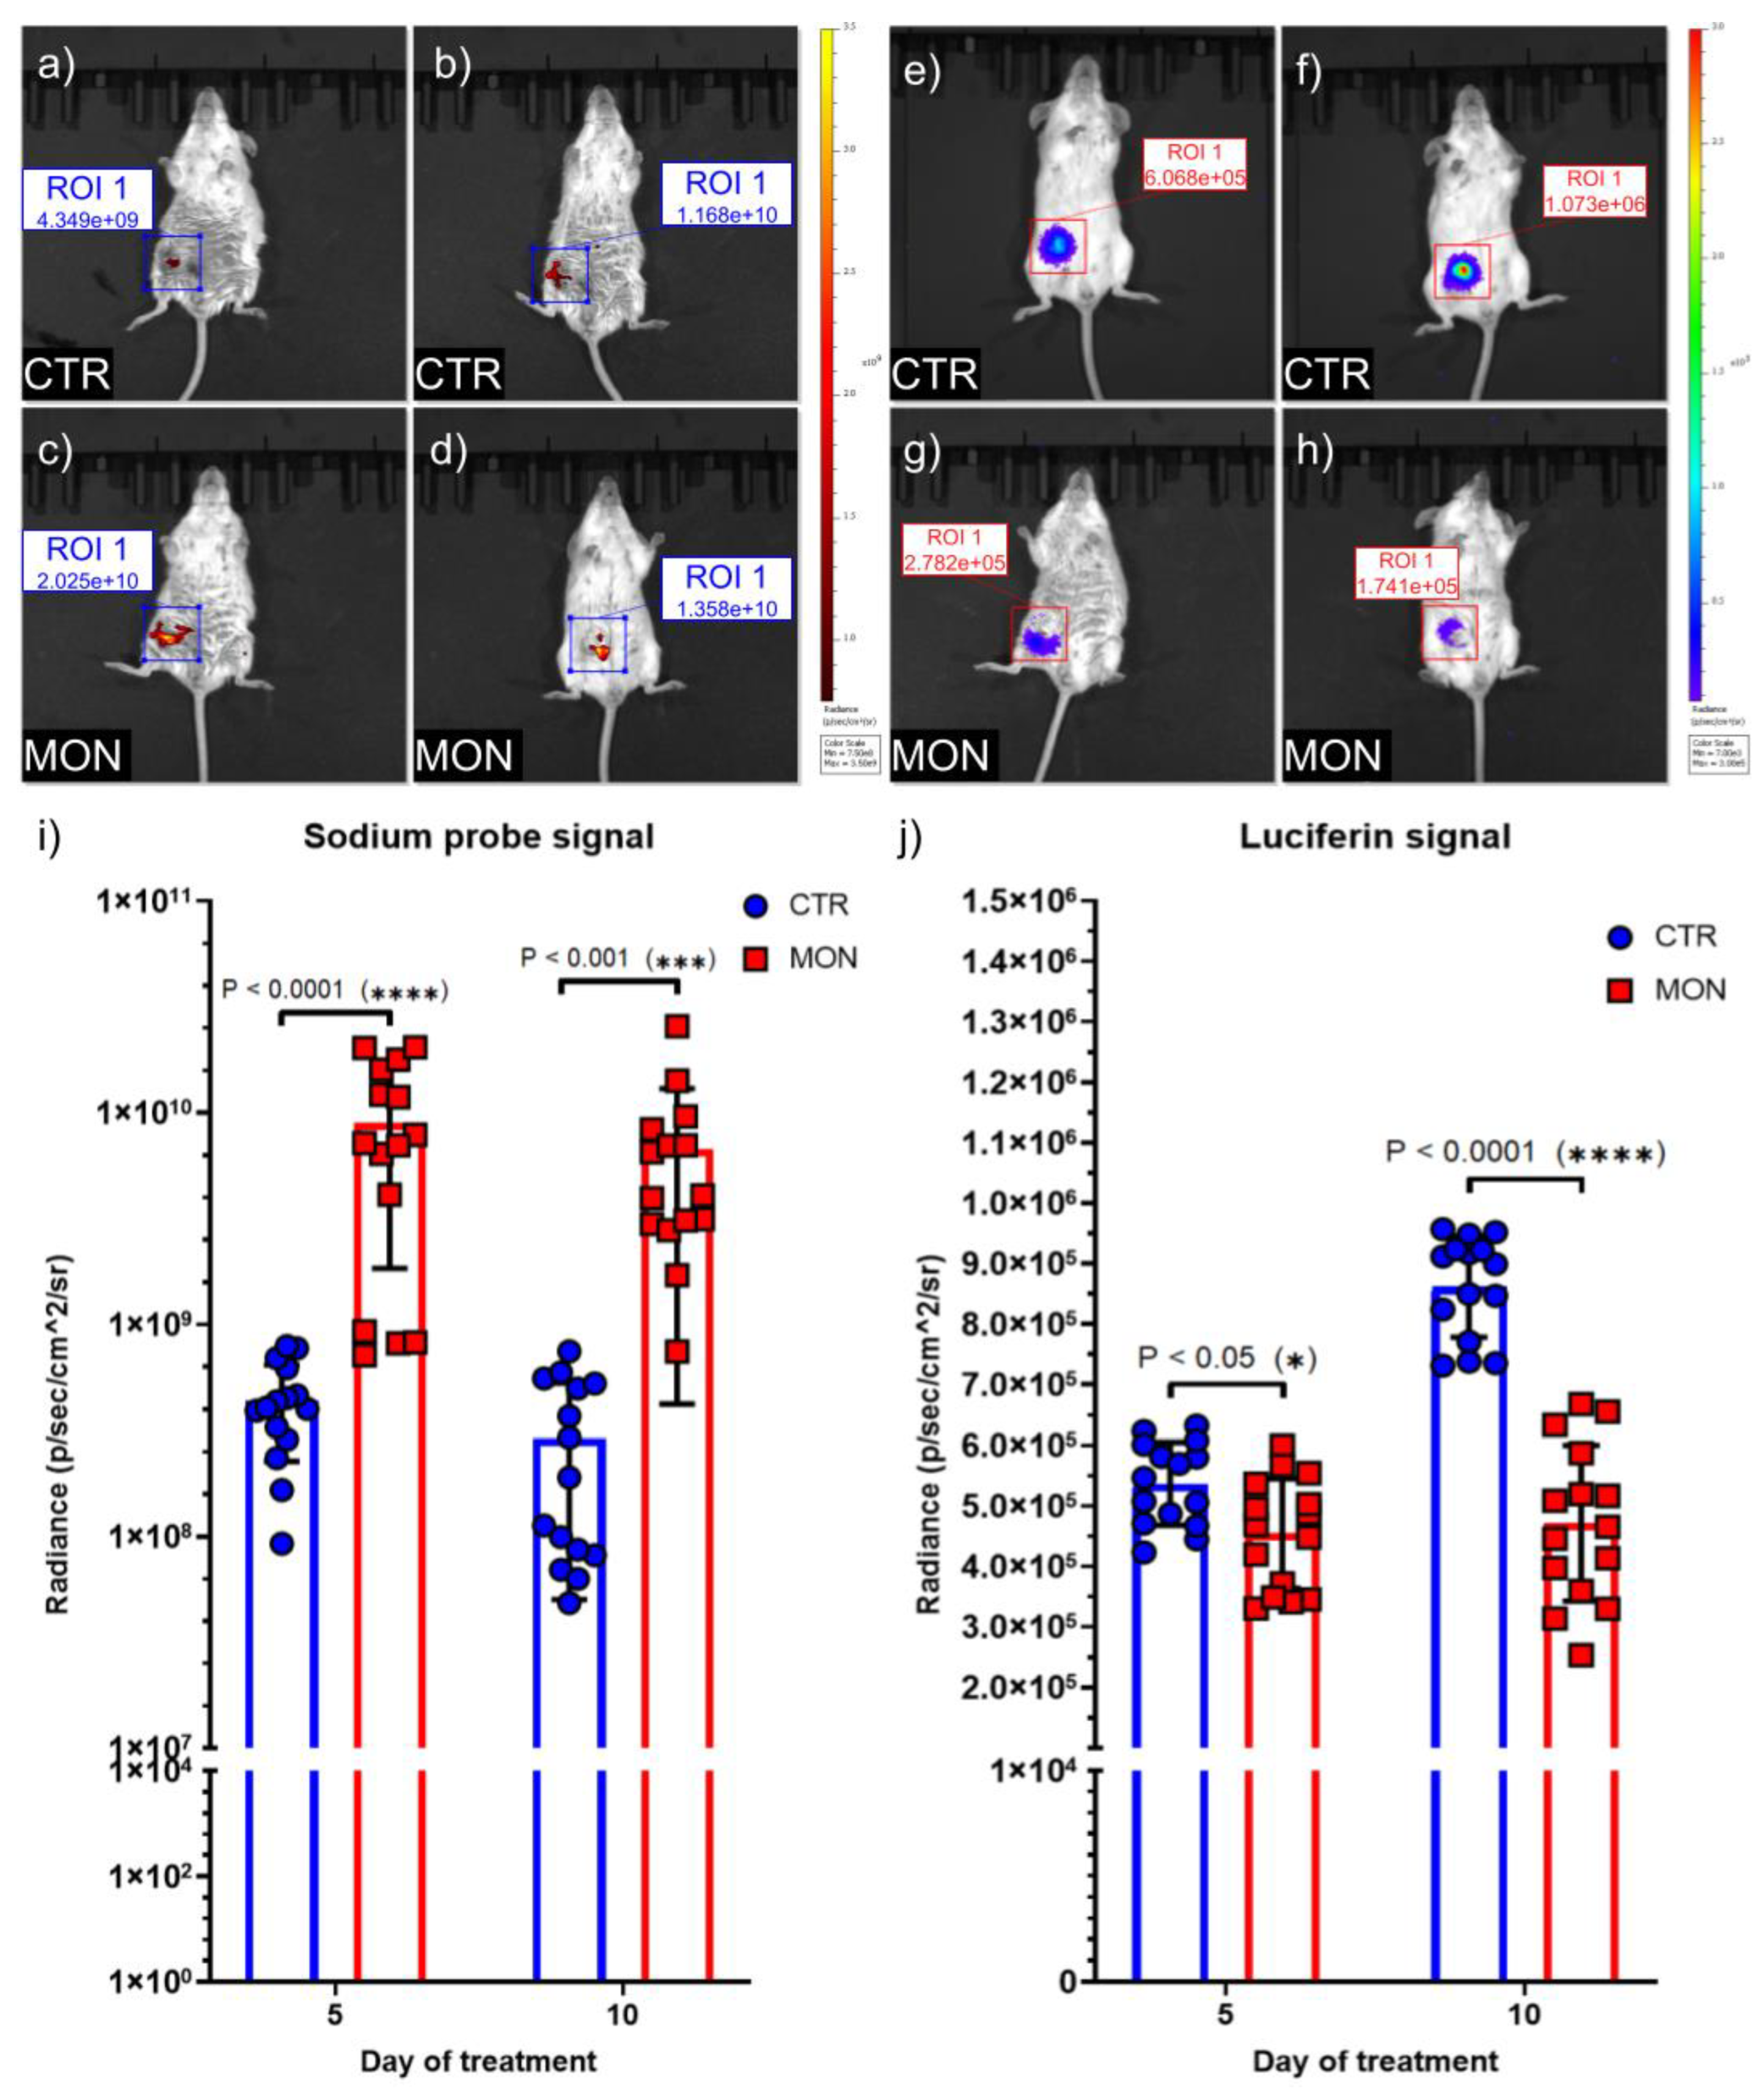
Bioluminescence imaging using IVIS® Spectrum was employed to monitor the distribution and development of the tumor cells. The IVISbrite™ D-Luciferin Ultra Bioluminescent Substrate in RediJect™ Solution (RediJect D-Luciferin Ultra K+ salt) was injected i.p. following the guidelines of the producer (150 mg/kg). Photon flux from the tumor is proportional to the number of live cells expressing luciferase so bioluminescence correlates directly with tumor size. Decrease of bioluminescence signals corresponds to necrotic areas.
The fluorescent cytosolic Na+ indicator CoroNa™ Green, AM was employed to assess the Na+ content in tumor and healthy tissues. The mice were injected right before the acquisition, with a solution (100 μL) made of the intracellular Na+-fluorescent dye (67 μM) in NaCl 0.9% with BSA (4%) and Pluronic acid (0.02%). Intracellular Na+ variations upon Monensin treatment were monitored through the IVIS® Spectrum in vivo imaging system set at 500 nm excitation and at 540 nm emission wavelengths.
2.8. Histology and Immunohistochemistry
Mouse tissues were routinely paraffin embedded and formalin fixed. Bone marrow (BM) samples were decalcified for 8 h using an EDTA-based decalcifying solution, washed in flowing water (1 h), and subsequently processed and embedded in paraffin. Four-micron-thick sections were deparaffinized, rehydrated, and stained with hematoxylin and eosin for histopathologic analyses or with anti-Ki-67 (1:250, Ventana® Medical Systems, Roche, Monza, Italy) to evaluate cell proliferation by using an automated immunostainer (Ventana, Roche, Monza, Italy). Slide images were acquired with the slide scanner ZEISS Axioscan 7; Objective: Plan-Apochromat 40x/0,95 corr M27; Camera: ZEISS Axiocam 705 color. The Ki-67 and cell-detection, to quantify cell density (evaluated as cells/mm2) and size (evaluated as EQPC: diameter of a circle of equal projection area of the cell), was conducted using respectively QuPath’s built-in “Positive cell detection” and “Cell detection”. Software version: QuPath-0.5.1.
2.9. Statistics and Reproducibility
Each experiment was repeated independently at least three times. Results are presented as the mean of three-eight independent experiments ± standard deviation. Statistical significance between two groups was determined by ordinary two-way ANOVA with Sidak’s multiple comparisons test, with individual variances computed for each comparison. Significance was established at the 5% level. P < 0.05 was considered statistically significant (*P < 0.05, **P < 0.01, ***P < 0.001, ****P<0.0001). GraphPad Prism v.8.4.3 (GraphPad Software, San Diego, CA, USA) was used for statistical analyses.
4. Discussion
The present study investigated in cellular and mice models of TNBC, the anticancer effects of Monensin in relation to its capacity to induce a specific and cytotoxic increase of intracellular sodium in TNBC cells.
Our results demonstrated by living cell imaging analysis that Monensin induces an early increase of intracellular sodium that precedes TNBC cell death. We also showed that the prevention of this alteration, by maintaining the cells in sodium-free medium, also protects TNBC cell death induced by Monensin. These in vitro observations demonstrated that the cytotoxic action of Monensin on TNBC cells was directly related to its activity of sodium ionophore and was dependent by the induction of an increase of sodium in the cancerous cells.
We further investigated in the in vivo model of TNBC the activity of Monensin and evidenced that mice systemic treatment with Monensin induced shrinkage of TNBC mass and increased intracellular sodium content in only cancer tissue.
We monitored TNBC development and sodium variations by in vivo imaging of luciferase-targeted TNBC cells and cellular sodium employing bioluminescent (luciferine) and fluorescent (Corona-Green-AM) dyes that need intracellular processing by living cells for visualization.
Evaluation of tumor growth by
in vivo imaging systems is a generally employed methodology [
29] that allows the not-invasive assessment of cancer development. We here contextually performed the
in vivo analysis of tissue sodium level by administration of the sodium fluorescent dye Corona-Green-AM. This procedure allows the actual
in vivo evaluation of the changes of the
cellular sodium level that cannot be achieved by the available methods of
in vivo or
ex vivo sodium measurements . These methods (i.e.
23Na MRI and ICP-MS analysis) can, in fact, directly measure sodium tissue content but without discriminating its changes among intra- or extracellular compartments.
The results obtained were consistent to what evidenced
in vitro with TNBC and HCC cells [
9], demonstrating, for the first time in
in vivo, that the ionophore Monensin increased sodium content of TNBC cells before appearance of cell death and also showing that sodium increase was associated to a reduction of TNBC expansion. Our
in vivo analysis also confirmed what indicated by the
23Na MRI studies of human breast cancer [
15,
16,
17,
18,
19,
20], evidencing that TNBC cells displayed a higher basal sodium intracellular content compared to untransformed cells and additionally showing that treatment with Monensin enhanced sodium content but only in TNBC cells.
This indicated that unlike healthy cells, cancerous TNBC cells were unable to compensate for the sodium load induced by monensin treatment and were, consequently, selectively exposed to the sodium-dependent cytotoxic action of Monensin demonstrated by the in vitro experiments.
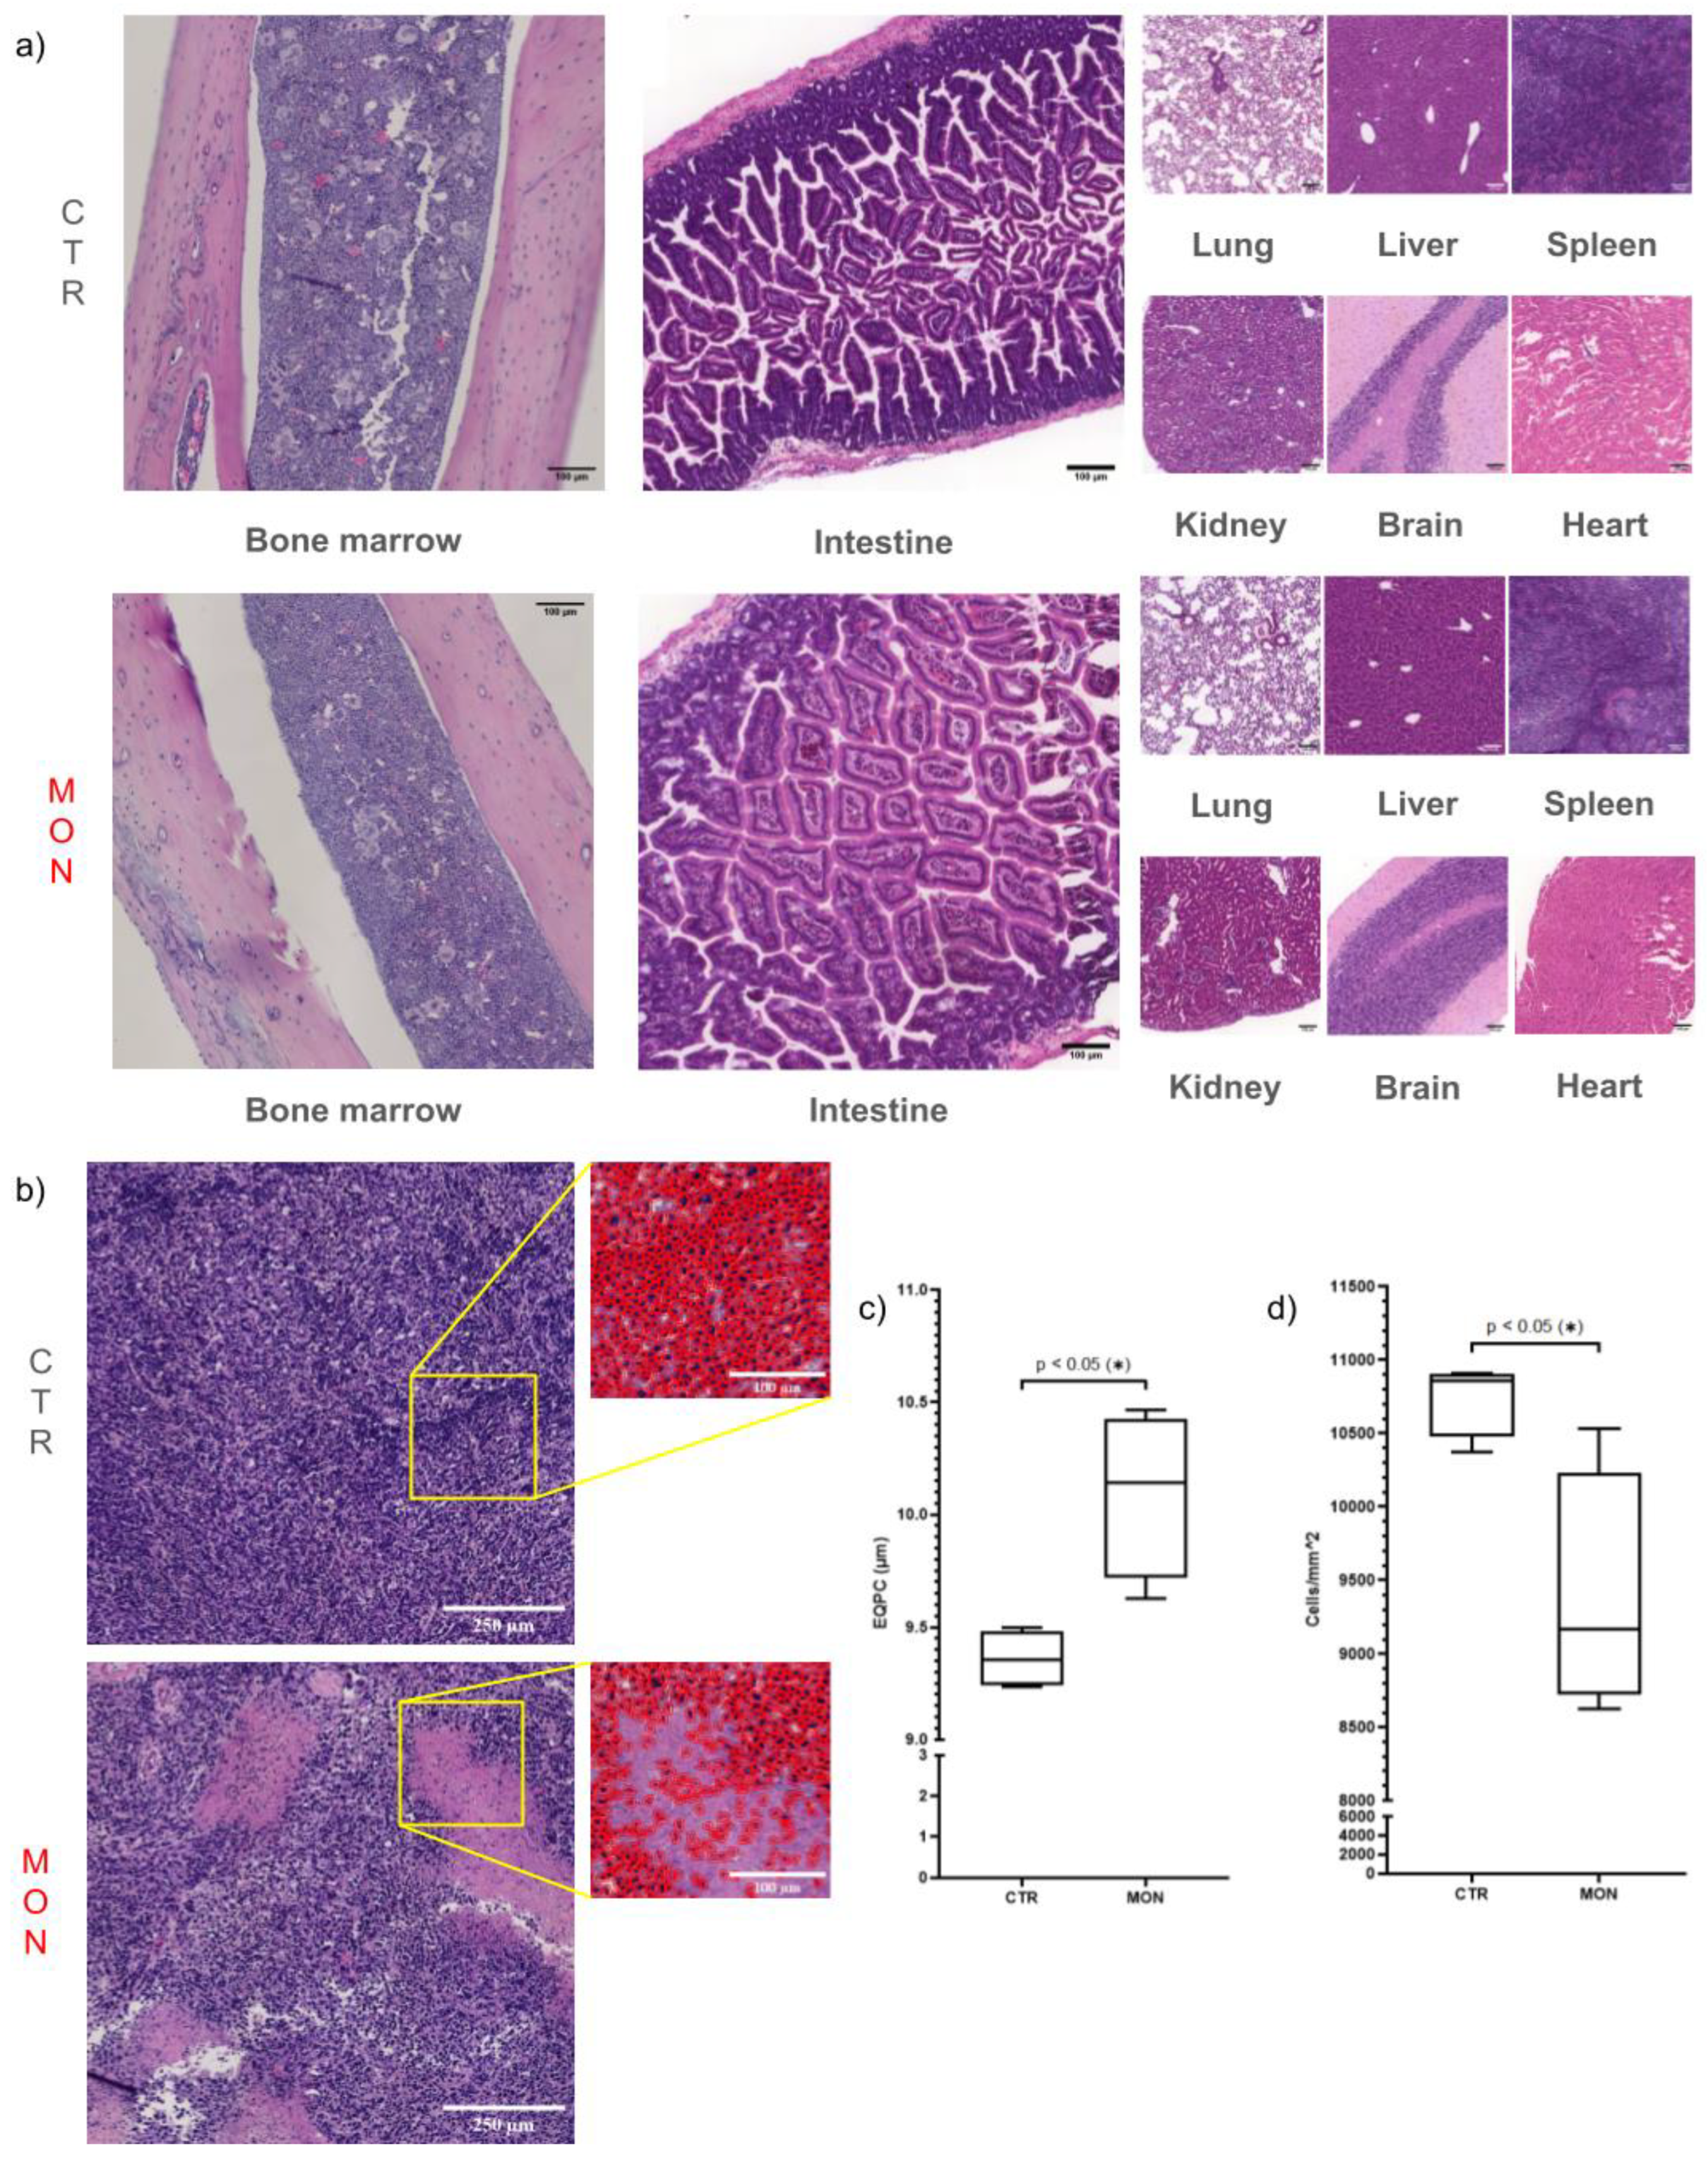
Accordingly, our histological analysis evidenced that Monensin treatment did not produce morphologic damage of healthy vital organs such as liver, lung, spleen, kidney, heart and brain. By contrast TNBC inhibition induced by Monensin was associated with the appearance of large necrotic areas in the tumor and with the swelling of the tumor cells. This latter observation is consistent to what previously reported studying the final alterations leading to death of primary hepatocytes: we showed that in the condition of mitochondrial dysfunction, the irreversible increase of intracellular sodium caused deregulation of the cell volume decrease mechanisms with imbalance of intracellular osmotic pressure and consequent loss of plasma membrane integrity[
10,
12].
Moreover, with HCC cells [
9], we demonstrated that Monensin caused a sodium dependent increase of intracellular water retention (k
io) and induced an increase of size of the HCC cells in the tumor [
9]. In this regard, it is noteworthy to outline, that MRI14,15 and Fast-Field-Cycling Nuclear Magnetic Resonance (NMR) relaxometry studies performed in human tumors [
30,
31,
32] evidenced a significantly enhanced k
io of cancer cells that was indicative of an enhanced intracellular osmotic pressure in tumors.
Our results on the effects of Monensin in the HCC e TNBC mice models together to the demonstration in human cancers of the enhanced sodium content [
15,
16,
17,
18,
19,
20] and of the osmotic-driven increase of intracellular water [
30,
31,
32], support the hypothesis that treatment with sodium ionophores could critically exacerbate these conditions thus possibly leading to a selective TNBC cell killing by sodium-dependent osmotic lysis.
This hypothesis implies that the anti-tumor effect of monensin is primarily attributable to a specific cytotoxic action on tumor tissue and not to a cytostatic effect on rapidly proliferating tissues as generally produced by standard chemotherapy [
27]. Indeed in our previous study with the allogenic model of HCC, Monensins did not show to affect the proliferating activity in either transformed or healthy tissues. Such observation was not expected, since several
in vitro studies had previously associated the anti-cancer activity of Monensin to its inhibitory effects on pro-proliferative pathways [
21,
22,
23,
24].
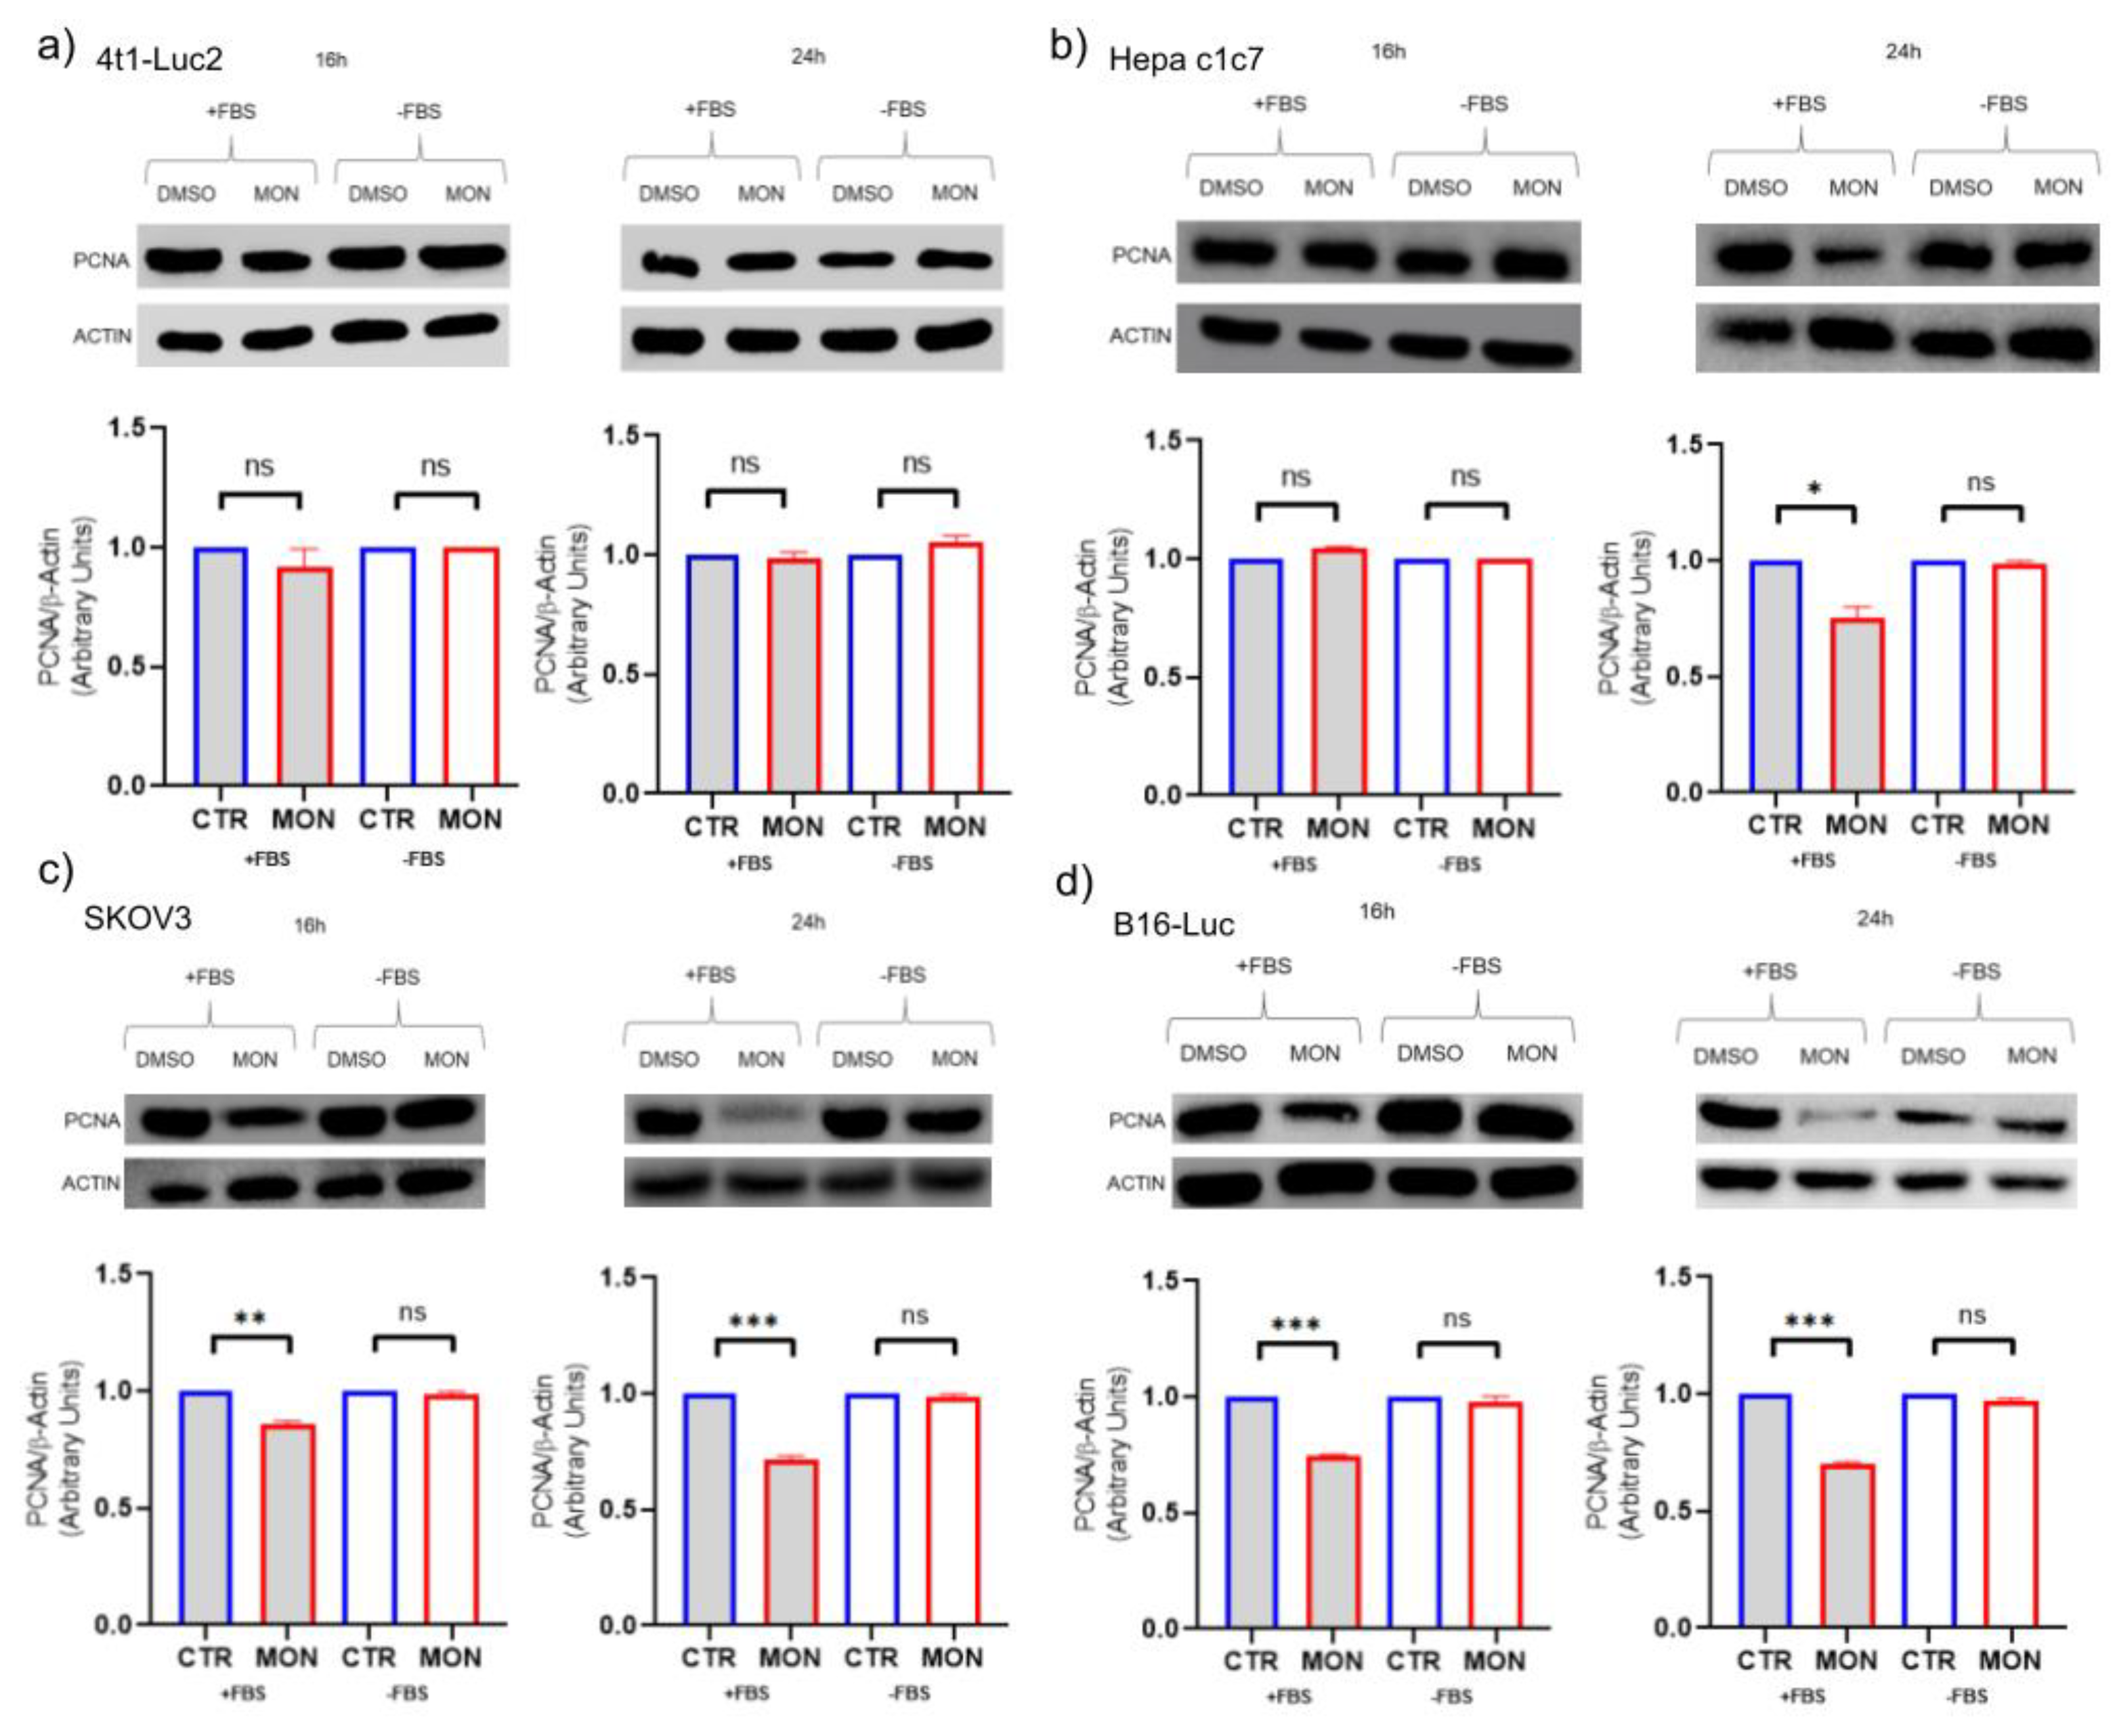
These studies, however, investigated the anti-cancer properties of Monensin in extrahepatic tumor cell lines, thus the lack of cytostatic activity in HCC could be related to the specific cancer cell type (C1C7 cells) employed in the research. In order to further investigate this issue, in the present study we evaluated the effects on monensin on the expression of the proliferative marker PCNA employing 4T1 cells in comparison with HCC cells (C1C7), ovarian carcinoma cells SKOV-3 and melanoma cells (B16) incubated during the treatment phase in the presence or absence of 10% fetal serum. The treatment in the absence of serum, also employed in all previous analysis on the cytotoxic and sodium-dependent effect of Monensin with both 4T1 and C1C7 cells [
9], was chosen as it was considered more compliant with reproducing "in vivo" conditions [
9]. The cells of solid tumors such as breast cancer, HCC, ovarian carcinoma and melanoma are, in fact, not directly exposed, except theoretically or in minimal quantity, to the serum proteins or with serum itself [
28]..
Treatment with monensin in the presence of serum was instead used to reproduce the experimental conditions described in the literature for the analysis of the anti-cancer activity of monensin with various types of tumor cells, including SKOV-3 and B16 cells [
21,
22,
23,
24,
25]. The results obtained showed substantial differences depending on the conditions used. Treatment with monensin in the absence of serum did not produce changes in the levels of the proliferation marker PCNA in either C1C7, SKOV-3, B16 or 4T1 cells. On the contrary, treatment with monensin in the presence of serum induced a reduction in the levels of the proliferation marker with all the cell types employed except with 4T1 cells. These data are in substantial agreement with the observations present in the literature which reported the ability of monensin to inhibit pro-proliferative pathways such as those mediated by the activation of EGF-R, Wnt/β-catenin signaling [
22,
23]. It is therefore conceivable that monensin can produce "in vitro" a cytostatic effect but only in conditions in which it is supported, amplified and maintained by exogenous pro-proliferative stimuli such as those present in fetal serum [
28] . In the absence of these stimuli, however, monensin does not show any effects on the intrinsic proliferative capacity of either C1C7, SKOV-3 or B16 cells. As regard TNBC 4T1 cells, monensin did not affect PCNA expression even in presence of serum. The antiproliferative effects of monensin was not previously reported in 4T1 cells but only in MCF-7 and MCF-10A breast cancer cells [
25] where was limited to the observation of a decreased in colony formation induced by the ionophore, an effect that can be also ascribed to a direct toxic action of the ionophore and that we could also visualize in our model (
Figure 2d ).
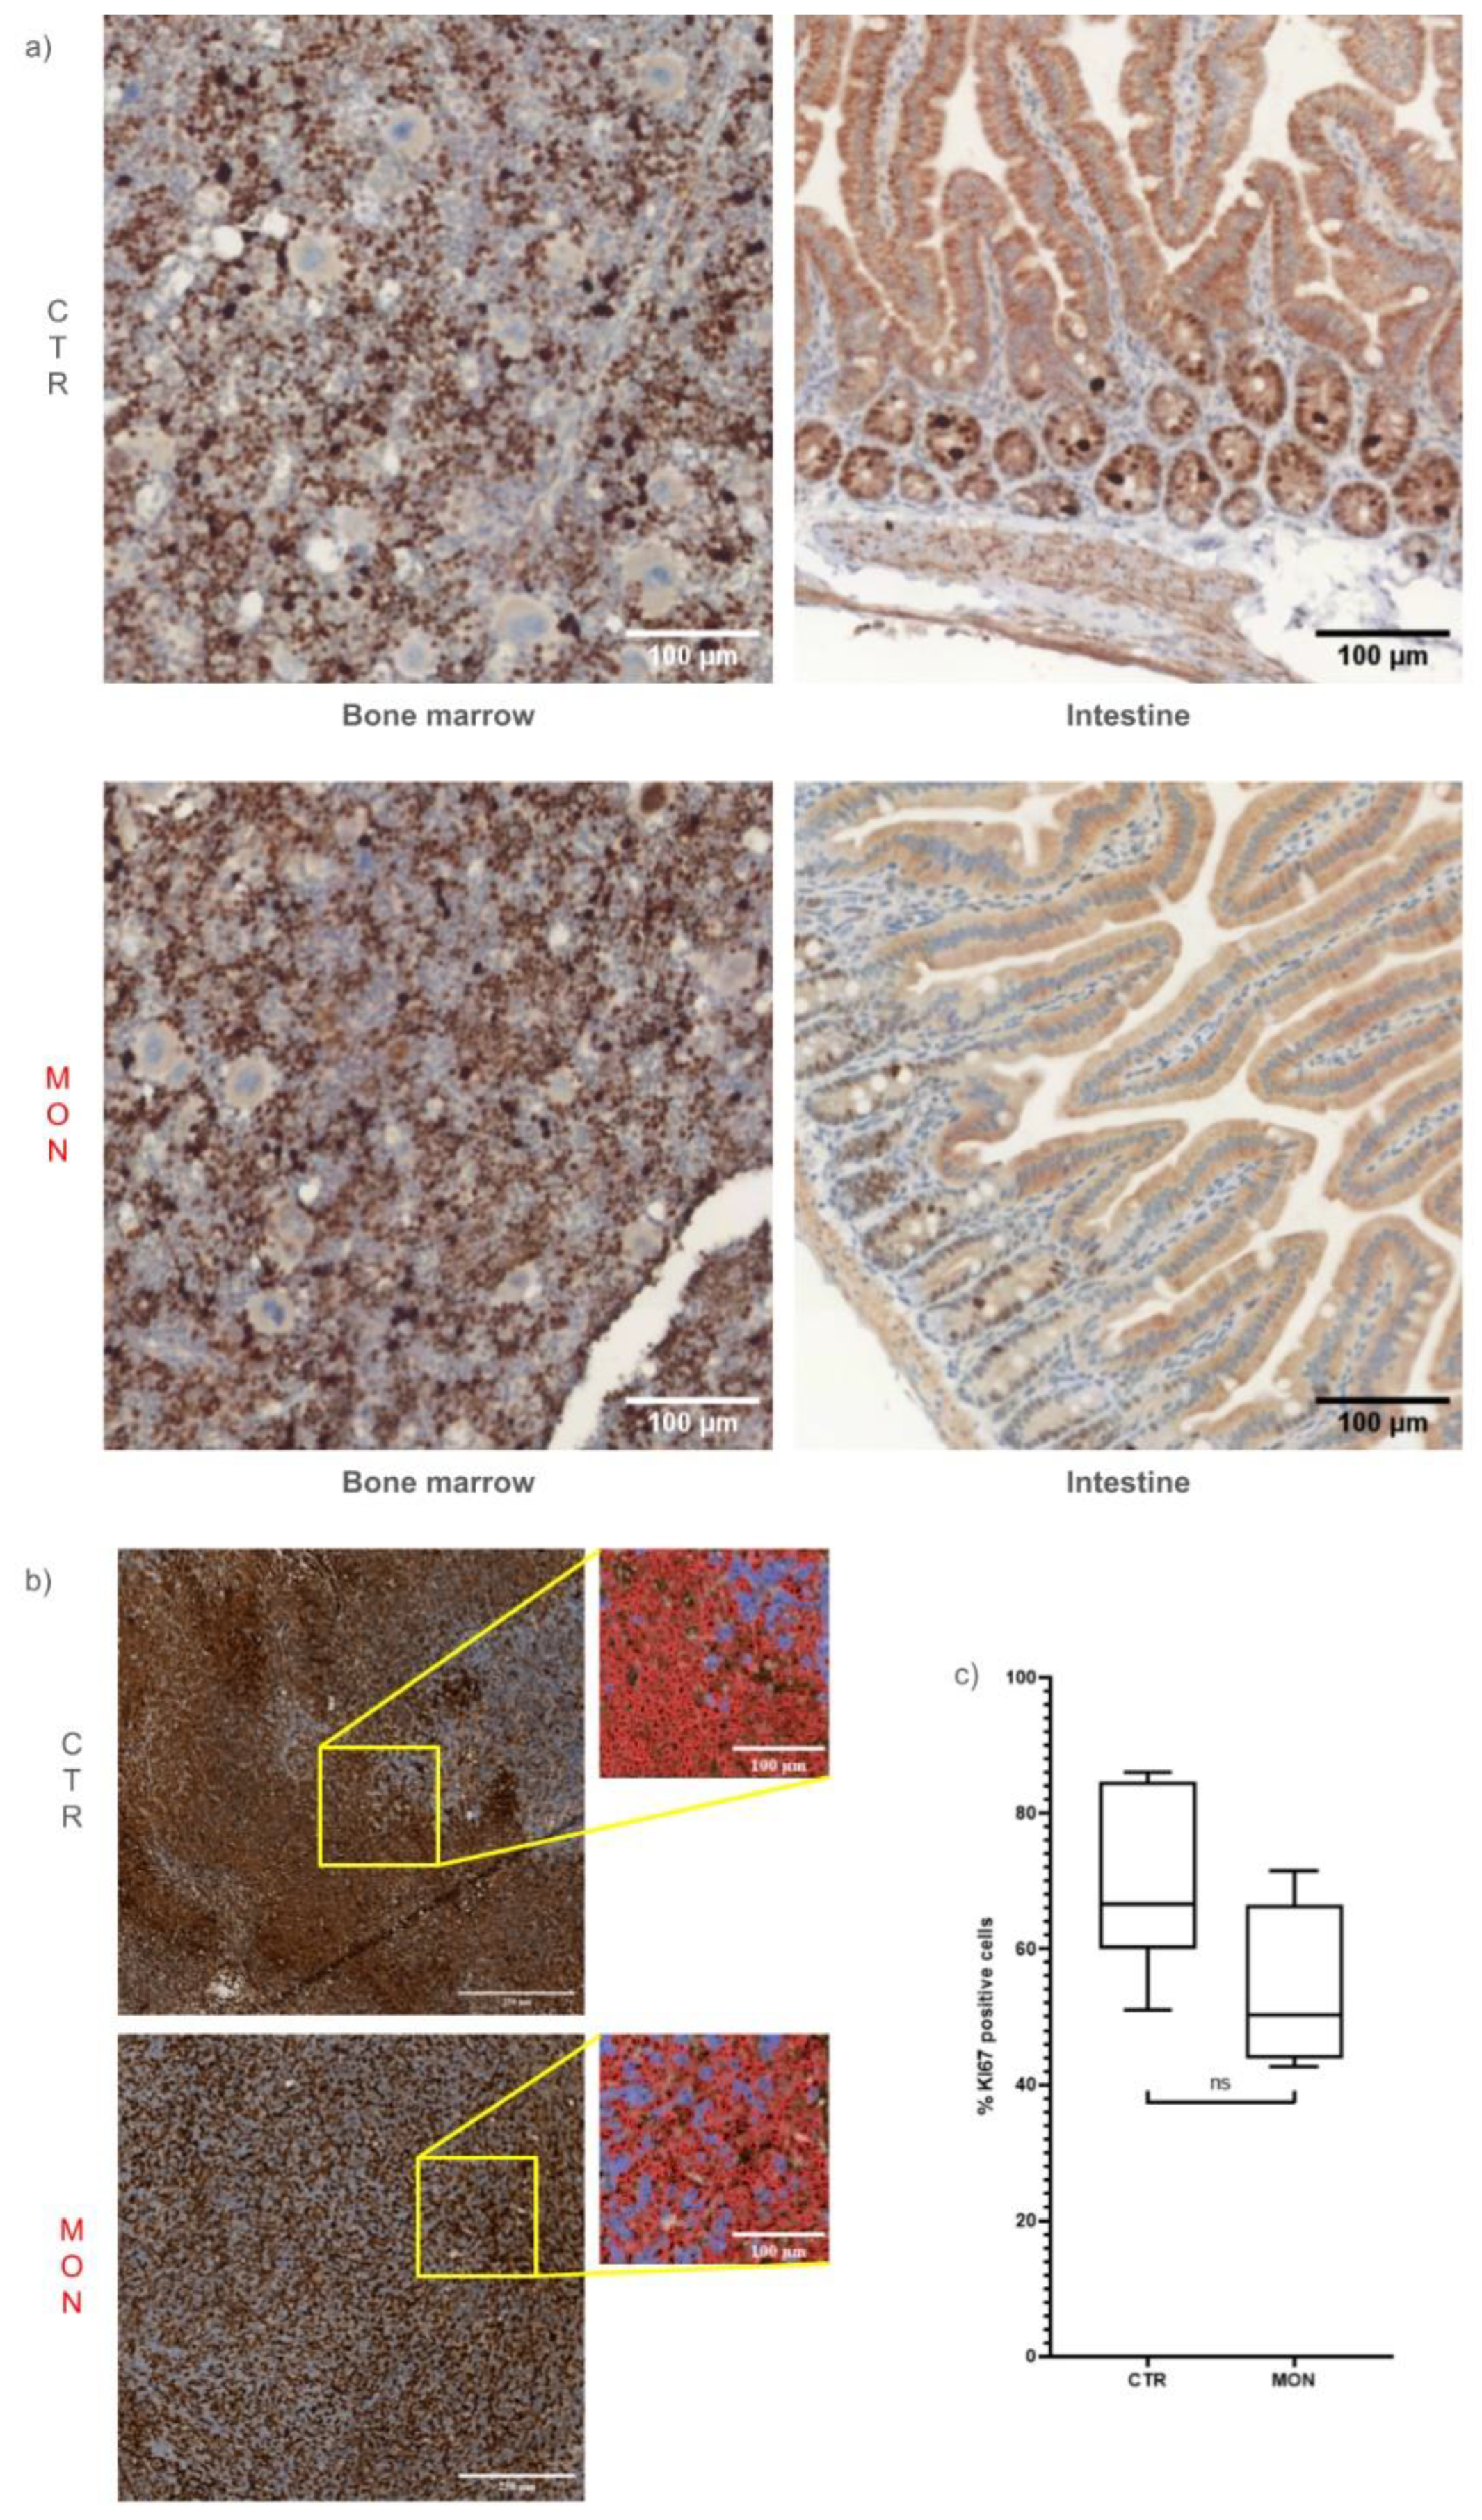
The in vivo analysis of the effect of monensin on tissue proliferating activity confirmed the lack of cytostatic effect of monensin both on the tumor and on normal proliferating tissues such as the bone marrow and intestinal mucosa. These data are of particular interest as they support the experimental hypothesis according to which monensin exerts its antitumor effect in TNBC in the absence of a cytostatic action.
The standard chemotherapy therapies currently employed for TNBC patients have the unavoidable effect of interfering with physiological signaling pathways and/or inhibiting the necessary cell turnover in normal proliferating tissues. This causes side effects that accentuate and amplify the morbidity conditions of TNBC patients. In particular, the cytostatic effect of the standard anti-TNBC therapies is the main cause of the wide spectrum of adverse reactions that cancer patients experience during and following therapeutic treatments responsible for serious symptoms such as diarrhea, nausea, vomiting and decline in immune defenses [
27]. The results presented in this study indicate that monensin is able to produce in mice an effective anti-TNBC effect inducing a cancer specific and sodium-dependent cytotoxic action while not altering the proliferative capacity of the tumor itself and the structural and functional integrity of healthy proliferating tissues such as the intestinal mucosa and the hematopoietic marrow. These observations point out the importance of studies on ionophoric molecules for the development of safe and innovative anti-TNBC therapies and strengthen the interest in the development of studies, that are currently only preclinical, on the use of sodium ionophores for the clinical treatment of TNBC and solid tumors in general.
Author Contributions
Conceptualization, R.C. ; methodology, R.C. and N.C.; software, S.F. and F.T.; validation, R.C., N.C. R.B.; formal analysis, S.F, N.C., T.T.. and F.T.; investigation, R.C.; resources, R.C.; data curation, S.F., F.T. and T.T.; writing—original draft preparation, R.C.; writing—review and editing, R.C., S.F. and F.T.; visualization, R.C., S.F. and F.T.; supervision, R.C.; project administration, R.C.; funding acquisition, R.C. All authors have read and agreed to the published version of the manuscript.
