Submitted:
06 December 2024
Posted:
06 December 2024
You are already at the latest version
Abstract
Photoinduced charge separation at donor-acceptor composites (active layer material of organic solar cells) is an important step of photoelectric energy conversion. It results in formation of the interfacial charge-transfer state (CTS), which is Coulombically bound electron-hole pair. We developed the mathematical procedure of direct quantification of the electron-hole distance on the basis of time-domain pulse electron paramagnetic resonance data, obtained in electron spin echo (ESE) experiment. For an ensemble of CTSs characterized by distribution of electron-hole distance this procedure derives the average electron-hole distance without numerical simulation of the experimental data, which is a superposition of the oscillating functions, corresponding to CTSs with the certain electron-hole distance. This procedure was tested on model distance distributions, yielding very accurate results. The data for highly efficient organic photovoltaic composite PM6/Y6 were also analyzed; the average electron-hole distance within the CTS and its dependence on temperature were determined. This procedure can be useful for tracing small changes in CTS structure during optimization of the donor-acceptor composite morphology, which is tightly related to photovoltaic efficiency of the composite.
Keywords:
1. Introduction
2. Theory
2.1. The Dipolar Modulation Signal and the Mellin Integral Transformation
2.2. Testing the Procedure of the Average Distance Calculation on Model Distance Distributions
3. Experimental
4. Results and Discussion
4.1. Calculation of the Average Electron-Hole Distance for CTS in Real Donor/Acceptor Composites
4.2. Expression for the Error of the Average Electron-Hole Distance
| a, a. u. | b, a. u. | c, a. u. | d, ns | |
| 30K | -28292.51201 | 1.25477∙106 | 0.82575 | 710 |
| 80K | -4.53786∙106 | 7.20244∙107 | 0.18572 | 15 |
5. Conclusions
Author Contributions
Funding
Data Availability Statement
Acknowledgments
Conflicts of Interest
References
- B.C. Thompson, J.M.J. Fréchet, Polymer–Fullerene Composite Solar Cells, Angew. Chem. Int. Ed. 47 (2008) 58–77. [CrossRef]
- C. Deibel, V. Dyakonov, Polymer–fullerene bulk heterojunction solar cells, Rep. Prog. Phys. 73 (2010) 096401. [CrossRef]
- E.S. Kobeleva, M.N. Uvarov, N.V. Kravets, A.V. Kulikova, V.A. Zinovyev, O.A. Gurova, V.I. Sysoev, A.M. Kondranova, M.S. Kazantsev, K.M. Degtyarenko, A.G. Matveeva, L.V. Kulik, Ternary Composite of Polymer, Fullerene and Fluorinated Multi-Walled Carbon Nanotubes as the Active Layer of Organic Solar Cells, J. Compos. Sci. 8 (2023) 3. [CrossRef]
- K. Fukuda, K. Yu, T. Someya, The Future of Flexible Organic Solar Cells, Advanced Energy Materials 10 (2020) 2000765. [CrossRef]
- Y. Li, W. Huang, D. Zhao, L. Wang, Z. Jiao, Q. Huang, P. Wang, M. Sun, G. Yuan, Recent Progress in Organic Solar Cells: A Review on Materials from Acceptor to Donor, Molecules 27 (2022) 1800. [CrossRef]
- S. Lee, D. Jeong, C. Kim, C. Lee, H. Kang, H.Y. Woo, B.J. Kim, Eco-Friendly Polymer Solar Cells: Advances in Green-Solvent Processing and Material Design, ACS Nano 14 (2020) 14493–14527. [CrossRef]
- M. Helgesen, R. Søndergaard, F.C. Krebs, Advanced materials and processes for polymer solar cell devices, J. Mater. Chem. 20 (2010) 36–60. [CrossRef]
- M. Jørgensen, K. Norrman, S.A. Gevorgyan, T. Tromholt, B. Andreasen, F.C. Krebs, Stability of Polymer Solar Cells, Advanced Materials 24 (2012) 580–612. [CrossRef]
- G. Li, R. Zhu, Y. Yang, Polymer solar cells, Nature Photon 6 (2012) 153–161. [CrossRef]
- A.V. Mumyatov, P.A. Troshin, A Review on Fullerene Derivatives with Reduced Electron Affinity as Acceptor Materials for Organic Solar Cells, Energies 16 (2023) 1924. [CrossRef]
- C. Yan, S. Barlow, Z. Wang, H. Yan, A.K.-Y. Jen, S.R. Marder, X. Zhan, Non-fullerene acceptors for organic solar cells, Nat Rev Mater 3 (2018) 18003. [CrossRef]
- J. Hou, O. Inganäs, R.H. Friend, F. Gao, Organic solar cells based on non-fullerene acceptors, Nat. Mater. 17 (2018) 119–128. [CrossRef]
- A.J. Heeger, 25th Anniversary Article: Bulk Heterojunction Solar Cells: Understanding the Mechanism of Operation, Advanced Materials 26 (2014) 10–28. [CrossRef]
- Y. Jiang, S. Sun, R. Xu, F. Liu, X. Miao, G. Ran, K. Liu, Y. Yi, W. Zhang, X. Zhu, Non-fullerene acceptor with asymmetric structure and phenyl-substituted alkyl side chain for 20.2% efficiency organic solar cells, Nat Energy 9 (2024) 975–986. [CrossRef]
- Y. Tamai, Charge generation in organic solar cells: Journey toward 20% power conversion efficiency: Special Issue: Emerging Investigators, Aggregate 3 (2022). [CrossRef]
- C. Deibel, T. Strobel, V. Dyakonov, Role of the Charge Transfer State in Organic Donor-Acceptor Solar Cells, Adv. Mater. 22 (2010) 4097–4111. [CrossRef]
- T.M. Burke, S. Sweetnam, K. Vandewal, M.D. McGehee, Beyond Langevin Recombination: How Equilibrium Between Free Carriers and Charge Transfer States Determines the Open-Circuit Voltage of Organic Solar Cells, Advanced Energy Materials 5 (2015) 1500123. [CrossRef]
- M. Causa’, J. De Jonghe-Risse, M. Scarongella, J.C. Brauer, E. Buchaca-Domingo, J.-E. Moser, N. Stingelin, N. Banerji, The fate of electron–hole pairs in polymer:fullerene blends for organic photovoltaics, Nat Commun 7 (2016) 12556. [CrossRef]
- M. Casalegno, R. Pastore, J. Idé, R. Po, G. Raos, Origin of Charge Separation at Organic Photovoltaic Heterojunctions: A Mesoscale Quantum Mechanical View, J. Phys. Chem. C 121 (2017) 16693–16701. [CrossRef]
- S.H. Park, A. Roy, S. Beaupré, S. Cho, N. Coates, J.S. Moon, D. Moses, M. Leclerc, K. Lee, A.J. Heeger, Bulk heterojunction solar cells with internal quantum efficiency approaching 100%, Nature Photon 3 (2009) 297–302. [CrossRef]
- C. Göhler, C. Deibel, The Role of Dynamic and Static Disorder for Charge-Transfer States in Organic Bulk Heterojunction Solar Cells, ACS Energy Lett. 7 (2022) 2156–2164. [CrossRef]
- A.J. Barker, K. Chen, J.M. Hodgkiss, Distance Distributions of Photogenerated Charge Pairs in Organic Photovoltaic Cells, J. Am. Chem. Soc. 136 (2014) 12018–12026. [CrossRef]
- J. Niklas, O.G. Poluektov, Charge Transfer Processes in OPV Materials as Revealed by EPR Spectroscopy, Adv. Energy Mater. 7 (2017) 1602226. [CrossRef]
- E.A. Lukina, A.A. Popov, M.N. Uvarov, E.A. Suturina, E.J. Reijerse, L.V. Kulik, Light-induced charge separation in a P3HT/PC 70 BM composite as studied by out-of-phase electron spin echo spectroscopy, Phys. Chem. Chem. Phys. 18 (2016) 28585–28593. [CrossRef]
- E.A. Beletskaya, E.A. Lukina, M.N. Uvarov, A.A. Popov, L.V. Kulik, Geminate recombination in organic photovoltaic blend PCDTBT/PC 71 BM studied by out-of-phase electron spin echo spectroscopy, J. Chem. Phys. 152 (2020) 044706. [CrossRef]
- A.A. Popov, M.N. Uvarov, L.V. Kulik, Mode of action of the third component in ternary organic photovoltaic blend PBDB-T/ITIC:PC70BM revealed by EPR spectroscopy, Synthetic Metals 277 (2021) 116783. [CrossRef]
- M.N. Uvarov, E.S. Kobeleva, K.M. Degtyarenko, V.A. Zinovyev, A.A. Popov, E.A. Mostovich, L.V. Kulik, Fast Recombination of Charge-Transfer State in Organic Photovoltaic Composite of P3HT and Semiconducting Carbon Nanotubes Is the Reason for Its Poor Photovoltaic Performance, IJMS 24 (2023) 4098. [CrossRef]
- E.A. Lukina, A.V. Kulikova, M.N. Uvarov, A.A. Popov, M. Liu, Y. Zhang, L.V. Kulik, Structure of the Charge-Transfer State in PM6/Y6 and PM6/Y6:YT Composites Studied by Electron Spin Echo Technique, Nanomanufacturing 3 (2023) 123–134. [CrossRef]
- A.G. Matveeva, V.M. Nekrasov, A.G. Maryasov, Analytical solution of the PELDOR inverse problem using the integral Mellin transform, Phys. Chem. Chem. Phys. 19 (2017) 32381–32388. [CrossRef]
- A.G. Matveeva, V.N. Syryamina, V.M. Nekrasov, M.K. Bowman, Non-uniform sampling in pulse dipolar spectroscopy by EPR: the redistribution of noise and the optimization of data acquisition, Phys. Chem. Chem. Phys. 23 (2021) 10335–10346. [CrossRef]
- P. Polyanin, A.V. Manzhirov, Handbook of Integral Equations, 0 ed., Chapman and Hall/CRC, 2008. [CrossRef]
- L. Venkataramanan, T.M. Habashy, D.E. Freed, F.K. Gruber, Continuous moment estimation of CPMG data using Mellin transform, Journal of Magnetic Resonance 216 (2012) 43–52. [CrossRef]
- M.L. Kirk, D.A. Shultz, D.E. Stasiw, G.F. Lewis, G. Wang, C.L. Brannen, R.D. Sommer, P.D. Boyle, Superexchange Contributions to Distance Dependence of Electron Transfer/Transport: Exchange and Electronic Coupling in Oligo( para -Phenylene)- and Oligo(2,5-Thiophene)-Bridged Donor–Bridge–Acceptor Biradical Complexes, J. Am. Chem. Soc. 135 (2013) 17144–17154. [CrossRef]
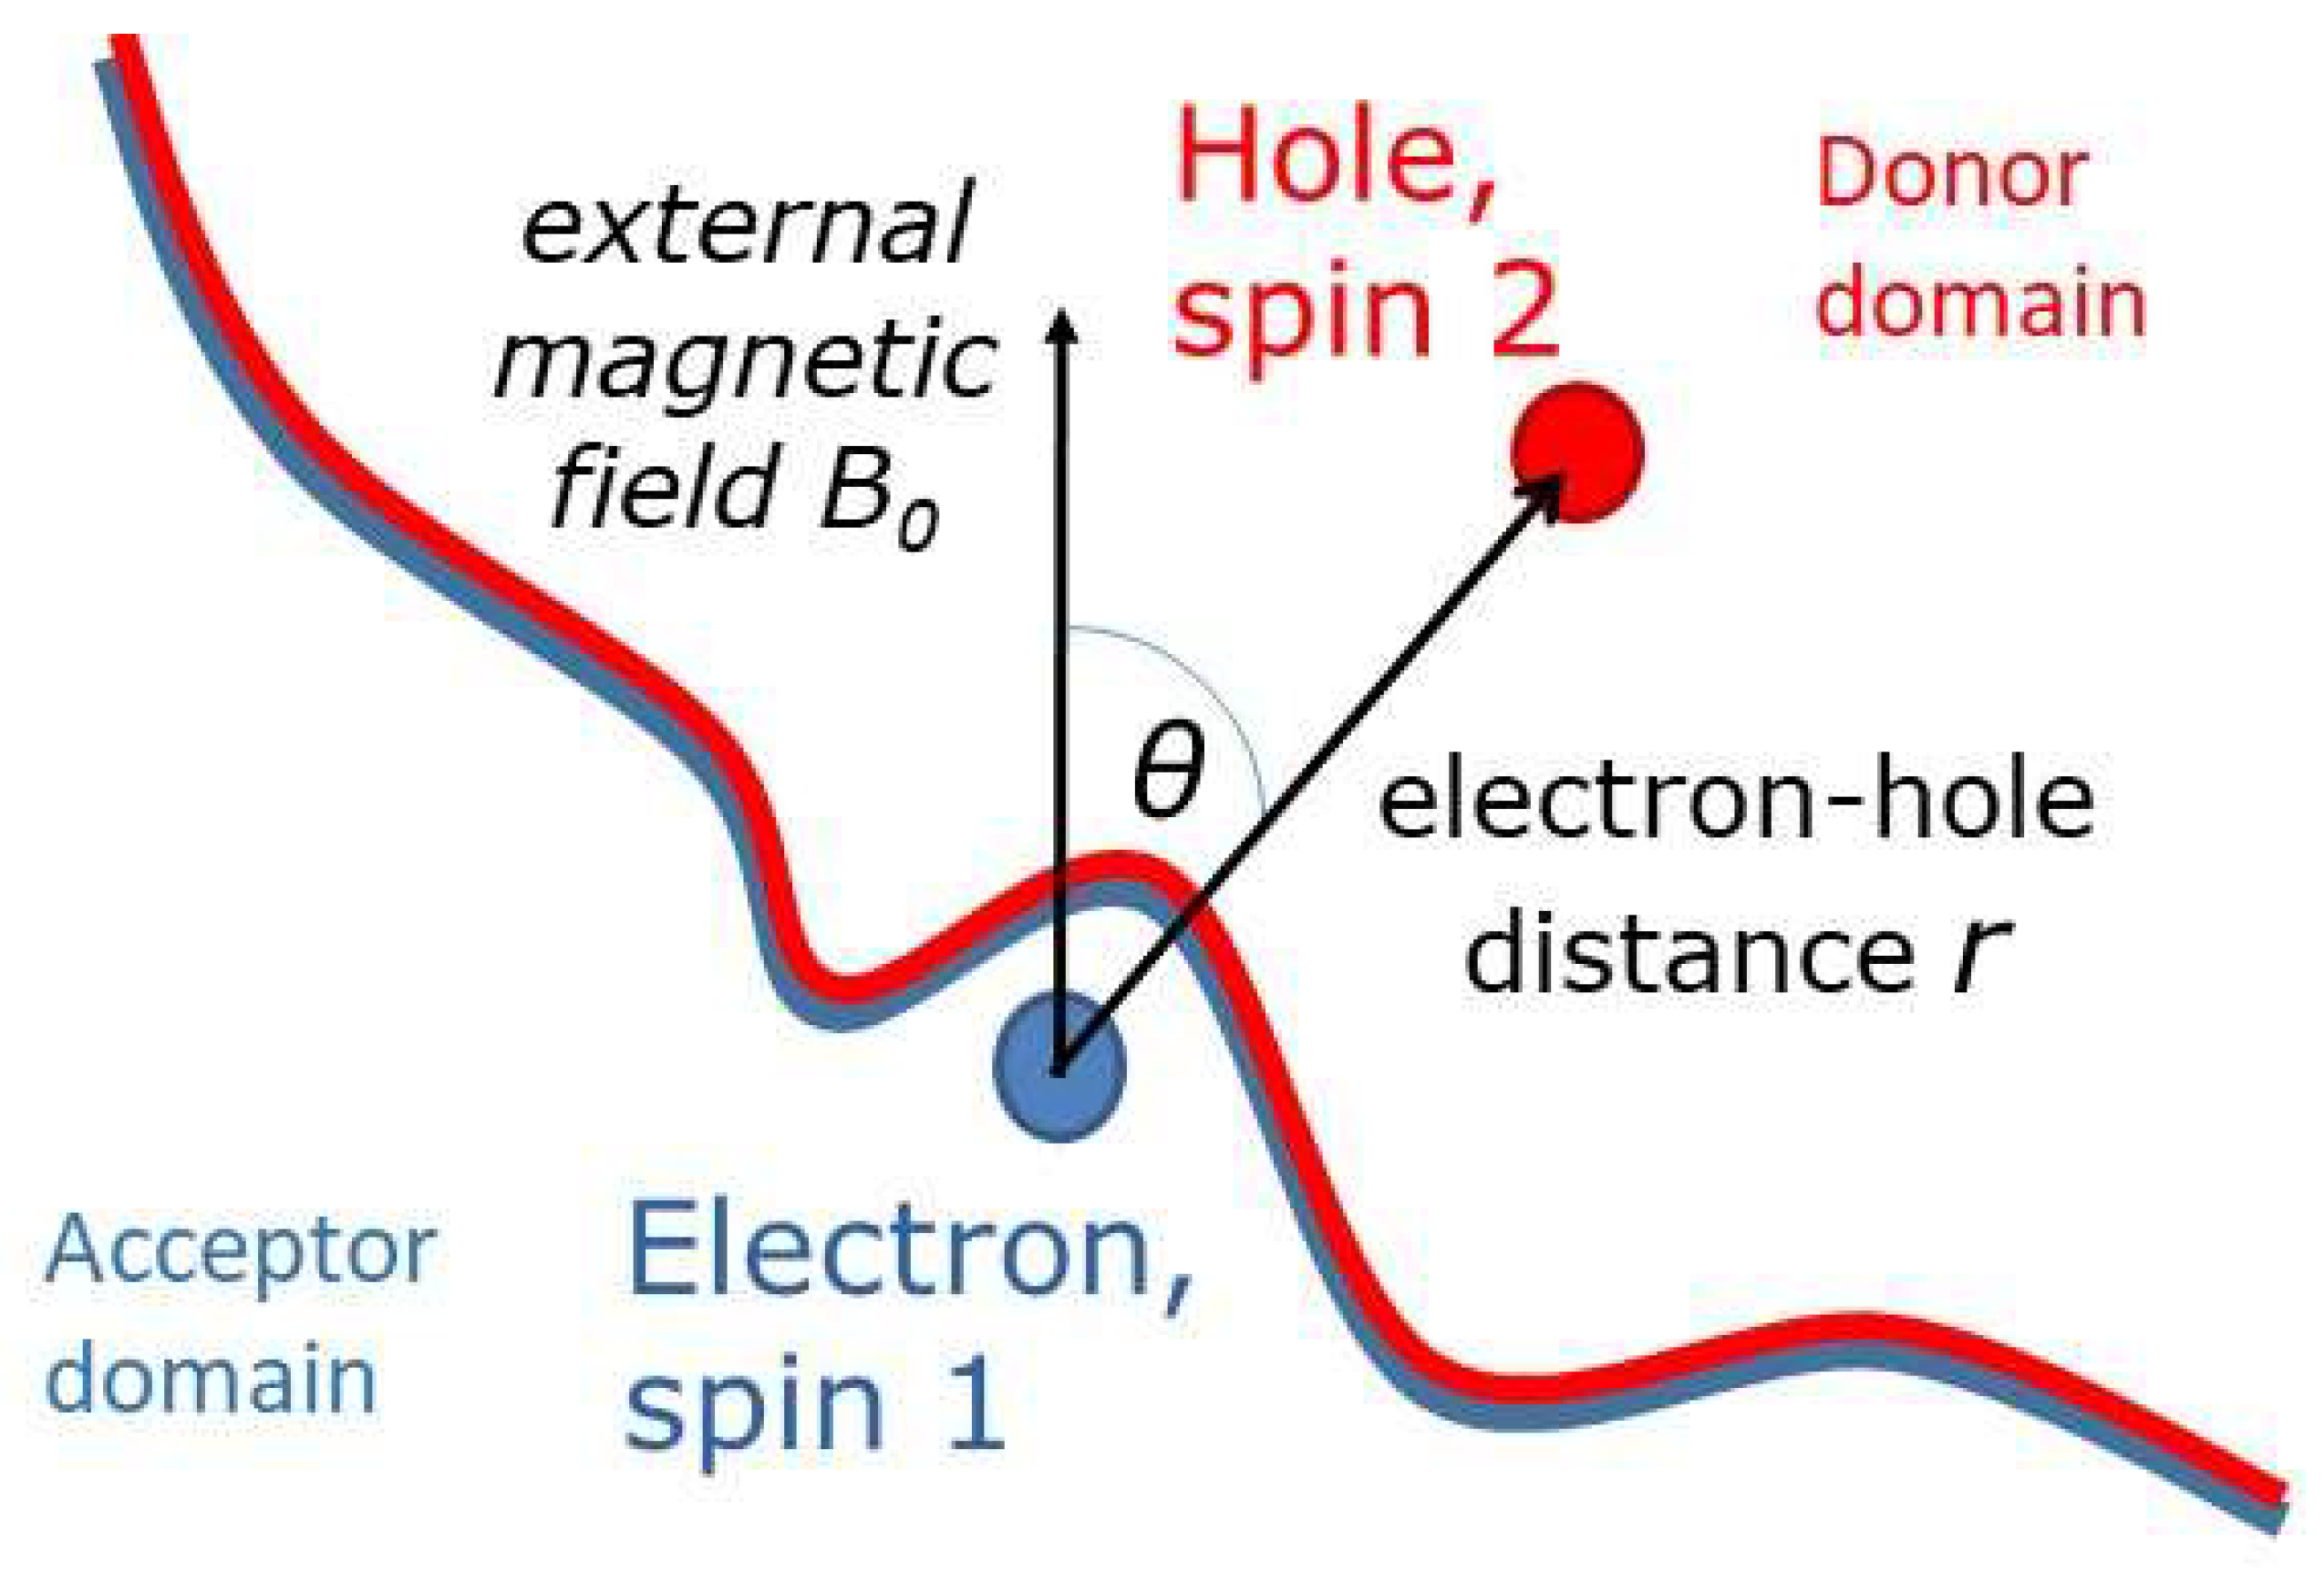
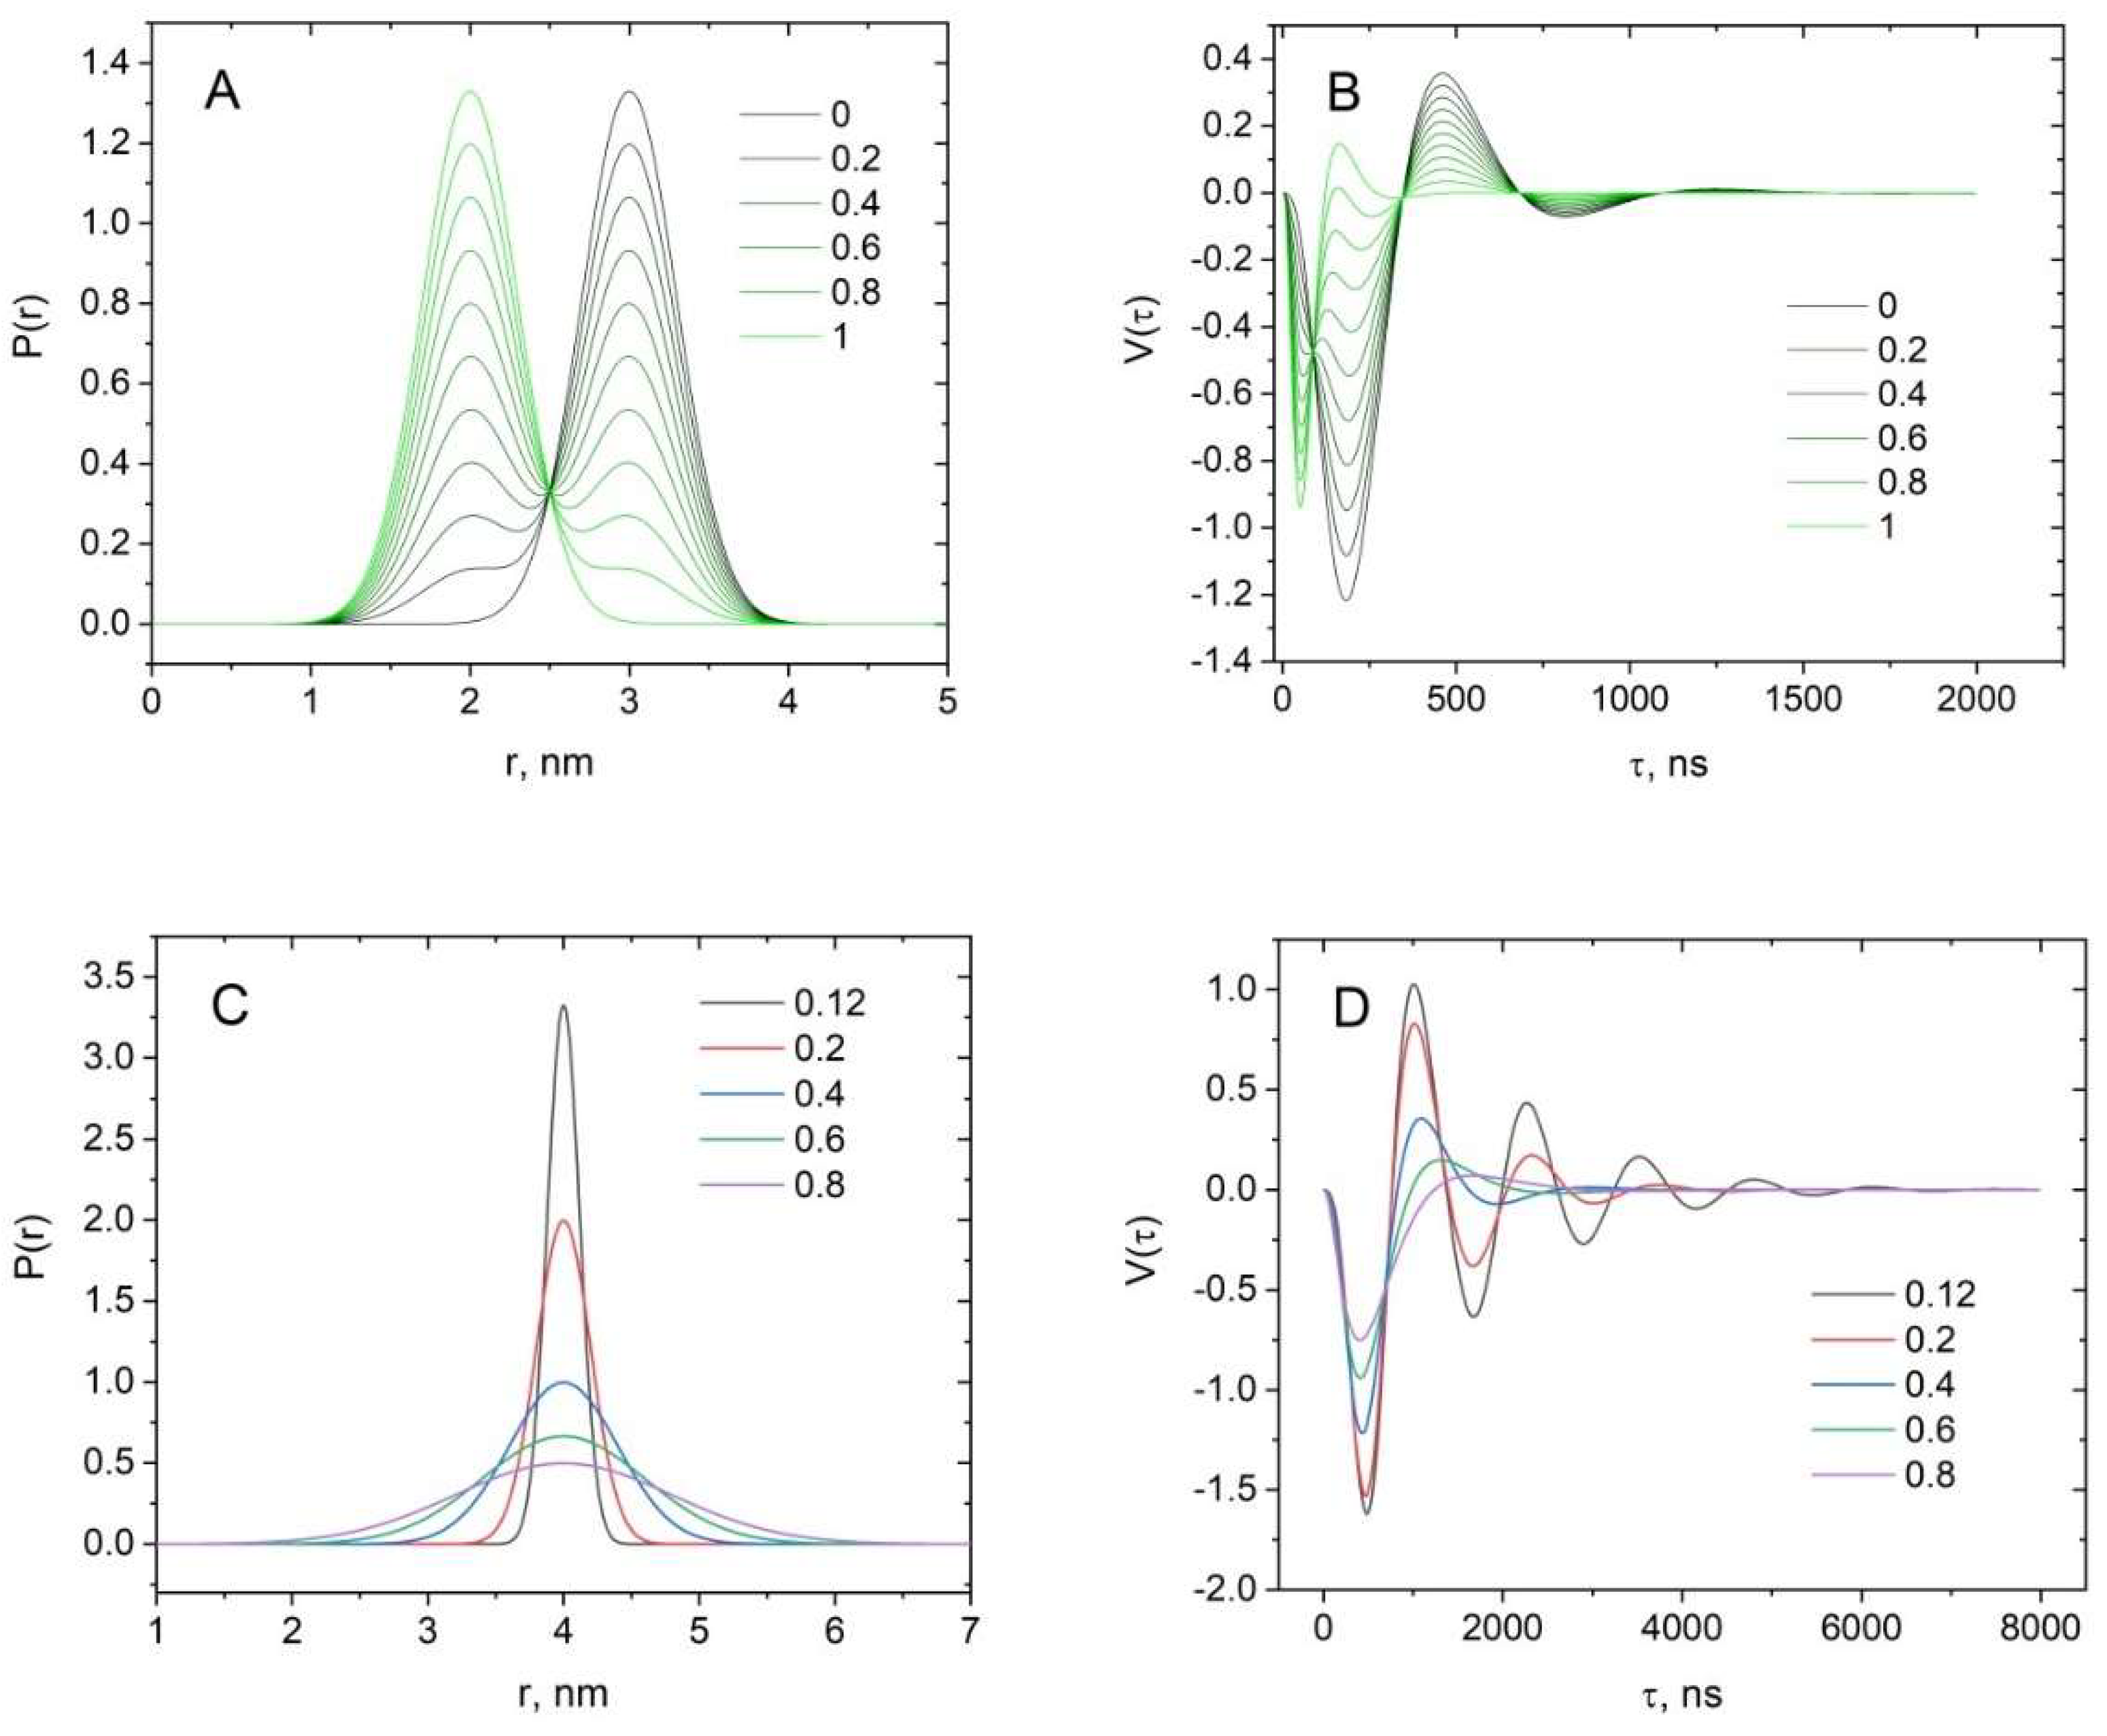
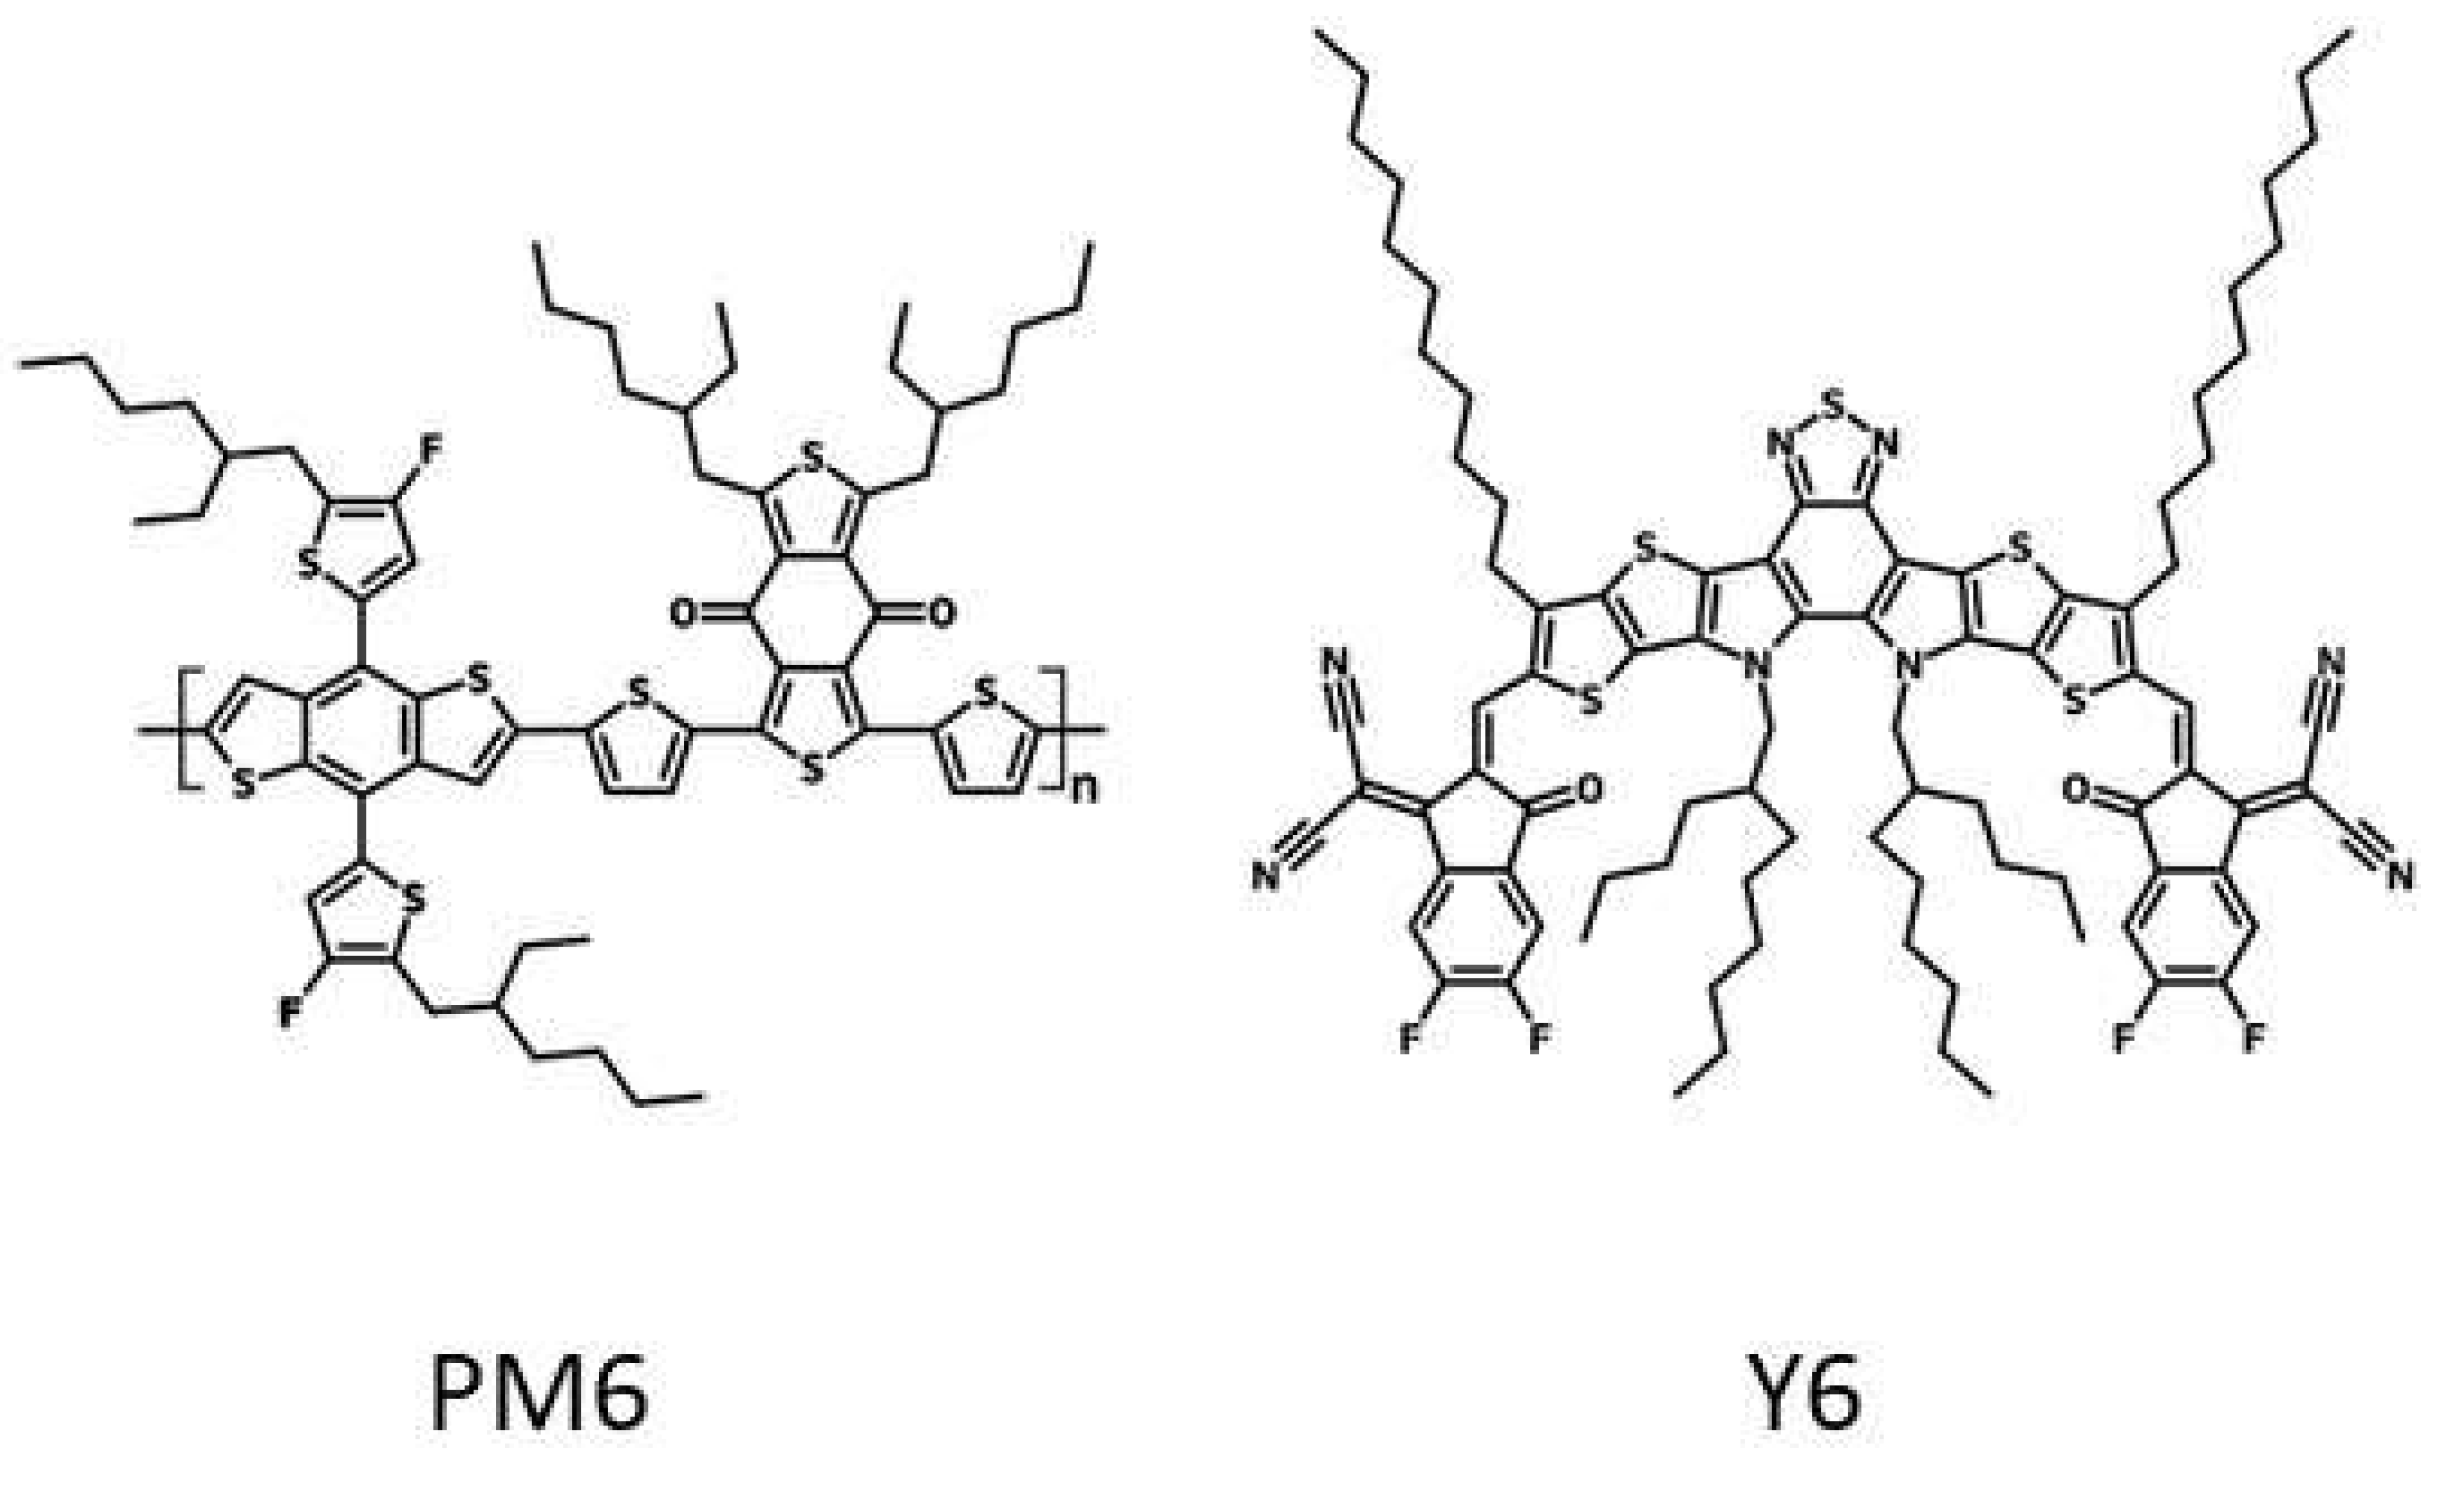
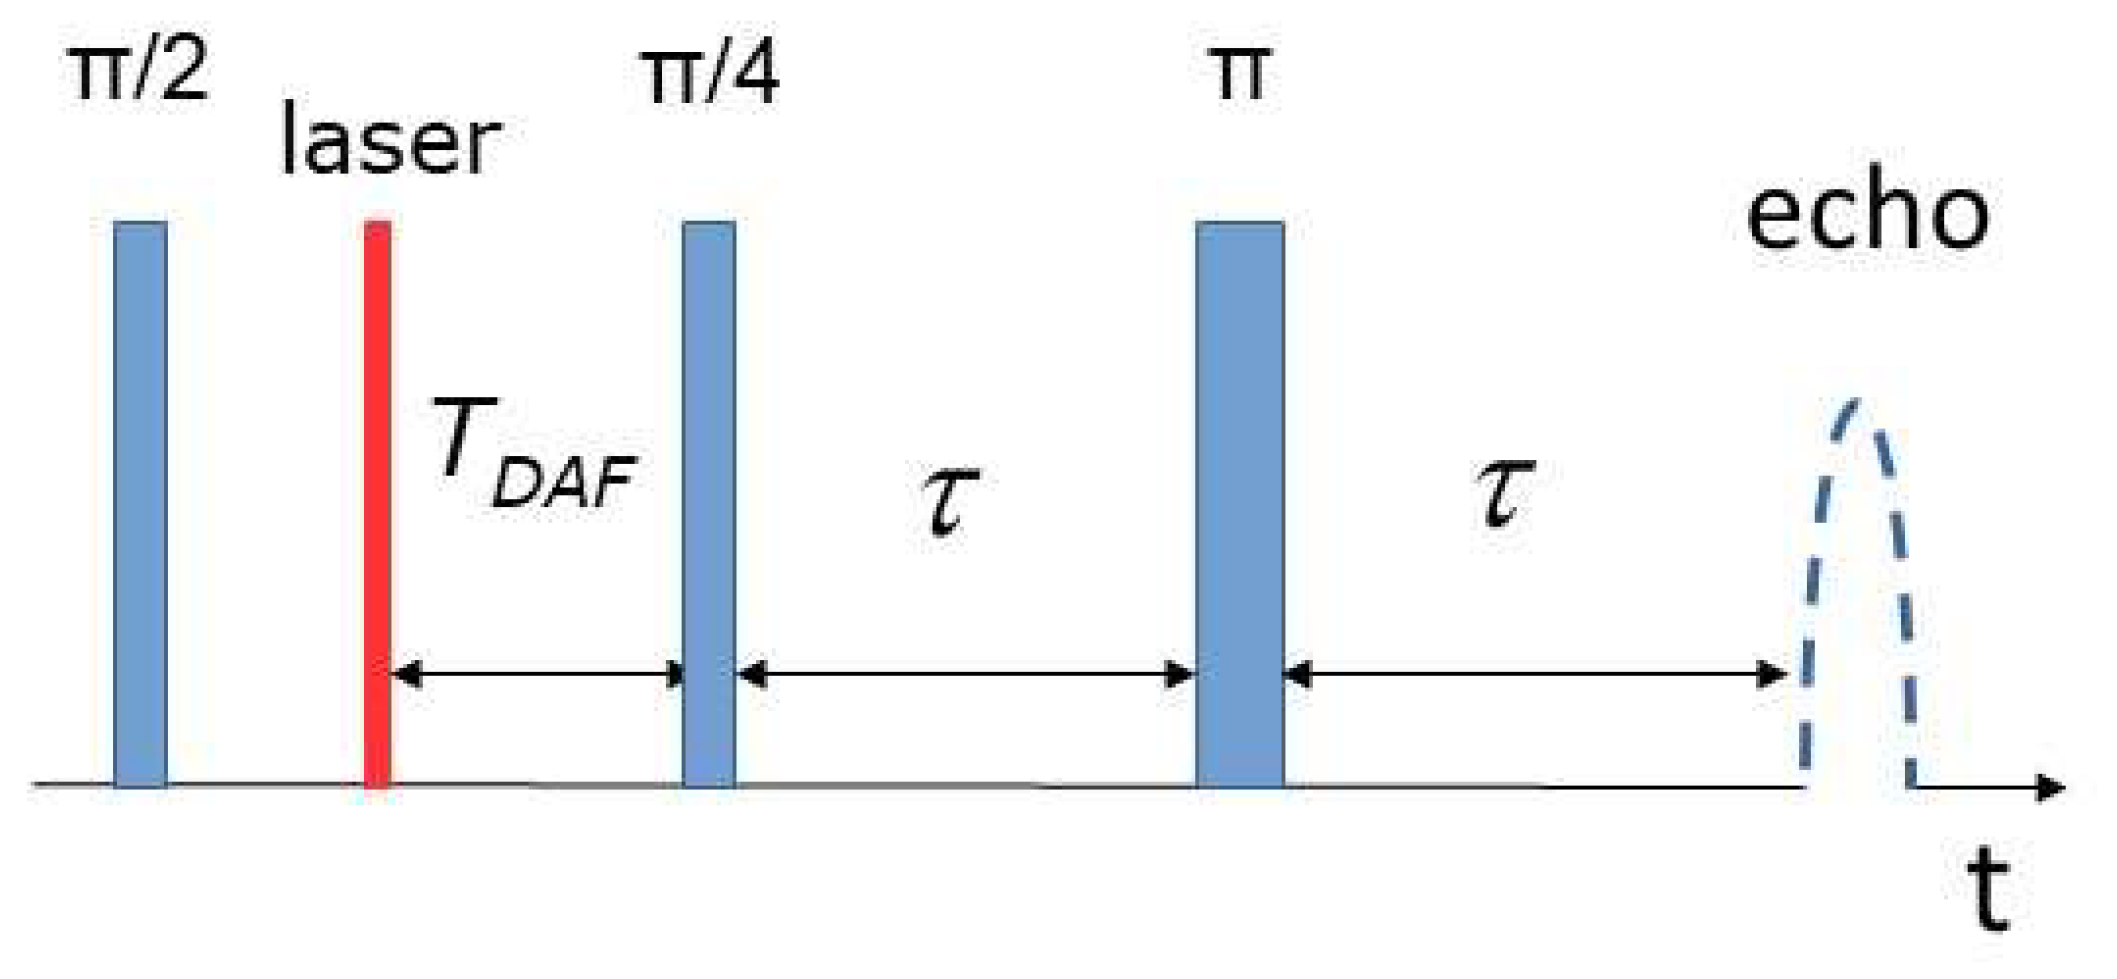

| Contribution of the first Gaussian | M1 (exact), nm | M1 (calculated), nm |
| 0 | 3 | 3.00012 |
| 0.1 | 2.9 | 2.90062 |
| 0.2 | 2.8 | 2.80108 |
| 0.3 | 2.7 | 2.70148 |
| 0.4 | 2.6 | 2.60183 |
| 0.5 | 2.5 | 2.50213 |
| 0.6 | 2.4 | 2.40237 |
| 0.7 | 2.3 | 2.30257 |
| 0.8 | 2.2 | 2.20271 |
| 0.9 | 2.1 | 2.1028 |
| 1 | 2 | 2.00284 |
| Width of the Gaussian, nm | M1 (calculated) |
| 0.12 | 4 |
| 0.2 | 4.00026 |
| 0.4 | 4.00039 |
| 0.6 | 4.00094 |
| 0.8 | 4.00487 |
| Sample preparation | Measurement conditions: temperature; DAF | M1, nm | ME1, nm |
| Drop-casting | 80K; 0us | 5.52275 | 0.14038 |
| Drop-casting | 80K; 1us | 5.48512 | 0.28545 |
| Drop-casting | 80K; 5us | 5.61639 | 0.25082 |
| Spin-coating | 80K; 0us | 5.52959 | 0.17701 |
| Spin-coating | 30K; 0us | 4.75013 | 0.04224 |
Disclaimer/Publisher’s Note: The statements, opinions and data contained in all publications are solely those of the individual author(s) and contributor(s) and not of MDPI and/or the editor(s). MDPI and/or the editor(s) disclaim responsibility for any injury to people or property resulting from any ideas, methods, instructions or products referred to in the content. |
© 2024 by the authors. Licensee MDPI, Basel, Switzerland. This article is an open access article distributed under the terms and conditions of the Creative Commons Attribution (CC BY) license (http://creativecommons.org/licenses/by/4.0/).


