Submitted:
07 December 2024
Posted:
09 December 2024
You are already at the latest version
Abstract
Keywords:
1. Introduction
2. Materials and Methods
2.1. Biosorbent Preparation
2.2. Biosorbent Characterization
2.3. Biosorption Kinetics
2.4. Effect of Biosorbent Dose
2.5. Influence of pH on Biosorption
2.6. Biosorption Isotherms
2.7. Desorption Tests
3. Results
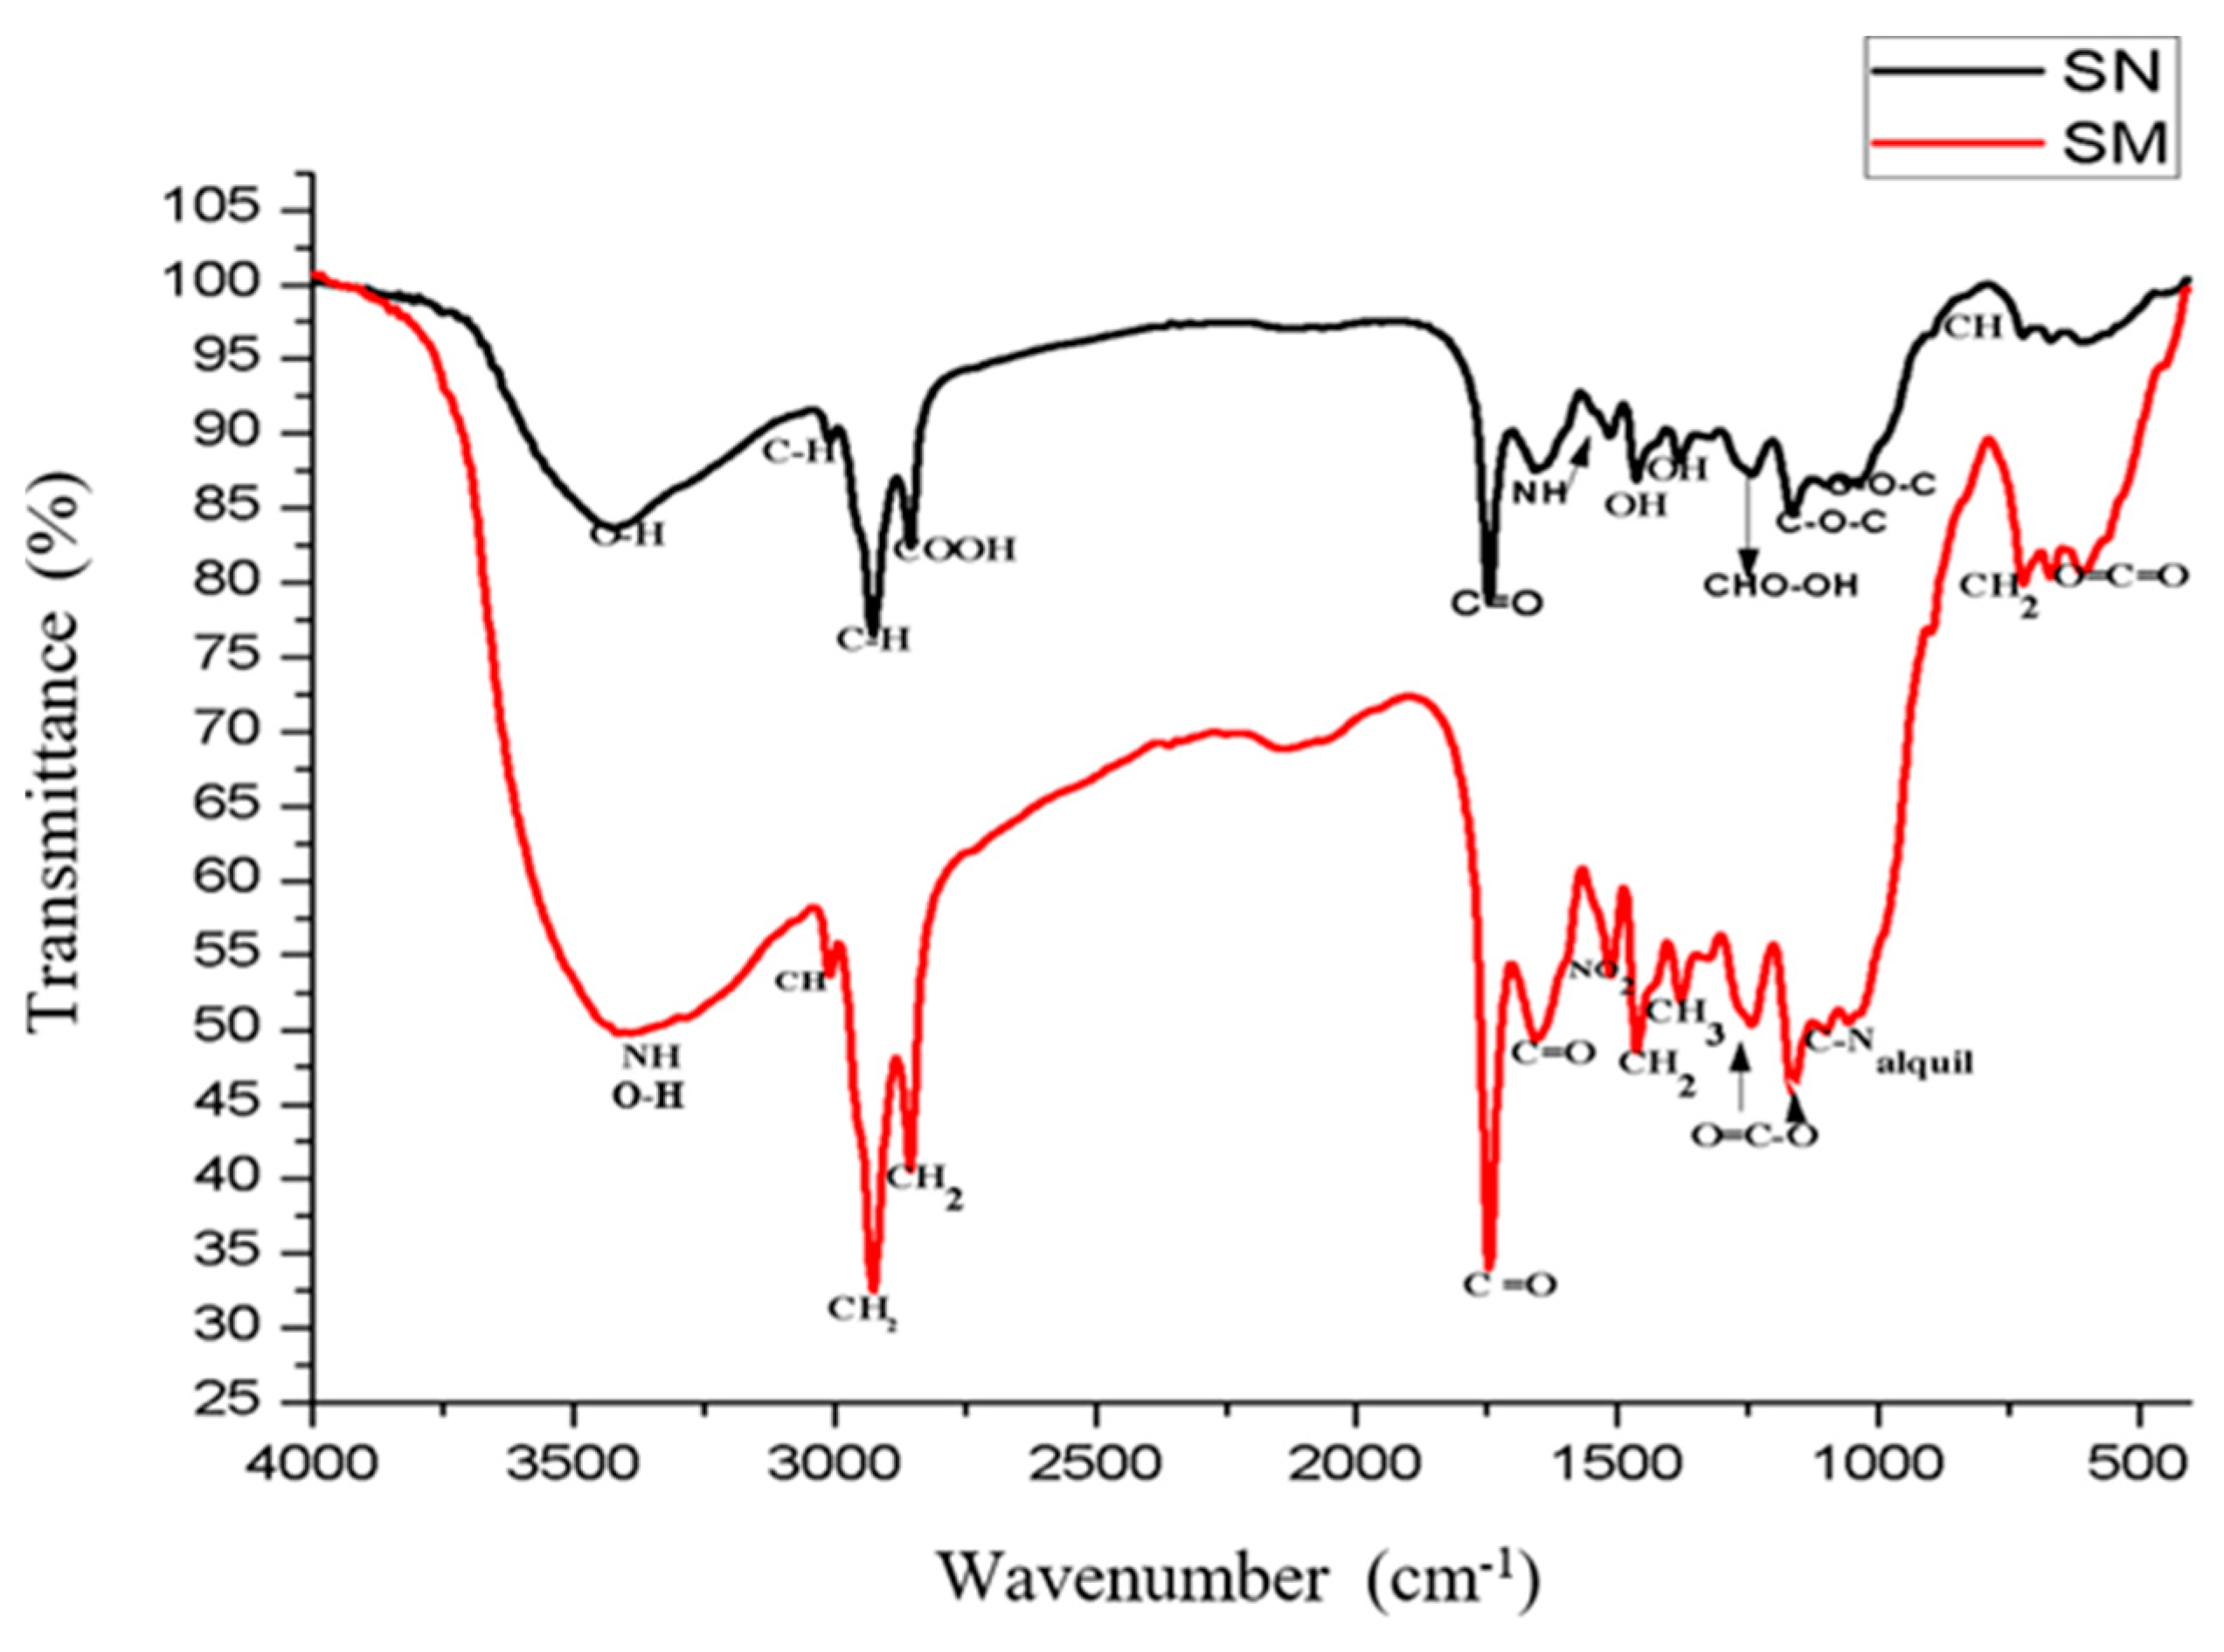
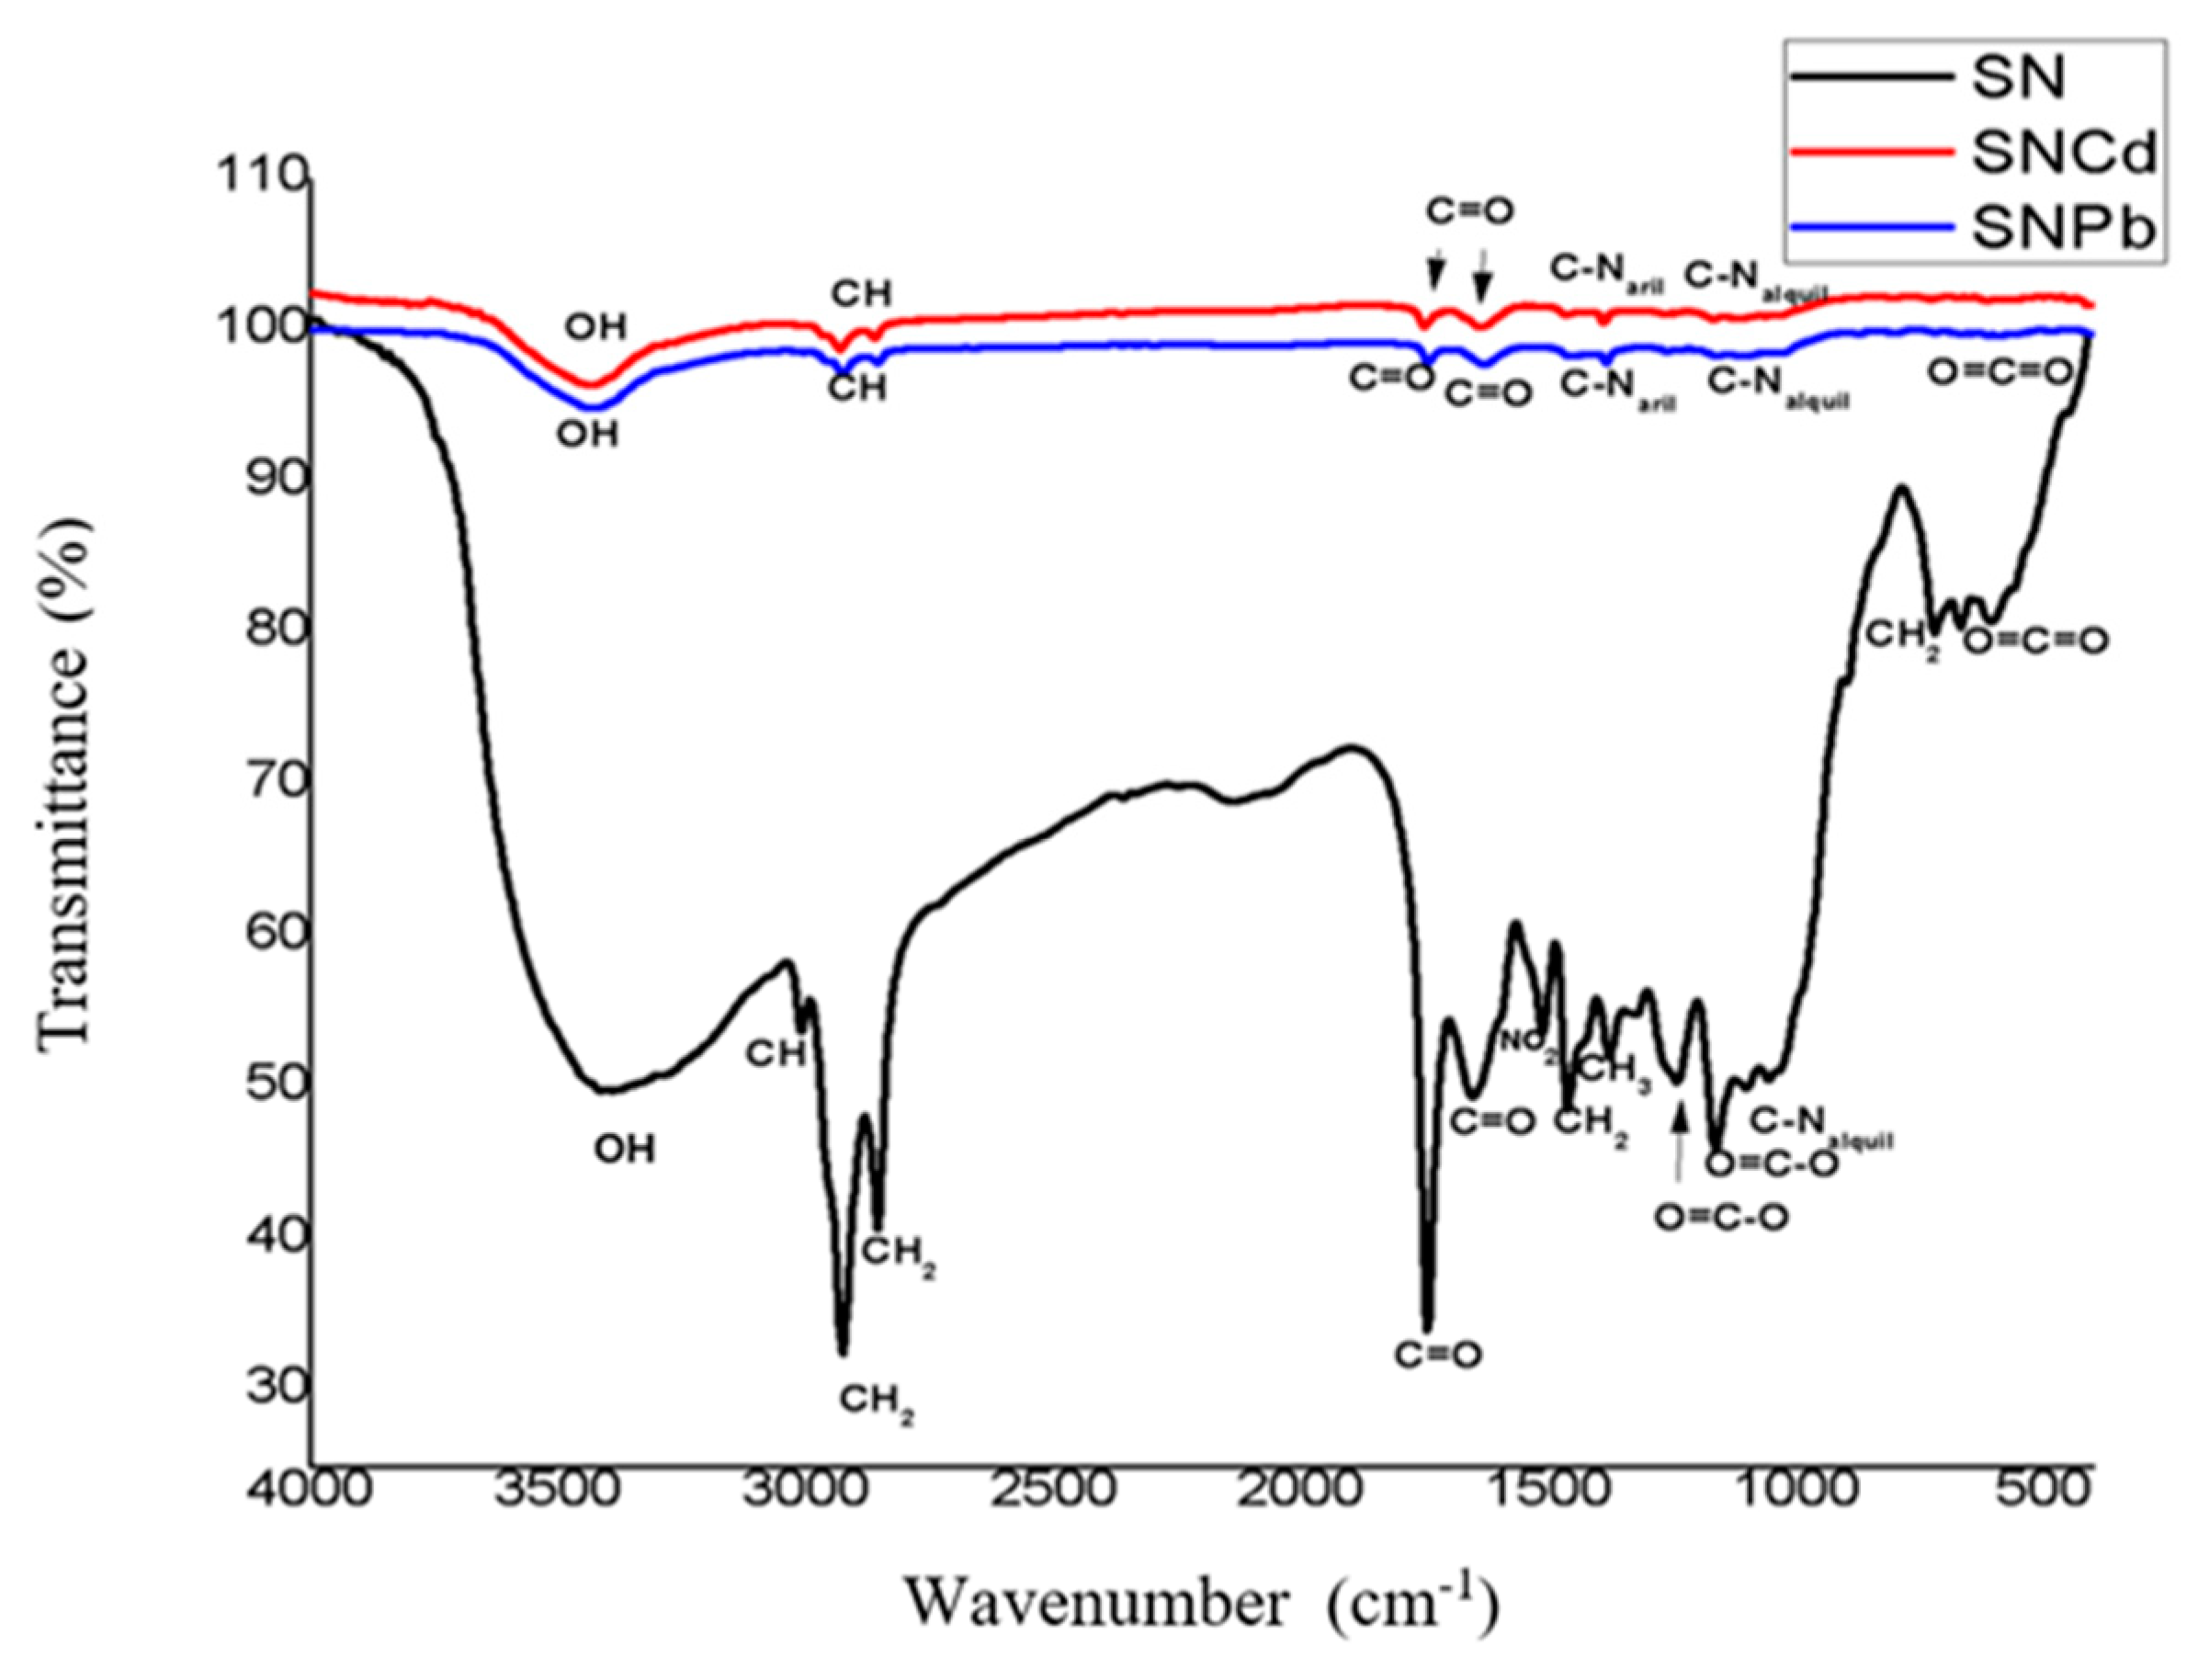
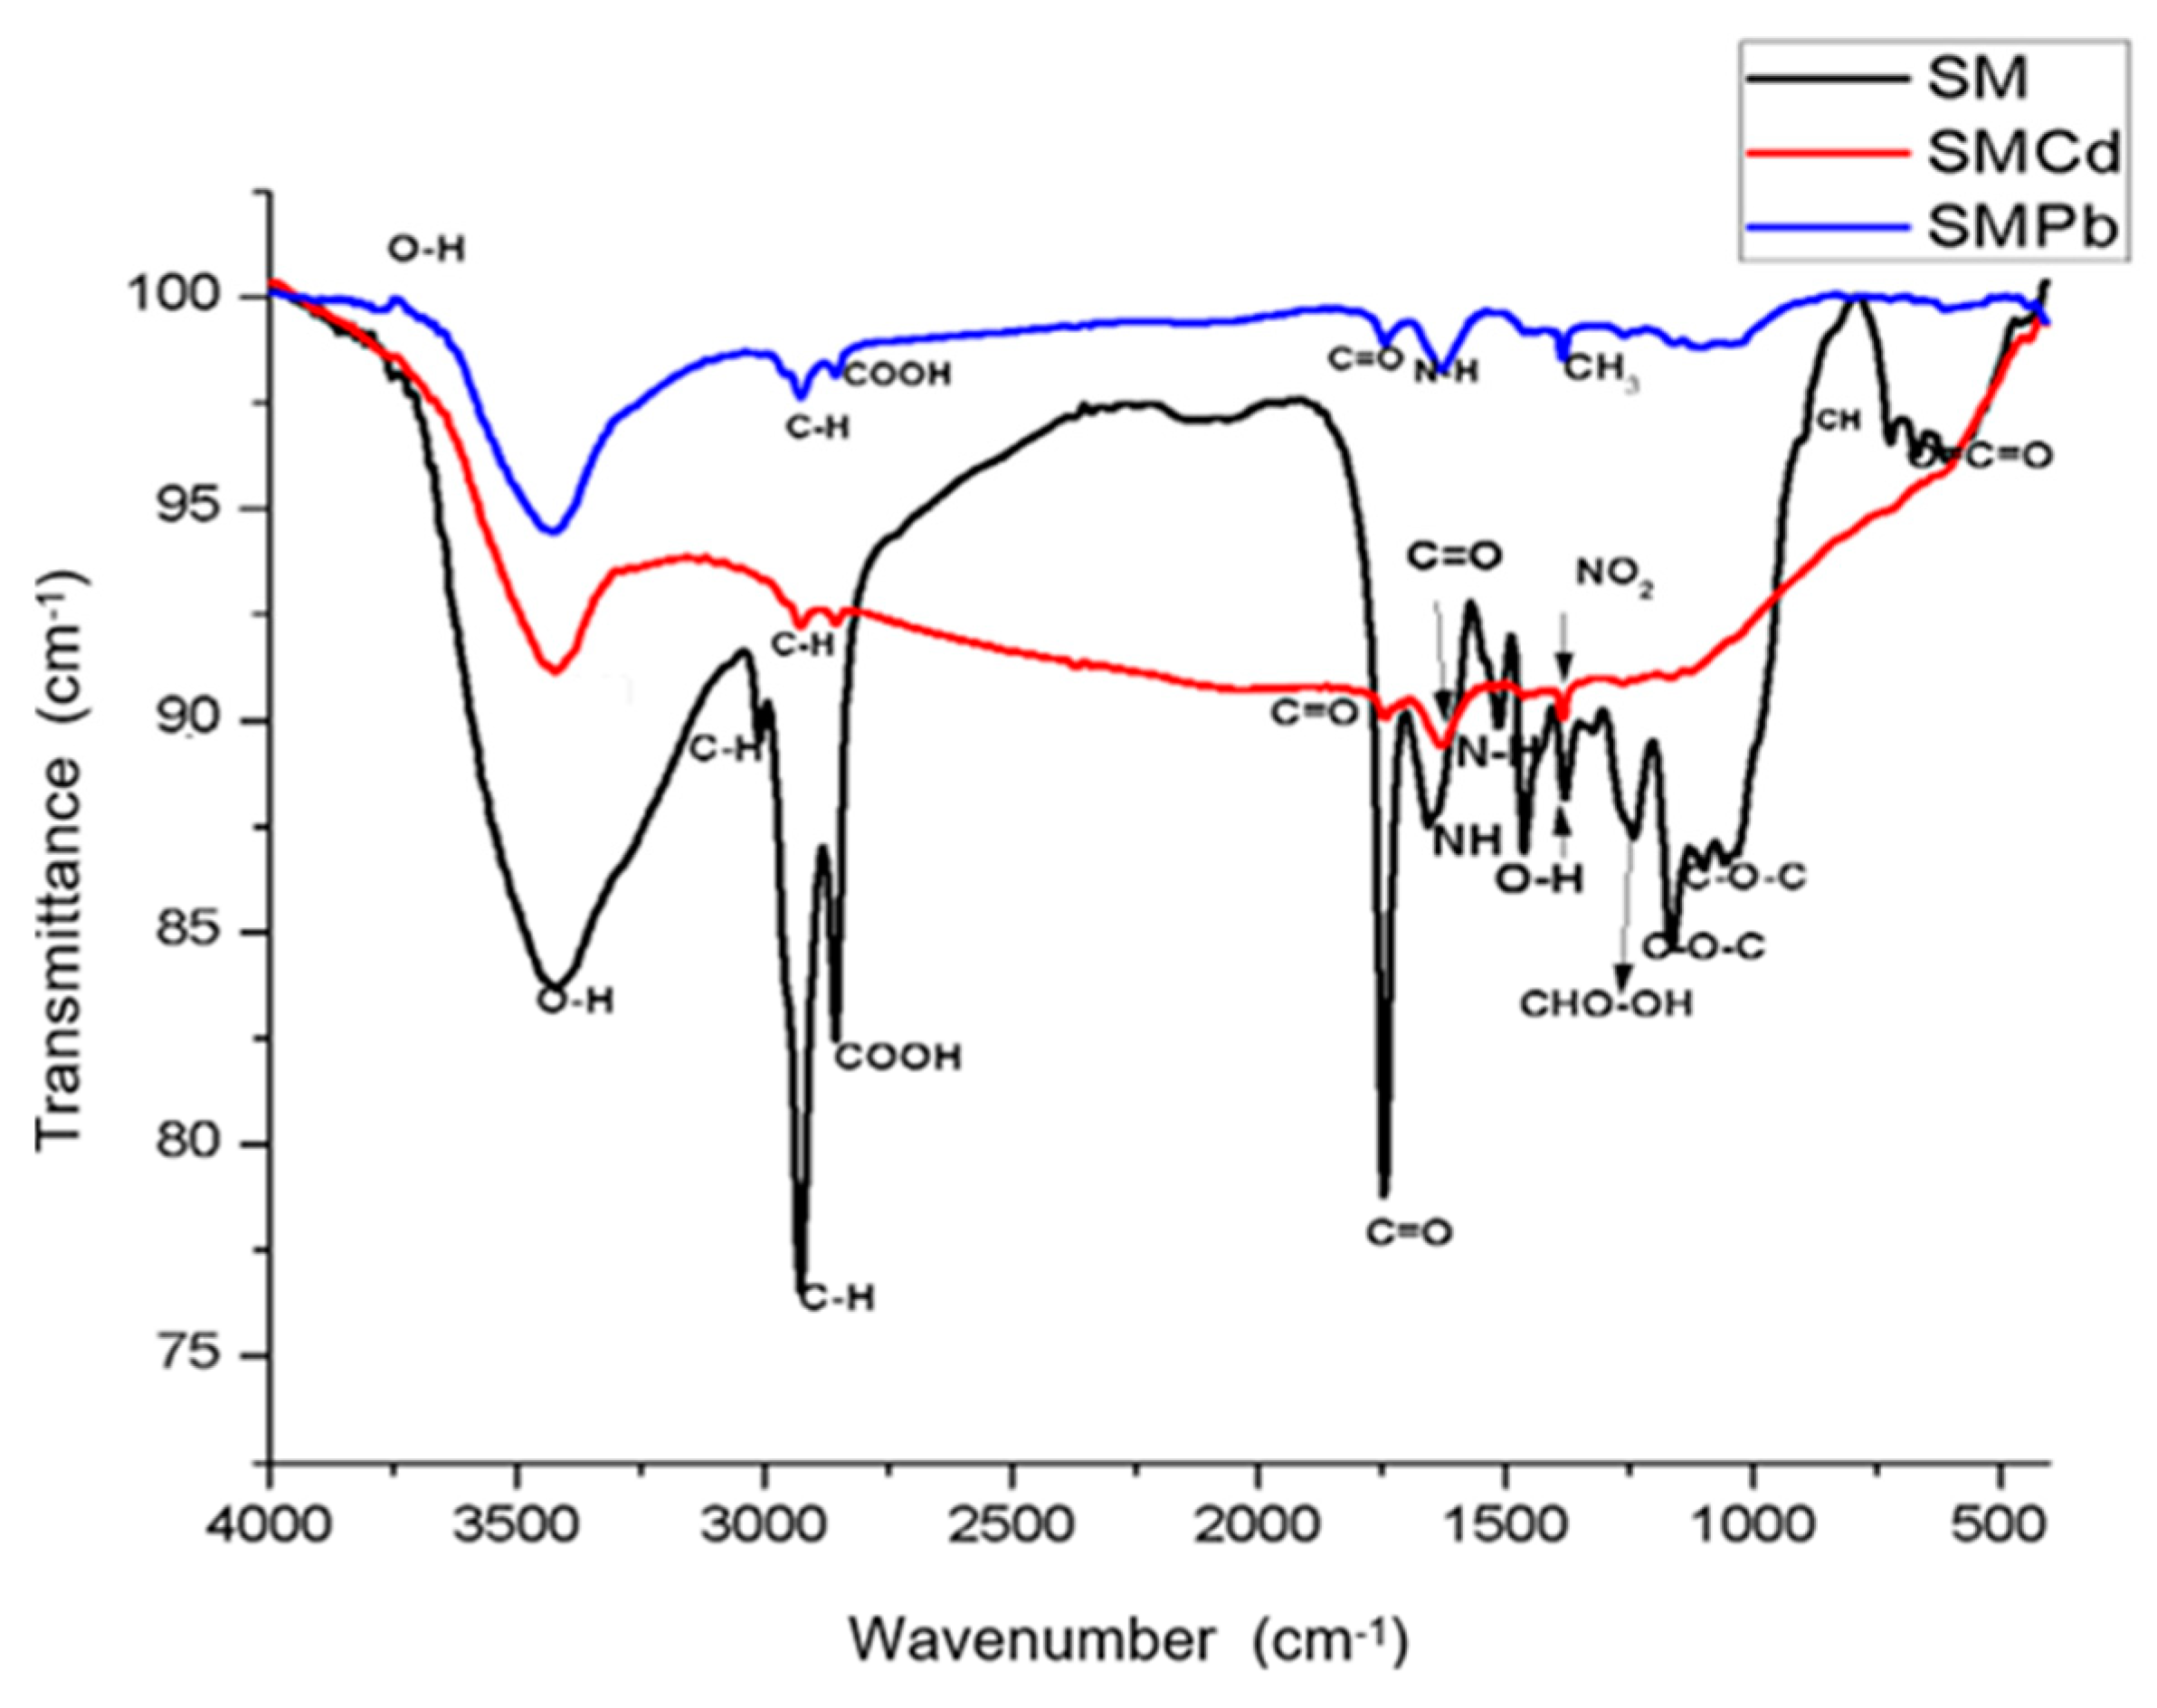
3.1. FTIR Analyses
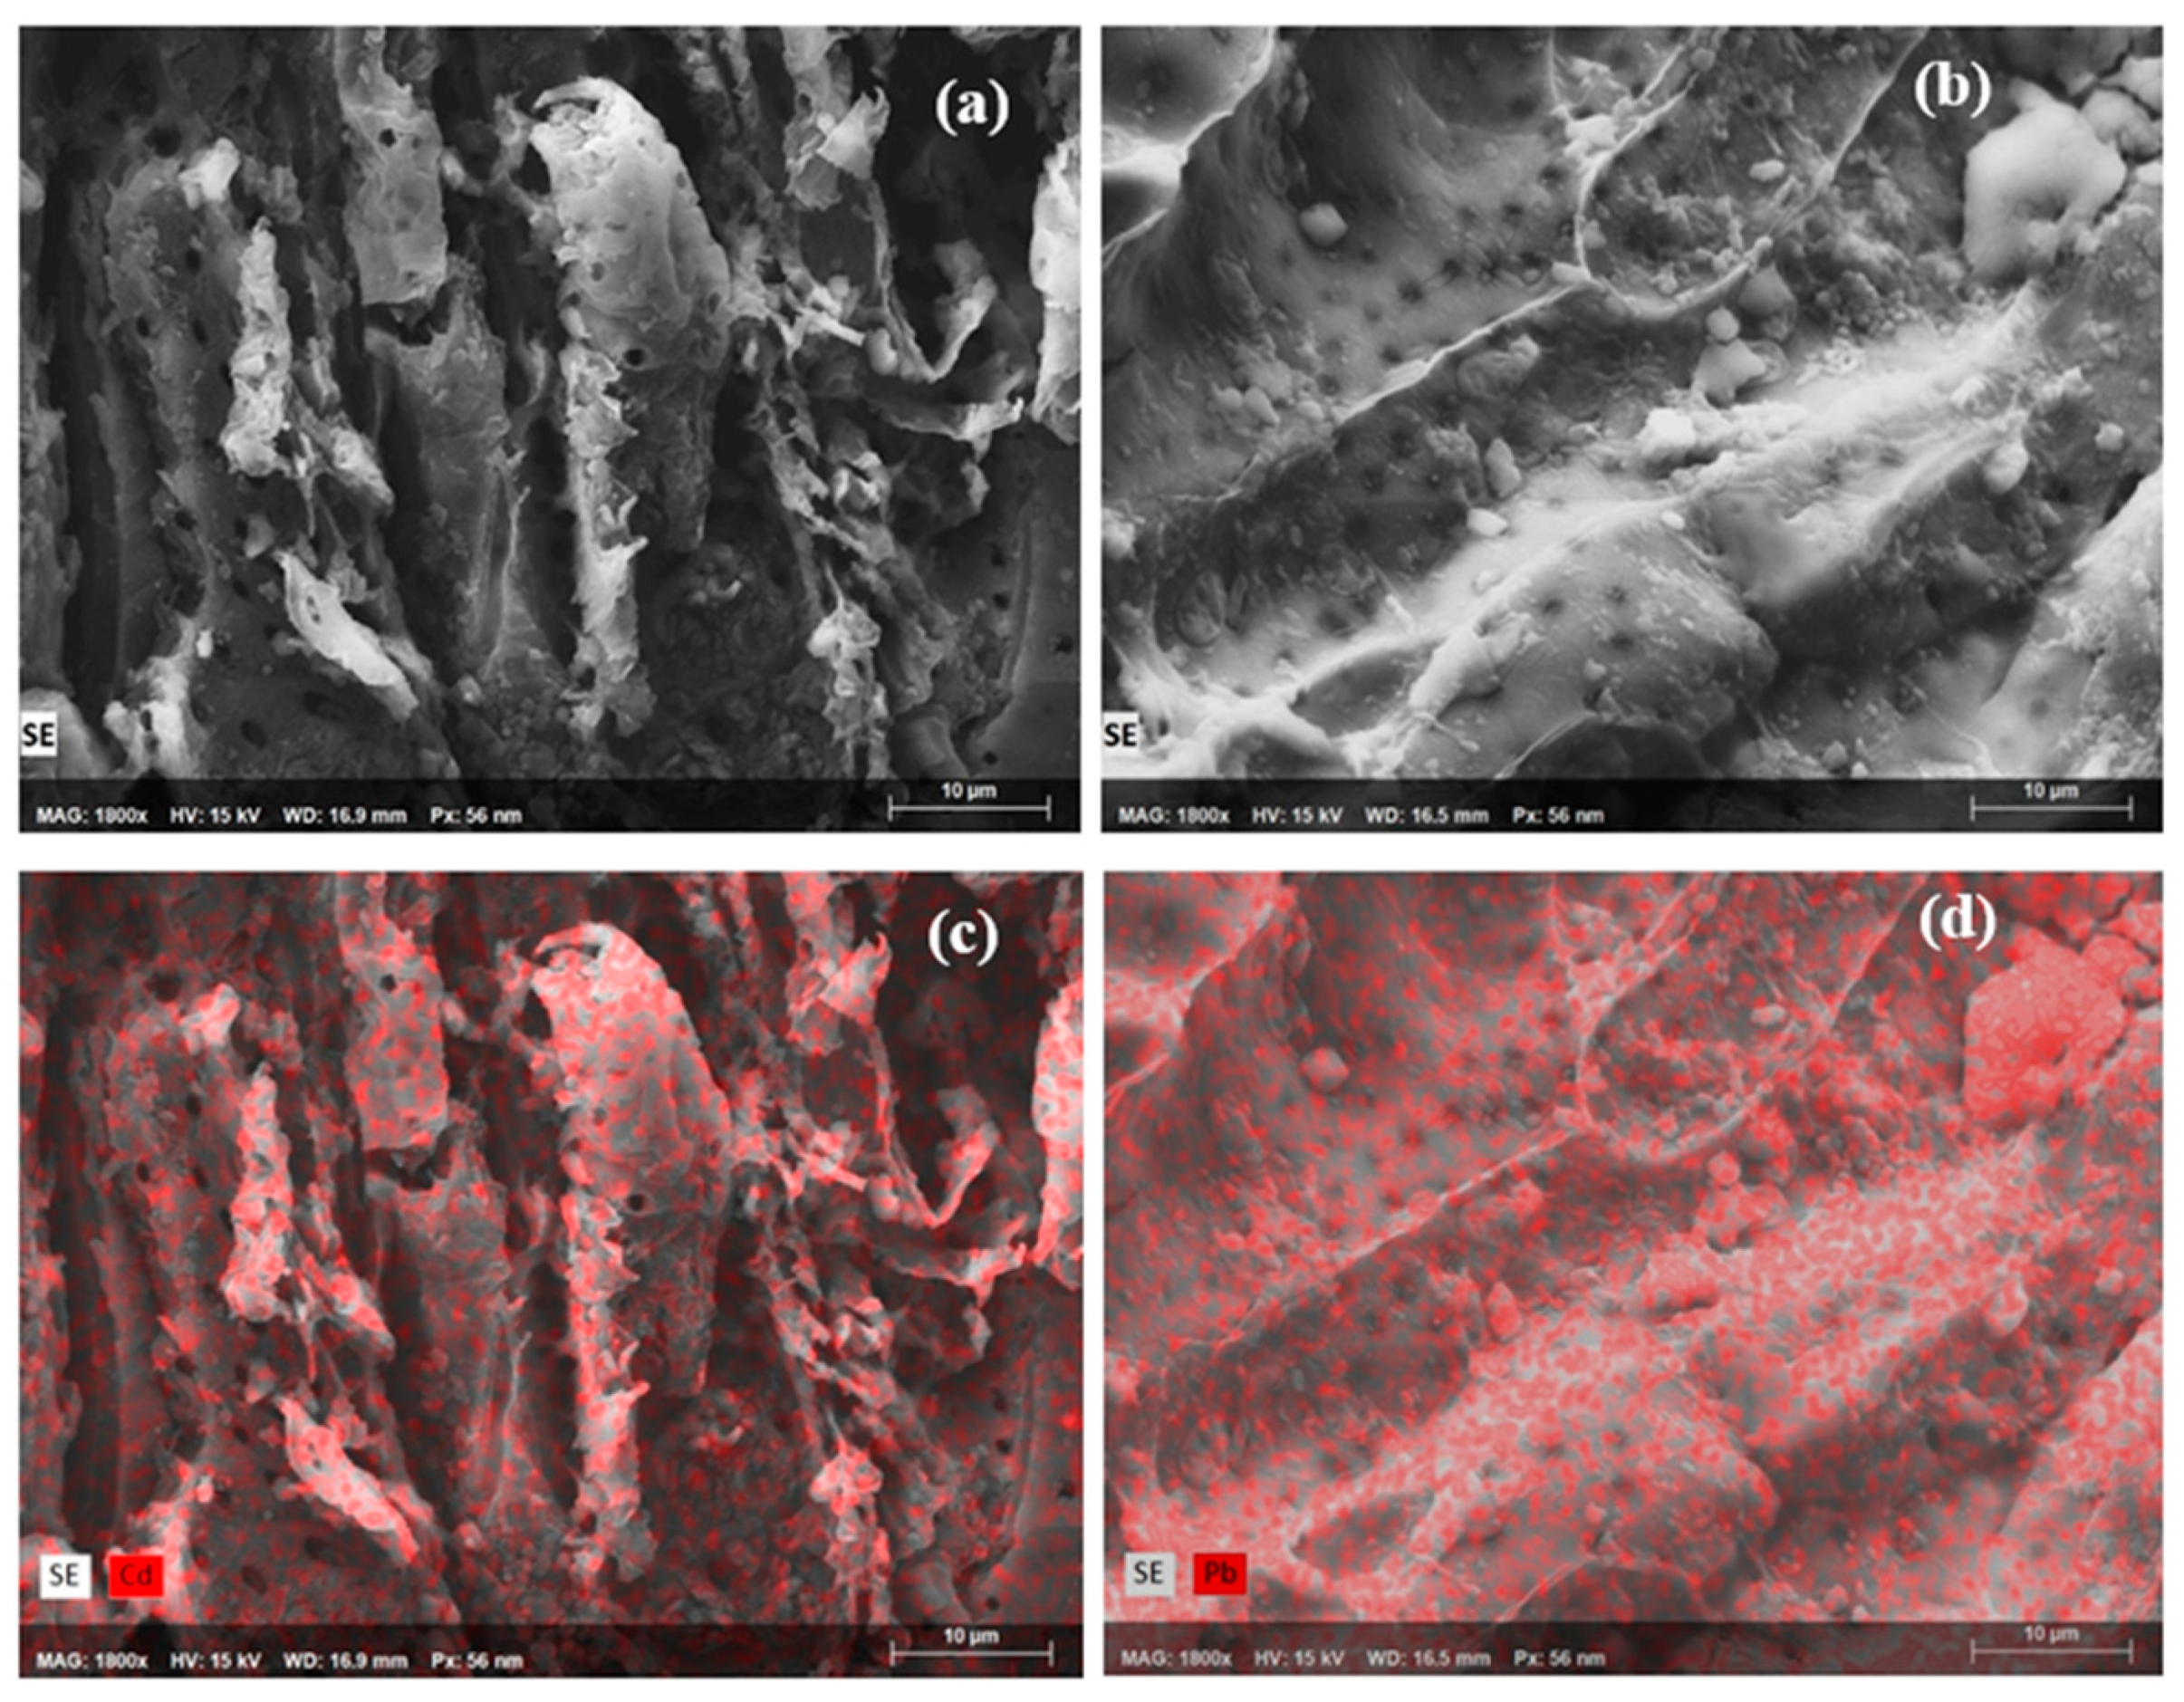
3.2. SEM-EDS Analyses
3.3. Zeta Potential (ᵹ)
3.4. Biosorption Kinetics
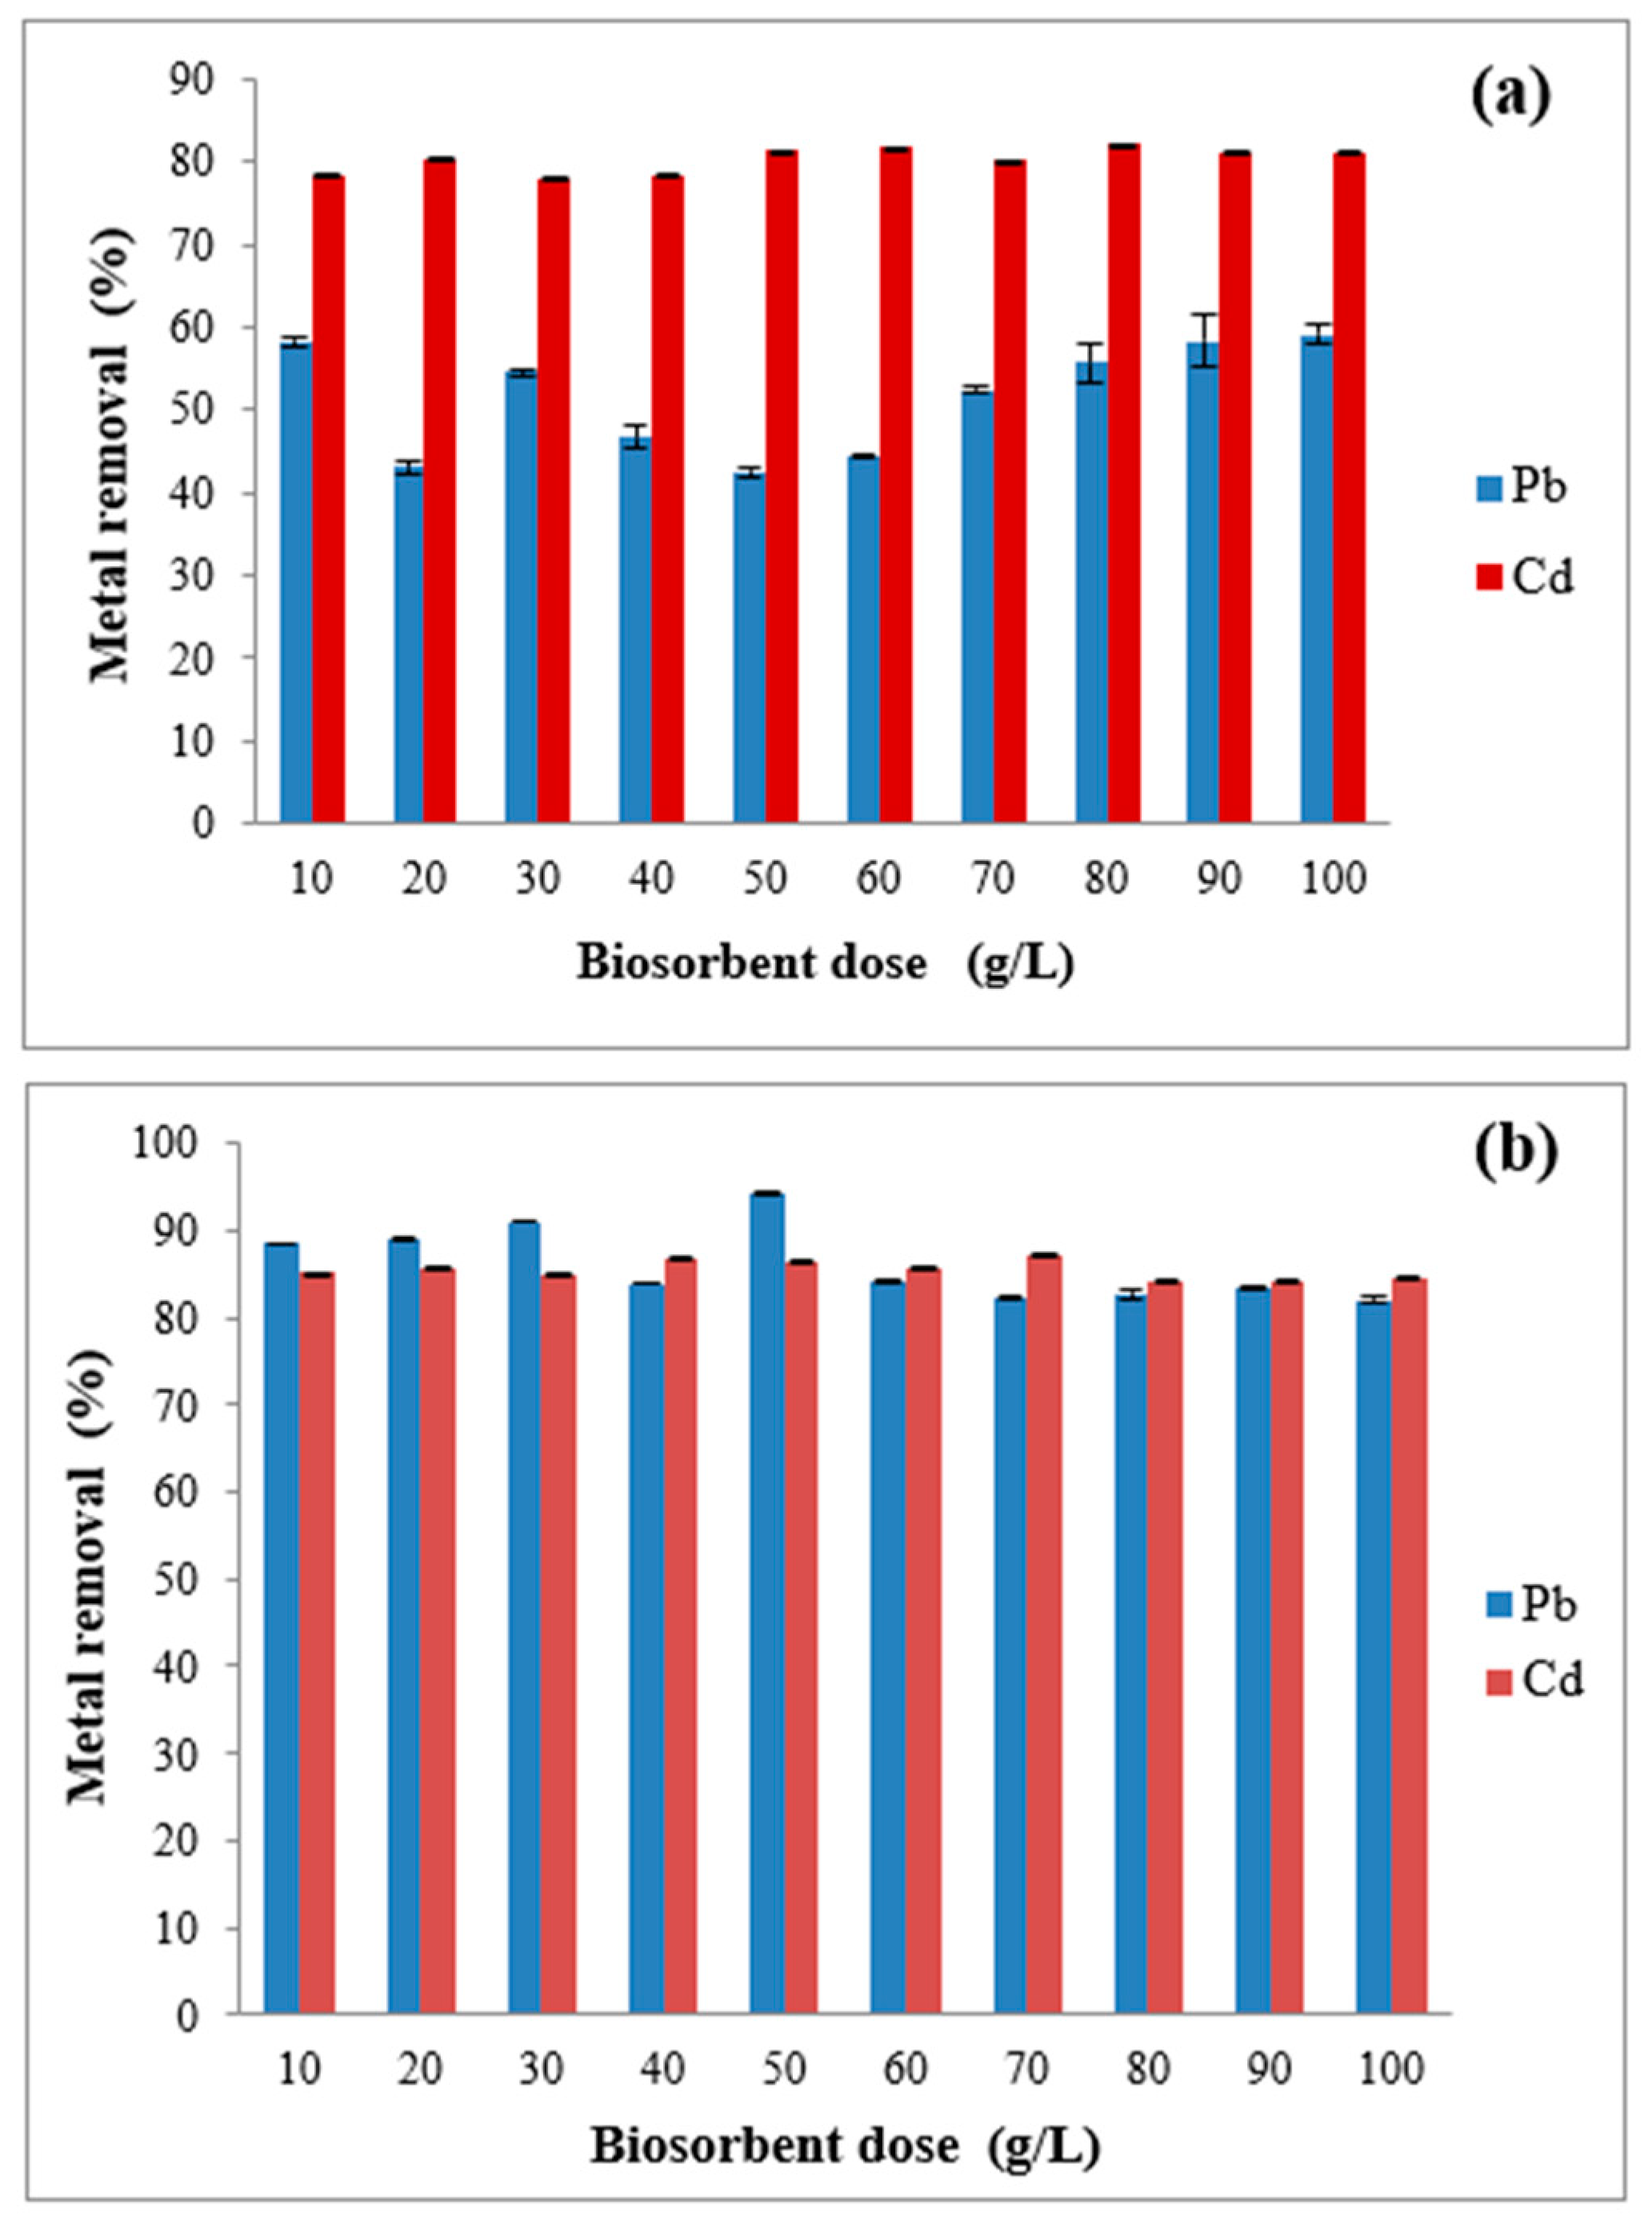
3.5. Effect of Biosorbent Dose
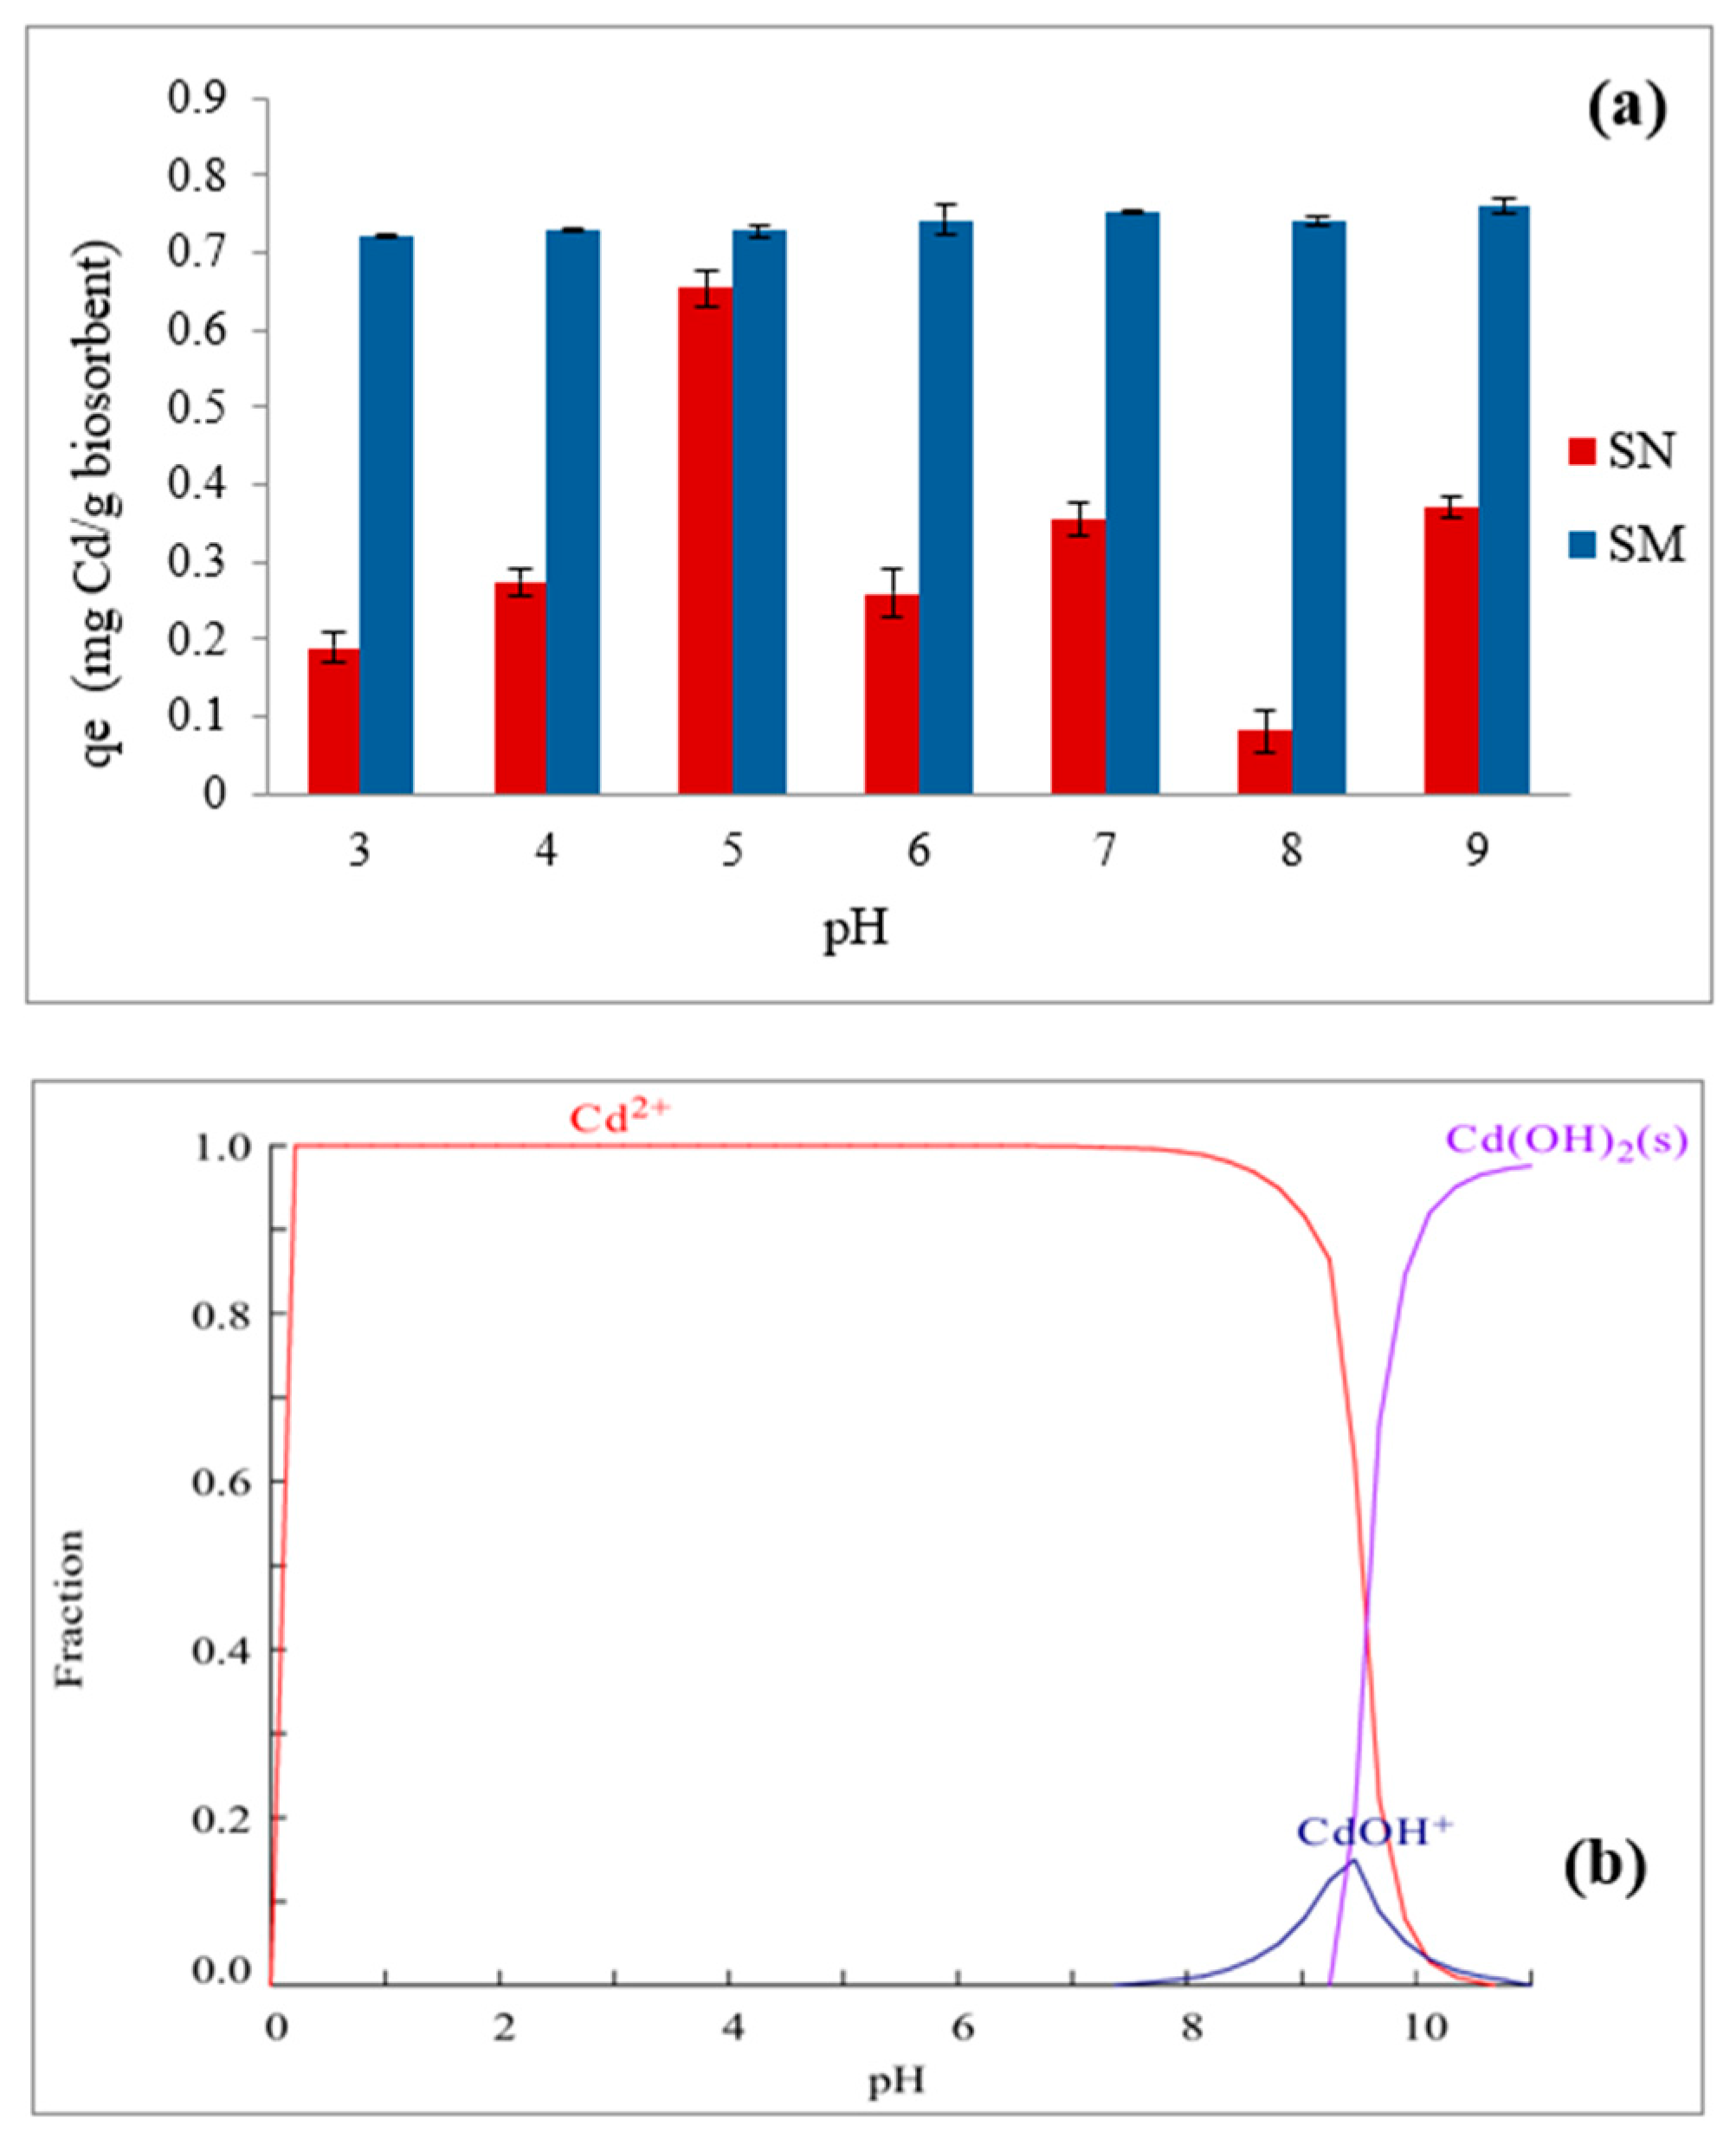
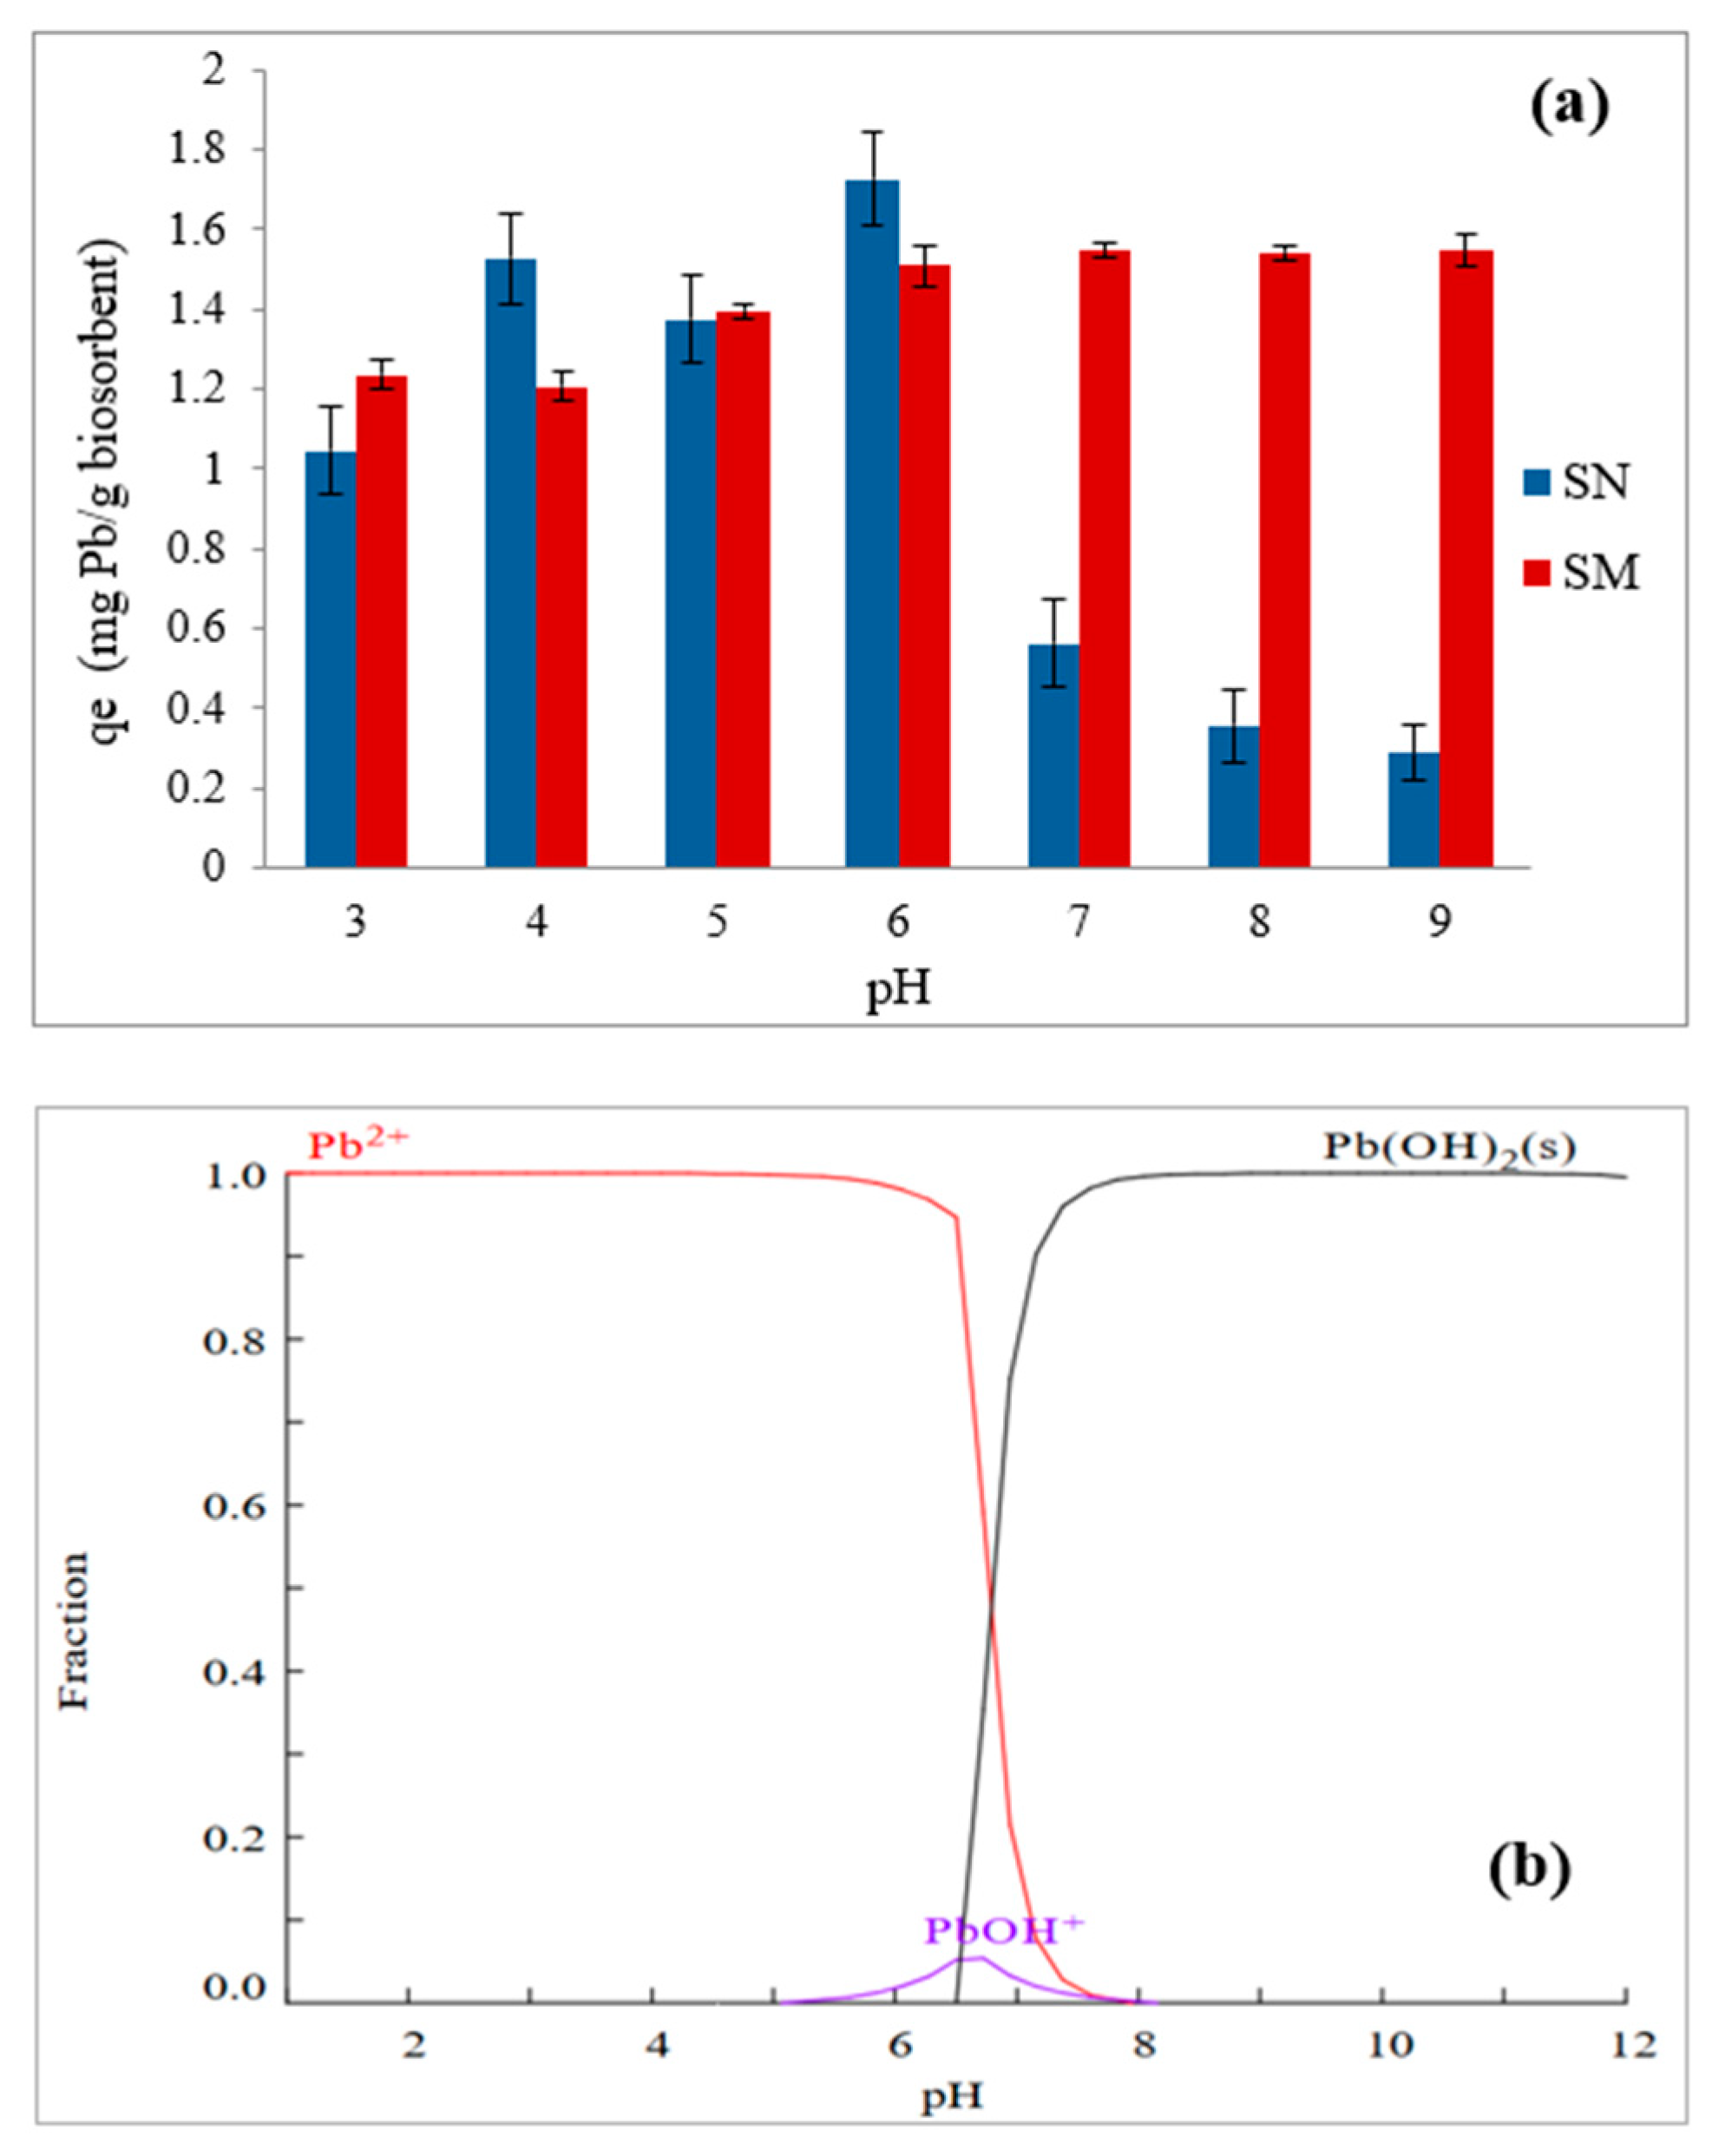
3.6. Influence of pH on Biosorption
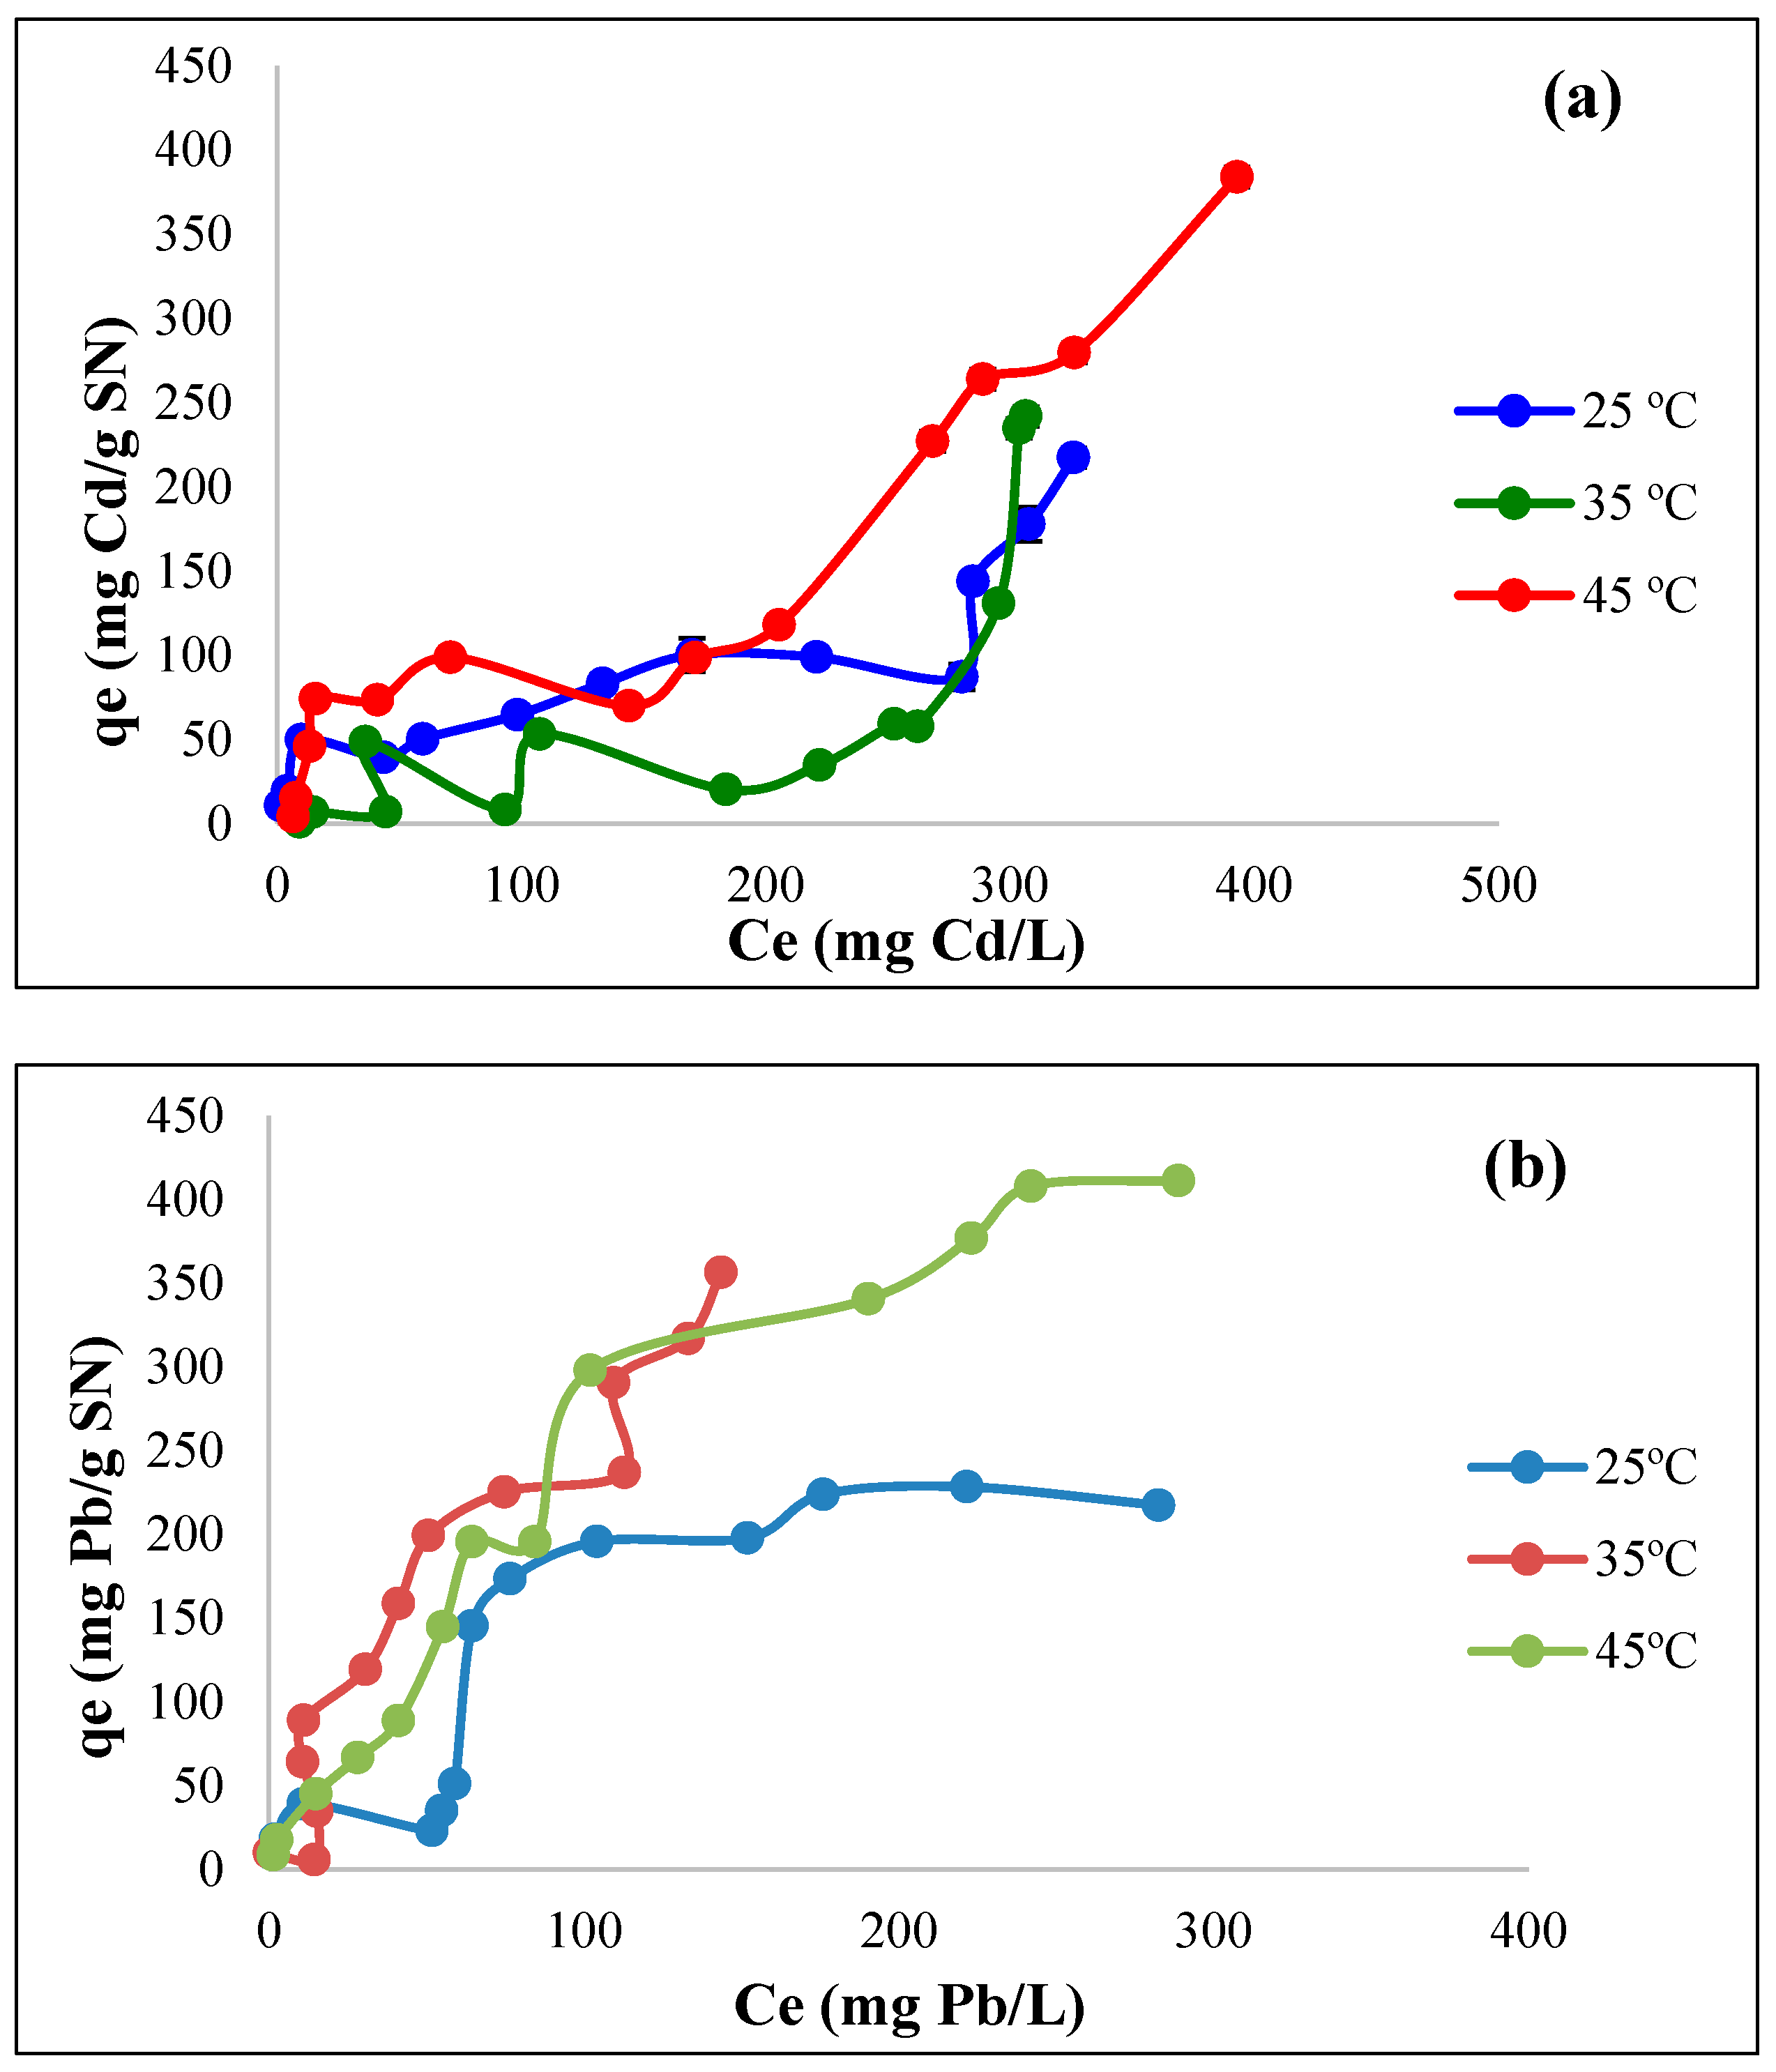
3.7. Biosorption Isotherms
3.8. Desorption Tests
3.9. Thermodynamic Parameters
4. Conclusions
Supplementary Materials
Author Contributions
Funding
Data Availability Statement
Acknowledgments
Conflicts of Interest
References
- Sanchez-Silva, J.M.; González-Estrada, R.R.; Blancas-Benitez, F.J.; Fonseca-Cantabrana, Á.; Sanchez-Silva, J.M.; González-Estrada, R.R.; Blancas-Benitez, F.J.; Fonseca-Cantabrana, Á. Utilización de subproductos agroindustriales para la bioadsorción de metales pesados. TIP Rev. Espec. En Cienc. Quím.-Biológicas 2020, 23. [Google Scholar] [CrossRef]
- Vallejo Aguilar, M. de la L.A.; Marín Castro, M.A.; Ramos Cassellis, M.E.; Silva Gómez, S.E.; Ibarra Cantún, D.; Tamariz Flores, J.V.; Vallejo Aguilar, M. de la L.A.; Marín Castro, M.A.; Ramos Cassellis, M.E.; Silva Gómez, S.E.; et al. Biosorción y tolerancia de Pb, Cr y Cd por la biomasa de Pleurotus ostreatus (Jacq. Ex Fr.) P. Kumm. Rev. Mex. Cienc. Agríc. 2021, 12, 275–289. [Google Scholar] [CrossRef]
- Moreno, L.G.N.; Velasco, L.V.; Cordero, A.R.; González, J.M. Contaminación y hongos: resistencia a metales pesados. LATAM Rev. Latinoam. Cienc. Soc. Humanidades 2022, 3, 215–232. [Google Scholar] [CrossRef]
- Hamid, N.H.A.; Rushdan, A.I.; Nordin, A.H.; Husna, S.M.N.; Faiz Norrrahim, M.N.; Knight, V.F.; Tahir, M.I.H.M.; Li, G.X.; Quan, T.L.; Abdullah, A.M.; et al. A State-of-Art Review on the Sustainable Technologies for Cadmium Removal from Wastewater. Water Reuse 2024, jwrd2024143. [Google Scholar] [CrossRef]
- Kumar, K.; Singh, D. Toxicity and Bioremediation of the Lead: A Critical Review. Int. J. Environ. Health Res. 2024, 34, 1879–1909. [Google Scholar] [CrossRef]
- Chong, Z.T.; Soh, L.S.; Yong, W.F. Valorization of Agriculture Wastes as Biosorbents for Adsorption of Emerging Pollutants: Modification, Remediation and Industry Application. Results Eng. 2023, 17, 100960. [Google Scholar] [CrossRef]
- Ghaith, E.-S.I.; Rizvi, S.; Namasivayam, C.; Rahman, P.K.S.M. Removal of Cd++ from Contaminated Water Using Bio-Surfactant Modified Ground Grass as a Bio-Sorbent. In Proceedings of the 2019 Advances in Science and Engineering Technology International Conferences (ASET); March 2019; pp. 1–7. [Google Scholar]
- Balali-Mood, M.; Naseri, K.; Tahergorabi, Z.; Khazdair, M.R.; Sadeghi, M. Toxic Mechanisms of Five Heavy Metals: Mercury, Lead, Chromium, Cadmium, and Arsenic. Front. Pharmacol. 2021, 12. [Google Scholar] [CrossRef] [PubMed]
- Ghorbani, M.; Seyedin, O.; Aghamohammadhassan, M. Adsorptive Removal of Lead (II) Ion from Water and Wastewater Media Using Carbon-Based Nanomaterials as Unique Sorbents: A Review. J. Environ. Manage. 2020, 254, 109814. [Google Scholar] [CrossRef]
- Bravo, C.; Quispe, L. Metales Pesados: Fuentes y su Toxicidad sobre la Salud Humana. Ciencias 2019, 2, 20–36. [Google Scholar] [CrossRef]
- Londoño Franco, L.F.; Londoño Muñoz, P.T.; Muñoz Garcia, F.G. Los Riesgos De Los Metales Pesados En La Salud Humana Y Animal. Biotecnoloía En El Sect. Agropecu. Agroindustrial 2016, 14, 145. [Google Scholar] [CrossRef]
- Figueroa, R.; Caicedo, D.; Echeverry, G.; Peña, M.; Méndez, F.; Figueroa, R.; Caicedo, D.; Echeverry, G.; Peña, M.; Méndez, F. Condición socioeconómica, patrones de alimentación y exposición a metales pesados en mujeres en edad fértil de Cali, Colombia. Biomédica 2017, 37, 341–352. [Google Scholar] [CrossRef] [PubMed]
- Irfan, M.; Liu, X.; Hussain, K.; Mushtaq, S.; Cabrera, J.; Zhang, P. The Global Research Trend on Cadmium in Freshwater: A Bibliometric Review. Environ. Sci. Pollut. Res. 2023, 30, 71585–71598. [Google Scholar] [CrossRef]
- Khan, Z.; Elahi, A.; Bukhari, D.A.; Rehman, A. Cadmium Sources, Toxicity, Resistance and Removal by Microorganisms-A Potential Strategy for Cadmium Eradication. J. Saudi Chem. Soc. 2022, 26, 101569. [Google Scholar] [CrossRef]
- Domínguez, E.G.; Noriega, R.R.; Villanueva, J.L.; Francisco, R.B. Modelo de Thomas Para La Cinética de Adsorción Del Azul de Metileno Mediante El Residuo Del Fruto de Encino: Thomas Model for Methylene Blue Adsorption Kinetics Using Oak Fruit Residue. South Fla. J. Dev. 2022, 3, 5250–5259. [Google Scholar] [CrossRef]
- Soliman, N.K.; Moustafa, A.F. Industrial Solid Waste for Heavy Metals Adsorption Features and Challenges; a Review. J. Mater. Res. Technol. 2020, 9, 10235–10253. [Google Scholar] [CrossRef]
- Malik, D.S.; Jain, C.K.; Yadav, A.K. Heavy Metal Removal by Fixed-Bed Column – A Review. ChemBioEng Rev. 2018, 5, 173–179. [Google Scholar] [CrossRef]
- Vázquez-Guerrero, A.; Alfaro-Cuevas-Villanueva, R.; Rutiaga-Quiñones, J.G.; Cortés-Martínez, R. Fluoride Removal by Aluminum-Modified Pine Sawdust: Effect of Competitive Ions. Ecol. Eng. 2016, 94, 365–379. [Google Scholar] [CrossRef]
- Sharma, A.; Anjana; Rana, H.; Goswami, S. A Comprehensive Review on the Heavy Metal Removal for Water Remediation by the Application of Lignocellulosic Biomass-Derived Nanocellulose. J. Polym. Environ. 2022, 30, 1–18. [Google Scholar] [CrossRef]
- Abdić, Š.; Memić, M.; Šabanović, E.; Sulejmanović, J.; Begić, S. Adsorptive Removal of Eight Heavy Metals from Aqueous Solution by Unmodified and Modified Agricultural Waste: Tangerine Peel. Int. J. Environ. Sci. Technol. 2018, 15, 2511–2518. [Google Scholar] [CrossRef]
- Ganesan, S. Waste Fruit Cortexes for the Removal of Heavy Metals from Water. In Green Adsorbents to Remove Metals, Dyes and Boron from Polluted Water; Inamuddin, Ahamed, M.I., Lichtfouse, E., Asiri, A.M., Eds.; Química ambiental para un mundo sostenible; Springer International Publishing: Cham, 2021; pp. 323–350. ISBN 978-3-030-47400-3. [Google Scholar]
- Nathan, R.J.; Martin, C.E.; Barr, D.; Rosengren, R.J. Simultaneous Removal of Heavy Metals from Drinking Water by Banana, Orange and Potato Peel Beads: A Study of Biosorption Kinetics. Appl. Water Sci. 2021, 11, 116. [Google Scholar] [CrossRef]
- Abatal, M.; Olguin, M.T.; Anastopoulos, I.; Giannakoudakis, D.A.; Lima, E.C.; Vargas, J.; Aguilar, C. Comparison of Heavy Metals Removal from Aqueous Solution by Moringa Oleifera Leaves and Seeds. Coatings 2021, 11, 508. [Google Scholar] [CrossRef]
- Quyen, V. thi; Pham, T.-H.; Kim, J.; Thanh, D.M.; Thang, P.Q.; Van Le, Q.; Jung, S.H.; Kim, T. Biosorbent Derived from Coffee Husk for Efficient Removal of Toxic Heavy Metals from Wastewater. Chemosphere 2021, 284, 131312. [Google Scholar] [CrossRef] [PubMed]
- Ezeonuegbu, B.A.; Machido, D.A.; Whong, C.M.Z.; Japhet, W.S.; Alexiou, A.; Elazab, S.T.; Qusty, N.; Yaro, C.A.; Batiha, G.E.-S. Agricultural Waste of Sugarcane Bagasse as Efficient Adsorbent for Lead and Nickel Removal from Untreated Wastewater: Biosorption, Equilibrium Isotherms, Kinetics and Desorption Studies. Biotechnol. Rep. 2021, 30, e00614. [Google Scholar] [CrossRef]
- Hashem, A.; Aniagor, C.O.; Farag, S.; Aly, A.A. Adsorption of Acid Violet 90 Dye onto Activated Carbon and Guava Seed Powder Adsorbents. Biomass Convers. Biorefinery 2023. [Google Scholar] [CrossRef]
- Zewail, T.M.; El-Garf, S.A.M. Preparation of Agriculture Residue Based Adsorbents for Heavy Metal Removal. Desalination Water Treat. 2010, 22, 363–370. [Google Scholar] [CrossRef]
- Parate, V.R.; Gulve, R.; Labhane, U.C.; I. Talib, M. Study of Metal Adsorbent Prepared from Guava Seeds. IOSR J. Environ. Sci. Toxicol. Food Technol. 2016, 10, 73–82. [Google Scholar] [CrossRef]
- Ortíz-Gutiérrez, M.; Alfaro-Cuevas-Villanueva, R.; Martínez-Miranda, V.; Hernández-Cristóbal, O.; Cortés-Martínez, R. Reduction and Biosorption of Cr(VI) from Aqueous Solutions by Acid-Modified Guava Seeds: Kinetic and Equilibrium Studies. Pol. J. Chem. Technol. 2020, 22, 36–47. [Google Scholar] [CrossRef]
- Ramos-Vargas, S.; Alfaro-Cuevas-Villanueva, R.; Huirache-Acuña, R.; Cortés-Martínez, R. Removal of Fluoride and Arsenate from Aqueous Solutions by Aluminum-Modified Guava Seeds. Appl. Sci. 2018, 8, 1807. [Google Scholar] [CrossRef]
- Sorption and Recovery of Platinum from Simulated Spent Catalyst Solution and Refinery Wastewater Using Chemically Modified Biomass as a Novel Sorbent | SpringerLink. Available online: https://link.springer.com/article/10.1007/s11356-018-1351-5 (accessed on 19 April 2023).
- Removal of Heavy Metal Ions from Wastewater by Chemically Modified Plant Wastes as Adsorbents: A Review - ScienceDirect. Available online: https://www.sciencedirect.com/science/article/abs/pii/S0960852407005068 (accessed on 19 April 2023).
- Warchoł, J.; Misaelides, P.; Petrus, R.; Zamboulis, D. Preparation and Application of Organo-Modified Zeolitic Material in the Removal of Chromates and Iodides. J. Hazard. Mater. 2006, 137, 1410–1416. [Google Scholar] [CrossRef] [PubMed]
- Fatimah, I.; Sahroni, I.; Dahlyani, M.S.E.; Oktaviyani, A.M.N.; Nurillahi, R. Surfactant-Modified Salacca Zalacca Skin as Adsorbent for Removal of Methylene Blue and Batik’s Wastewater. Mater. Today Proc. 2021, 44, 3211–3216. [Google Scholar] [CrossRef]
- Qin, H.; Hu, T.; Zhai, Y.; Lu, N.; Aliyeva, J. The Improved Methods of Heavy Metals Removal by Biosorbents: A Review. Environ. Pollut. 2020, 258, 113777. [Google Scholar] [CrossRef]
- Pradhan, N.; Rani, R.; David, J. A Review on Utility of An Astonishing Fruit: Psidium Guajava (Guava). J. Sci. Technol. JST 2021, 6, 60–72. [Google Scholar] [CrossRef]
- Kumar, K.; Ahmed, N.; Rizvi, Q.-U.-E.H.; Jan, S.; Thakur, P.; Chauhan, D.; Kaur, J. Guava Wastes and By-Products: Chemistry, Processing, and Utilization. In Handbook of Fruit Wastes and By-Products; CRC Press, 2022 ISBN 978-1-00-316446-3.
- Gavhane, A.; Dighe, P.; Kour, A.; Author, C.; Chopade, S. The Nutritional and Bioactive Potential of Guava and Possibilities for Its Commercial Application in Value- Added Products. 2022, 11, 2643–2647.
- Omayio, D.G.; Abong’, G.O.; Okoth, M.W.; Gachuiri, C.K.; Mwang’ombe, A.W. Trends and Constraints in Guava (Psidium Guajava L.) Production, Utilization, Processing and Preservation in Kenya. Int. J. Fruit Sci. 2020, 20, S1373–S1384. [Google Scholar] [CrossRef]
- Sánchez-Sánchez, H.A.; Cortés-Martínez, R.; Alfaro-Cuevas, R. Fluoride Removal from Aqueous Solutions by Mechanically Modified Guava Seeds. Int. J. Sci. 2013, 11. [Google Scholar]
- Masry, B.A.; Madbouly, H.A.; Daoud, J.A. Studies on the Potential Use of Activated Carbon from Guava Seeds (AC-GS) as a Prospective Sorbent for the Removal of Cr(VI) from Aqueous Acidic Medium. Int. J. Environ. Anal. Chem. 2023, 103, 378–395. [Google Scholar] [CrossRef]
- Shkliarenko, Y.; Halysh, V.; Nesterenko, A. Adsorptive Performance of Walnut Shells Modified with Urea and Surfactant for Cationic Dye Removal. Water 2023, 15, 1536. [Google Scholar] [CrossRef]
- Mohamed Pauzan, A.S.; Ahad, N. Biomass Modification Using Cationic Surfactant Cetyltrimethylammonium Bromide (CTAB) to Remove Palm-Based Cooking Oil. J. Chem. 2018, 2018, 5059791. [Google Scholar] [CrossRef]
- Barboza, J.A.T.; Penido, E.S.; Ferreira, G.M.D. Production of Surfactant-Modified Banana Peel Biosorbents Applied to Treatment and Decolorization of Effluents. Colloids Surf. Physicochem. Eng. Asp. 2024, 680, 132650. [Google Scholar] [CrossRef]
- Omeiza Aroke, U.; El-Nafaty, U. XRF, XRD and FTIR Properties and Characterization of HDTMA-Br Surface Modified Organokaolinite Clay. Int. J. Emerg. Technol. Adv. Eng. 2014, 4, 817–825. [Google Scholar]
- Kim, J.; Kim, Y.; Jung, S.; Yun, H.; Won, S.; Yeo, H.; Choi, I.-G.; Kwak, H.W. Green Lignocellulosic Superadsorbent for Superior Pd(II) Removal and Cascade Catalytic Conversion. Sep. Purif. Technol. 2024, 332, 125732. [Google Scholar] [CrossRef]
- Wang, B.; Sun, Y.-C.; Sun, R.-C. Fractional and Structural Characterization of Lignin and Its Modification as Biosorbents for Efficient Removal of Chromium from Wastewater: A Review. J. Leather Sci. Eng. 2019, 1, 5. [Google Scholar] [CrossRef]
- Lin, Z.; Ye, Y.; Li, Q.; Xu, Z.; Wang, M. A Further Insight into the Biosorption Mechanism of Au(III) by Infrared Spectrometry. BMC Biotechnol. 2011, 11, 98. [Google Scholar] [CrossRef]
- Sura, N.; Okabe, H.; Omondi, B.A.; Mufundirwa, A.; Hidaka, Y.; Hara, K. Study on the Influence of Inductive Groups on the Performance of Carboxylate-Based Hydrogel Polymer Network. Polym. Test. 2019, 80, 106117. [Google Scholar] [CrossRef]
- Dinh, V.-P.; Nguyen, P.-T.; Tran, M.-C.; Luu, A.-T.; Hung, N.Q.; Luu, T.-T.; Kiet, H.A.T.; Mai, X.-T.; Luong, T.-B.; Nguyen, T.-L.; et al. HTDMA-Modified Bentonite Clay for Effective Removal of Pb(II) from Aqueous Solution. Chemosphere 2022, 286, 131766. [Google Scholar] [CrossRef]
- Chen, F.; Hong, M.; You, W.; Li, C.; Yu, Y. Simultaneous Efficient Adsorption of Pb2+ and MnO4− Ions by MCM-41 Functionalized with Amine and Nitrilotriacetic Acid Anhydride. Appl. Surf. Sci. 2015, 357, 856–865. [Google Scholar] [CrossRef]
- Ho, Y.S.; McKay, G.; Wase, D.A.J.; Forster, C.F. Study of the Sorption of Divalent Metal Ions on to Peat. Adsorpt. Sci. Technol. 2000, 18, 639–650. [Google Scholar] [CrossRef]
- Low, M.J.D. Kinetics of Chemisorption of Gases on Solids. Available online: https://pubs.acs.org/doi/pdf/10.1021/cr60205a003 (accessed on 28 August 2024).
- Lagergren, S. Zur theorie der sogenannten adsorption geloster stoffe. Kungliga Svenska Vetenskapsakademiens. Handlingar 1898, 24, 1–39. [Google Scholar]
- Abdallah, M.A.M.; Alprol, A.E. Utilization of Aquatic Biomass as Biosorbent for Sustainable Production of High Surface Area, Nano- Microporous, for Removing Two Dyes from Wastewater. Sci. Rep. 2024, 14, 4471. [Google Scholar] [CrossRef]
- Blaga, A.C.; Tanasă, A.M.; Cimpoesu, R.; Tataru-Farmus, R.-E.; Suteu, D. Biosorbents Based on Biopolymers from Natural Sources and Food Waste to Retain the Methylene Blue Dye from the Aqueous Medium. Polymers 2022, 14, 2728. [Google Scholar] [CrossRef]
- Dharsana, M.; Jose, J.P.A. Adsorption of Lead from Contaminated Water Using Biosorbent. Mater. Technol. 2022, 56, 171–177. [Google Scholar] [CrossRef]
- Bayuo, J.; Rwiza, M.; Abukari, M.A.; Pelig-Ba, K.B.; Mtei, K. Modeling and Optimization of Independent Factors Influencing Lead(II) Biosorption from Aqueous Systems: A Statistical Approach. Sci. Afr. 2022, 16, e01270. [Google Scholar] [CrossRef]
- Effect of pH on Cadmium Bio-Sorption by Myriophyllum Spicatum. Available online: http://www.hjkxyj.org.cn/en/article/id/20091116 (accessed on 18 November 2024).
- Li, X.; Xiao, Q.; Shao, Q.; Li, X.; Kong, J.; Liu, L.; Zhao, Z.; Li, R. Adsorption of Cd (II) by a Novel Living and Non-Living Cupriavidus Necator GX_5: Optimization, Equilibrium and Kinetic Studies. BMC Chem. 2023, 17, 54. [Google Scholar] [CrossRef] [PubMed]
- Tunali Akar, S.; Arslan, D.; Alp, T. Ammonium Pyrrolidine Dithiocarbamate Anchored Symphoricarpus Albus Biomass for Lead(II) Removal: Batch and Column Biosorption Study. J. Hazard. Mater. 2012, 227–228, 107–117. [Google Scholar] [CrossRef]
- Ofomaja, A.E.; Naidoo, E.B.; Modise, S.J. Biosorption of Copper(II) and Lead(II) onto Potassium Hydroxide Treated Pine Cone Powder. J. Environ. Manage. 2010, 91, 1674–1685. [Google Scholar] [CrossRef]
- Giles, C.H.; Smith, D.; Huitson, A. A General Treatment and Classification of the Solute Adsorption Isotherm. I. Theoretical. J. Colloid Interface Sci. 1974, 47, 755–765. [Google Scholar] [CrossRef]
- Bruna, F.; Celis, R.; Pavlovic, I.; Barriga, C.; Cornejo, J.; Ulibarri, M.A. Layered Double Hydroxides as Adsorbents and Carriers of the Herbicide (4-Chloro-2-Methylphenoxy)Acetic Acid (MCPA): Systems Mg–Al, Mg–Fe and Mg–Al–Fe. J. Hazard. Mater. 2009, 168, 1476–1481. [Google Scholar] [CrossRef]
- Zhao, N.; Yang, C. Influence of Nonionic Surfactants on the Adsorption and Elution of Atrazine in Agriculturally Modified Soils. Agriculture 2024, 14, 733. [Google Scholar] [CrossRef]
- Katsou, E.; Malamis, S.; Tzanoudaki, M.; Haralambous, K.J.; Loizidou, M. Regeneration of Natural Zeolite Polluted by Lead and Zinc in Wastewater Treatment Systems. J. Hazard. Mater. 2011, 189, 773–786. [Google Scholar] [CrossRef] [PubMed]
- Tran, H.N.; Chao, H.-P. Adsorption and Desorption of Potentially Toxic Metals on Modified Biosorbents through New Green Grafting Process. Environ. Sci. Pollut. Res. 2018, 25, 12808–12820. [Google Scholar] [CrossRef] [PubMed]
- Stirk, W.A.; Staden, J. van Desorption of Cadmium and the Reuse of Brown Seaweed Derived Products as Biosorbents. 2002; 45, 9–16. [Google Scholar] [CrossRef]
- Alfaro-Cuevas-Villanueva, R.; Hidalgo-Vázquez, A.R.; Cortés Penagos, C. de J.; Cortés-Martínez, R. Thermodynamic, Kinetic, and Equilibrium Parameters for the Removal of Lead and Cadmium from Aqueous Solutions with Calcium Alginate Beads. Sci. World J. 2014, 2014, 647512. [Google Scholar] [CrossRef]
- Bashir, A.; Malik, L.A.; Ahad, S.; Manzoor, T.; Bhat, M.A.; Dar, G.N.; Pandith, A.H. Removal of Heavy Metal Ions from Aqueous System by Ion-Exchange and Biosorption Methods. Environ. Chem. Lett. 2019, 17, 729–754. [Google Scholar] [CrossRef]
- Tran, H.N.; You, S.-J.; Chao, H.-P. Thermodynamic Parameters of Cadmium Adsorption onto Orange Peel Calculated from Various Methods: A Comparison Study. J. Environ. Chem. Eng. 2016, 4, 2671–2682. [Google Scholar] [CrossRef]
- Costanzo, F.; Silvestrelli, P.L.; Ancilotto, F. Physisorption, Diffusion, and Chemisorption Pathways of H2 Molecule on Graphene and on (2,2) Carbon Nanotube by First Principles Calculations. J. Chem. Theory Comput. 2012, 8, 1288–1294. [Google Scholar] [CrossRef] [PubMed]
- Elanza, S.; Taouil, H.; Amine, A.; Doubi, M.; Lebkiri, A.; Rifi, El. Thermodynamic Study and Mathematical Modeling of Adsorption of Co2+ Ions on Biopolymers Based of Sugarcane Bagasse. Orient. J. Chem. 2017, 33, 3204–3210. [Google Scholar] [CrossRef]
| Biosorbent | Model parameters | ||||||||
|---|---|---|---|---|---|---|---|---|---|
| Lagergren | Pseudo-second-order | Elovich | |||||||
| KL (min-1) |
qe (mg/g) |
R | K2 (g/mg·min) |
qe (mg/g) |
R | a (mg/g.min) |
b (g/mg) |
R | |
| SN | 0.8511 | 1.0629 | 0.9930 | 0.0720 | 1.1482 | 0.9572 | 0.2040 | 2.9735 | 0.8362 |
| SM | 1.0710 | 1.5260 | 0.9995 | 2.9738 | 1.5290 | 0.9994 | 2.7142 | 5.1468 | 0.9576 |
| Biosorbent | Model parameters | ||||||||
|---|---|---|---|---|---|---|---|---|---|
| Lagergren | Pseudo-second-order | Elovich | |||||||
| KL (min-1) |
qe (mg/g) |
R | K2 (g/mg·min) |
qe (mg/g) |
R | a (mg/g.min) |
b (g/mg) |
R | |
| SN | 0.0690 | 1.1537 | 0.9460 | 0.0788 | 1.2225 | 0.9670 | 0.0371 | 3.2305 | 0.9650 |
| SM | 0.0559 | 1.0790 | 0.9343 | 0.0719 | 1.1482 | 0.9572 | 0.0205 | 2.9736 | 0.8357 |
| T (K) | Cd | Pb | ||||
|---|---|---|---|---|---|---|
| ∆Go (KJ/mol) |
∆Ho (KJ/mol) |
∆So (J/mol-K) |
∆Go (KJ/mol) |
∆Ho (KJ/mol) |
∆So (J/mol-K) |
|
| 298.15 | 2.262 | 2.56 | -55.95 | -3.00 | -2.204 | 2.233 |
| 308.15 | 2.252 | -3.10 | ||||
| 318.15 | 2.242 | -3.20 | ||||
| 318.15 | -25.015 | -11.323 | ||||
| T (K) | Cd | Pb | ||||
|---|---|---|---|---|---|---|
| ∆Go (KJ/mol) |
∆Ho (KJ/mol) |
∆So (J/mol-K) |
∆Go (KJ/mol) |
∆Ho (KJ/mol) |
∆So (J/mol-K) |
|
| 298.15 | -24.995 | -24.69 | 88.1 | -11.303 | -25.015 | 42.34 |
| 308.15 | -25.005 | -11.313 | ||||
Disclaimer/Publisher’s Note: The statements, opinions and data contained in all publications are solely those of the individual author(s) and contributor(s) and not of MDPI and/or the editor(s). MDPI and/or the editor(s) disclaim responsibility for any injury to people or property resulting from any ideas, methods, instructions or products referred to in the content. |
© 2024 by the authors. Licensee MDPI, Basel, Switzerland. This article is an open access article distributed under the terms and conditions of the Creative Commons Attribution (CC BY) license (https://creativecommons.org/licenses/by/4.0/).


