1. Introduction
Recent assessments on extreme wildfire events and their trends indicate that areas such as the Mediterranean could be exposed to more events of this kind, possibly linked to anthropogenic climate change [
1,
2,
3].
Extreme wildfire events generally have a common factor, which is the phenomenon of pyroconvection [
4,
5]. This phenomenon results in fire convection columns extending to the middle and upper troposphere [
6]. The typical framework of pyroconvection are flammagenitus (or fire) clouds that develop above the smoke plumes linked to a fire event [
7]. These clouds, known as pyrocumulonimbus and pyrocumulus, as well as their post-development dynamics influence the transport of smoke particles and hot gases, which then contribute to the formation of additional clouds following condensation processes [
8]. These dynamics can result into several effects that increase the potential of extreme wildfire spreading, such as lightnings of pyrogenic nature [
9,
10,
11], the injection of aerosols as high as the lower stratosphere [
12,
13], additional fire growth [
13], and significant changes both in surface winds [
15,
16,
17] and synoptic-scale flows [
18].
The summer 2021 wildfire crisis in the central Mediterranean area and neighboring regions. EFFIS, the European Forest Fire Information System, issued a comprehensive report on the effects of these extreme events on European ecosystems [
19].
Türkiye has a natural vulnerability to wildfire across multiple regions of the country and the 2021 crisis resulted into unprecedented wildfire occurrences [
20] that challenged the country’s capacity to detect them in time and counter the hazard efficiently [
21]. The alteration of landscapes resulted in increased exposure to flood hazards [
22]. The damage to biodiversity was also notable [
23,
24,
25]. In addition to the main hazards and damage linked to wildfire occurrences, air quality was also affected [
26,
27]. Satellite data from Sentinel-2 and Sentinel-5P allowed an assessment of burn severity and CO emissions linked to Turkish fires [
28]. The impact of these wildfires on air quality was also assessed via the integration of satellite data with ground measurements [
29].
In Greece, heat waves affected the summer 2021 and triggered a number of wildfires [
30]. Fires with similar degrees of intensity were not seen in Greece for 13 years, since the previous summer crisis of 2007 which resulted in the loss of more than 12% of Greece’s forested areas [
31,
32,
33,
34,
35,
36,
37], however their damage was considerable, and the country’s early warning systems were challenged [
38]. Research research also evidenced the susceptibility of the country’s wildfire hazard to synoptic scale drivers [
39]. Overall, both Greece and Türkiye were very heavily affected, and surveys attempted to provide a reliable estimate on the combined impact of wildfire-related emissions in the eastern Mediterranean sector [
40].
In Italy, fires affected several regions [
41] and the atmospheric outputs of these events have also been observed by WMO/GAW (World Meteorological Organization—Global Atmosphere Watch) observation sites across the country [
42,
43]. Among the Italian regions affected by the 2021 crisis, Calabria reported extensive wildfire events especially in the southern area of the region, with coincides with the southernmost area of the entire Italian peninsula, in the Aspromonte National Park [
43]. The 2021 crisis led to a more detailed analysis on the areas affected by these events in Italy: areas with intense land abandonment have showed to be vulnerable to such events [
44]. The effects on air quality were also assessed [
45], as well as the increase in soil exposure to erosion [
46].
In this research, three among the main products of wildfires will be analyzed using a combination of ground measurements, satellite data on tropospheric column concentrations, and both methods when applicable: carbon monoxide (CO, ground and satellite), formaldehyde (HCHO, satellite), and black carbon (BC, ground). Ground measurements have been performed at the WMO/GAW observation site of Lamezia Terme (code: LMT) in Calabria, Southern Italy.
Carbon monoxide is a primary output of combustion and is attributed to both anthropogenic and natural sources [
47,
48]; among the carbon compounds present in the atmosphere, carbon monoxide is now characterized by a declining trend [
49], likely linked to more sustainable policies [
50] and efficient combustion engines introduced ever since the 2000s [
51]. Prior to these measures, atmospheric carbon dioxide trends and annual emissions were considerable [
52]. However, the annual decline rate has lowered in the past few years also due to notable wildfire-related outputs [
53,
54]. CO is used as an effective tracer of wildfire emissions [
43]
Formaldehyde (FA) is a carcinogen and mutagen [
55,
56] characterized by multiple sources: wildfires contribute to outdoor HCHO concentrations in the atmosphere [
57,
58,
59], in addition to anthropogenic sources such as the combustion of coal, industrial activities, manufacturing, and others [
60,
61,
62]. Formaldehyde also poses a considerable indoor air quality (IAQ) risk due to releases from wooden furniture, tobacco smoking, and other sources which combine with poor indoor ventilation and further increase exposure-related risks [
63,
64,
65,
66,
67].
Black carbon, or soot, is a relevant product of combustion processes, like CO [
48]. Wildfires are known to result in notable BC emissions into the atmosphere [
68]. Black carbon poses health hazards [
69,
70,
71] and is also capable of altering Earth’s climate via perturbations in radiative forcing [
72,
73,
74]. It has a high GWP (global warming potential) [
75], which is counterbalanced by its short persistence time in the atmosphere [
76,
77].
The paper is divided as follows:
Section 2 describes the observation site of LMT, its findings and their implications on the diffusion of greenhouse gases and pollutants;
Section 3 reports the methods used for analysis and evaluations, as well as those employed for data gathering;
Section 4 and
Section 5 focus on results and discussion, respectively;
Section 6 closes the paper with a summary of this study’s findings and their implications.
2. The LMT Observation Site
Located 600 meters from the Tyrrhenian coast of Calabria, Southern Italy, the Lamezia Terme (LMT) observation site (Lat: 38°52.605′ N; Lon: 16°13.946′ E; Alt: 6 m a.s.l.) is a regional WMO/GAW (World Meteorological Organization—Global Atmosphere Watch) performing continuous measurements of greenhouse gases, aerosols, key meteorological data, and other parameters. Located in the westernmost area of the Catanzaro isthmus, which is the narrowest point in the entire Italian peninsula (≈31 kilometers between the Tyrrhenian and Ionian coasts), the site is affected by a local wind circulation pattern that is well oriented on the W/NE axis, as described in two works by Federico et al. (2010a, 2010b) [
78,
79]. Wind circulation also has an impact on local air traffic, as the runway orientation of the Lamezia Terme International Airport (IATA: SUF; ICAO: LICA) located 3 kilometers north from the WMO station is 10/28 (100/280 °N).
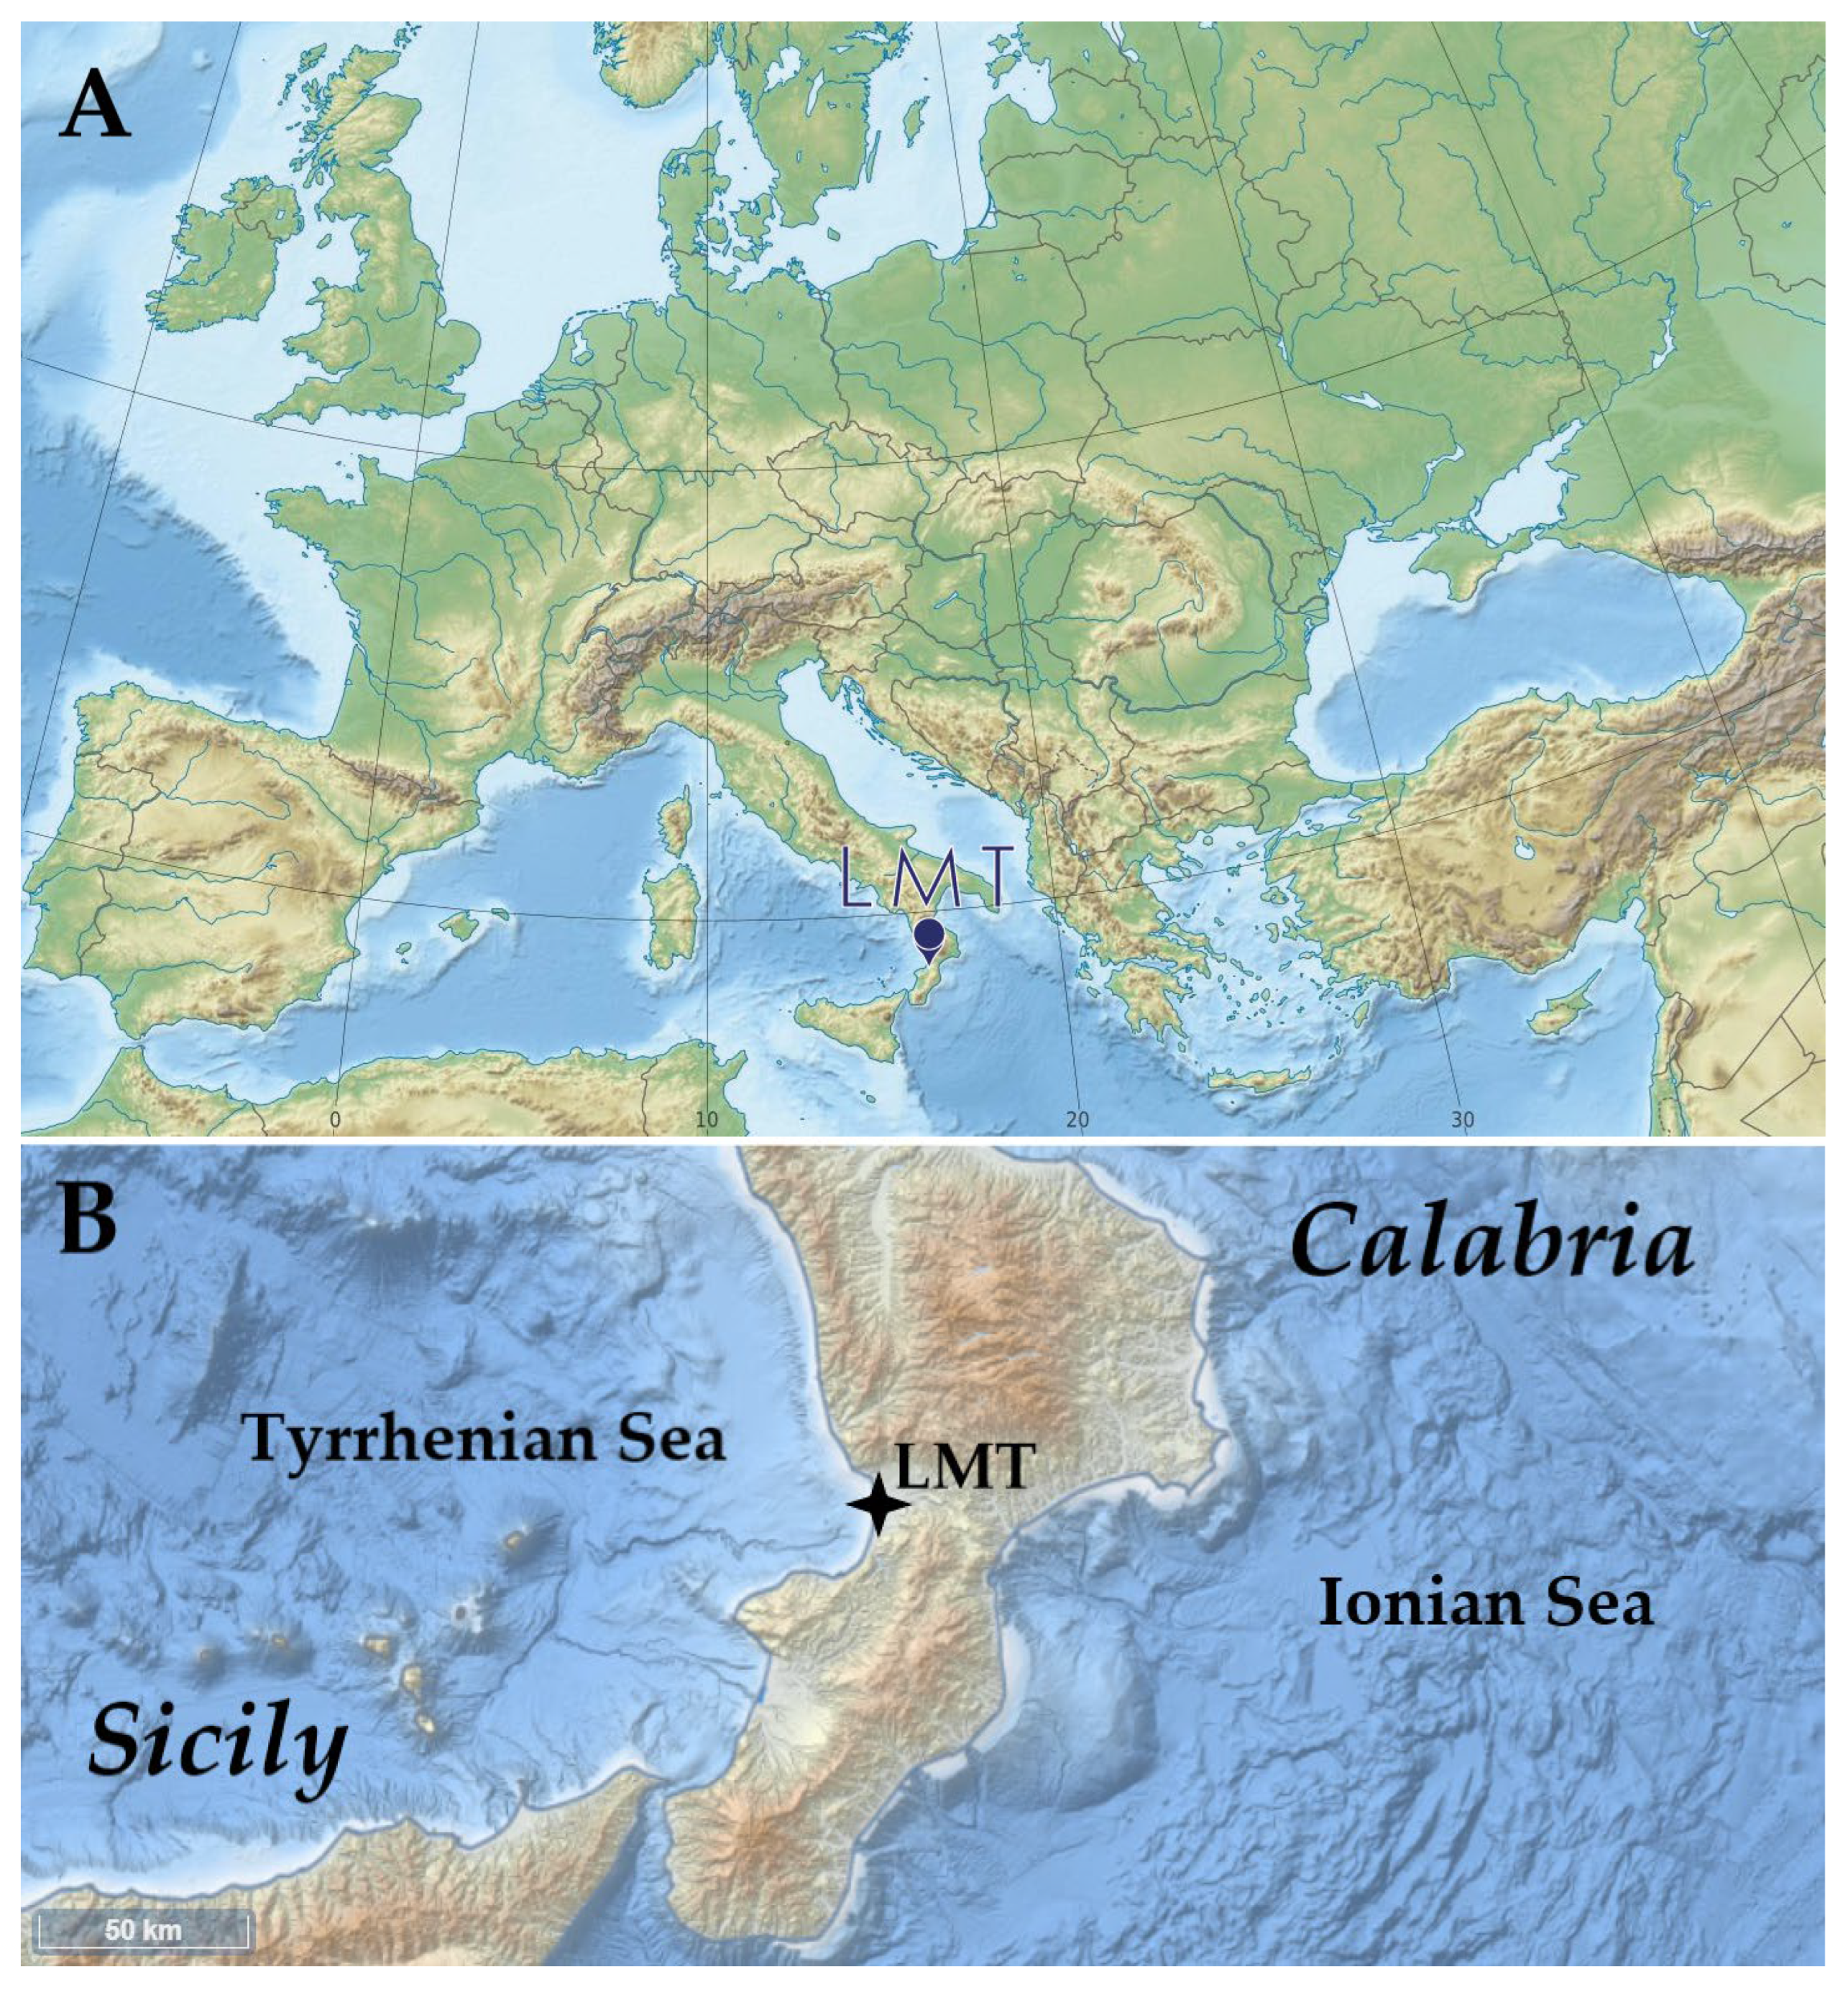
Figure 1.
A: LMT’s location in the central Mediterranean basin. B: Modified EMODnet [
80] map showing LMT’s location in the southern Italian region of Calabria.
Figure 1.
A: LMT’s location in the central Mediterranean basin. B: Modified EMODnet [
80] map showing LMT’s location in the southern Italian region of Calabria.
The station’s location in the center of the Mediterranean exposes its observations to Saharan dust events [
81] and summer open fire emissions [
43]. During LMT’s observation history, local wind circulation has been characterized using different methodologies, such as the analysis of vertical wind profiles [
82] and PBL variability [
83,
84,
85]. An analysis of solar radiation using several methodologies was also performed [
86]. With respect to reactive gases, the study by Cristofanelli et al. (2017) [
87] provided a milestone characterization of the site with remarks on a number of local emission sources (
e.g., the above-mentioned airport, livestock farming, the A2 highway). Some of these sources could be characterized even further in a study on the first COVID-19 lockdown of 2020 and the exceptional circumstances of reduced anthropic activities that followed [
88]. Additional details on specific greenhouse gases became available in cyclic and multi-year studies: in D’Amico et al. (2024a) [
89], seven continuous years of methane (CH
4) measurements showed that emission peaks were linked to northeastern-continental winds, while western-seaside winds yielded lower values. A seasonal influence was also observed, with winter and summer yielding the highest and lowest concentrations, respectively. Methane concentrations at the site have also shown a strong correlation with wind speeds in a so-defined HBP (Hyperbola Branch Pattern), as the highest concentrations were linked to low speeds and, vice versa, the lowest mole fractions were correlated with high speeds, further demonstrating the influence of local emission sources. A study on surface ozone (O
3) however demonstrated that these patterns are not constant among gases, as ozone showed a “reversed” pattern adding additional complexity to the correlations between winds and other parameters on a local scale [
90]. The analysis of gases and aerosols at LMT also involved cross-station research with other southern Italian stations [
91,
92] and the evaluation of weekly patterns in pollutants to discriminate natural and anthropogenic outputs [
93]. In D’Amico et al. (2024e) [
94] an additional level of complexity was observed on the nature of LMT measurements: the study, which assessed peplospheric influences on a number of parameters at the site, evidenced the presence of four wind regime categories affecting LMT data gathering that need to be taken in consideration.
3. Data gathering and analysis
Carbon monoxide (CO) mole fractions in ppm (parts per million) have been gathered by a Picarro G2401 (Santa Clara, California, USA) CRDS (Cavity Ring-Down Spectrometry) [
95,
96] analyzer. The same instrument also gathers data on CO
2 (carbon dioxide), CH
4 (methane) and H
2O (water vapor). The principle of CRD spectroscopy allows to measure, with high degrees of precision, the concentration of trace gases in the atmosphere. The G2401 analyzer at LMT gathered data every 5 seconds with a precision of 1 ppb, and the resulting outputs have been aggregated on hourly or daily basis, depending on the evaluation. More details concerning G2401 measurements at LMT are available in Malacaria et al. (2024) [
43] and D’Amico et al. (2024a) [
89].
The tropospheric density of CO and HCHO (or FA) in the vertical column have been obtained by Sentinel-5P, an ESA (European Space Agency) satellite aimed at global air pollution monitoring launched as part of the Copernicus mission [
97]. 5P is in a low-Earth afternoon polar orbit yielding a swath of 2600 kilometers and carries TROPOMI (Tropospheric Monitoring Instrument), a device capable of advanced atmospheric monitoring spectrometry. TROPOMI scans have a spatial resolution of 3.5x5.5 kilometers and the signal-to-noise ratio is high. Operational Level 2 (L2) products are publicly available for use via the Copernicus platform [
98]. Data on daily observed columns are downloaded in netCDF format, and an algorithm set up at CNR ISAC parses through all parameters required for local data analysis at the LMT observatory. The analysis is divided into several steps: coordinates extraction (latitude and longitude); trace gas data analysis and its division into arrays correlated to a map focused on the region of interest; data processing via a filter applying a Q
a > 0.5 condition to the entire set; generation of a georeferenced map showing data filtered from the array; a direct comparison between select coordinates and satellite measurements nearby, with the selection of the minimum distance to the selected site with respect to the slightest reported distance in the array. Q
a is a data quality indicator whose assigned values range between 0 and 1: applicable manuals recommend a Q
a greater than 0.5 to exclude influences from a number of conditions such as ice/snow warnings, Solar Zenith Angle (SZA) ≤ 70°, cloud radiance fraction at 340 nm < 0.5, surface albedo ≤ 0.2, air mass factor > 0.1, and common error flags [
99,
100].
Ground indoor and outdoor measurements of formaldehyde at the site are limited to a summer 2021 campaign at the local INAIL (Italian National Institute for Insurance against Accidents at Work) department located nearby [
101]. Continuous measurements of surface HCHO at LMT are not available.
Black carbon (BC), and specifically equivalent black carbon (eBC) data in micrograms per cubic meter (μg/m
3 or μg PCM) have been gathered by a Thermo Scientific 5012 (Franklin, Massachusetts, USA) MAAP (Multi-Angle Absorption Photometer) [
102,
103,
104] performing measurements on a per-minute basis. More details concerning eBC data gathering at LMT via the MAAP are available in Malacaria et al. (2024) [
43] and D’Amico et al. (2024b) [
93].
Wind speed (m/s) and direction (°) at a near-ground level have been measured by a Vaisala WXT520 (Vantaa, Finland) weather station. The instrument also gathers data on relative humidity, pressure, accumulated rain, and temperature. Additional details on WXT520 measurements are available in D’Amico et al. (2024c) [
88].
Surface measurements at LMT between July and August 2021 are characterized by high coverage rates, shown in
Table 1 as percentages compared to the hours and days elapsed during the study period. All days are covered by surface measurements, while gaps of only a few hours, due to instrument calibration and maintenance, are limited. CO and eBC data have been further differentiated by wind sector: northeast (0-90 °N); southeast (90-180 °N); west (240-300 °N).
With respect to wildfire analysis on a Mediterranean scale, this research study relied on FIRMS productions to assess the locations of major wildfires prior to the evaluation of backtrajectories from the LMT observation site in Calabria. FIRMS (Fire Information for Resource Management System) provides NRT (Near Real-Time) data on active fires from the MODIS (Moderate Resolution Imaging Spectroradiometer) instrument aboard the Terra Aqua platform, and the VIIRS (Visible Infrared Imaging Radiometer Suite) abord the NOAA 20, NOAA 21, and S-NPP. Generally, gathered data on a global scale are available within three hours from satellite scanning. Thermal anomalies or active fires represent the center of a 1km pixel that is flagged by the MODIS MOD14/MYD14 Fire and Thermal Anomalies algorithm as containing one or more fires within the pixel [
105]. This is the most basic fire product in which active fires and other thermal anomalies, such as volcanoes, are identified. MCD14DL outputs are available in a number of formats (KML, TXT, WMS, and SHP), meant to be used by a variety of programs for data processing. Only the TXT and SHP formats, however, contain all the attributes. Collection 61 (C61) data effectively replaced Collection 6 (C6) in April 2021 [
106]. It is worth noting that C61 did not feature substantial upgrades in terms of algorithm, as the updates were mostly focused on improving the calibration in Terra and Aqua MODIS Level 1B data products. The analysis of fires and the consequent detection of daily active fires is obtained by FIRMS via sensors mounted on satellites; these sensors generally have swath widths in the 2300-3000 km range which provide two daily observations for most of Earth’s surface.
Backtrajectories aimed specifically at two case studies have been computed in HYSPLIT (Hybrid Single-Particle Lagrangian Integrated Trajectory) by NOAA’s (National Oceanic and Atmospheric Administration) Air Resources Laboratory [
107,
108]. The use of backtrajectories in case studies, combined with additional evaluations, can provide relevant information on specific emission sources [
109].
4. Results
4.1. Tropospheric and surface observations of CO, HCHO, and eBC
At the LMT observatory in Calabria, Southern Italy, Picarro G2401 and Thermo Scientific 5012 instruments gathered continuous data on carbon monoxide and black carbon, respectively. Data on surface meteorological parameters (wind direction and speed) have been gathered by a Vaisala WXT520. As shown in
Table 1, the coverage rates of all instruments between July and August are very high.
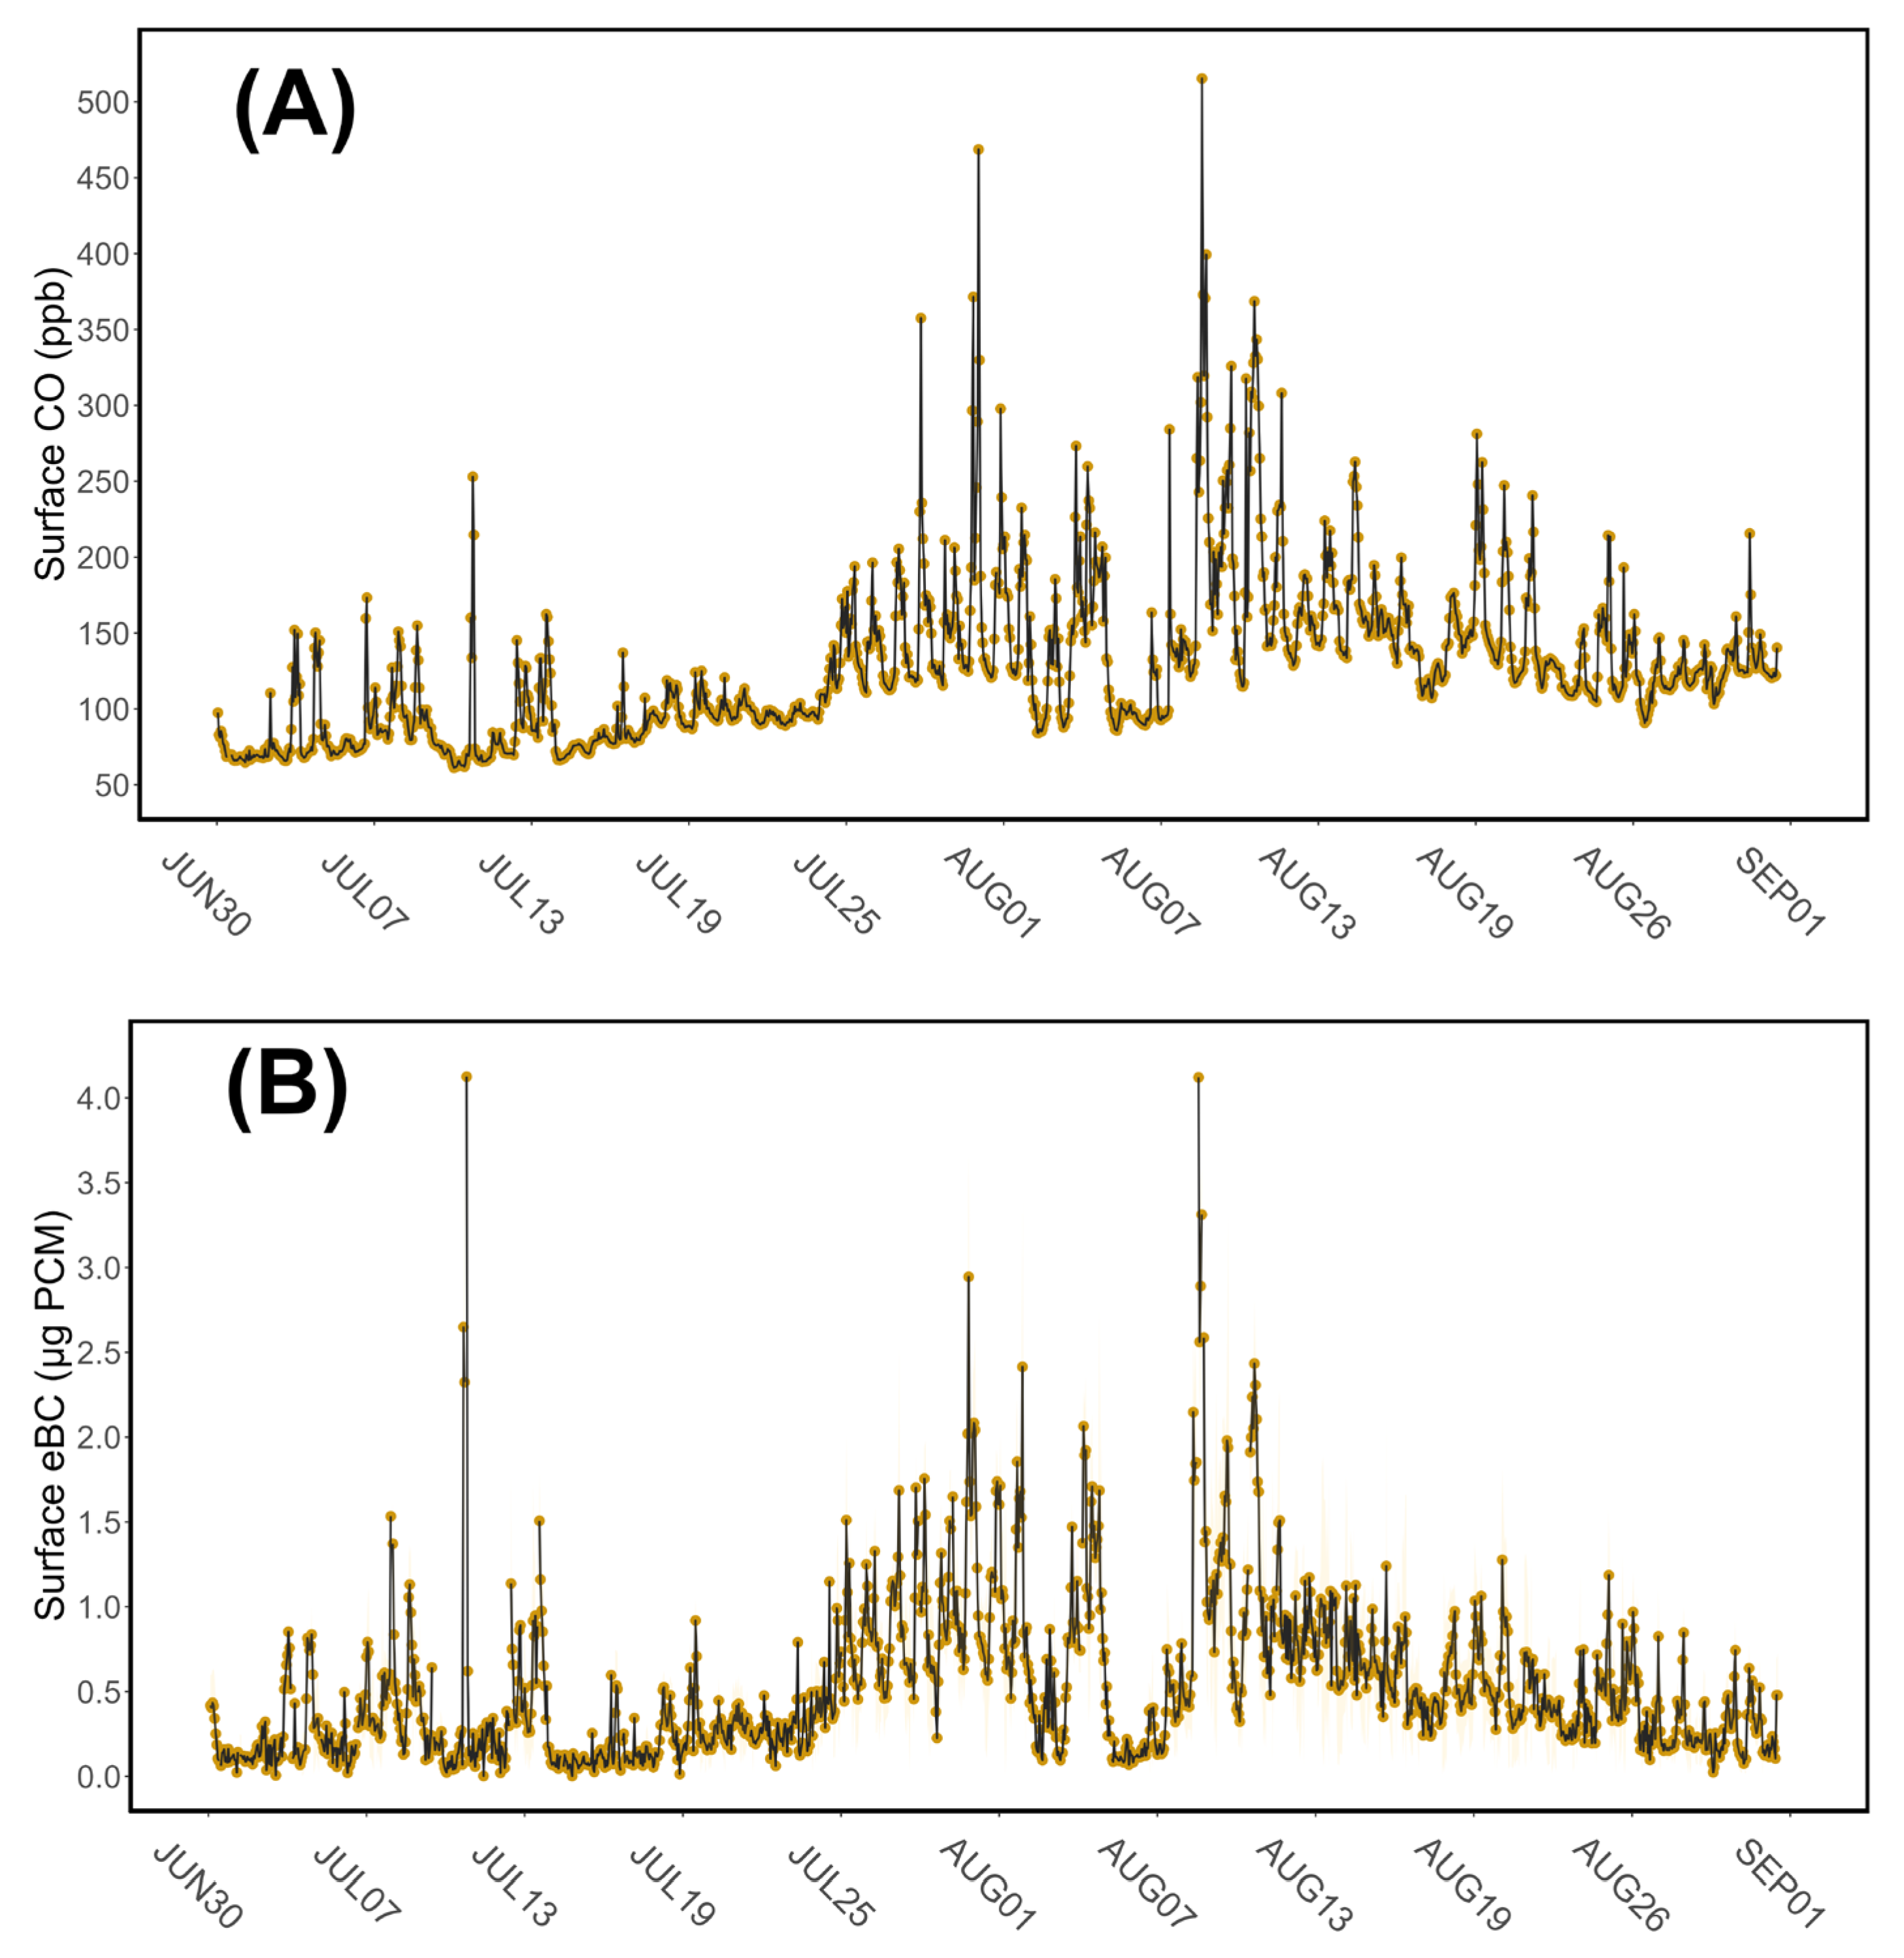
Figure 2 shows the hourly averages of carbon monoxide and equivalent back carbon during the observation period.
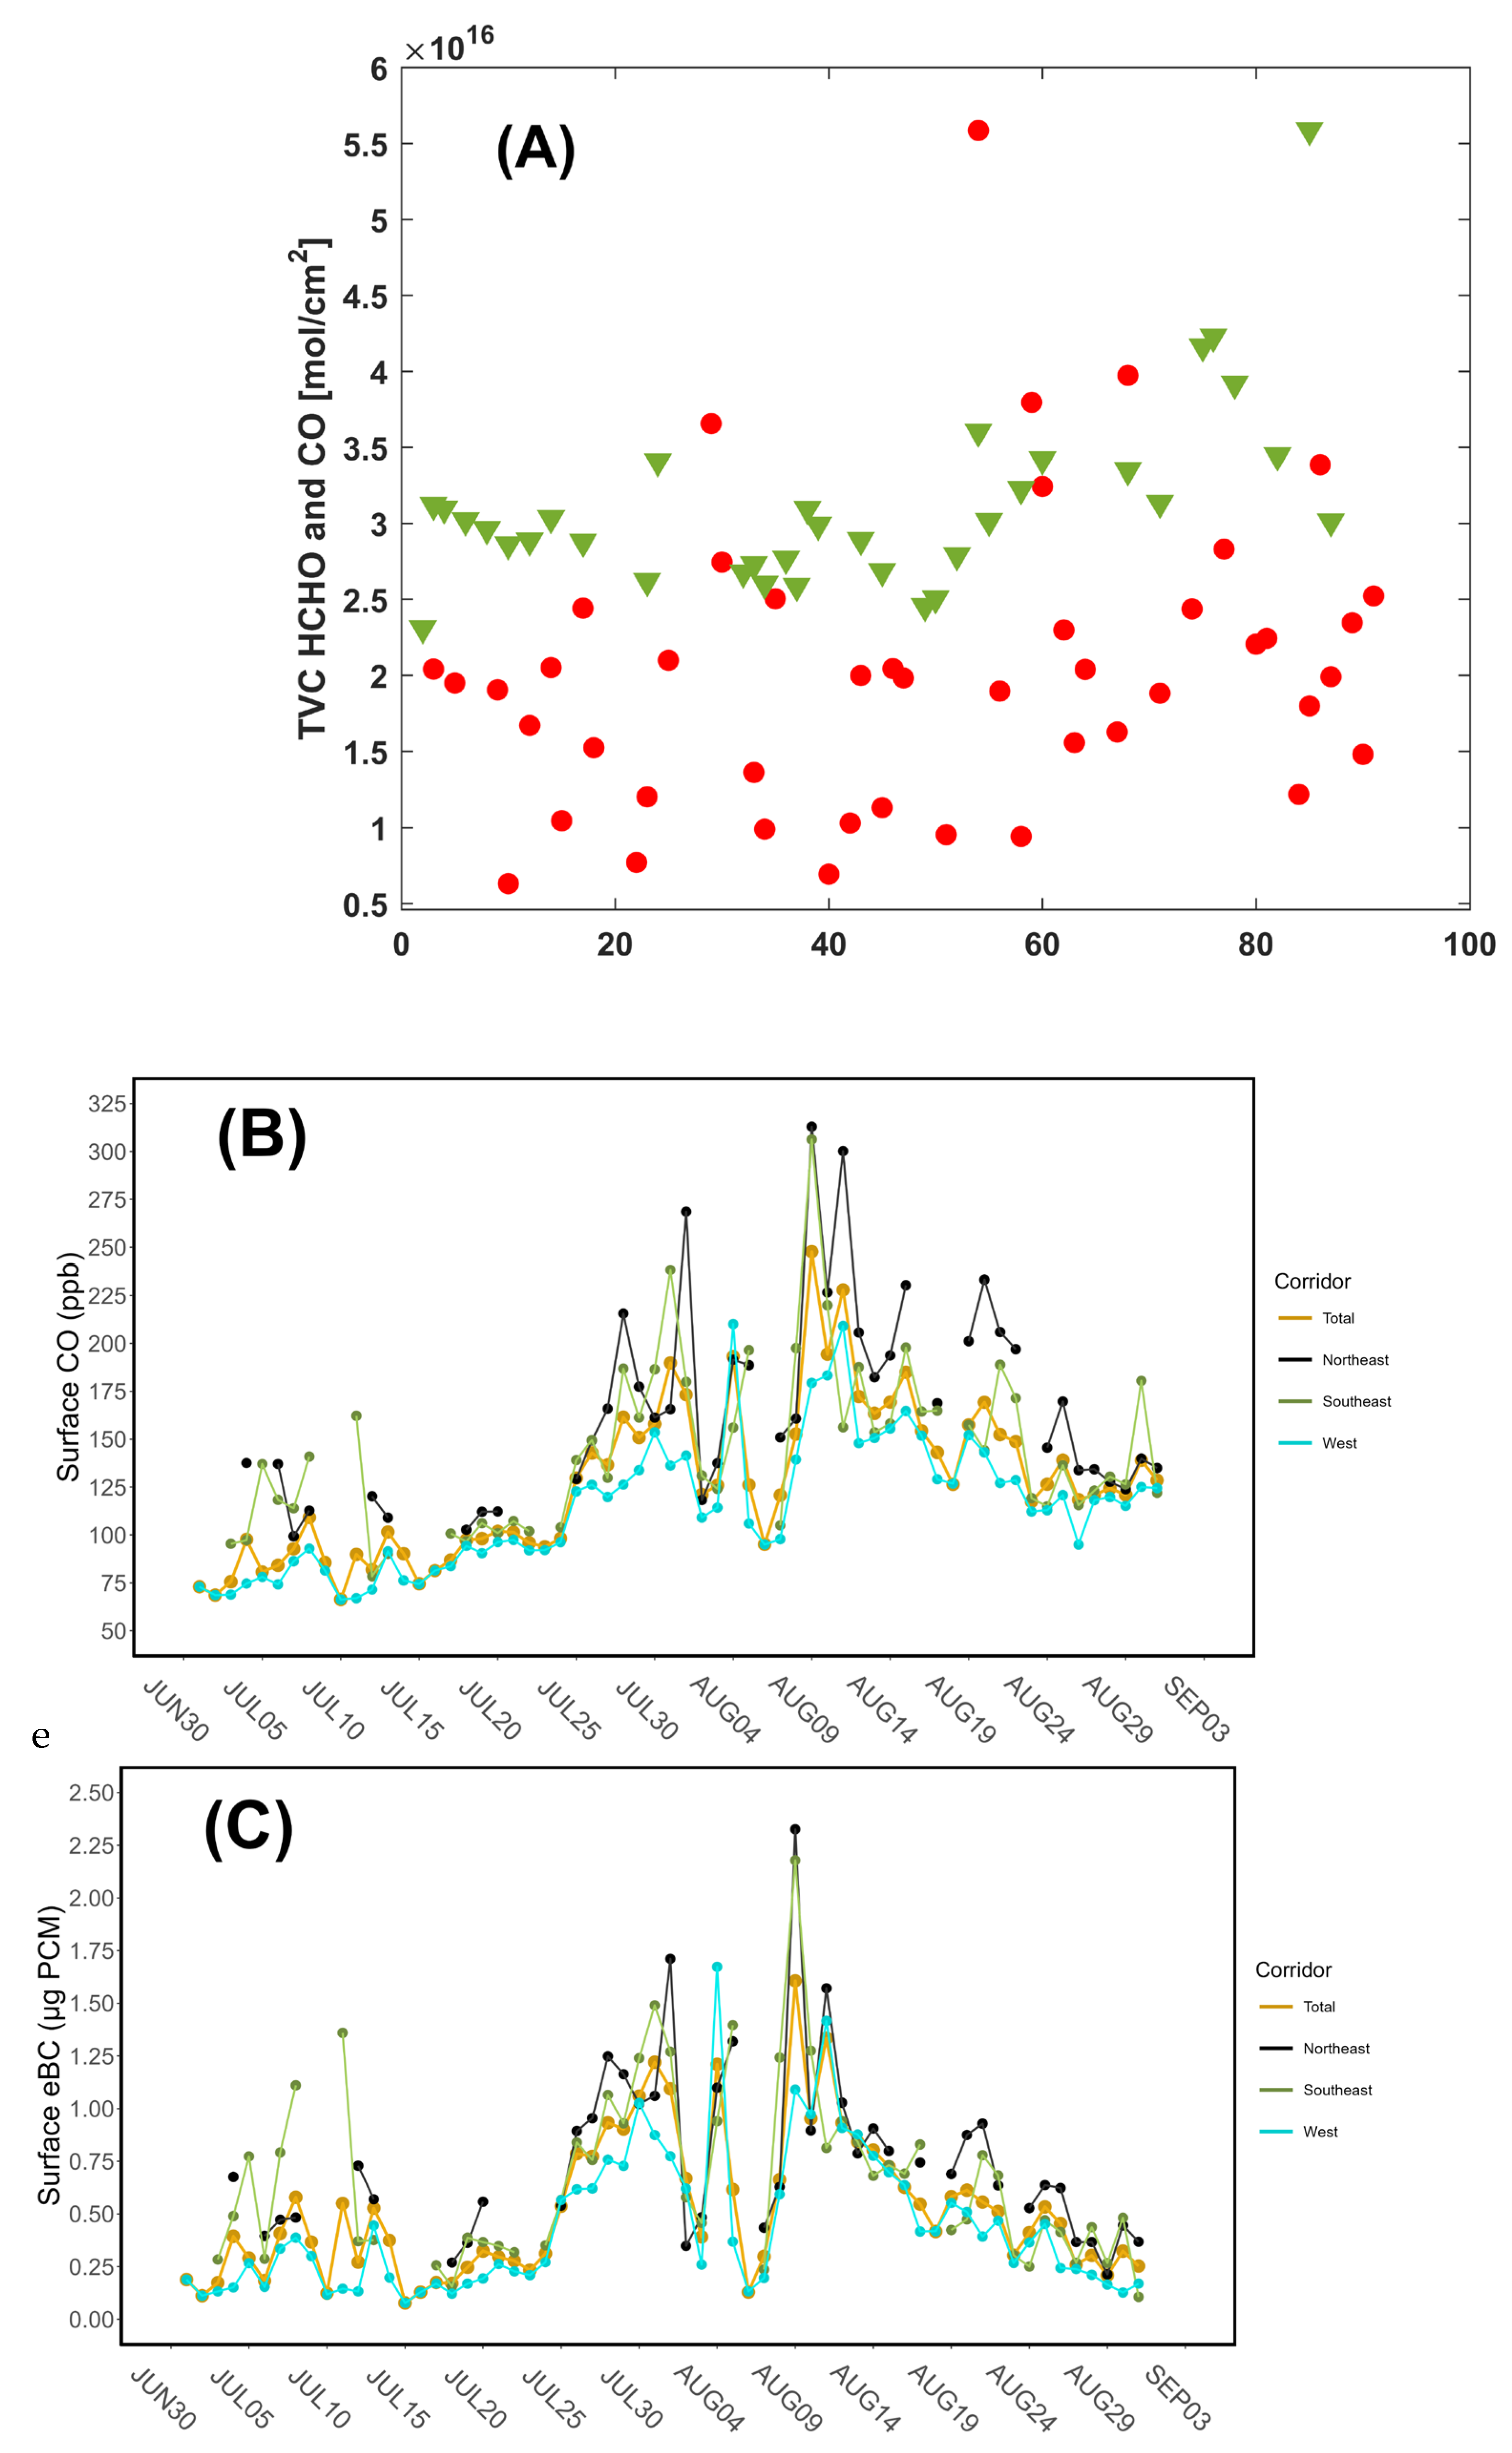
In addition to hourly averages, daily averages have been computed by integrating CO and eBC concentrations with wind data, differentiating these averages per wind sector. Daily tropospheric column densities of CO and HCHO, obtained via satellite data, have also been computed. The results are shown in
Figure 3.
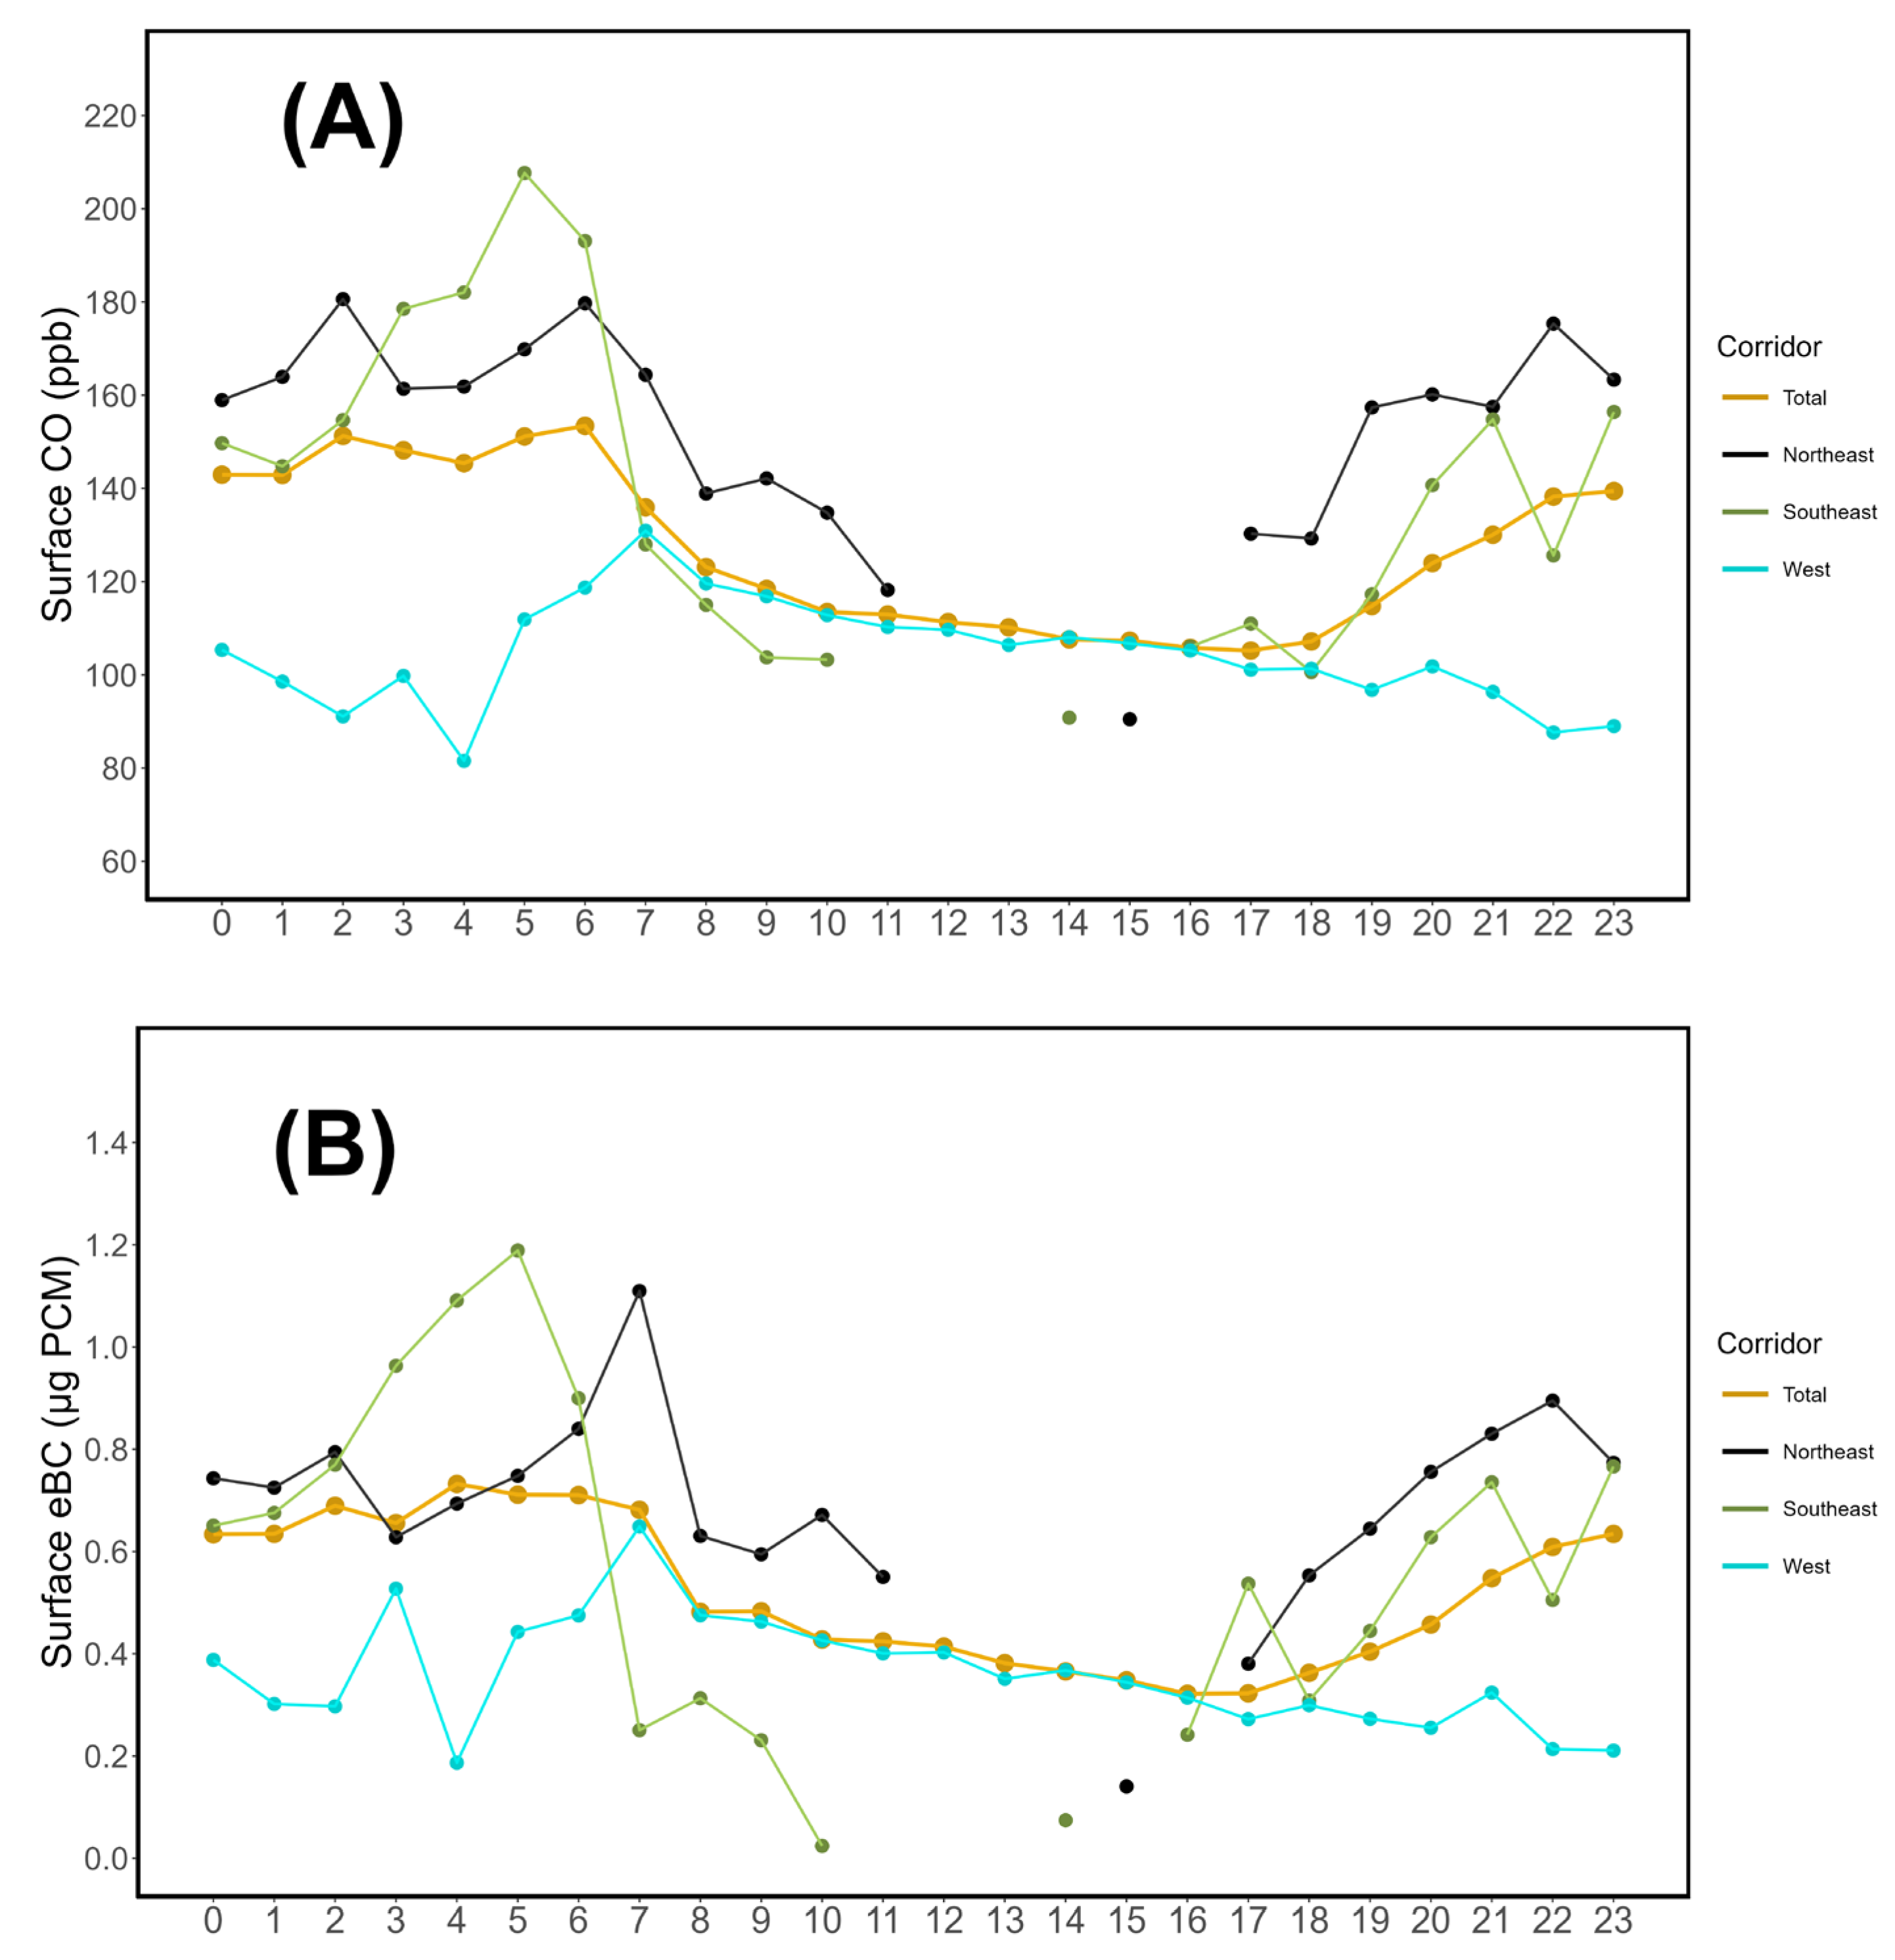
Figure 4 shows the daily cycles, differentiated by wind sector, of CO and eBC. The graphs show diurnal hours (11:00-16:00) gaps where the northeastern and southeastern winds are absent during the study period.
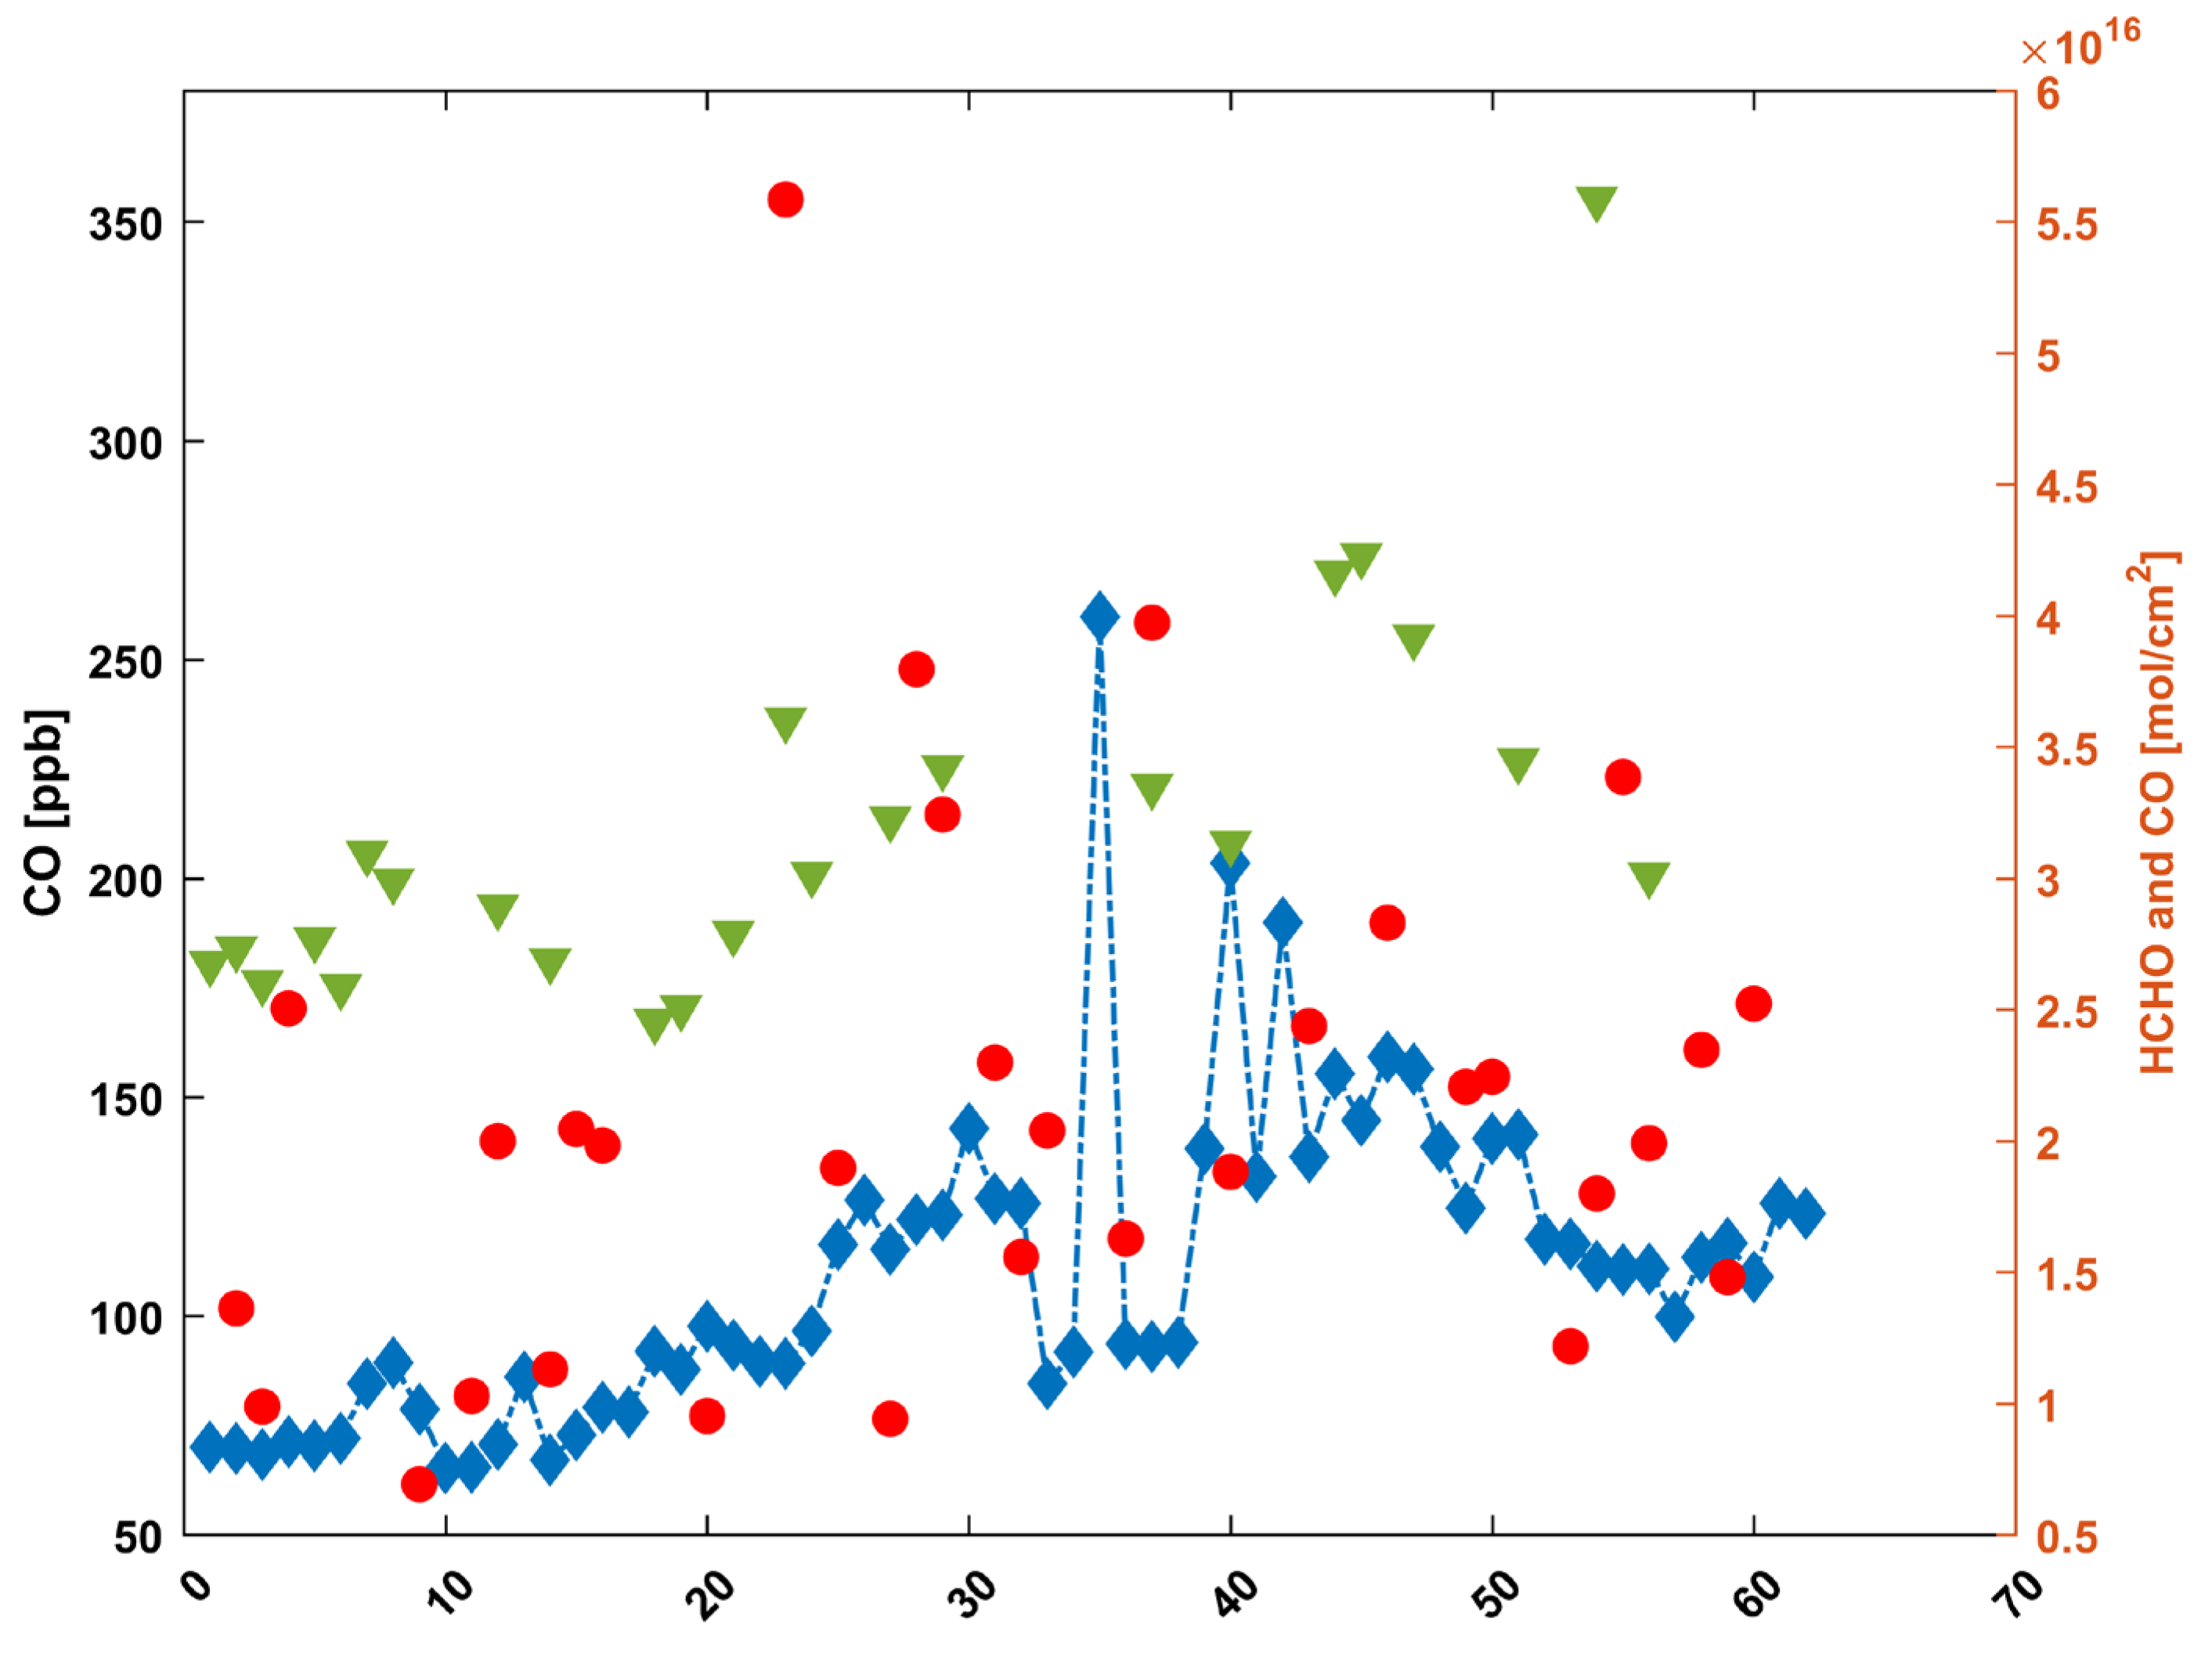
Considering that satellite flybys above LMT occur at 14:00 UTC and data obtained during the passage is considered a daily total column density of both CO and HCHO, these values have been compared with surface data of CO gathered at 14:00 UTC by the Picarro G2401 CRDS analyzer at LMT.
Figure 5.
Direct comparison between daily satellite total column densities of CO (green triangles) and HCHO (red circles), and the hourly concentrations of surface CO (blue diamonds) observed at the time satellite passage, 14:00 UTC.
Figure 5.
Direct comparison between daily satellite total column densities of CO (green triangles) and HCHO (red circles), and the hourly concentrations of surface CO (blue diamonds) observed at the time satellite passage, 14:00 UTC.
4.2. Case studies
As described in
Section 1, the Mediterranean wildfire crisis of summer 2021 affected several countries and caused enormous environmental damage. Analyzing two continuous months and surface and satellite data, three case studies (CS1, CS2, CS3) have been selected for additional evaluations.
The July 10
th-11
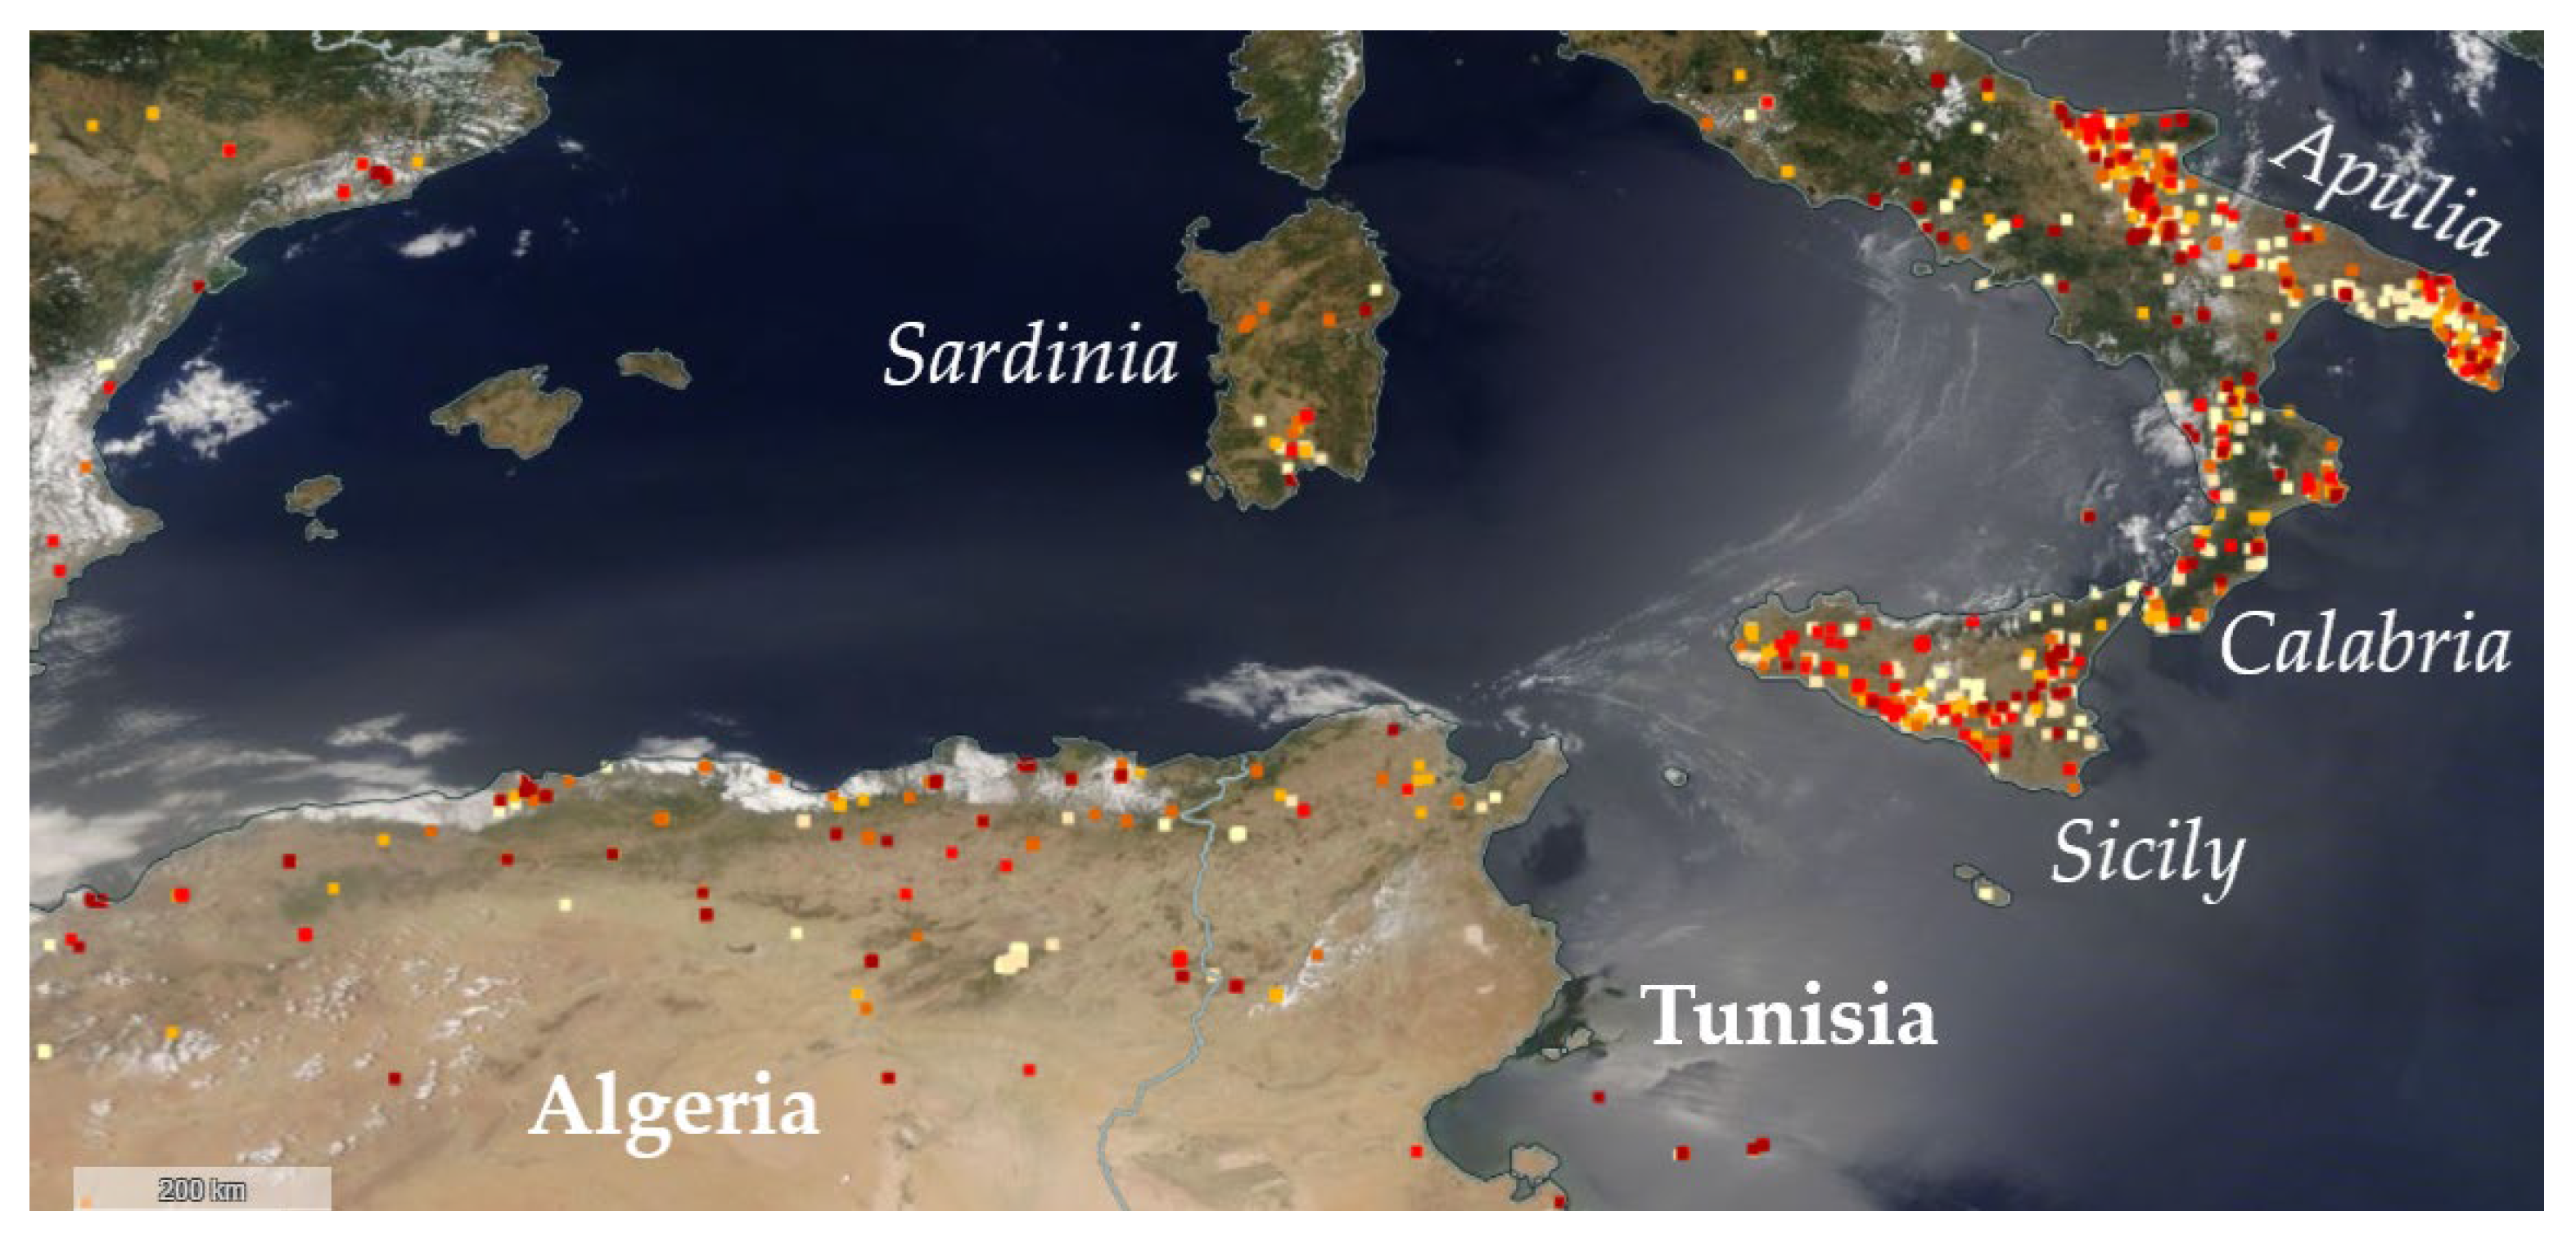
th peaks (CS1) observed at Lamezia Terme (LMT) could be attributable to vast wildfires occurred in Calabria itself, the Italian regions of Sicily, Apulia and Sardinia, and northern African regions in Tunisia and Algeria, as shown by FIRMS data (
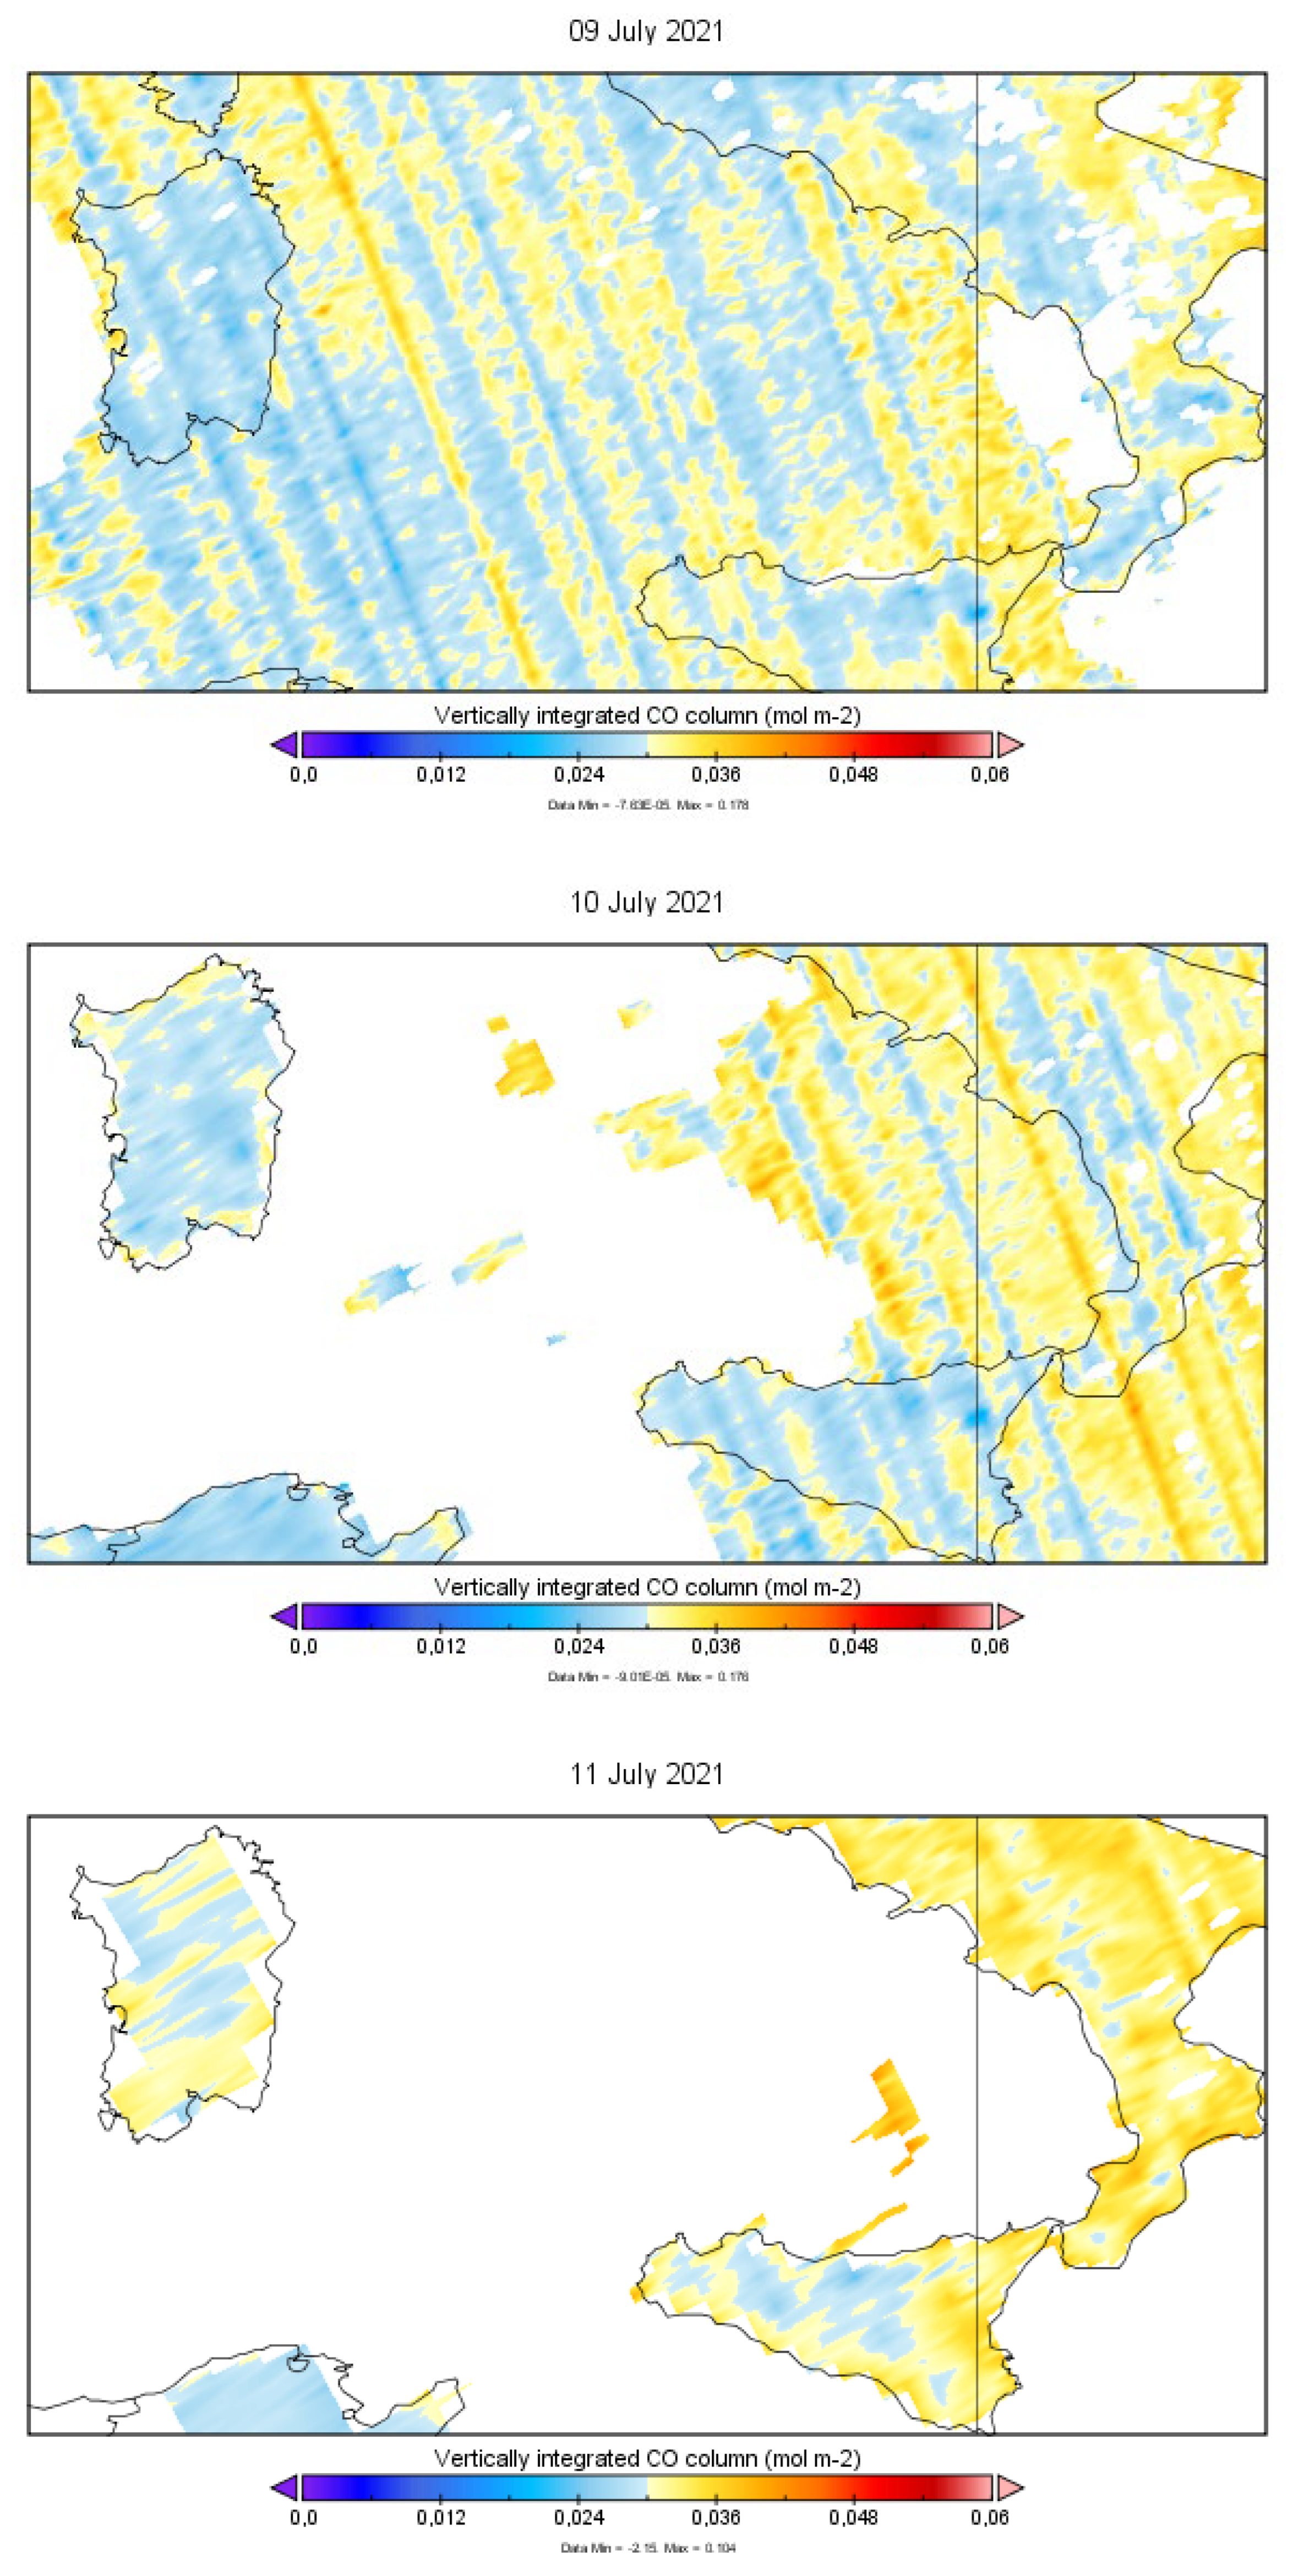
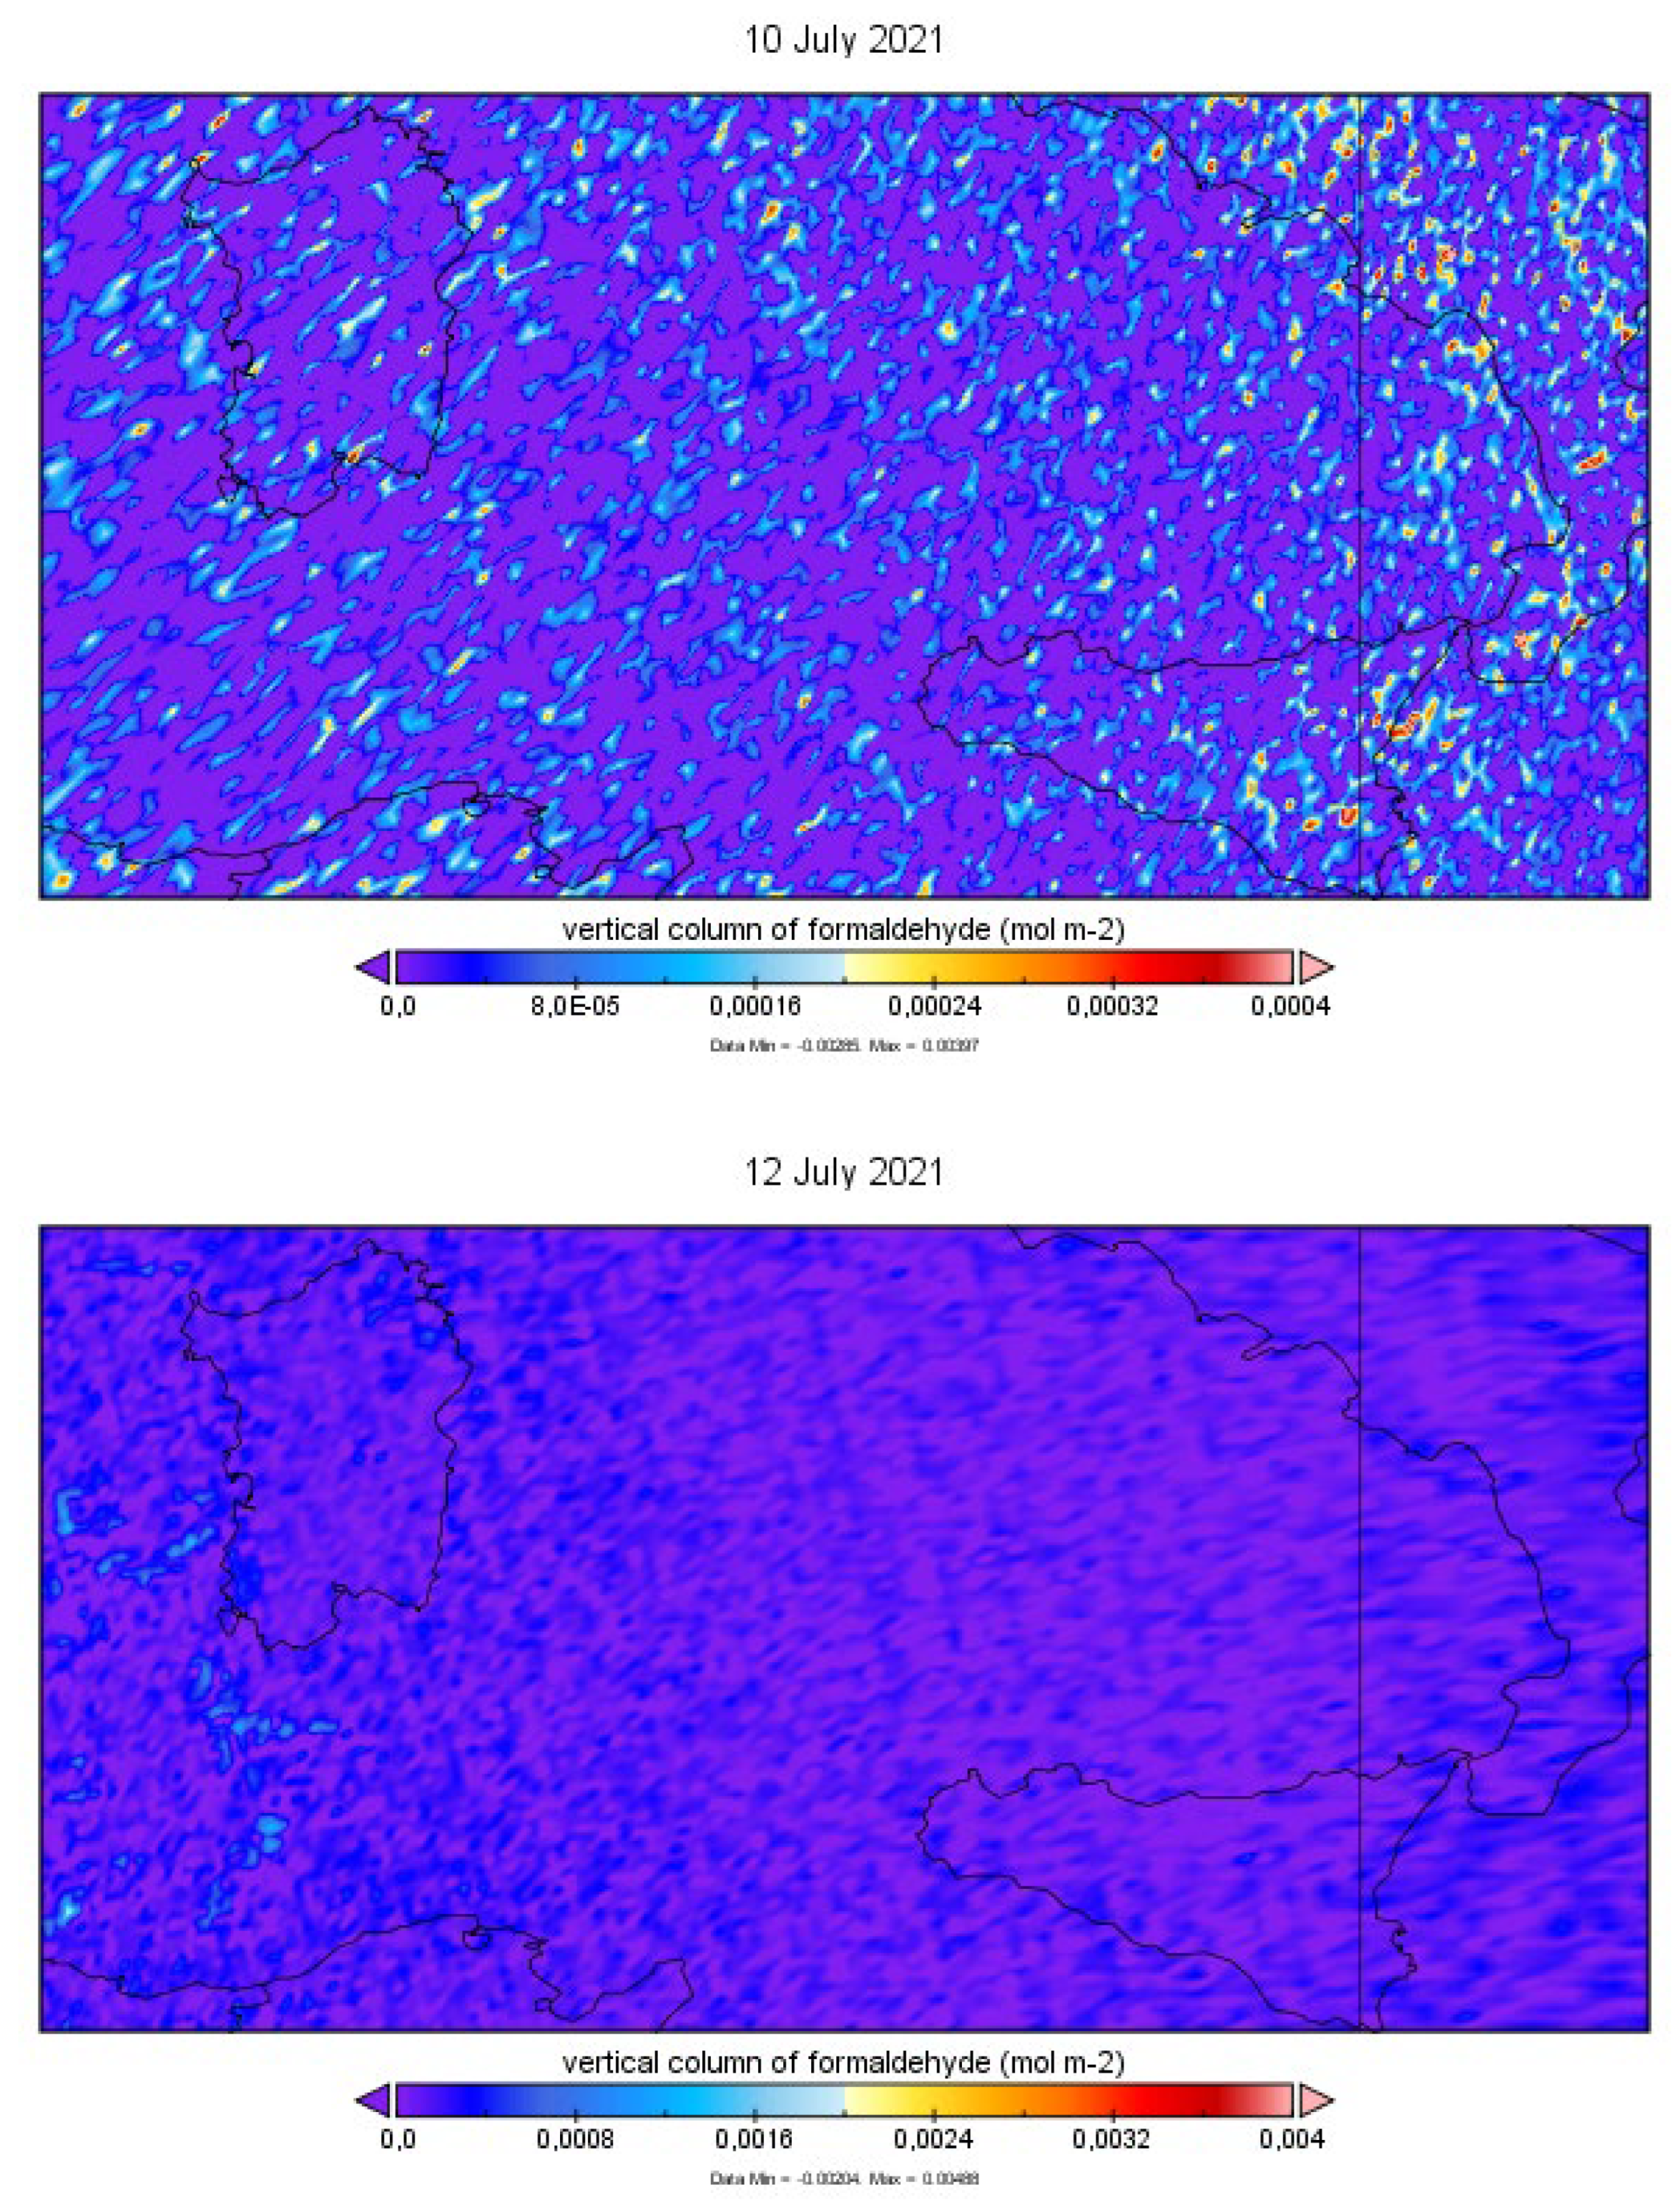
Figure 6) and related estimates on the number of days of prolonged fire activity in these areas. Total column densities of CO and HCHO have been therefore analyzed, and the results are shown in
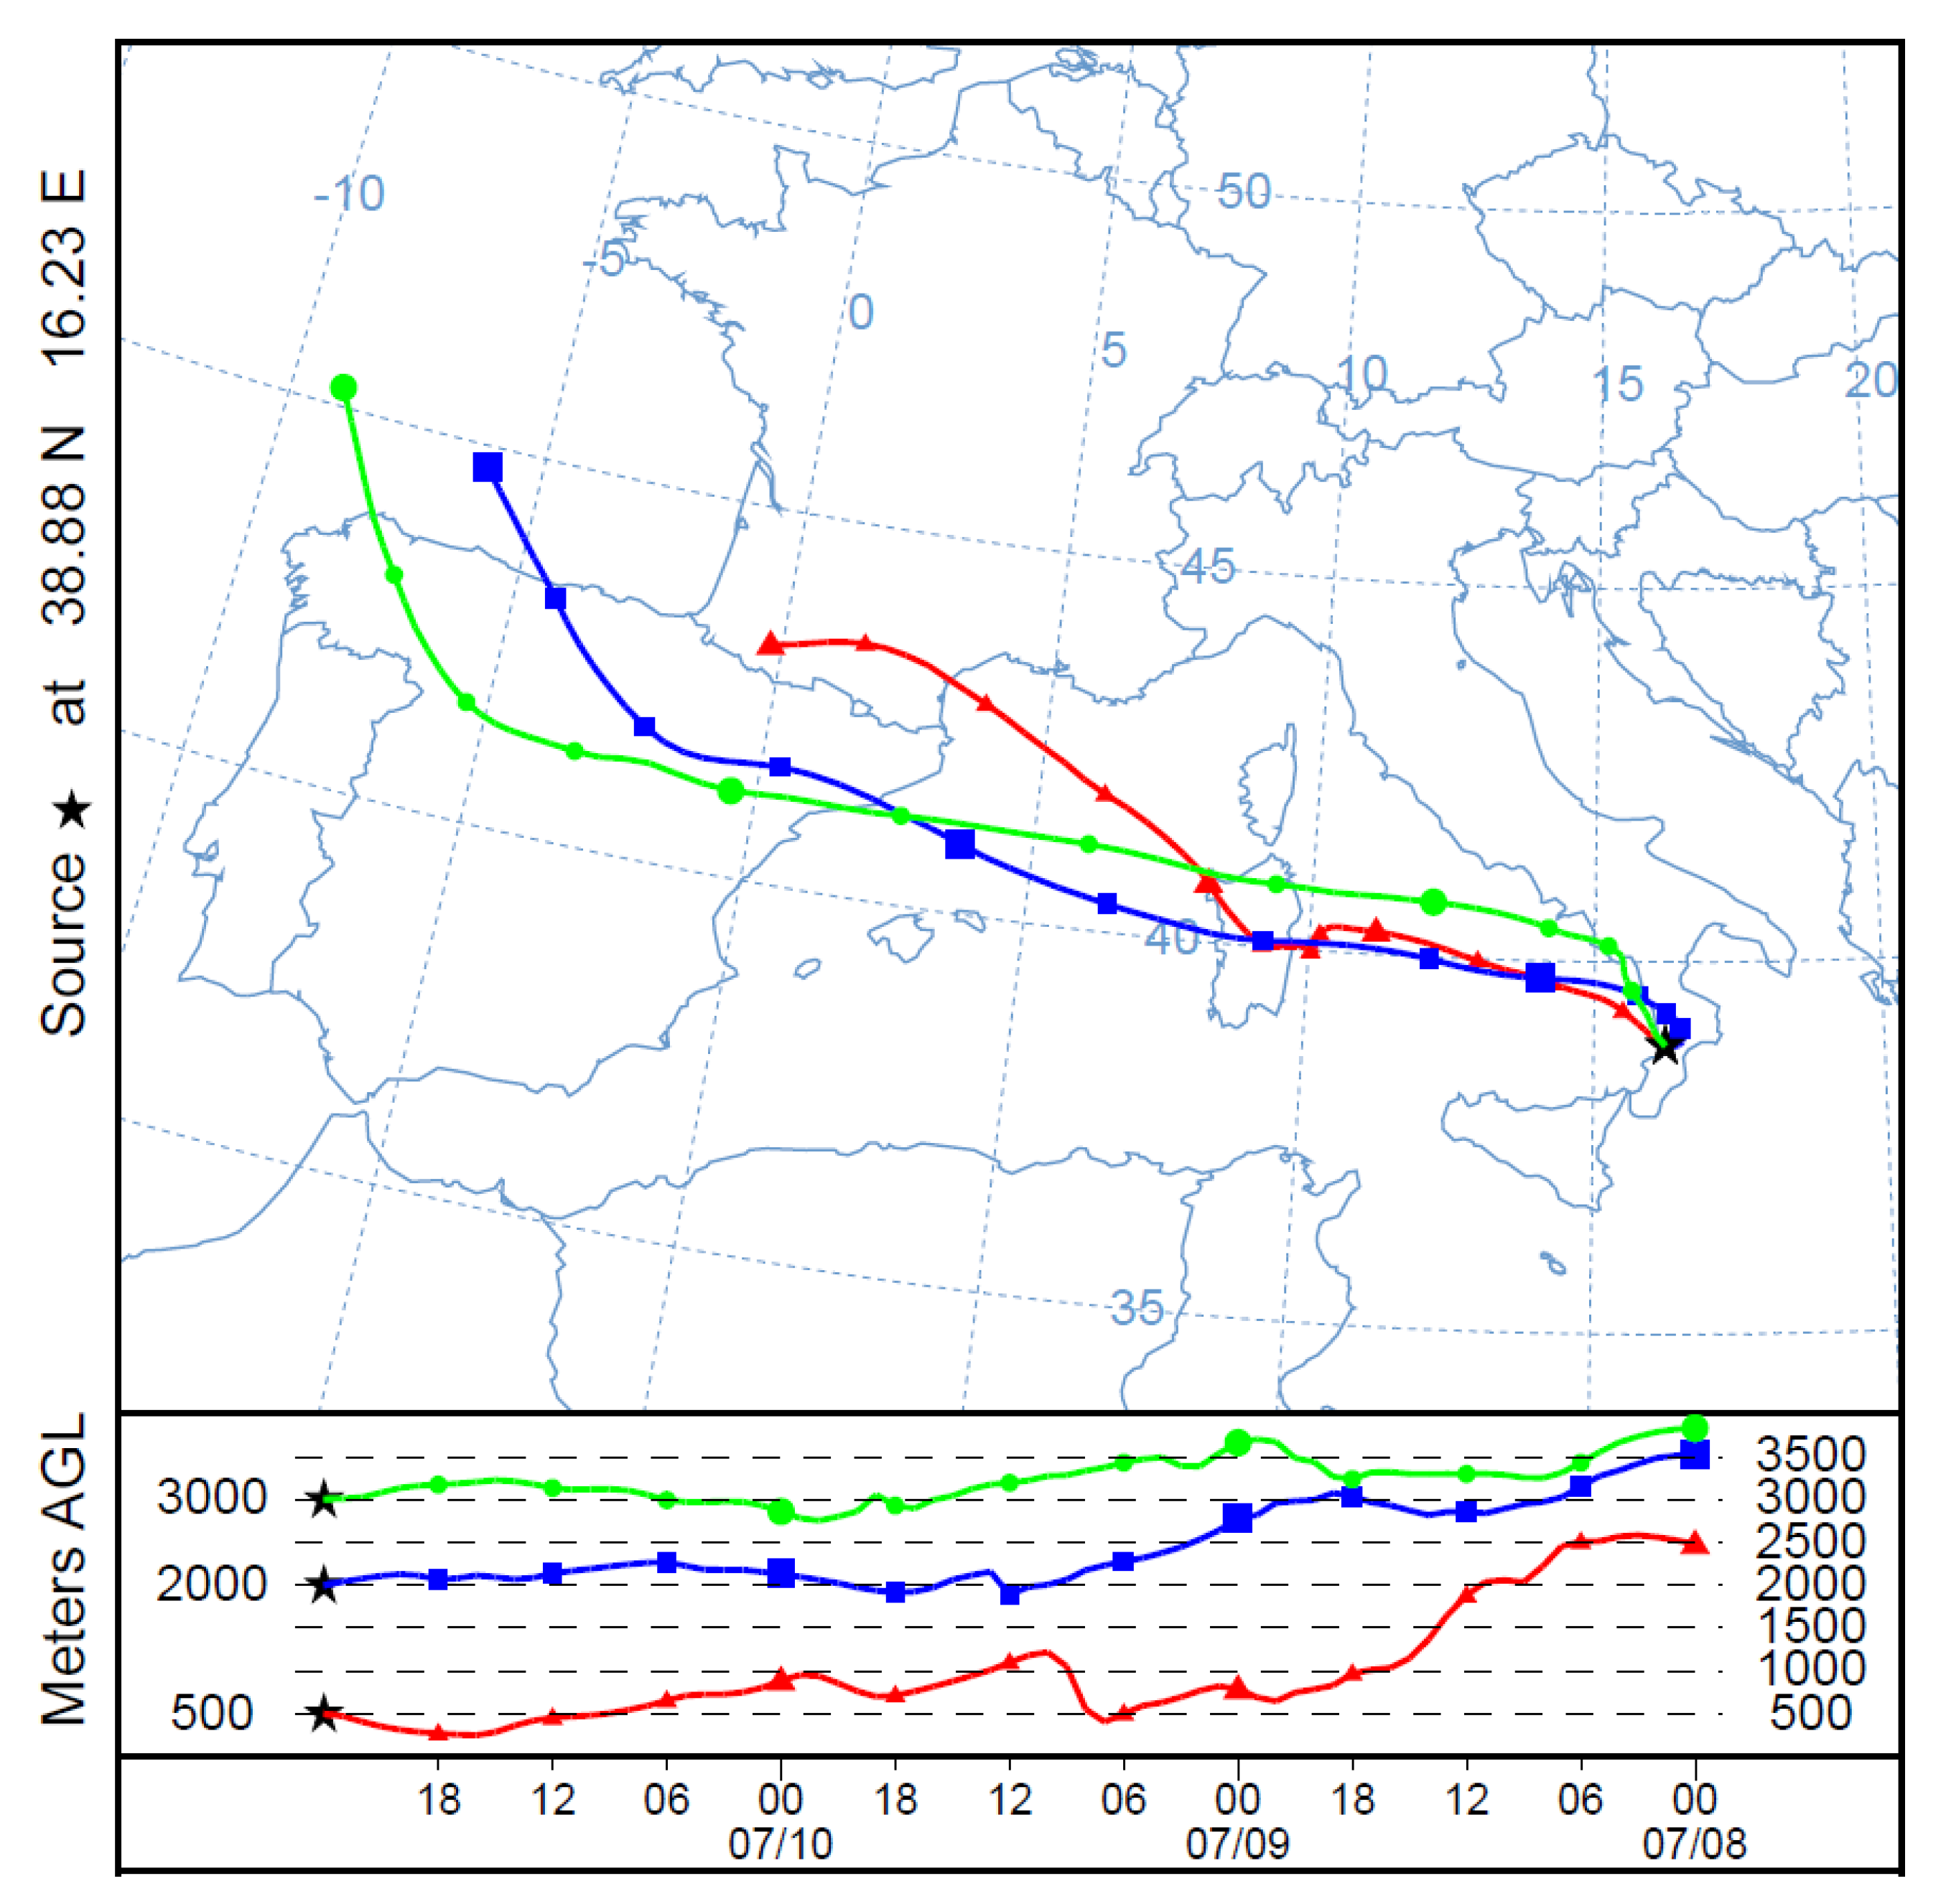
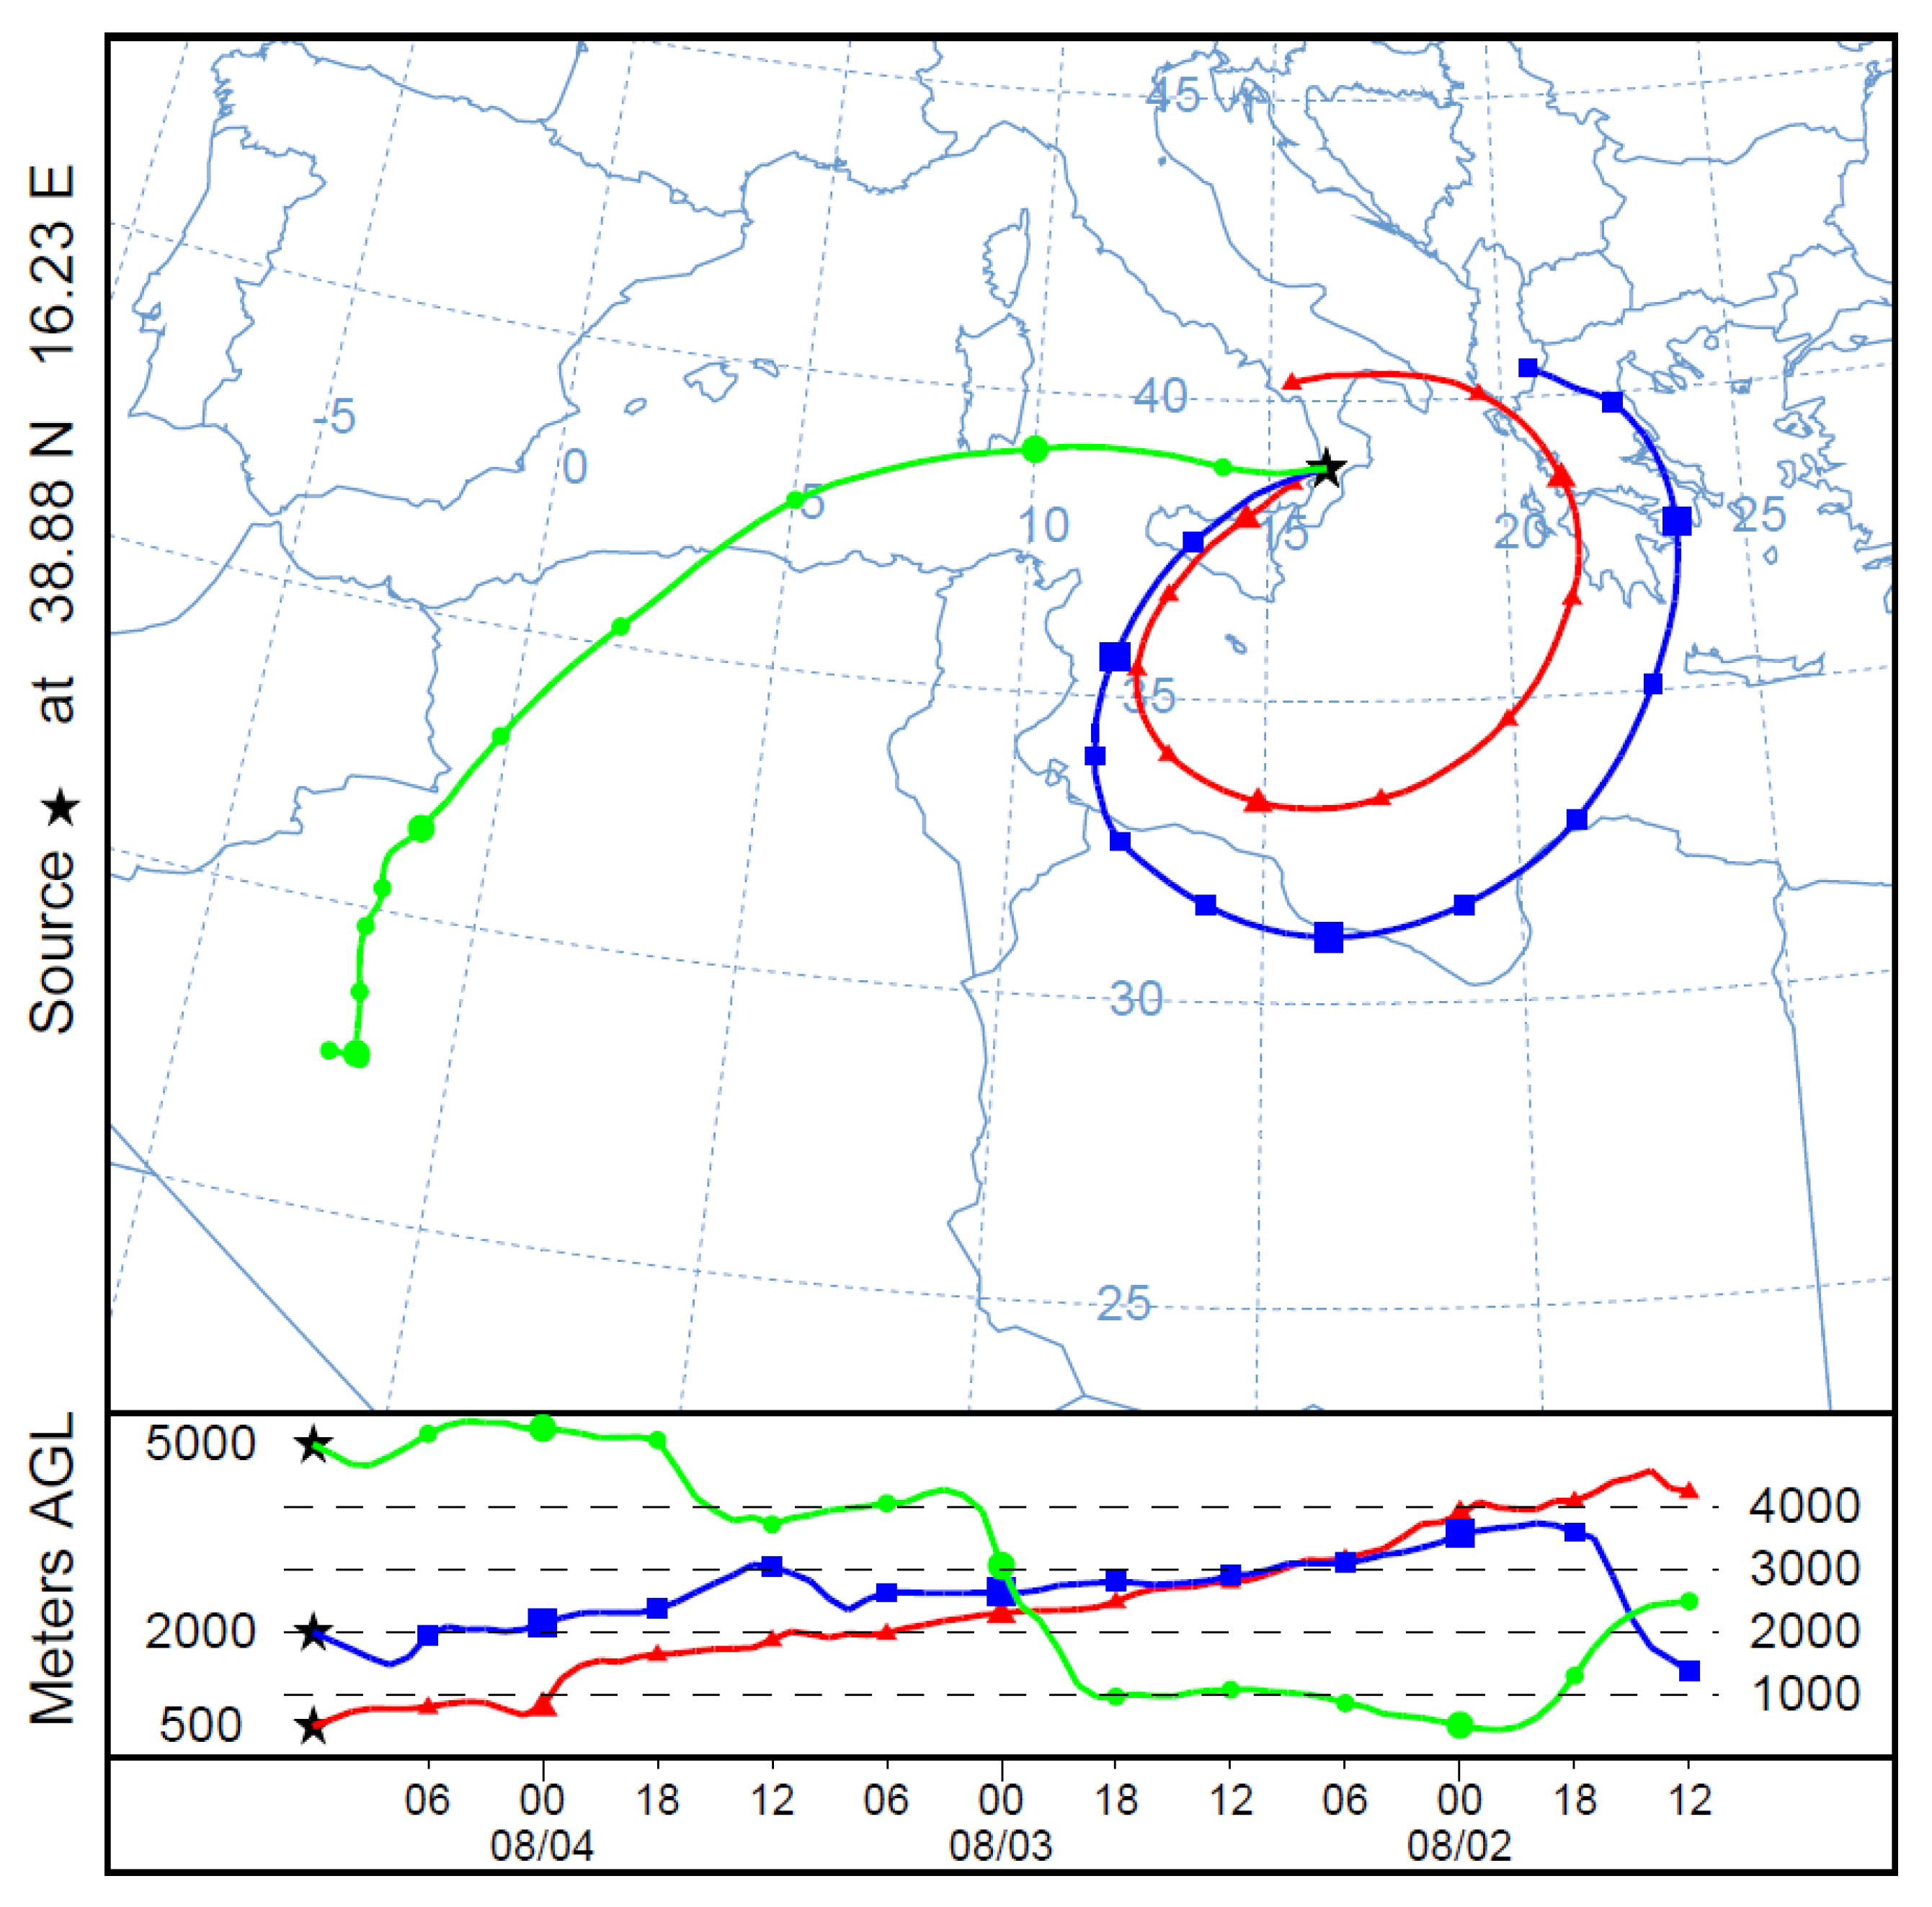
Figure 7. Via the HYSPLIT model, backtrajectories have been computed using LMT’s coordinates as starting point (
Figure 8), indicating that the sources of CS1 peaks at LMT may be attributable to Sardinian wildfires.
The second case study (CS2) is aimed at the peaks observed between July 29
th and August 1
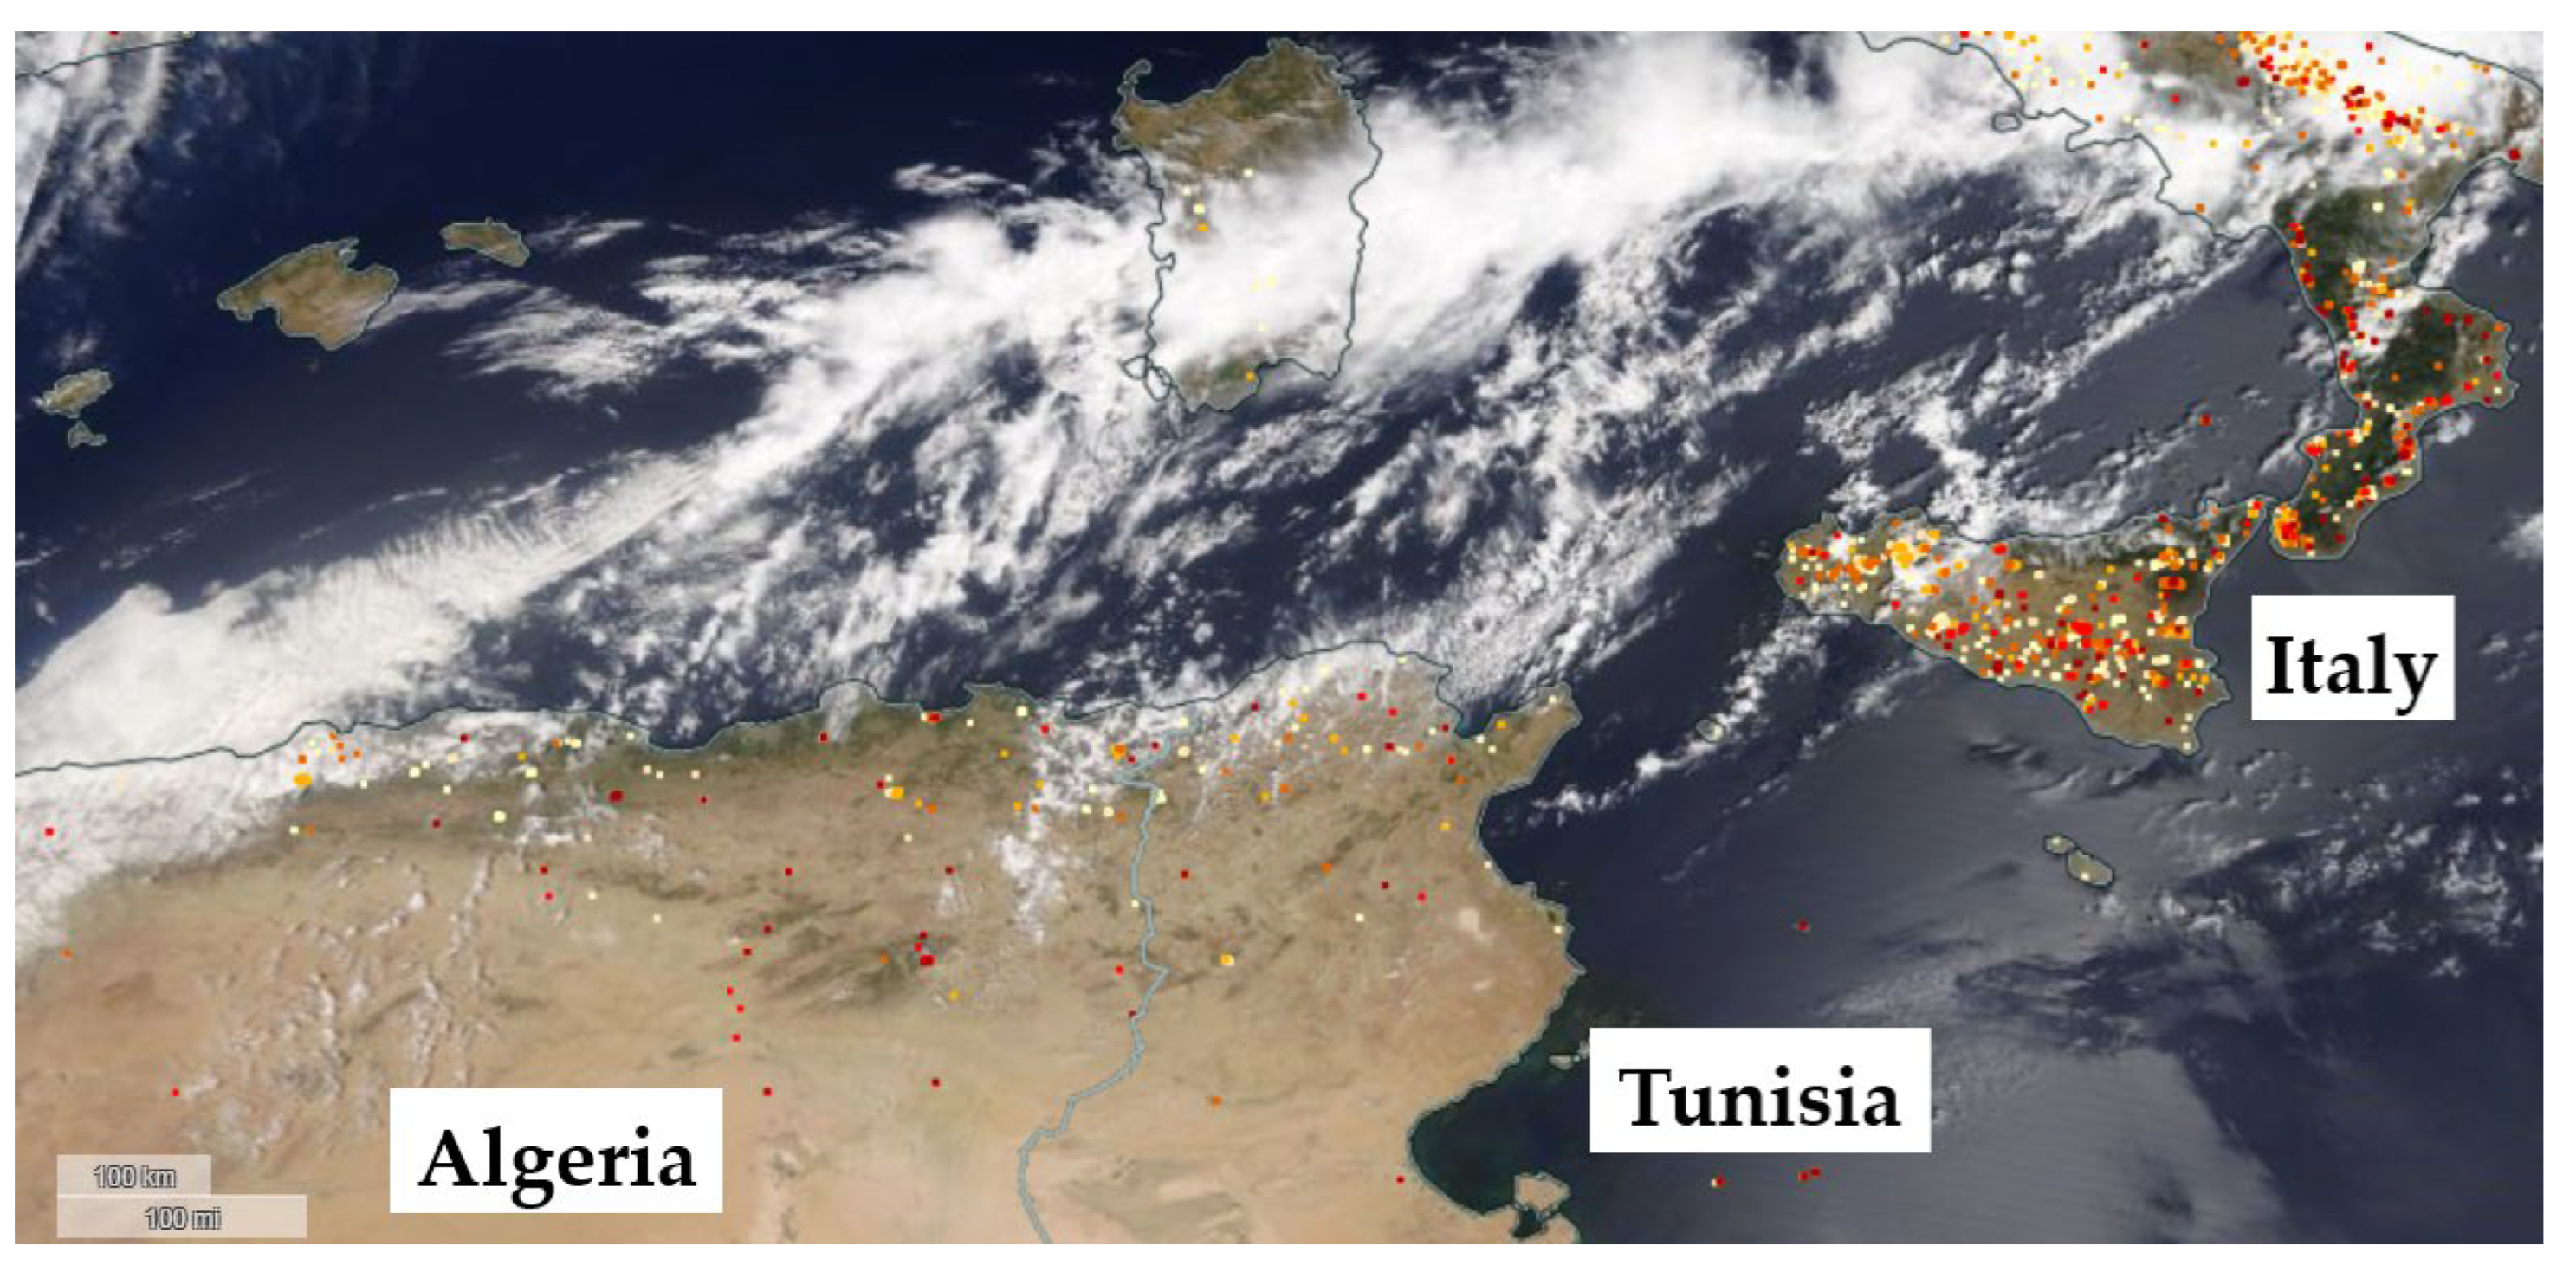
st. Algeria, and the southern Italian regions of Calabria and Sicily were affected by a significant number of prolonged wildfires. FIRMS data on the week elapsed between July 28
th and August 3
rd shows several wildfires affecting these areas (
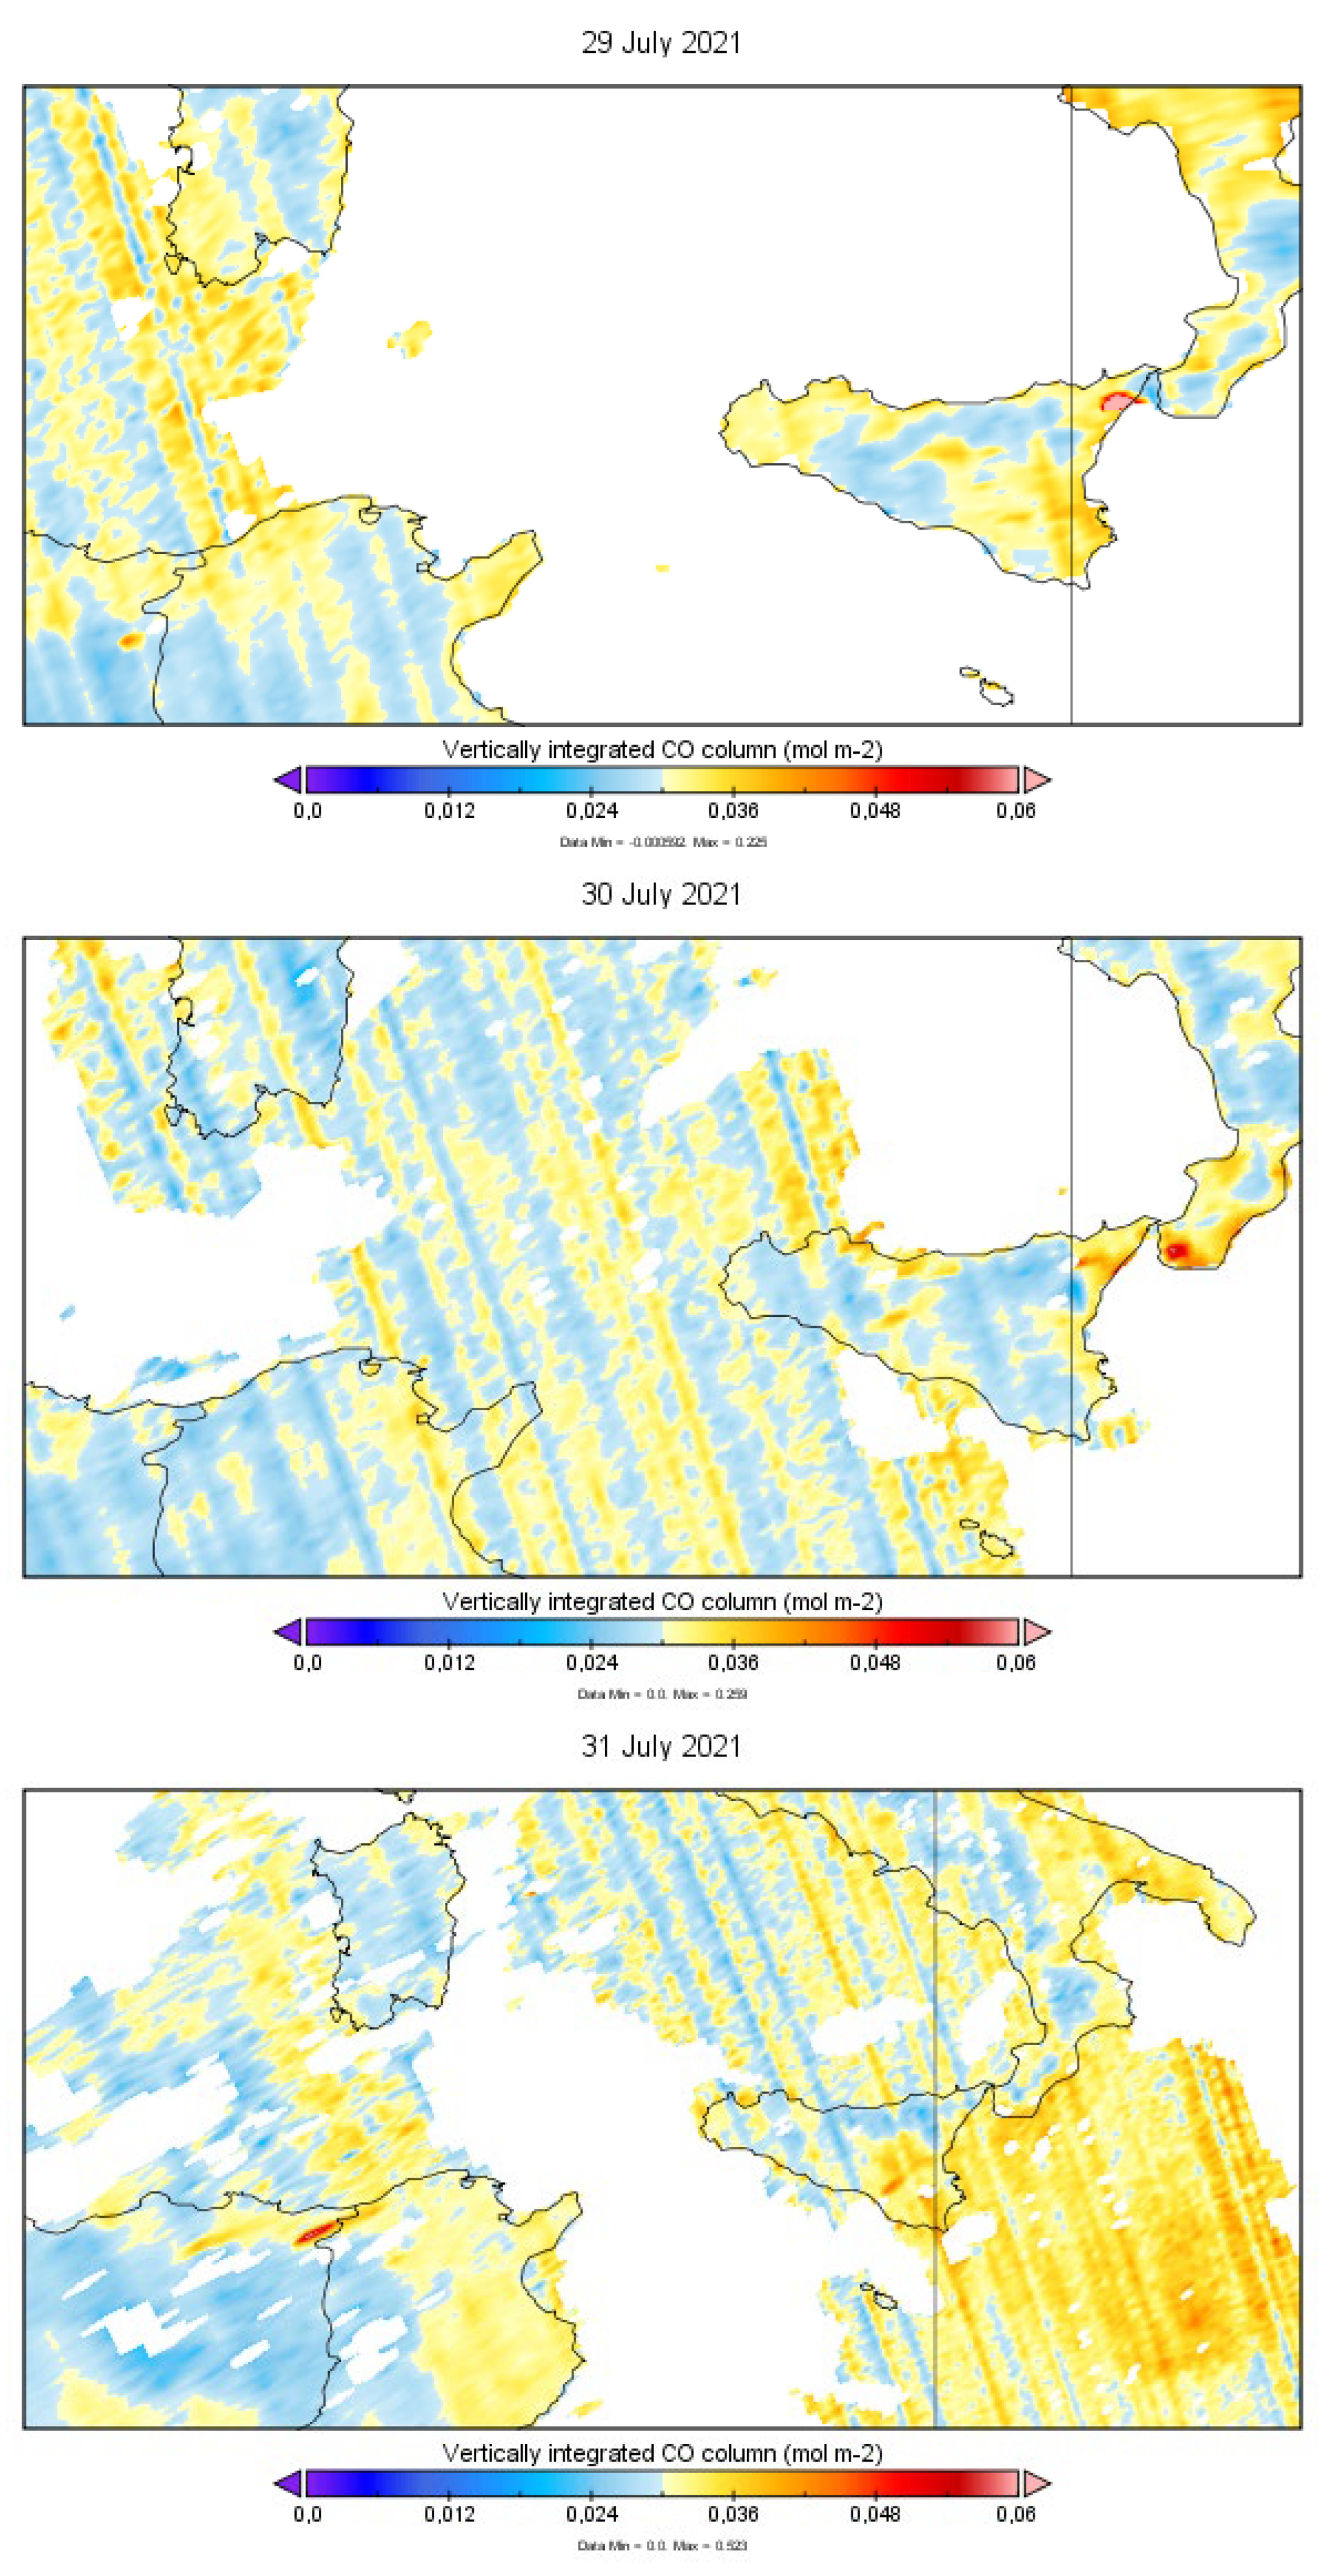
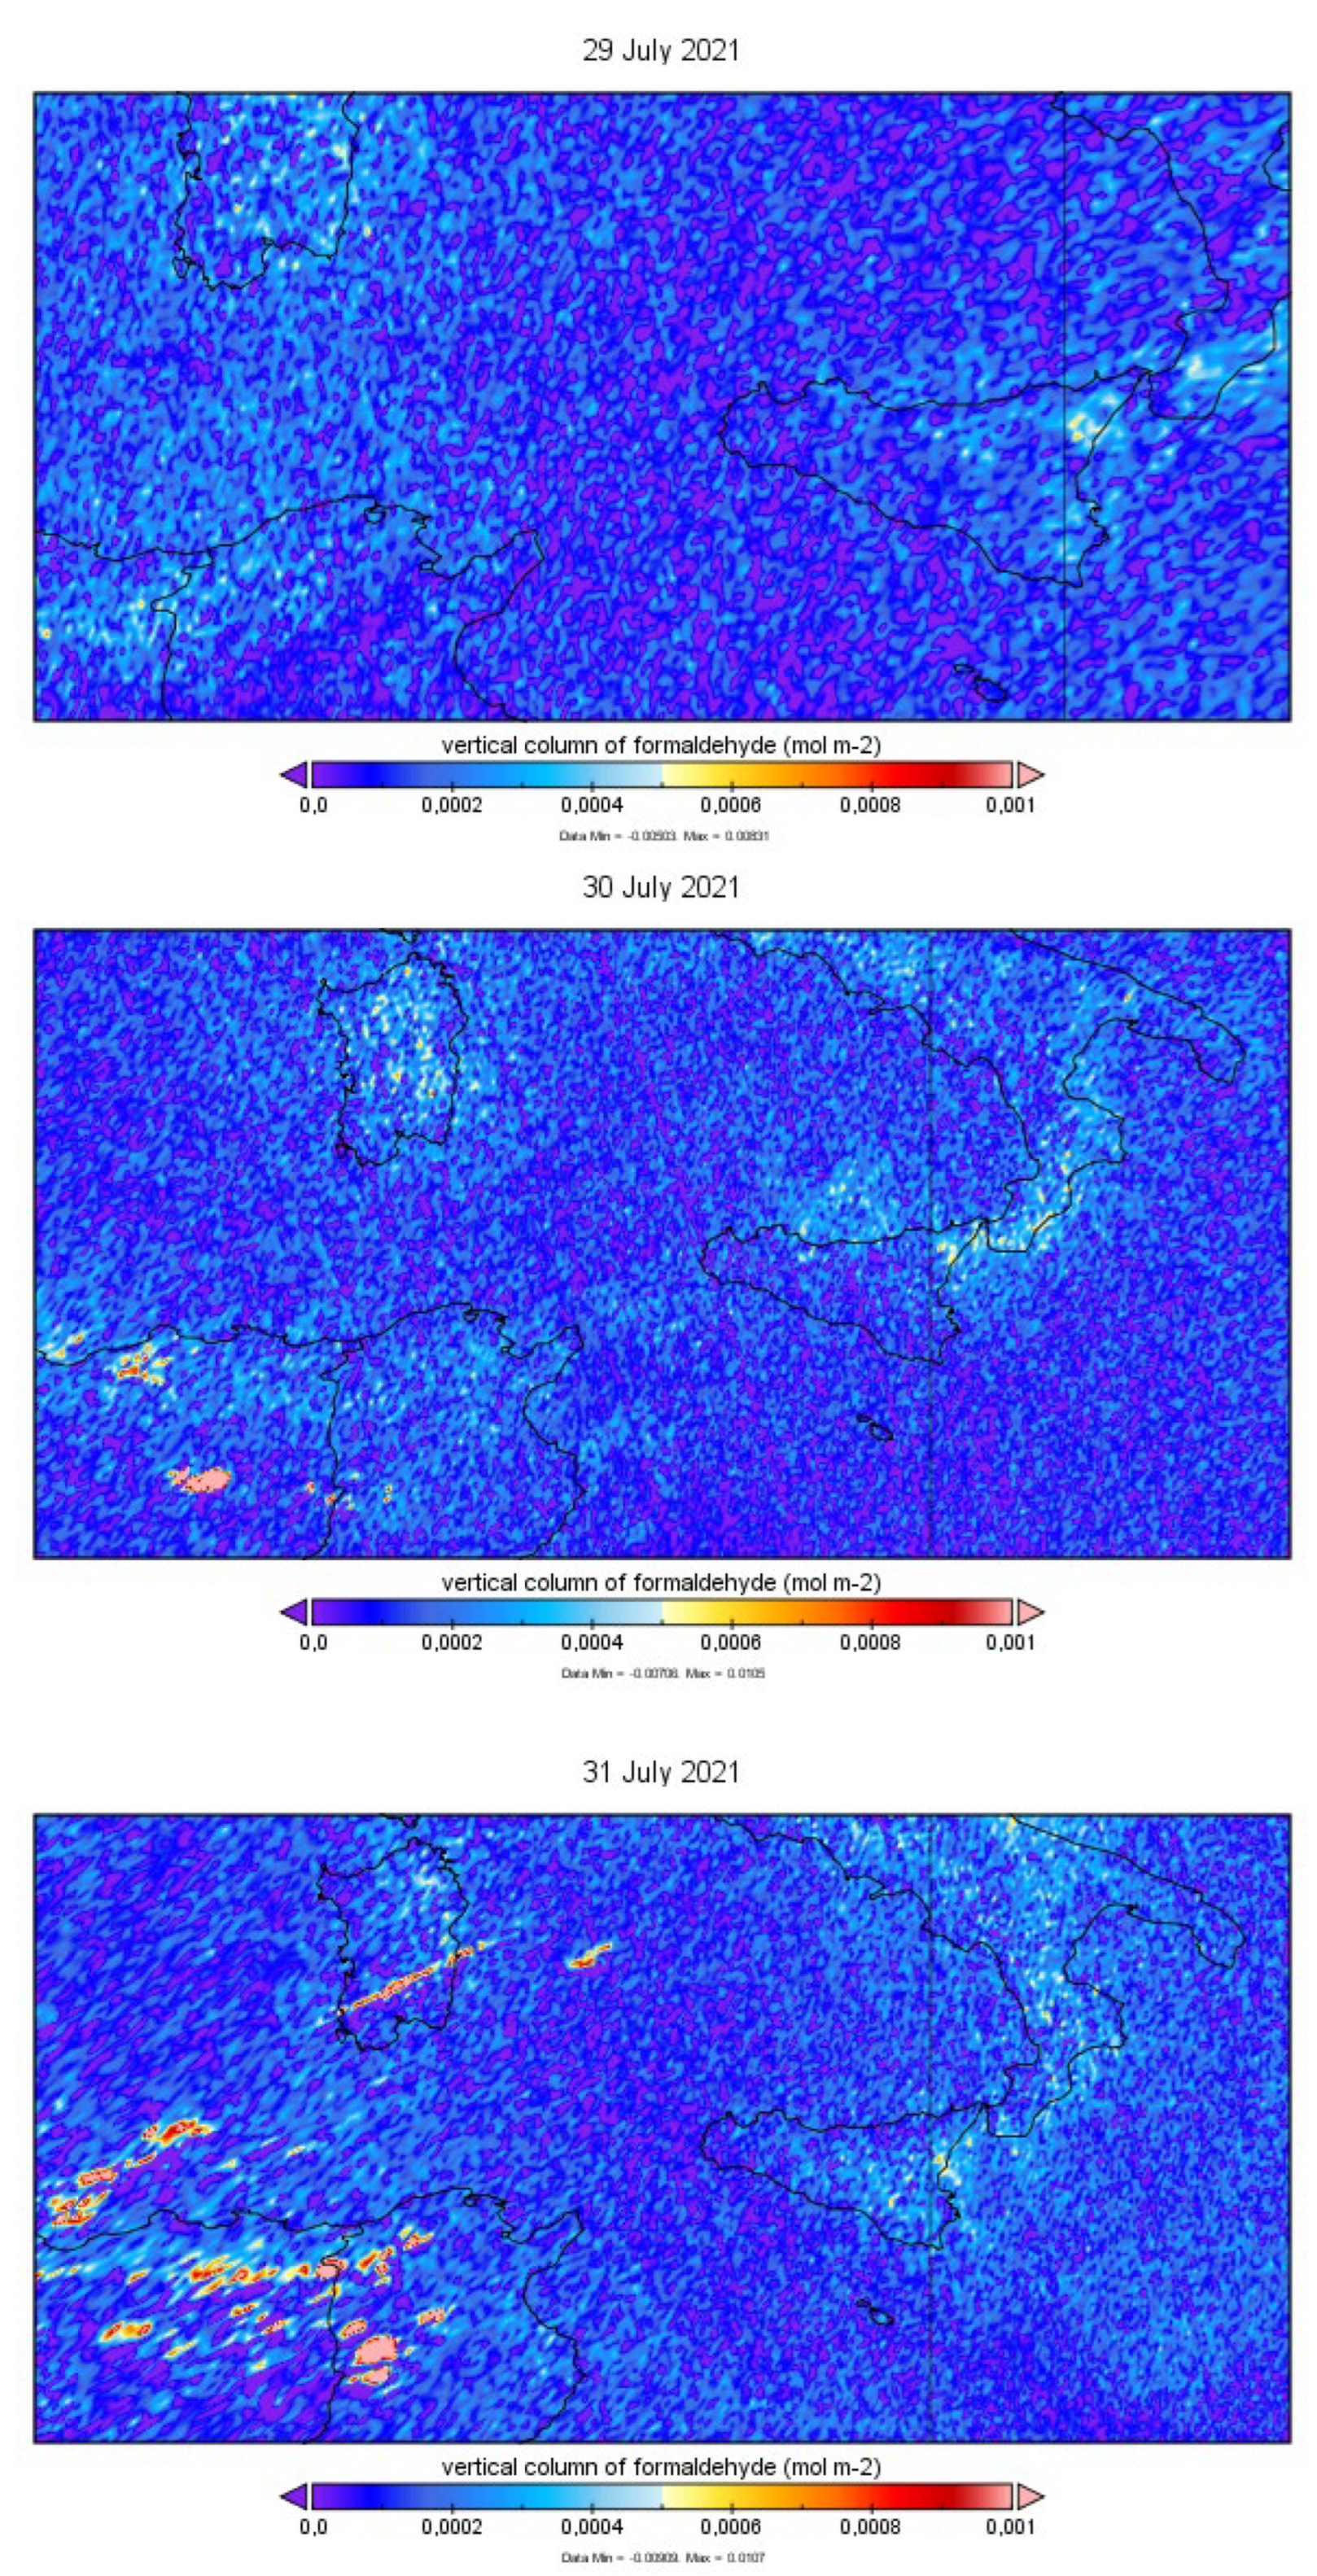
Figure 9). The tropospheric column densities computed on July 29
th-31
st data, shown in
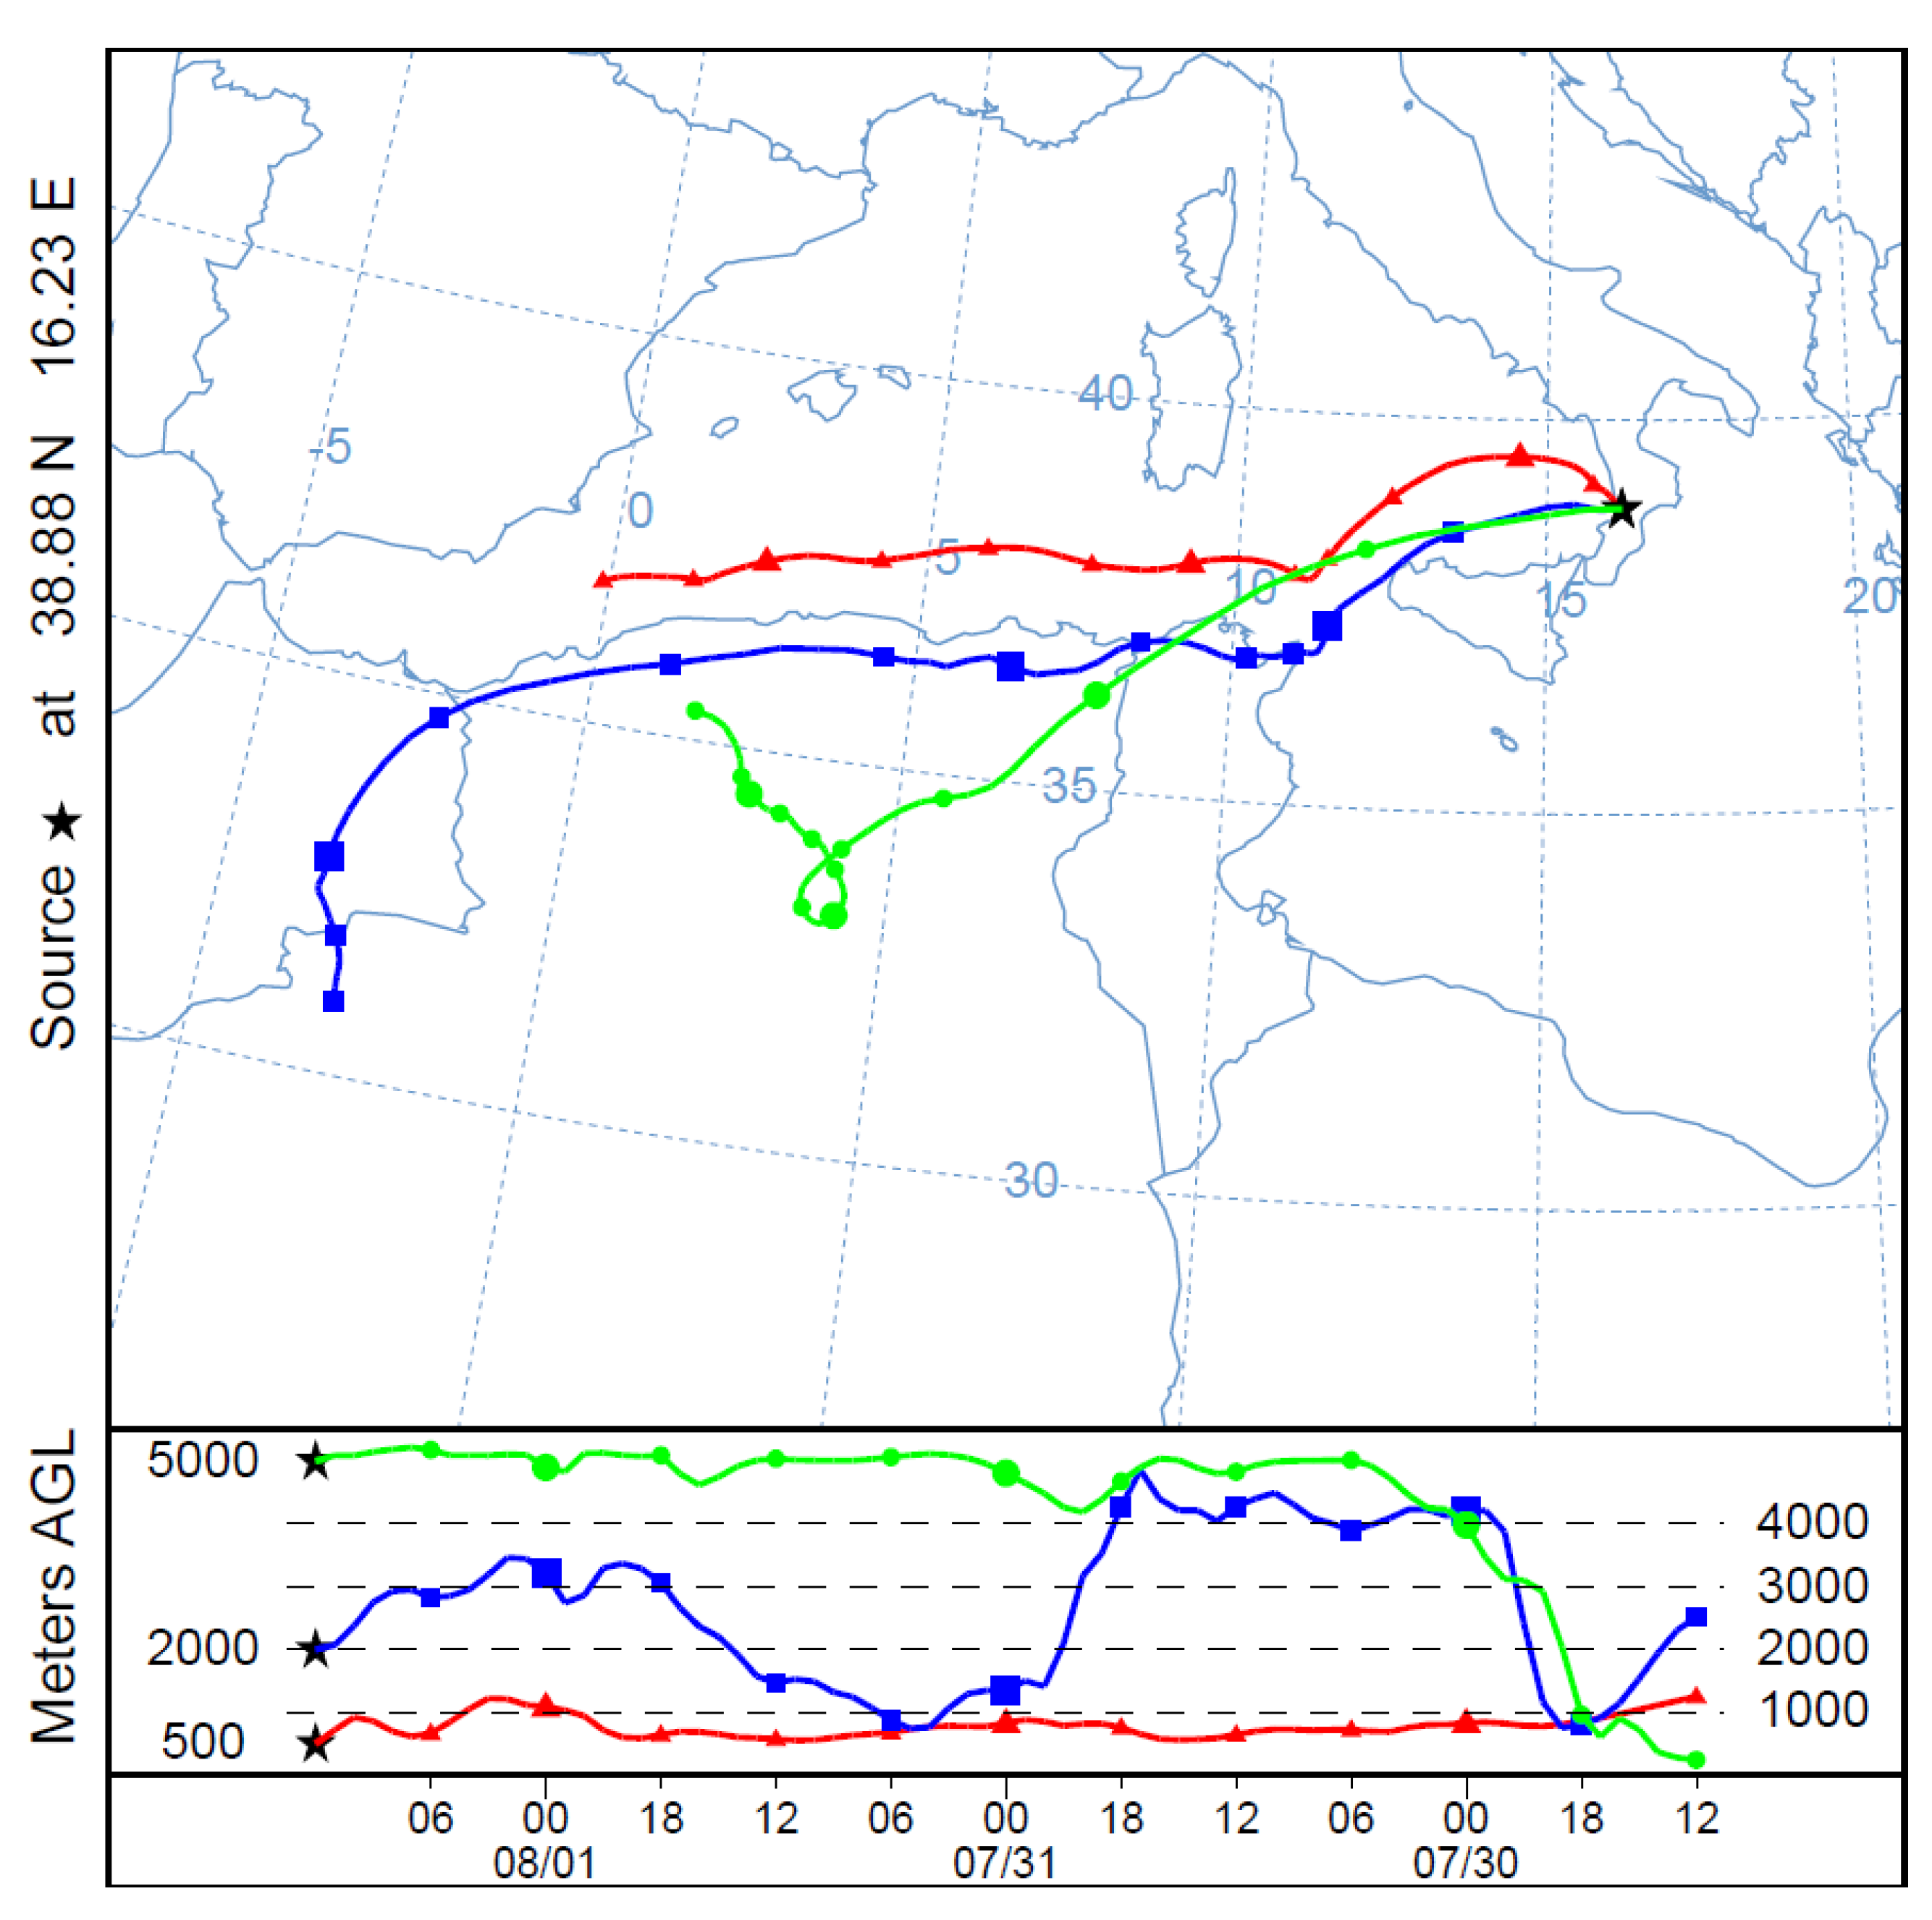
Figure 10, and the HYSPLIT backtrajectory shown in
Figure 11 both indicate the northern African country of Algeria as the most probable source of these emissions.
The third case study (CS3) focused on August 4
th, which provided evidence of an eastern source such as Greece and Türkiye, which as described in
Section 1 were heavily affected by the wildfire crisis at the time. FIRMS data on the entire week between July 31
st and August 6
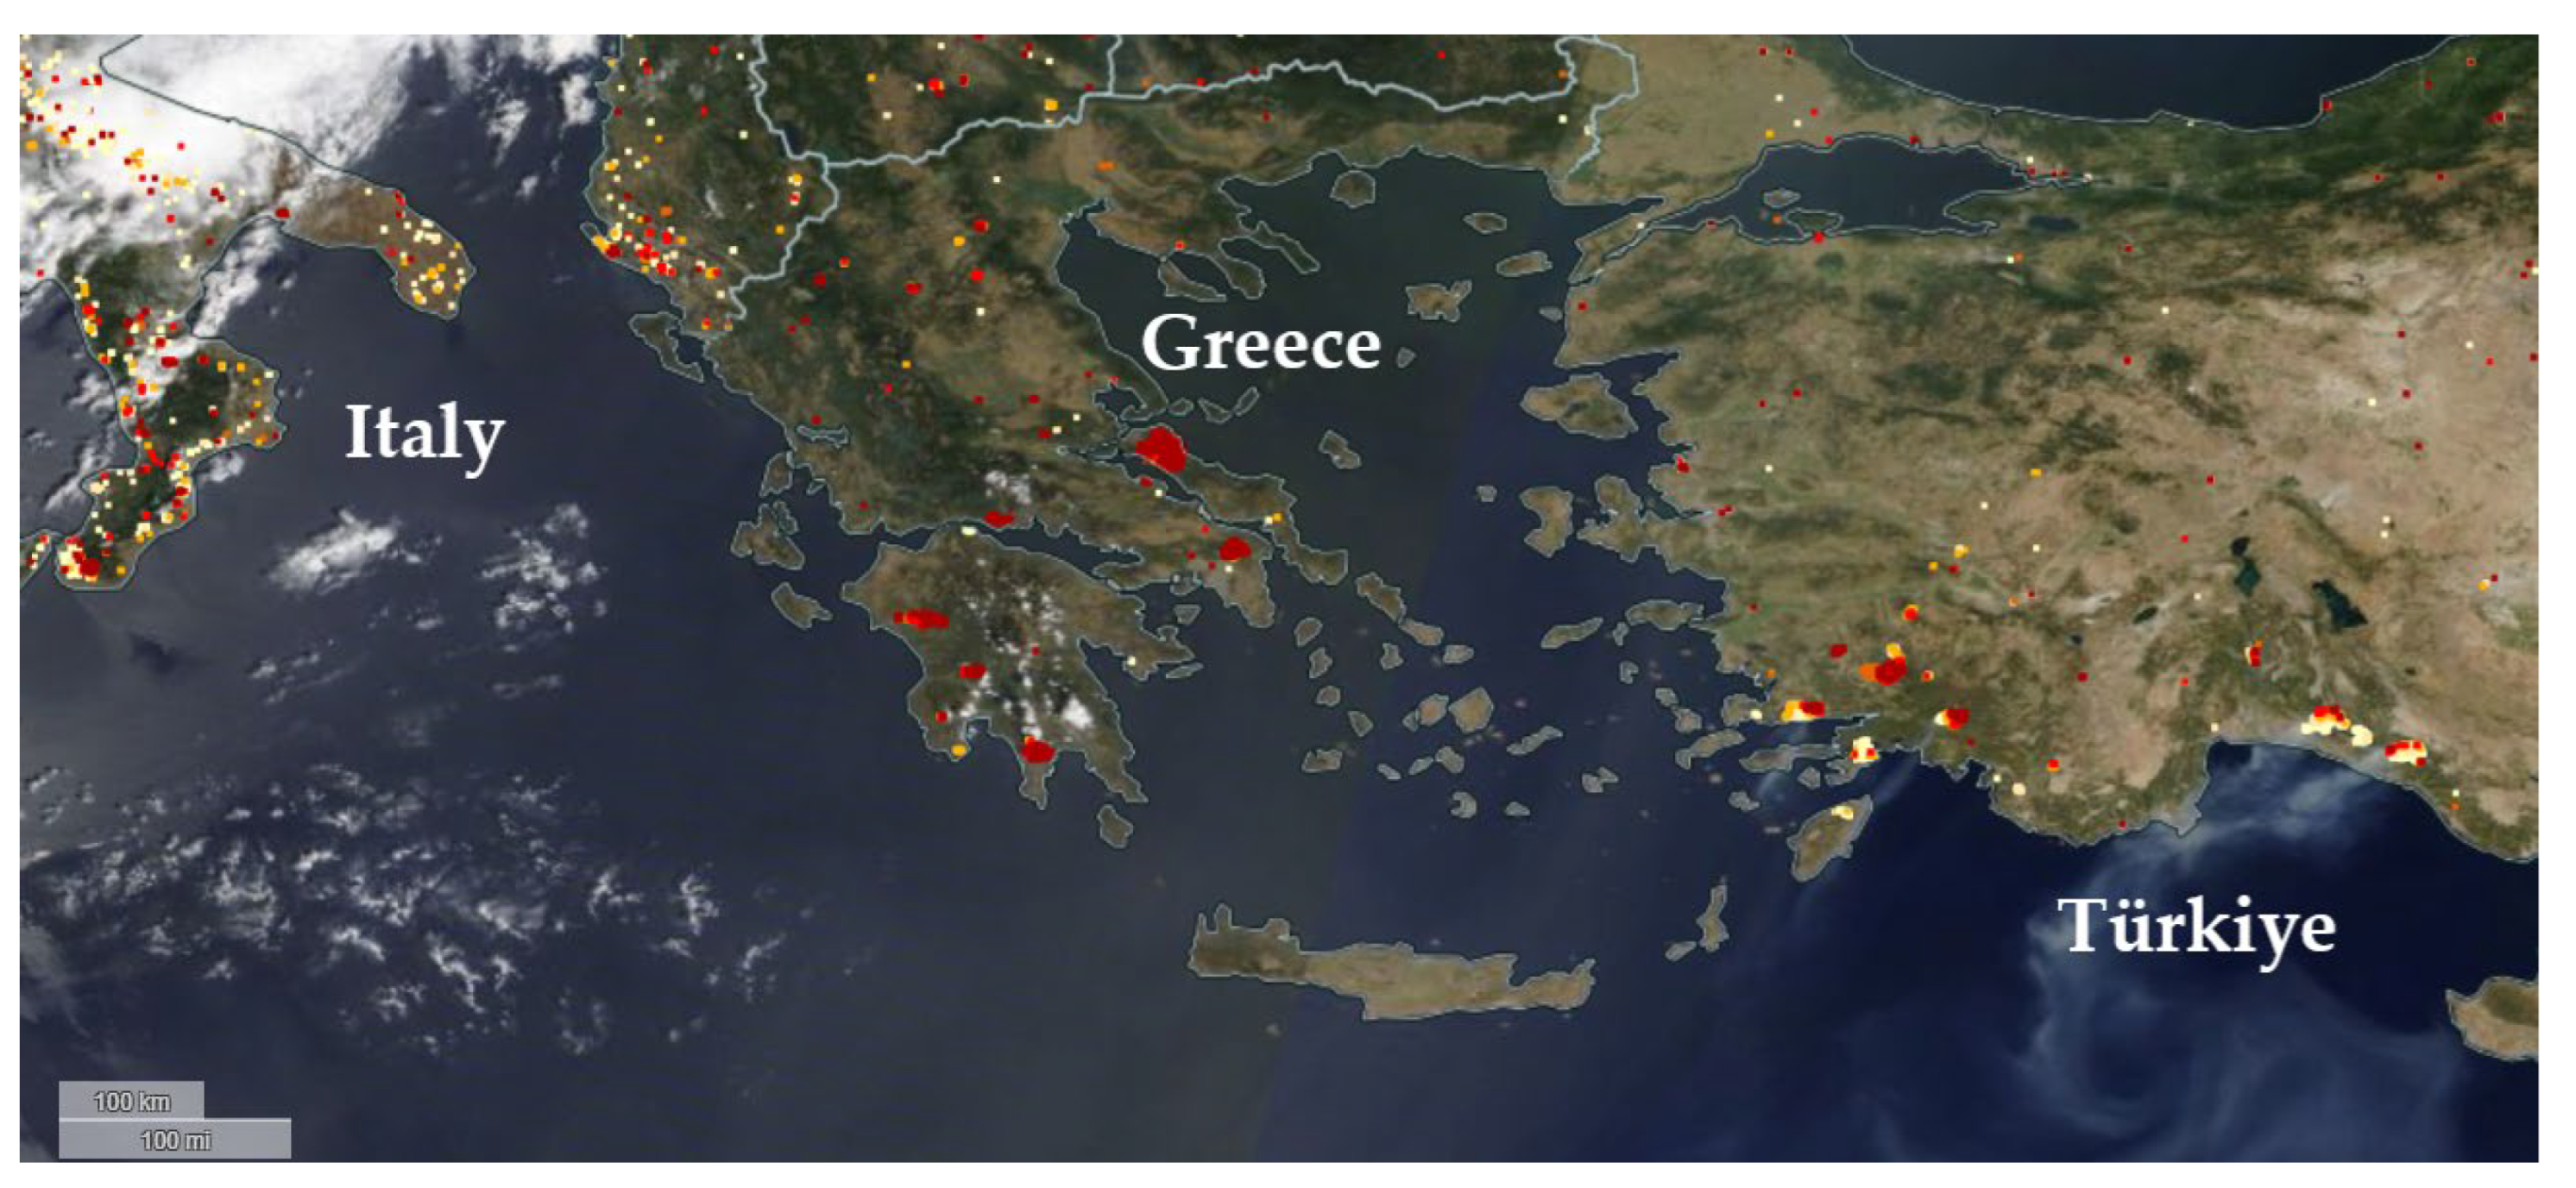
th shows vast areas in both countries being affected by wildfires (
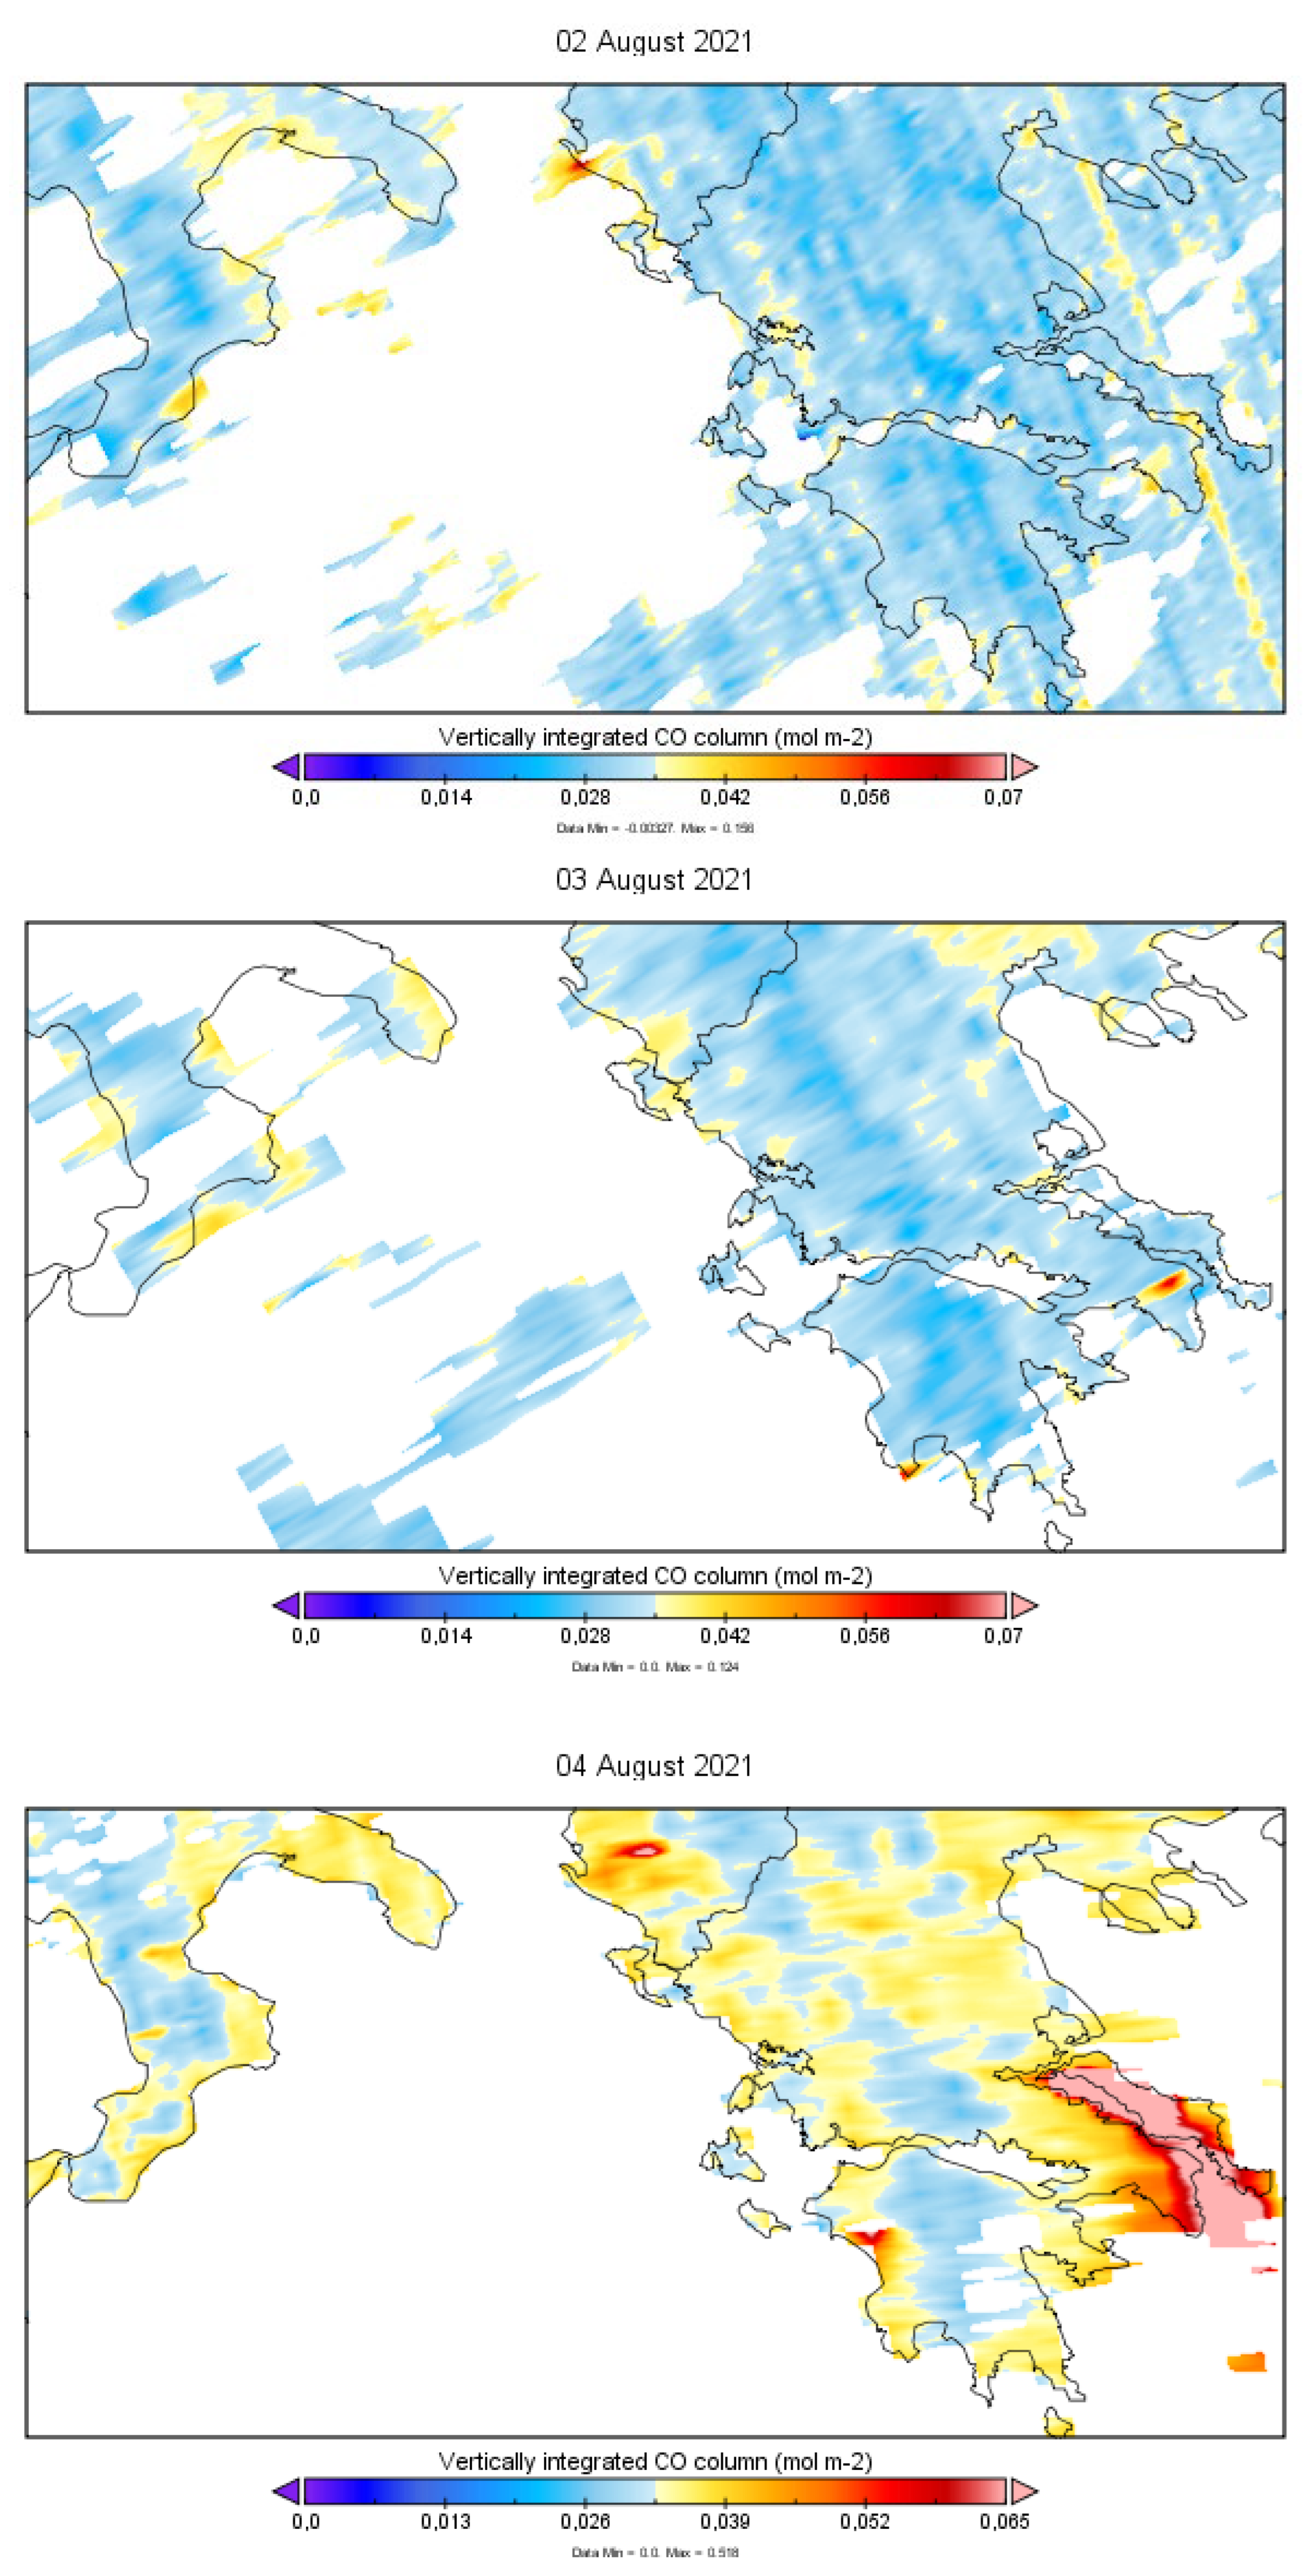
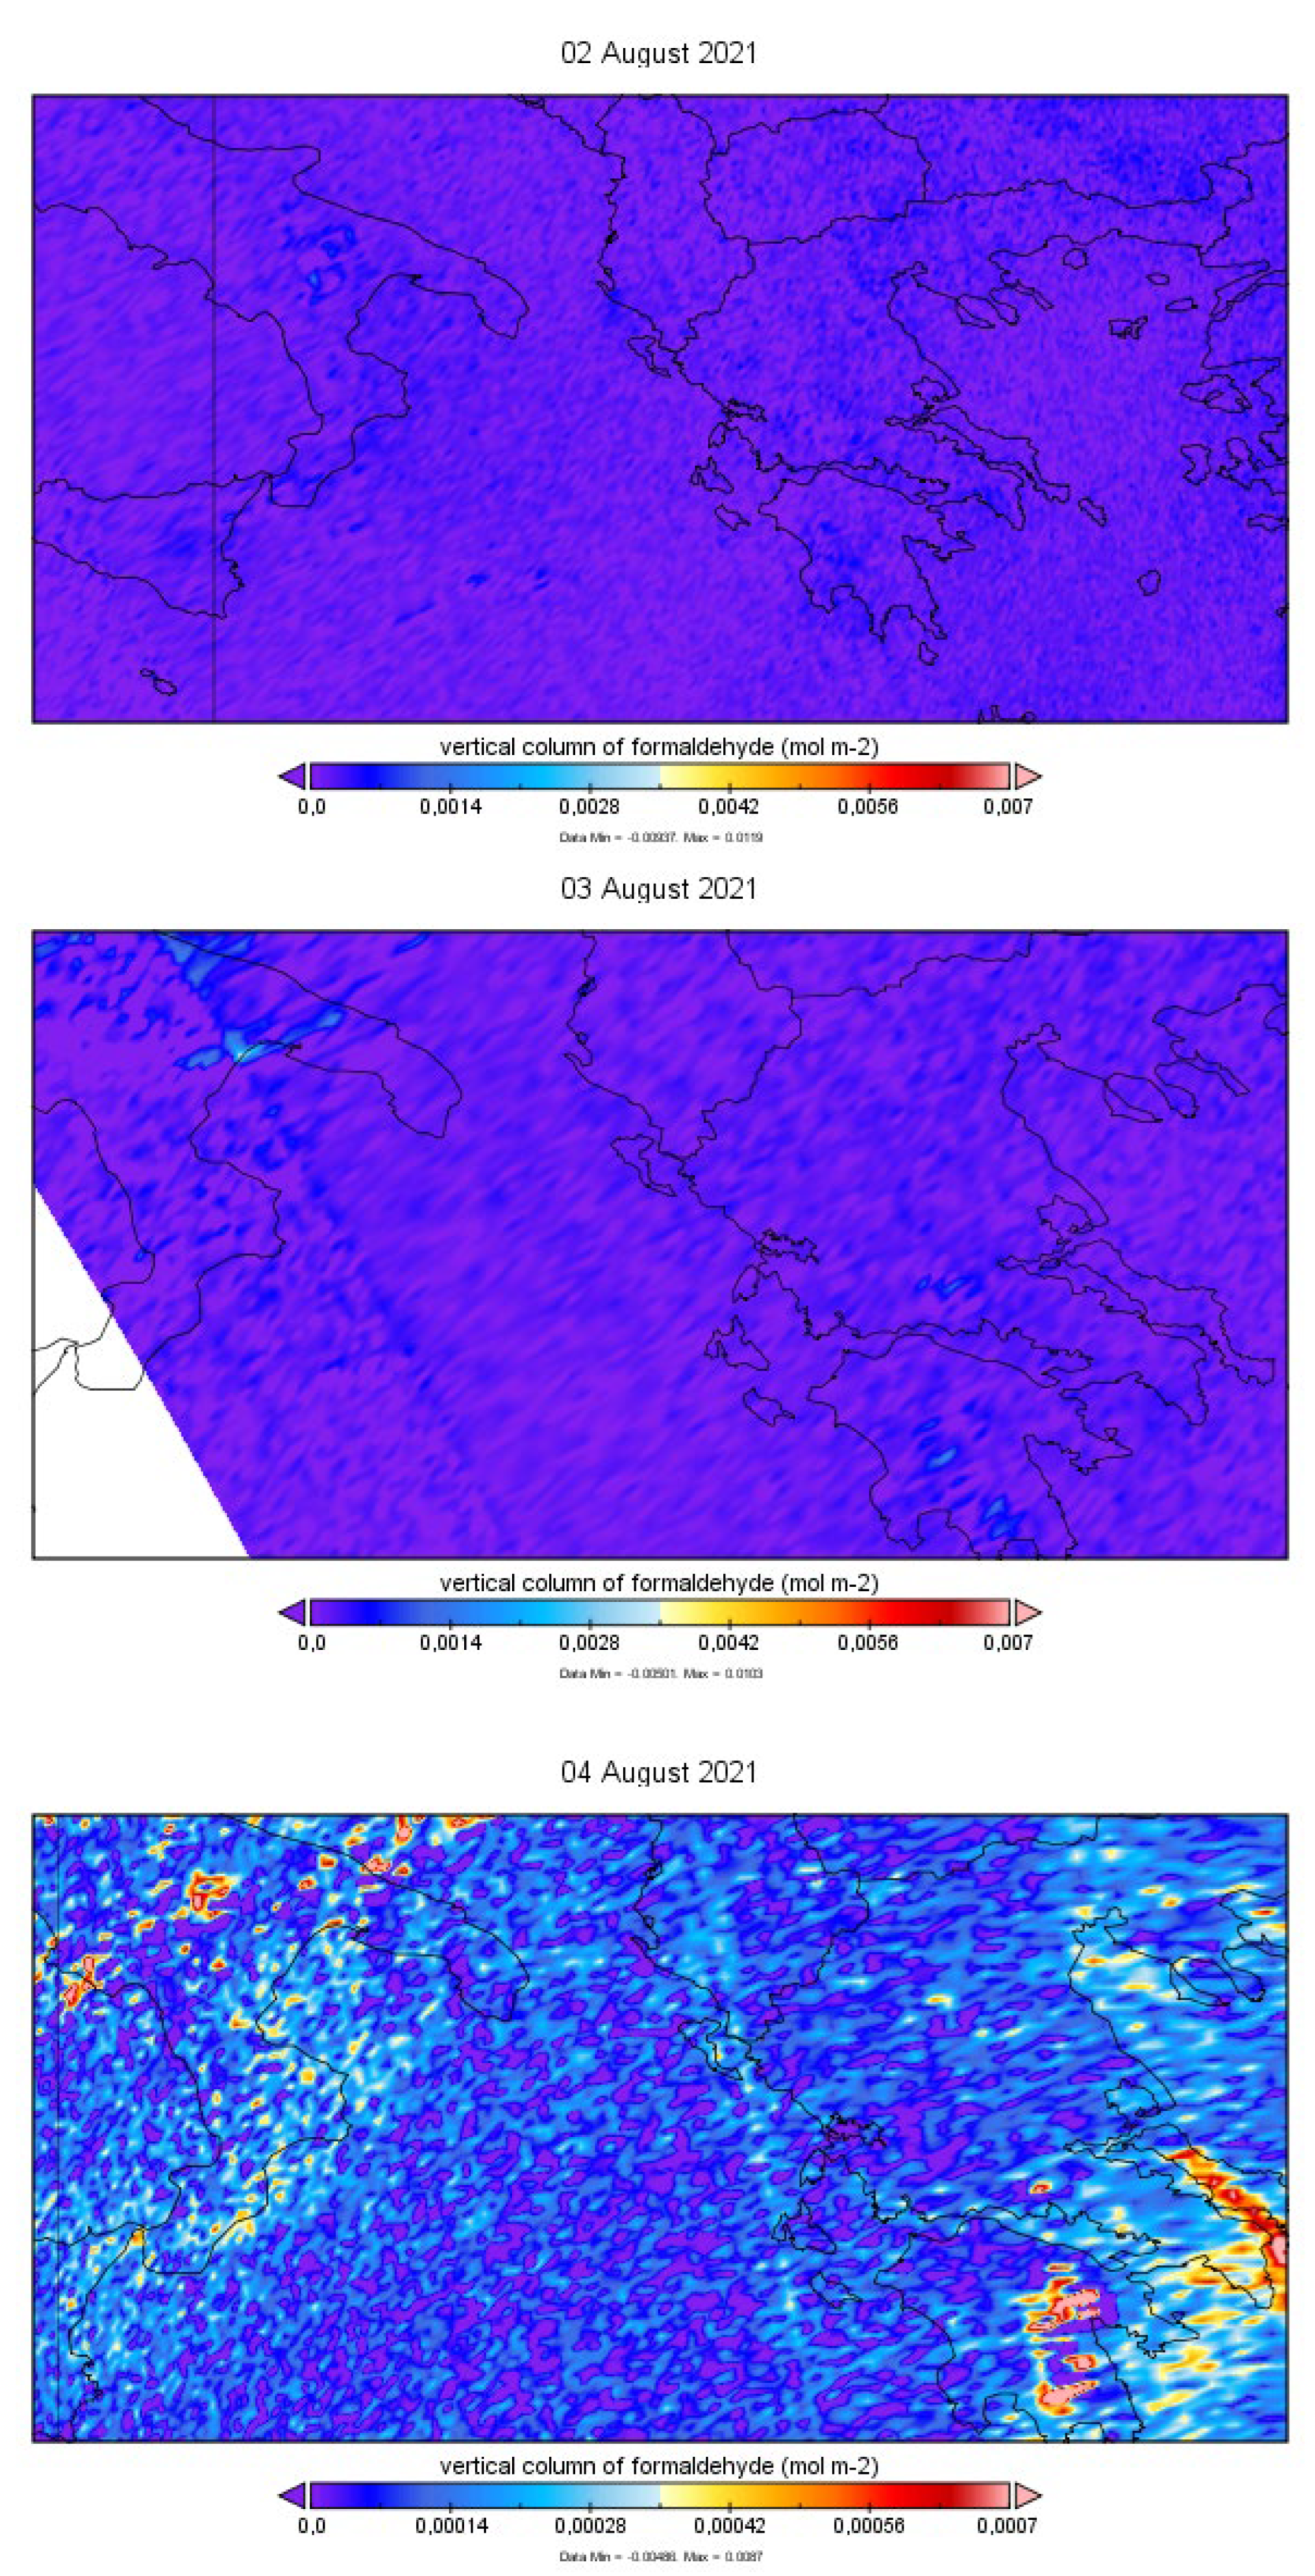
Figure 12). The Italian regions of Calabria and Apulia were also affected by prolonged wildfire activity. Tropospheric column data, shown in
Figure 13, shows relevant Greek peaks in density. One of the HYSPLIT backtrajectories (
Figure 14) centered at LMT is compatible with the surge in CO and HCHO emissions reported in Greece at the time.
5. Discussion
Data on the summer 2021 wildfire crisis in the Mediterranean basin have been subject to new analyses aimed at an enhanced characterization of carbon monoxide (CO) and formaldehyde (HCHO) observations, with the addition of equivalent black carbon (eBC) as an additional tracer of combustion processes. At the WMO/GAW (World Meteorological Organization—Global Atmosphere Watch) regional site of Lamezia Terme (code: LMT) in Calabria, Southern Italy, surface observations of CO and eBC have been integrated by tropospheric total column data on CO and HCHO to assess the influence of wildfires over air quality in the central Mediterranean during the peak of that crisis, in July and August 2021. This evaluation considers a longer observation period compared to previous research on local Calabrian wildfires [
43].
LMT’s location in the Mediterranean (
Figure 1) exposes the observation site to Saharan dust events [
81] and wildfire inputs from multiple sources: in the previous study, releases from wildfires affecting the Calabrian Aspromonte massif in August 2021 were observed via a multiparameter approach [
43].
In this study, a longer observation period has been selected between July 1
st and August 31
st of the same year: at the LMT station, this period is characterized by an excellent coverage rate of surface CO and eBC, with instruments nearing 100% in terms of coverage, thus allowing a detailed analysis of all data gathered during the period (
Table 1).
Using hourly averages as a reference (
Figure 2), the entire observation period has been assessed with respect to surface CO (ppm) and eBC (μg/m
3 or μg PCM) which both provided new insights on possible wildfire outputs other than those already described in Malacaria et al. (2024) [
43], which accounted for the August 10
th–12
th peaks linked to wildfires located in the Aspromonte massif in Calabria. The evaluation of hourly averages pinpointed a number of circumstances with high peaks.
Using daily averages and integrating the tropospheric total column densities of CO and HCHO, a cross-analysis of surface and column data was possible (
Figure 3). The cross analysis allowed to determine the difference between high altitude air mass transport from remote sources, and nearby surface/near-surface outputs. The LMT coastal site is affected by local wind circulation patterns (
Section 2) which have a direct impact on atmospheric measurements. In
Figure 3B,C, data have been differentiated by wind sector, which could provide more precise information on the source of observed peaks. The differentiation was also applied to daily cycle analyses (
Figure 4) and highlighted the presence of gaps,
i.e. hours that were not covered by specific combinations of wind direction and the surface concentration of CO and eBC.
A comparison between daily averages alone however cannot be deemed sufficient to compare surface and tropospheric column data. In the case of CO, which is the only evaluated parameter measured from both surface analyzers and satellite sensors, the daily average calculated from surface data is not directly comparable to total tropospheric column density observed by satellite scans. Considering that these scans occur at 14:00 UTC, the surface hourly averages of CO at that time have been considered and plotted with column data in
Figure 5. Although divergences are present, each indicating a circumstance of near-surface peaks which were not distributed on the tropospheric column and, vice versa, high altitude air mass transport which did not result into a surface concentration peak, data shown in
Figure 5 indicate an increase of CO between July and August 2021. Formaldehyde, which is not subject to continuous surface measurements, also shows a trend compatible with carbon monoxide variability. It is worth noting that tropospheric column densities are not equally susceptible at all altitudes, as the employed instruments are more sensitive to surface and near-surface concentrations: in the case of CO, this feature enhances the correlation between tropospheric column and surface data.
CO and HCHO are both tracers of combustion (
Section 1), however formaldehyde is characterized by a lower persistence time in the atmosphere due to chemical and photochemical processes [
110], thus making HCHO a proximity indicator. Air mass transport from remote wildfires would therefore be significantly depleted in HCHO.
The variability of CO and HCHO during the study period (July-August 2021) and related peaks have allowed to indicate three case studies (CS); via FIRMS, daily tropospheric column data, surface measurements, and HYSPLIT backtrajectories, each CS has been constrained to a probable source of emission in the Mediterranean basin.
In the process of evaluating CS1, FIRMS data showed a significant number of wildfires active for 2+ days in Calabria itself, and the Italian regions of Sardinia, Sicily, and Apulia (
Figure 6). TVC data on CO and HCHO between July 9
th and 12
th, subject to availability limitations (CO data not available on July 12
th, and HCHO data not available on the 9
th and 11
th), highlight the presence of Calabrian and Sardinian wildfires in particular (
Figure 7). At the LMT observatory, this period was already known to be characterized by CO and eBC concentrations above seasonal and yearly averages, thus indicating wildfires as possible sources [
43]. Using the computed HYSPLIT backtrajectory shown in
Figure 8, the peaks of CS1 are attributable to Sardinian wildfires: at the site, these trajectories are linked to western wind corridors, which are generally depleted in GHGs and pollutants [
89]. However, the perturbation of background atmospheric levels caused by wildfires and the wind inversion processes linked to the daily cycle at LMT [
88,
93] are both compatible with westerly winds for CS1.
A similar circumstance is observed in CS2, where FIRMS data indicate wildfire activity in north Africa, specifically in Algeria (
Figure 9) which is known to be susceptible to wildfires [
111,
112]. The peaks in CO and HCHO from Algerian wildfires are confirmed by TVC data (
Figure 10) and the computed HYSPLIT backtrajectory also results into a western air mass transport observed at LMT (
Figure 11), which culminated with the precipitation to surface levels of pollutants at high altitudes, linked to daily cycle wind circulation inversions at LMT [
78,
79].
In CS3’s case, FIRMS data confirm very heavy wildfire activity in central Greece and in several regions across Türkiye in early August (
Figure 12). Tropospheric column data of CO and HCHO highlight, especially for August 4
th (
Figure 13), significant peaks in column density in areas that were significantly affected by wildfires in central Greece at the time (
Section 1). However, the analysis of backtrajectories via HYSPLIT (
Figure 14) has shown once again a westerly wind corridor linked to surface LMT observations via a clockwise pattern instead of a northeastern wind corridor. Surface LMT detections are, in CS3, also correlated with inversions in wind circulation caused by the local daily cycle and the precipitation of pollutants from higher altitudes.
Overall, the findings shown during the evaluation of all case studies demonstrate the complexity of wildfire detections from surface observations in the central Mediterranean, as air mass transport combines with local phenomena and influences the impact of wildfire emissions to the surface. In fact, without the local wind inversion cycle at LMT, the peaks linked to CS1 through CS3 would have likely lacked a surface counterpart of tropospheric density peaks.
6. Conclusions
By expanding the findings of a previous study on the summer 2021 wildfire crisis in the Mediterranean via the implementation of additional methodologies and a longer study period (July-August), the effects of wildfires on atmospheric measurements performed at the WMO/GAW (World Meteorological Organization—Global Atmosphere Watch) regional site of Lamezia Terme (LMT) could be characterized.
Surface measurements at the site of carbon monoxide (CO) are characterized by a very high coverage rate, with nearly 100% of the study period covered by a measurement. Surface equivalent black carbon (eBC) concentrations, although not classified as gaseous, have also been used as an effective tracer of wildfire emissions and also have a very high coverage rate in terms of measurements. Surface findings have been correlated with tropospheric total column densities of CO and formaldehyde (HCHO) to observe the air mass transport of wildfire byproducts in the central Mediterranean. Surface measurements at LMT have pinpointed peaks that resulted into the evaluation of three distinct case studies (CS). The analysis of these CS, which integrated a previous research study on Calabrian wildfires that struck the Aspromonte massif in the southernmost area of the Italian peninsula, has revealed a number of possible sources of the observed surface concentration peaks of CO and eBC. Specifically, the Italian region of Sardinia, northern Algeria, and central Greece have been pinpointed as the wildfire emission sources of the evaluated case studies via the integration of surface measurements with TVC and HYSPLIT backtrajectories. Although they were also affected by heavy wildfire activity, the Italian regions of Sicily and Apulia, as well as Türkiye, are apparently not linked to any of the peaks observed by LMT between July and August 2021. Surprisingly, central Greek outputs have been detected at LMT from the west instead of the east, thus demonstrating the importance of air mass transport in the diffusion of wildfire emissions. In this case, as well as in the other two case studies, surface peaks have been influenced by local wind inversion patterns and the consequent precipitation of pollutants. Without the described local wind regime mechanisms, would have likely missed these peaks.
These findings provide a tangible example of several factors that interplay with each other and add more degrees of complexity to the diffusion of wildfire outputs in the Mediterranean basin. Although the primary focus with respect to wildfires is the effective containment of the damage caused to the environment, enhanced analyses of wind circulation and the broader impacts of wildfires to air quality can also be assessed to issue ad hoc warnings and mitigate the risks associated with them.
Author Contributions
Conceptualization, F.D. and T.L.F.; methodology, F.D. and T.L.F.; software, F.D., G.D.B., L.M., S.S., D.G., and T.L.F.; validation, F.D., G.D.B., L.M., S.S., C.R.C., D.G., I.A. and T.L.F.; formal analysis, F.D., G.D.B., L.M., S.S., C.R.C., D.G., I.A. and T.L.F.; investigation, F.D., G.D.B., L.M., S.S., C.R.C., D.G., I.A. and T.L.F.; resources, C.R.C. and T.L.F.; data curation, F.D., G.D.B., L.M., S.S., C.R.C., D.G., I.A. and T.L.F.; writing—original draft preparation, F.D., G.D.B. and T.L.F.; writing—review and editing, F.D., G.D.B., L.M., S.S., C.R.C., D.G., I.A. and T.L.F.; visualization, F.D., G.D.B. and T.L.F.; supervision, F.D., C.R.C. and T.L.F.; project administration, C.R.C.; funding acquisition, C.R.C. All authors have read and agreed to the published version of the manuscript.
Funding
This research was funded by AIR0000032—ITINERIS, the Italian Integrated Environmental Research Infrastructures System (D.D. n. 130/2022—CUP B53C22002150006) under the EU—Next Generation EU PNRR—Mission 4 “Education and Research”—Component 2: “From research to business”—Investment 3.1: “Fund for the realization of an integrated system of research and in-novation infrastructures.”
Data Availability Statement
Data are currently not available as they are subject to other research.
Conflicts of Interest
The authors declare no conflicts of interest.
References
- Bowman, D.M.J.S.; Williamson, G.J.; Abatzoglou, J.T.; Kolden, C.A.; Cochrane, M.A.; Smith, A.M.S. Human exposure and sensitivity to globally extreme wildfire events. Nat. Ecol. Evol. 2017, 1, 0058. [Google Scholar] [CrossRef] [PubMed]
- Duane, A.; Castellnou, M.; Brotons, L. Towards a comprehensive look at global drivers of novel extreme wildfires. Clim. Chang. 2021, 165, 43. [Google Scholar] [CrossRef]
- Senande-Rivera, M.; Insua-Costa, D.; Miguez-Macho, G. Towards an atmosphere more favourable to firestorm development in Europe. Environ. Res. Lett. 2022, 17(9), 094015. [Google Scholar] [CrossRef]
- Gonzi, S.; Feng, L.; Palmer, P.I. Seasonal cycle of emissions of CO inferred from MOPITT profiles of CO: Sensitivity to pyroconvection and profile retrieval assumptions. Geophys. Res. Lett. 2011, 38(8), L08813. [Google Scholar] [CrossRef]
- Castellnou, M.; Bachfischer, M.; Miralles, M.; Ruiz, B.; Stoof, C.R.; Vilà-Guerau de Arellano, J. Pyroconvection Classification Based on Atmospheric Vertical Profiling Correlation With Extreme Fire Spread Observations. J. Geophys. Res.-Atmos. 2022. [Google Scholar] [CrossRef]
- Finney, M.; McAllister, S.; Grumstrup, T.; Forhofer, J. Wildland Fire Behavior—Dynamics, Principles, and Processes, 1st ed.; CSIRO Publishing: Melbourne, Australia, 2021; pp. 461–462. [Google Scholar]
- Fromm, M.; Servranckx, R.; Stocks, B.J.; Peterson, D.A. Understanding the critical elements of the pyrocumulonimbus storm sparked by high-intensity wildland fire. Communications Earth and Environment 2022, 3, 243. [Google Scholar] [CrossRef]
- Lareau, N.P.; Clements, C.B. Environmental controls on pyrocumulus and pyrocumulonimbus initiation and development. Atmos. Chem. Phys. 2016, 16(6), 4005–4022. [Google Scholar] [CrossRef]
- Rosenfeld, D.; Fromm, M.; Trentmann, J.; Luderer, G.; Andreae, M.O.; Servranckx, R. The Chisholm firestorm: Observed microstructure, precipitation and lightning activity of a pyro-cumulonimbus. Atmos. Chem. Phys. 2007, 7(3), 645–659. [Google Scholar] [CrossRef]
- Dowdy, A.J.; Fromm, M.D.; McCarthy, N. Pyrocumulonimbus lightning and fire ignition on Black Saturday in southeast Australia. J. Geophys. Res.-Atmos. 7342. [Google Scholar] [CrossRef]
- Safronov, A.N. Effects of Climatic Warming and Wildfires on Recent Vegetation Changes in the Lake Baikal Basin. Climate 2020, 8(4), 57. [Google Scholar] [CrossRef]
- Fromm, M.; Bevilacqua, R.; Servranckx, R.; Josen, J.; Thayer, J.P.; Herman, J.; Larko, D. Pyro-cumulonimbus injection of smoke to the stratosphere: Observations and impact of a super blowup in northwestern Canada on 3–4 August 1998. J. Geophys. Res.-Atmos. 3–4 August. [CrossRef]
- Fromm, M.D.; McRae, R.H.D.; Sharples, J.J.; Kablick, G.P. III. Pyrocumulonimbus pair in Wollemi and Blue Mountains National Parks, 22 November 2006. Aust. Meteorol. Ocean. 22 November. [CrossRef]
- Thurston, W.; Keppert, J.D.; Tory, K.J.; Fawcett, R.J.B. The contribution of turbulent plume dynamics to long-range spotting. Int. J. Wildland Fire 2017, 26(4), 317–330. [Google Scholar] [CrossRef]
- Potter, B.E. Atmospheric interactions with wildland fire behavior—I. Basic surface interactions, vertical profiles and synoptic structures. Int. J. Wildland Fire. [CrossRef]
- Potter, B.E. Atmospheric interactions with wildland fire behavior—II. Plume and vortex dynamics. Int. J. Wildland Fire 2012, 21(7), 802–817. [Google Scholar] [CrossRef]
- Peace, M. , McCaw, L., Santos, B., Kepert, J., Burrows, N., & Fawcett, R. J. B. (2017). Meteorological drivers of extreme fire behaviour during the Waroona bushfire, Western Australia, January 2016. J. South. Hemisph. Earth Syst. Sci. 2017, 67, 79–106. [Google Scholar] [CrossRef]
- Kablick, G.P. III; Allen, D.R.; Fromm, M.D.; Nedoluha, G.E. Australian PyroCb Smoke Generates Synoptic-Scale Stratospheric Anticyclones. Geophys. Res. Lett. 2020, 47(13), e2020GL088101. [Google Scholar] [CrossRef]
- San-Miguel-Ayanz, J.; Durrant, T.; Boca, R.; Maianti, P.; Libertá, G.; Artés-Vivancos, T.; Oom, D.; Branco, A.; de Rigo, D.; Ferrari, D.; Pfeiffer, H.; Grecchi, R.; Onida, M.; Löffler, P. Forest Fires in Europe, Middle East and North Africa 2021, Publications Office of the European Union, Luxembourg, 2022. [CrossRef]
- Arslan, H.; Baltaci, H.; Demir, G.; Ozcan, H.K. Spatiotemporal changes and background atmospheric factors associated with forest fires in Turkiye. Environ. Monit. Assess. 2024, 196(10), 891. [Google Scholar] [CrossRef] [PubMed]
- Cosgun, U.; Coşkun, M.; Toprak, F.; Yıldız, D.; Coşkun, S.; Taşoğlu, E.; Öztürk, A. Visibility Evaluation and Suitability Analysis of Fire Lookout Towers in Mediterranean Region, Southwest Anatolia/Türkiye. Fire 2023, 6(8), 305. [Google Scholar] [CrossRef]
- Yilmaz, O.S.; Akyuz, D.E.; Aksel, M.; Dikici, M.; Akgul, M.A.; Yagci, O.; Balik Sanli, F.; Aksoy, H. Evaluation of pre- and post-fire flood risk by analyitical hierarchy process method: a case study for the 2021 wildfires in Bodrum, Türkiye. Landscape Ecol. Eng. 2023, 19(2), 271–288. [Google Scholar] [CrossRef]
- Gülçin, D.; Özcan, A.U.; Akdağ, B.; Çiçek, K. Assessment of Endemic Lycian Salamanders Habitats Impacted by 2021 Mega Forest Fires in Türkiye. Ecologia Balkanica 2022, 14, 57–78. [Google Scholar]
- Aydin-Kandemir, F.; Demir, N. 2021 Türkiye mega forest Fires: Biodiversity measurements of the IUCN Red List wildlife mammals in Sentinel-2 based burned areas. Adv. Space Res. 2023, 71(7), 3060–3075. [Google Scholar] [CrossRef]
- Yildiz, C.; Çömert, R.; Tanyaş, H.; Yılmaz, A.; Akbaş, A.; Akay, S. S:, Yetemen, Ö.; Görüm, T. The effect of post-wildfire management practices on vegetation recovery: Insights from the Sapadere fire, Antalya, Türkiye. Front. Earth Sci. 2023, 11, 1174155. [Google Scholar] [CrossRef]
- Tariq, S.; ul-Haq, Z.; Mariam, A.; Mehmood, U.; Ahmed, W. Assessment of air quality during worst wildfires in Mugla and Antalya regions of Türkiye. Nat. Hazards 2023, 115(2), 1235–1254. [Google Scholar] [CrossRef]
- Eke, M.; Cingiroglu, F.; Kaynak, B. Investigation of 2021 wildfire impacts on air quality in southwestern Türkiye. Atmos. Environ. 2024, 325, 120445. [Google Scholar] [CrossRef]
- Yilmaz, O.S.; Acar, U.; Sanli, F.B.; Gulgen, F.; Ates, A.M. Mapping burn severity and monitoring CO content in Türkiye’s 2021 Wildfires, using Sentinel-2 and Sentinel-5P satellite data on the GEE platform. Earth Sci. Inform. 2023, 16, 221–240. [Google Scholar] [CrossRef]
- Çinar, T.; Taşpinar, F.; Aydin, A. Analysis and estimation of gaseous air pollutant emissions emitted into the atmosphere during Manavgat and Milas wildfire episodes using remote sensing data and ground measurements. Air Qual. Atmos. Health 2024, 17(3), 559–579. [Google Scholar] [CrossRef]
- Founda, D.; Katavoutas, G.; Pierros, F.; Mihalopoulos, N. The Extreme Heat Wave of Summer 2021 in Athens (Greece): Cumulative Heat and Exposure to Heat Stress. Sustainability 2022, 14(13), 7766. [Google Scholar] [CrossRef]
- Boschetti, L.; Roy, D.; Barbosa, P.; Boca, R.; Justice, C. A MODIS assessment of the summer 2007 extent burned in Greece. Int. J. Remote Sens. 2008, 29(8), 2433–2436. [Google Scholar] [CrossRef]
- Kaskaoutis, D.G.; Kharol, S.K.; Sifakis, N.; Nastos, P.T.; Sharma, A.R. Badarinath, K.V.S. Kambezidis, H.D. Satellite monitoring of the biomass-burning aerosols during the wildfires of August 2007 in Greece: climate implications. Atmos. Environ. 20 August. [CrossRef]
- Sifakis, N.I.; Iossifidis, C.; Kontoes, C.; Keramitsoglou, I. Wildfire Detection and Tracking over Greece Using MSG-SEVIRI Satellite Data. Remote Sens. 2011, 3(3), 524–538. [Google Scholar] [CrossRef]
- Polychronaki, A.; Gitas, I.Z. Burned Area Mapping in Greece Using SPOT-4 HRVIR Images and Object-Based Image Analysis. Remote Sens. 2012, 4(2), 424–438. [Google Scholar] [CrossRef]
- Koutsias, N.; Arianoutsou, M.; Kallimanis, A.S.; Mallinis, G.; Halley, J.M.; Dimopoulos, P. Where did the fires burn in Peloponnisos, Greece the summer of 2007? Evidence for a synergy of fuel and weather. Agric. For. Meteorol. 2012, 156, 41–53. [Google Scholar] [CrossRef]
- Kontoes, C.; Keramitsoglou, I.; Papoutsis, I.; Sifakis, N.I.; Xofis, P. National Scale Operational Mapping of Burnt Areas as a Tool for the Better Understanding of Contemporary Wildfire Patterns and Regimes. Sensors 2013, 13(8), 11146–11166. [Google Scholar] [CrossRef]
- Kalivas, D.P.; Petropoulos, G.P.; Athanasiou, I.M.; Kollias, V.J. An intercomparison of burnt area estimates derived from key operational productions: The Greek wildland fires of 2005-2007. Nonlinear Proc. Geoph. 2013, 20(3), 397–409. [Google Scholar] [CrossRef]
- Giannaros, T.M.; Papavasileiou, G.; Lagouvardos, K.; Kotroni, V.; Dafis, S.; Karagiannidis, A.; Dragozi, E. Meteorological Analysis of the 2021 Extreme Wildfires in Greece: Lessons Learned and Implications for Early Warning of the Potential for Pyroconvection. Atmosphere 2022, 13(3), 475. [Google Scholar] [CrossRef]
- Papavasileiou, G.; Giannaros, T.M. Synoptic-scale drivers of fire weather in Greece. Sci. Total Environ. 2024, 925, 171715. [Google Scholar] [CrossRef]
- Bilgiç, E.; Tuna Tuygun, G.; Gündüz, O. Development of an emission estimation method with satellite observations for significant forest fires and comparison with global fire emission inventories: Application to catastrophic fires of summer 2021 over the Eastern Mediterranean. Atmos. Environ. 2023, 308, 119871. [Google Scholar] [CrossRef]
- Pulvirenti, L.; Squicciarino, G.; Fiori, E.; Negro, D.; Gollini, A.; Puca, S. Near real-time generation of a country-level burned area database for Italy from Sentinel-2 data and active fire detections. Remote Sens. Appl.: Soc. Environ. 1009. [Google Scholar] [CrossRef]
- Cristofanelli, P.; Trisolino, P.; Calzolari, F.; Busetto, M.; Calidonna, C.R.; Amendola, S.; Arduini, J.; Fratticioli, C.; Hundal, R.A.; Maione, M.; Marcucci, F.; Marinoni, A.; Montaguti, S.; Renzi, L.; Roccato, F.; Bonasoni, P.; Putero, D. Influence of wildfire emissions to carbon dioxide (CO2) observed at the Mt. Cimone station (Italy, 2165 m asl): A multi-year investigation. Atmos. Environ. [CrossRef]
- Malacaria, L.; Parise, D.; Lo Feudo, T.; Avolio, E.; Ammoscato, I.; Gullì, D.; Sinopoli, S.; Cristofanelli, P.; De Pino, M.; D’Amico, F.; Calidonna, C.R.C. Multiparameter Detection of Summer Open Fire Emissions: The Case Study of GAW Regional Observatory of Lamezia Terme (Southern Italy). Fire 2024, 7(6), 198. [Google Scholar] [CrossRef]
- Ascoli, D.; Moris, J.V.; Marchetti, M.; Sallustio, L. Land use change towards forests and wooded land correlates with large and frequent wildfires in Italy. Ann. Silvic. Res. [CrossRef]
- Castagna, J.; Senatore, A.; Bencardino, M.; D’Amore, F.; Sprovieri, F.; Pirrone, N.; Mendicino, G. Multiscale assessment of the impact on air quality of an intense wildfire season in southern Italy. Sci. Total Environ. 2021, 761, 143271. [Google Scholar] [CrossRef] [PubMed]
- Argentiero, I.; Ricci, G.F.; Elia, M.; D’Este, M.; Giannico, V.; Ronco, F.V.; Gentile, F.; Sanesi, G. Combining Methods to Estimate Post-Fire Soil Erosion Using Remote Sensing Data. Forests 2021, 12(8), 1105. [Google Scholar] [CrossRef]
- Khalil, M.A.K.; Rasmussen, R.A. Carbon Monoxide in the Earth’s Atmosphere: Increasing Trend. Science, /: 54-56. https, 4644. [Google Scholar]
- Edwards, D.P.; Emmons, L.K.; Hauglustaine, D.A.; Chu, D.A.; Gille, J.C.; Kaufman, Y.J.; Pétron, G.; Yurganov, L.N.; Giglio, L.; Deeter, M.N.; et al. Observations of carbon monoxide and aerosols from the Terra satellite: Northern Hemisphere variability. J. Geophys. Res. -Atmos. 2004, 109, 17–D2420. [Google Scholar] [CrossRef]
- Capilla, C. Analysis of the trend and seasonal cycle of carbon monoxide concentrations in an urban area. Env. Sci. Poll. Res. Int. 2007, 14, 19–22. [Google Scholar] [CrossRef]
- Dill, J. Estimating emissions reductions from accelerated vehicle retirement programs. Transp. Res. D: Transp. Environ. [CrossRef]
- Zheng, B.; Chevallier, F.; Ciais, P.; Yin, Y.; Deeter, M.N.; Worden, H.M.; Wang, Y.; Zhang, Q.; He, K. Rapid decline in carbon monoxide emissions and export from East Asia between years 2005 and 2016. Environ. Res. Lett. 2018, 13, 044007. [Google Scholar] [CrossRef]
- Walsh, M.P. Global trends in motor vehicle pollution control: 1996 state of the art and remaining problems. Int. J. Veh. Des. [CrossRef]
- Dennison, P.E.; Brewer, S.C.; Arnold, J.D.; Moritz, M.A. Large wildfire trends in the western United States, 1984–2011. Geophys. Res. Lett. 2014, 41, 2928–2933. [Google Scholar] [CrossRef]
- Buchholz, R.R.; Worden, H.M.; Park, M.; Francis, G.; Deeter, M.N.; Edwards, D.P.; Emmons, L.K.; Gaubert, B.; Gille, J.; Martínez-Alonso, S.; et al. Air pollution trends measured from Terra: CO and AOD over industrial, fire-prone, and background regions. Remote Sens. Environ. 2021, 256, 112275. [Google Scholar] [CrossRef]
- Checkoway, H.; Dell, L.D.; Boffetta, P.; Gallagher, A.E.; Crawford, L.; Lees, P.J.S.; Mundt, K.A. Formaldehyde exposure and mortality risks from acute myeloid leukemia and other lymphohematopoietic malignancies in the US National Cancer Institute Cohort study of workers in formaldehyde industries. JOEM 2015, 57(7), 785–794. [Google Scholar] [CrossRef]
- Binazzi, A.; Mensi, C.; Miligi, L.; Di Marzio, D.; Zajacova, J.; Galli, P.; Camagni, A.; Calisti, R.; Balestri, A.; Murano, S.; et al. Exposures to IARC Carcinogenic Agents in Work Settings Not Traditionally Associated with Sinonasal Cancer Risk: The Experience of the Italian National Sinonasal Cancer Registry. Int. J. Environ. Res. Public Health 2021, 18, 12593. [Google Scholar] [CrossRef] [PubMed]
- Na, K.; Cocker, D.R. Fine organic particle, formaldehyde, acetaldehyde concentrations under and after the influence of fire activity in the atmosphere of Riverside, California. Environ. Res. 2008, 108, 7–14. [Google Scholar] [CrossRef] [PubMed]
- Efimova, N.V.; Rukavishnikov, V.S. Assessment of Smoke Pollution Caused by Wildfires in the Baikal Region (Russia). Atmosphere 2021, 12(12), 1542. [Google Scholar] [CrossRef]
- Vichi, F.; Bassani, C.; Ianniello, A.; Esposito, G.; Montagnoli, M.; Imperiali, A. Formaldehyde Continuous Monitoring at a Rural Station North of Rome: Appraisal of Local Sources Contribution and Meteorological Drivers. Atmosphere 2023, 14(12), 1833. [Google Scholar] [CrossRef]
- Nogueira, T.; Dominutti, P.A.; De Carvalho, L.R.F.; Fornaro, A.; Andrade, M.D.F. Formaldehyde and acetaldehyde measurements in urban atmosphere impacted by the use of ethanol biofuel: Metropolitan Area of Sao Paulo (MASP), 2012-2013. Fuel 2014, 134, 505–513. [Google Scholar] [CrossRef]
- Jung, S.; Kim, S.; Chung, T.; Hong, H.; Lee, S.; Lim, J. Emission Characteristics of Hazardous Air Pollutants from Medium-Duty Diesel Trucks Based on Driving Cycles. Sustainability 2021, 13(14), 7834. [Google Scholar] [CrossRef]
- Du, W.; Xie, H.; Li, J.; Guan, X.; Li, M.; Wang, H.; Wang, X.; Zhang, X.; Zhang, Q. The Emission Characteristics of VOCs and Environmental Health Risk Assessment in the Plywood Manufacturing Industry: A Case Study in Shandong Province. Sustainability 2024, 16(17), 7350. [Google Scholar] [CrossRef]
- Yu, C.W.F.; Crump, D.R. Testing for formaldehyde emission from wood-based products—A review. Indoor Built Environ. 1999, 8(5), 280–286. [Google Scholar] [CrossRef]
- Salthammer, T.; Mentese, S.; Marutzky, R. Formaldehyde in the indoor environment. Chem. Rev. 2010, 110(4), 2536–2572. [Google Scholar] [CrossRef]
- Chen, X.; Li, F.; Liu, C.; Yang, J.; Zhang, J.; Peng, C. Monitoring, Human Health Risk Assessment and Optimized Management for Typical Pollutants in Indoor Air from Random Families of University Staff, Wuhan City, China. Sustainability 2017, 9(7), 1115. [Google Scholar] [CrossRef]
- Widder, S.H.; Haselbach, L. Relationship among Concentrations of Indoor Air Contaminants, Their Sources, and Different Mitigation Strategies on Indoor Air Quality. Sustainability 2017, 9(7), 1149. [Google Scholar] [CrossRef]
- Protano, C.; Antonucci, A.; De Giorgi, A.; Zanni, S.; Mazzeo, E.; Cammalleri, V.; Fabiani, L.; Mastrantonio, R.; Muselli, M.; Mastrangeli, G.; Ursini, C.L.; Cavallo, D.; Poli, D.; Di Gennario, G.; De Palma, G.; Vitali, M. Exposure and Early Effect Biomarkers for Risk Assessment of Occupational Exposure to Formaldehyde: A Systematic Review. Sustainability 2024, 16(9), 3631. [Google Scholar] [CrossRef]
- Lavoué, D.; Liousse, C.; Cachier, H.; Stocks, B.J.; Goldammer, J.G. Modeling of carbonaceous particles emitted by boreal and temperate wildfires at northern latitudes. J. Geophys. Res. -Atmos. 2687. [Google Scholar] [CrossRef]
- Tiittanen, P.; Timonen, K.L.; Ruuskanen, J.; Mirme, A.; Pekkanen, J. Fine particulate air pollution, resuspended road dust and respiratory health among symptomatic children. Eur. Respir. J. 1999, 13(2), 266–273. [Google Scholar] [CrossRef] [PubMed]
- Lighty, J.S.; Veranth, J.M.; Sarofim, A.F. Combustion aerosols: Factors governing their size and composition and implications to human health. J. Air Waste Manag. Assoc. 2000, 50, 1565–1618. [Google Scholar] [CrossRef] [PubMed]
- Park, S.S.; Kim, Y.J.; Cho, S.H.; Kim, M.O. Chemical composition of fine particles in three urban areas, Korea. J. Aerosol Sci. 2000, 31, 118–119. [Google Scholar] [CrossRef]
- Horvath, H. Atmospheric light absorption: A review. Atmos. Environ. Part A 1993, 27, 293–317. [Google Scholar] [CrossRef]
- Penner, J.E.; Chuang, C.C.; Grant, K. Climate forcing by carbonaceous and sulfate aerosols. Climate Dynamics 1998, 14(12), 839–851. [Google Scholar] [CrossRef]
- Chameides, W.L.; Bergin, M. Soot takes center stage. Science 2002, 297, 2214–2215. [Google Scholar] [CrossRef]
- Bond, T.C.; Doherty, S.J.; Fahey, D.W.; Forster, P.M.; Berntsen, T.; DeAngelo, B.J.; Flanner, M.G.; Ghan, S.; Kärcher, B.; Koch, D.; et al. Bounding the role of black carbon in the climate system: A scientific assessment. J. Geophys. Res. Atmos. 2013, 118, 5380–5552. [Google Scholar] [CrossRef]
- Jacobson, M.Z. Strong radiative heating due to the mixing state of black carbon in atmospheric aerosols. Nature 2001, 409, 695–697. [Google Scholar] [CrossRef]
- Ramanathan, V.; Carmichael, G. Global and regional climate changes due to black carbon. Nat. Geosci. 2008, 1, 221–227. [Google Scholar] [CrossRef]
- Federico, S.; Pasqualoni, L.; De Leo, L.; Bellecci, C. A study of the breeze circulation during summer and fall 2008 in Calabria, Italy. Atmos. Res. [CrossRef]
- Federico, S.; Pasqualoni, L.; Sempreviva, A.M.; De Leo, L.; Avolio, E.; Calidonna, C.R.; Bellecci, C. The seasonal characteristics of the breeze circulation at a coastal Mediterranean site in South Italy. Adv. Sci. Res. 2010, 4, 47–56. [Google Scholar] [CrossRef]
- European Commission. European Marine Observation and Data Network (EMODnet). https://emodnet.ec.europa.eu/en/bathymetry. (accessed on 2 November 2024).
- Calidonna, C.R.; Avolio, E.; Gullì, D.; Ammoscato, I.; De Pino, M.; Donateo, A.; Lo Feudo, T. Five Years of Dust Episodes at the Southern Italy GAW Regional Coastal Mediterranean Observatory: Multisensors and Modeling Analysis. Atmosphere 2020, 11(5), 456. [Google Scholar] [CrossRef]
- Gullì, D.; Avolio, E.; Calidonna, C.R.; Lo Feudo, T.; Torcasio, R.C.; Sempreviva, A.M. Two years of wind-lidar measurements at an Italian Mediterranean Coastal Site. In European Geosciences Union General Assembly 2017, EGU—Division Energy, Resources & Environment, ERE. Energy Procedia 2017, 125, pgs–214. [Google Scholar] [CrossRef]
- Avolio, E.; Federico, S.; Miglietta, M.M.; Lo Feudo, T.; Calidonna, C.R.; Sempreviva, A.M. Sensitivity analysis of WRF model PBL schemes in simulating boundary-layer variables in southern Italy: An experimental campaign. Atmos. Res. 2017, 192, 58–71. [Google Scholar] [CrossRef]
- Romano, S.; Lo Feudo, T.; Calidonna, C.R.; Burlizzi, P.; Perrone, M.R. Solar eclipse of 20 March 2015 and impacts on irradiance, meteorological parameters, and aerosol properties over southern Italy. Atmos. Res. 2017, 198, 11–21. [Google Scholar] [CrossRef]
- Lo Feudo, T.; Calidonna, C.R.; Avolio, E.; Sempreviva, A.M. Study of the Vertical Structure of the Coastal Boundary Layer Integrating Surface Measurements and Ground-Based Remote Sensing. Sensors 2020, 20(22), 6516. [Google Scholar] [CrossRef]
- Lo Feudo, T.; Avolio, E.; Gullì, D.; Federico, S.; Calidonna, C.R.; Sempreviva, A. Comparison of Hourly Solar Radiation from a Ground-Based Station, Remote Sensing and Weather Forecast Models at a Coastal Site of South Italy (Lamezia Terme). Energy Procedia 2015, 76, 148–155. [Google Scholar] [CrossRef]
- Cristofanelli, P.; Busetto, M.; Calzolari, F.; Ammoscato, I.; Gullì, D.; Dinoi, A.; Calidonna, C.R.; Contini, D.; Sferlazzo, D.; Di Iorio, T.; Piacentino, S.; Marinoni, A.; Maione, M.; Bonasoni, P. Investigation of reactive gases and methane variability in the coastal boundary layer of the central Mediterranean basin. Elem. Sci. Anth. 2017, 2017 5, 12. [Google Scholar] [CrossRef]
- D’Amico, F.; Ammoscato, I.; Gullì, D.; Avolio, E.; Lo Feudo, T.; De Pino, M.; Cristofanelli, P.; Malacaria, L.; Parise, D.; Sinopoli, S.; De Benedetto, G.; Calidonna, C.R. Trends in CO, CO2, CH4, BC, and NOx during the first 2020 COVID-19 lockdown: source insights from the WMO/GAW station of Lamezia Terme (Calabria, Southern Italy). Sustainability 2024, 16(18), 8229. [Google Scholar] [CrossRef]
- D’Amico, F.; Ammoscato, I.; Gullì, D.; Avolio, E.; Lo Feudo, T.; De Pino, M.; Cristofanelli, P.; Malacaria, L.; Parise, D.; Sinopoli, S.; De Benedetto, G.; Calidonna, C.R. Integrated analysis of methane cycles and trends at the WMO/GAW station of Lamezia Terme (Calabria, Southern Italy). Atmosphere 2024, 15(8), 946. [Google Scholar] [CrossRef]
- D’Amico, F.; Gullì, D.; Lo Feudo, T.; Ammoscato, I.; Avolio, E.; De Pino, M.; Cristofanelli, P.; Busetto, M.; Malacaria, L.; Parise, D.; Sinopoli, S.; De Benedetto, G.; Calidonna, C.R. Cyclic and multi-year characterization of surface ozone at the WMO/GAW coastal station of Lamezia Terme (Calabria, Southern Italy): implications for local environment, cultural heritage, and human health. Environments 2024, 11(10), 227. [Google Scholar] [CrossRef]
- Donateo, A.; Lo Feudo, T.; Marinoni, A.; Dinoi, A.; Avolio, E.; Merico, E.; Calidonna, C.R.; Contini, D.; Bonasoni, P. Characterization of In Situ Aerosol Optical Properties at Three Observatories in the Central Mediterranean. Atmosphere 2018, 9(10), 369. [Google Scholar] [CrossRef]
- Donateo, A.; Lo Feudo, T.; Marinoni, A.; Calidonna, C.R.; Contini, D.; Bonasoni, P. Long-term observations of aerosol optical properties at three GAW regional sites in the Central Mediterranean. Atmos. Res. 2020, 241, 104976. [Google Scholar] [CrossRef]
- D’Amico, F.; Ammoscato, I.; Gullì, D.; Avolio, E.; Lo Feudo, T.; De Pino, M.; Cristofanelli, P.; Malacaria, L.; Parise, D.; Sinopoli, S.; De Benedetto, G.; Calidonna, C.R. Anthropic-Induced Variability of Greenhouse Gasses and Aerosols at the WMO/GAW Coastal Site of Lamezia Terme (Calabria, Southern Italy): Towards a New Method to Assess the Weekly Distribution of Gathered Data. Sustainability 2024, 16(18), 8175. [Google Scholar] [CrossRef]
- D’Amico, F.; Calidonna, C.R.; Ammoscato, I.; Gullì, D.; Malacaria, L.; Sinopoli, S.; De Benedetto, G.; Lo Feudo, T. Peplospheric influences on local greenhouse gas and aerosol variability at the Lamezia Terme WMO/GAW regional station in Calabria, Southern Italy: a multiparameter investigation. Under review in MDPI Sustainability.
- Duan, Y.; Wang, C.; Winstead, C.B. Exploration of microwave plasma source cavity ring-down spectroscopy for elemental measurements. Anal. Chem. 2003, 75(9), 2105–2111. [Google Scholar] [CrossRef]
- Chu, P.M.; Hodges, J.T.; Rhoderick, G.C.; Lisak, D.; Travis, J.C. Methane-in-air standards measured using a 1.65 μm frequency-stabilized cavity ring-down spectrometer. Proc. SPIE 6378, Chemical and Biological Sensors for Industrial and Environmental Monitoring II, 3780. [Google Scholar] [CrossRef]
- Veefkind, J.P.; Aben, I.; McMullan, K.; Förster, H.; de Vries, J.; Otter, G.; Claas, J.; Eskes, H.J.; de Haan, J.F.; Kleipool, Q.; van Weele, M.; Hasekamp, O.; Hoogeveen, R.; Landgraf, J.; Snel, R.; Tol, P.; Ingmann, P.; Voors, R.; Kruizinga, B.; Vink, R.; Visser, H.; Levelt, P.F. TROPOMI on the ESA Sentinel-5 Precursor: A GMES mission for global observations of the atmospheric composition for climate, air quality and ozone layer applications. Remote Sens. Environ. 2012, 120, 70–83. [Google Scholar] [CrossRef]
- Copernicus. Sentinel data—Sentinel-5P. https://dataspace.copernicus.eu/explore-data/data-collections/sentinel-data/sentinel-5p. (accessed on 25 October 2024).
- De Smedt, I.; Eichmann, K.U.; Lambert, J.C.; Loyola, D.; Veefkind, J.P. S5P Mission Performance Centre Formaldehyde [L2 HCHO] Readme; Technical Report; BIRA-IASB: Uccle, Belgium, 2019. [Google Scholar]
- Vigouroux, C.; Langerock, B.; Augusto Bauer Aquino, C.; Blumenstock, T.; Cheng, Z.; De Mazière, M.; De Smedt, I.; Grutter, M.; Hannigan, J.W.; Jones, N.; Kivi, R.; Loyola, D.; Lutsch, E.; Mahieu, E.; Makarova, M.; Metzger, J.-M.; Morino, I.; Murata, I.; Nagahama, T.; Notholt, J.; Ortega, I.; Palm, M.; Pinardi, G.; Röhling, A.; Smale, D.; Stremme, W.; Strong, K.; Sussmann, R.; Té, Y.; van Roozendael, M.; Wang, P.; Winkler, H. TROPOMI-Sentinel-5 Precursor formaldehyde validation using an extensive network of ground-based Fourier-transform infrared stations. Atmos. Meas. Tech. 2020, 13, 3751–3767. [Google Scholar] [CrossRef]
- Barrese, E.; Valentini, M.; Scarpelli, M.; Samele, P.; Malacaria, L.; D’Amico, F.; Lo Feudo, T. Assessment of formaldehyde’s impact on indoor environments and human health via the integration of satellite tropospheric total columns and outdoor ground sensors. Sustainability 2024, 16(22), 9669. [Google Scholar] [CrossRef]
- Petzold, A.; Kramer, H.; Schönlinner, M. Continuous Measurement of Atmospheric Black Carbon Using a Multi-angle Absorption Photometer. Environ. Sci. Pollut. Res. 2002, 4, 78–82. [Google Scholar]
- Petzold, A.; Schönlinner, M. Multi-angle absorption photometry—A new method for the measurement of aerosol light absorption and atmospheric black carbon. J. Aerosol Sci. 2004, 35(4), 421–441. [Google Scholar] [CrossRef]
- Petzold, A.; Schloesser, H.; Sheridan, P.J.; Arnott, P.; Ogren, J.A.; Virkkula, A. Evaluation of multiangle absorption photometry for measuring aerosol light absorption. Aerosol Sci. Technol. 2005, 39, 40–51. [Google Scholar] [CrossRef]
- National Aeronautics and Space Administration. Data Products—MODIS Thermal Anomalies/Fire. https://modis.gsfc.nasa.gov/data/dataprod/mod14.php. (accessed on 1 November 2024).
- National Aeronautics and Space Administration. Earth Data—MODIS/Aqua Terra Thermal Anomalies/Fire locations 1km FIRMS NRT (accessed on 1 November 2024). [CrossRef]
- Stein, A.F.; Draxler, R.R; Rolph, G.D.; Stunder, B.J.B.; Cohen, M.D.; Ngan, F. NOAA’s HYSPLIT atmospheric transport and dispersion modeling system. Bull. Amer. Meteor. Soc. 2015, 96, 2059–2077. [Google Scholar] [CrossRef]
- Rolph, G.; Stein, A.; Stunder, B. Real-time Environmental Applications and Display sYstem: READY. Environ. Modell. Softw. 2017, 95, 210–228. [Google Scholar] [CrossRef]
- Fleming, Z.L.; Monks, P.S.; Manning, A.J. Review: Untangling the influence of air-mass history in interpreting observed atmospheric composition. Atmos. Res. [CrossRef]
- Wittrock, F.; Richter, A.; Oetjen, H.; Burrows, J.P.; Kanakidou, M.; Myriokefalitakis, S.; Volkamer, R.; Beirle, S.; Platt, U.; Wagner, T. Simultaneous global observations of glyoxal and formaldehyde from space. Geophys. Res. Lett. 2006, 33(16), L16804. [Google Scholar] [CrossRef]
- Meddour-Sahar, O. Wildfires in Algeria: Problems and challenges. iForest Biogeosci. For. 2015, 8(6), 818–826. [Google Scholar] [CrossRef]
- Curt, T.; Aini, A.; Dupire, S. Fire Activity in Mediterranean Forests (The Algerian Case). Fire 2020, 3(4), 58. [Google Scholar] [CrossRef]
Figure 2.
Hourly averages of surface CO (A) and eBC (B) at LMT, between July and August 2021.
Figure 2.
Hourly averages of surface CO (A) and eBC (B) at LMT, between July and August 2021.
Figure 3.
Daily averaged tropospheric total column densities of CO (green triangle) and HCHO (red circle) (A); surface concentration of CO (B) and eBC (C) at Lamezia Terme station, both differentiated by wind corridor.
Figure 3.
Daily averaged tropospheric total column densities of CO (green triangle) and HCHO (red circle) (A); surface concentration of CO (B) and eBC (C) at Lamezia Terme station, both differentiated by wind corridor.
Figure 4.
Daily cycles of surface CO (A) and eBC (B), differentiated by wind sector.
Figure 4.
Daily cycles of surface CO (A) and eBC (B), differentiated by wind sector.
Figure 6.
FIRMS data on fires affecting the central Mediterranean area between July 8th and July 14th 2021. Light colors indicate fires lasting for 5+ days, thus contributing to prolonged emissions. Italian regions are marked in italics, while other countries are marked in bold. Malta, Spain, and France, as well as several Italian regions, have been omitted to improve visualization.
Figure 7.
CO and HCHO vertical column data referring to the July 10th–12th, which is the first case study assessed in this research (CS1). CO column data on July 12th, and HCHO column data on July 9th and 11th were not available.
Figure 7.
CO and HCHO vertical column data referring to the July 10th–12th, which is the first case study assessed in this research (CS1). CO column data on July 12th, and HCHO column data on July 9th and 11th were not available.
Figure 8.
HYSPLIT backtrajectory computed from LMT’s coordinates, showing well defined paths leading to the Italian region of Sardinia.
Figure 8.
HYSPLIT backtrajectory computed from LMT’s coordinates, showing well defined paths leading to the Italian region of Sardinia.
Figure 9.
FIRMS data on fires affecting the central Mediterranean area between July 28th and August 3rd 2021. Light colors indicate fires lasting for 5+ days, thus contributing to prolonged emissions. Country names are in bold. Malta, Spain, and France have been omitted to improve visualization.
Figure 9.
FIRMS data on fires affecting the central Mediterranean area between July 28th and August 3rd 2021. Light colors indicate fires lasting for 5+ days, thus contributing to prolonged emissions. Country names are in bold. Malta, Spain, and France have been omitted to improve visualization.
Figure 10.
Tropospheric columns of CO and HCHO referred to CS2 (specifically, July 29th-31st), showing a northern African source of the peaks observed at LMT.
Figure 10.
Tropospheric columns of CO and HCHO referred to CS2 (specifically, July 29th-31st), showing a northern African source of the peaks observed at LMT.
Figure 11.
HYSPLIT backtrajectory of CS2, indicating Algeria as a probable source.
Figure 11.
HYSPLIT backtrajectory of CS2, indicating Algeria as a probable source.
Figure 12.
FIRMS map showing areas affected by wildfires between July 31st and August 6th, with lighter colors indicating wildfires lasting for 5+ days. Balkan countries other than Greece, and Cyprus, have been omitted from labeling to improve visualization.
Figure 12.
FIRMS map showing areas affected by wildfires between July 31st and August 6th, with lighter colors indicating wildfires lasting for 5+ days. Balkan countries other than Greece, and Cyprus, have been omitted from labeling to improve visualization.
Figure 13.
Vertical columns of the Case Study 3 (CS3), referring to the period between August 2nd and Aug. 4th. Column density data show surges in emissions from Greece.
Figure 13.
Vertical columns of the Case Study 3 (CS3), referring to the period between August 2nd and Aug. 4th. Column density data show surges in emissions from Greece.
Figure 14.
HYSPLIT computed backtrajectories, set at LMT’s coordinates, for CS3.
Figure 14.
HYSPLIT computed backtrajectories, set at LMT’s coordinates, for CS3.
Table 1.
Coverage rate per instrument/dataset compared to the total number of hours (1488) and days (62) elapsed between July 1st and August 31st, 2021.
Table 1.
Coverage rate per instrument/dataset compared to the total number of hours (1488) and days (62) elapsed between July 1st and August 31st, 2021.
| Type |
G2401 |
MAAP |
WXT520 |
Sat. CO |
Sat. FA |
| Hours |
99.66% |
98.18% |
100% |
- |
- |
| Days |
100% |
100% |
100% |
87.09% |
82.25% |
|
Disclaimer/Publisher’s Note: The statements, opinions and data contained in all publications are solely those of the individual author(s) and contributor(s) and not of MDPI and/or the editor(s). MDPI and/or the editor(s) disclaim responsibility for any injury to people or property resulting from any ideas, methods, instructions or products referred to in the content. |
© 2024 by the authors. Licensee MDPI, Basel, Switzerland. This article is an open access article distributed under the terms and conditions of the Creative Commons Attribution (CC BY) license (http://creativecommons.org/licenses/by/4.0/).
