
Submitted:
11 December 2024
Posted:
12 December 2024
You are already at the latest version
Abstract
Biogas usually contains volatile organic compounds such as terpenes, siloxanes, halogenated hydrocarbons, ketones, alcohols, furans and esters which presence in the biogas is highly dependent on the feedstock. These trace components can affect the integrity of the materials they come into contact with e.g. equipment, pipelines, engines and their presence in the gas may pose health, safety and environmental risks. Understanding the composition of gases is a prerequisite to ensure the correct function of gas infrastructure, appliances and vehicles. This study examined how volatile organic compound (VOC) content in biogas varies depending on the feedstock and evaluate the efficiency of different upgrading processes in removing VOCs. The data, primarily collected in Sweden, includes biogases produced in digesters and landfills. The selection of VOCs included in the study was based on extensive analysis of samples collected from numerous biogas- and biomethane industrial facilities over an extended period, providing a comprehensive overview of VOC composition. The data has multiple potential uses, including predicting which VOCs would be found in biomethane for a given feedstock and upgrading technique. Additionally, this data can also be used in the standardization discussions to assess the plausibility of the proposed limit values and the need to regulate additional compounds.
Keywords:
Biogas
; biomethane
; composition
; VOCs
; compositional profile
1. Introduction
Gas supplies more than 20% of the overall energy demand in Europe, with the major share coming from fossil natural gas [1]. For example, in 2021, natural gas accounted for 33.5% of the EU final energy consumption in households [2]. Natural gas is also used as a transport fuel where it contributes to important benefits to consumers such as contributing to the decarbonisation, emitting lower levels of greenhouse gases than other hydrocarbon fuels and releasing virtually no particulate matter nor nitrogen oxides [3]. However, Europe currently produces only 15% of the gas it consumes resulting in a high dependency on external suppliers [4]. As biomethane has similar properties to natural gas, it can replace natural gas in a seamless manner using existing infrastructure and technology [5]. Environmental benefits [6] of biogas technology include a reduction of greenhouse gas (GHG) emissions, enhanced energy security, the possibility to exploite agricultural and zootechnical byproducts and municipal waste, with a lower impact on air quality compared to combustion-based strategies for these biomasses. Moreover, the digestate by-product is a material for agricultural uses and biogas production is easily scalable.
Biomethane is obtained from biogas, which in turn is obtained by methanization of organic waste. There are multiple production pathways for biogas as many different feedstocks can be used to produce biogas, the main categories are crop residues, animal manure, organic fractions of municipal solid waste (including organic food waste) and wastewater sludge [7]. Upgrading biogas into biomethane involves purification through techniques like water scrubbing, amine scrubbing, adsorption (PSA), and membrane separation. Biogas, primarily composed of methane and carbon dioxide with water saturation, may also contain nitrogen and low levels of carbon monoxide. Inorganic and organic sulphur contained in the feedstock is converted into dissolved sulphides which are transferred to the biogas mainly as hydrogen sulphide [8] but also as organic sulphur-containing compounds. Additionally, biogas usually contains volatile organic compounds (VOCs) [9,10] such as terpenes, siloxanes, halogenated hydrocarbons, ketones, alcohols, furans and esters which presence in the biogas is highly dependent on the feedstock. Due to the large number of VOCs present in the biogas, it is safe to assume that some trace components remain unidentified. Trace components can affect the integrity of the materials they come into contact with e.g. equipment, pipelines, engines and their presence in the gas may pose health, safety and environmental risks. For instance, if biomethane contains siloxanes, in some conditions, microsilica may be formed [11]. This crystalline silica has similar physical and chemical properties as glass and may cause abrasion on engine surfaces and subjecting sensitive engine parts to elevated temperatures due to its thermal insulating properties. Furthermore, it acts as an electrical insulator, hindering spark plug function and resulting in serious damage and the formation of deposits on various engine components including spark plugs, pistons, cylinder heads, and exhaust after treatment systems.
Terpenes in biogas plants have been linked to several issues, including odor problems, indoor air quality issues at workplaces and operational problems. The concentration of terpenes in biomethane may be high enough to affect or mask the odorization of the fuel by compounds such as tetrahydrothiophene despite the odor threshold of terpenes being 1,000 times lower than those of tetrahydrothiophene [12]. At high concentrations, terpenes may condense in natural gas pipelines and influence the integrity of the plastic pipelines and gas grid components [12] . Swedish plants have suspected these substances to be partly responsible for the dissolution of electrical cables and other rubber / plastic parts in valves and pumps, leading to operational difficulties and consequently the need for more frequent component replacement [13]. Therefore, depending on the application, several specifications related to biogas and biomethane have been adopted. Specifications for biomethane intended for injection into natural gas grids (EN 16723-1 [14]) and for use as vehicle fuel (16723-2 [15]) set requirements with respect to numerous parameters, including the contents of impurities such as siloxanes and sulphur as well as physical properties such as its calorific value and density.
Through different research projects co-financed by the Swedish gas industry [9,11,13] and different metrology projects [16,17], valuable data specific for Sweden has been gathered. In these projects, biogases from over 70 different plants, produced from a variety of feedstocks, and biomethanes from more than 50 plants, upgraded using various techniques, have been analyzed for VOC content. The analysis, conducted over a decade, utilized a consistent method involving thermal desorption, gas chromatography coupled with a flame ionization detector, and a mass spectrometer. In these projects, the focus has often been on a specific family of trace components such as siloxanes [11] or terpenes [13]. Even if the projects have focused on specific components, the non-selective analytical method used to obtain these data allows the simultaneous detection of many other families of trace components (ketones, alkanes, sulphur components, etc.). Thus, every analysis provides information on 100 to 150 different components, and this valuable data has not yet fully been exploited. All samples were analyzed using the same sampling and analytical methods and are then directly comparable.
The dataset created during these projects can be used to document typical composition ranges of biogas and biomethane as these analytical data are supported with identifying information regarding the feedstock and the method of production (for example mesophilic or thermophilic process for biogas and the feedstocks and upgrading method for biomethane). Such knowledge can be used during the commissioning of a plant to dimension some components such as filters or to select an upgrading technique. This dataset can also be useful for plants in operation to identify drift problems if the composition is found to significantly deviate from the expected ranges.
2. Materials and Methods
The data cover biogas from digesters and landfills. Among the biogas produced in digesters, the majority of plants utilize a mixture of feedstocks where one feedstock is in high proportion and other feedstocks in minor proportions. For mixtures of feedstocks, a given plant in the figures of this study is categorized under their primary (percentual) type. The biogas samples examined in this study consisted of 21% from wastewater treatment plant (WWTP) sludge, 17% from landfill waste, 10% from household food waste, 3% from manure, 9% from industrial waste, and 39% from mixtures of two or more of these feedstocks (Figures 1a and 1b). Additionally, biogas production is classified based on the method used, with 16% of the biogas collected from landfill sites and 84% produced in digesters. Of the latter, 57% was produced under mesophilic conditions, 21% under thermophilic conditions, and the conditions for 5% were unknown (Figure 1c).
For biomethane samples, the technique used to upgrade the biogas is also indicated and upgrading segmentation is shown in Figure 2. Water scrubbers and amine scrubbers are the most common upgrading techniques with 31.8% and 45.5% respectively of the samples in this study. Only a few samples are obtained in plants having membrane-based technologies or pressure swing adsorption (PSA). 32 samples out of 45 have corresponding data for the gas before upgrading which allows to evaluate the effectiveness of the technique to remove VOCs from the biogas.
2.1. Collection of Biogas and Biomethane Samples
The sampling process involved the use of stainless-steel sorbent tubes filled with Tenax TA. Onsite, at each sampling point, an Altef sampling bag was filled. From the bag, a minimum of four replicates were gathered within a short period of time, 30 minutes maximum after filling of the bag (each having a volume ranging from 50 to 200 ml). The tubes were then packed in aluminum foil and in a plastic bag and were sent back to the laboratory for analysis. The time between sampling and analysis never exceeded five days. During that time, the tubes were stored in a freezer at -18°C.
2.2. Selection of VOCs
The selection of volatile organic compounds (VOCs) was based on previous knowledge acquired through thorough analysis of samples collected from numerous biogas- and biomethane- industrial facilities over an extended period of time which provided a comprehensive overview of VOC composition. The feedstock mixtures, digestion conditions (mesophilic or thermophilic), and upgrading processes were known for most sites included in the study. The VOCs identified in the study include 8 siloxanes, 10 terpenes, 18 sulphur compounds, 20 hydrocarbons, 4 ketones and alcohols, 5 furans and 6 esters. Halogenated VOCs containing chlorine or fluorine and acids were not included in this study. Amines were not found in any of the samples.
2.3. Analytical Method
The analytical method has already been described elsewhere [18,19] and the applicability of the sampling method (sampling in a gas bag before immediate sampling onto tubes) has been demonstrated by performing stability studies using reference materials containing several relevant compounds such as BTEX, siloxanes and sulphur compounds [18] and on real samples [19]. The method is also described in the ISO 2620:24 standard [20].
The samples were analyzed using an Agilent 6890N gas chromatograph with two detectors, a flame ionization detector and a mass spectrometer 5975C inert MSD. The instrument was operated in an electron impact mode with standard conditions (ionizing electron energy of 70 eV and mass scan from 29 to 300 amu). A BPX5 column in 5% Phenyl (equiv) Polysilphenylene-siloxane with dimension 60m x 32 mm ID x 1 μm was employed.
To release the adsorbed substances, the sorbent tubes underwent a two-stage thermal desorption process. A Markes TD100 desorber was utilized to heat the sorbent tubes to 275 °C for seven minutes, releasing the adsorbed substances. These substances were then transferred to a cold trap containing graphitized carbon where they were focused at a temperature of -10 °C. The trap was then rapidly heated to 300 °C, releasing the volatile organic compounds (VOCs) to be separated on the gas chromatography (GC) column. The column effluent was then divided into two streams for detection of the individual components. One stream passed through a flame ionization detector, while the other stream was directed towards a mass spectrometer.
3. Results
3.1. Biogas
In a first set of experiments, the total VOC concentration (TVOC) in biogas was studied depending on the feedstock used as shown in Figure 3. The samples with the highest concentration of VOCs are clearly the one produced from the digestion of food wastes (>500 mg/m3). Total VOC concentration for samples from the digestion of manure and crops have all less than 50 mg/m3. Total VOC concentration in samples from landfill or wastewater treatment plants (mesophilic) is in the range of 50-200 mg/m3 with some exceptions, for example one plant of WWTP thermophilic digestion with higher TVOC concentration utilizes High Solid Anaeobic Digestion (HSAD) [21] which is a solid-state operational system with low water content, known as a semi-dry or dry anaerobic digestion process [21]. Total VOC concentration in samples from wastewater treatment plants (thermophilic) is in the range of 250-900 mg with large variations from case to case.
As mentioned in the introduction, not all VOCs can be individually identified. Even if the analytical method has been optimized to avoid coelution of the target compounds, biogases are often complex mixtures comprising many VOCs that are unresolvable in gas chromatography. Moreover, some compounds cannot be identified due to the lack of availability of reference substances.
VOC distribution have the following characteristics:
- -
- Biogases from landfill or wastewater treatment plants (WWTP) contain mostly hydrocarbons, mostly ramified or cyclic alkanes with 6 to 14 carbon atoms. Siloxanes are found in biogases produced from WWTP, mainly decamethyl-cyclopentasiloxane (D5-siloxane), clearly dominant in samples from WWTP and octamethyl-cyclotetrasiloxane (D4-siloxane), often dominant in landfill samples, Figure 4 (In cases where siloxane D5 was found in significant concentrations in biogases produced from another main feedstock e.g., food waste, it was confirmed that these plants also had wastewater treatment plants sludges as feedstock).
- -
- Biogases from household food waste contain majority terpenes. P-cymene and D-limonene are clearly dominant, as they represent together, often more than 90% of the total VOCs (Figure 5). These biogases also contain hydrocarbons with formula C10H18 and C10H20 in significant concentrations. Examples of those are 3,7-dimethyl-1,6-octadiene, 2,6-dimethyl-2,6-octadiene (trans) (both identified using reference standards), 4-methyl-1-(1-methulethyl)-cyclohexene, 2,6-dimethyl-4-octene and 3,7-dimethyl-2-octene (identified using mass spectra reference libraries with a match factor above 98%, no reference standards were available for these substances)
- -
- Biogases produced from manure varies depending on the origin of manure (swine, cattle…) but some of the VOC identified on more than half of the samples are 2-propanethiol, α-pinene, benzene, toluene, 2-butanone and 2-methyl-furan.
- -
- Biogases from industrial wastes (example: digestion of sludge from paper mill or brewery, fish rests), all contain toluene, methyl-furans, dimethylfurans and ethyl-furans.
Any specific VOC or family of VOCs can be found in biogases produced from different feedstocks or being characteristic of one type of feedstocks. To illustrate different cases, Figure 4, Figure 5, Figure 6, Figure 7, Figure 8, Figure 9, Figure 10 and Figure 11 shows examples for D4-siloxane, D5-siloxane, some of organic sulphur compounds, 2-butanone, 2-butanol, methyl-furans, C2-furans, benzene and toluene.
Interestingly, the concentration of D5 in WWTP samples is often comprised between 2500 to 5000 µg/m3 and 500 to 1000 µg/m3 for D4 which can be considered as typical ranges. However, eight exceptions where these concentrations are higher (up to 15000 µg/m3 for D5) were found. It would be interesting to study more in depth the parameter processes in these plants in order to understand why they seem to stand out from the typical ranges. The ratio of D5/D4 is typically between 4 and 7 with some exceptions where this number reaches 12.
The sum of the concentration of organic sulphur containing compounds were plotted against the different feedstocks in Figure 6. These compounds are produced from all types of feedstocks but to a lesser extent in landfill and gas produced from WWTP sludges with some notable exceptions for plants 1, 7 and 9 (thermophilic) and plants 11 and 17 (mesophilic) which cannot be explained without looking more in-depth at other process parameters. Interestingly, sulphur containing compound produced varies from feedstock to feedstock. Both 2-propanethiol and 2-butanethiol (Figure 7) seem to be mostly linked to feedstocks such as “Food wastes thermophilic process” and “manure” while 1-propanethiol (Figure 8) is mostly found in samples produced from food wastes.
The most abundant compound for the oxygen-containing compounds (e.g., ketones, esters, furans and alcohols have been analyzed but not acids in this study) is 2-butanone, which can be found at concentrations up to 400 mg/m3. This compound, as shown in Figure 9, is clearly associated with the feedstock “food wastes” in plants with a thermophilic process. Other ketones often found in biogas samples are 2-pentanone and 3-pentanone. 2-butanol is the alcohol found in highest concentration (methanol and ethanol were not included as VOCs in this study as they are retained quantitatively on the Tenax TA sorbent). Ethyl acetate and 2-butanol (Figure 9) follows the same pattern as 2-butanone, associated with the feedstock “food wastes” in plants with a thermophilic process.
The concentration of methyl-furans and C2-furans (ethyl-furans and dimethyl-furans) is shown in Figure 10. These compounds are characteristic VOCs, and they are widely found in biogases (food waste, WWTP sludges, manure, industrial waste, crops) average concentrations of 2500 µg/m3 for methyl-furans and 1000 µg/m3 for C2-furans. However, much higher concentrations (> 10000 µg/m3) were found in four samples, two samples from food waste with a mesophilic process (no conclusion can be drawn as other plants with the same characteristics have much lower concentrations) and two samples from sludge from paper mill (possibly, these compounds are produced from this specific feedstock, need to be verified with more samples).
The concentrations of benzene and toluene are shown in Figure 11. Benzene is mostly found in samples from landfill and manure. Toluene is widely found in biogases, but in relatively higher concentration in samples from WWTP. High concentrations (> 50000 µg/m3) were found in five samples, two from food waste, two from WWTP sludge and one plant from manure.
3.2. Biomethane
The total VOC and terpenes concentrations in biomethane produced from different feedstocks and with different upgrading techniques can be seen in Figure 12. Most of the biomethanes with relatively high content of VOCs (>200 mg/m3) are obtained from the upgrading of biogas produced from food wastes using an amine scrubber, these VOCs are predominantly terpenes as it can be seen in Figure 12 with the notable exceptions for biomethane 6 – amine scrubber (which also contains toluene, siloxanes and alkanes in significant concentrations), 9 – amine scrubber (which contains also 2-butanone in significant concentration, 6500 mg/m3) and 15 – amine scrubber (which contains thiophene, alkanes, methyl-furans). However, biomethane 6 and 15 are analysed before the dryer, which is known to influence the removal of VOC [9].
Another indicative data is the percentage of VOC remaining in the biomethane after upgrading which is shown in Figure 13.
Figure 13 indicates that biogases upgraded by amine scrubbers still contain a non-negligible proportion of VOCs (10 to 60 % VOC found in the biogas are not removed by the upgrading technique). However, gases 6, 11 and 15 are analysed before the dryer, gas 12 being the equivalent of gas 11 but after the dryer. However, as biomethane samples haven´t always been analysed together with the equivalent biogas, some data are missing on this figure (missing data for plants 2 to 7, 9, 10, 11, 13, 14 for water scrubber, missing data for plants 2, 5 and 14 for amine scrubber, missing data for plants 2 and 3 for membranes).
The data can also give valuable information regarding the effectiveness of upgrading techniques to remove regulated species such as siloxanes (Figure 14) or organic sulphur (Figure 15).
The results of this study indicate (Figure 14) that all upgrading techniques largely remove siloxanes. (Gases 6 – amine scrubber and 15 - amine scrubber are wet gases; the siloxanes would probably be removed after the dryer). A notable exception is gas 14 – amine scrubber which contains 900 μg/m3 of L2 - hexamethyldisiloxane. All other biomethanes contain less than 300 μg/m3 (sum total siloxanes, see figure 13) which will be less than 0.1 mg Si/m3 (the percent of silicon in siloxanes varies from 29.2 % for L2 to 37.8% for D6). Therefore, almost all gases analyzed in this study are compliant with the requirements set in EN16723-2 [15] regarding total volatile silicon.
The results of this study indicate (Figure 15) that only tetrahydrothiophene (which is commonly used as an odorant in Sweden) was found in measurable concentrations in biomethane produced by upgrading with water scrubber while other organic sulphur compounds were found when the biomethane was produced by upgrading with an amine scrubber and in these cases, dimethyl sulphide (and in lesser extent dimethyl disulphide) were often found to be the largest contributor to the sum of organic sulphur in the gas.
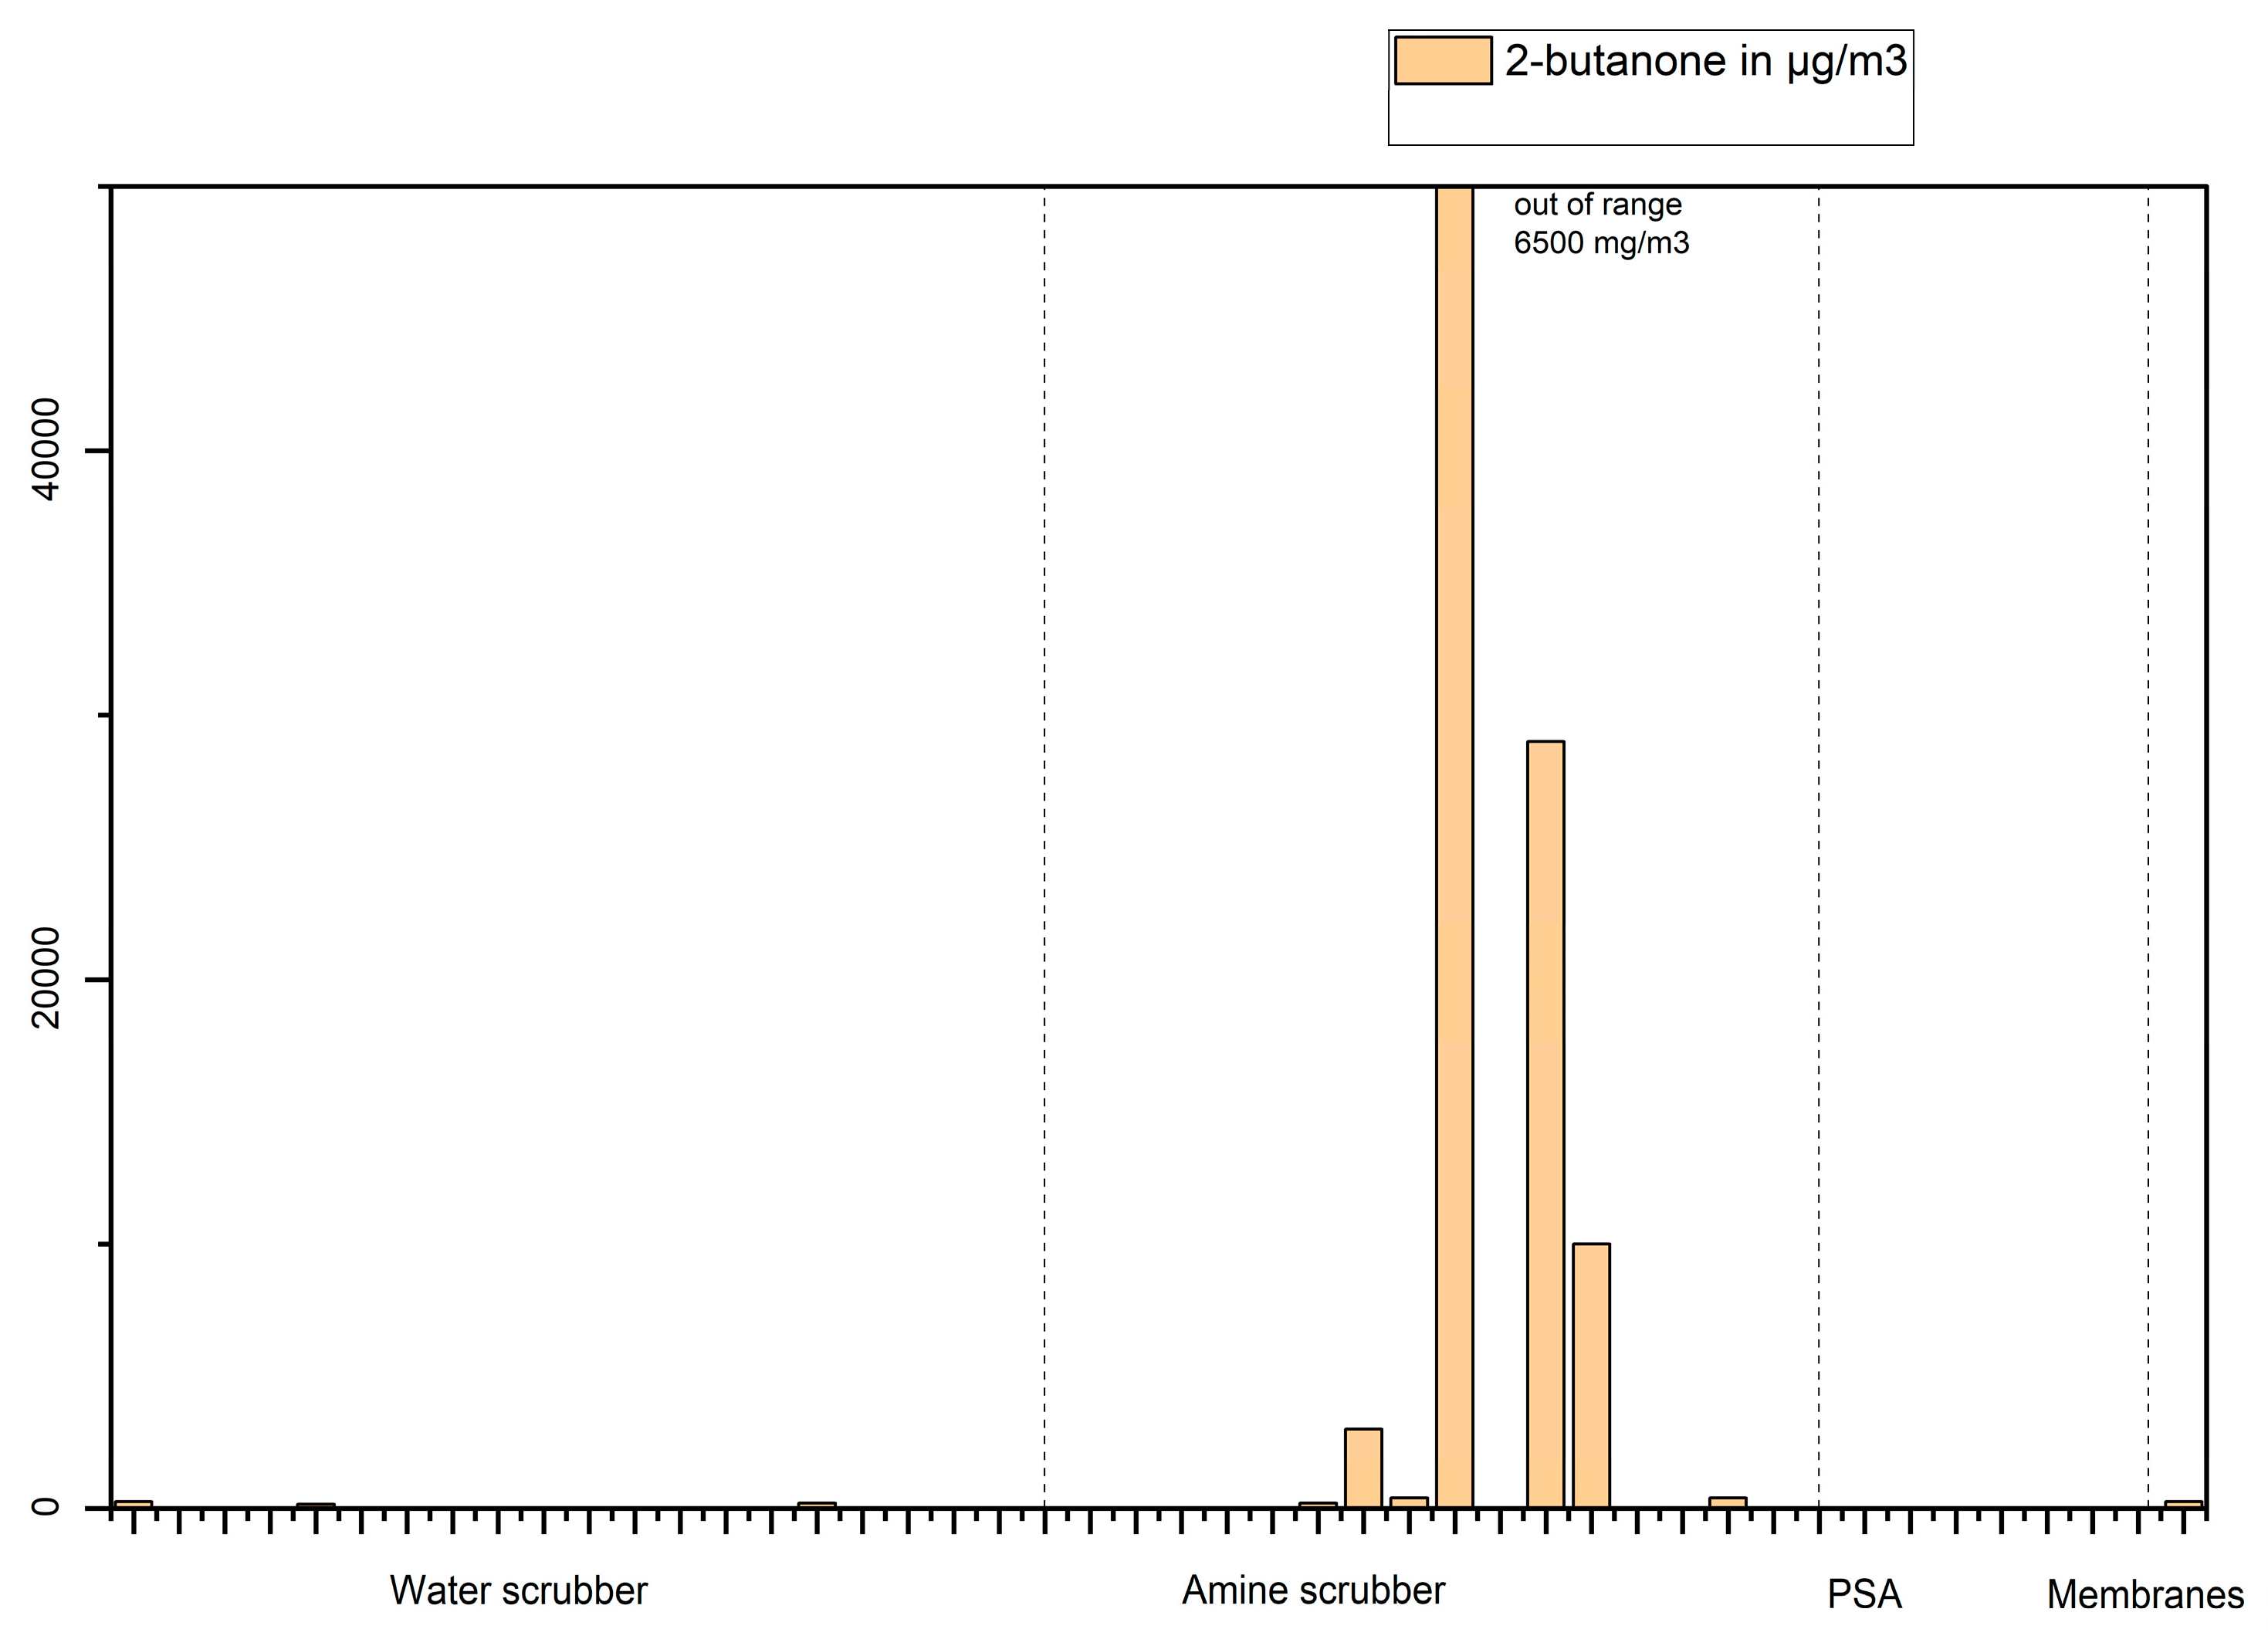
Finally, the data can also give information regarding the effectiveness of upgrading techniques to remove species which are not yet regulated (Figure 12 for terpenes and Figure 16 for 2-butanone). Figure 16 shows that 2-butanone can be in relative high concentration but in only a few samples (one sample with 29 mg/m3, one sample with 10 mg/m3 and one sample with 3 mg/m3, the outliner on this Figure 16 is due to the biomethane composition being determined before the dryer) in biomethane produced for the thermophilic digestion of food wastes when the biogas is upgraded using an amine scrubber (biomethane 15 from amine scrubber is from before the dryer and contains majority thiophene and methyl-thiophenes). All biomethanes after dryer contain less than 30 mg/m3 which will be less than 12 mg S/m3 (the percent of sulphur in these compounds varies from 30 % to 45%) which is well below the maximum limit value of 30 mg S/m3 stated in EN 16723-2:2017. However, some S-containing compounds are not analysed here (hydrogen sulphide, sulphur dioxide, carbonyl sulphide and carbon disulphide are not included in the study as they are not VOCs).
4. Conclusions
The data presented in this study originates from a relatively large number of plants (95 for biogas and 45 for biomethane) and can therefore be used to inform biogas plant operators of composition ranges that can be expected during normal operation based on the feedstock and the temperature in the digester (thermophilic or mesophilic conditions). Some conclusions can be drawn about which VOC can be expected to be found in a biogas depending on the feedstock used. However, it is also clear that other parameters may play a role as exceptions to the main profile of presence are seen for each compound.
This information can be used, for example, during plant commissioning to dimension certain components such as filters. It also helps to understand and investigate potential operational problems, which can be confirmed if measured concentrations of certain VOCs significantly differ from typical values. Additionally, it can predict which VOCs will be present in biomethane for a given feedstock and a given upgrading technique. This data is also a good basis for further standardization needed for the conformity assessment of biomethane to support Europe's transition towards green energy: to evaluate the feasibility of the proposed limit values (the data support the current limit of 0.1 mg Si/m3 and 30 mg S/m3 by demonstrating that is readily achieved in almost all plants studied here) or the need for additional regulation of substances (for example, terpenes and eventually 2-butanone to prevent odor masking issues). However, these data are so far specific for Sweden. There is a high variability in the sources of organic material used in different countries. For example, Sweden collects in a large extent, food wastes from households while Germany produces biogas mainly from crops and manure. Even the definition of feedstocks needs to be compared (food wastes for example). Therefore, it is necessary to add data obtained in other countries to get a better picture of the profile of biogas and biomethane compositions. However, before a proper comparison can be made, data comparability must be established by ensuring that the analytical methods used give similar results if applied to the same sample.
The study confirms that biogas composition is variable, complex and highly dependent on the feedstock used. While some VOCs are linked to a particular feedstock (e.g., siloxanes in WWTP, 2-butanone, 2 butanol in food wastes with thermophilic process, cyclic hydrocarbons in landfill samples), others are found from many different types of feestocks (e.g., BTEX, organic sulphur compounds). In food waste samples, the dominant components are p-cymene and D-limonene, along with other terpenes and components with chemical formulas close to terpenes (dimethyl-octenes for example). In landfill samples, the composition of the waste and the progress of the decomposition process are the two parameters which control the composition of the gas and will most probably differ from country to country. In Sweden, organic waste disposal at landfill sites has been prohibited since 2005, while landfill sites in other countries still accepts such waste. In WWTP samples, hydrocarbons (linear and ramified) and siloxane D5 are predominant.
Author Contributions
Conceptualization, K.A.; methodology, K.A.; formal analysis, K.A; investigation, K.A.; data curation, K.A.; writing—original draft preparation, K.A.; writing—review and editing, S.H. All authors have read and agreed to the published version of the manuscript.
Funding
This research was funded by the EU-funded BIOSTAR2C project, Grant agreement ID: 101112475.
Data Availability Statement
Data are available on request.
Conflicts of Interest
Authors declare no conflicts of interest.
References
- "The Role of Gas in Today's Energy Transitions," International Energy Agency, World Energy Outlook special report, 2019.
- "Energy consumption in households," Eurostat, , [Online]. Available: https://ec.europa.eu/eurostat/statistics-explained/index.php?title=Energy_consumption_in_households. [Accessed 23 02 2024].
- "Gas as a transport fuel," NGVA Europe.
- "Infrastructure and security of supply," European Biogas Association, [Online]. Available: https://www.europeanbiogas.eu/benefits/#decarbonisation. [Accessed 23 02 2024].
- P. Marconi and L. Rosa, "Role of biomethane to offset natural gas," Renewable and Sustainable Energy Reviews, vol. 187, p. 113697, 2023.
- V. Paolini, F. Petracchini , M. Segreto, L. Tomassetti, N. Naja and A. Cecinato, "Environmental impact of biogas: A short review of current knowledge," Journal of Environmental Science and Health, Part A, vol. 53, no. 10, 2018. [CrossRef]
- "Outlook for biogas and biomethane: Prospects for organic growth," International Energy Agency, [Online]. Available: https://www.iea.org/reports/outlook-for-biogas-and-biomethane-prospects-for-organic-growth/an-introduction-to-biogas-and-biomethane. [Accessed 23 02 2024].
- P. Peu, S. Picard, A. Diara, R. Girault, F. Beline and G. Bridoux, "Prediction of hydrogen sulphide production during anaerobic digestion of organic subtrate," Bioressource Technologie, vol. 121, pp. 419-424, 2012.
- K. Arrhenius and U. Johansson, "Characterisation of Contaminants in Biogas before and after Upgrading to Vehicle Gas,," Energiforsk 2012:246, Sweden, 2012.
- S. Rasi, J. Läntelä and J. Rintala, "Trace compounds affecting biogas energy utilisation - a review," Energy Conversion Management, vol. 12, pp. 3369-3375, 2011. [CrossRef]
- K. Arrhenius, B. Magnusson and E. Sahlin, "Impurities in biogas: validation of methodology of analysis for siloxanes," Energiforsk report 2011: 243, Sweden, 2011.
- E. A. Polman, H. Top, B. Gerritsen and A. Rekers, "Development of existing and new measurement technologies for determination of the gas composition,," EDGaR, GT15-0029, The Netherlands, 2015.
- K. Arrhenius, A. Holmqvist, M. Carlsson, J. Engelbrektsson, A. Jansson, L. Rosell, H. Yaghooby and A. Fischer, "Terpenes in biogas plants digesting food wastes," Energiforsk report 2017:350, Sweden, 2017.
- "EN 16723-1:2016 Natural gas and biomethane for use in transport and biomethane for injection in the natural gas network - Part 1: Specifications for biomethane for injection in the natural gas network," European Committee for Standardization (CEN), Brussels, Belgium, 2016.
- "EN 16723-2:2017 Natural gas and biomethane for use in transport and biomethane for injection in the natural gas network - Part 2: Automotive fuels specification," European Committee for Standardization (CEN), Brussels, Belgium, 2017.
- ENG54 Metrology for Biogas, European Metrology Research Programme: EURAMET, 2014-2017.
- 16ENG05 - Metrology for biomethane, European Metorlogy Programme for innovation and research: EURAMET, 2017-2020.
- K. Arrhenius, H. Yaghooby, L. Rosell, O. Büker, L. Culleton, S. Bartlett, A. Murugan, P. Brewer, J. Li, A. M. van der Veen, I. de Krom, F. Lestremau and J. Beranek, "Suitability of vessels and adsorbents for the short-term storage of biogas/biomethane for the determination of impurities e Siloxanes, sulfur compounds, halogenated hydrocarbons, BTEX," Biomass and Bioenergy, vol. 105, pp. 127-135, 2017.
- K. Arrhenius, A. Fischer and O. Büker, "Methods for Sampling Biogas and Biomethane on Adsorbent Tubes after Collection in Gas Bags," Applied Sciences, vol. 9, no. 1171, 2019. [CrossRef]
- "ISO 2620:24 - nalysis of natural gas — Biomethane — Determination of VOCs by thermal desorption gas chromatography with flame ionization and/or mass spectrometry detectors," International Standardization Organization, Switzerland, 2024.
- M. O. Fagbohungbe, I. C. Dodd, B. M. Herbert, H. Li, L. Ricketts and K. T. Semple, "High solid anaerobic digestion: Operational challenges and possibilities," Environment Technology & Innovation, vol. 4, pp. 268-284, 2015. [CrossRef]
Figure 1.
Feedstock used to produce the 95 biogases analysed in this study (A) (21% of the biogases were produced by the digestion of WWTP sludge,17% in landfill sites, 10% from household food wastes, 3% from manure, 9% from industry wastes, and 39% from mixtures of two or more of those feestocks– (B) detail on mixtures of feedstocks – (C) process type (16% of the biogases were collected at landfill sites for 84% of the biogas that were produced in digesters, 57% was produced under mesophilic conditions, 21% under thermophilic conditions, for 5%, the conditions were not known).
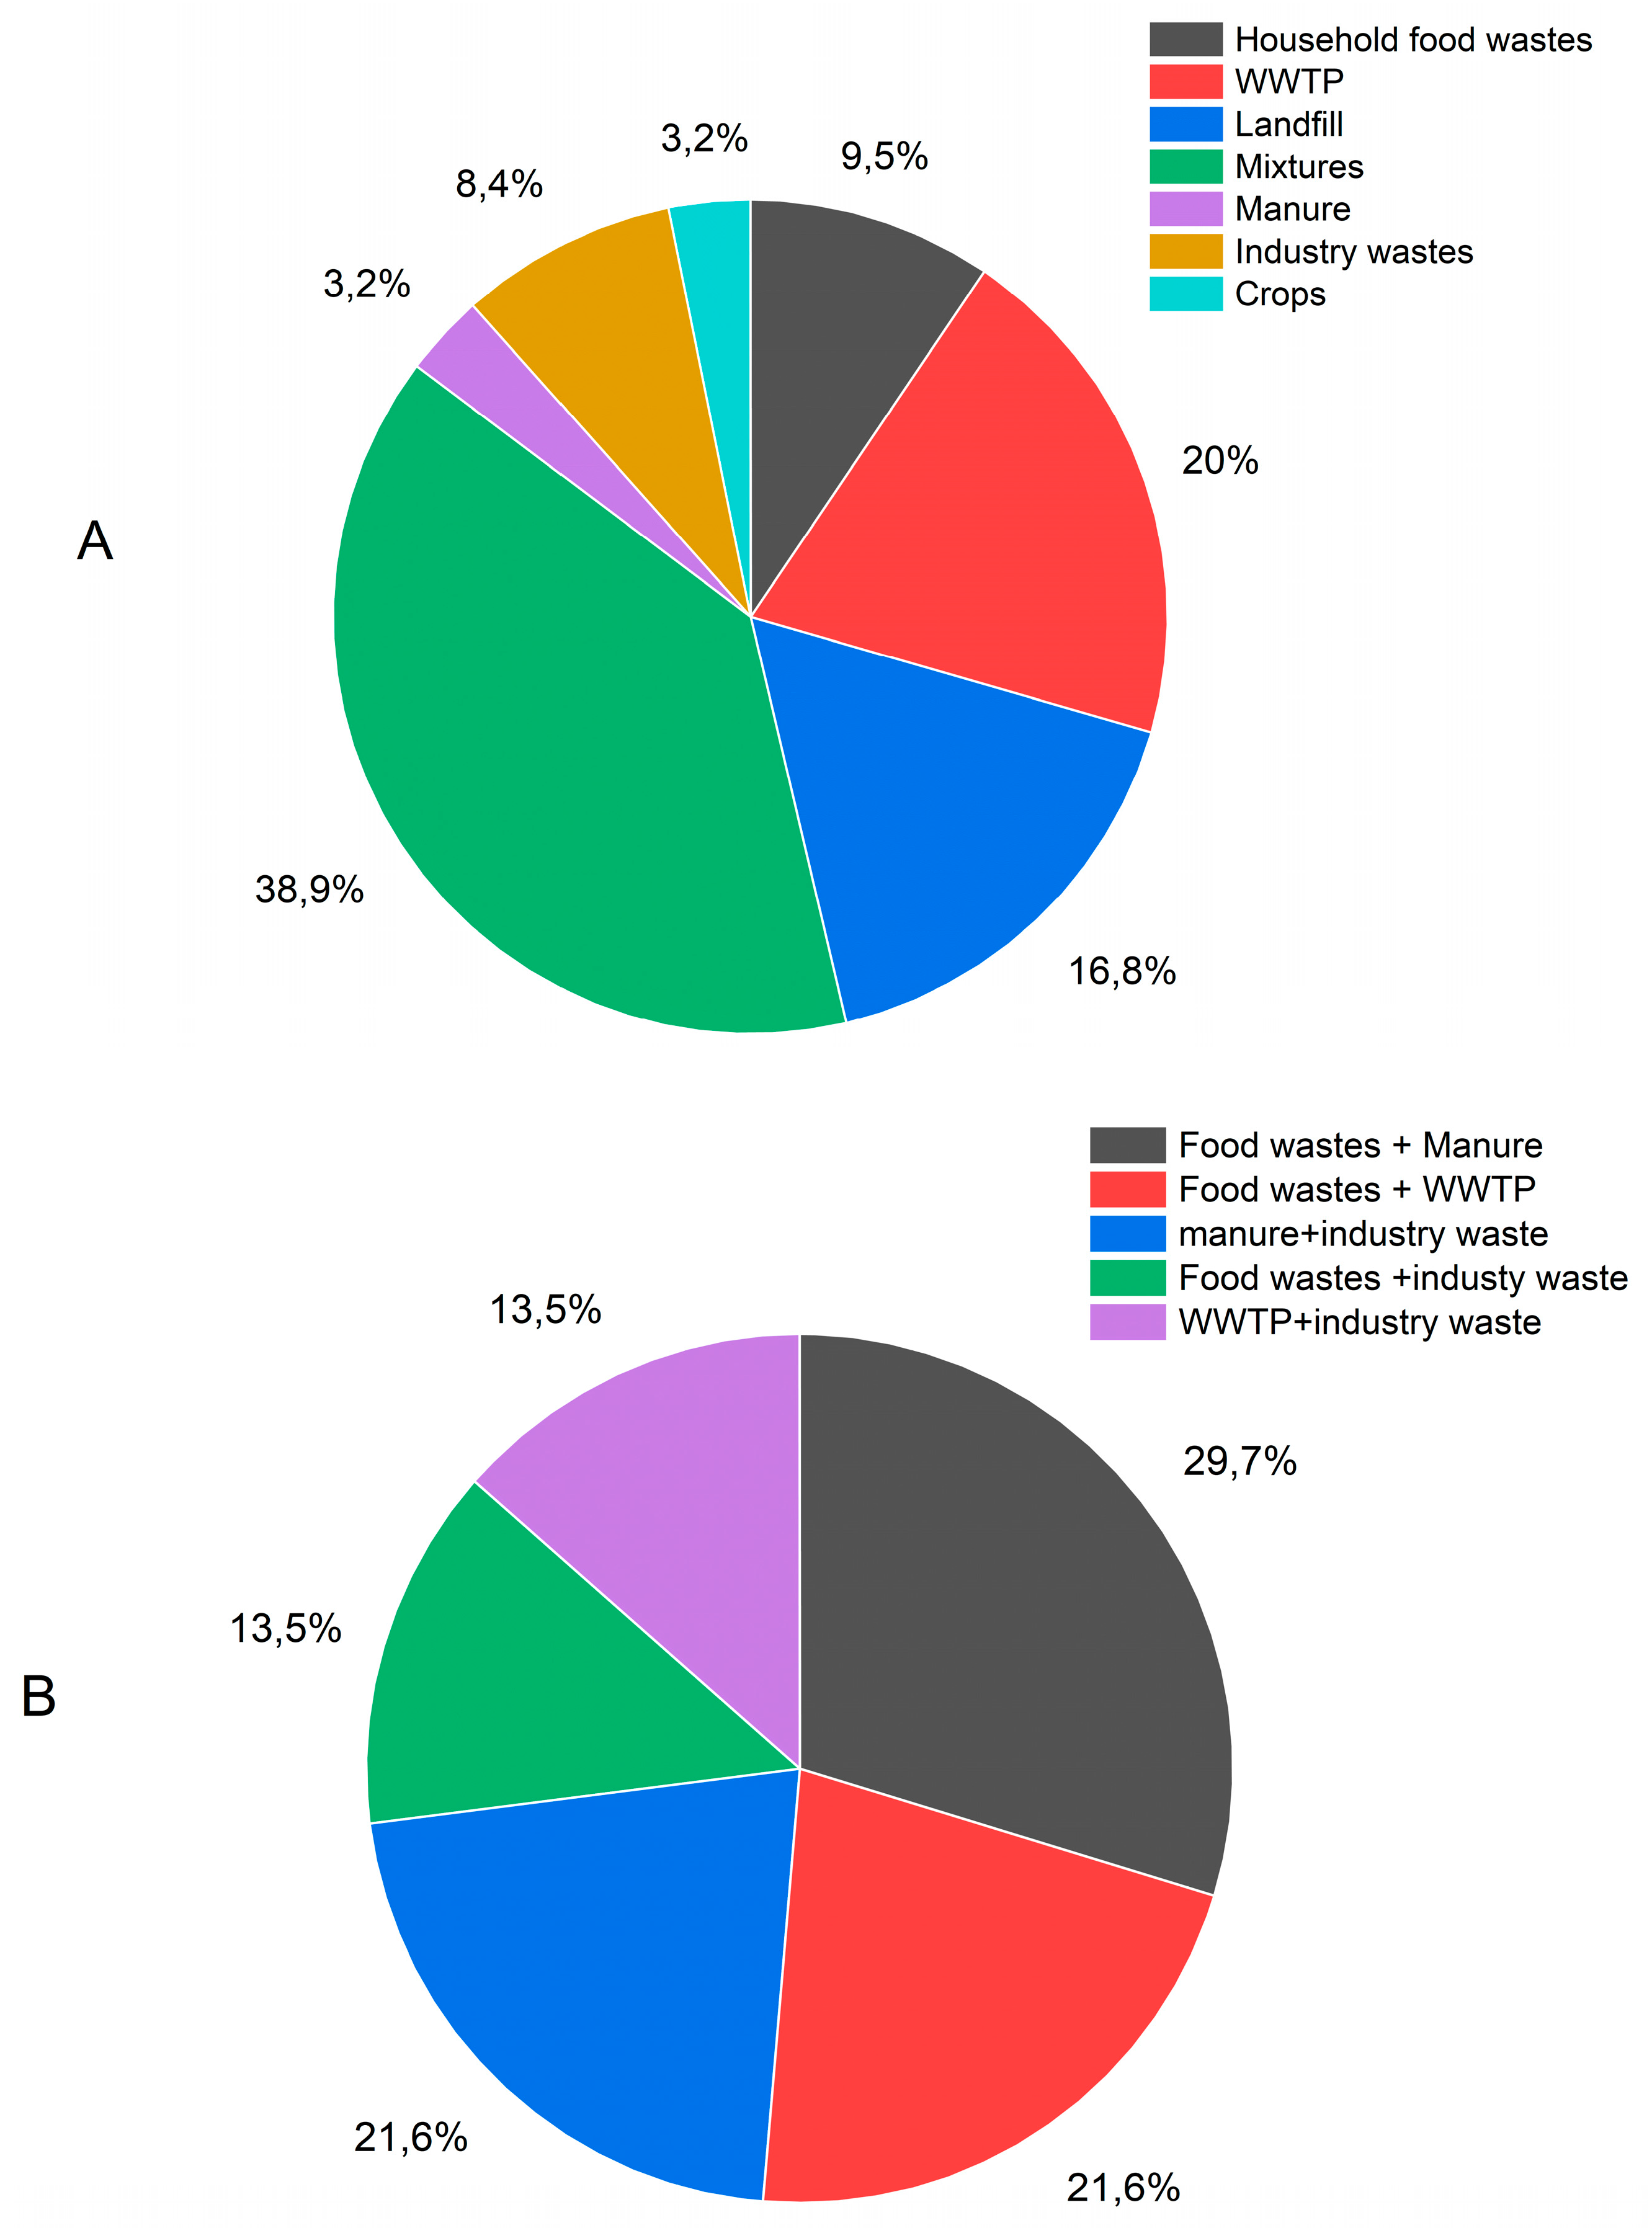
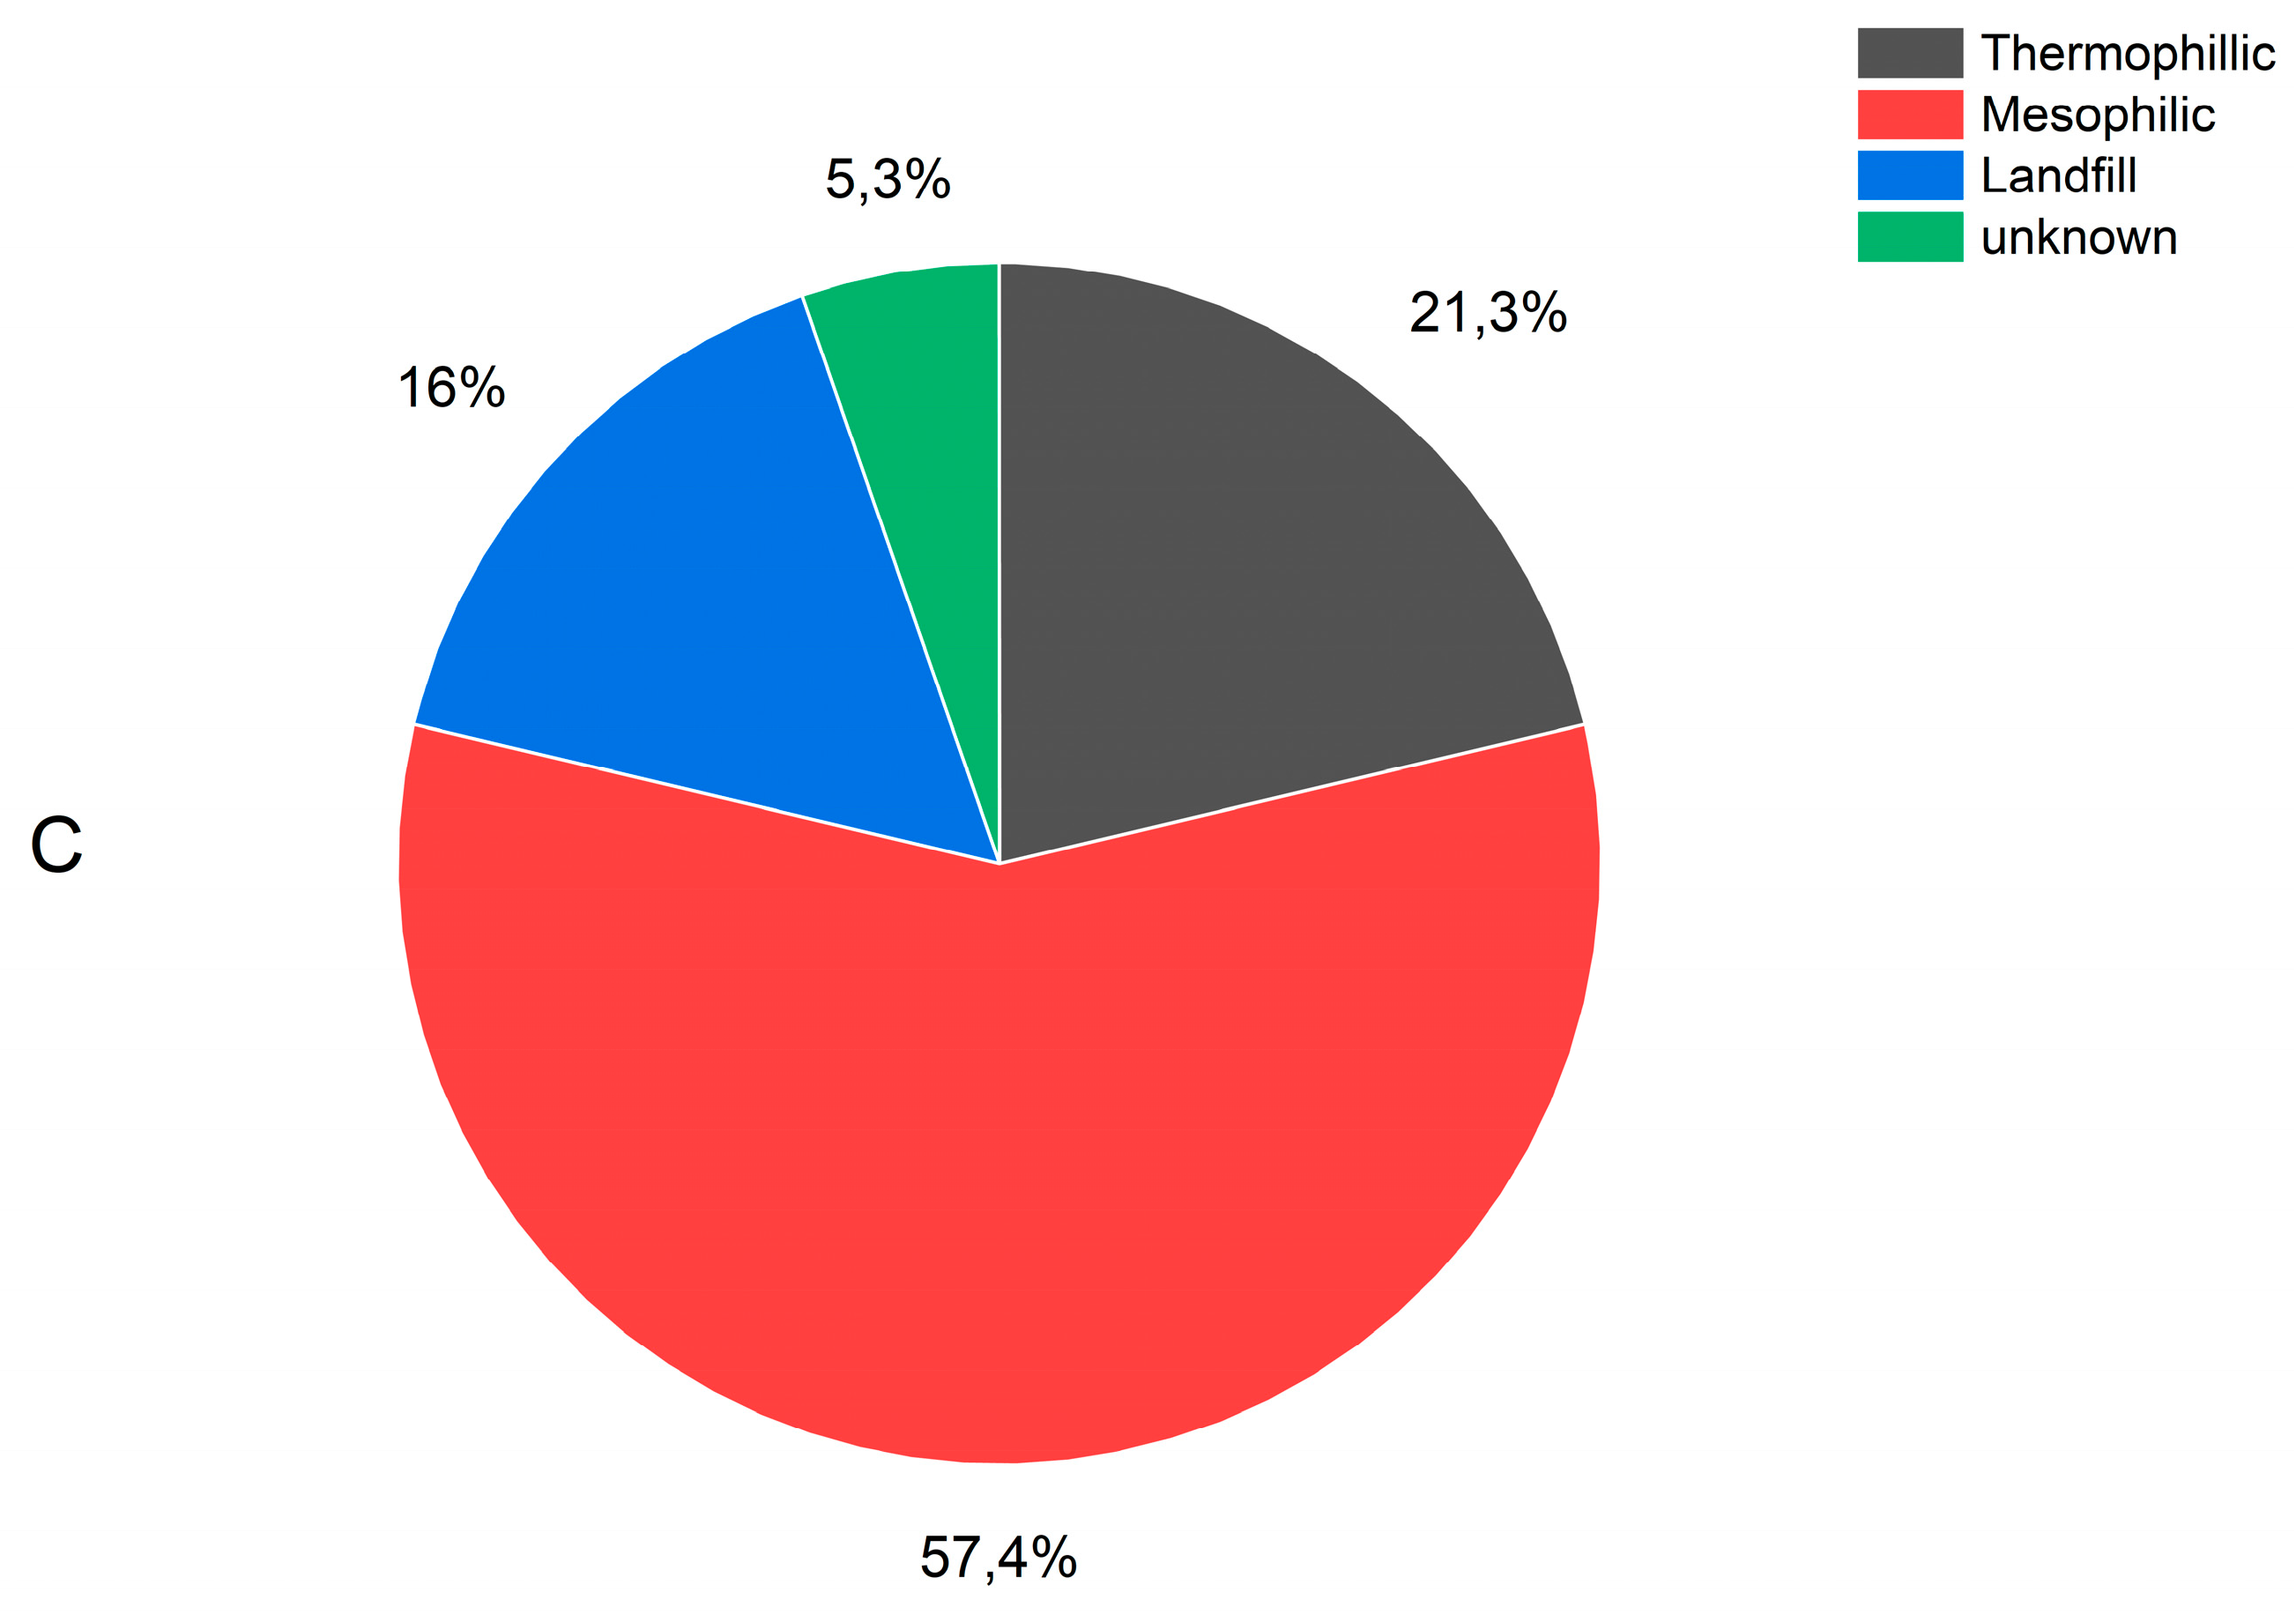
Figure 2.
Biogas upgrading distribution for biomethane data (45% of the biomethane analysed were produced by upgrading of biogas with water scrubber, 32% by upgrading with amine scrubber, 14% by upgrading with pressure swing adsorption technique and 9% by upgrading with membranes).
Figure 2.
Biogas upgrading distribution for biomethane data (45% of the biomethane analysed were produced by upgrading of biogas with water scrubber, 32% by upgrading with amine scrubber, 14% by upgrading with pressure swing adsorption technique and 9% by upgrading with membranes).
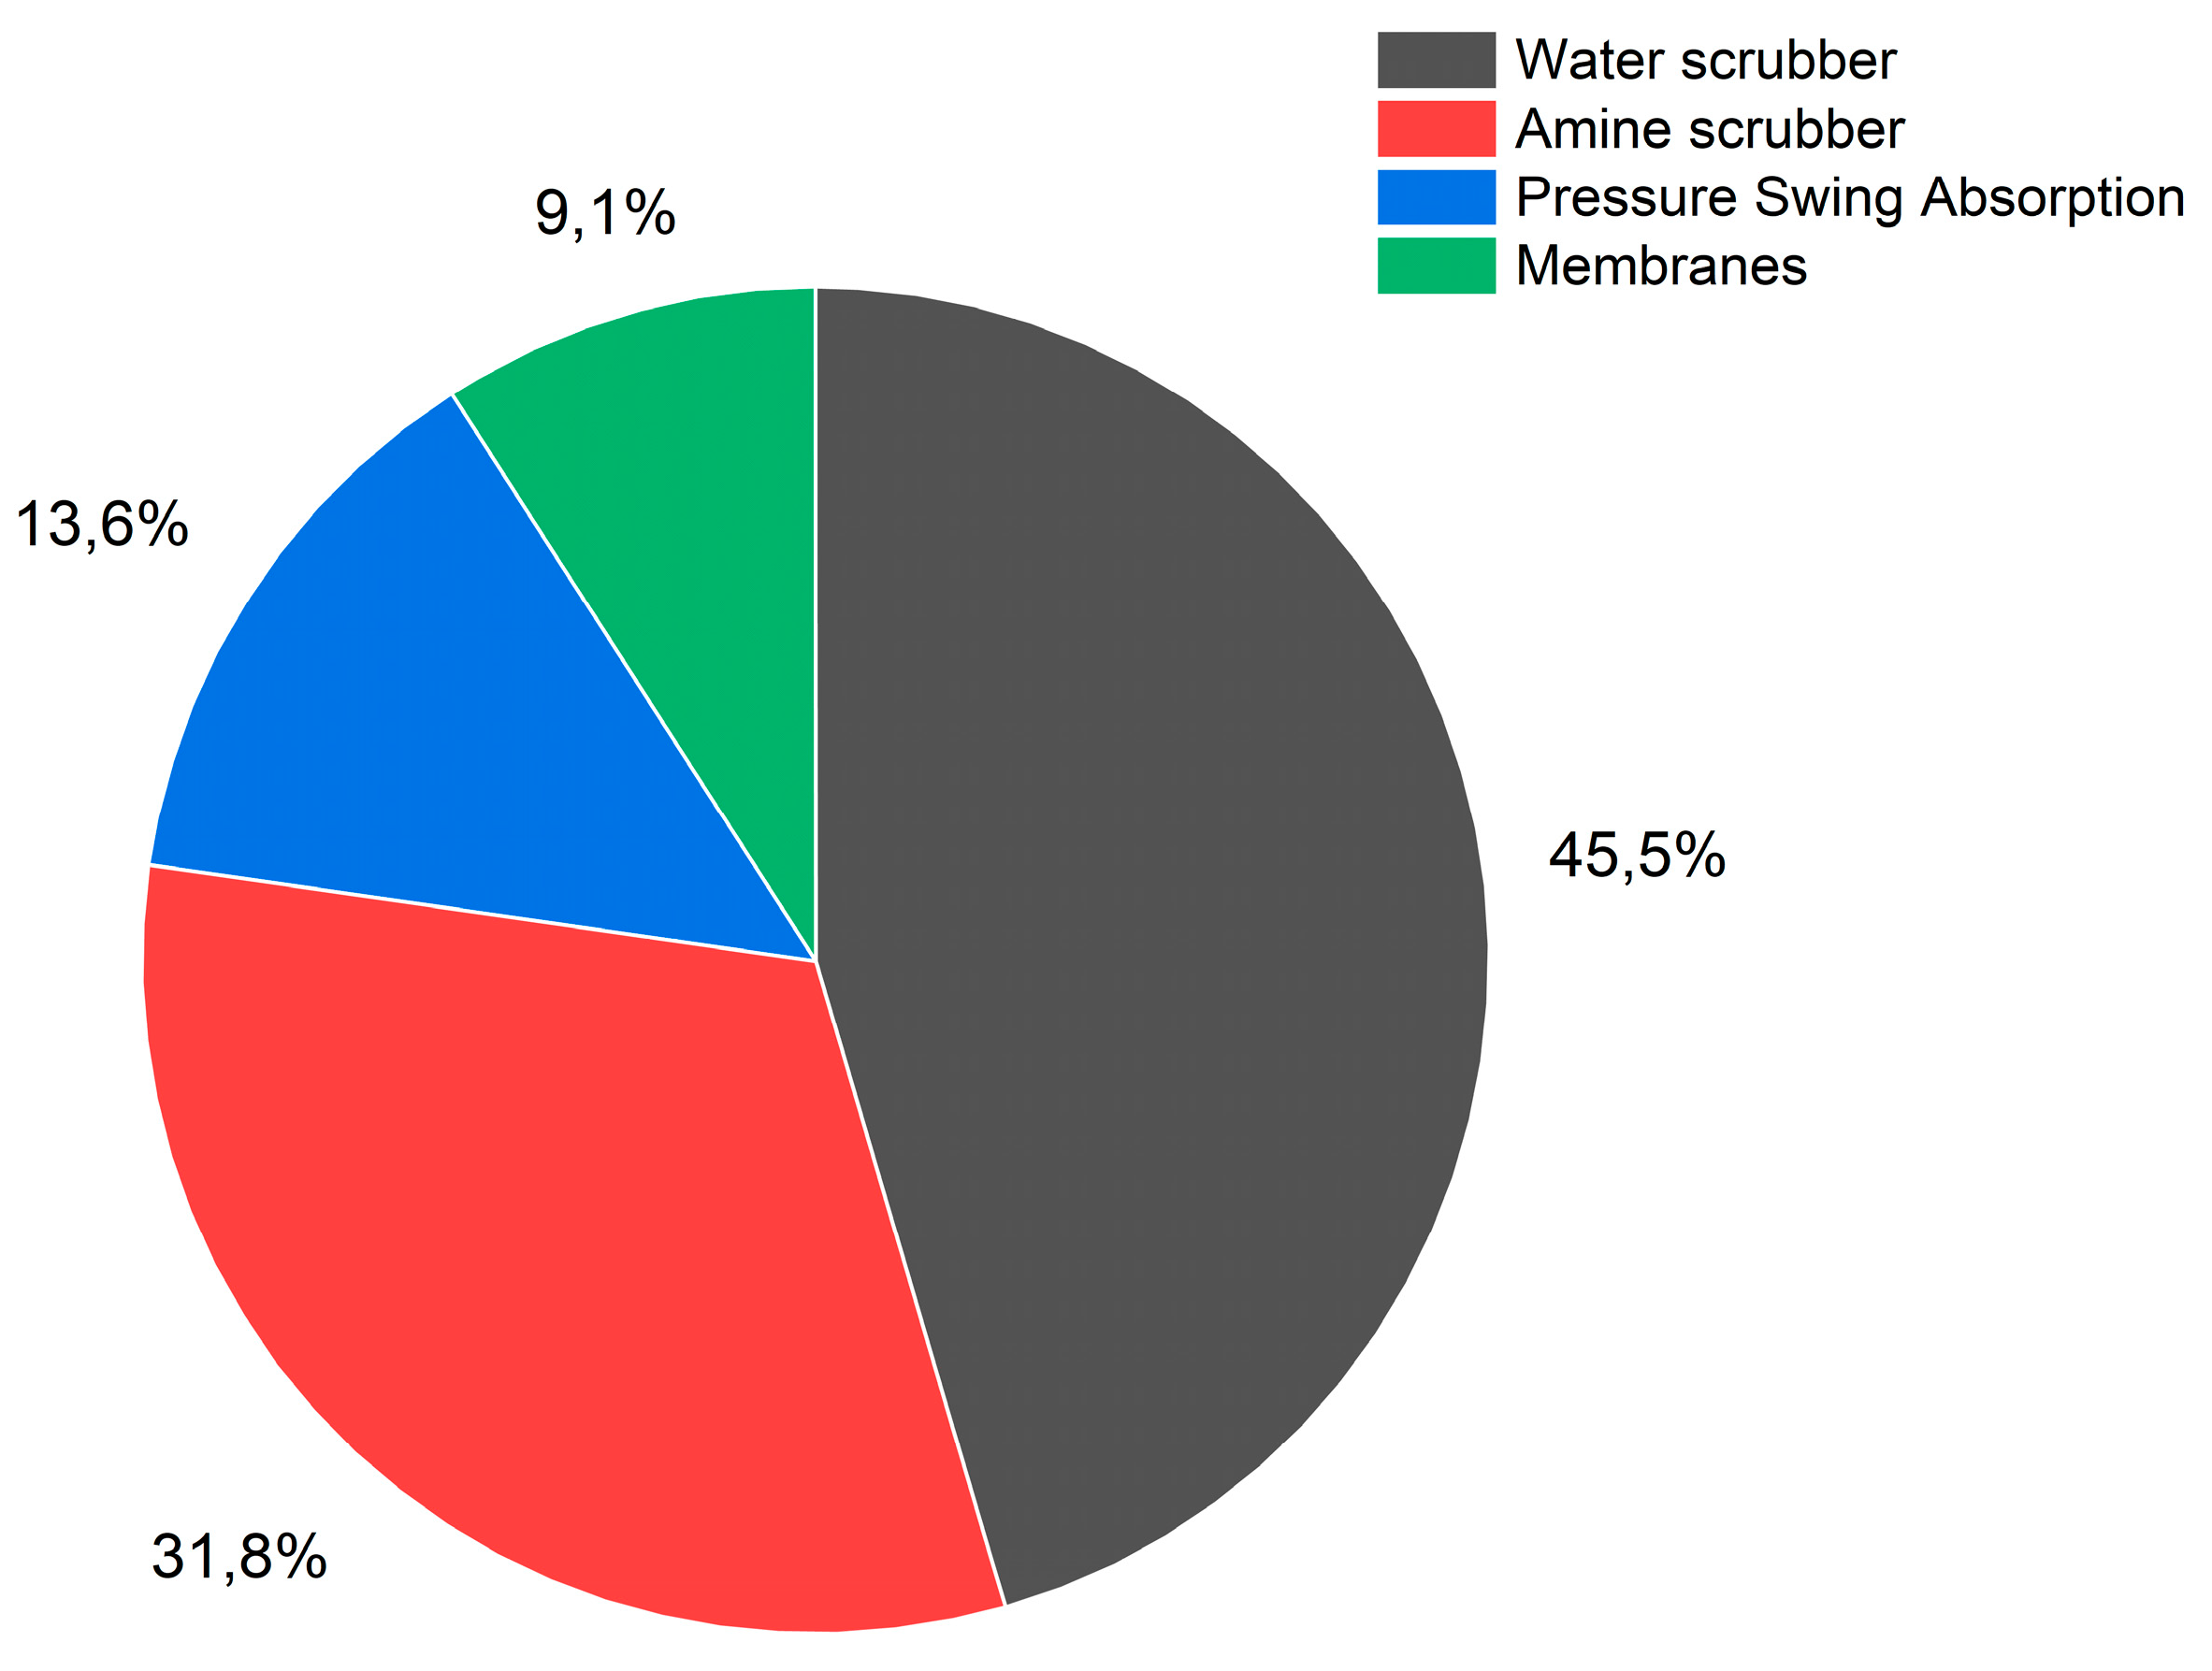
Figure 3.
Total VOCs concentration in biogases depending on the main feedstock used.
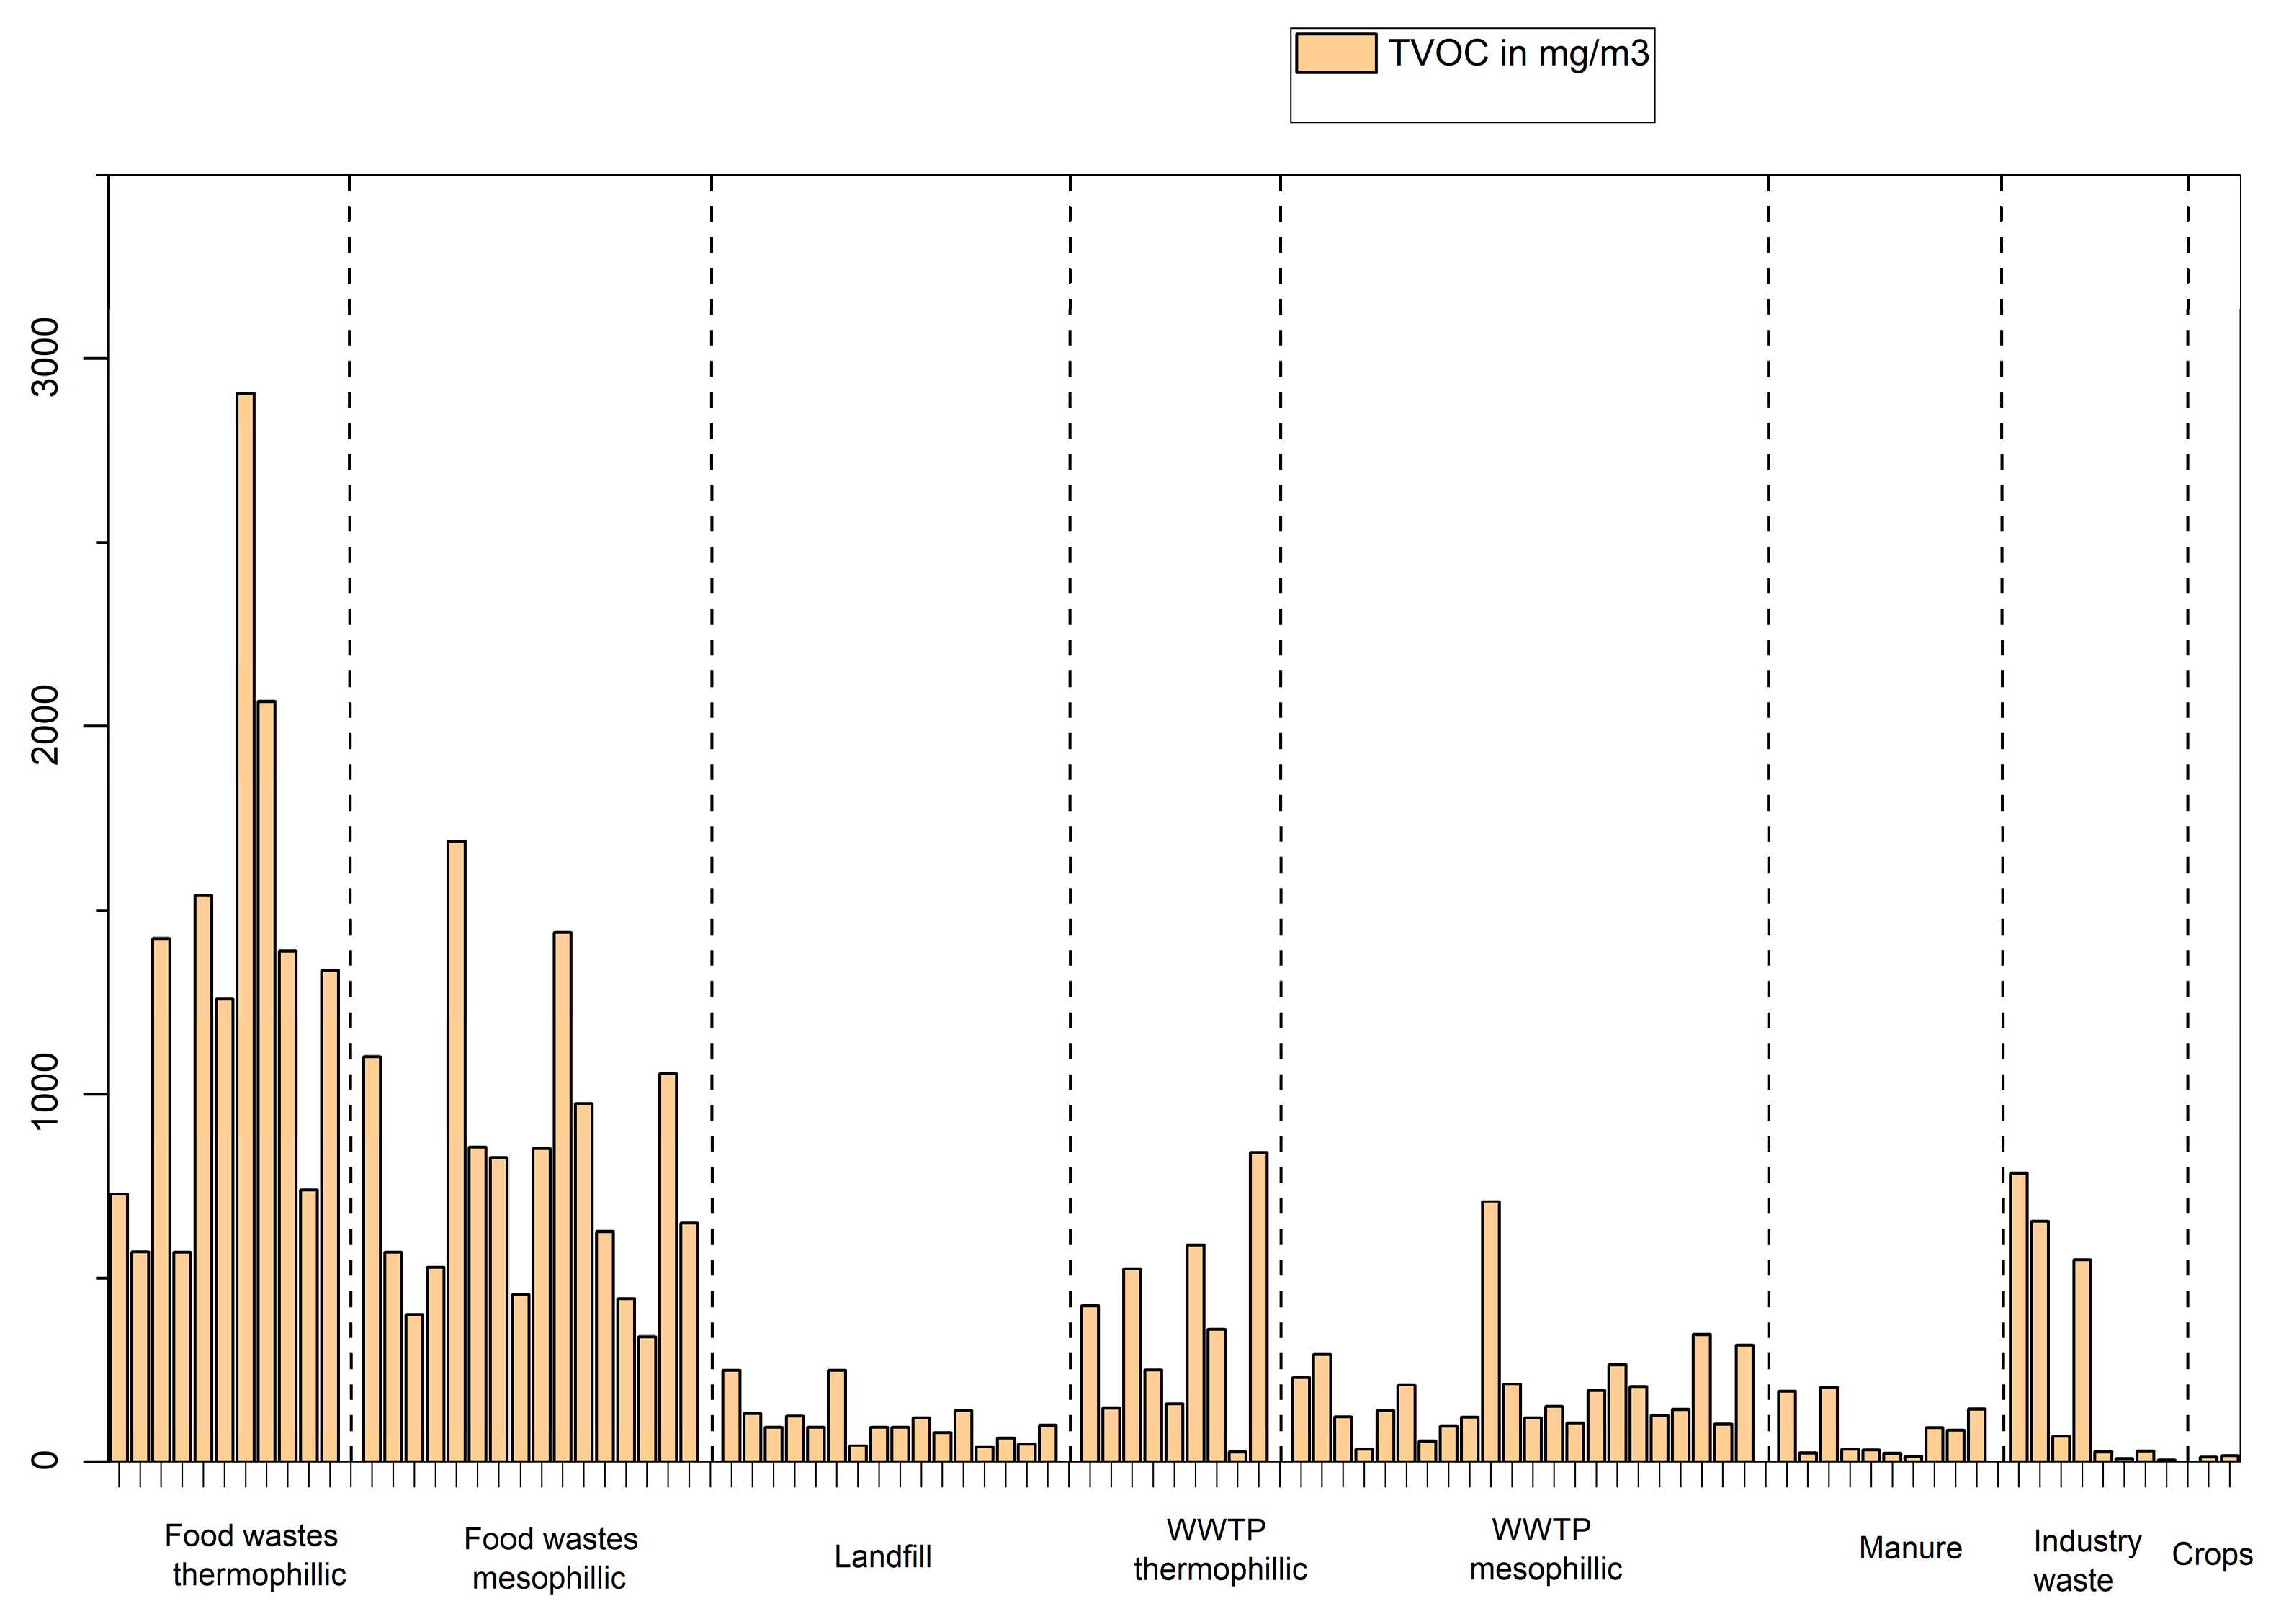
Figure 4.
Concentrations of D4 (orange) and D5 (green) in µg/m3 of biogas produced from different feedstocks.
Figure 4.
Concentrations of D4 (orange) and D5 (green) in µg/m3 of biogas produced from different feedstocks.
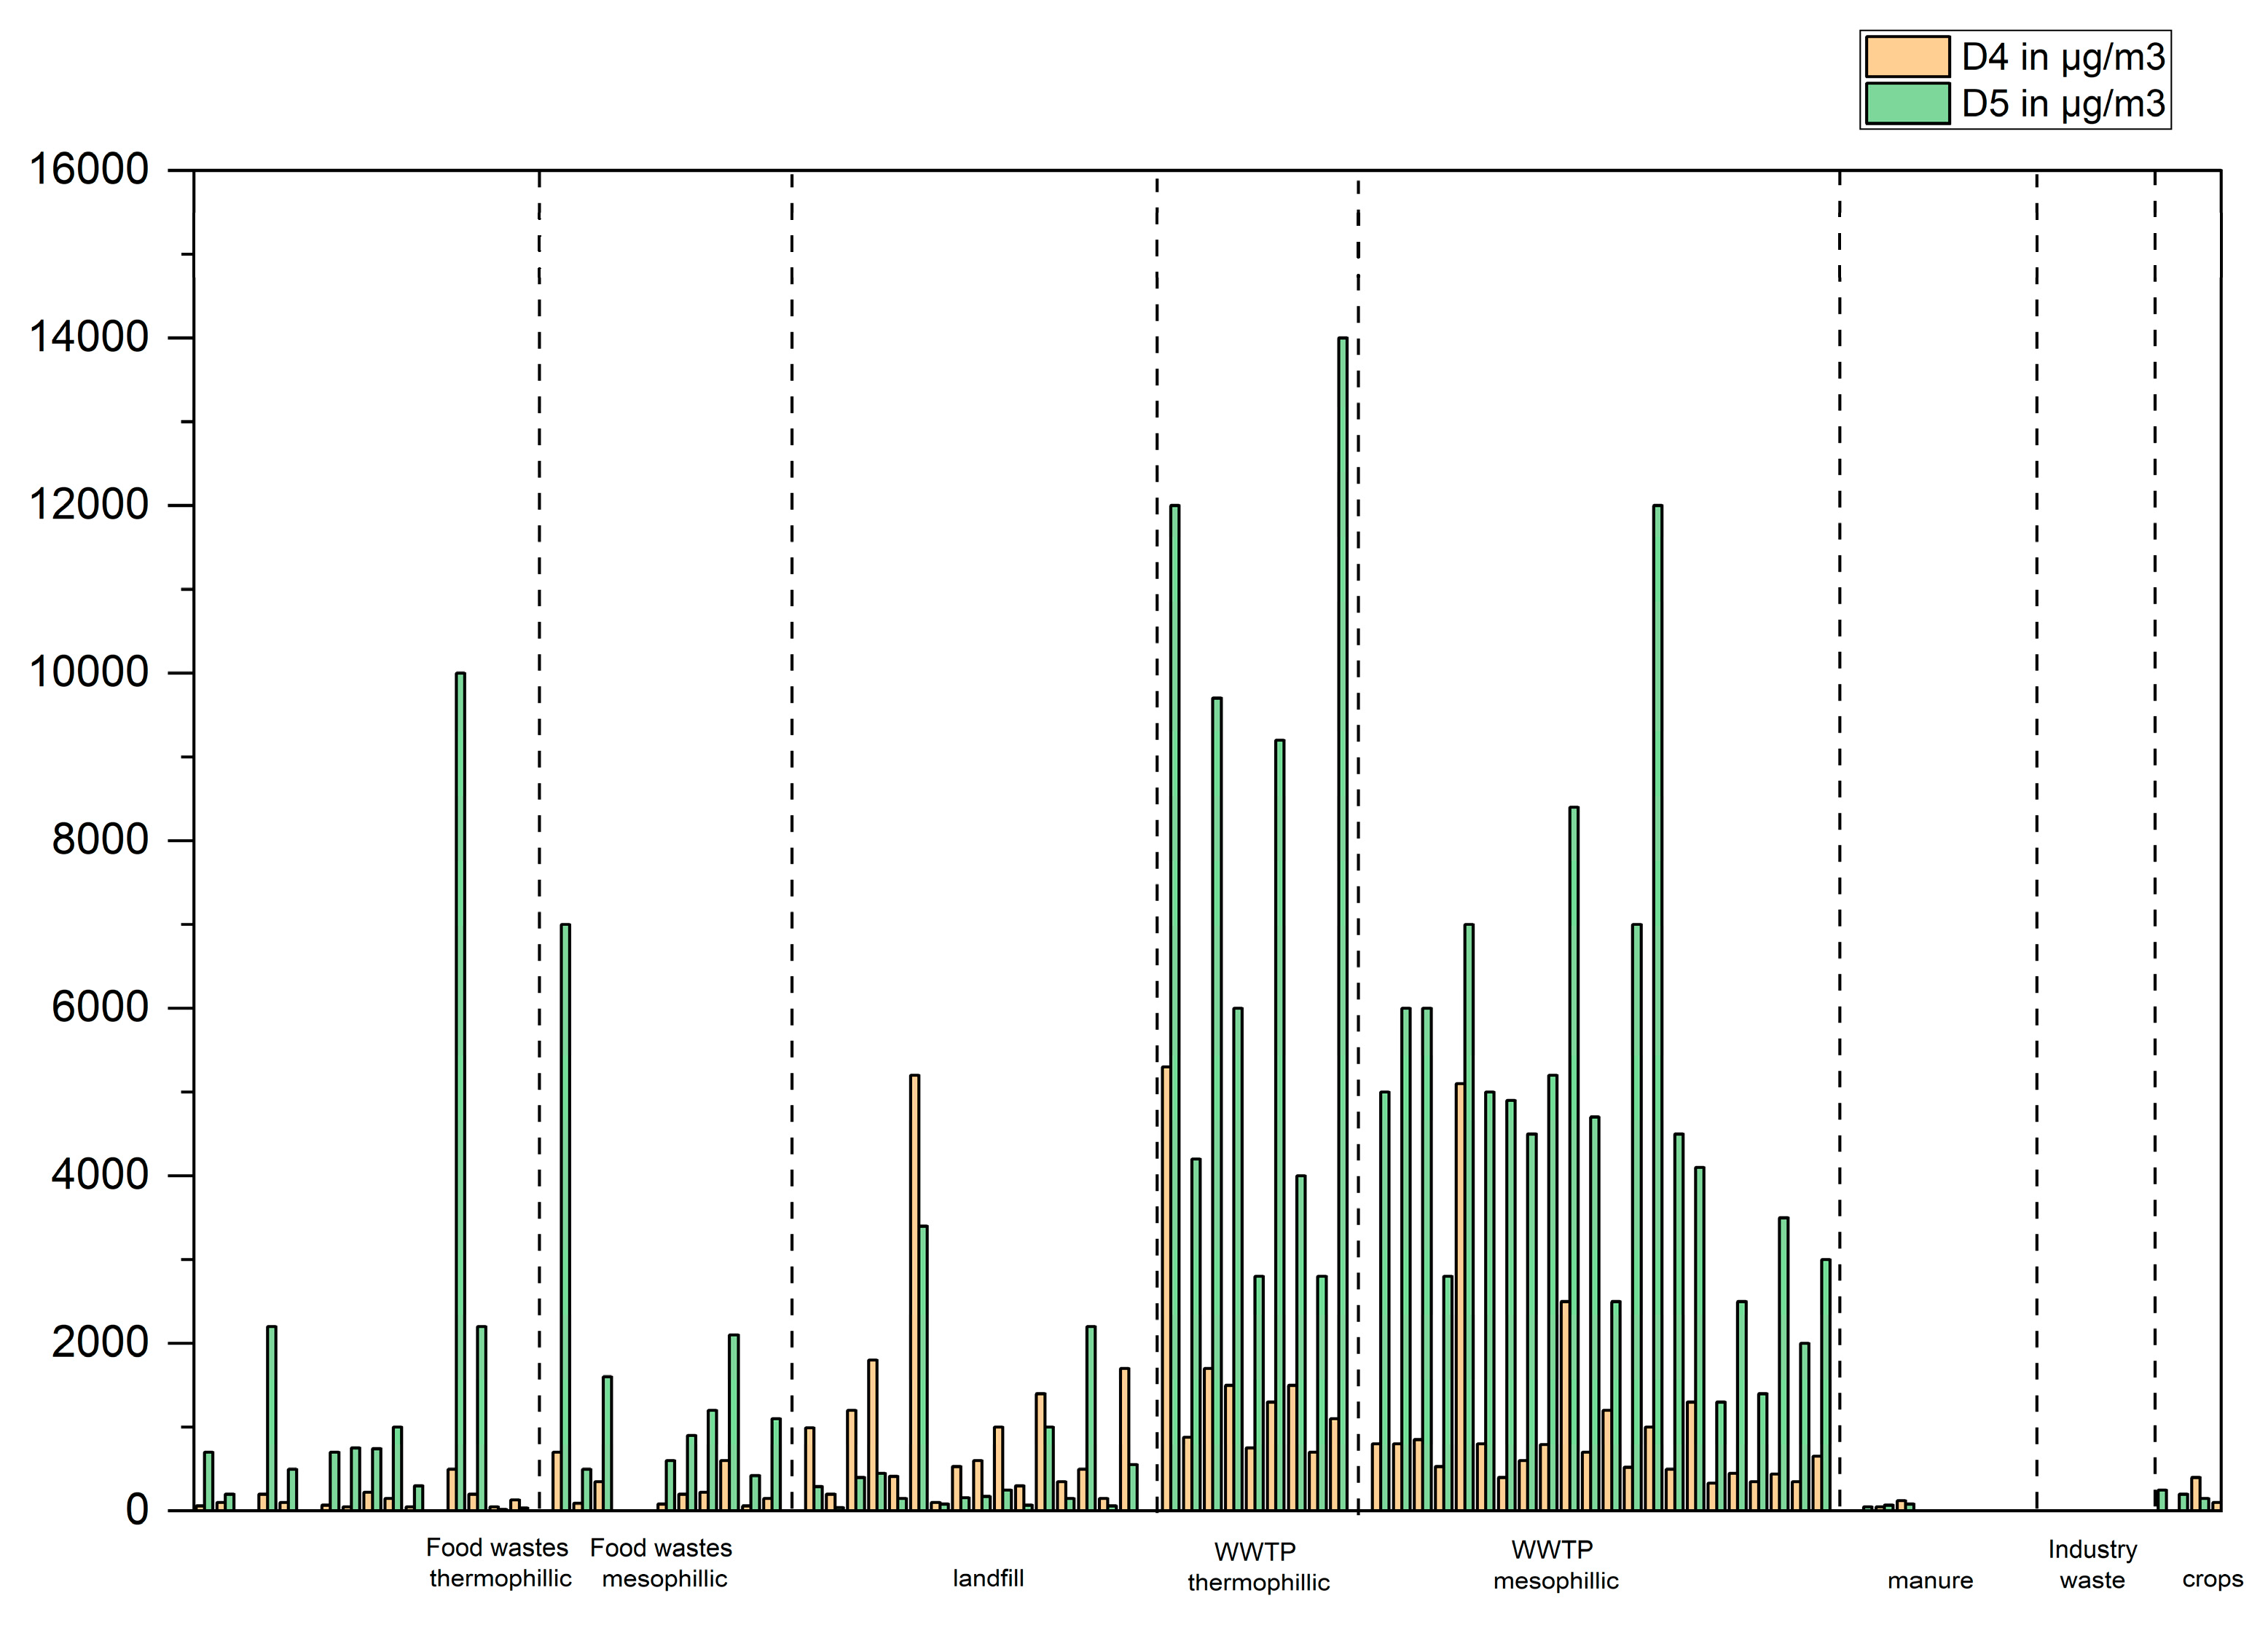
Figure 5.
Sum of p-cymene + D-limonene concentration (orange) and TVOC concentration (green) in biogas produced from different feedstocks.
Figure 5.
Sum of p-cymene + D-limonene concentration (orange) and TVOC concentration (green) in biogas produced from different feedstocks.
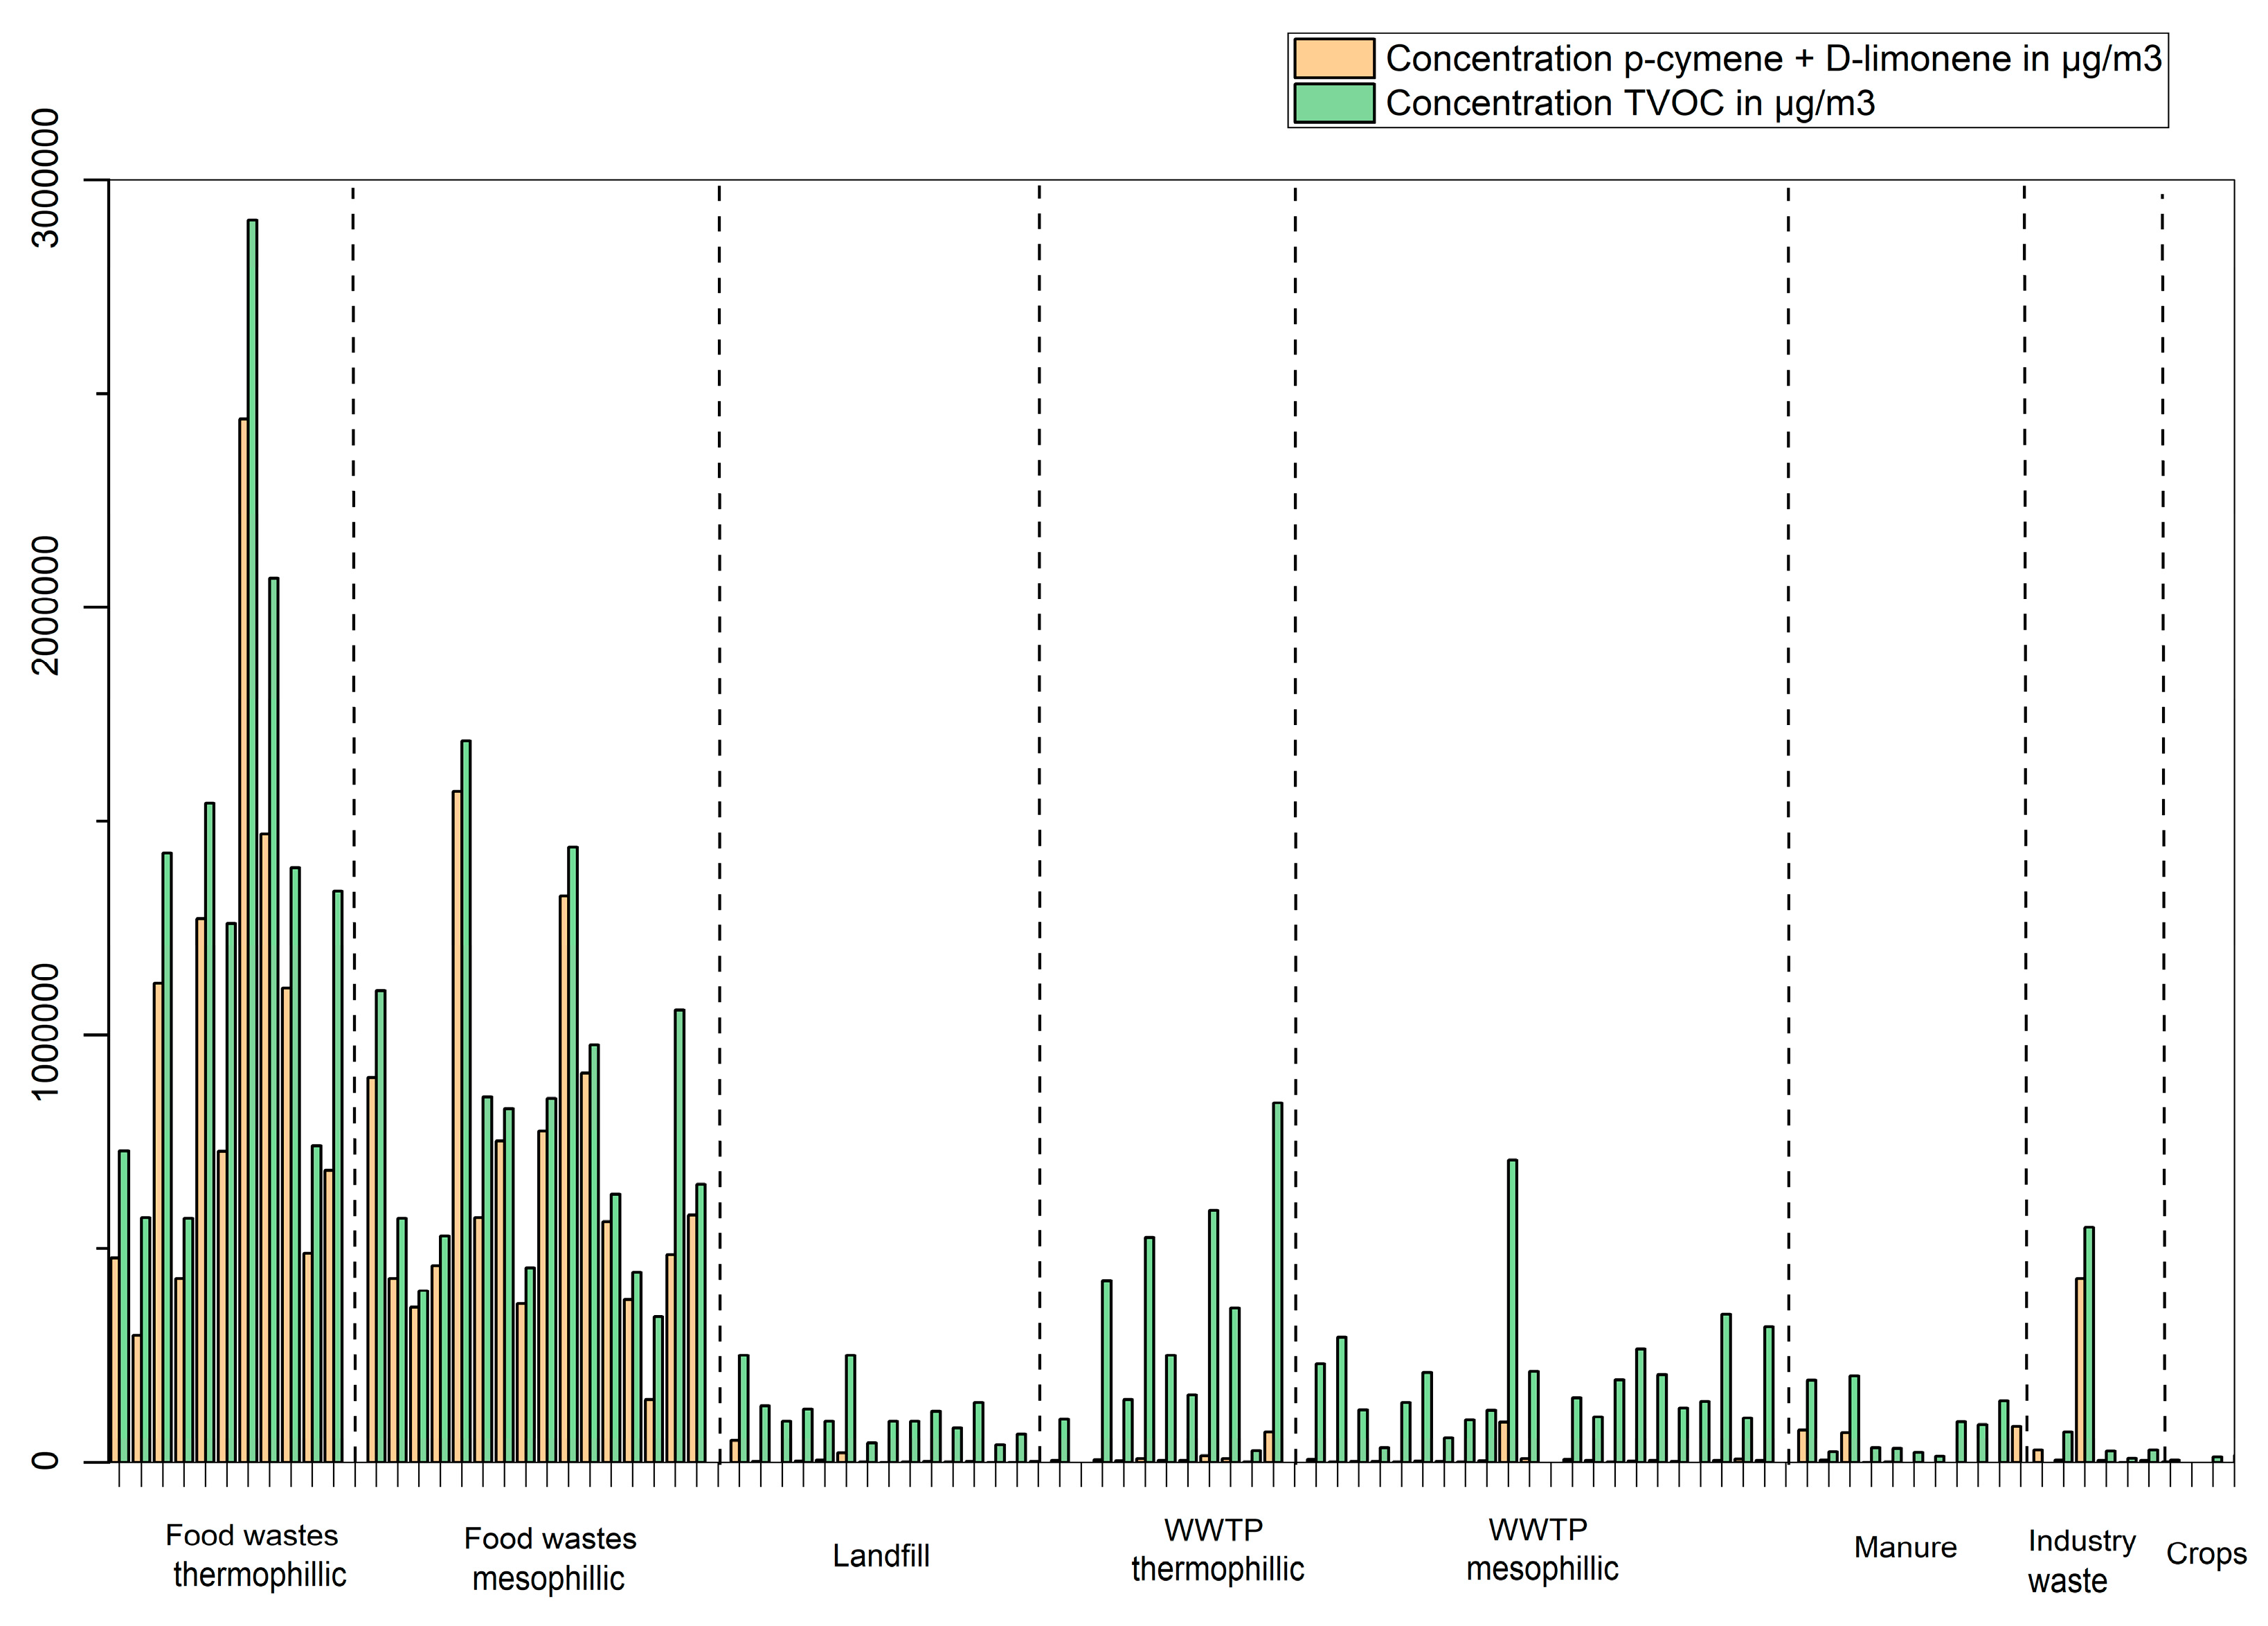
Figure 6.
Concentration of organic sulphur containing compounds in µg/m3 in biogas produced from different feedstocks.
Figure 6.
Concentration of organic sulphur containing compounds in µg/m3 in biogas produced from different feedstocks.
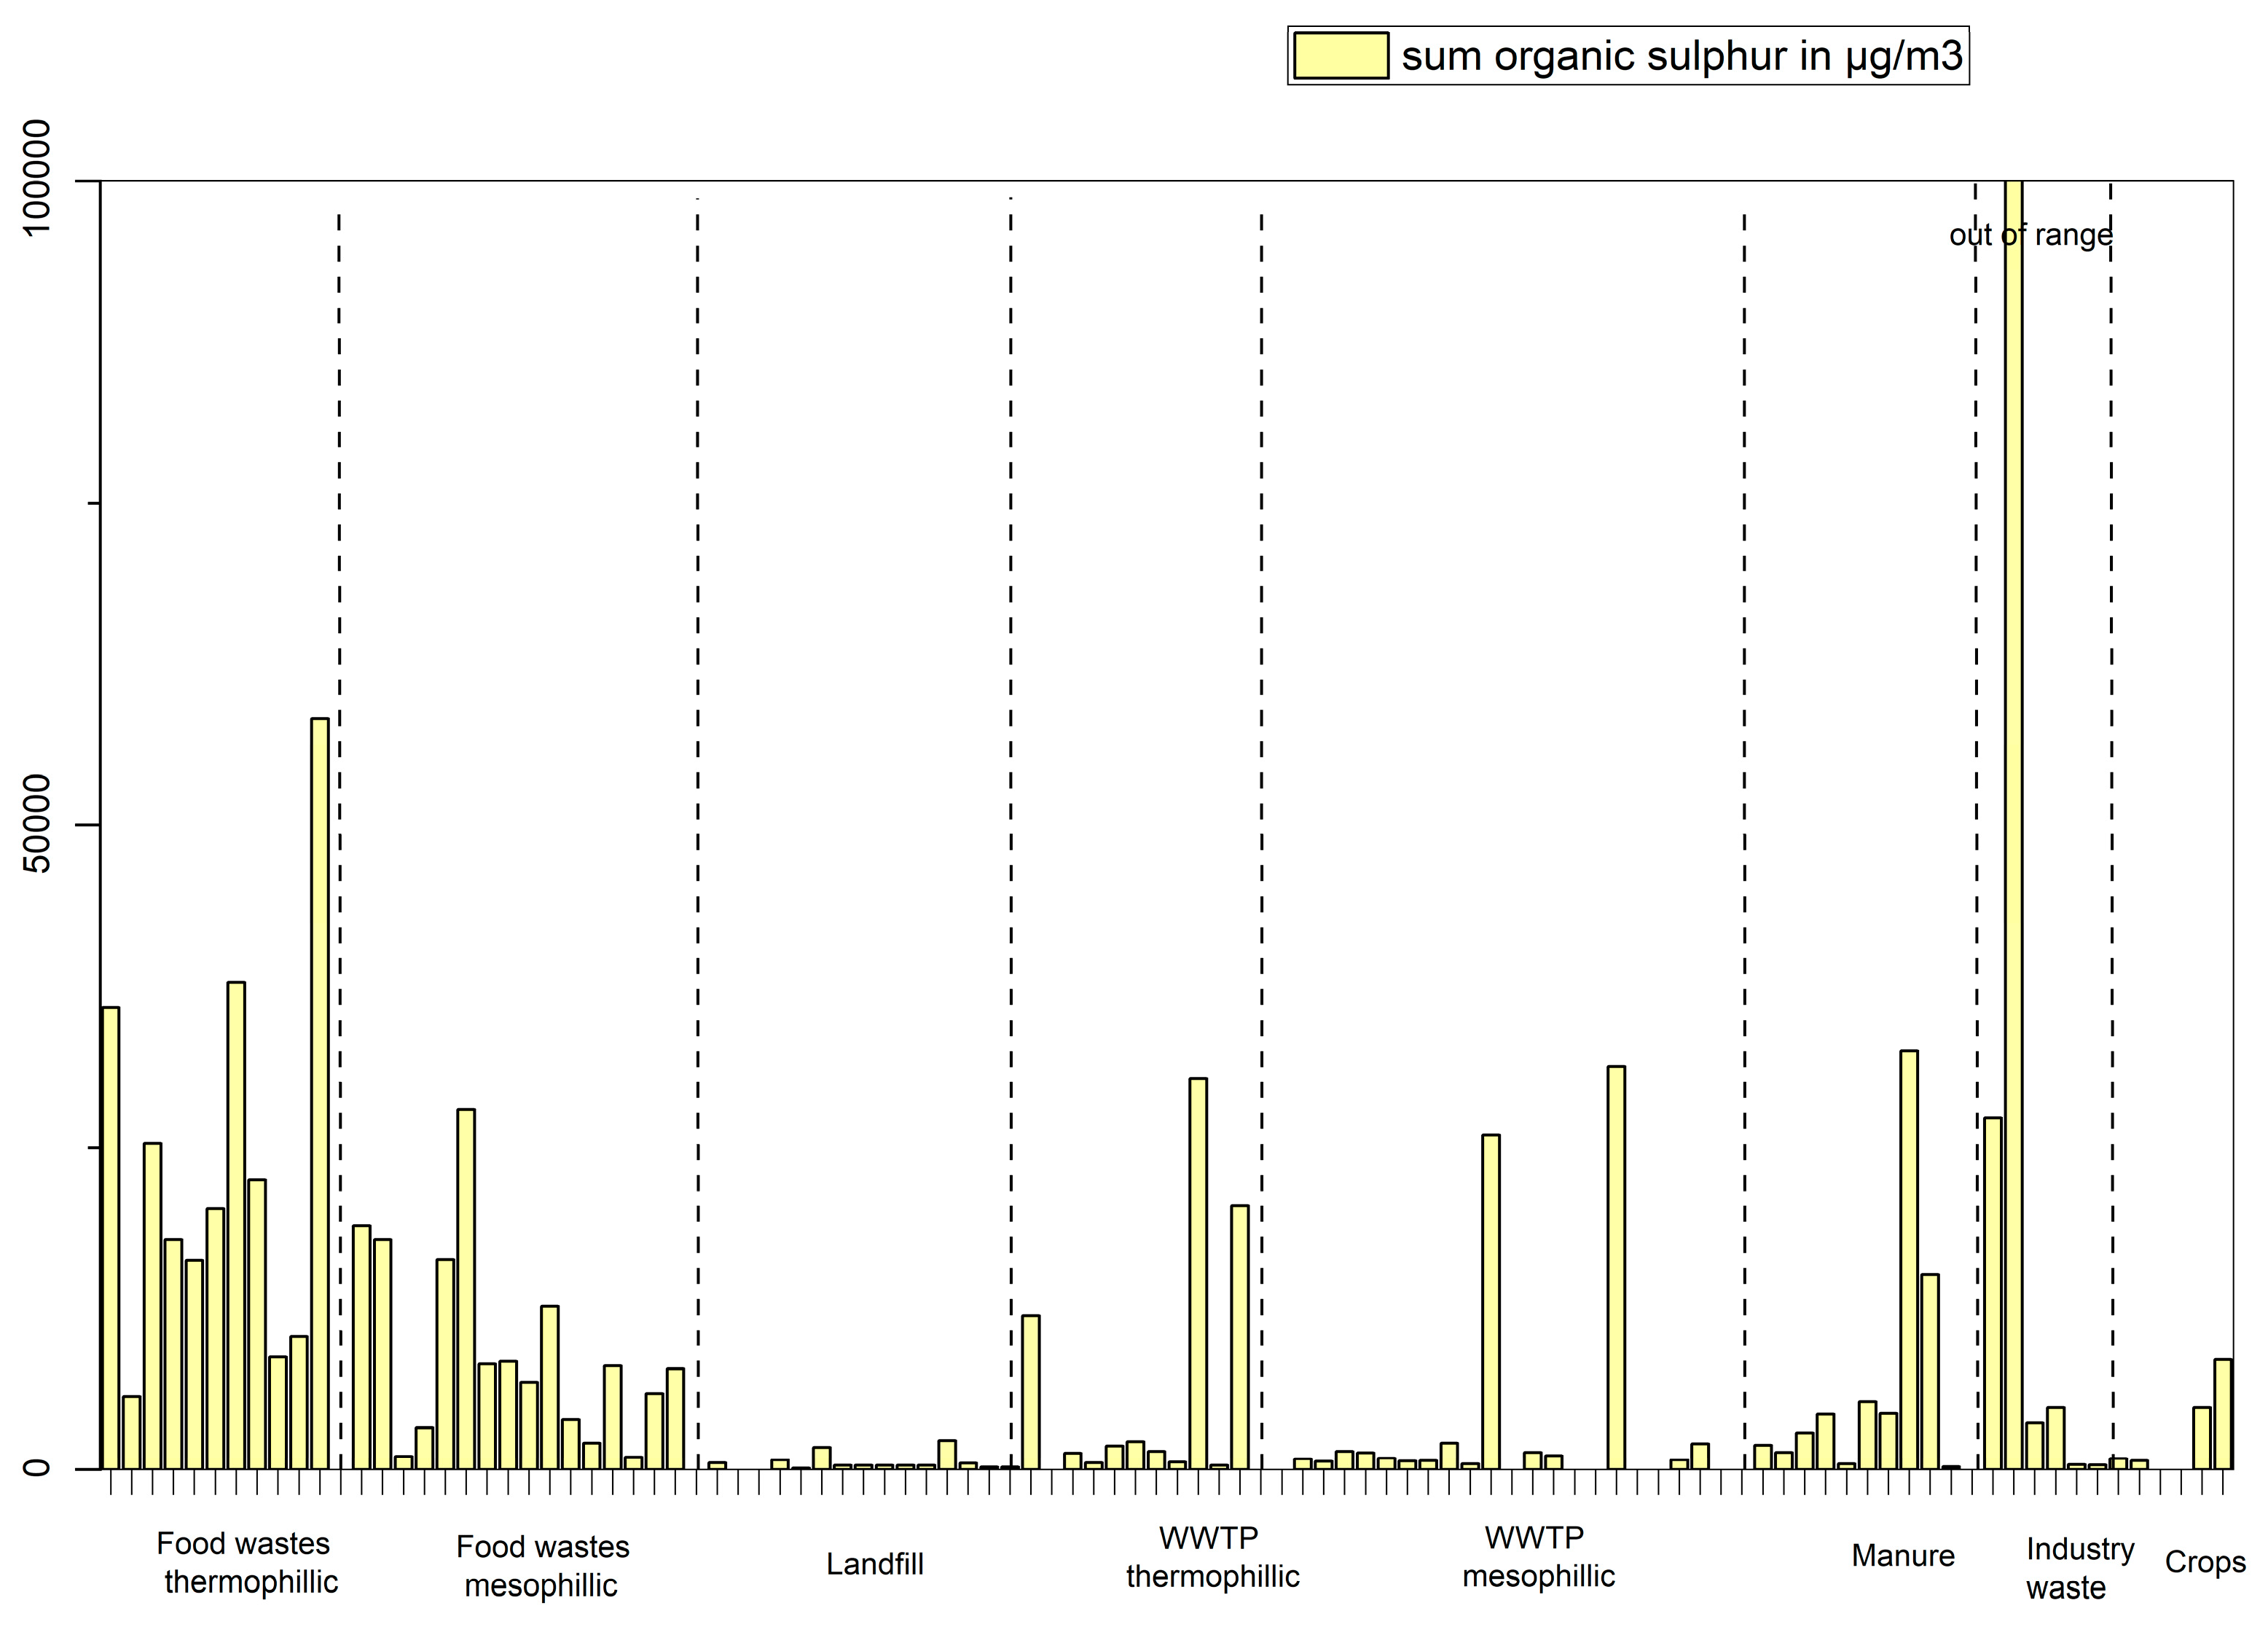
Figure 7.
Concentration of 2-propanethiol (green) and 2-butanethiol (purple) in µg/m3 in biogas produced from different feedstocks.
Figure 7.
Concentration of 2-propanethiol (green) and 2-butanethiol (purple) in µg/m3 in biogas produced from different feedstocks.
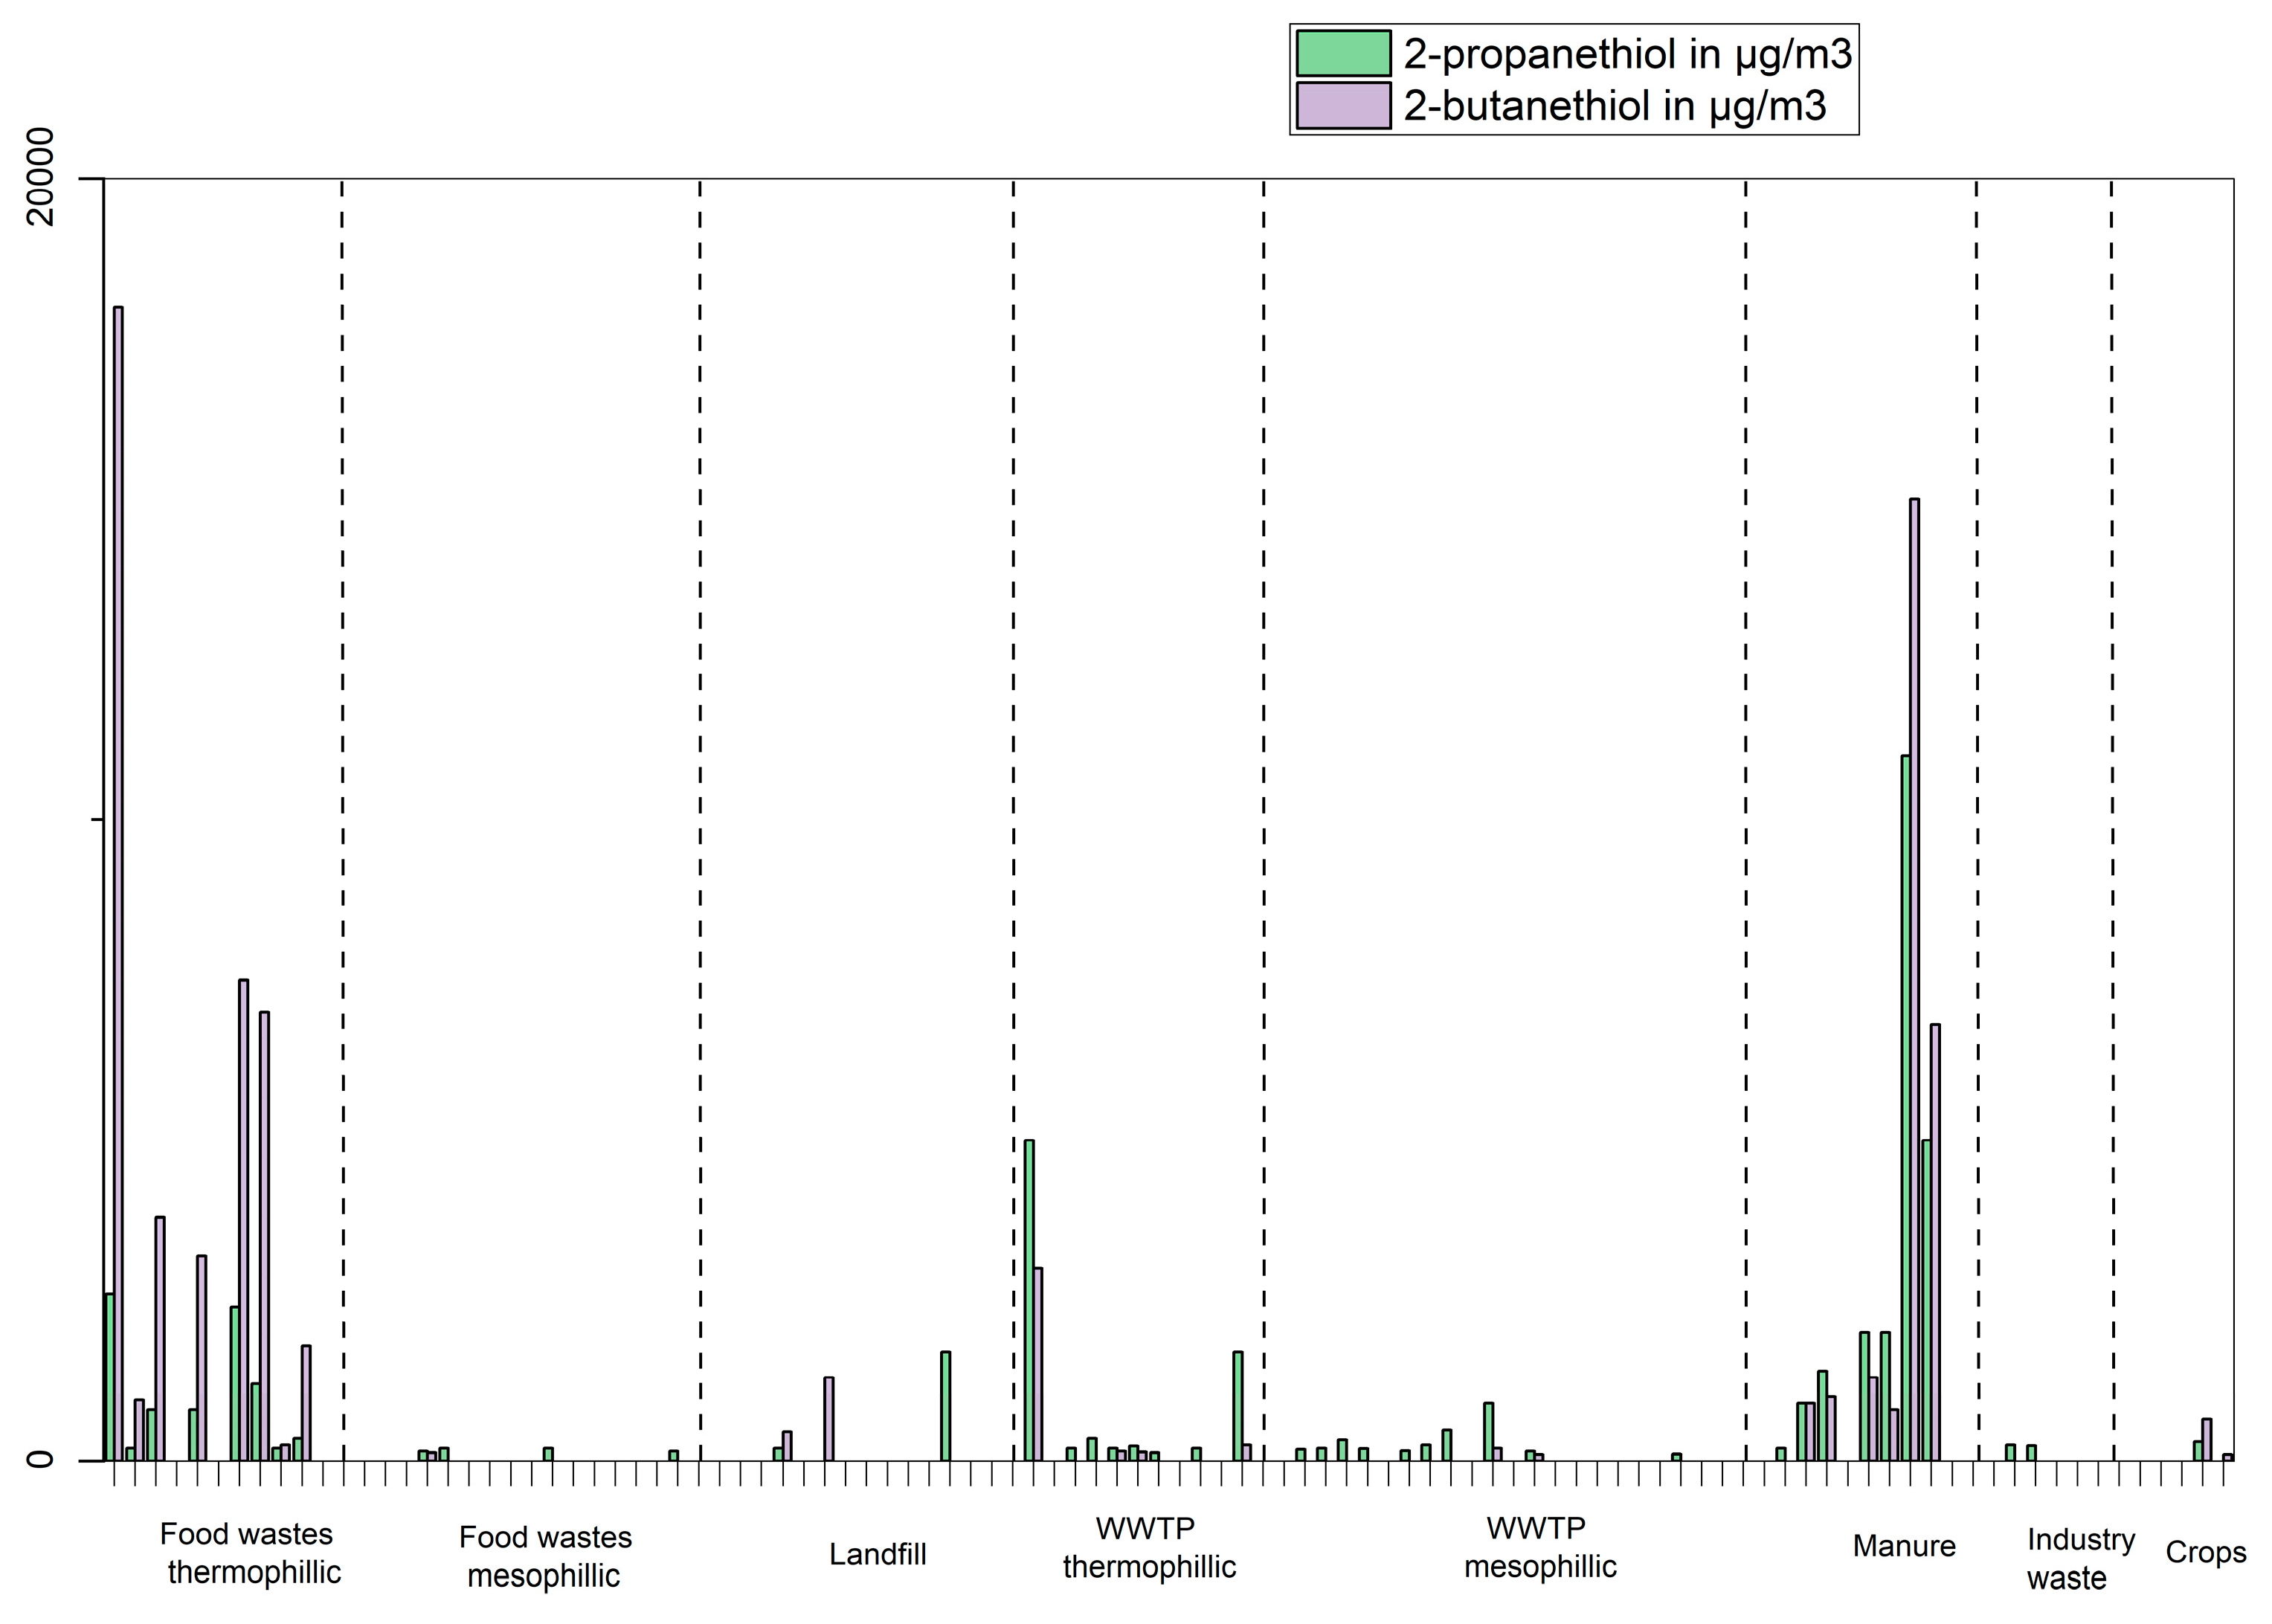
Figure 8.
Concentration of 1-propanethiol in µg/m3 in biogas produced from different feedstocks.
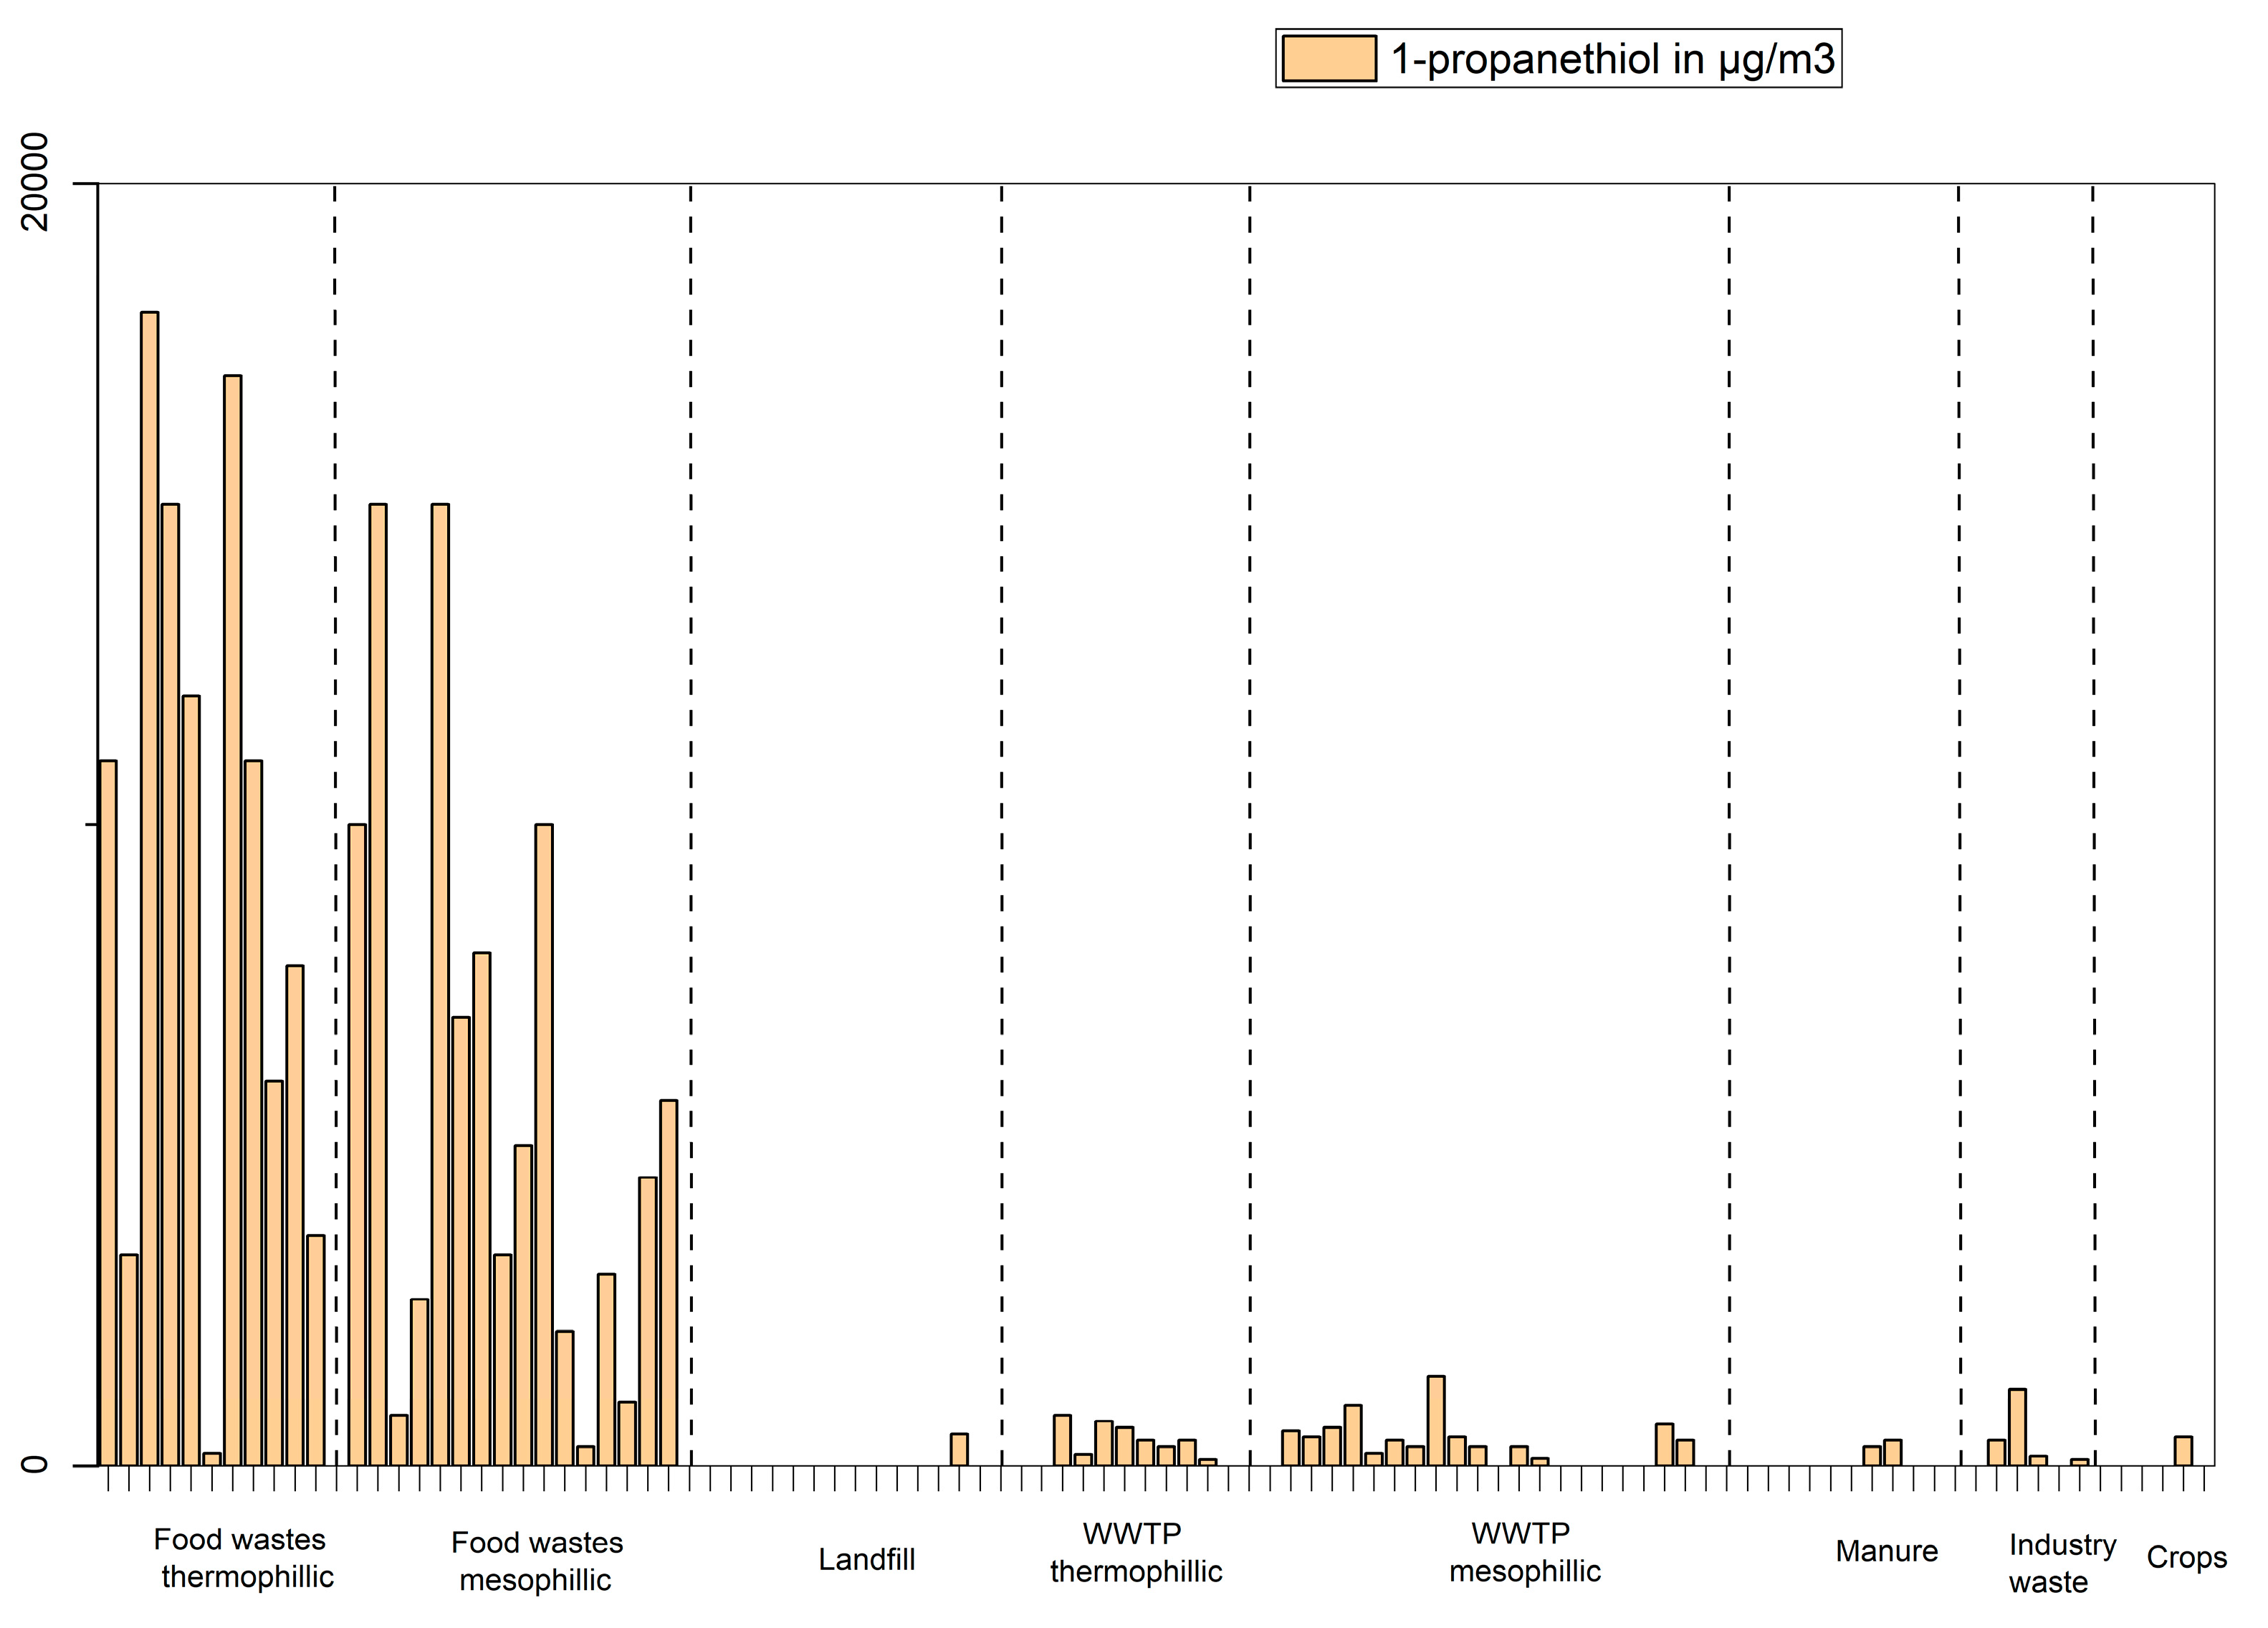
Figure 9.
Concentrations in µg/m3 of 2-butanone and 2-butanol in biogas produced from different feedstocks.
Figure 9.
Concentrations in µg/m3 of 2-butanone and 2-butanol in biogas produced from different feedstocks.
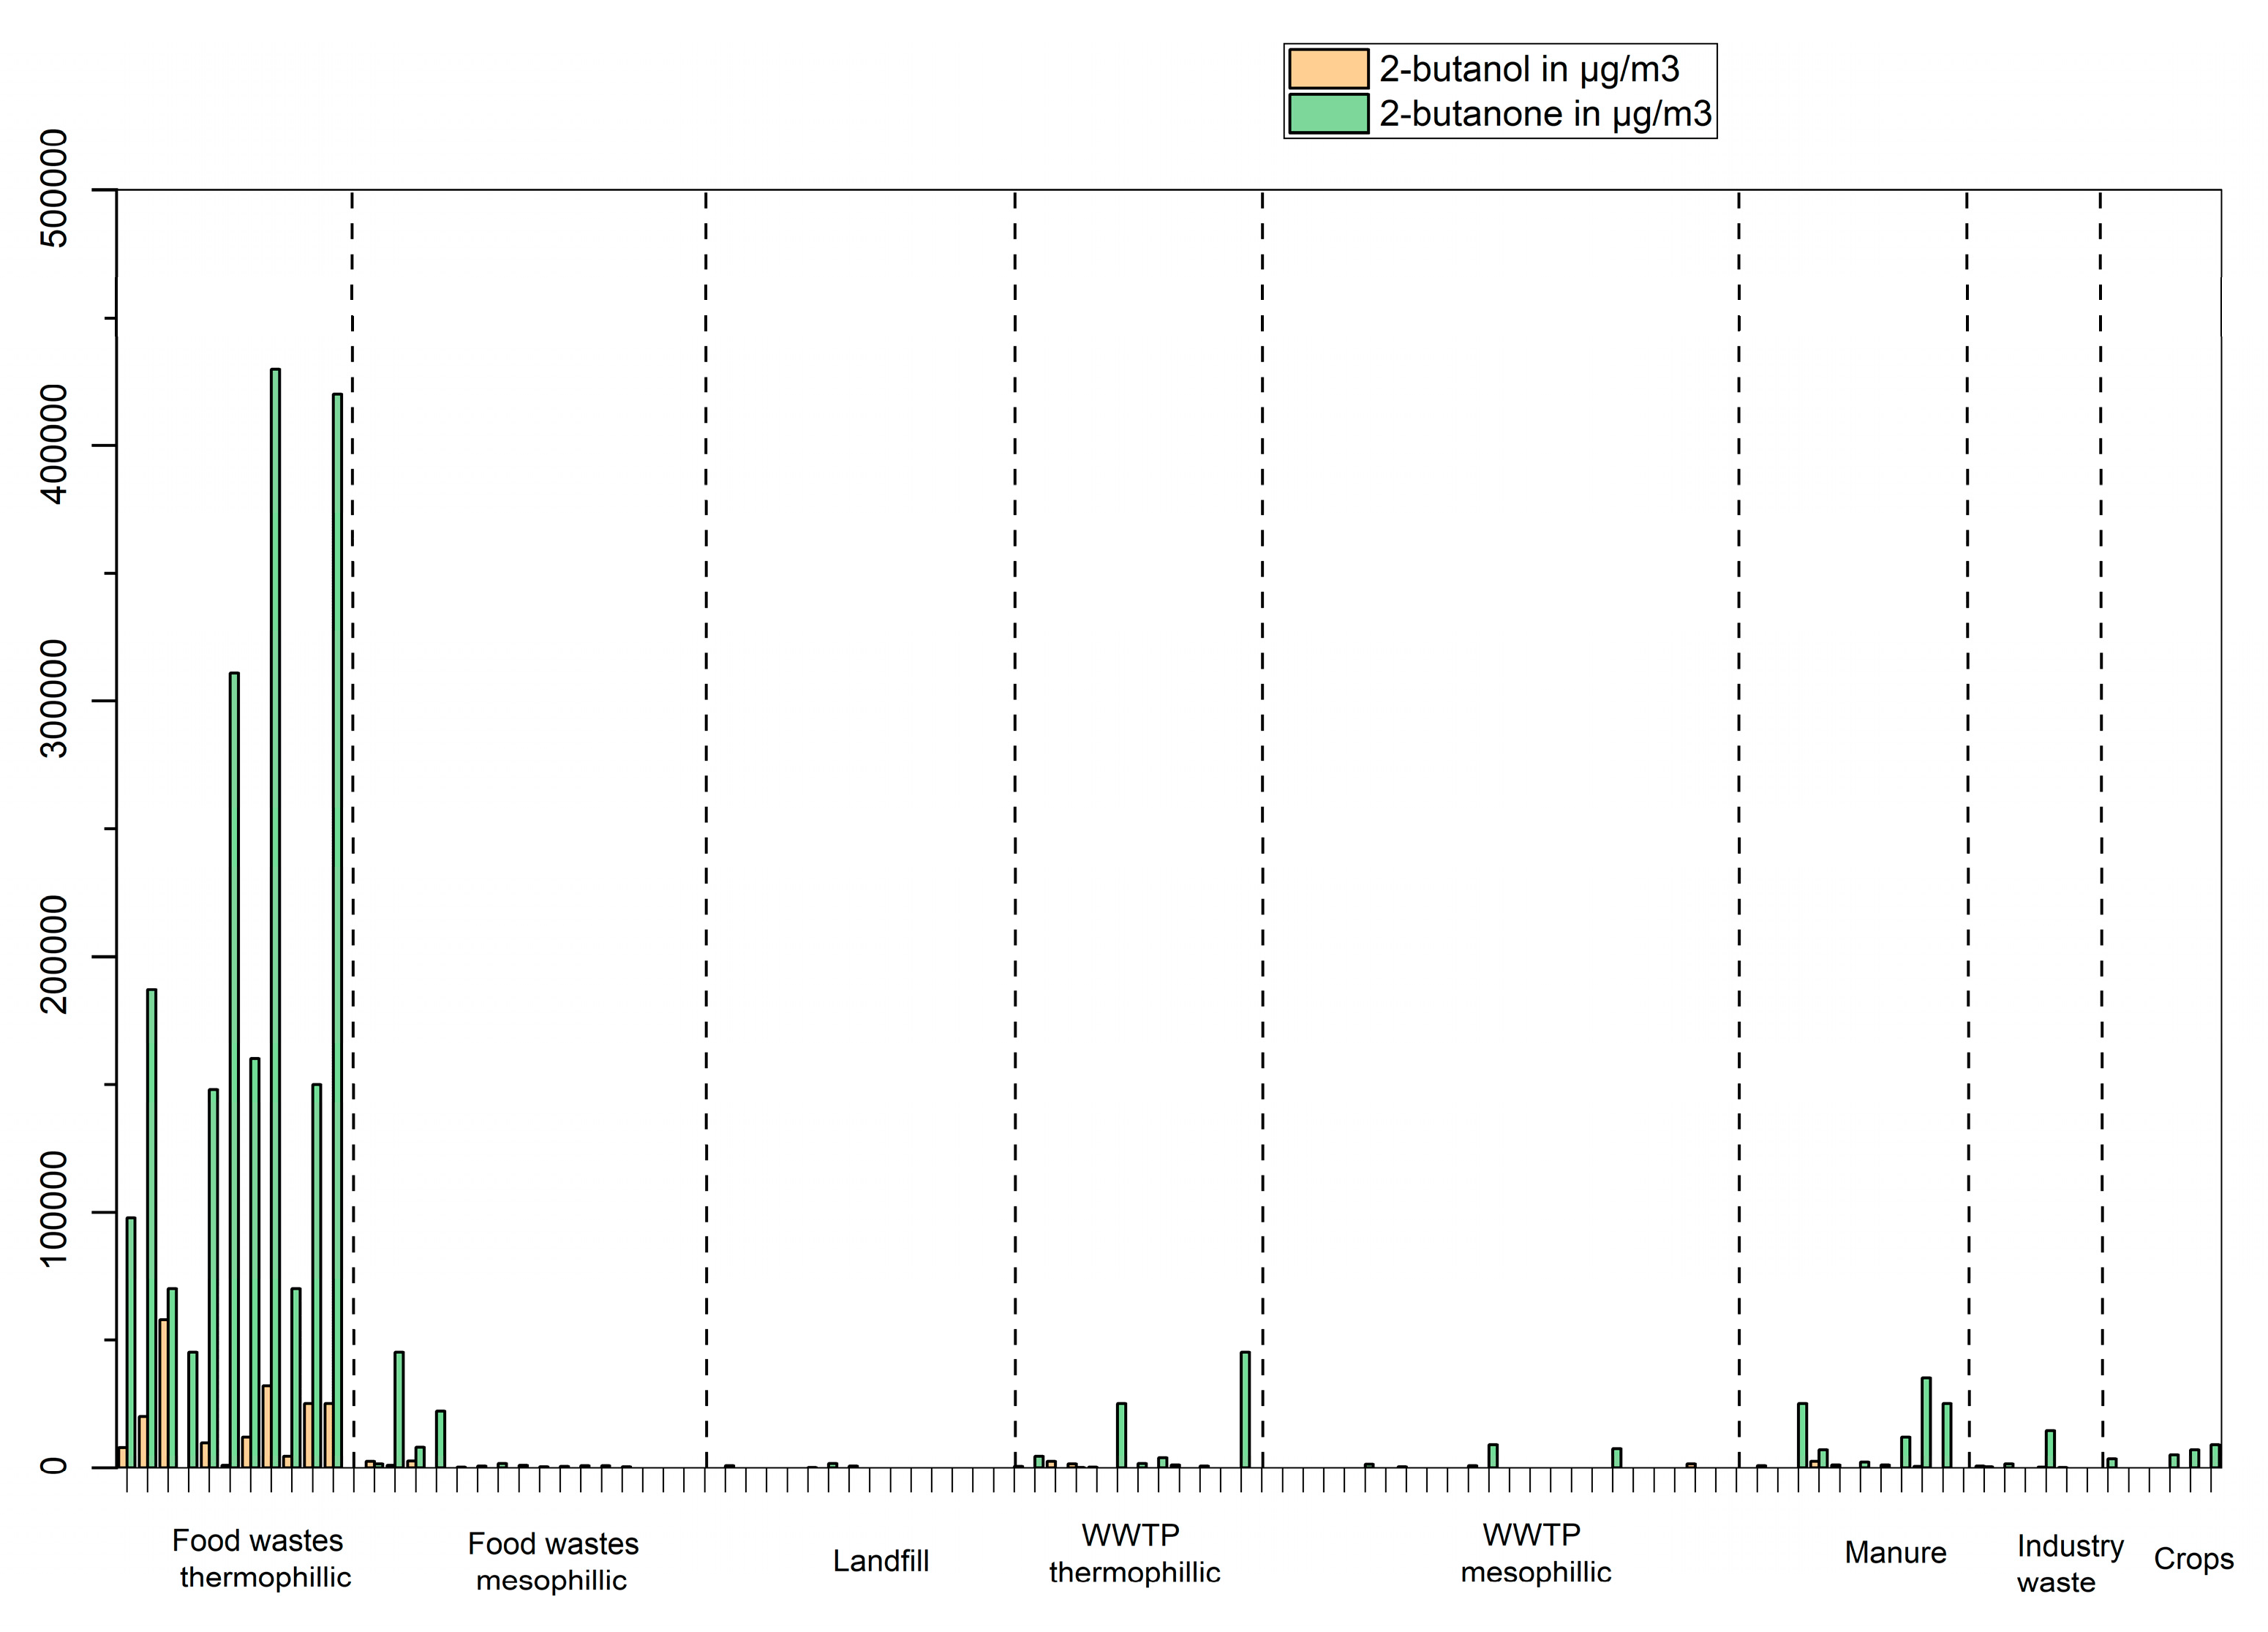
Figure 10.
Concentrations in µg/m3 of methyl-furans (sum of 2-methyl-furan and 3-methyl-furan) and C2-furans in biogas produced from different feedstocks.
Figure 10.
Concentrations in µg/m3 of methyl-furans (sum of 2-methyl-furan and 3-methyl-furan) and C2-furans in biogas produced from different feedstocks.
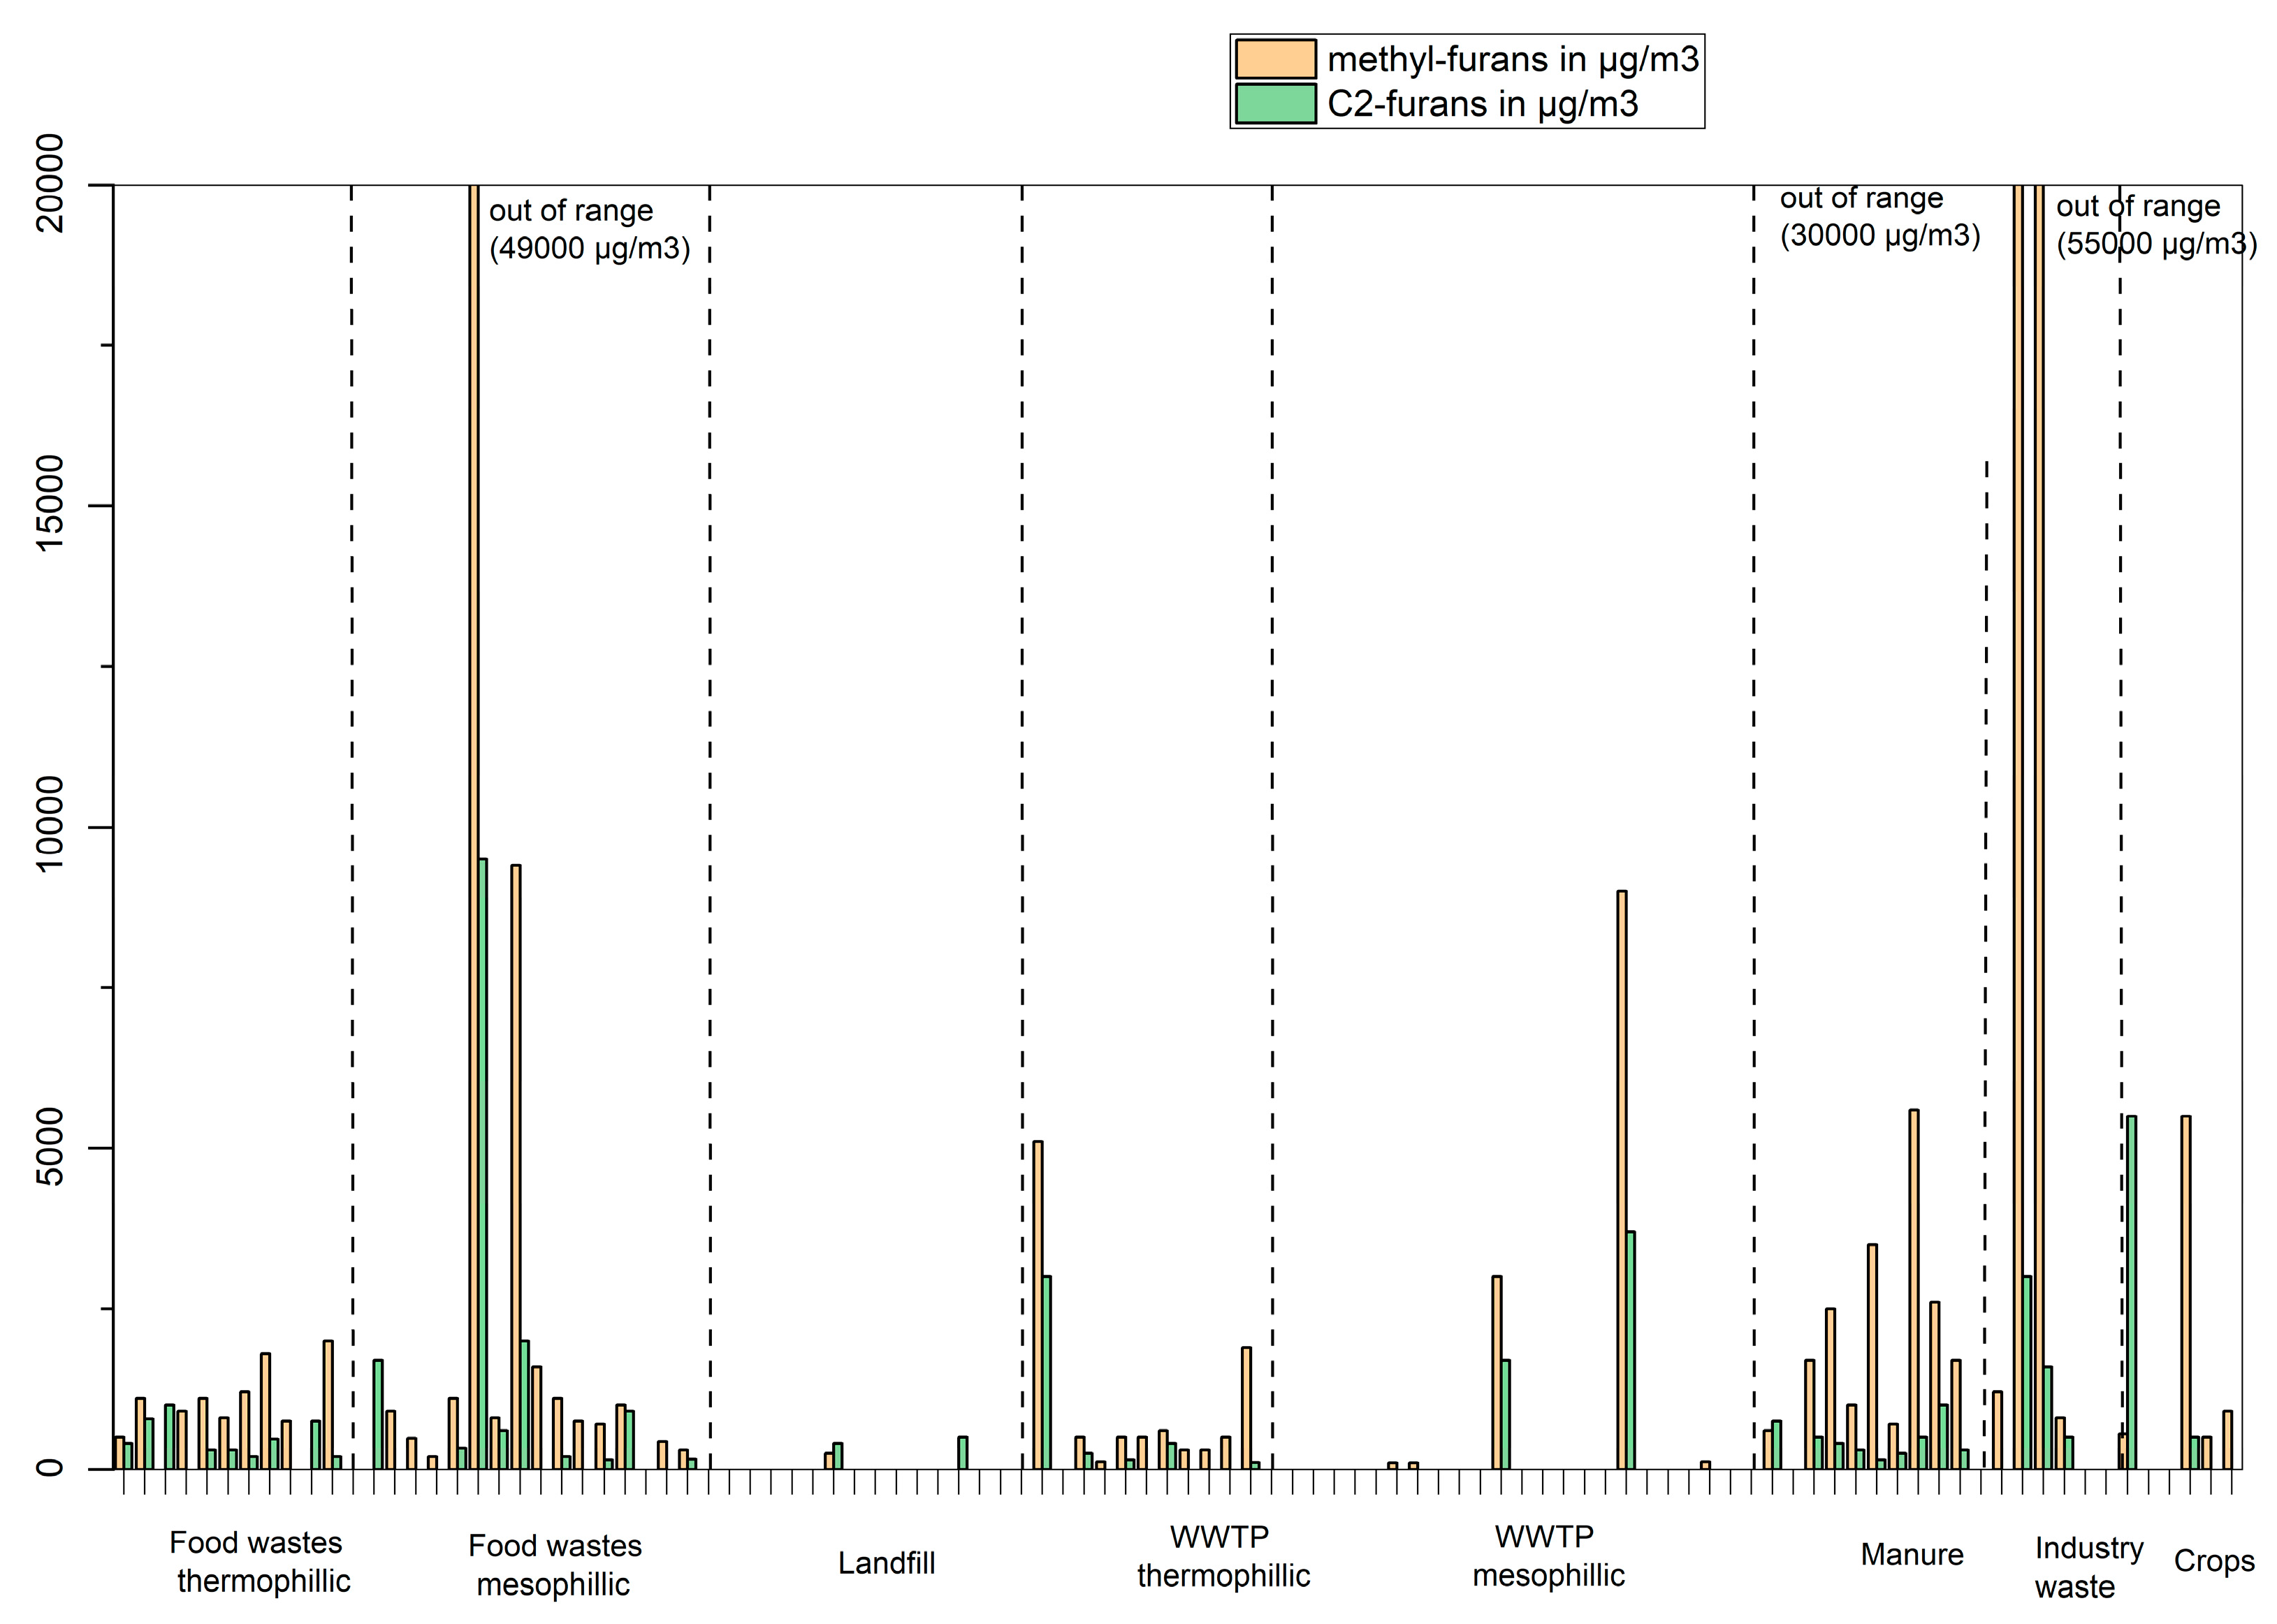
Figure 11.
Concentrations of benzene (orange) and toluene (green) in µg/m3 in biogas produced from different feedstocks.
Figure 11.
Concentrations of benzene (orange) and toluene (green) in µg/m3 in biogas produced from different feedstocks.
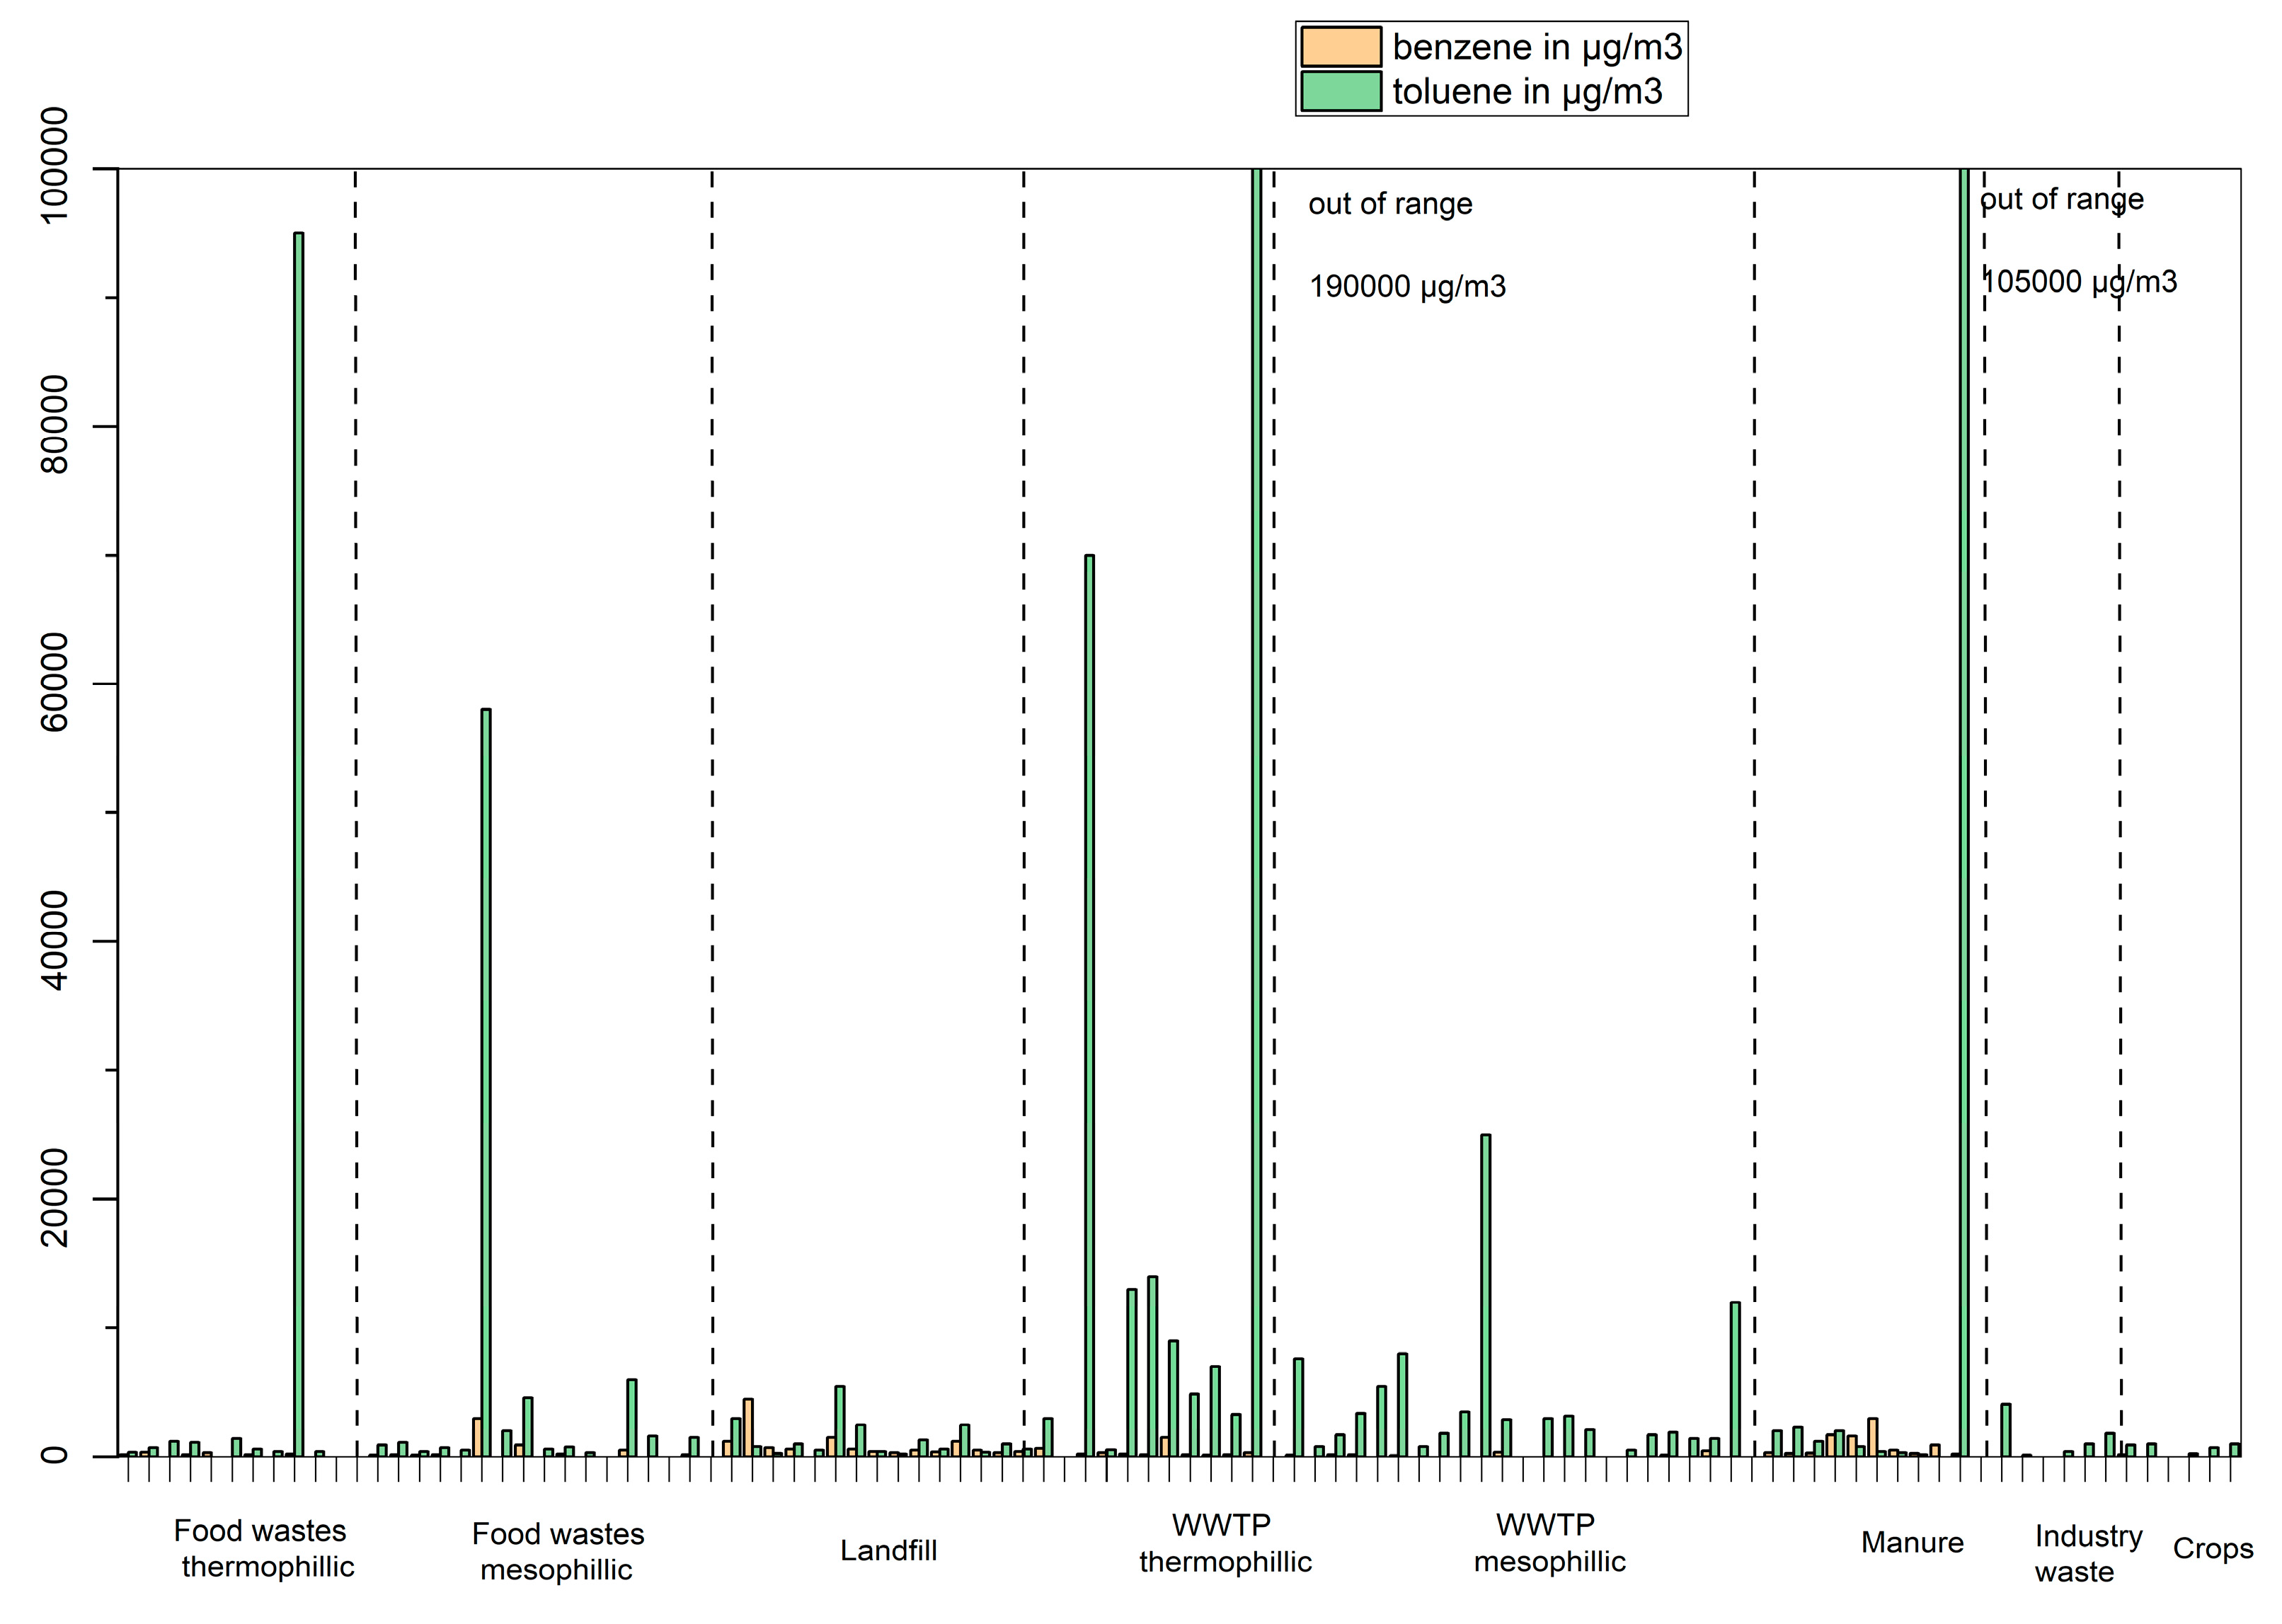
Figure 12.
TVOC and terpenes concentrations in µg/m3 in biomethane produced from food wastes with different upgrading techniques.
Figure 12.
TVOC and terpenes concentrations in µg/m3 in biomethane produced from food wastes with different upgrading techniques.
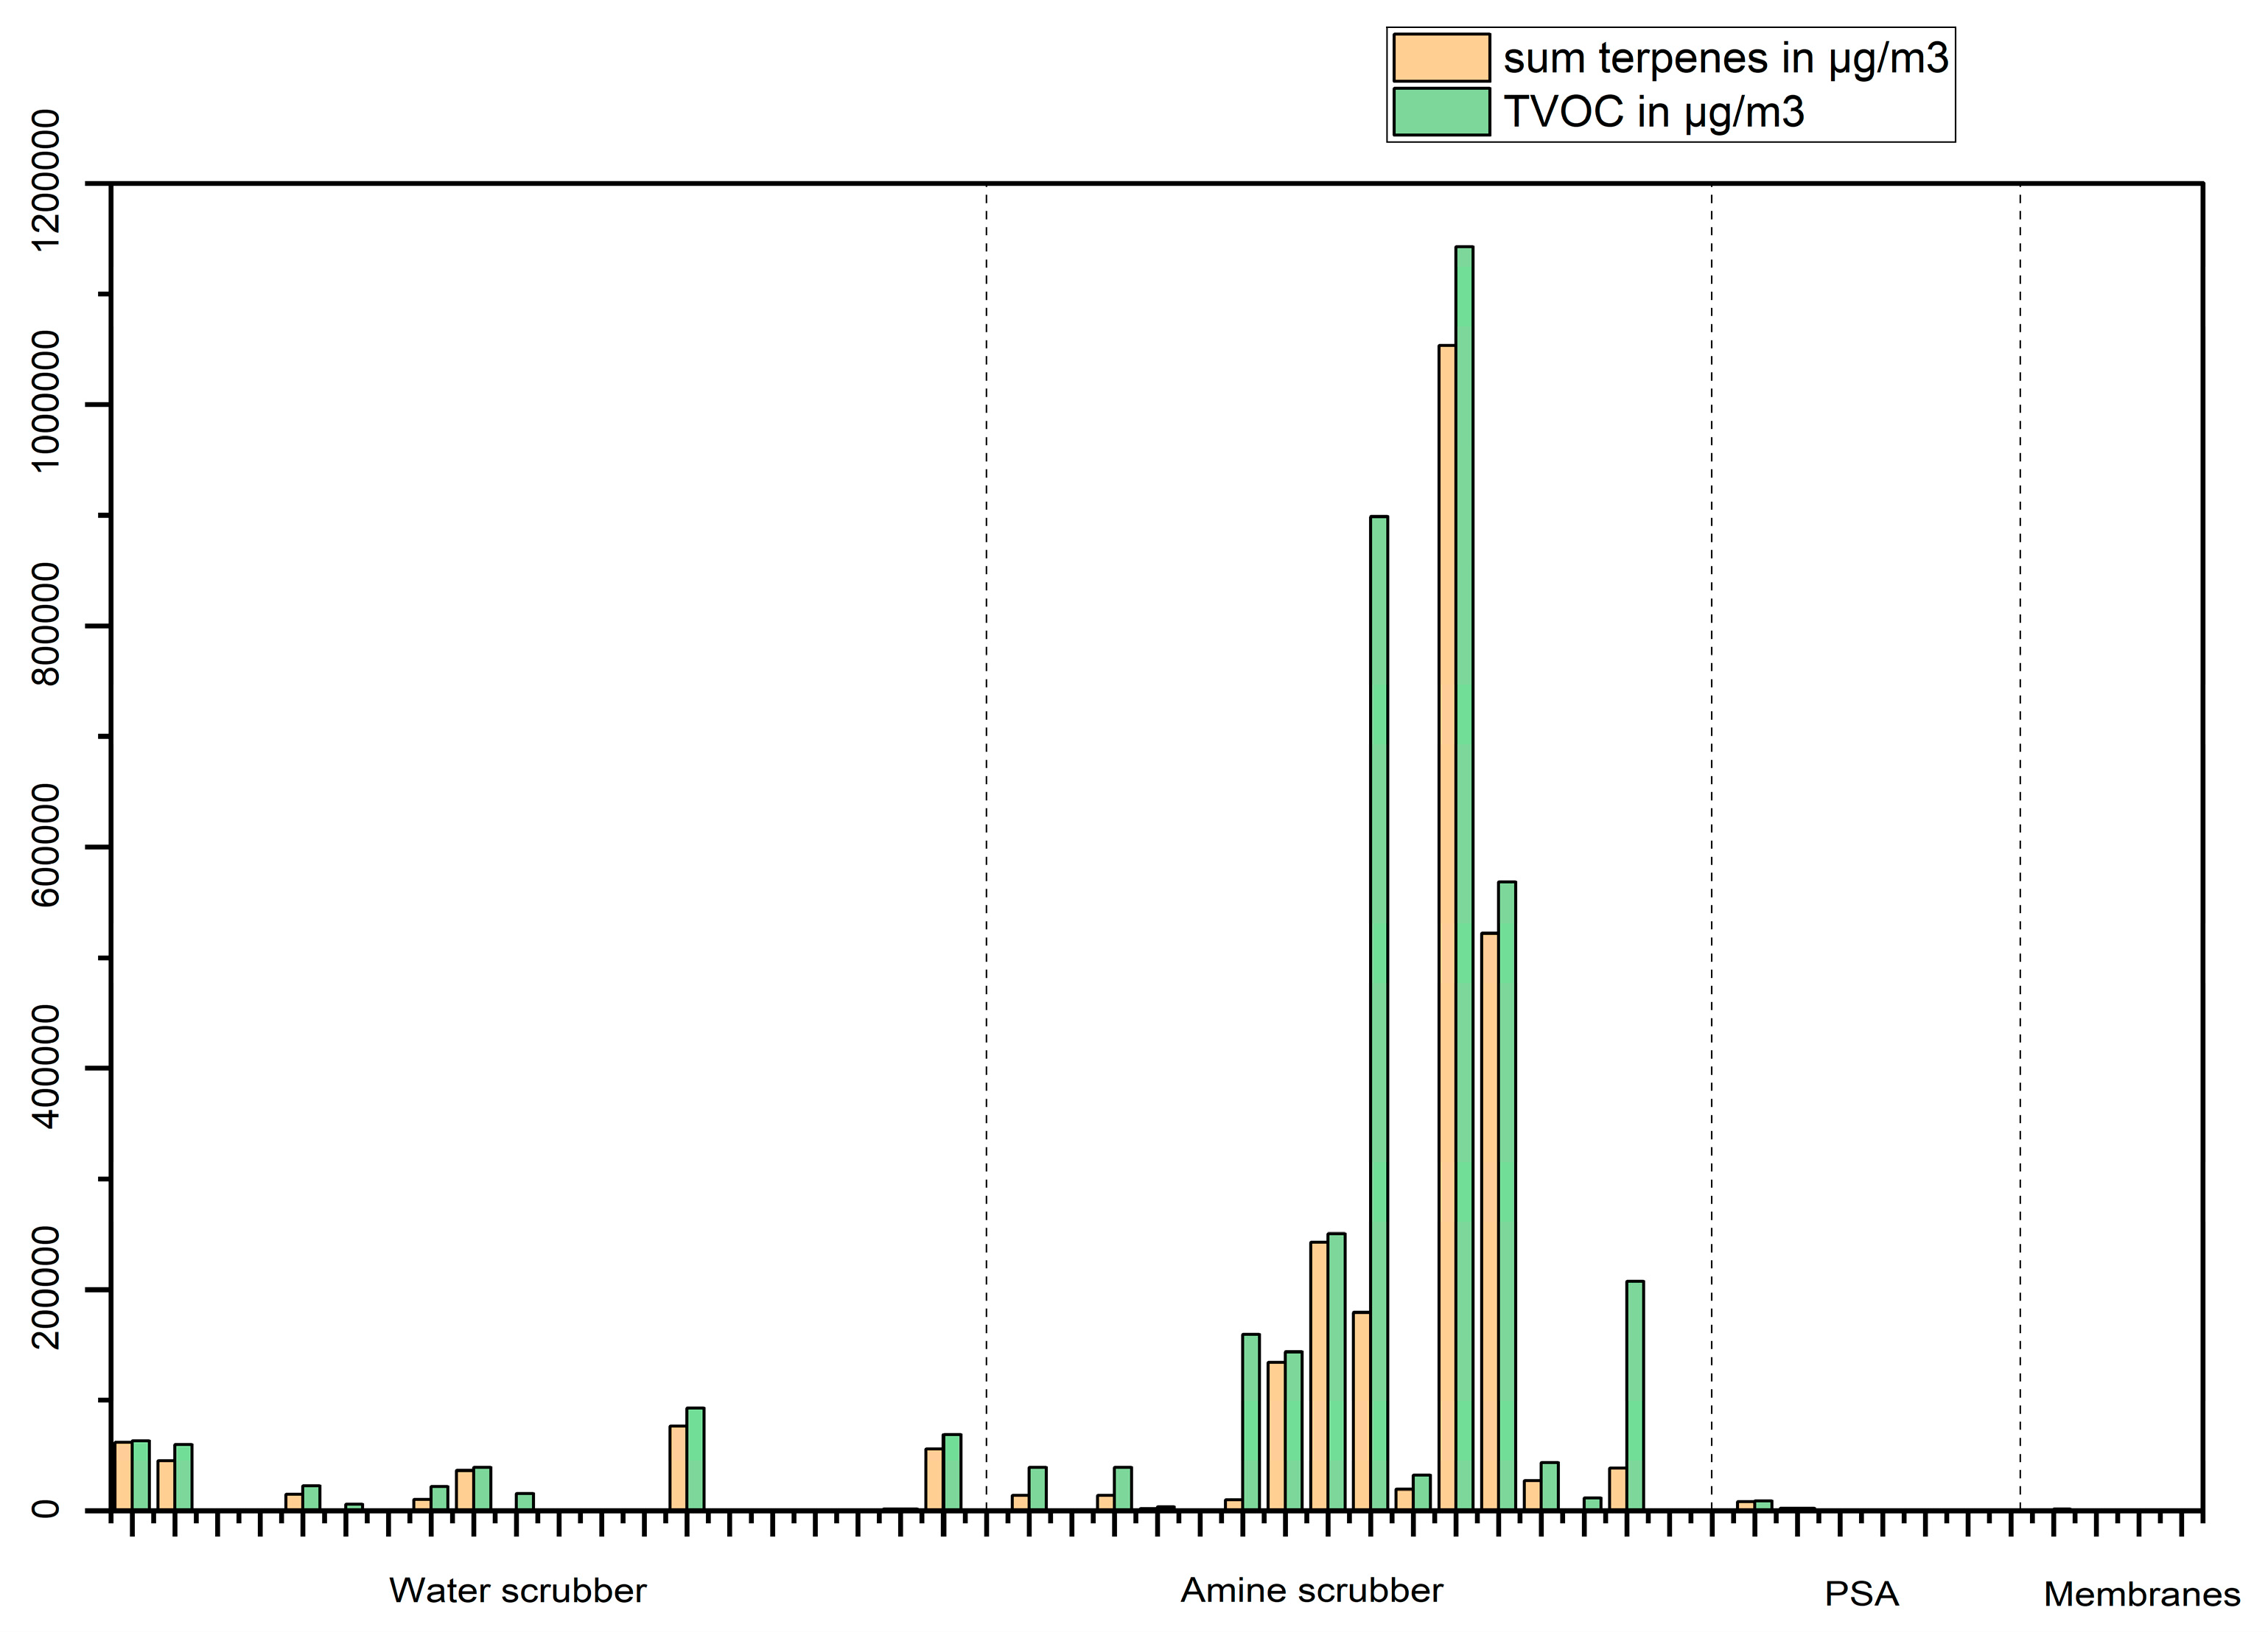
Figure 13.
Percentage of VOCs remaining in the biomethane for the gases having corresponding biogas data.
Figure 13.
Percentage of VOCs remaining in the biomethane for the gases having corresponding biogas data.
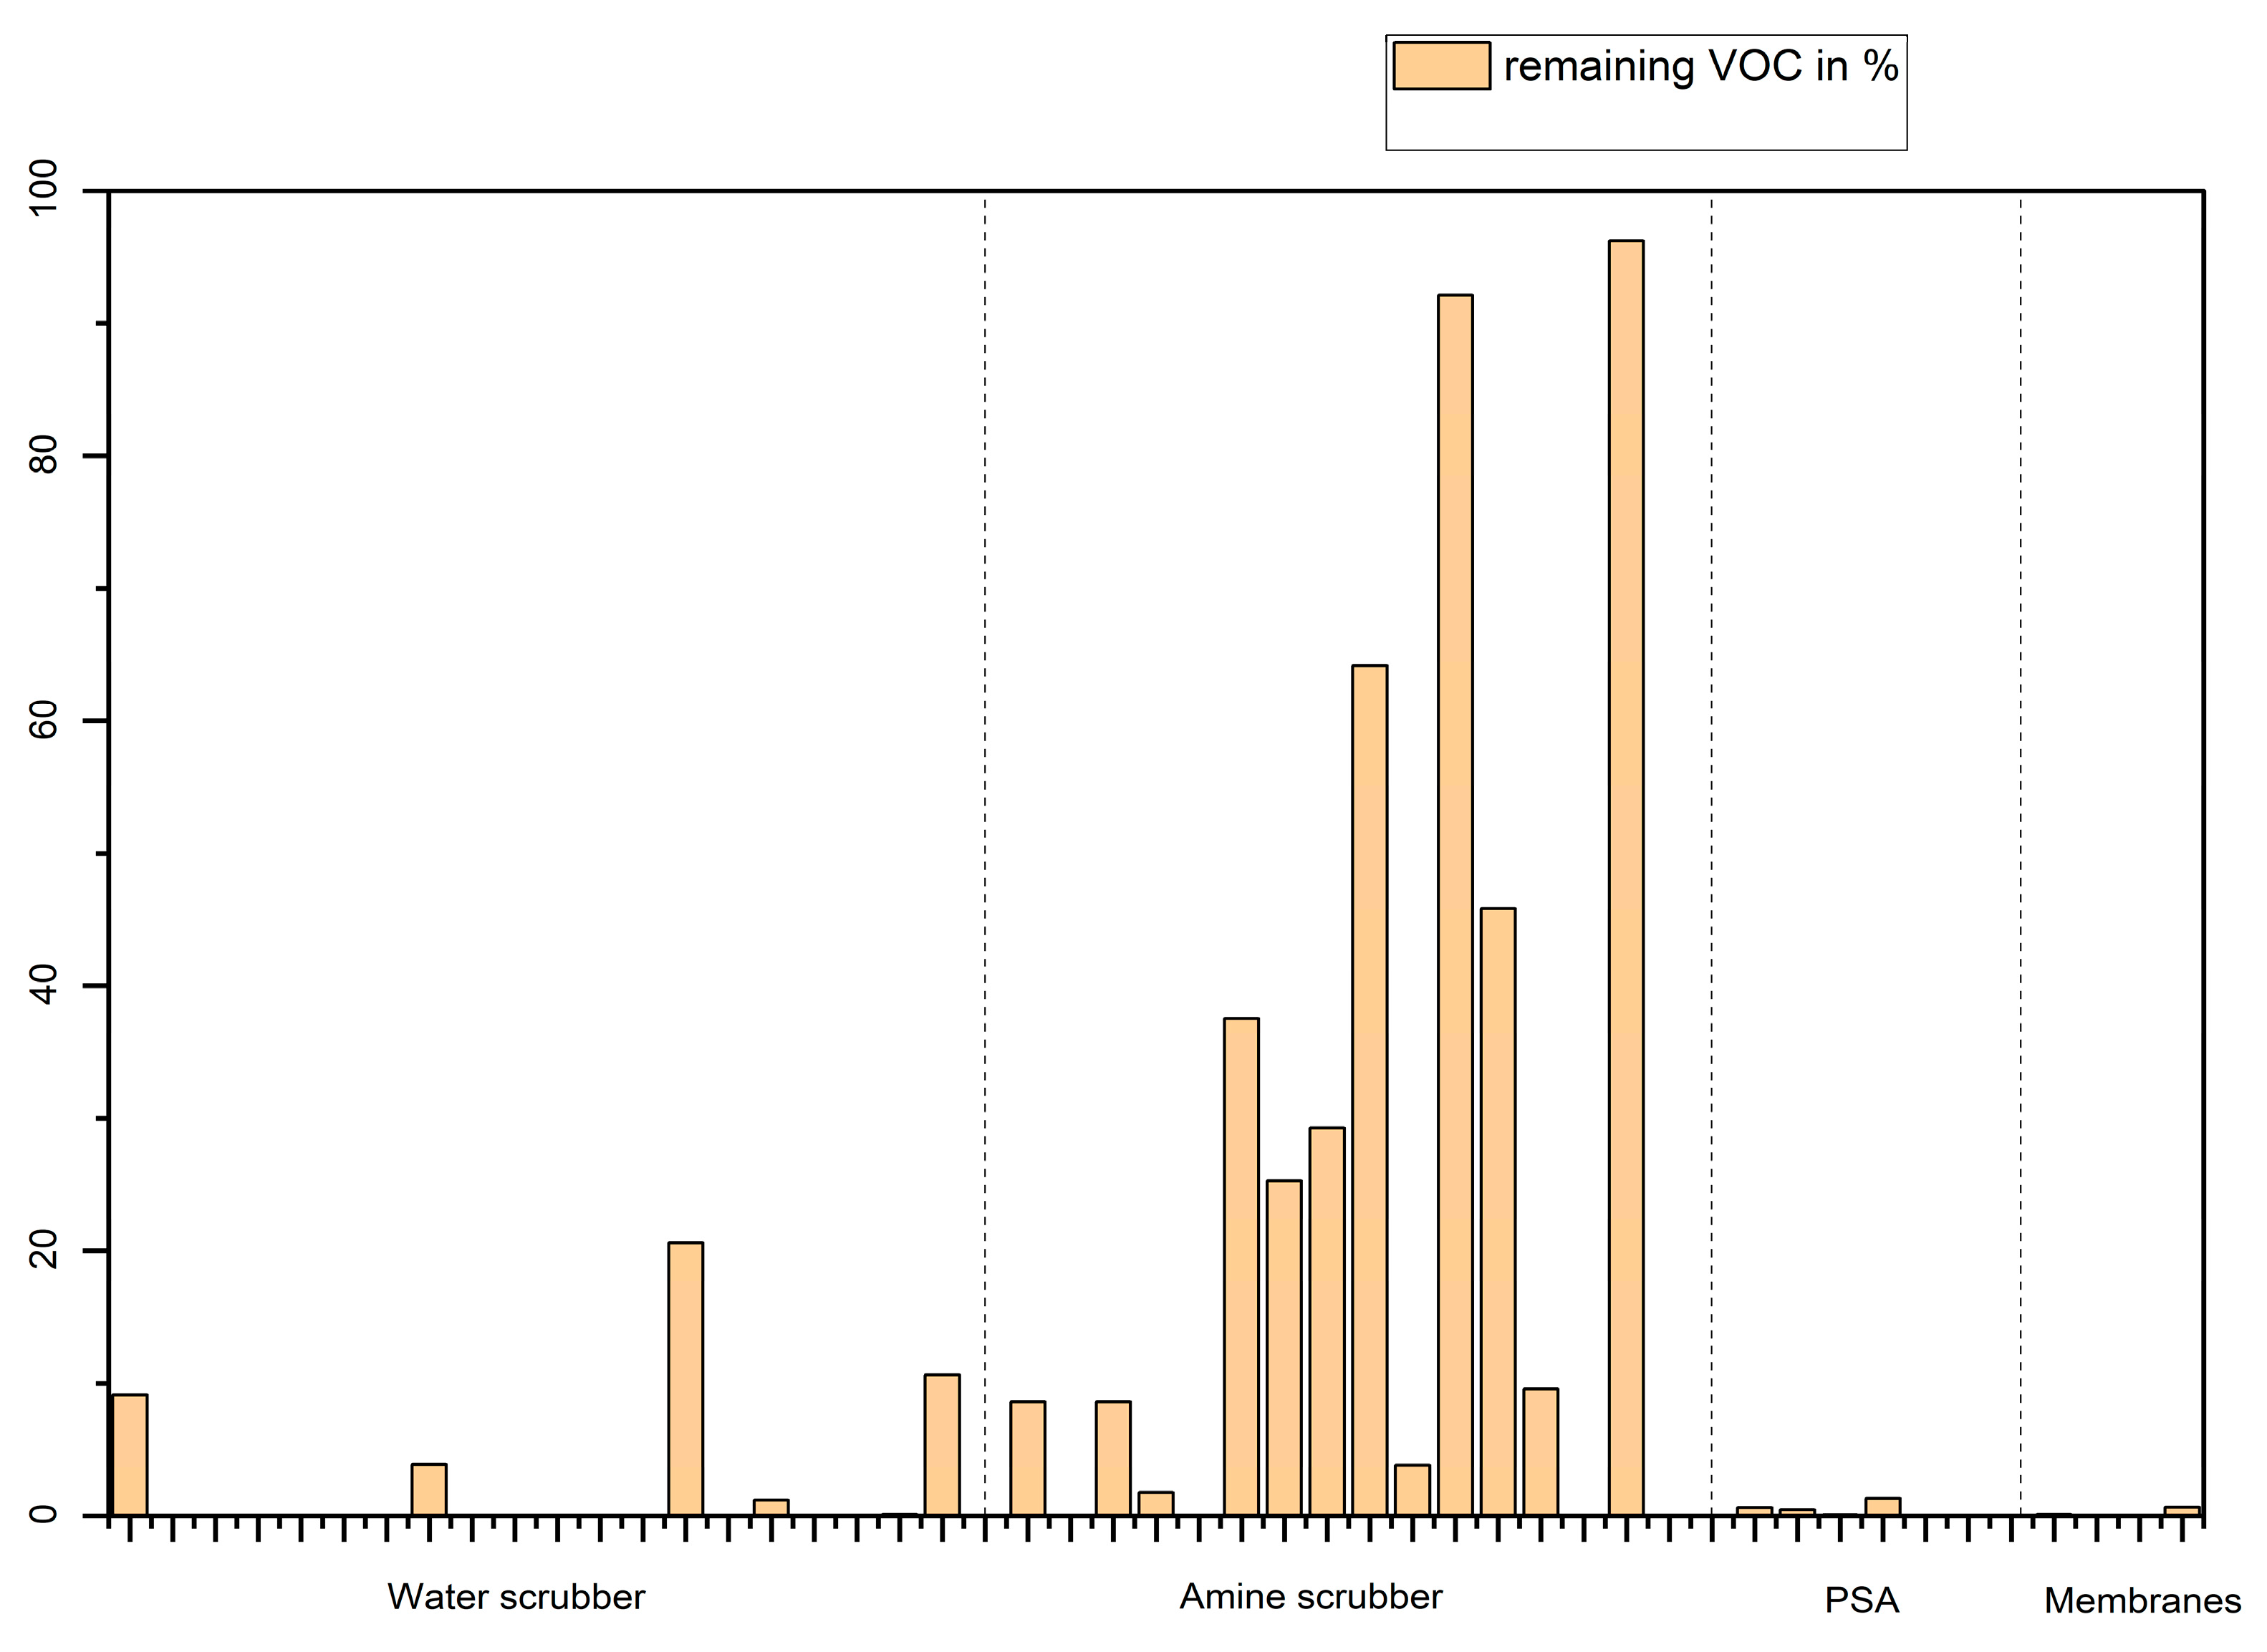
Figure 14.
Siloxanes concentration in µg/m3 in biomethane produced from food wastes with different upgrading techniques.
Figure 14.
Siloxanes concentration in µg/m3 in biomethane produced from food wastes with different upgrading techniques.
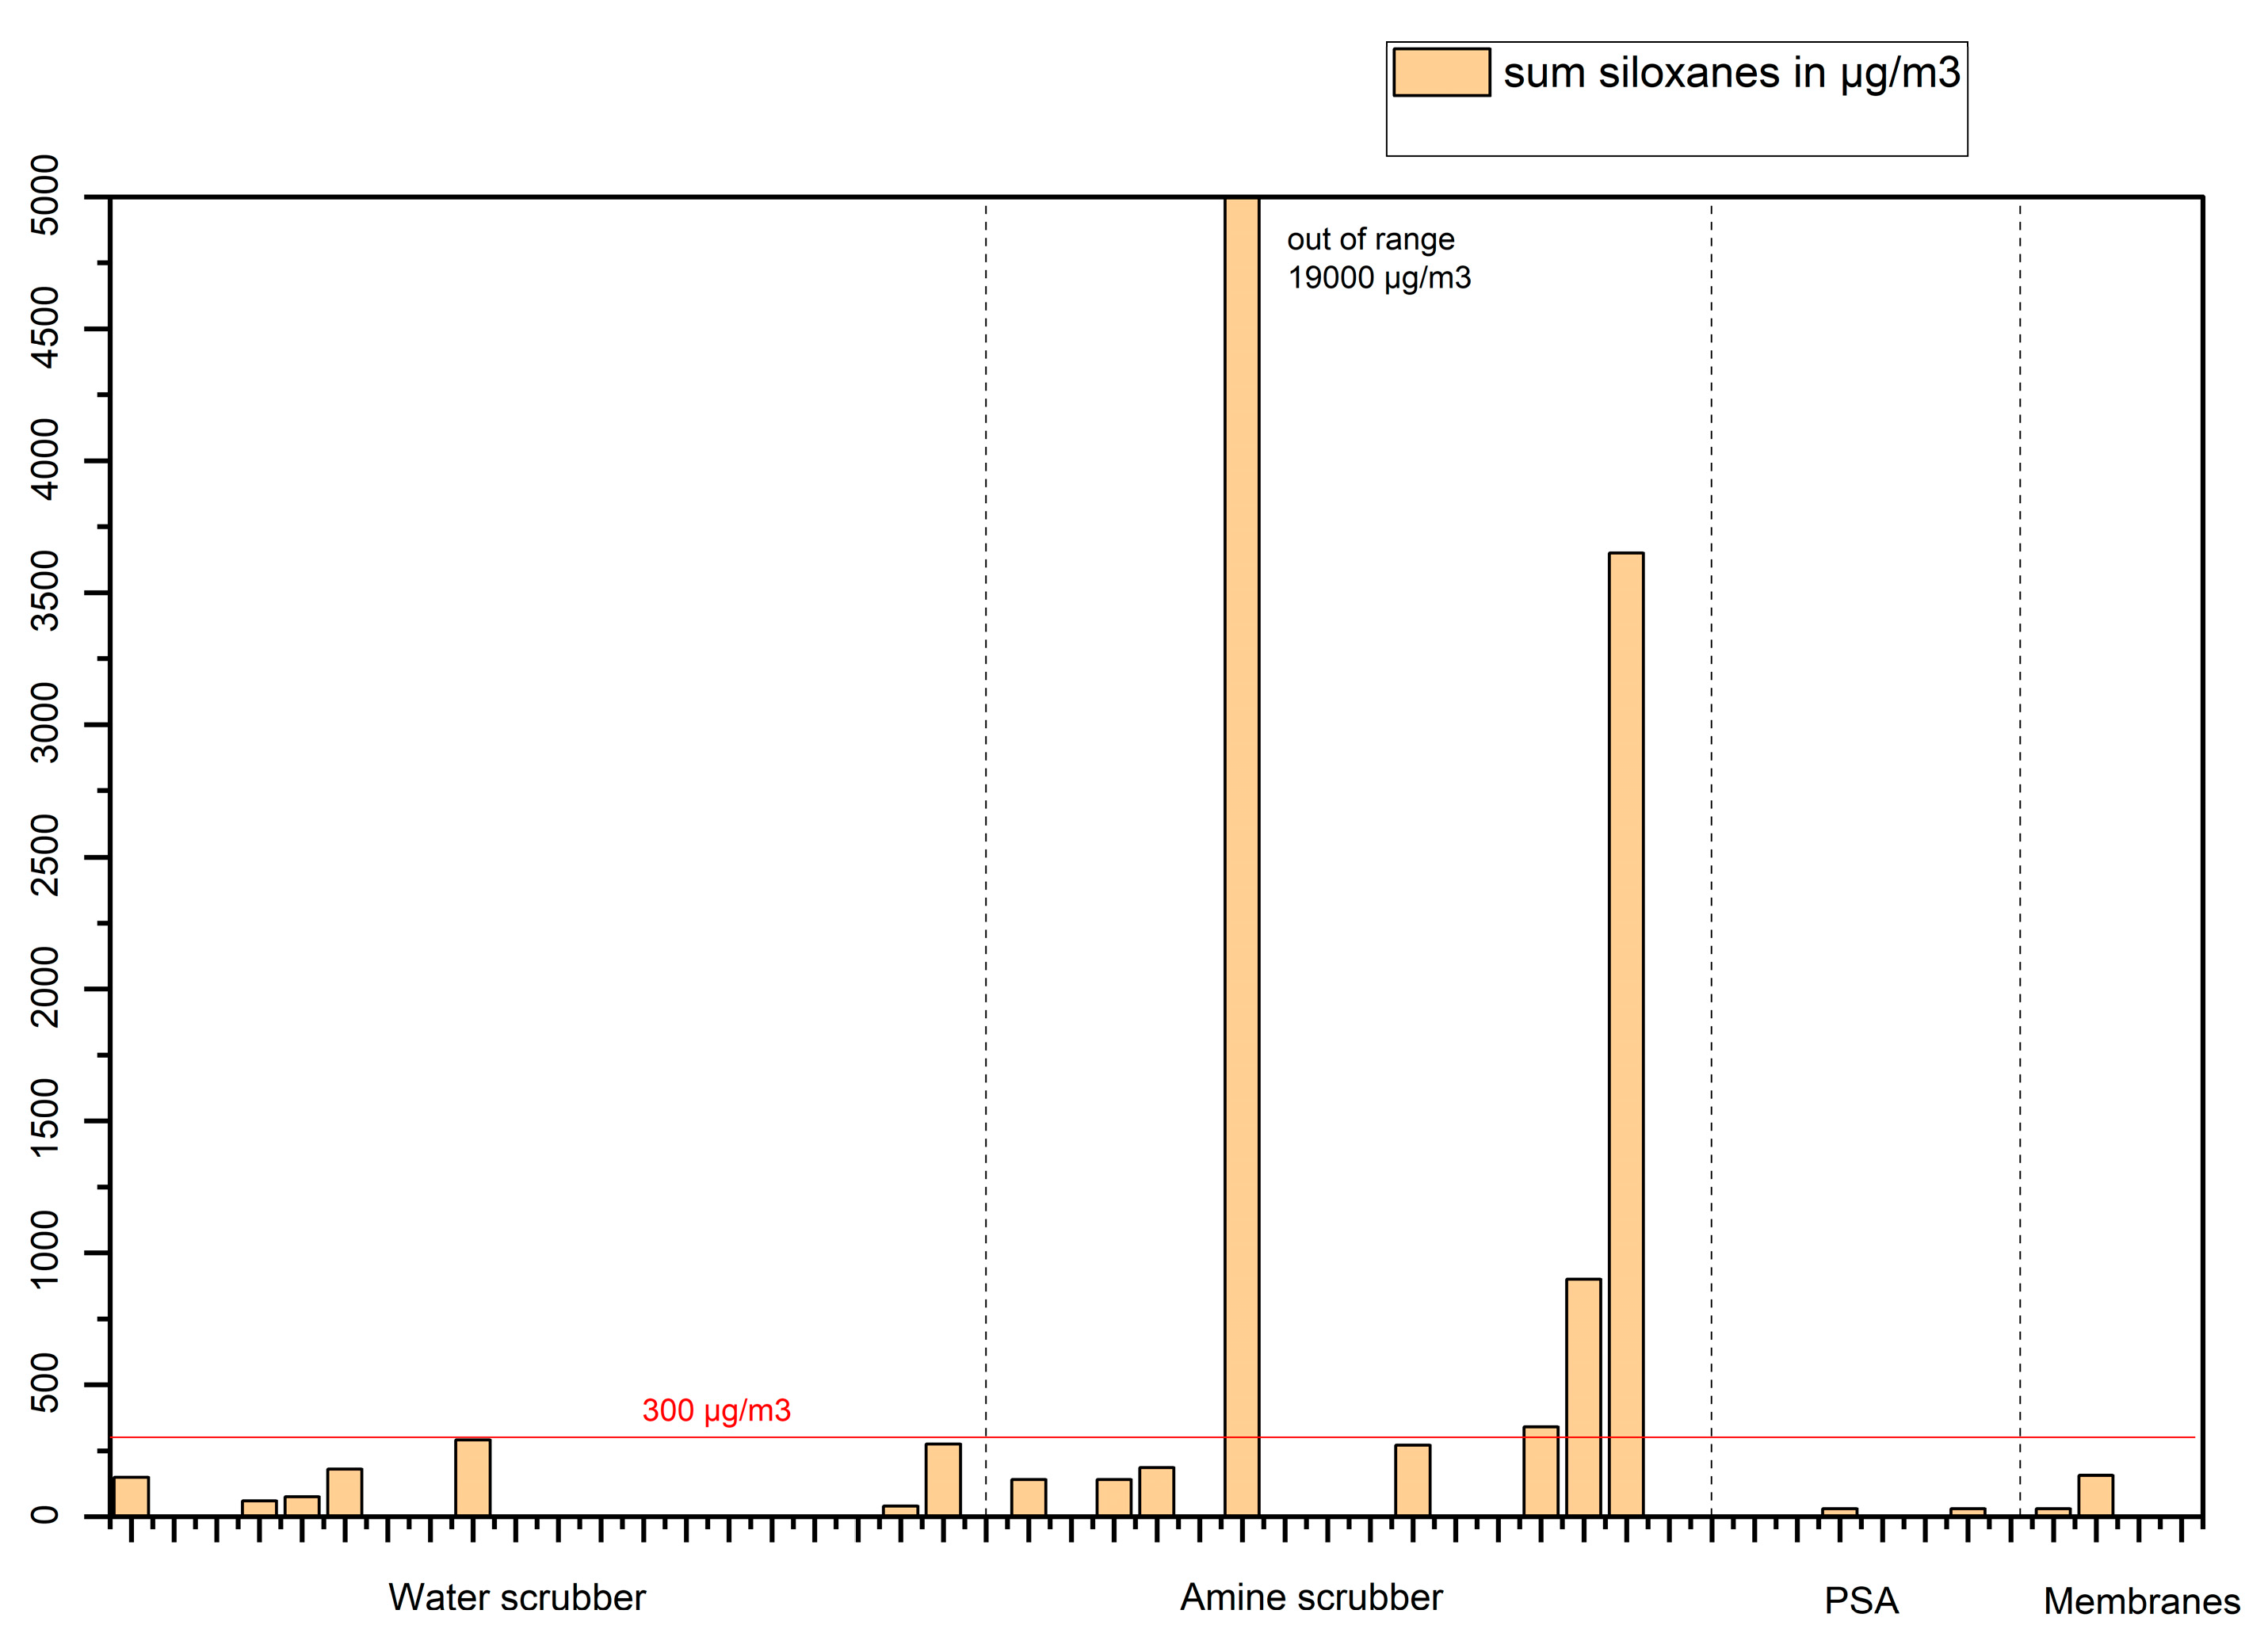
Figure 15.
Sum organic sulphur and tetrahydrothiophene concentrations in µg/m3 in biomethane produced from food wastes with different upgrading techniques.
Figure 15.
Sum organic sulphur and tetrahydrothiophene concentrations in µg/m3 in biomethane produced from food wastes with different upgrading techniques.
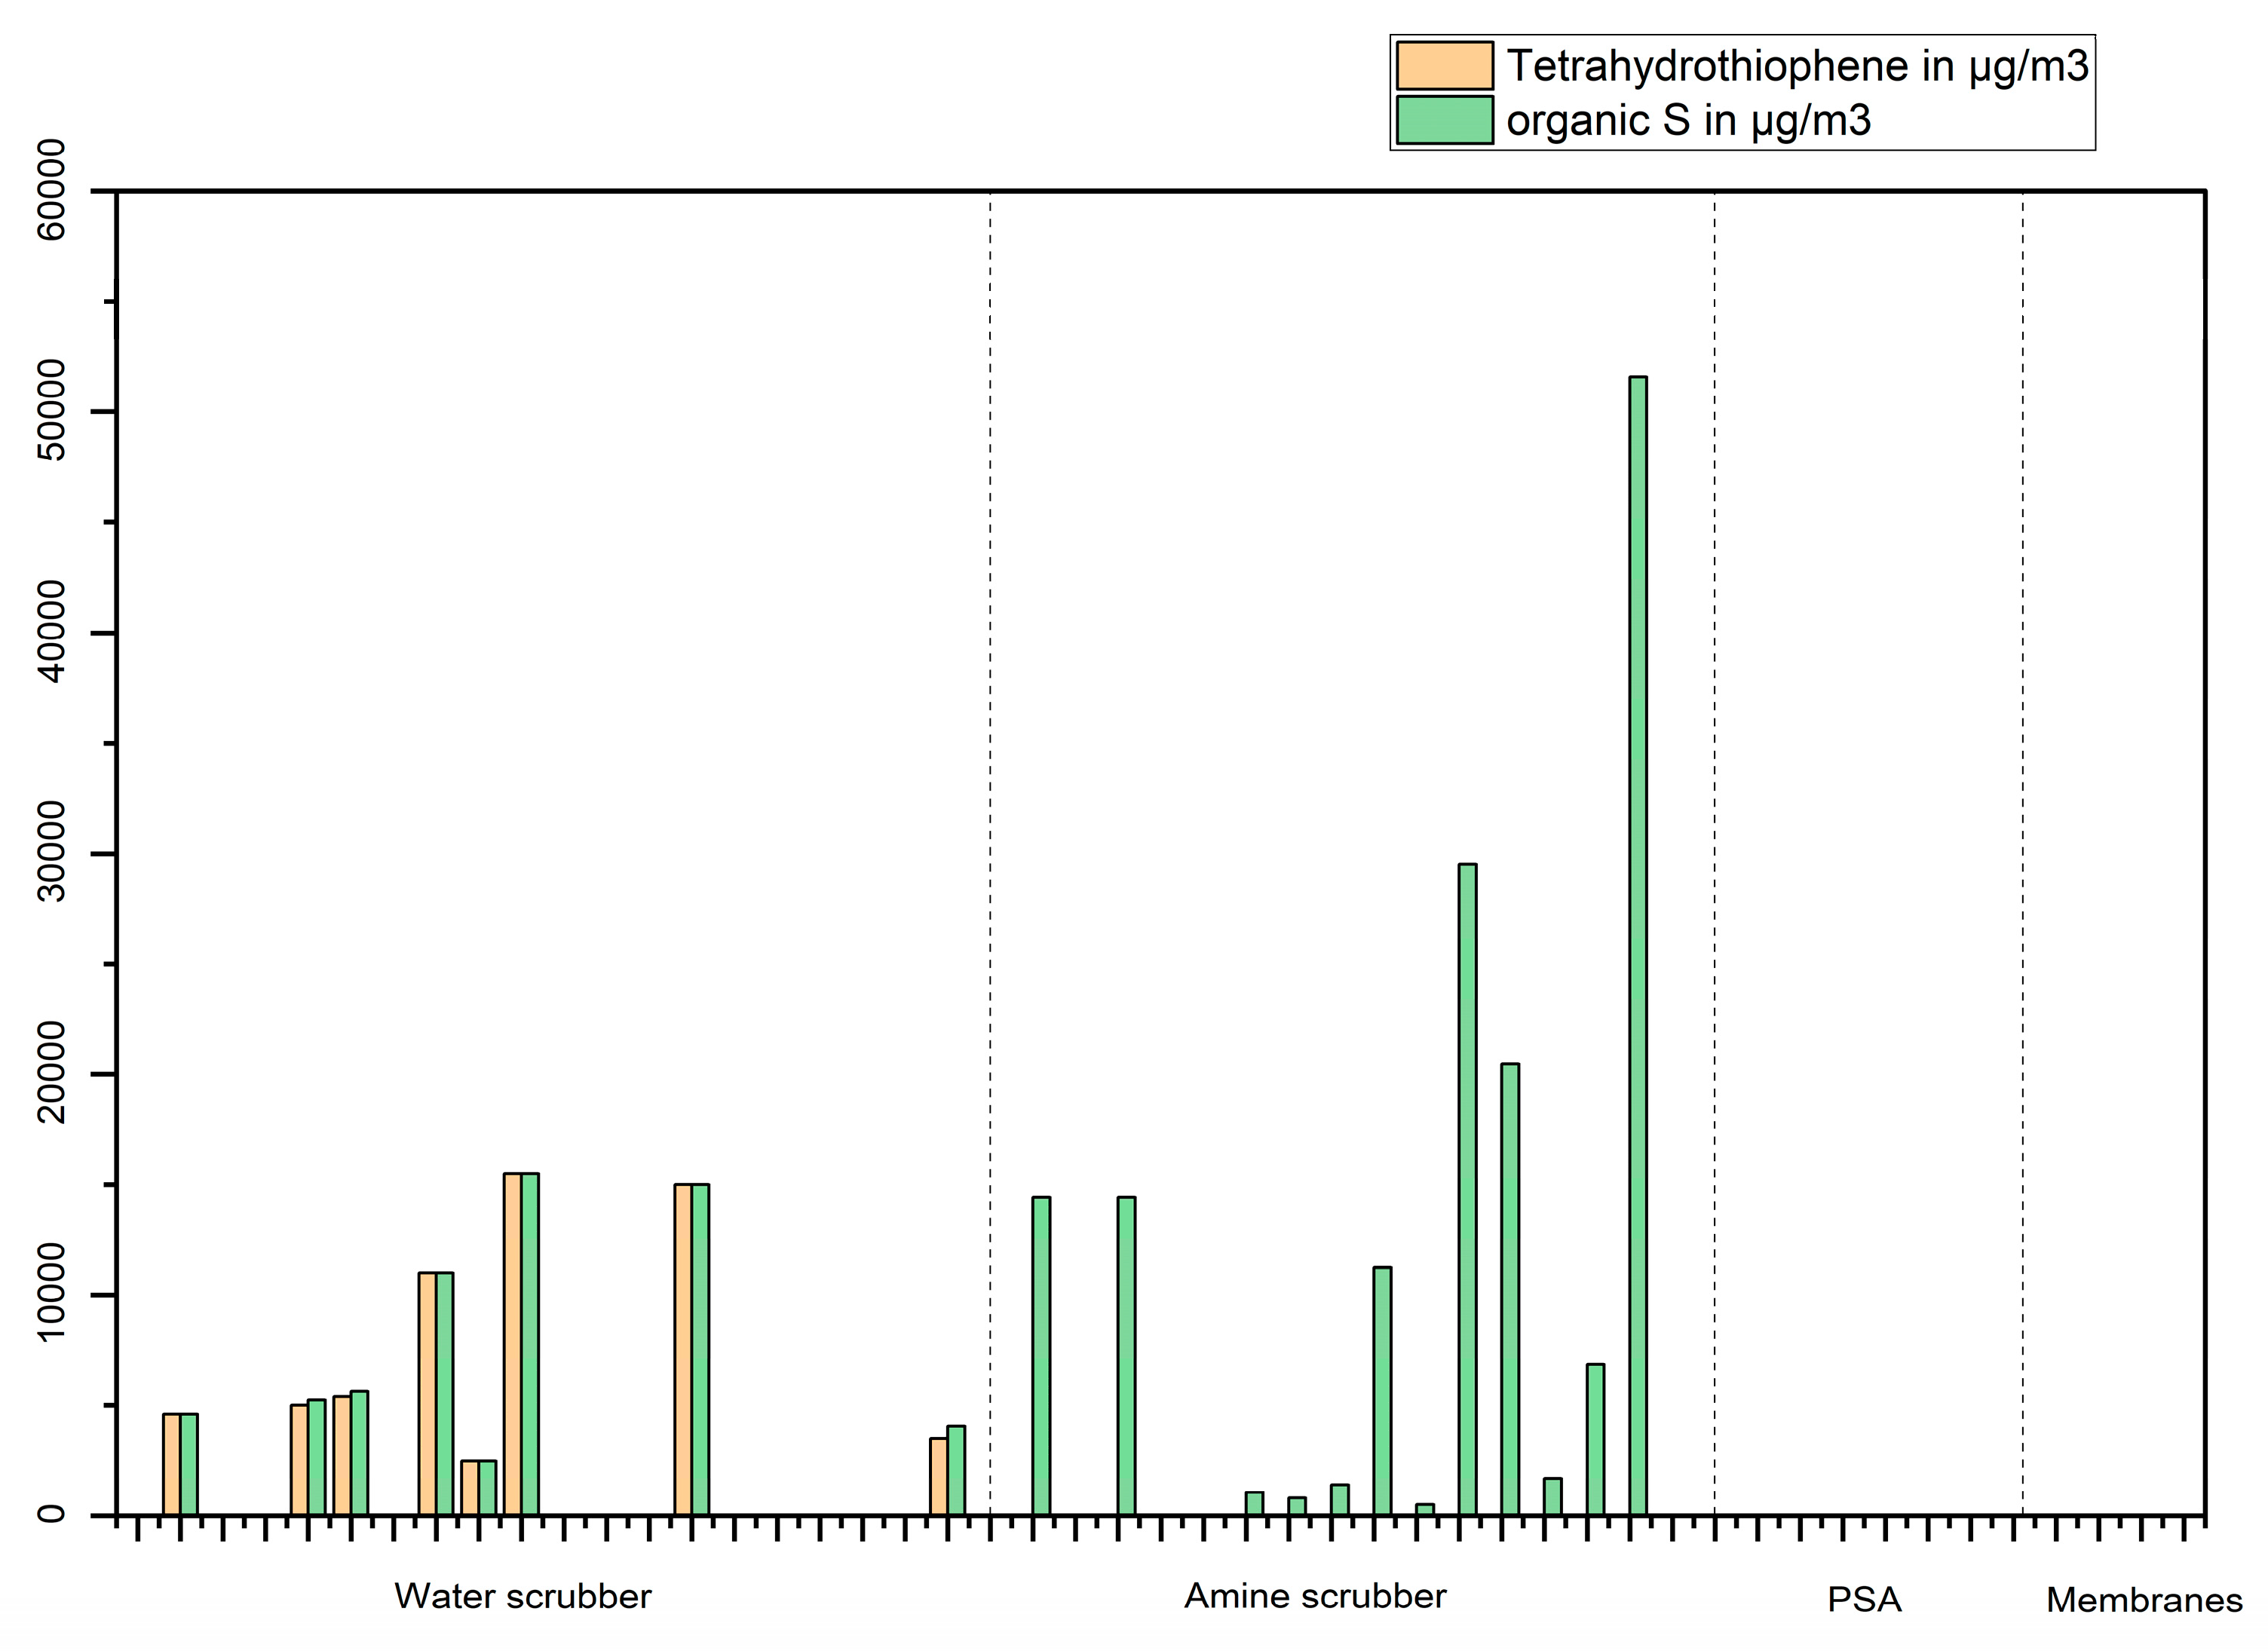
Figure 16.
2-butanone concentration in µg/m3 in biomethane produced from food wastes with different upgrading techniques.
Figure 16.
2-butanone concentration in µg/m3 in biomethane produced from food wastes with different upgrading techniques.
Disclaimer/Publisher’s Note: The statements, opinions and data contained in all publications are solely those of the individual author(s) and contributor(s) and not of MDPI and/or the editor(s). MDPI and/or the editor(s) disclaim responsibility for any injury to people or property resulting from any ideas, methods, instructions or products referred to in the content. |
© 2024 by the authors. Licensee MDPI, Basel, Switzerland. This article is an open access article distributed under the terms and conditions of the Creative Commons Attribution (CC BY) license (http://creativecommons.org/licenses/by/4.0/).
Copyright: This open access article is published under a Creative Commons CC BY 4.0 license, which permit the free download, distribution, and reuse, provided that the author and preprint are cited in any reuse.


