Preprint
Article

This version is not peer-reviewed.

Reliability and Validity Measures of the Patellofemoral Subscale Koos-Pf in the Greek Patients with Patellofemoral Pain

A peer-reviewed article of this preprint also exists.

Submitted:

13 December 2024

Posted:

16 December 2024

You are already at the latest version

Abstract

Background: Patellofemoral pain (PFP) is one of the most common multifactorial musculoskeletal pathologies affecting the knee joint. The prevalence of PFP in the general population ranges from 11% to 17%, with higher rates observed in specific groups such as females, runners, military personnel, and young athletes. To assess symptoms associated with PFP, the Patellofemoral subscale (KOOS-PF) was developed, consisting of 11 questions that evaluate pain, stiffness, and quality of life. The KOOS-PF scale has already been validated and shown to be reliable in both Spanish and Arabic. Objectives: The aim of this study was to assess the reliability and validity of the KOOS-PF scale in the Greek language among the Greek population with Patellofemoral pain. Methods: Fifty-five participants aged 18-65 years who suffered from PFP were evaluated in two phases on the 1st and 3rd days regarding the reliability and validity of the measures of KOOS-PF in the Greek language. Construct validity was assessed using the Knee Outcome Survey scale - Activities of Daily Living Scale (KOS-ADLS). Reliability was measured through Repeated measurements (test-retest) using intraclass coefficient correlation (ICC), standard error (SEM) and smallest detectable change (SDD. Internal consistency was evaluated using Cronbach’s coefficient a. The significance level was set at 5% (α=0.05). Results: The KOOS-PF measures showed high internal consistency reliability (Cronbach's alpha 0.87, p=0.05) and high test-retest reliability (ICC=0.95, p=0.05, SEM= 3.7, SDC=13.57). Additionally, the Greek version of the KOOS-PF exhibited high construct validity when correlated with the KOS-ADLS scale (r=0.72, p=0.001). Conclusions: The KOOS-PF scale was displayed high reliability and construct validity for measuring Patellofemoral pain in the Greek population.

Keywords: 
;  ;  ;  

1. Introduction

Patellofemoral pain (PFP) is one of the most common multifactorial musculoskeletal conditions. It is defined as pain originating from the patellofemoral joint or surrounding soft tissues in individuals, regardless of tissue damage [1]. PFP typically worsens during activities that stress the joint, such as deep squats, running, jumping, or climbing stairs [1,2,3].
The prevalence of PFP is significant, affecting approximately 23% of the general population and impacting specific groups, such as adolescent athletes, where 25% discontinue sports activities. This can lead to serious consequences, including musculoskeletal issues like osteoarthritis and a reduced quality of life, affecting their ability to perform daily activities [4,5]. PFP is more common in specific population groups, including females, runners, military personnel, and young athletes, negatively impacting not only musculoskeletal health but also overall quality of life, as described by the biopsychosocial model [1,6].
Several tools have been developed to evaluate patellofemoral pain (PFP) including the Kujala score, the Patellofemoral Pain Syndrome Severity Scale (PPSSS) [7,8] and the Patellofemoral subscale and Osteoarthritis Outcome Score (KOOS-PF) [9]. The KOOS-PF scale is widely recognized and has been validated in both Spanish and Arabic [10,11]. However, there is no validation of the KOOS-PF scale in the Greek language for the in the Greek population suffering with patellofemoral pain.
The aim of this study was to assess the reliability and validity of the KOOS-PF scale in Greek among the Greek population with Patellofemoral pain.

2. Materials and Methods

This study evaluated the validity and reliability of the Patellofemoral scale (KOOS-PF) for the Greek population following the standard guidelines by [12]. It has been approved by the Ethics Committee of the University of West Attica (No. 68323).

2.1. Participants

Fifty-nine (59) patients aged 18 to 65 years participated in this study, all diagnosed with patellofemoral pain. The inclusion criteria for the study were: a) anterior knee pain diagnosed by the same orthopedic surgeon; b) pain during functional activities in the patellofemoral joint, assessed by a VAS scale of >5-6, which worsened with activities such as squatting, climbing/descending stairs, and running; and c) a duration of pain exceeding 3 months [9]. The exclusion criteria included: a) pathological conditions such as stage 3 or higher knee osteoarthritis or recent surgeries (e.g., knee arthroplasty); b) other pathological conditions; and c) an inability to understand the Greek language.

2.2. Procedure

2.2.1. Translation

Permission has been given from the main authors of the KOOS-PF subscale, [13] to translate it into the Greek. The original version includes 11 self-assessment questions which have been categorized in three groups: stiffness, pain and quality of life. Every question has five possible answers. Each answer has a numeric value from 0 to 4. The final score is on a 0–100 scale, where 0 is the worst health score and 100 represent the best. The following steps were used in the translation:
  • Initial translation: A bilingual expert translated the KOOS-PF scale from English to Greek ensuring that the knowledge of medical terminology.
  • Back- translated: Another bilingual expert translated the Greek version back into English to check for consistency with the original text.
  • Expert Review: A panel of researchers and clinicians reviewed both the Greek and back-translated English versions to ensure that the meaning and context were preserved.
  • Pre-testing: The translated questionnaire was administered to a small group of Greek-speaking individuals to assess clarity and relevance.
Final Adjustments: Based on feedback from the pre-testing phase, necessary revisions were made to improve comprehension and cultural appropriateness.
5.
Final Adjustments: Based on feedback from the pre-testing phase, necessary revisions were made to improve comprehension and cultural appropriateness.
6.
Approval: The final Greek version was submitted to the main authors [13] for approval to ensure fidelity to the original subscale.

2.3. Outcome Measures

2.3.1. Visual Analog Scale (VAS)

The VAS scale was administered to the patients during their demographic data collection to describe their pain experience [14].

2.3.2. Patellofemoral Subscale (KOOS-PF)

The KOOS-PF subscale was administered twice to the patients, on the first and third days to evaluate the reliability of the measurements [11,15,16]. The final score was calculated by taking the mean score of the 11 questions, dividing it by the maximum possible score for each question ranging from 0-100, where 0 indicates the worst health status and 100 indicates the best using the following formula: Final score=100 – [(average score ΕΠ1-ΕΠ11)/4 * 100].

2.3.3. Knee Outcome Survey-Activities of Daily Living Scale (KOS-ADLS)

The KOS-ADLS was administered on the first day simultaneously with the KOOS-PF subscale to ensure construct validity of the KOOS-PF scale [15,16]. The KOS-ADLS was used with the official permission of the authors who were validated it in Greek [17]. This scale consists of 14 questions that evaluate the symptoms of the knee joint pathology, and the functional limitations experienced during daily activities.

2.4. Psychometric Assessment

2.4.1. Reliability

Reliability was assessed through internal consistency, test-retest reliability, Standard Error of Measurement (SEM), and Smallest Detectable Difference (SDD) [18]. Internal consistency, evaluated through Cronbach’s alpha, measures in regard assessing whether the items are aligned with the same construct. Test-retest reliability was evaluated across time intervals, and it was quantified through the Intraclass Correlation Coefficient (ICC). The Standard Error of Measurement (SEM) assessed how precise the individual scores were while accounting for measurement error, and the Smallest Detectable Difference (SDD) represented the smallest score difference that indicated an actual change rather than one due to measurement error [19].

2.4.2. Construct Validity

The construct validity of the KOOS-PF scale was evaluated through convergent validity, which examines the degree of the KOOS-PF baseline scores when they were correlated with the KOS-ADL scores using the correlation coefficient method [20].

2.5. Statistical Analysis

Data analysis was conducted using Stata 18.0 (Anon n.d.). For the description of the demographics and baseline data, we reported the mean value, the Standard Deviation (SD), the median value, the first (Q1) and third (Q3) quartile, and the absolute and relative frequencies, as applicable. For the psychometric measurements, we reported the point estimates, the 95% Confidence Intervals (95% CI), and the respective p-values, as applicable. Precision was set to one decimal for the baseline and demographic data description, two for the psychometric measurements, and three for the p-values and four for the factor analysis results. To be consistent with the benchmarks of the subject-to-item ratio method [21], we opted for a ratio of five participants per item [22]. Initially, Exploratory Data Analysis (EDA) was conducted to explore the data distribution and characteristics [23]. The benchmark values and interpretation of Cronbach’s alpha [24], ICC [25], and the correlation coefficient [26] are demonstrated in Table 1. Regarding SEM and SDD, lower values indicate higher reliability [27]. Normality of the KOOS-PF, the VAS, and the KOS-ADL was evaluated through the Shapiro-Wilk test [28] to select the appropriate correlation coefficient for quantifying the convergent validity of the KOOS-PF. Floor and ceiling (F/C) effects were categorized as significant (≥15%), moderate (10% to <15%), minor (5% to <10%), or negligible (<5%) [29]. Data was tested for suitability for factor analysis through the inter-item correlations, the determinant of the correlation matrix, the Kaiser-Meyer-Olkin (KMO) statistic, and Bartlett’s test; inter-item correlations should lie between 0.30 and 0.90, the determinant was acceptable if greater than 0.00001, acceptable KMO values were values above 0.50, and Bartlett’s test was considered significant if p-value was smaller than 0.50. To identify the number of factors to extract, both the Kaiser criterion (eigenvalues greater than 1) and the scree plot method were applied [30]. Factor loadings were evaluated based on thresholds of ≥0.32 for acceptable communalities, ≥0.5 for moderate communalities, and ≥0.8 for high communalities. A minimum of 60% variance was deemed acceptable to account for the total item variance [31]. The statistical significance was pre-specified at p<0.05.

3. Results

Fifty-five (55) patients, primarily women (N=31, 54.6%), with an established diagnosis of patellofemoral pain, aged from 18 to 65 years old (mean age=38.9, SD=14.8), participated in the study. The participants’ average duration of patellofemoral pain was 7.5 (SD=10.7) months, and the average pain intensity was 7/10 (SD=0.9). The mean baseline KOOS-PF score was 36.3 (SD=16.6). The EDA revealed no missing data across all variables. The demographics and baseline data are demonstrated in Table 2.

3.1. Reliability

The Cronbach’s alpha point estimate was 0.87 (95% CI: 0.85 to 0.93, p-value<0.001), the ICC was 0.95 (95% CI: 0.71 to 0.99, p-value<0.001), the SEM was 3.7, and the SDD 13.6. All reliability measurements ranged from good to excellent, indicating a robust reliability of the Greek version of the KOOS-PF scale. The results are demonstrated in Table 3.

3.2. Construct Validity

Construct validity was assessed by evaluating convergent validity between the baseline scores of the KOOS-PF, the VAS for pain [31], and the KOS-ADL, since the KOOS-PF theoretically measures constructs related to those captured by the VAS and KOS-ADL. The correlations between the scales were analyzed through the appropriate correlation coefficient [20]. The validity assessment results demonstrated a high positive linear correlation between the KOOS-PF and Greek KOS-ADL scores (r = 0.72, 95% CI: 0.57 to 0.83, p-value<0.001) and a moderate negative linear correlation between the KOOS-PF and the VAS scores (r = -0.64, 95% CI: -0.45 to -0.77, p-value<0.001) supporting the construct validity of the KOOS-PF scale in this context. The results of construct validity are presented in Table 4.

3.3. Structural Validity

Factor analysis was used to model the relationships among the observed variables using latent variables, the factors; Exploratory Factor Analysis (EFA) was the method of choice as no strong a priori hypothesis for the interrelations between the variables and the factors is available [32].

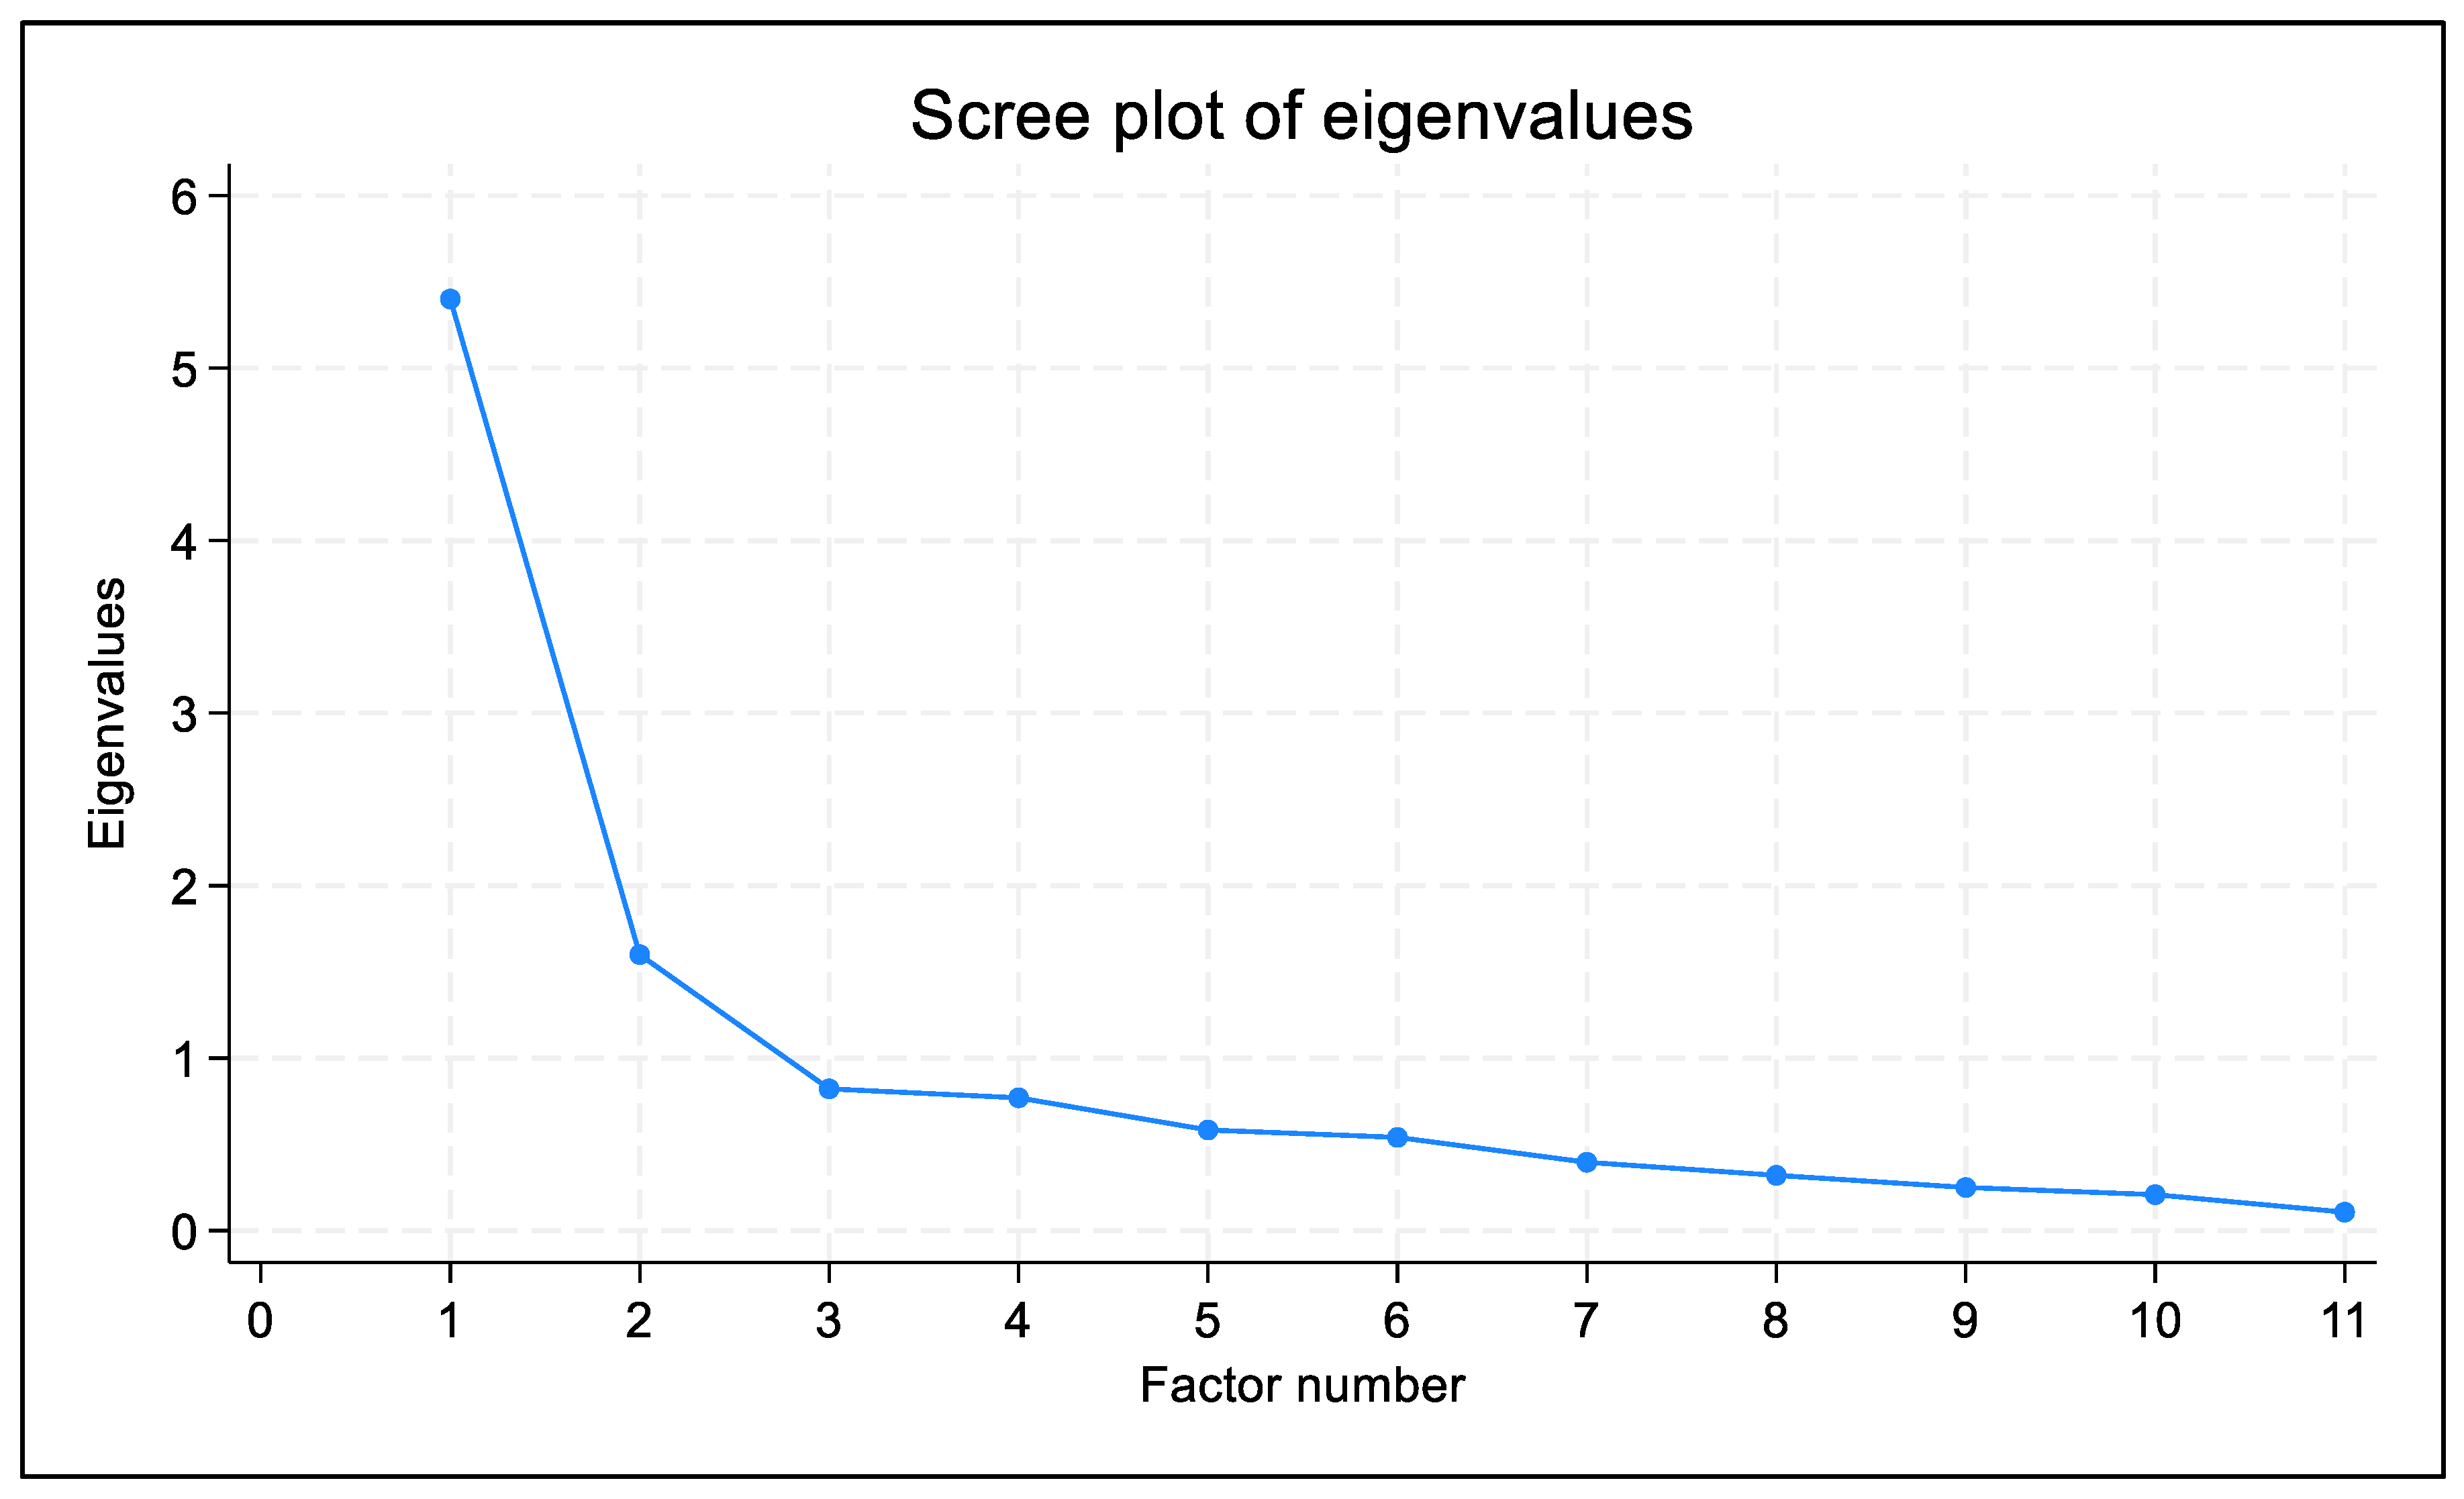
3.4. Factorial Validity

Table 5 demonstrates the results of the inter-item correlation matrix. The KMO statistic was 0.826, Bartlett’s test of sphericity was significant (n<0.001), and the determinant was 0.001, disproving multicollinearity. The lowest correlation was observed between items 1 and 8 (0.0529), while the highest was found between items 5 and 6 (0.8323). No correlations exceeded 0.9, but numerous were found below the lower threshold (0.3), primarily related to items 8 and 9. Given that the above-mentioned global tests indicate factorability and that factor analysis is used in an exploratory basis in our research, we decided to proceed with the EFA, accommodating the varying inter-item correlations, through the Principal Axis Factoring (PAF) model [33].
The results of the PAF analysis are presented in Table 6. Two factors were retained, which explained 74% of the total variance; factor 1 explains 46.58% of the variance, and Factor 2 explains 27.42%. The moderate correlation (0.6103) between the factors suggests a meaningful but distinct relationship, supporting the use of oblique rotation [34]. Based on the Kaiser criterion and the scree plot (Figure 1) the two-factor model is the best representation of the 11-item Greek version of the KOOS-PF. The rotated factor loadings indicated that most variables related to everyday activities (items 1, 2, 3, 4, 5, 6, 10, 11) load highly on Factor 1. This suggests that Factor 1 could represent the construction of general physical function in everyday activities. In contrast, the two items related to jogging and running (items 8 & 9) had strong loadings on Factor 2, indicating that Factor 2 could capture a dimension of sport-related activities.

3.5. Floor and Ceiling Effects

Floor and ceiling (F/C) effects were evaluated through the percentage of respondents achieving the lowest (floor) or highest (ceiling) possible scores in a domain. High F/C effects, defined by a significant proportion of respondents scoring the lowest or highest possible values, indicate limited instrument range, measurement inaccuracy, and response bias, compromising the questionnaire’s performance. Historically, F/C effects above 15% are considered significant, though some recommend stricter thresholds for optimal sensitivity [29]. None of the subjects reached the worst or the best possible score, therefore the KOOS-PF demonstrated no F/C effects. The results are summarized in Table 7.

4. Discussion

The aim of this study was to assess the reliability and validity of the KOOS-PF scale in Greek among the Greek population with patellofemoral pain. The reliability measurements showed findings indicating scores ranging from above average to excellent, demonstrating a robust reliability of the Greek version of the KOOS-PF scale. Cronbach’s alpha point estimate was found to be 0.87, while the ICC was found to be 0.95, and regarding SEM and SDD values were lower indicating the high reliability of the KOOS-PF in Greek (Table 2). Evidently, all measurements were pertained to reliability were above average to excellent, indicating a robust reliability of the Greek version of the KOOS-PF scale.
These findings provided the internal consistency of the KOOS-PF scale in Greek, ensuring almost similar painful situations in terms of quality of life of Greek patients suffering from patellofemoral pain. However, our findings (Cronbach’s alpha 0.87) agreed with the original version (Cronbach’s alpha 0.86) [13] and, as well as with the Arabic language version (Cronbach’s alpha 0.81) [21], while in Spanish the internal consistency scores were the highest (Cronbach’s alpha 0.93) [11]. Overall, all the above results confirm the consistent way of using this scale in different cultural populations.
The excellent reliability of the Greek version of the KOOS-PF describes the ability of the scale to perform accurately and consistently well. In the Greek and Arabic languages, the reliability of this scale was quite similar and in these languages the time estimate between repeated measurements was the same at 48 hours, even in the Spanish and the original version their reliability was assessed at 1 and 2 weeks also having high values [11]. In addition, all the above studies showed lower SEM and SDD values as in the Greek version, indicating the clarity and precision of the questions contained in the KOOS-PF scale regarding the good understanding of the patients’ knowledge.
The construct validity of the KOOS-PF scale was assessed through convergent validity showing a high positive linear correlation between KOOS-PF and KOS-ADL scores (r = 0.72) and a moderate negative linear correlation between KOOS-PF and VAS scores (r = -0.64). These findings support the construct validity of the KOOS-PF scale in this context for use in the Greek version (Table 4). Therefore, the KOOS-PF did not show floor/ceiling effects of patients’ scores, indicating no limited instrument range, measurement inaccuracy and response bias, compromising the performance of the KOOS-PF scale in terms of use in Greek (Table 5).
Our findings are consistent with previous validity studies in Spanish (r= 0.71), the original version (r= 0.74), and Arabic, although the validity score was lower (r=0.57) than ours [11]. Therefore, considering that the KOS-ADL questionnaire is already validated for its reliability and validity, we considered that since the participants answer in almost the same way to similar questions of the two tools, it means that experience what they describe (pain, stiffness, quality reduction life) to the extent that they describe them.
Regarding the results of the exploratory data analysis of the KOOS-PF scale indicated that there was insufficient sample adequacy, as the Kaiser–Meyer–Olkin (KMO) statistic was less than 0.70 to conduct confirmatory factor analysis [35,36]. According to Kaiser’s criterion [37], the selection of factors that could be used to explain variance was performed based on the criteria of factors that explained a significant percentage of variance (70-80% in total) and had an eigenvalue >1, indicating that this value is very good for use in statistical analysis (Figure Y). However, eight items (1, 2, 3, 4, 5, 6, 10, 11) showed high loading and communalities at the appropriate range (above 0.30). The decision to retain a single-factor solution was further supported by the scree plot. Subsequently, the above 8 items were used for exploratory factor analysis, with a pre-hypothesized single factor. Loadings and item communalities of the 8 items are presented in Table 6.
Regarding the factors mentioned above indicated that most variables related to everyday activities (items 1, 2, 3, 4, 5, 6, 10, 11) load highly on Factor 1, it appeared that almost all questions of the KOOS-PF scale were either positively or negatively correlated with related activities, such as heavy household chores, jumping, running, and kneeling, along with corresponding symptoms like stiffness and pain during participation (Table 7). This suggests that Factor 1 could represent the construction of general physical function in everyday activities. The correlation of these factors indicated the patients’ self-efficacy in their actions and management.
In contrast, the two items related to jogging and running (items 8 & 9) had strong loadings on Factor 2, indicating that Factor 2 could capture a dimension of sport-related activities. This two-factor model supports the differentiation between general physical activities and more specific activities like jogging and running. The findings of this validity and reliability study will be further analyzed when the sample size of patients is larger, allowing for confirmatory factor analysis. Therefore, future studies should involve larger sample size and specific populations, such as athletes, soldiers, and female in Greece.

5. Conclusions

In conclusion, the KOOS-PF scale in Greek appears to be valid and reliable, providing clinical researchers with an effective evaluation tool for patients with Patellofemoral Pain.

Author Contributions

Conceptualization, Μ.P. and I.M.; methodology, M.P., I.M., E.B., E.P., G.P.; software, E.B.; validation, M.P., I.M., E.B., E.P., G.P., and G.K.; formal analysis, M.P., I.M., E.B.; investigation, I.M.; resources, Μ.P. and I.M.; data curation, M.P., I.M., E.B., E.P., G.P..; writing—original draft preparation, Μ.P. and I.M.; writing—review and editing, E.B., E.P., G.P., and G.K.; visualization, E.B., E.P., G.P., and G.K.; supervision, M.P.; project administration, M.P. All authors have read and agreed to the published version of the manuscript.

Funding

This research received no external funding.

Institutional Review Board Statement

The study was conducted in accordance with the Declaration of Helsinki, and approved by the Ethics Committee of the University of West Attica (No. 68323).

Informed Consent Statement

Informed consent was obtained from all subjects involved in the study.

Data Availability Statement

Dataset available on request from the corresponding author. The data are not publicly available due to privacy or ethical restrictions.

Conflicts of Interest

The authors declare no conflicts of interest.

References

  1. Smith, B.E.; Selfe, J.; Thacker, D.; Hendrick, P.; Bateman, M.; Moffatt, F.; Rathleff, M.S.; Smith, T.O.; Logan, P. Incidence and prevalence of patellofemoral pain: A systematic review and meta-analysis. PLoS ONE 2018, 13, e0190892. [Google Scholar] [CrossRef] [PubMed]
  2. Crossley, K.M.; van Middelkoop, M.; Callaghan, M.J.; Collins, N.J.; Rathleff, M.S.; Barton, C.J. 2016 Patellofemoral pain consensus statement from the 4th International Patellofemoral Pain Research Retreat, Manchester. Part 2: Recommended physical interventions (exercise, taping, bracing, foot orthoses and combined interventions). British journal of sports medicine 2016, 50, 844–852. [Google Scholar] [CrossRef] [PubMed]
  3. Petersen, W.; Ellermann, A.; Gösele-Koppenburg, A.; Best, R.; Rembitzki, I.V.; Brüggemann, G.-P.; Liebau, C. Patellofemoral pain syndrome. Knee surgery sports traumatology arthroscopy 2014, 22, 2264–2274. [Google Scholar] [CrossRef] [PubMed]
  4. Bricca, A.; Juhl, C.B.; Steultjens, M.; Wirth, W.; Roos, E.M. Impact of exercise on articular cartilage in people at risk of, or with established, knee osteoarthritis: A systematic review of randomised controlled trials. British journal of sports medicine 2019, 53, 940–947. [Google Scholar] [CrossRef] [PubMed]
  5. Wallis, J.A.; Roddy, L.; Bottrell, J.; Parslow, S.; Taylor, N.F. A systematic review of clinical practice guidelines for physical therapist management of patellofemoral pain. Physical therapy 2021, 101, pzab021. [Google Scholar] [CrossRef]
  6. Nascimento, L.R.; Teixeira-Salmela, L.F.; Souza, R.B.; Resende, R.A. Hip and knee strengthening is more effective than knee strengthening alone for reducing pain and improving activity in individuals with patellofemoral pain: A systematic review with meta-analysis. journal of orthopaedic sports physical therapy 2018, 48, 19–31. [Google Scholar] [CrossRef] [PubMed]
  7. Papadopoulos, C.; Constantinou, A.; Cheimonidou, A.-Z.; Stasinopoulos, D. Greek cultural adaption and validation of the Kujala anterior knee pain scale in patients with patellofemoral pain syndrome. Disability and rehabilitation 2017, 39, 704–708. [Google Scholar] [CrossRef] [PubMed]
  8. Papadopoulos, C.; Nardi, L.; Antoniadou, M.; Stasinopoulos, D. Greek adaptation and validation of the patellofemoral pain syndrome severity scale. Hong Kong Physiotherapy Journal 2013, 31, 95–99. [Google Scholar] [CrossRef]
  9. Crossley, K.M.; Macri, E.M.; Cowan, S.M.; Collins, N.J.; Roos, E.M. The patellofemoral pain and osteoarthritis subscale of the KOOS (KOOS-PF): Development and validation using the COSMIN checklist. British journal of sports medicine 2018, 52, 1130–1136. [Google Scholar] [CrossRef] [PubMed]
  10. Ateef, M. Measurement properties of the knee injury and osteoarthritis outcome score patello-femoral questionnaire in saudi arabians. PeerJ 2020, 8, e9323. [Google Scholar] [CrossRef]
  11. Martinez-Cano, J.P.; Vernaza-Obando, D.; Chica, J.; Castro, A.M. Cross-cultural translation and validation of the Spanish version of the patellofemoral pain and osteoarthritis subscale of the KOOS (KOOS-PF). BMC Research Notes 2021, 14, 220. [Google Scholar] [CrossRef] [PubMed]
  12. Beaton, D.E.; Bombardier, C.; Guillemin, F.; Ferraz, M.B. Guidelines for the process of cross-cultural adaptation of self-report measures. Spine 2000, 25, 3186–3191. [Google Scholar] [CrossRef] [PubMed]
  13. Roos, E.M.; Roos, H.P.; Lohmander, L.S.; Ekdahl, C.; Beynnon, B.D. Knee Injury and Osteoarthritis Outcome Score (KOOS)--development of a self-administered outcome measure. J Orthop Sports Phys Ther 1998, 28, 88–96. [Google Scholar] [CrossRef]
  14. Delgado, D.A.; Lambert, B.S.; Boutris, N.; McCulloch, P.C.; Robbins, A.B.; Moreno, M.R.; Harris, J.D. Validation of digital visual analog scale pain scoring with a traditional paper-based visual analog scale in adults. JAAOS Global Research Reviews 2018, 2, e088. [Google Scholar] [CrossRef]
  15. Terwee, C.B.; Bot, S.D.; de Boer, M.R.; Van der Windt, D.A.; Knol, D.L.; Dekker, J.; Bouter, L.M.; de Vet, H.C. Quality criteria were proposed for measurement properties of health status questionnaires. Journal of clinical epidemiology 2007, 60, 34–42. [Google Scholar] [CrossRef] [PubMed]
  16. Heale, R.; Twycross, A. Validity and reliability in quantitative studies. Evidence-based nursing 2015, 18, 66–67. [Google Scholar] [CrossRef]
  17. Kapreli, E.; Panelli, G.; Strimpakos, N.; Billis, E.; Zacharopoulos, A.; Athanasopoulos, S. Cross-cultural adaptation of the Greek version of the Knee Outcome Survey–activities of Daily Living Scale (KOS-ADLS). The Knee 2011, 18, 424–427. [Google Scholar] [CrossRef]
  18. van de Graaf, V.A.; Wolterbeek, N.; Scholtes, V.A.; Mutsaerts, E.L.; Poolman, R.W. Reliability and validity of the IKDC, KOOS, and WOMAC for patients with meniscal injuries. The American journal of sports medicine 2014, 42, 1408–1416. [Google Scholar] [CrossRef] [PubMed]
  19. Kim, S.H.; Park, Y.-B.; Song, M.-K.; Lim, J.-W.; Lee, H.-J. Reliability and validity of the femorotibial mechanical axis angle in primary total knee arthroplasty: Navigation versus weight bearing or supine whole leg radiographs. Knee surgery related research 2018, 30, 326. [Google Scholar] [CrossRef]
  20. Youssef, N.; Saleeb, M.; Gebreal, A.; Ghazy, R.M. The internal reliability and construct validity of the evidence-based practice questionnaire (EBPQ): Evidence from healthcare professionals in the Eastern Mediterranean Region. In Proceedings of the Healthcare, 2023; p. 2168.
  21. Alfadhel, S.A.; Vennu, V.; Alnahdi, A.H.; Omar, M.T.; Alasmari, S.H.; AlJafri, Z.; Bindawas, S.M. Cross-cultural adaptation and validation of the Saudi Arabic version of the Knee Injury and Osteoarthritis Outcome Score (KOOS). Rheumatology international 2018, 38, 1547–1555. [Google Scholar] [CrossRef]
  22. Anthoine, E.; Moret, L.; Regnault, A.; Sébille, V.; Hardouin, J.-B. Sample size used to validate a scale: A review of publications on newly-developed patient reported outcomes measures. Health and quality of life outcomes 2014, 12, 1–10. [Google Scholar] [CrossRef] [PubMed]
  23. Komorowski, M.; Marshall, D.; Salciccioli, J.; Crutain, Y. Exploratory Data Analysis. 2016; pp. 185–203.
  24. Taber, K.S. The Use of Cronbach’s Alpha When Developing and Reporting Research Instruments in Science Education. Research in Science Education 2018, 48, 1273–1296. [Google Scholar] [CrossRef]
  25. Bobak, C.A.; Barr, P.J.; O’Malley, A.J. Estimation of an inter-rater intra-class correlation coefficient that overcomes common assumption violations in the assessment of health measurement scales. BMC Med Res Methodol 2018, 18, 93. [Google Scholar] [CrossRef]
  26. Schober, P.; Boer, C.; Schwarte, L.A. Correlation Coefficients: Appropriate Use and Interpretation. Anesth Analg 2018, 126, 1763–1768. [Google Scholar] [CrossRef] [PubMed]
  27. Tighe, J.; McManus, I.; Dewhurst, N.G.; Chis, L.; Mucklow, J. The standard error of measurement is a more appropriate measure of quality for postgraduate medical assessments than is reliability: An analysis of MRCP (UK) examinations. BMC medical education 2010, 10, 1–9. [Google Scholar] [CrossRef]
  28. Kim, H.-Y. Statistical notes for clinical researchers: Assessing normal distribution (1). Restorative dentistry endodontics 2012, 37, 245–248. [Google Scholar] [CrossRef]
  29. Gulledge, C.M.; Smith, D.G.; Ziedas, A.; Muh, S.J.; Moutzouros, V.; Makhni, E.C. Floor and ceiling effects, time to completion, and question burden of PROMIS CAT domains among shoulder and knee patients undergoing nonoperative and operative treatment. JBJS Open Access 2019, 4, e0015. [Google Scholar] [CrossRef] [PubMed]
  30. Jacobs, N.; Berduszek, R.; Dijkstra, P.; Sluis, C. Validity and Reliability of the Upper Extremity Work Demands Scale. Journal of occupational rehabilitation 2017, 27. [Google Scholar] [CrossRef] [PubMed]
  31. Alzhrani, M. Knee Injury and Osteoarthritis Outcome Score Patellofemoral Questionnaire: Psychometric Properties among Females of Kingdom of Saudi Arabia. International Journal of Environmental Research and Public Health 2022, 19, 6058. [Google Scholar] [CrossRef]
  32. Flora, D.B.; LaBrish, C.; Chalmers, R.P. Old and new ideas for data screening and assumption testing for exploratory and confirmatory factor analysis. Frontiers in psychology 2012, 3, 55. [Google Scholar] [CrossRef]
  33. De Winter, J.C.; Dodou, D. Factor recovery by principal axis factoring and maximum likelihood factor analysis as a function of factor pattern and sample size. Journal of applied statistics 2012, 39, 695–710. [Google Scholar] [CrossRef]
  34. Zhang, G.; Hattori, M.; Trichtinger, L. Target Rotation With Both Factor Loadings and Factor Correlations. Psychological Methods 2018, 24, 390–402. [Google Scholar] [CrossRef] [PubMed]
  35. Thompson, C.G.; Kim, R.S.; Aloe, A.M.; Becker, B.J. Extracting the variance inflation factor and other multicollinearity diagnostics from typical regression results. Basic and Applied Social Psychology 2017, 39, 81–90. [Google Scholar] [CrossRef]
  36. Paraskevopoulos, E.; Christakou, A.; Karanasios, S.; Louka, A.P.; Pamboris, G.M.; Papandreou, M. Translation, Adaptation and Validation of the Greek Version of the Kerlan-Jobe Orthopaedic Clinic Shoulder and Elbow Score in Greek Overhead Athletes. J. Funct. Morphol. Kinesiol. 2024, 9, 49. [Google Scholar] [CrossRef] [PubMed]
  37. Kaiser, HF. An index of factorial simplicity. Psychometrika. 1974, 39, 31–36. [Google Scholar] [CrossRef]
Figure 1. Screeplot of eigenvalues.
Preprints 142846 g001
Table 1. Benchmarks and interpretation of the Cronbach’s alpha, the Intraclass Correlation Coefficient, and the correlation coefficients.
Statistic Absolute magnitude of the observed statistic Interpretation
Cronbach’s alpha 0.01-0.06 Non-acceptable internal consistency
0.61-0.70 Acceptable internal consistency
0.71-0.80 Good and acceptable internal consistency
0.81-0.90 Good internal consistency
0.91-1.00 Excellent internal consistency
Intraclass Correlation Coefficient 0.00-0.49 Poor test-retest reliability
0.50-0.75 Moderate test-retest reliability
0.75-0.90 Good test-retest reliability
0.91-1.00 Excellent test-retest reliability
Correlation Coefficient 0.00-0.10 Negligible correlation
0.10-0.39 Weak correlation
0.40-0.69 Moderate correlation
0.70-0.89 High correlation
0.90-1.00 Excellent correlation
Table 2. Demographics and baseline data.
Variable (continuous) Mean value (SD) Median value (Q1-Q3) N
Age (years) 38.9 (14.8) 35.0 (26.0 – 55.0) 55
Height (centimetres) 172.5 (10.0) 171.0 (165.0 -180.0) 55
Weight (kilograms) 76.7 (19.9) 70.0 (63.0 – 86.0) 55
Body Mass Index (BMI) 25.6 (5.3) 24.5 (22.2 – 27.3) 55
Pain duration (Months) 7.5 (10.7) 4.0 (3.0 – 5.0) 55
Pain intensity (VAS score)1 7.0 (0.9) 7.0 (6.0 – 8.0) 55
KOOS-PF score2 36.3 (16.6) 30.1 (22.7 – 50.0) 55
KOS-ADL score3 50.6 (18.1) 47.1 (38.6 – 64.3) 55
Variable (dichotomous) Absolute frequency Relative frequency 55
Gender assigned at birth
Female 31 56.4%
Male 24 43.6%
Notes: SD = Standard Deviation; Q1 = 1st quartile; Q3 = 3rd quartile; N = number of respondents; 1. Non-normally distributed variable (Shapiro-Wilk W statistic= 0.94, p-value=0.013); 2. Normally distributed variable (Shapiro-Wilk W statistic=0.97, p-value=0.11); 3. Normally distributed variable (Shapiro-Wilk W statistic=0.97, p-value=0.23).
Table 3. Reliability measurements of the Greek version of the KOOS-PF scale.
Statistic Point estimate 95% CI p-value
Cronbach’s alpha 0.87 0.85 to 0.93 <0.001
Intraclass Correlation Coefficient 0.95 0.71 to 0.99 <0.001
Standard Error of Measurement (SEM) 3.7 - -
Smallest Detectable Difference (SDD) 13.6 - -
Notes: 95% CI = 95% Confidence Interval.
Table 4. Validity measurements of the Greek version of the KOOS-PF scale.
Correlation coefficients Point estimate 95% CI p-value
KOOS-PF versus KOS-ADL1 0.72 0.57 to 0.83 <0.001
KOOS-PF versus VAS2 - 0.64 -0.45 to -0.77 <0.001
Notes: 95% CI = 95% Confidence Interval; 1. The correlation was assessed through Pearson’s correlation coefficient; 2. The correlation was assessed through Spearman’s correlation coefficient.
Table 5. Inter-item correlations of the Greek version of the KOOS-PF scale.
Item 1 Item 2 Item 3 Item 4 Item 5 Item 6 Item 7 Item 8 Item 9 Item 10 Item 11
Item 1 1.0000
Item 2 0.4308 1.0000
Item 3 0.3345 0.5710 1.0000
Item 4 0.4079 0.3871 0.5240 1.0000
Item 5 0.6000 0.4642 0.5785 0.5939 1.0000
Item 6 0.5838 0.5241 0.6206 0.6291 0.8323 1.0000
Item 7 0.3400 0.2739 0.3290 0.4740 0.4183 0.4050 1.0000
Item 8 0.0529 0.1129 0.2565 0.4381 0.3456 0.5449 0.3122 1.0000
Item 9 0.0739 0.1754 0.1949 0.3380 0.4226 0.4543 0.4342 0.6514 1.0000
Item 10 0.4454 0.5646 0.6306 0.5508 0.6176 0.6774 0.4376 0.3488 0.2928 1.0000
Item 11 0.4432 0.3205 0.5417 0.4075 0.5627 0.6267 0.2170 0.3997 0.2358 0.5142 1.0000
Note: This is a Spearman’s correlation matrix; Kaiser-Meyer-Olkin statistic=0.826; Determinant of the correlation matrix=0.001; Bartlett test of sphericity chi-square=331.879, p-value<0.001.
Table 6. Summary of Exploratory Factor Analysis of the Greek version of the KOOS-PF scale.
Factor 1 Factor 2
Item1 0.8220 -0.3115
Item2 0.6852 -0.1357
Item3 0.8573 -0.0988
Item4 0.5770 0.2652
Item5 0.7612 0.1691
Item6 0.7030 0.3539
Item7 0.3818 0.3816
Item8 -0.0152 0.9079
Item9 -0.0530 0.9216
Item10 0.7840 0.1131
Item11 0.7634 -0.0262
Eigenvalue 5.1241 3.0158
%ofvariance 46.58 27.42
Note:Extractionmethod:PrincipalAxisFactoring(PAF);Rotation method: Oblique rotation with Kaiser normalization; Factor loadings >40 appear in bold.
Table 7. Floor and ceiling (F/C) effects of the KOOS-PF scale.
KOOS-PF scale KOOS-PF value % scoring Effect classification
Floor effects 0
(minimum/worst score)
0 % negligible
Ceiling effects 100
(maximum/best score)
0 % negligible
Disclaimer/Publisher’s Note: The statements, opinions and data contained in all publications are solely those of the individual author(s) and contributor(s) and not of MDPI and/or the editor(s). MDPI and/or the editor(s) disclaim responsibility for any injury to people or property resulting from any ideas, methods, instructions or products referred to in the content.
Copyright: This open access article is published under a Creative Commons CC BY 4.0 license, which permit the free download, distribution, and reuse, provided that the author and preprint are cited in any reuse.
Prerpints.org logo

Preprints.org is a free preprint server supported by MDPI in Basel, Switzerland.

Subscribe

Disclaimer

Terms of Use

Privacy Policy

Privacy Settings

© 2025 MDPI (Basel, Switzerland) unless otherwise stated