Submitted:
14 December 2024
Posted:
16 December 2024
You are already at the latest version
Abstract
In this study, we take two batches of 323 provincial traditional villages in Shaanxi Province from 2015 to 2017 as the research object. We use Google Earth to conduct spatial positioning, analyze the villages’ spatial distribution characteristics, and carry out correlation analysis under different geographical units and influencing factors. The study shows that traditional villages in Shaanxi Province have three high-density core areas, with the increase of altitude and terrain undulation, its distribution shows a "low–high–low" distribution pattern; mostly concentrated in the south and southeast and within 3 km from the drainage basin; the population density and economic level are weakly negatively correlated with the spatial distribution of traditional villages. According to their spatial agglomeration characteristics, traditional villages in Shaanxi Province can be divided into four distribution modes, namely, diffusion type, polarizing type, trough type, and backward type.
Keywords:
Shaanxi Province
; Traditional Villages
; GIS
; Spatial Distribution
Traditional villages, originally called ancient villages, mainly refer to those villages with a long history, strong relics, and typical cultural models. They contain a rich historical and cultural landscape, representing five thousand years of Chinese agricultural civilization, and a combination of material cultural heritage and intangible cultural heritage [1]. Foreign studies on traditional villages originated in France in the 1820s, and for a long time, qualitative analysis of the relationship between villages and natural factors predominated [2]. In his book The Relationship Between Traffic Colonies and Terrain, the German geographer J.G. Kohl analyzed and comprehensively compared the types of metropolises, market towns, and villages; discussed the relationship between villages and terrain and traffic; and revealed the differences in the influence of terrain on the geographical location of villages [3]. Sevenant, M., and others used the GIS spatial analysis method to study the relationship between land-use zoning and landscape visibility, revealing the village landscape types under different land-use modes [4]. There are also many studies on the relationship between village system progress, economic development, and population density [5,6,7]. In addition, Eva Kiss and David L. Brown analyzed the reconstruction and population redistribution of villages in the transition period of market development transformation, and the humanities research paradigm is becoming more widely used [8,9,10,11,12].
With the progress of the discipline, the study of the relevant geography, sociology, and anthropology has gradually developed. From the perspective of quantitative analysis, Xingyi Wang et al. analyzed the spatial distribution characteristics of 111 traditional villages in Anhui Province, used common methods such as nuclear density and the geographical concentration index, and revealed the influence of natural, social, cultural, and other factors on their patterns [13]. Saiqiang Hu et al. revealed the spatial distribution characteristics and the historical evolution process of traditional villages in Fujian Province through the average center analysis and spatial superposition analysis methods [14]. From the perspective of qualitative research, Xiaoyang Jia, Xianhui Liu, Yaru Guo, Jiao Xue, Yixin Tang, and Rongjing Huang, etc., analyzed the morphological characteristics of traditional villages in Henan Province in the process of new urbanization from a qualitative research and description perspective, revealing seven types of villages and the status quo and problems of cultural protection under their cultural influence [15,16,17,18,19,20]. From the perspective of research scope, research on the development status of traditional villages in Shaanxi Province has gradually developed from small to large. Ying Li and Jin Qian used villages such as Dangjia Village as examples to analyze the problems encountered in the development process of typical traditional villages, so as to provide ideas for follow-up planning research [21,22,23,24,25]; Jizhu Wang and Yan Jin used the Shaanxi section of the Ming Great Wall, Xi’an, and the Hancheng area as the research scope, analyzed the contradictions and problems in the development process of local traditional villages, analyzed the development mode, and put forward protection and utilization strategies [26,27,28].
This study uses the nuclear density analysis in ArcGIS and the standard deviation ellipse spatial analysis method to study the spatial distribution characteristics of traditional villages in Shaanxi Province, and it discusses the influence of natural and social humanities factors on their distribution characteristics, mainly through quantitative analysis. Qualitative description reveals the development of traditional villages in Shaanxi Province, constituting the spatial and regional distribution characteristics of traditional villages, in order to provide a reference for the development and protection of traditional villages.
1. Overview of the Study Area
Shaanxi Province is the gateway fortress of northwest China, located between an east longitude of 105°29′~111°15′ and a north latitude of 31°42′~39°35′, with an area of 205,800 km2. It is narrow from east to west and long from north to south, the east-west span is 160-490 km, the north-south span is about 880 km, and the altitude range is about 164-3748 m, spanning the Yangtze River and the Yellow River which account for 98% of the total water area of the province. According to the differences in geography and climate, Shaanxi Province is divided into three natural geographical areas: northern Shaanxi Plateau, Guanzhong Plain, and southern Shaanxi Mountain. The administrative division map of Shaanxi Province is shown in Figure 1.
2. Data Sources and Research Methods
2.1. Data Source
The data of the traditional villages in Shaanxi Province are from the Shaanxi Provincial People’s Government and Shaanxi Provincial Department of Housing and Urban–Rural Development. The DEM data with 30 m resolution in Shaanxi Province come from the Geospatial Data Cloud Platform, the administrative boundaries at all levels in Shaanxi Province come from 1:1 million basic data in China, and other economic and cultural data come from the following places: Shaanxi Provincial Local Chronicles Office, Shaanxi Provincial Bureau of Statistics, a geographical and national conditions monitoring cloud platform, and the Shaanxi Statistical Yearbook, etc.
2.2. Study Methods
2.2.1. Nuclear Density Analysis
The spatial distribution density of geographical elements are generally quantified by density.There are three common methods used for densitometric analysis: point density analysis, line density analysis, and nuclear density analysis. For point density and line density analysis, a neighborhood is specified to calculate the pixel density around each output pixel. The kernel density allows a known total number of points to be dispersed from the point position to the periphery, and a surface can be generated around each point to give the highest value at the center of the surface (point position). This study uses the most effective nuclear density analysis to process 323 provincial traditional villages in Shaanxi Province and generate nuclear density maps. The nuclear density analysis method can be illustrated using the following formula:
In Equation (1), is the kernel function; represents the geographic coordinates of the i-th (i = 1, 2, …, n) point; and h is the bandwidth of the kernel density function. The shape and value range of the kernel function are closely related to the number and utilization of the geographical characteristic points used.
2.2.2. The Nearest-Neighbor Distance Index
From a macro point of view, the spatial distribution of traditional villages can be classified as the distribution of dotted elements in space. The nearest-distance method (NNI), also known as the nearest-distance index method, is used to measure the relative position of the point distribution and the distance between the nearest point, and it is an important geographical indicator of the point element configuration. That is, the distance between each point and its nearest point is determined, and the average value of these distances is the average nearest distance representing the proximity (the nearest distance). The nearest-neighbor point index (R) can be characterized as the ratio of the actual nearest-neighbor distance to the theoretical nearest-neighbor distance, as shown in the following equation:
In this equation, when R = 1, , the point element is a random distribution type; when R > 1, , the point element is uniformly distributed; when R < 1, , the point element is cluster-distributed.
2.2.3. Analysis Method of Centrality and Trend of Spatial Distribution
Center-of-gravity analysis produces the average x and y coordinates of all elements in the study area, namely the geometric center of gravity of the geographical distribution of traditional villages. The center-of-gravity model can be expressed using the following equation:
In Equation (3), X and Y are the longitude and latitude of the center-of-gravity coordinates of traditional villages in different divisions of Shaanxi Province, respectively; Xi and Yi are the longitude and latitude coordinates of the i-th traditional village in Shaanxi; and Wi is the sum of the number of traditional villages studied.
The standard deviation ellipse method in spatial statistical analysis, also known as the SDE (standard deviation ellipse) method, is commonly used to measure the trend distribution of a group of dotted elements. The spatial characteristics of geographical elements are summarized as follows: the central trend, the degree of dispersion, and the direction trend. The average center of the SDE method represents the relative concentration position of the geographical element distribution; the rotating azimuth reflects the main trend direction of the distribution; and the long axis and the short axis are the standard distance, which indicate the distribution direction and range of the principle element, respectively. The calculated expression is shown as follows:
In this equation, xi and yi represent the coordinate value of the i-th element, and represent the average center of all elements, and n is the total number of elements.
2.2.4. Buffer Zone Analysis
Buffer zone analysis refers to the automatic establishment of a buffer polygon layer within a certain width on the basis of points, lines, and surface entities, and then the superpositioning of the layer and the target layer to obtain the required results.
2.3. Spatial Distribution of the Correlation Analysis Method
2.3.1. Global Autocorrelation
The spatial autocorrelation (global Moran’s I) tool measures spatial autocorrelation based on element location and uses a spatial correlation index to measure the degree of spatial correlation. It can reveal the spatial distribution patterns and interaction mechanisms of the study objects. The significance of the index was assessed by calculating the Moran’s I index values, z-score, and p-values. The Moran’s I statistical analysis represents the following:
In Equation (6), I is the global Moran’s I; n is the total number of elements; Yi and Yj are the number of samples in areas i and j; Wij is the spatial weight matrix between elements i and j; S2 is the variance of the number of samples; and is the average number of samples.
2.3.2. Local Autocorrelation
On the basis of the global spatial autocorrelation analysis, in order to make up for the local information masked in the global analysis process, the local spatial agglomeration status is then tested using the local spatial autocorrelation LISA (Local Indices of Spatial Autocorrelation) agglomeration map. Accordingly, four types of spatial autocorrelation distribution patterns can be expressed: high–high, low–low, low–high, and high–low agglomeration. The local autocorrelation expression is as follows:
In this equation, Ii is the local spatial autocorrelation index; Xi and Xj are the attribute values of the spatial units i and j; is the average of Xi; n is the number of study objects; and Wij is the spatial weight matrix.
3. Analysis of the Spatial Agglomeration and Correlation of Shaanxi Traditional Villages
3.1. Analysis of the Distribution and Evolution of Traditional Villages
The nuclear density analysis method is the main method for conducting spatial distribution pattern analysis of geographical point elements. This study conducts the visual mapping analysis of various traditional villages in Shaanxi Province, and the results are shown in Figure 2 below. It can be seen that the traditional villages in Shaanxi Province show a distribution pattern of “agglomeration in the north and south and scattered in the middle.” The three high-density core areas are, respectively, Yulin in northern Shaanxi, Weinan in Guanzhong, and Ankang in southern Shaanxi.
In general, after the formation of the first batch of agglomeration centers, the distribution of villages in the latter batches has no obvious impact on the overall situation, and to some extent, it can be said to act as a supplement to the first batch of traditional villages. In terms of geographical location, Yulin City is located on the west bank of the middle reaches of the Yellow River. The abundant water conservation conditions provide a guarantee for the origin and development of village agriculture, especially for traditional villages. Weinan is located in the widest area of “800 li Qinchuan,” and is also a key city near Xi’an along the Silk Road Economic Belt. Its superior geographical location and profound cultural history have promoted the formation and development of traditional villages. Ankang is located in the southernmost part of Shaanxi Province. The paleolithic culture site discovered in the last century is an important transitional zone connecting the Yellow River and Yangtze River Basin, where the history and culture are rich and mysterious. The common feature of these places is that the terrain is relatively flat. Since ancient times, land has been a prerequisite for the development of a clan, a village, or even a city.
3.2. Analysis of the Average Closest Proximity of Traditional Villages
In this study, the average nearest-neighbor method is used to analyze the distribution types of traditional villages in Shaanxi Province. This method is suitable for the comparison and analysis of different elements in the fixed research area. The analysis results of the village locations from different batches are shown in Table 1.
In the study area, the average observed values between the first batch of traditional villages and the second batch and all batch location pairs were 0.133, 0.111, and 0.094, the nearest-neighbor index was 0.637, 0.562, and 0.575, and the values were less than 1, indicating that the first batch, second batch, and total batch of traditional villages in Shaanxi Province showed spatial agglomeration distribution patterns, respectively. From the first to the second batch, the ratio index of the traditional villages of all batches gradually decreases, preliminarily indicating that traditional villages in Shaanxi Province gradually gather in distribution in the study area; the z-scores are -9.072, -10.230, and -14.597. The absolute value gradually decreases, indicating that the agglomeration degree of traditional villages is gradually enhanced, and the overall distribution is the most obvious. The p-value analysis of the significance test of the above results shows that the p-value is 0 and less than 0.01, which indicates that this cluster distribution pattern is statistically significant.
3.3. Analysis of the Spatial Distribution Trend of Traditional Villages
The size of the output ellipse in the standard deviation is divided into three levels: the first level contains about 68% of the elements in the cluster, the second level contains about 95% of the cluster, and the third level about 99% of the cluster. In order to accurately represent the distribution trend of traditional villages, this study chooses the first-level standard deviation elliptic surface for analysis, because the higher the elliptic series, the larger the radius of curvature, the less obvious the direction performance, and the less accurate the analysis of the results.
As shown in Figure 3, the elliptical rotation angles of the first batch, the second batch, and all batches in Shaanxi Province are 23.638, 19.077, and 21.302, and the main distribution direction is basically the same. From the first to the second batch, the elliptical long-axis length increase and short-axis length contraction, and the elliptical scale, were also reduced. The development direction of the traditional village in Shaanxi Province is north by east, south by west, with east–west expansion–contraction. The development model of the village is stable, and the spatial agglomeration enhancement is partly due to the influence of urban development and rural revitalization of development planning.
3.4. Analysis of the Center of Gravity of Traditional Villages
The change in the spatial distribution center of gravity of traditional villages partly reflects the migration route of the local historical and cultural relics, and also indirectly indicates the center-of-gravity distribution of traditional villages.
Figure 4.
The center-of-gravity distribution of traditional villages in Shaanxi Province.
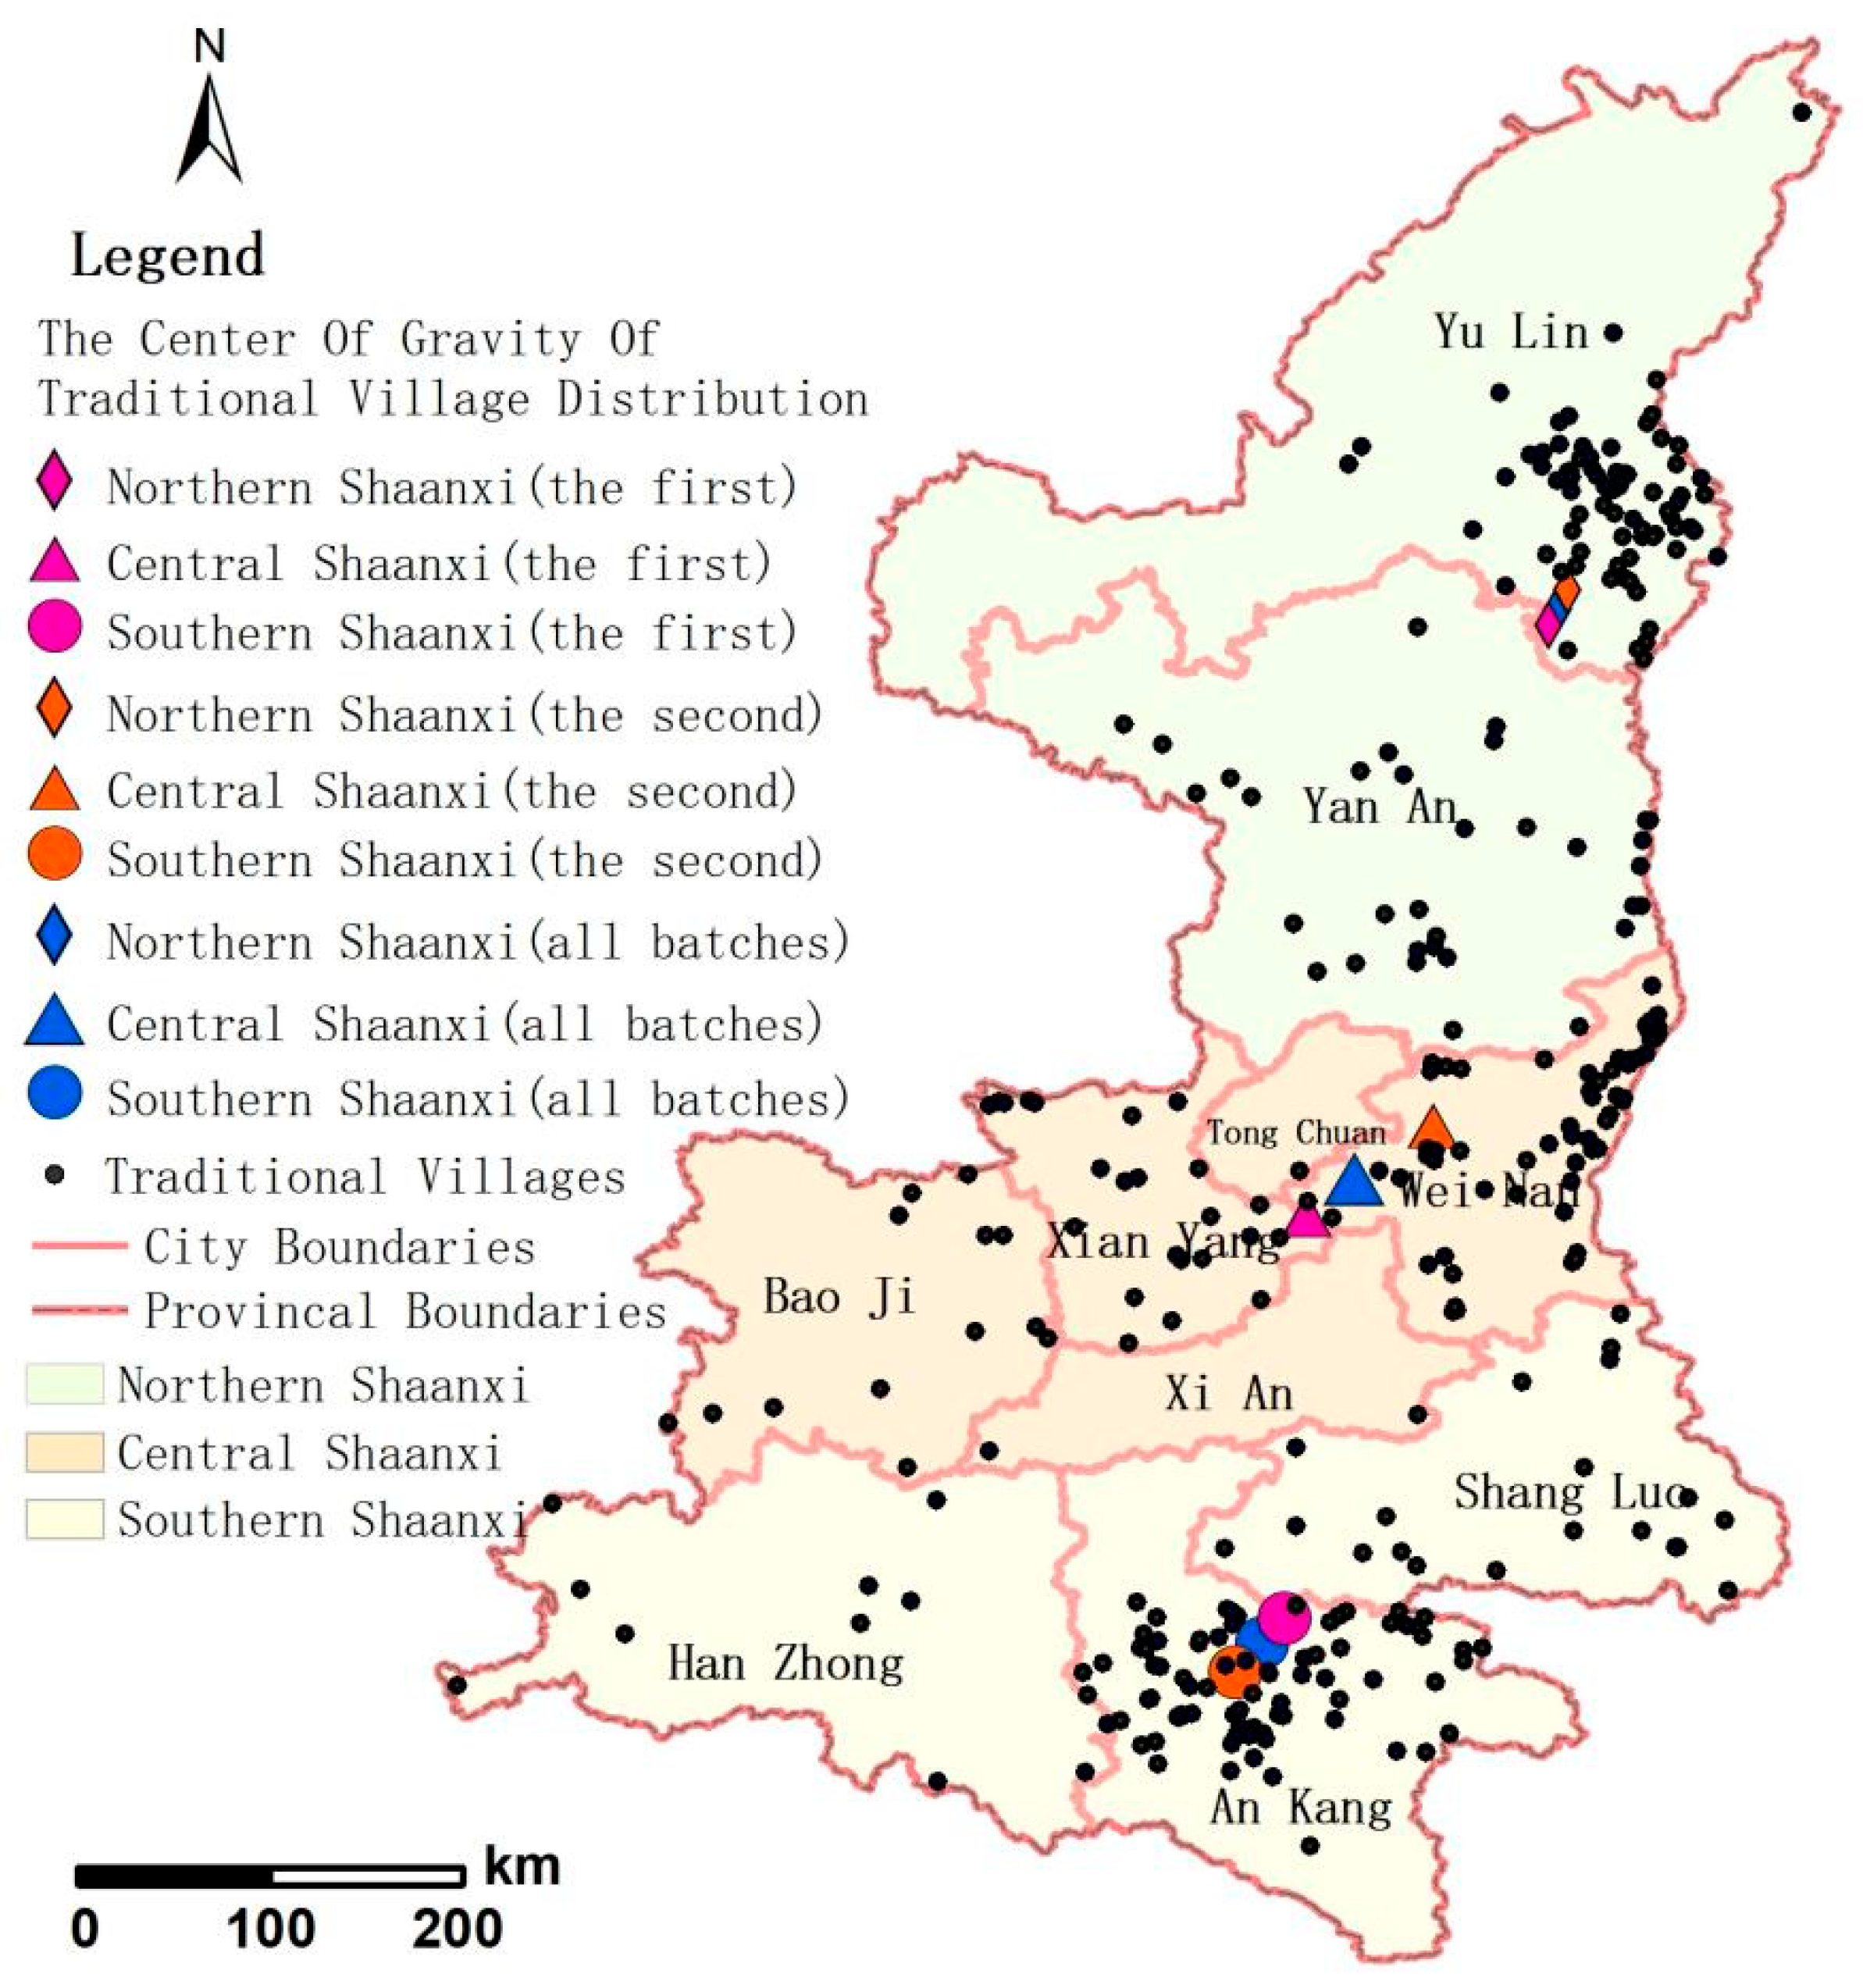
As can be seen from the figure, the distribution center of gravity of the three geographical regions migrated in the same trend of "northeast–southwest." Among the first batch of traditional villages, the distribution of northern Shaanxi is in Qingjian County, Yulin City, in the central part. This is a famous red revolutionary base area, which contains the unique essence of traditional culture and is also the only "hometown of Jujube" in China. The center of gravity of the Guanzhong area is in Sanyuan County, Xianyang City, which is the "North Gate" of the provincial capital Xi’an, with a history of more than 1,500 years. The sunken cave dwellings with regional characteristics are dense and well preserved, and these are the main construction characteristics and landscape of traditional villages. The center of gravity of southern Shaanxi is distributed in Hanbin District of Ankang City, which is adjacent to a national road with developed traffic. In the second batch of traditional villages, the distribution center of gravity in northern and southern Shaanxi remains unchanged. The center of gravity of the Guanzhong area is located in Pucheng County, Weinan City, which has a history of more than 3,000 years, and has always had the reputation of being a "hometown of generals." There are many tombs of emperors from the Tang Dynasty, with cultural cohesion and centripetal force. Among all of the batches, the average center of northern Shaanxi and southern Shaanxi moves only slightly in each stage, and the traditional villages are highly concentrated. The center of gravity in the Guanzhong area is large and wide. This migration distance and range is also a trend in the development process of traditional villages. Traditional culture has been continuously developed along one set direction and at a certain distance, producing a shadow.
3.5. Global Autocorrelation Analysis of Traditional Villages
In this study, the distribution number of traditional villages in each region is counted at the city scale, and the global spatial autocorrelation Moran’s index is used to explore the spatial differentiation law of traditional villages in Shaanxi Province.
In Shaanxi Province, for the first batch, the seond batch and the total batch of traditional villages, the regional calculation value of Moran’s I index is greater than 0 and the z-score is greater than 0. From the analysis in Figure 5, the calculation results show that we can reject the null hypothesis: traditional villages with the spatial distribution location (distance) have a significant correlation in spatial distribution type, and the spatial difference is small.
Figure 5.
Schematic diagram of global space autocorrelation of traditional villages in Shaanxi Province.
Figure 5.
Schematic diagram of global space autocorrelation of traditional villages in Shaanxi Province.
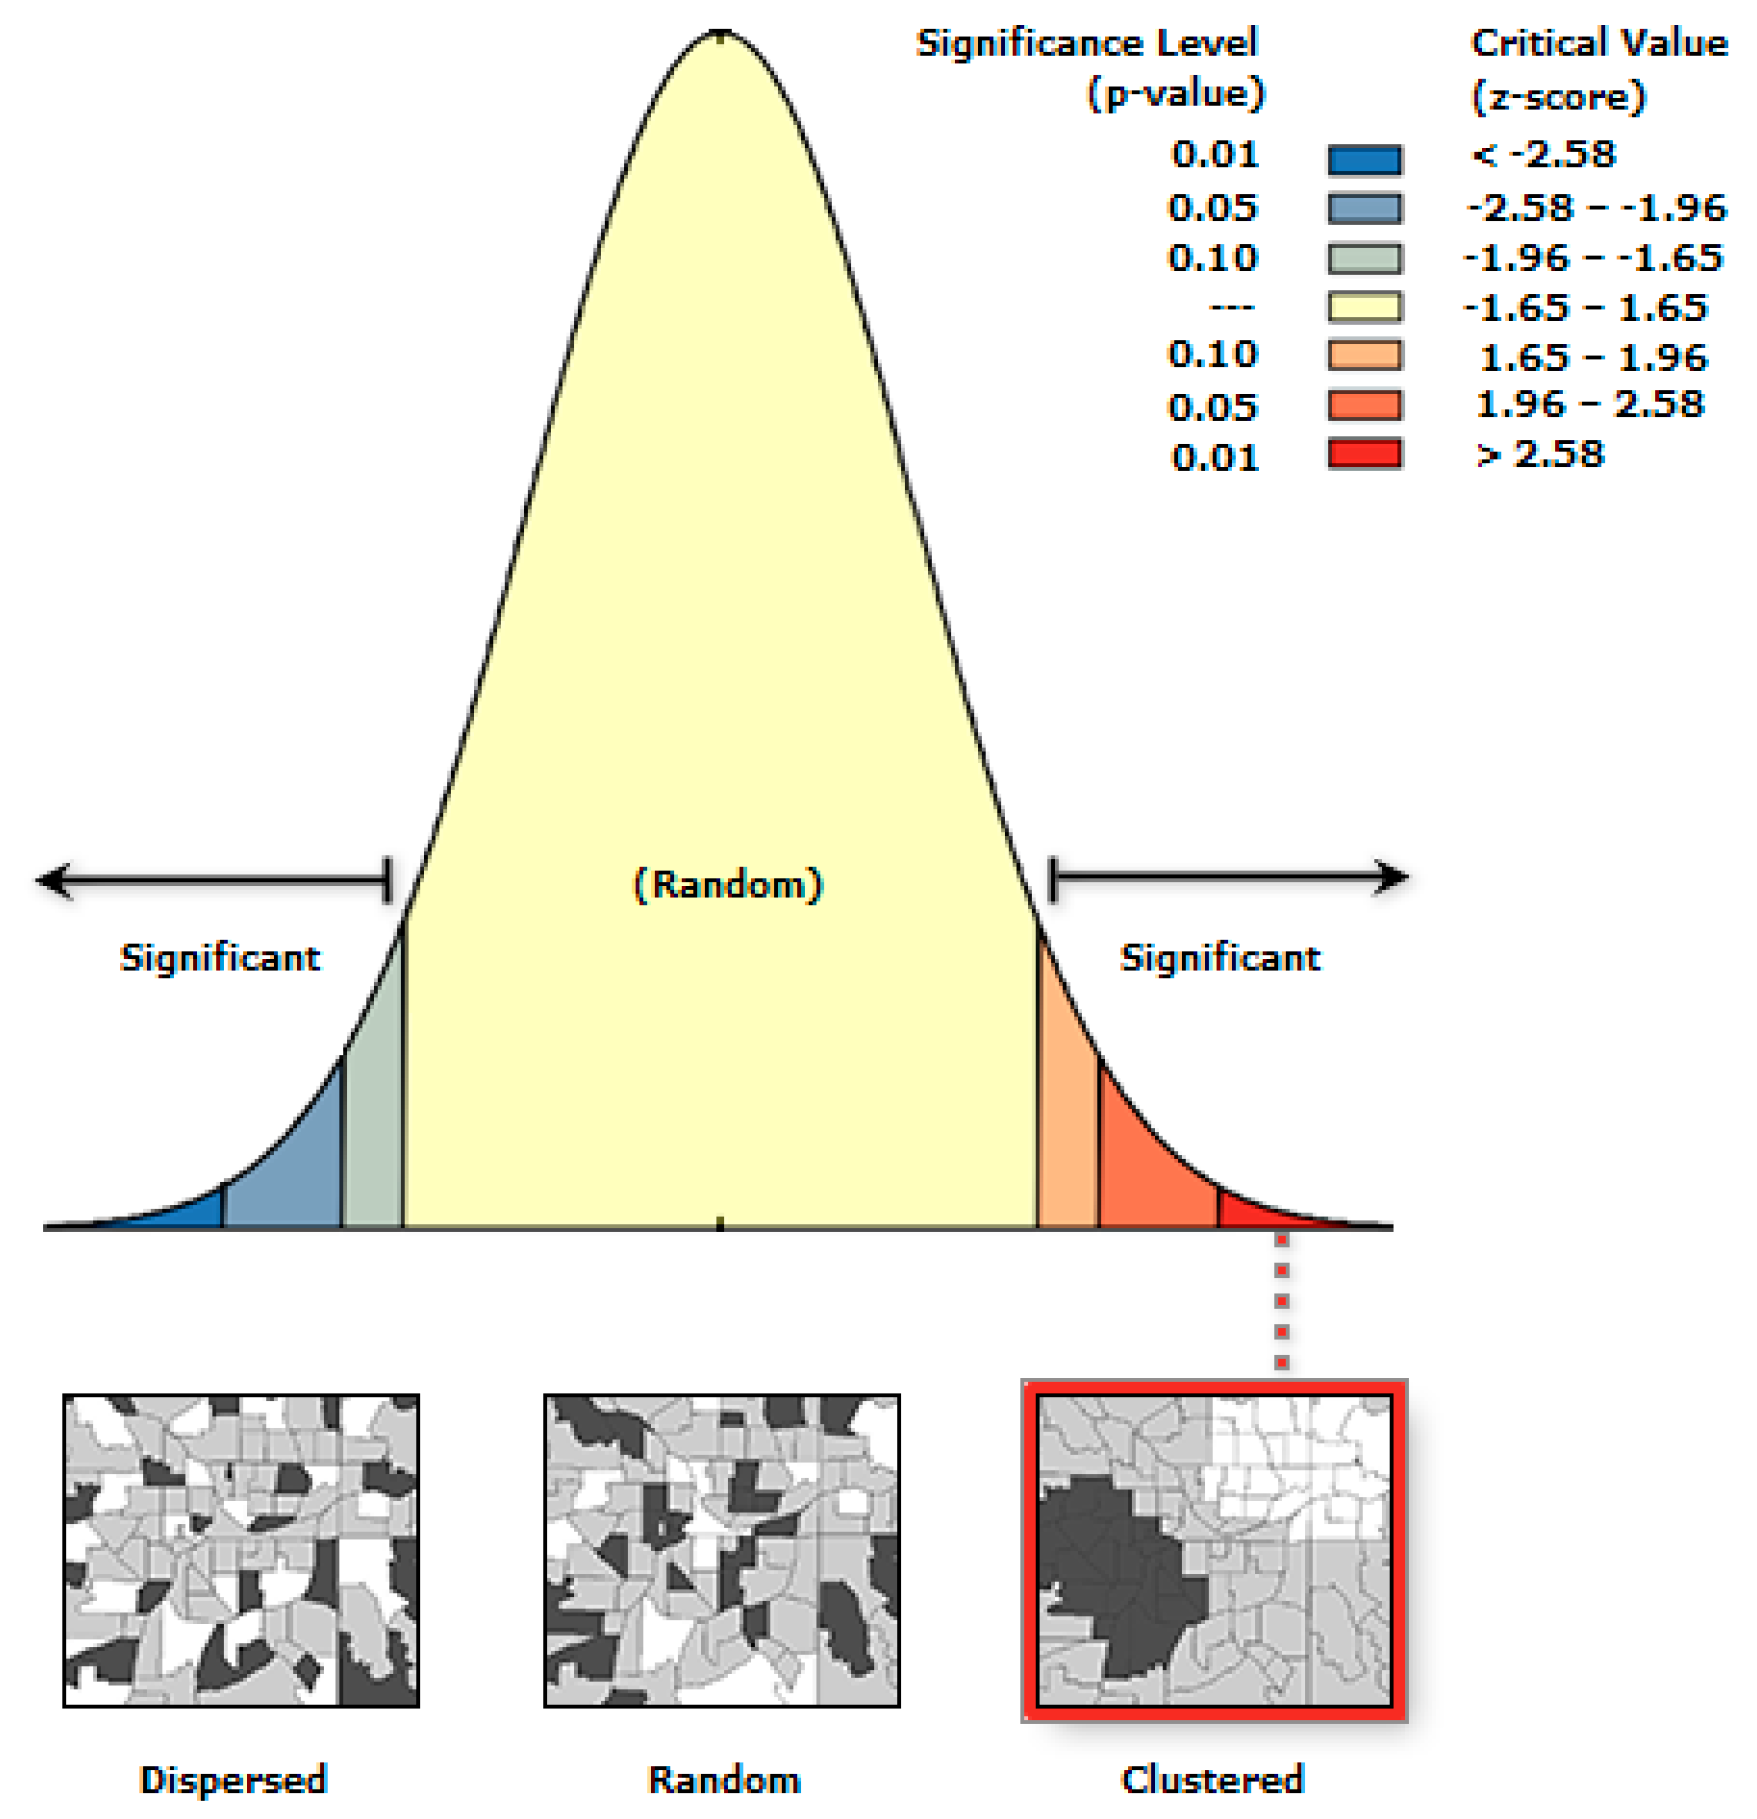

Table 2.
Global Moran’s I index for spatial distribution of different batches of traditional villages in Shaanxi Province.
Table 2.
Global Moran’s I index for spatial distribution of different batches of traditional villages in Shaanxi Province.
| Batch | Parameter | Moran’s I | Z Price | P Price |
|---|---|---|---|---|
| First batch | Northern Shaanxi Province | 0.900796 | 17.7244 | 0 |
| Central Shaanxi Plain | 0.97746 | 11.159094 | 0 | |
| Southern Shaanxi | 0.875622 | 21.325754 | 0 | |
| Whole | 0.947291 | 30.213201 | 0 | |
| Second batch | Northern Shaanxi Province | 0.102755 | 3.81184 | 0.000138 |
| Central Shaanxi Plain | 0.882784 | 23.025172 | 0 | |
| Southern Shaanxi | 0.787518 | 14.936198 | 0 | |
| Whole | 0.810265 | 40.510686 | 0 | |
| Total batch | Northern Shaanxi Province | 0.522841 | 32.418611 | 0 |
| Central Shaanxi Plain | 0.979073 | 20.0998 | 0 | |
| Southern Shaanxi | 0.902863 | 27.072004 | 0 | |
| Whole | 0.814429 | 80.226721 | 0 |
Overall, from the first to the second batch, the global spatial autocorrelation index in northern Shaanxi, Guanzhong, and southern Shaanxi decreased, indicating that the spatial distribution correlation of traditional villages decreased during this period; the z-score in northern Shaanxi and southern Shaanxi decreased, indicating that the spatial correlation of the first batch of traditional villages is significantly higher than that of the second batch. The Z-value in Guanzhong region has increased by two times, indicating that the spatial correlation of the second batch of traditional villages is more significant. In the "13th Five-Year Plan" for Guanzhong’s development, the importance of cultural city construction is more strongly emphasized, a series of rural folk custom construction activities are carried out, the village characteristics and local features are emphasized, and the development and protection of traditional villages are increasingly highly valued.
3.6. Local Autocorrelation Analysis of Traditional Villages
Local spatial autocorrelation analysis can compensate to some extent for the instability of local states covered in the process of global autocorrelation analysis. In order to further explore and study the spatial distribution characteristics of the small-scale administrative units of space in traditional villages in Shaanxi Province, local spatial self-correlation analysis was performed at 99% confidence, and LISA maps were drawn.
In general, the distribution of traditional villages in Shaanxi Province shows a positive correlation in space. There is no spatial distribution type of high–high agglomeration in Guanzhong, while the low–low agglomeration type is concentrated in the west of Guanzhong and southern Shaanxi; the low–high agglomeration and high–low agglomeration types are less frequent, but occur rarely in northern and southern Shaanxi. The distribution pattern of spatial agglomeration in most other areas is not significant, as shown in the gray area in Figure 6.
4. Spatial Distribution Characteristics Under the Influence of Different Factors
4.1. Ground Elevation Factor
Different topographic conditions have different effects on human survival and development. As an index to measure the height of the terrain, it is necessary to analyze the ground elevation factor’s influence on the distribution pattern of traditional villages. Shaanxi Province has plain, plateau, and desert landforms, with the highest altitude of 3,748 m and the lowest altitude of 164 m. According to the topographic features, they are divided into five categories: below 500 m, 500-800 m, 800-1200 m, 1200-1500 m, and above 1500 m; the extraction analysis method is used to explore the distribution difference in traditional villages at all levels. The statistical results are shown in Table 3.
In the first batch of traditional villages, as shown in Figure 7.1, the traditional villages in northern Shaanxi are distributed in areas above 500 m, with 51 traditional villages between 500 and 1200 m, accounting for 89.47% of the total in northern Shaanxi, and are not distributed at the altitude of 1500 m. In Guanzhong, there are 48 areas below 1200 m, accounting for 88.9% of the total. In southern Shaanxi, 26 are below 500 m, accounting for 44.33% of the total number above 1200 m. In the second batch of traditional villages, as shown in Figure 7.2, there are no traditional villages in areas below 500 m and above 1500 m, and the number of traditional villages at an altitude of 500 to 1200 m is 49, accounting for 92.5% of the total. In Guanzhong, there are 46 areas below 1200 m, accounting for 93.9% of the total. There are 41 villages below 800 m, accounting for 82%, and there are no traditional villages above 1200 m. In general, the two batches of traditional villages have great similarity in their topographic distribution patterns. In total, 94.1% of traditional villages are in areas below 1200 m, there are very few in areas above 1500 m, accounting for about 0.6% of the total, and most of these are located in the Qinling Mountains in the Guanzhong region. The loess plateau region in northern Shaanxi, the Guanzhong Plain region, and the Han River Basin region in southern Shaanxi are the main distribution areas of traditional villages in Shaanxi Province. The gentle terrain for the area is a prerequisite for vigorously developing agricultural production. The transition area of wind and sand and the Qinling Mountains in northern Shaanxi are rare, because these landforms limited the construction of ancient villages and human production and life to a certain extent, thus affecting the site selection and cultural fabric of traditional villages.
4.2. Slope Direction Factors
In geography, the slope direction can be used to identify the steepest downhill direction at a certain position on the surface, namely the mountain slope pointing from high to low, where the plane is not sloping, and its value is designated as -1. The slope direction was divided into nine categories: plane (-1), north (0~22.5°), northeast (22.5°~67.5°), east (67.5°~112.5°), southeast (112.5°~157.5°), south (157.5°~202.5°), southwest (202.5°~247.5°), west (247.5°~292.5°), and northwest (292.5°~337.5°). Shaanxi Province is located in the northern hemisphere, and the best radiation intensity of light and the south and southwest directions belong to the sunny slope, with sufficient light and good water and heat conditions, the most suitable for human production and life; the west and southeast directions belong to the half-sunny slope; the east and northwest directions belong to the half-shaded slope, and the heat conditions are more general; and the north and northeast directions belong to the shaded slope. In this study, the geographical distribution points of traditional villages on each slope of Shaanxi Province were extracted, analyzed, and calculated, as shown in Figure 8.
As can be seen from Figure 8, traditional villages in Shaanxi Province are distributed on each slope, among which they are the least distributed in the plane direction, with only one, accounting for 0.31% of the total number of traditional villages. The south, southeast, and southwest directions are the most distributed, with 175, accounting for 54.18% of the total number of traditional villages. Combined with Figure 9, more traditional villages are distributed in the direction of the sunny slope and half-sunny slope, and the solar and thermal conditions are sufficient. This slope is not only suitable for the development of rural agriculture and human survival, but also conducive to the formation of villages and the preservation and inheritance of a village landscape. This also proves that the ancients had a certain tendency to choose this slope. They would fully consider the limitation of the slope to production and life, and more often choose the sunny slope and half-sunny slope suitable for living. In the plane direction, only one traditional village is distributed in Zhouyuan Village, Hancheng City, Guanzhong Plain, located at the bottom of the Fenhe River and the low altitude Chuanyuan area in the Yellow River Basin. Historically, Zhouyuan Village was an important wharf, where ships from north and south met and then traded up the Fenhe River to Yaodu (Linfen City, Shanxi Province). At the same time, the Zhou people are the best at farming, so they have better reasons for choosing the lower altitude area of the Yellow River Basin. Zhouyuan Village has the only well-preserved Dayu Temple building from the Yuan Dynasty, which has a history and culture of more than 4,000 years’ accumulation; it is located on the bank of the Yellow River, belonging to the riverside, but it is also in line with people's habits and principles of living by water.
Figure 8.
The distribution of the number of traditional villages in different slope directions in Shaanxi Province.
Figure 8.
The distribution of the number of traditional villages in different slope directions in Shaanxi Province.
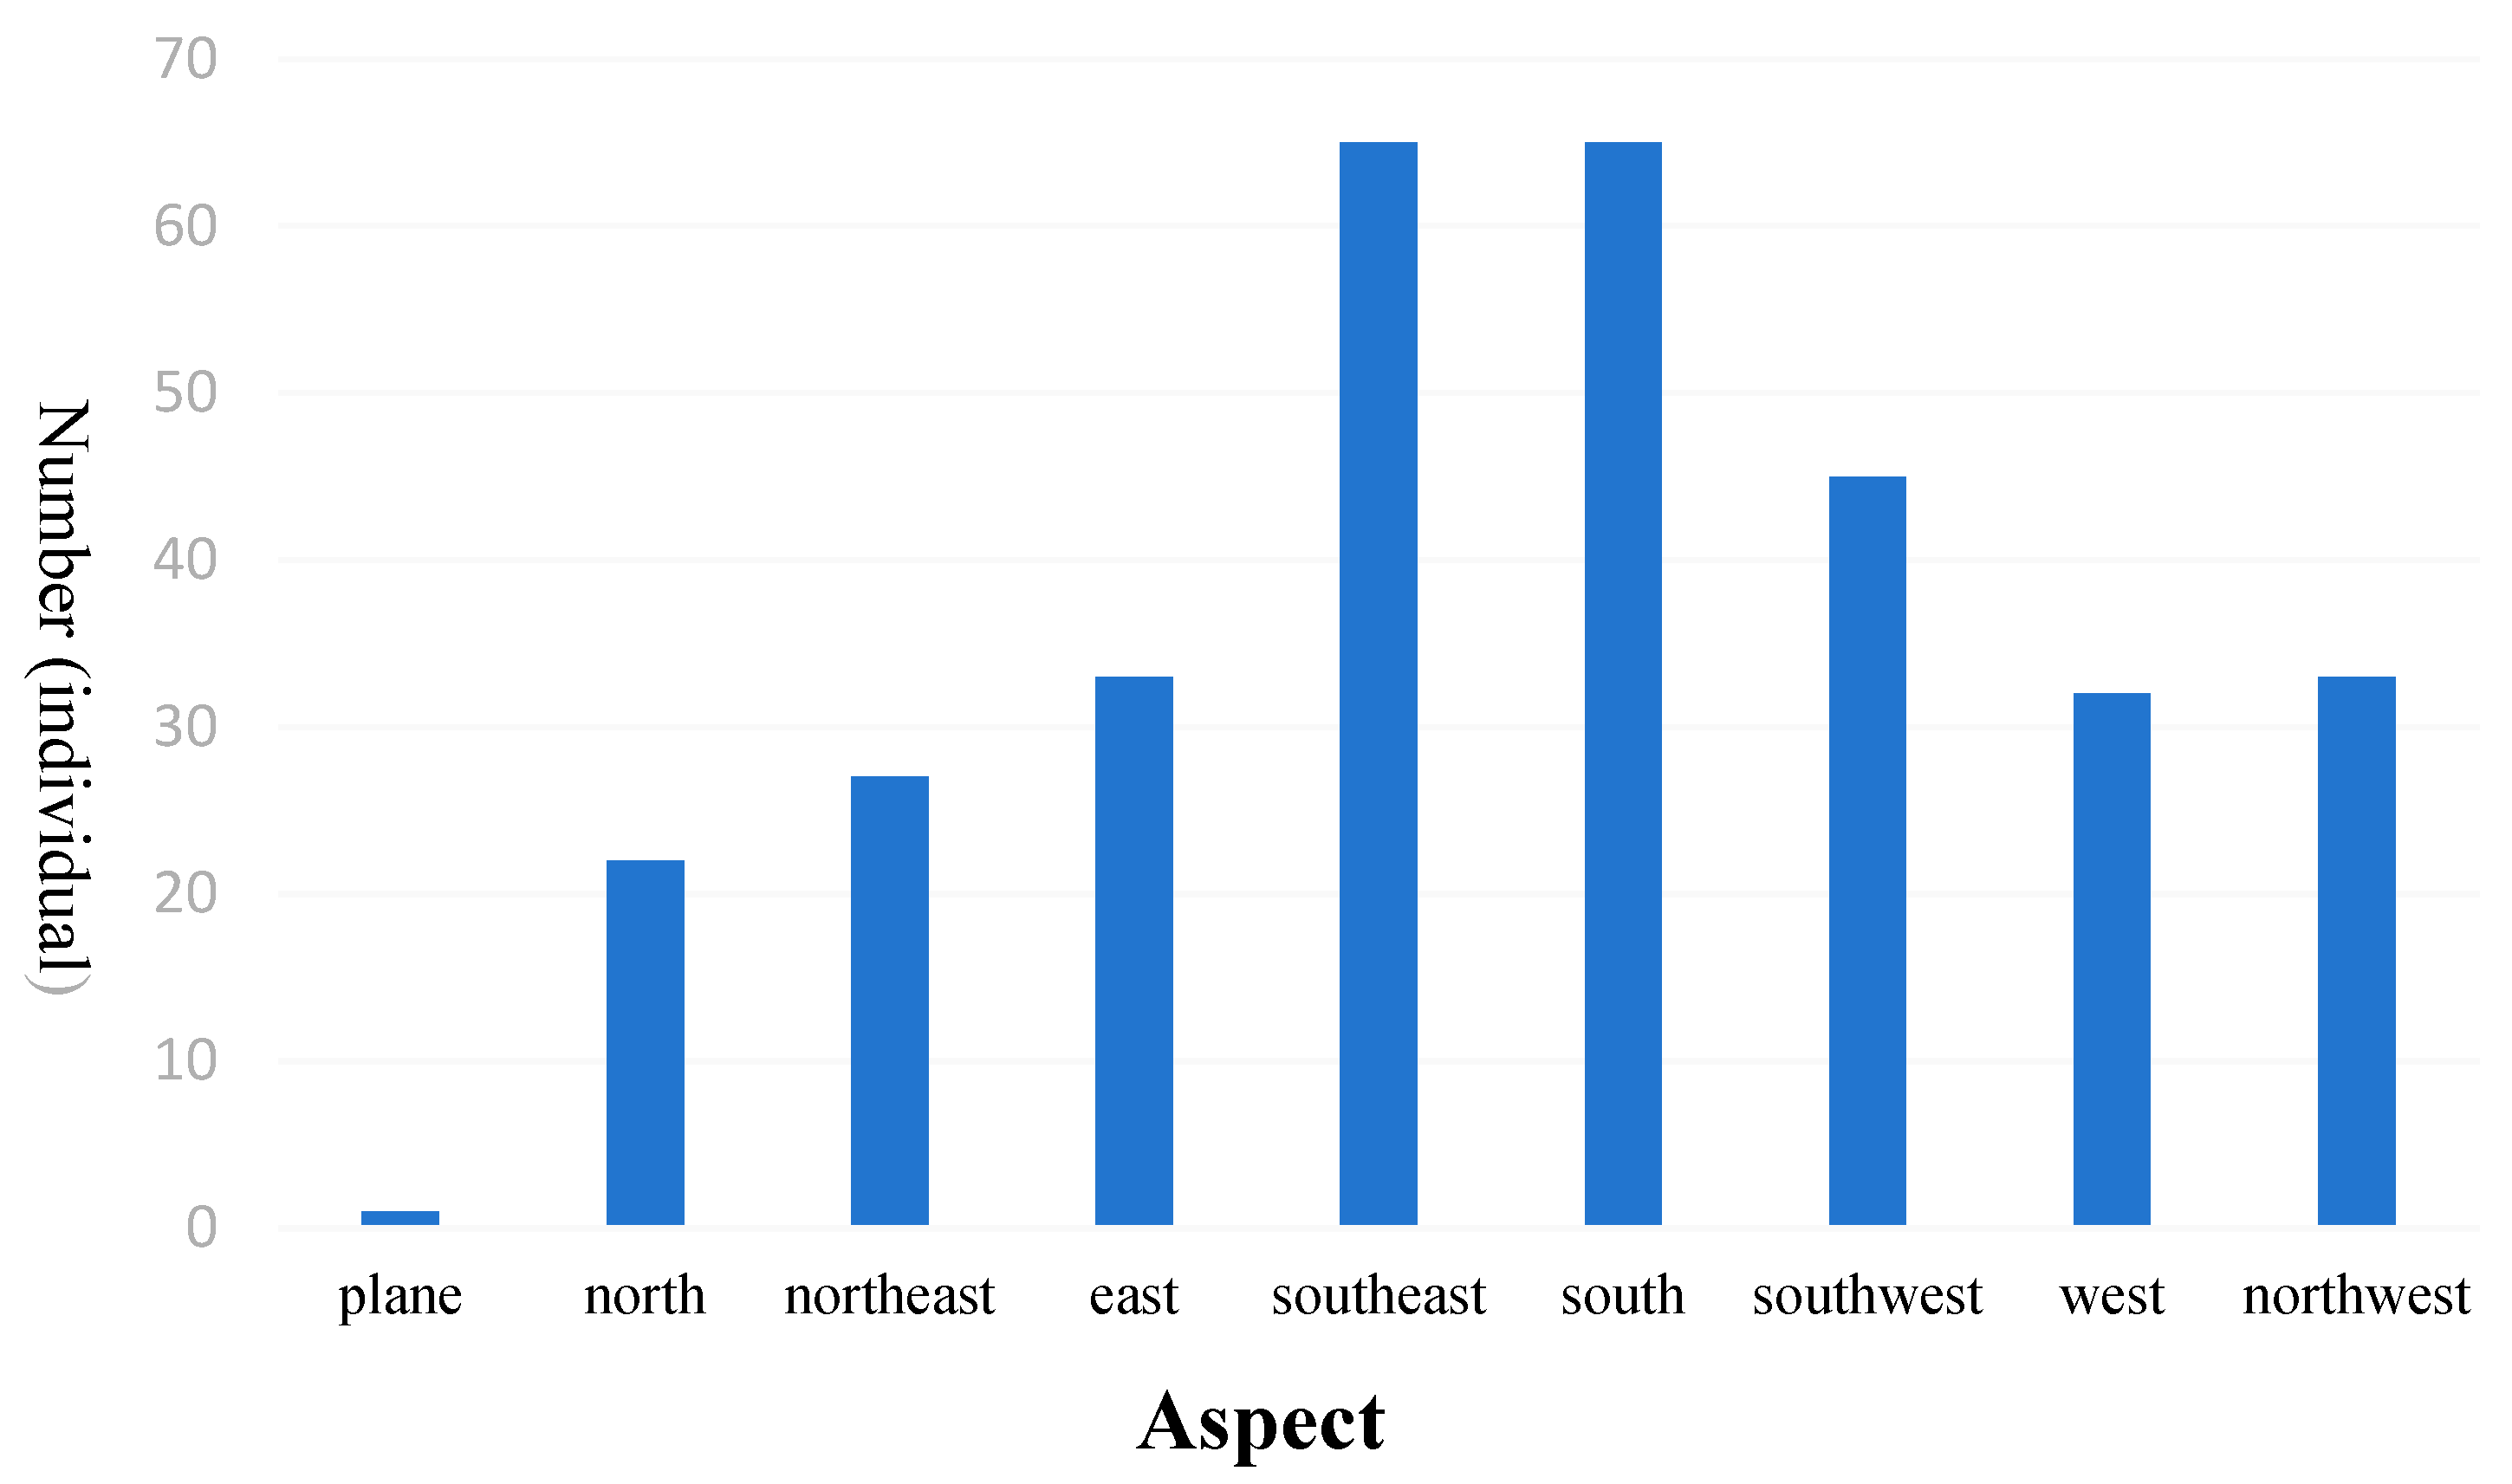
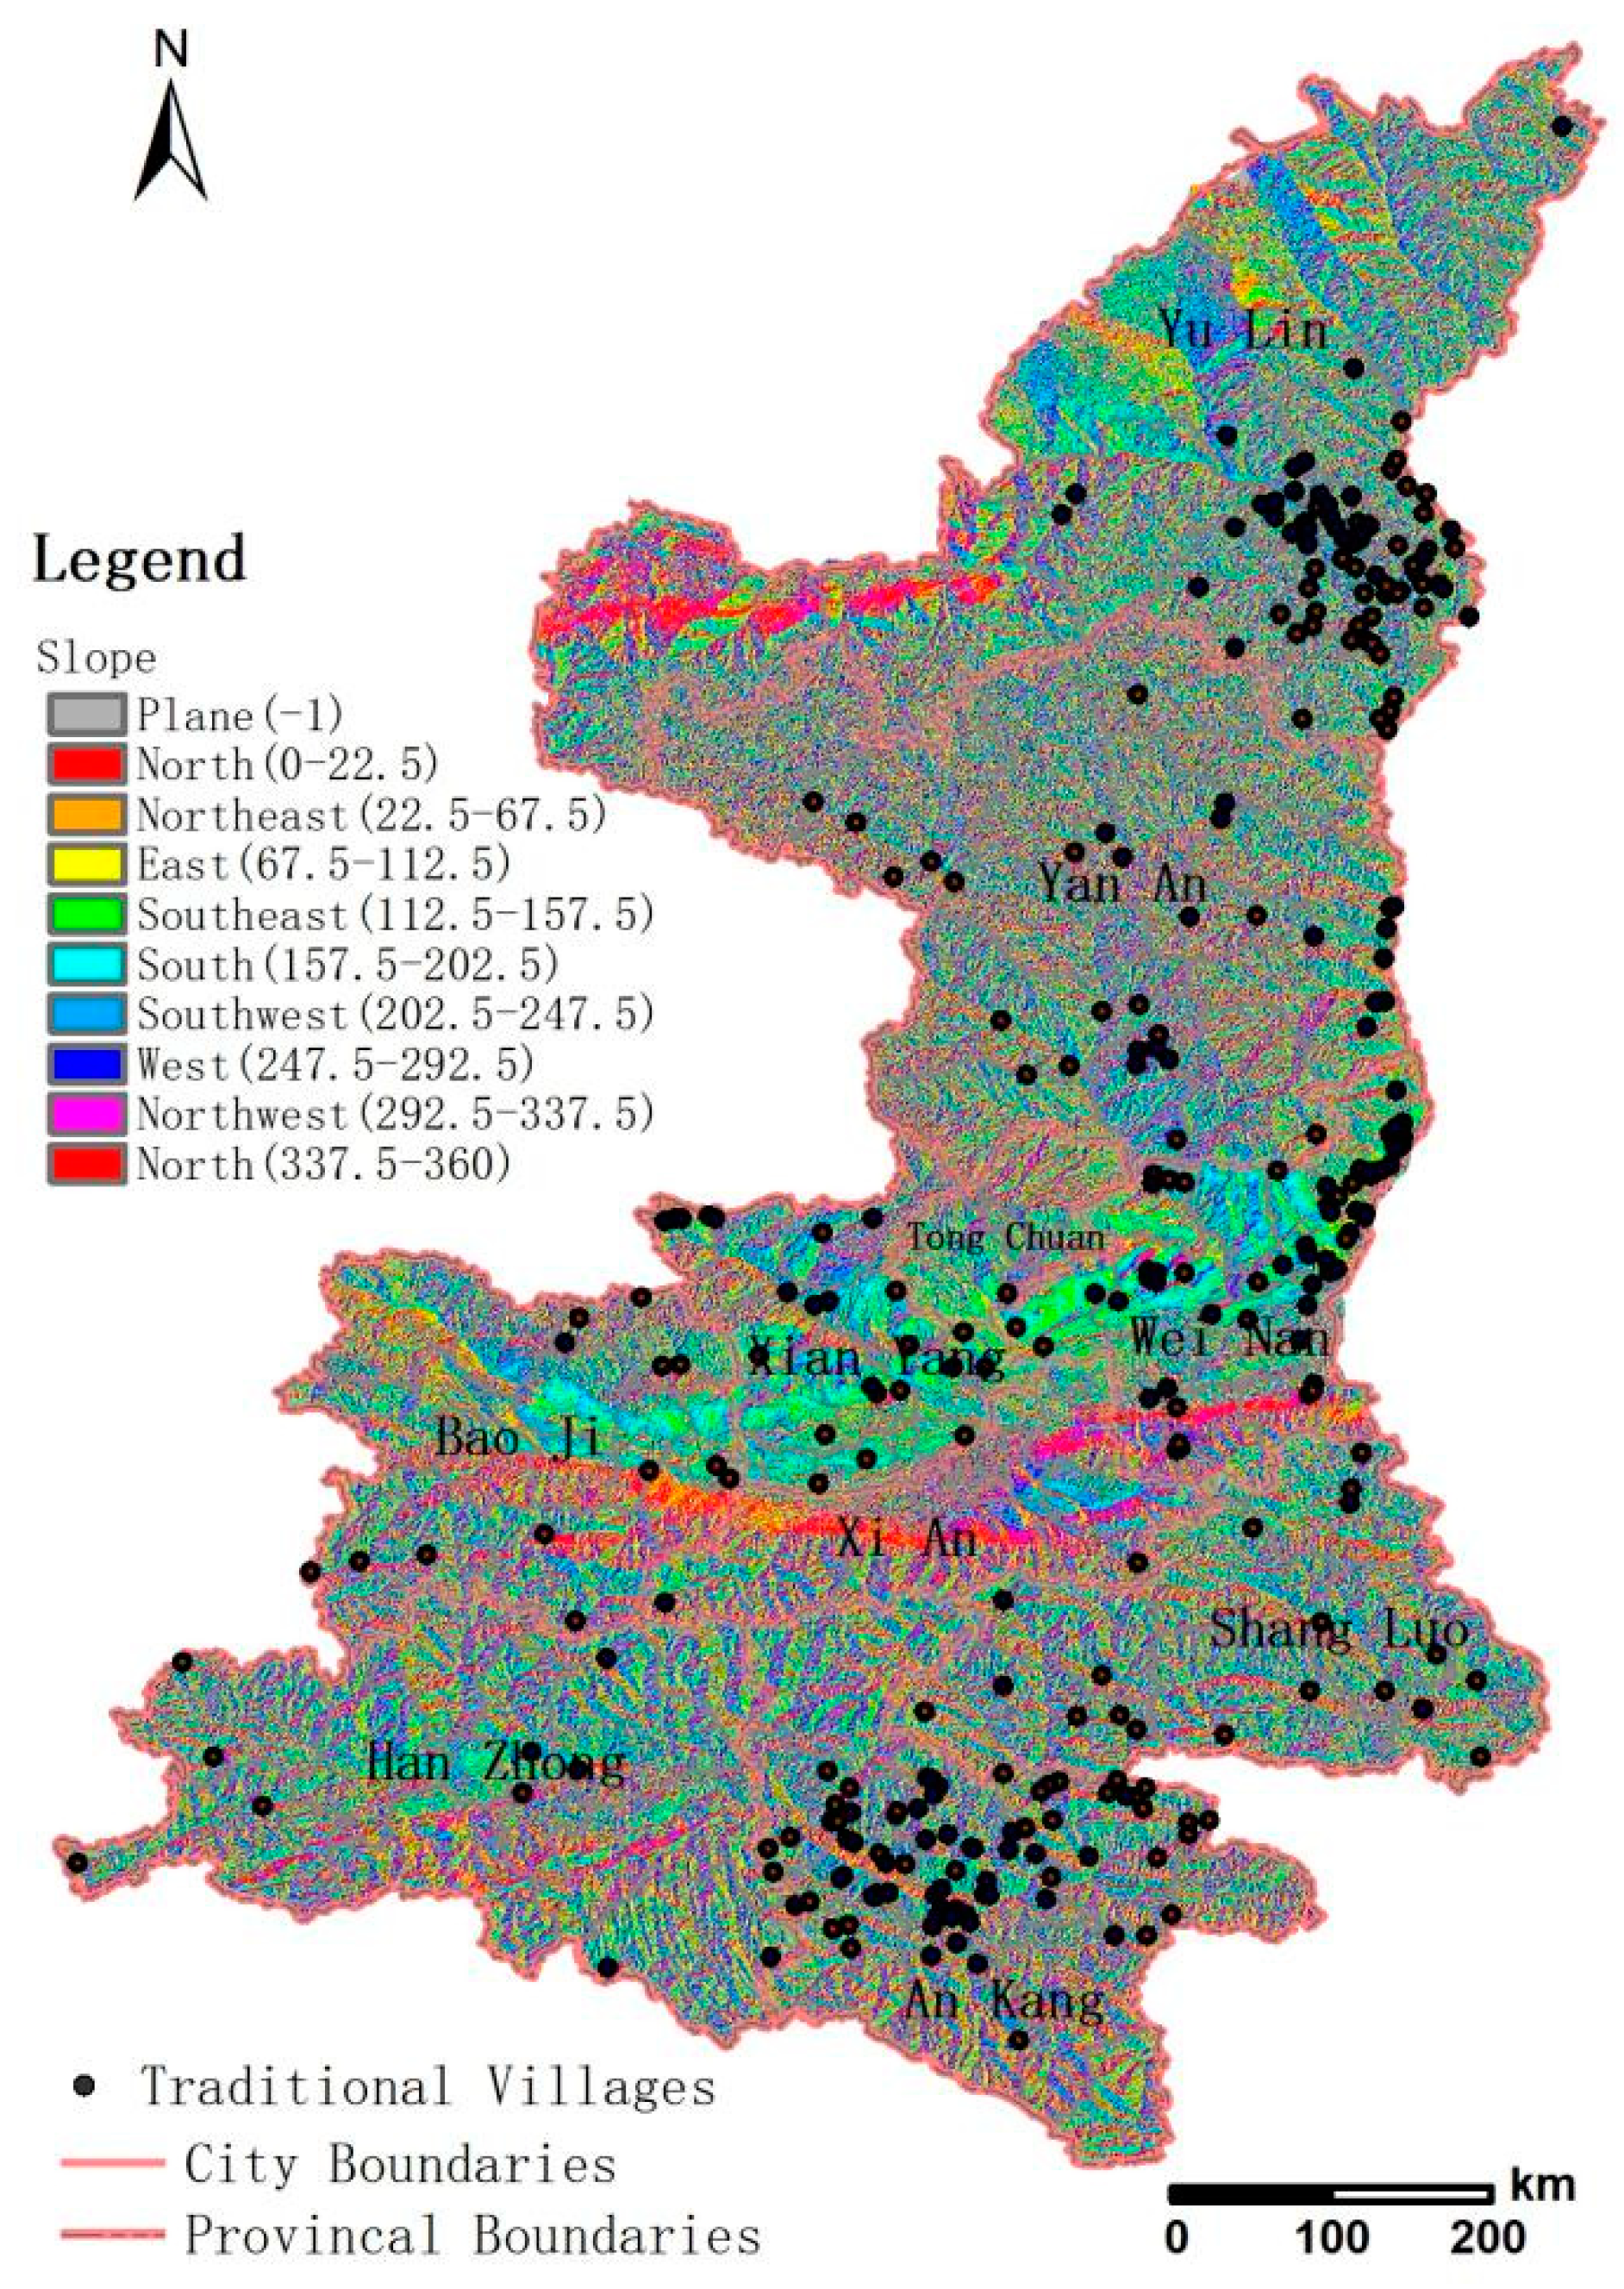
Figure 9.
Spatial distribution map of traditional villages in different slope directions in Shaanxi Province.
Figure 9.
Spatial distribution map of traditional villages in different slope directions in Shaanxi Province.
4.3. Terrain Relief
Topographic relief is an indicator used to measure the difference between the maximum and minimum elevation within a given study area, reflecting a macroscopic indicator of the topographic characteristics within the area. With the help of the ArcGIS10.0 platform, this study uses the neighborhood analysis function in spatial analysis to extract the maximum and minimum values in the unit analysis window of Shaanxi Province, and obtain the topographic fluctuation through calculation, as shown in Figure 10.
Combined with the topographic characteristics, the topographic relief is divided into six grades, and the statistical results are shown in Table 4 below.
According to Table 4, traditional villages in Shaanxi Province are concentrated in low hilly areas with topographic fluctuations between 0 and 80 m, accounting for about 95.98% of the total number of traditional villages. This shows that the location of traditional villages tends to be in areas with small topographic relief, and areas with a height difference within 80 m are densely distributed. Considering Figure 10, from the perspective of the northern Shaanxi region, the topographic relief within the unit study area is generally low. There are 107 traditional villages distributed within a height difference of 80 m, accounting for 98.17% of the total number of traditional villages in northern Shaanxi; at Level 5 and above, the terrain relief is relatively large, and there is no distribution of traditional villages. Within the research scope of the Guanzhong area, all traditional villages are concentrated in a range of topographic relief of less than 80 m; Grade 1 traditional villages are the most numerous, accounting for 65.47% of the number of Grade 1 traditional villages, among which they are densely distributed in Weinan; there are no traditional villages distributed at Grade 4 and above. The topography of southern Shaanxi is relatively large, with traditional villages of Levels 1–5 in the study area; the distribution of Level 2 is the largest, accounting for 37.07% of the total number of Level 2 traditional villages, mostly in the central Hanzhong region of southern Shaanxi; there are no traditional villages in areas with a terrain undulations exceeding 200 m. It can be seen that the fluctuation of the terrain has a great tendency for the site selection and distribution of traditional villages. The flat terrain has good transportation accessibility and convenient production and living, which can attract people to settle down and form a village.
4.4. Water System Factors
Since ancient times, human civilization has developed based on considerations of the water system, e.g., being too close to the river, having too high a risk of natural disasters, and experiencing inconvenience around daily water use in traditional lifestyles. Therefore, it is particularly important to choose an appropriate near-river distance.
Figure 11.
Relationship between traditional villages and water systems in Shaanxi Province.

In this study, the main rivers in Shaanxi Province were buffered by 3 km intervals, and the results showed that the number of traditional villages within 3 km from the river accounted for 37.89% of the total number of villages, those within 3 to 6 km accounted for 22.36%, and those between 6 and 9 km accounted for 11.80%. Under the buffer distance of 12 km, traditional villages accounted for 83.81%, which indicates that the number of traditional villages decreases with increasing distance from a river.
4.5. Population Distribution Pattern
The scope and intensity of human activities are closely related to the development of traditional villages. This paper uses the population data of a 1 km by 1 km kilometer grid in 2010 [29]. The spatial distribution map of traditional villages was superimposed to generate the number distribution map under their spatial distribution density.
Figure 12.
Traditional villages and population distribution map of Shaanxi Province.
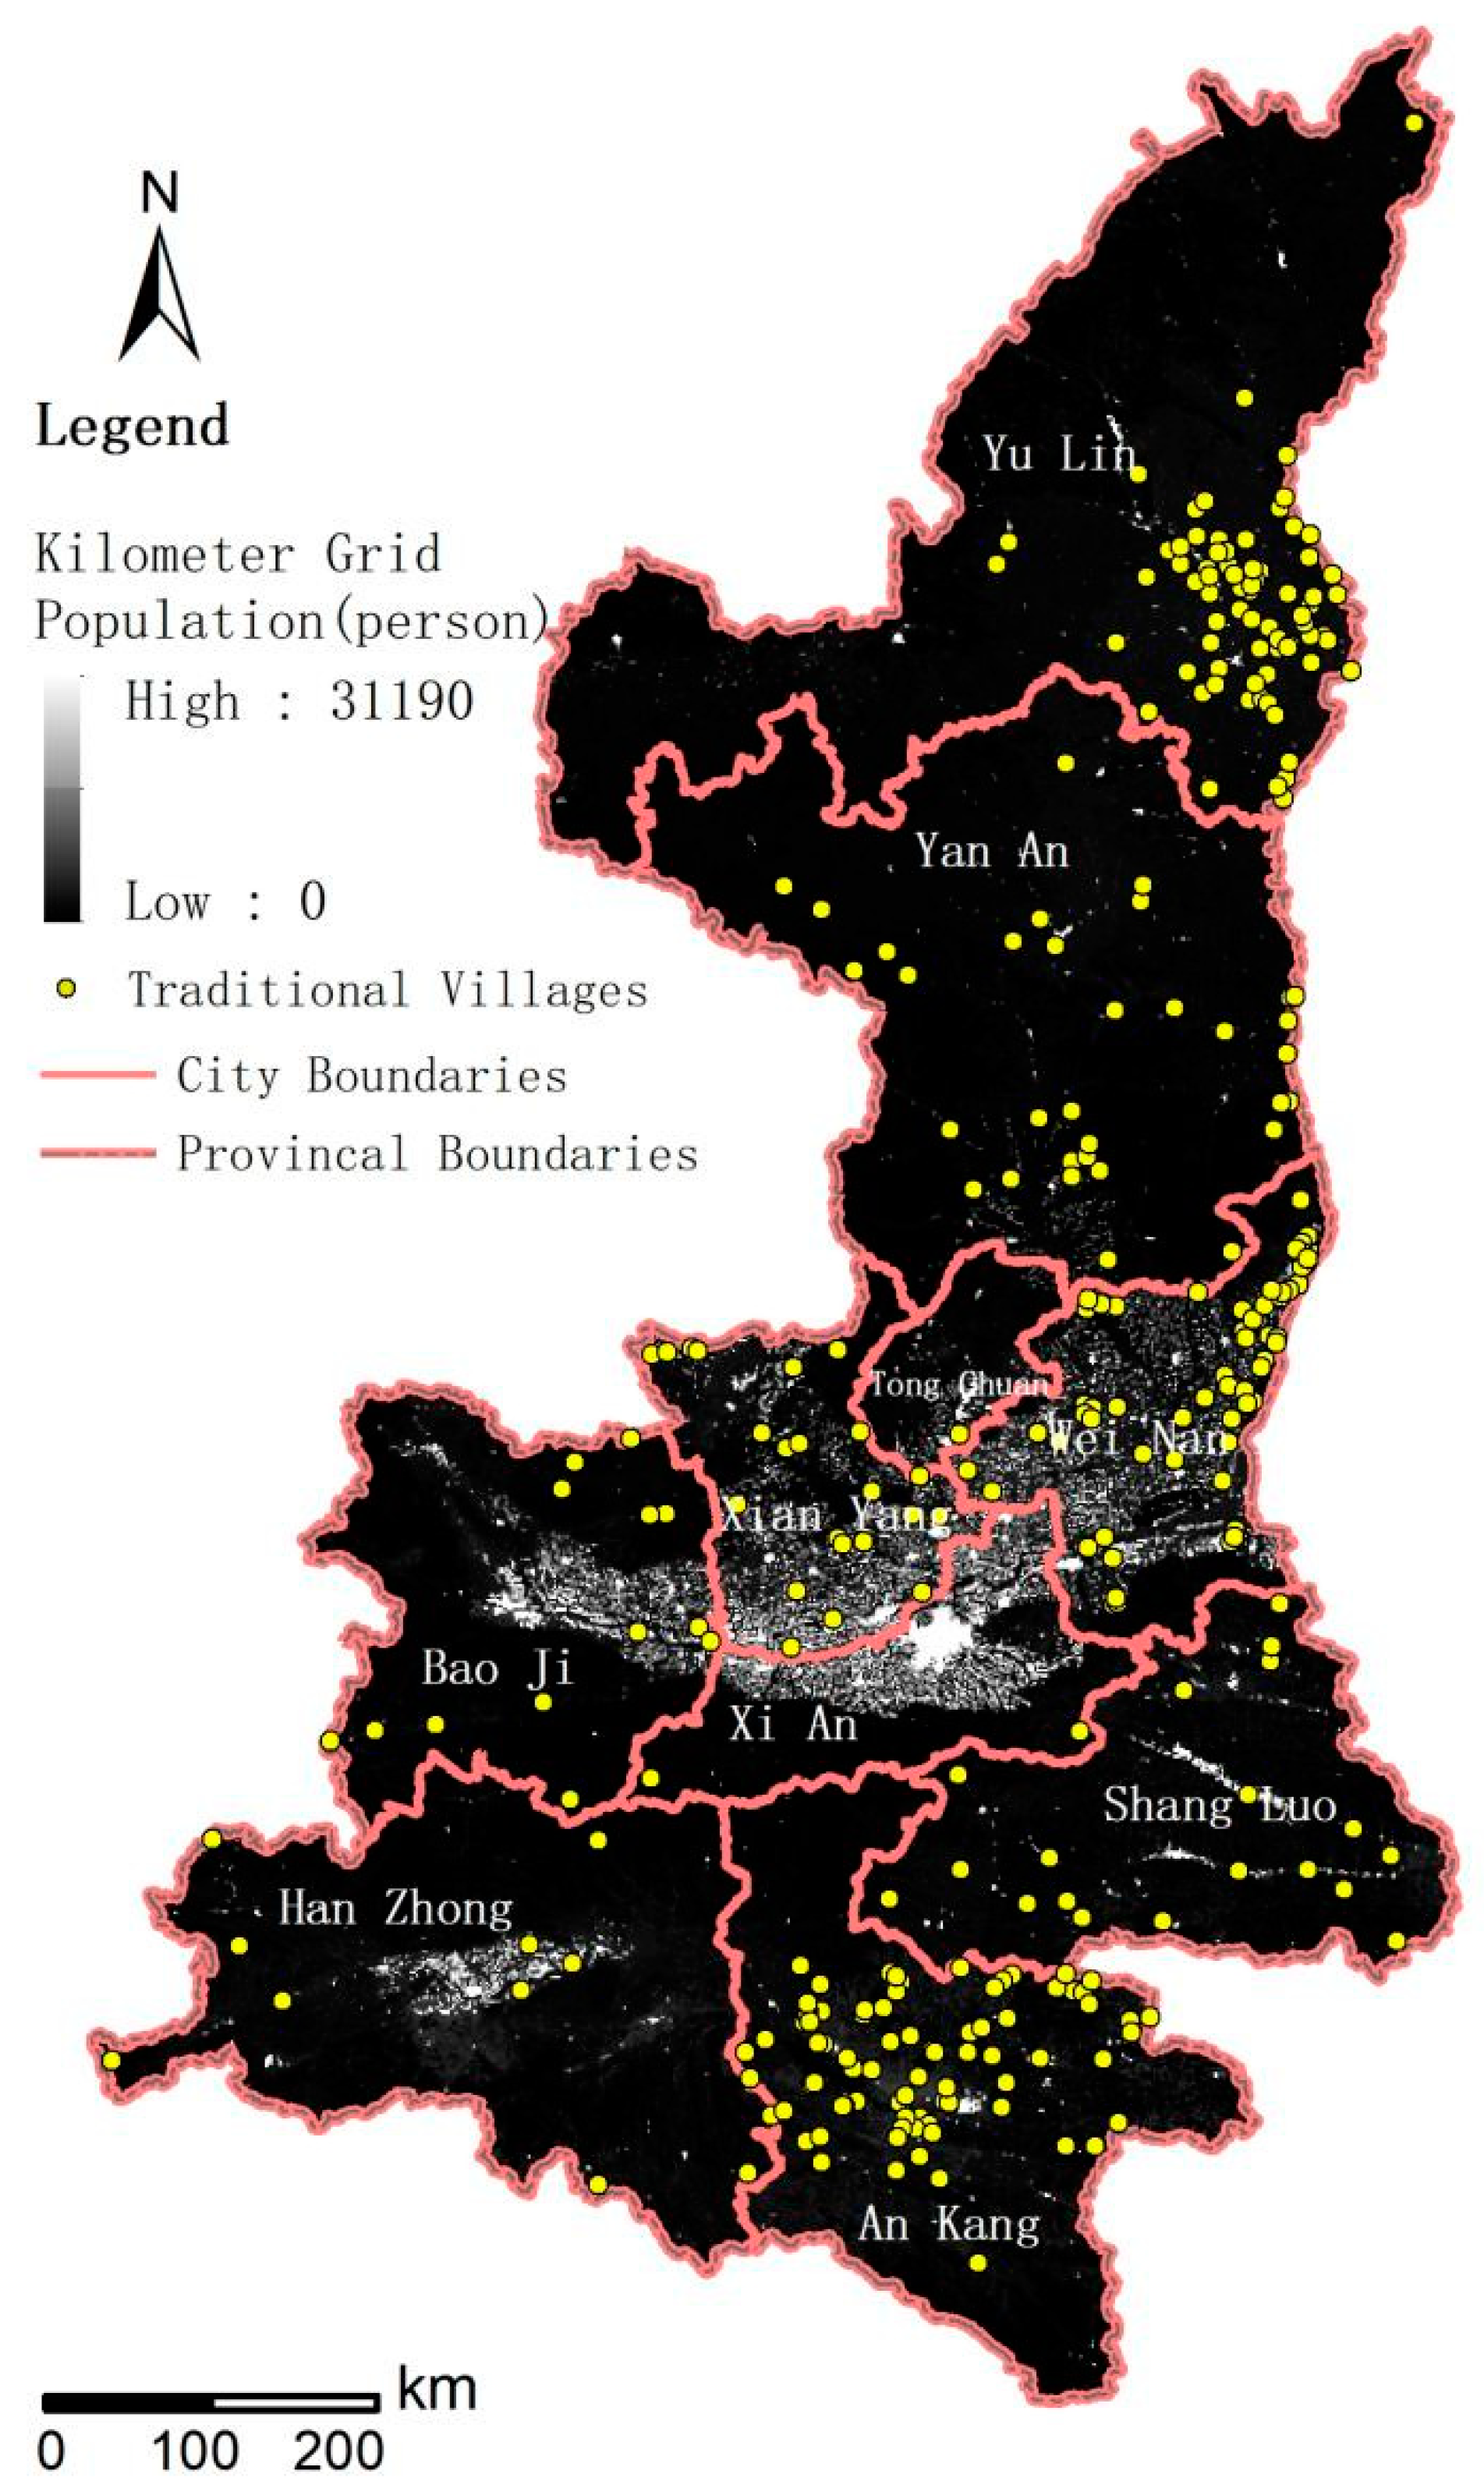
According to the superposition analysis, most areas with a population density of more than 13,000 people are in Xi’an and Baoji in Guanzhong, but no traditional villages are distributed in areas with a population density of more than 5000; a total of 40 traditional villages are in areas with a population density of more than 1000 people. The specific statistical results are shown in Table 5 below.
According to the administrative boundary line, it can be seen that the population density in the central urban area is generally high, and the number of traditional villages in this area is very small, accounting for about 0.93%. Nearly 80% of the traditional villages in the province are distributed in areas with a population density of less than 500 people, mainly in the Yulin, Ankang, and Weinan areas, while other areas are relatively evenly distributed. To some extent, the high population density indicates that the modernization level in this area is relatively high and can attract population migration, so the number of traditional villages in such areas is relatively small. In areas with a small population density, modernization development is relatively slow, and the influence of human production and life is relatively small, which provides powerful conditions for the preservation and protection of traditional villages.
4.6. GDP Feature
Through the superposition analysis of the GDP grid data set of 1 km * 1 km in 2010 [30], and the distribution characteristic map of traditional villages, the relationship between the economic development level and the spatial distribution of regional traditional villages can be studied, as shown in Figure 13.
According to the superposition analysis, it can be seen that there is only one traditional village in the high-value area, which is located in Danfeng County in southern Shaanxi Province. There are 11 traditional villages in areas with a GDP above CNY 100 million. Each of the three geographical regions has a relatively uniform distribution; areas with a GDP between CNY 20 and 50 million have 35 traditional villages, accounting for 10.84% of the total; and areas with a GDP below CNY 3 million have 213 villages, accounting for 65.94% of the total, and are concentrated in Yulin and Ankang. The economy is relatively underdeveloped, and the development and utilization of the traditional villages are less intense, but to some extent, this is conducive to better preserving the historical and cultural connotations contained in the traditional villages. The specific statistical results are shown in Table 6 below.
5. Discussion on the Distribution Mode of Traditional Villages
According to the local Moran’s correlation index of each geographical unit and the agglomeration nature of spatial high and low values, they are divided into four distribution modes: diffusion, polarizing, trough, and backward.
5.1. Diffusion Type
The distribution number of traditional villages in the geographical unit itself and the surrounding geographical unit is at a high level, and this attribute is positively correlated between the two regions. It is a high–high agglomeration area in space, and such a regional type is called the diffusion area. In general, there are two types of high–high agglomeration distribution in traditional villages in Shaanxi Province, including the area centered on Mizhi County and the area centered on Ankang City, both of which are contiguous diffusion distribution types. As the center of northern and southern Shaanxi, the two places have good economic development conditions, forming obvious contiguous diffusion distribution areas, and becoming the center of gravity for the development of traditional villages in northern and southern Shaanxi.
5.2. Polarization Type
In the region, there are a large number of traditional villages in their own geographical units, while the number in the surrounding geographical units is small. The two regions have a negative correlation. Numerically, they are in the high–low agglomeration distribution area, also known as the polarized region. Such areas have concentrated a large number of traditional villages with relatively higher numerical values than the adjacent geographical units, so they show an obvious spatial polarization phenomenon. For example, Mizhi County has changed from diffusion type to polarized type, which shows that Mizhi County has a certain inhibitory effect on the development of traditional villages in the surrounding counties and does not increase or improve the surrounding counties’ development under the radiation-driving effect of cultural development. The reason lies in the unique geographical location of Mizhi County. The diversity of the loess plateau landforms means that the settlement environment and residential buildings in the region present as various types, forming the typical cave dwellings—Mizhi buildings—on the loess plateau.
5.3. Low Trough Type
The number of traditional villages in the region is small, while in the surrounding geographical units it is large. The two regions show a negative spatial correlation. They are low–high agglomeration types in space, which is called the trough distribution mode. The key feature of this distribution mode is that more villages are distributed around the diffusion region. In general, the trough areas are mainly distributed in Hengshan District (Yulin City), Ziyang County, and Pingli County. Among them, Hengshan District (Yulin City) has changed from an insignificant distribution type to a trough area. Due to its adjacent high-value agglomeration areas such as Mizhi County and Zizhou County, there is a negative correlation between the distribution of traditional villages in space; thus, this is also the improvement and progress of high-value agglomeration areas for their development.
5.4. Backward Type
The number of traditional villages in the region and its surrounding geographical units is small, and the two regions show a positive correlation in space. It has a low–low agglomeration type, also known as the backward distribution mode. The distinctive feature of this pattern in the study area is that a cluster distribution is presented, and the surrounding geographical units of traditional villages are sparse and occasionally distributed around the polarization type. In all of the batches, there is a backward mode of large-area mass distribution, concentrated in the southwest of Shaanxi Province. From the geographical location, some of them are close to cities, and the economic development level is limited. In the process of urbanization construction, it will inevitably affect the spatial distribution of traditional villages and put them in a backward state.
6. Conclusions
Through the spatial positioning and analysis of 323 provincial traditional villages in Shaanxi Province, it can be seen that three agglomeration areas are formed with overall distribution characteristics of "concentrated between north and south and scattered in the middle.” The distribution of traditional villages in northern Shaanxi expands from southwest to northeast, the Guanzhong region expands to the north, and the development direction of traditional villages in southern Shaanxi tends to be stable. Accordingly, the center of gravity of traditional villages also deviates, moving from northeast to southwest, which is closely related to the rich cultural resources and the role of the functional area of the cultural center.
The distribution and development of traditional villages are influenced by many factors. According to the topographic conditions, people are more inclined to choose sites suitable for survival and residence, and traditional villages in the territory are mostly distributed in areas with an altitude below 1200 m. However, there are no traditional villages in northern Shaanxi below 500 m. The slope direction also has a certain guiding role in the site selection of traditional villages. Villages are mostly distributed in the Yangpo and Banyangpo areas. Areas with a relief degree of more than 200 m are not conducive to the construction and development of traditional villages. There are no traditional villages in Shaanxi Province within this scope. The water system affects human survival and life and further affects the site selection of traditional villages. Traditional villages are mostly distributed in areas with a small population and a relatively low level of economic development. This is conducive to the protection of traditional villages. There is also a certain economic basis to promote the long-term development and construction of traditional villages.
The morphological characteristics of traditional villages are the essential carrier and spiritual sustainment of local cultural content, and their importance is self-evident. In the future, more attention should be paid to protecting the integrity of the spatial structure of traditional villages. On the basis of respecting the history and retaining the truth, traditional villages should be put on the road to creative development and extending the "life cycle" of villages. Relying on the power of science and technology, the protection and inheritance of traditional villages will take on a new change, and ancient traditional villages will gain a wider audience and better development, which is also an important direction for the sustainable development of traditional villages in the future.
Funding
This article is a report of the research project “Research on the Integration of Ethnic Groups in the Northwest of the Sixteen Kingdoms and Northern Dynasties as Seen in Stone Carving Materials,” funded by the National Social Science Foundation of China (Grant No. 23XKG002).
References
- Feng, J. Model of Traditional Chinese village filing Survey; Culture and Art Press: Tianjin, 2014; pp. 10–18. [Google Scholar]
- Chen, Z.; Chen, X. Foreign trends and domestic trends in rural settlement geography research. World Geographic Research 1994, 72–79. [Google Scholar]
- Guo, X. Rural settlement development and its spatial structure in loess hilly region. Lanzhou University, 2007; pp. 19–27. [Google Scholar]
- Sevenant, M.; Antrop, M. Settlement models, land use and visibility in rural landscapes: Two case studies in Greece. Landscape & Urban Planning 2007, 80, 362–374. [Google Scholar]
- Oldfield, P. Rural settlement and economic development in Southern Italy:Troia and its contado. c.1020-c.1230. Journal of Medieval History 2005, 31, 327–345. [Google Scholar] [CrossRef]
- Argent, N.M.; Griffin, S.T. Tracing the Density Impulse in Rural Settlement Systems: A Quantitative Analysis of the Factors Underlying Rural Population Density across South-Eastern Australia, 1981-2001. Population and Environment 2005, 27, 151–190. [Google Scholar] [CrossRef]
- Smailes, P.; Argent, N.; Griffin, T. Rural population density: its impact on socialand demographic aspects of rural communities. Journal of Rural Studies 2002, 18, 385–404. [Google Scholar] [CrossRef]
- Kiss, E. Rural restructuring in Hungary in the period of socio-economic transition. Geojournal 2000, 51, 221–233. [Google Scholar] [CrossRef]
- Brown, D.L.; Kulcsár, L.J.; Kulcsár, L.; Obádovics, C. Post-Socialist Restructuring and Population Redistribution in Hungary. Rural Sociology 2005, 70, 336–359. [Google Scholar] [CrossRef]
- Czetwertynski-Sytnik, L.; Kozio, E.; Mazurski, K.R. Settlement and sustainability in the Polish Sudetes. GeoJournal 2000, 50, 273–284. [Google Scholar] [CrossRef]
- Carolan, M.S. Barriers to the Adoption of Sustainable Agriculture on Rented Land: An Examination of Contesting Social Fields. Rural Sociology 2010, 70, 387–413. [Google Scholar] [CrossRef]
- Snyder, A.R.; Mclaughlin, D.K. Female-Headed Families and Poverty in Rural America. Rural Sociology 2010, 69, 127–149. [Google Scholar] [CrossRef]
- Wang, X.; Guan, X.; Ding, J.; et al. Spatial distribution characteristics and analysis of traditional villages in Anhui Province. Journal of Anhui Agricultural University (Social Science Edition) 2017, 26, 19–25. [Google Scholar]
- Hu, S.; Yang, D.; Liu, S. Spatial pattern and historical evolution of traditional villages in Fujian Province. Economic Geography 2024, 44, 211–220. [Google Scholar]
- Jia, X.; Zhang, P.; Xie, M.; et al. Thoughts on New Rural Planning under the Context of New Urbanization in Henan Province. Zhejiang Agricultural Science 2016, 57, 754–757. [Google Scholar]
- Liu, X. Spatial distribution and influencing factors of traditional villages in Henan province. Journal of Henan University of Science and Technology: Social Science Edition 2016, 34, 5–9. [Google Scholar]
- Guo, Y. Study on the types of traditional villages in Henan Province. Cooperative Economy and Technology 2016, 20–22. [Google Scholar]
- Xue, J. Study on the types and morphology of traditional villages in Henan Province. Zhengzhou University, 2016. [Google Scholar]
- Kang, Y. Protection and inheritance of excellent traditional culture in theprocess of new urbanization in Henan Province. Zhengzhou University, 2016. [Google Scholar]
- Huang, R.; Su, H.; Wei, Z. Spatial distribution of traditional villages in Henan Province and its influencing factors. Journal of Shaanxi Normal University (Natural Science Edition) 2019, 98–105. [Google Scholar]
- Li, Y. Study on Spatial Layout Adjustment of Dangjia Village, Hancheng, Shaanxi Province. Xi’an University of Architecture and Technology, 2017. [Google Scholar]
- Lin, D. Research on Characteristic rural Planning and Design of Shaanxi Province——Taking the design of Qifeng Wan Folk Village in Luonan County as an example. Xi’an University of Architecture and Technology, 2017. [Google Scholar]
- Song, Y. Study on landscape design of traditional villages in Shizangou Village, Shaanxi Province. Xi’an University of Architecture and Technology, 2017. [Google Scholar]
- Xu, H. Take Maiping Village in Shiquan County as an example; Xi’an University of Architecture and Technology, 2018. [Google Scholar]
- Qian, J. Research on the protection and development of Traditional villages in Hanzhong City——Lefeng Village, Yuanguan Town as an example. Changan University, 2017. [Google Scholar]
- Wang, J. Take the Shaanxi section of the Ming Great Wall and the fortress as an example. Northwest University, 2017. [Google Scholar]
- Jin, Y. Research on the Protection and Utilization of Traditional Villages in ian from the View of Cultural Ecology. Changan University, 2018. [Google Scholar]
- Chen, X. Analysis and protection and development strategy of traditional villages in Hancheng. Xi’an University of Architecture and Technology, 2017. [Google Scholar]
- Fu, J.; Jiang, D.; Huang, Y. Gridded Population dataset of China (1km). Global Change Research Data Publishing and Repository, 2014.
- Huang, Y.; Jiang, D.; Fu, J.; et al. China km grid GDP distribution data set. Global Change Science Data Registration and Publishing System, 2014.
Figure 1.
Administrative division map of Shaanxi Province.
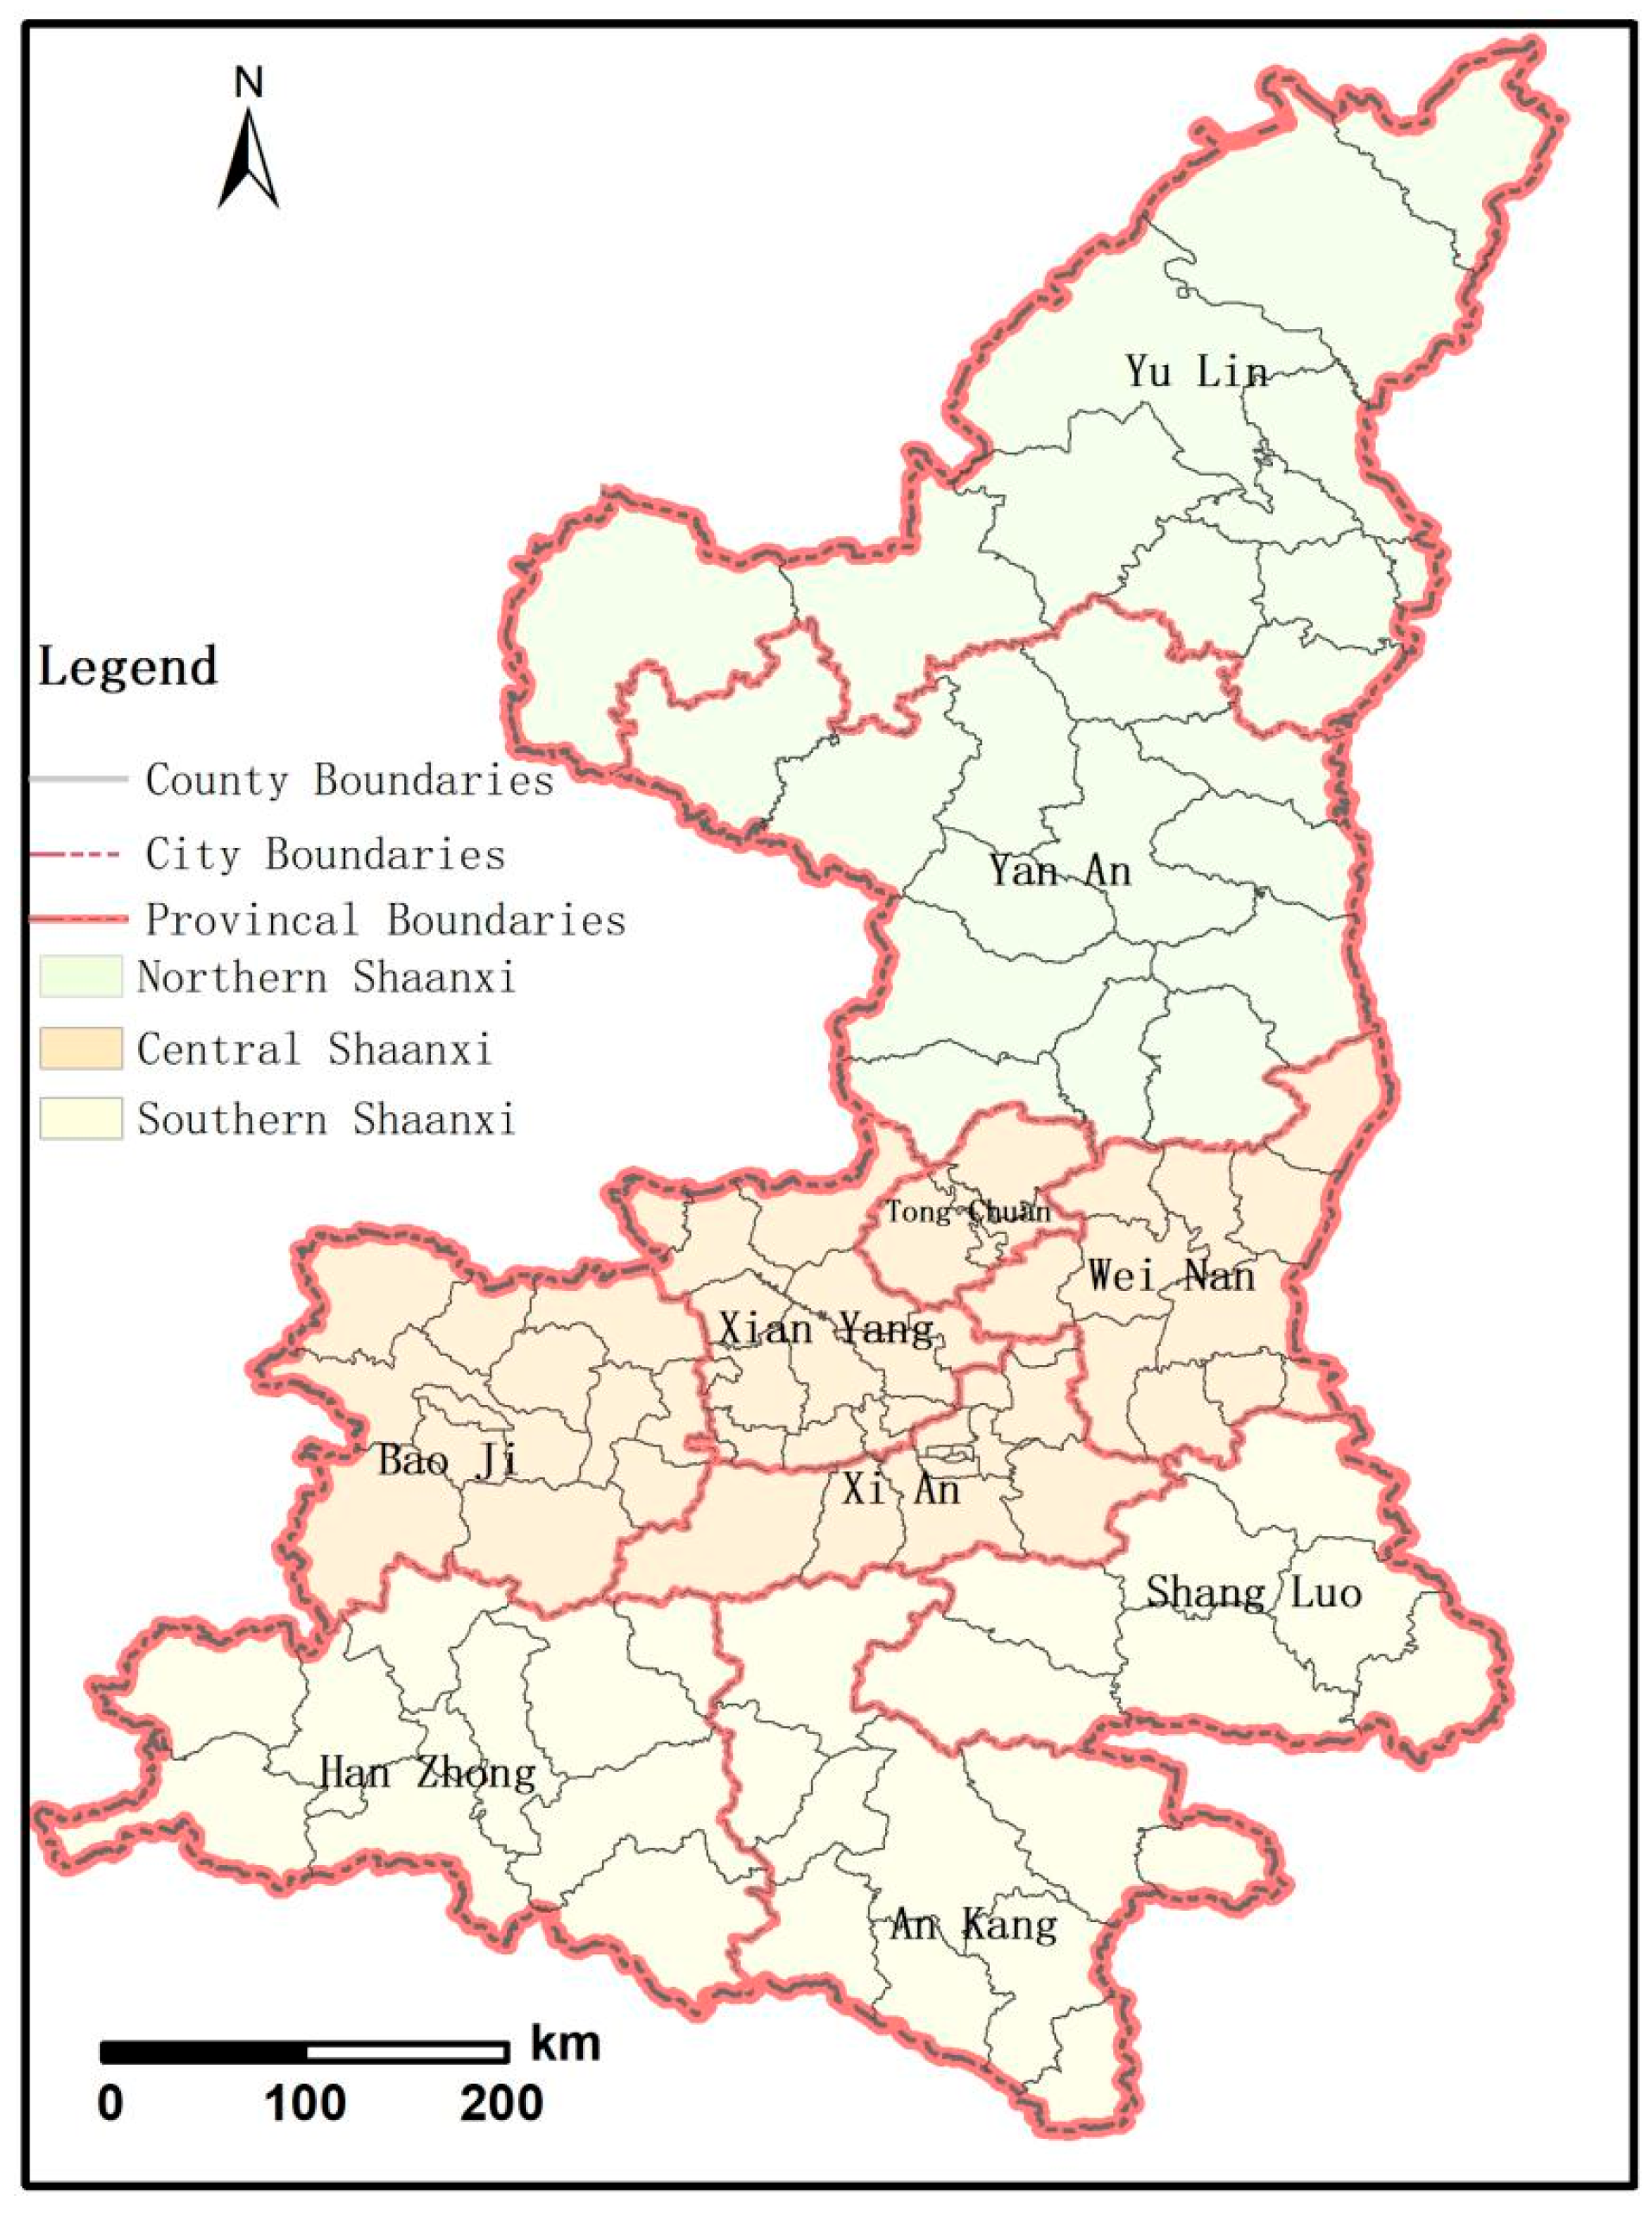
Figure 2.
Nuclear density distribution map of different batches of traditional villages in Shaanxi Province.
Figure 2.
Nuclear density distribution map of different batches of traditional villages in Shaanxi Province.
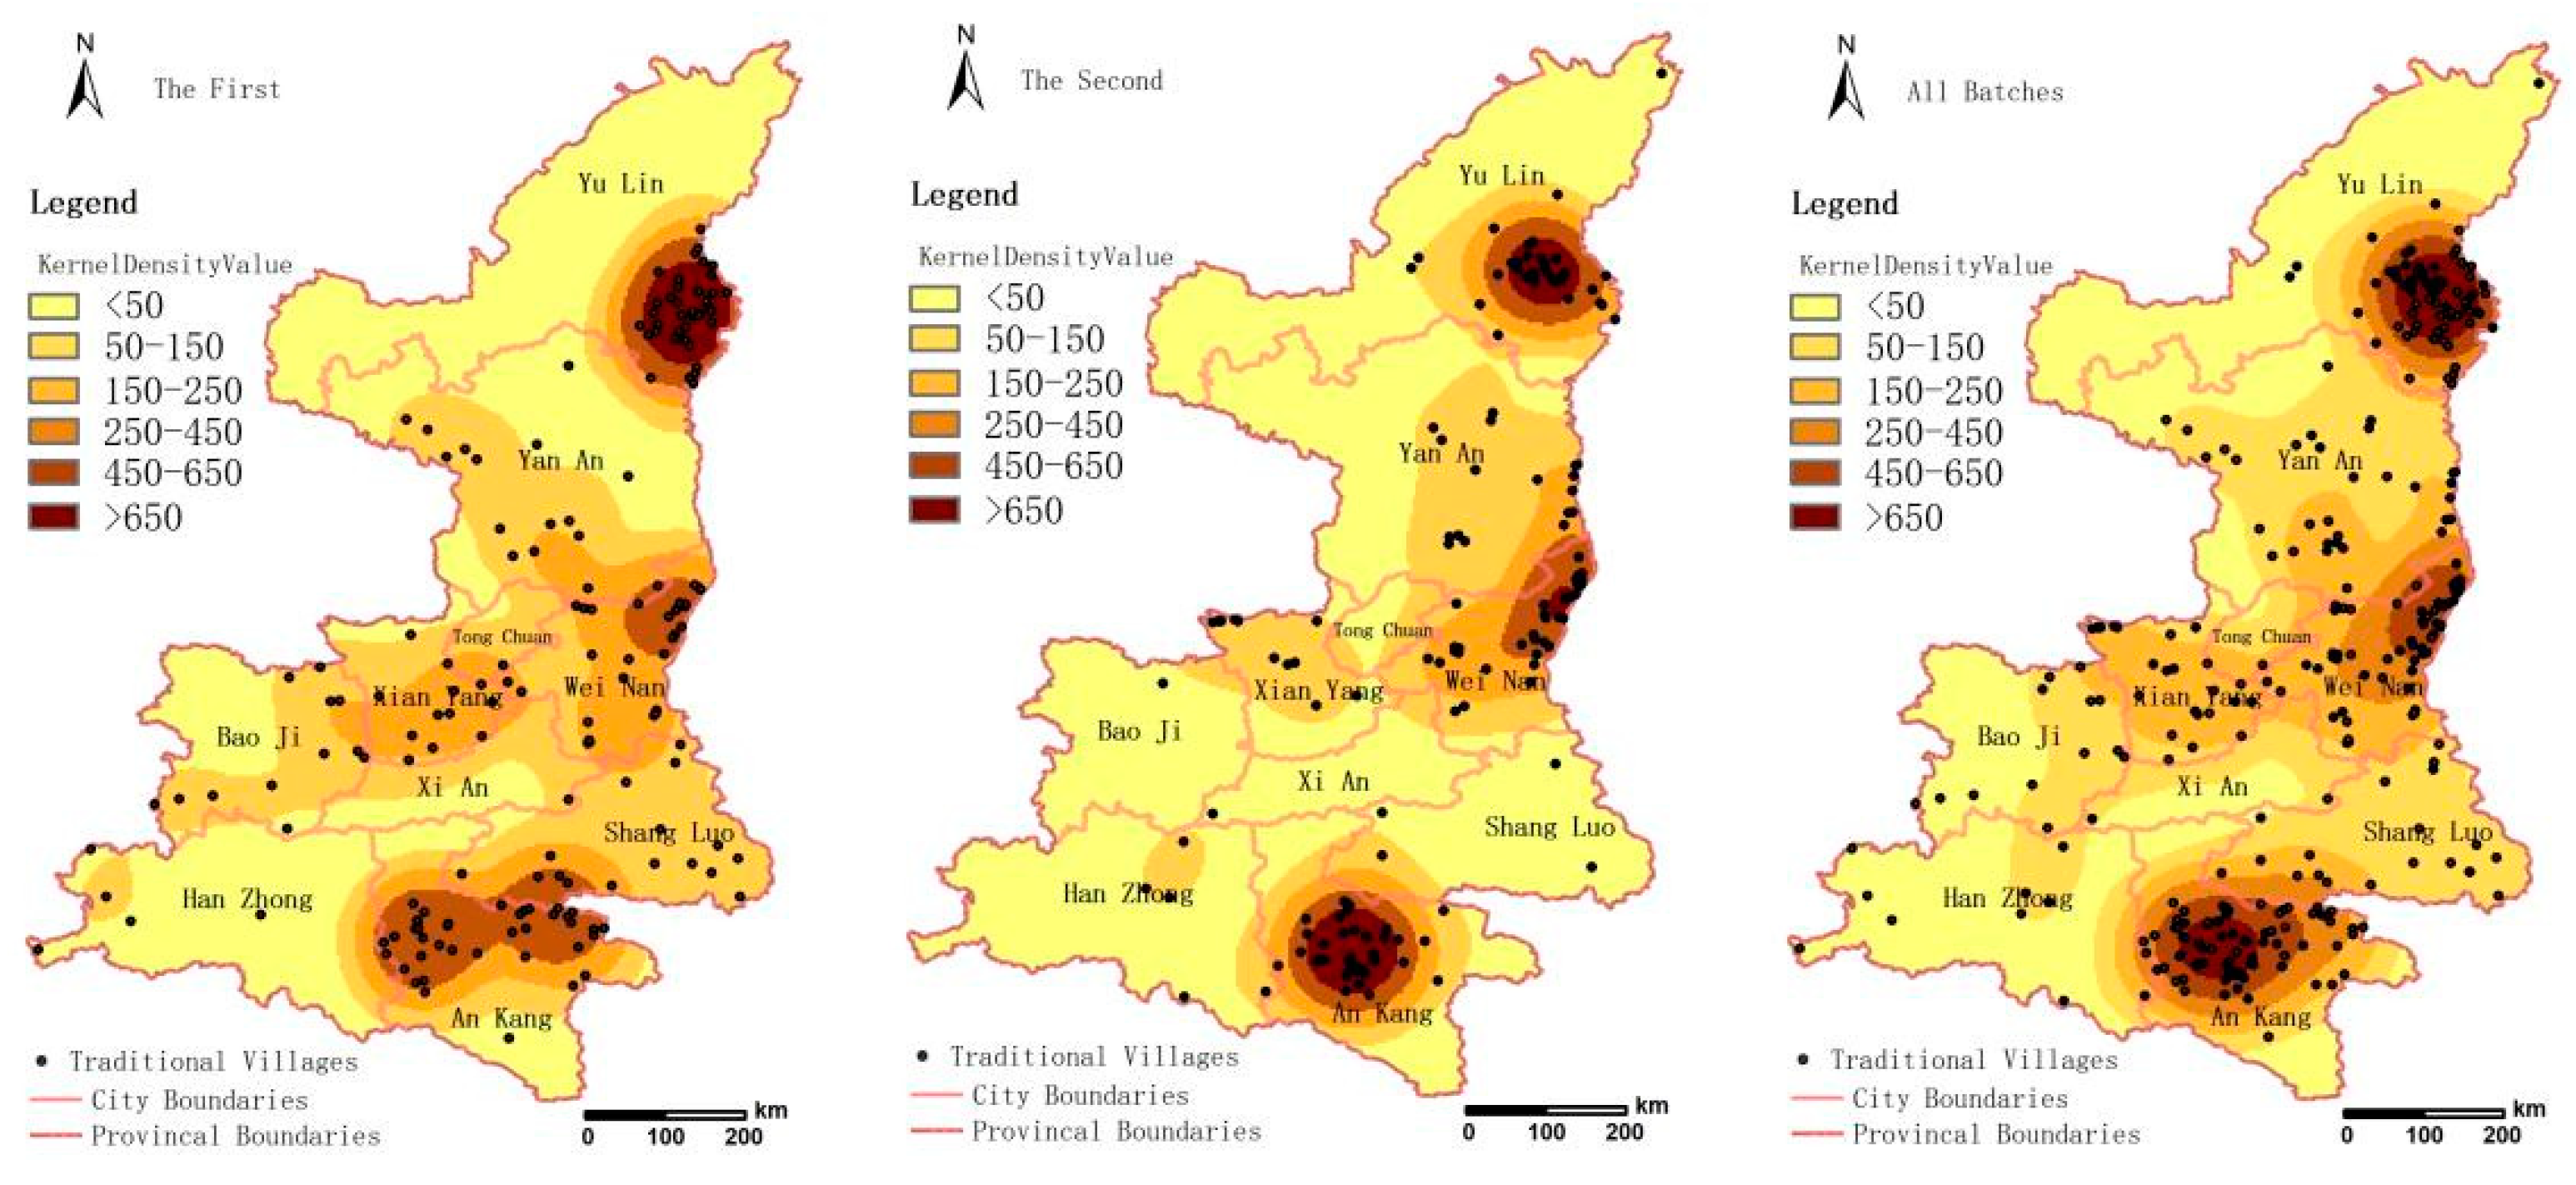
Figure 3.
Elliptic distribution trend of traditional villages in Shaanxi Province.
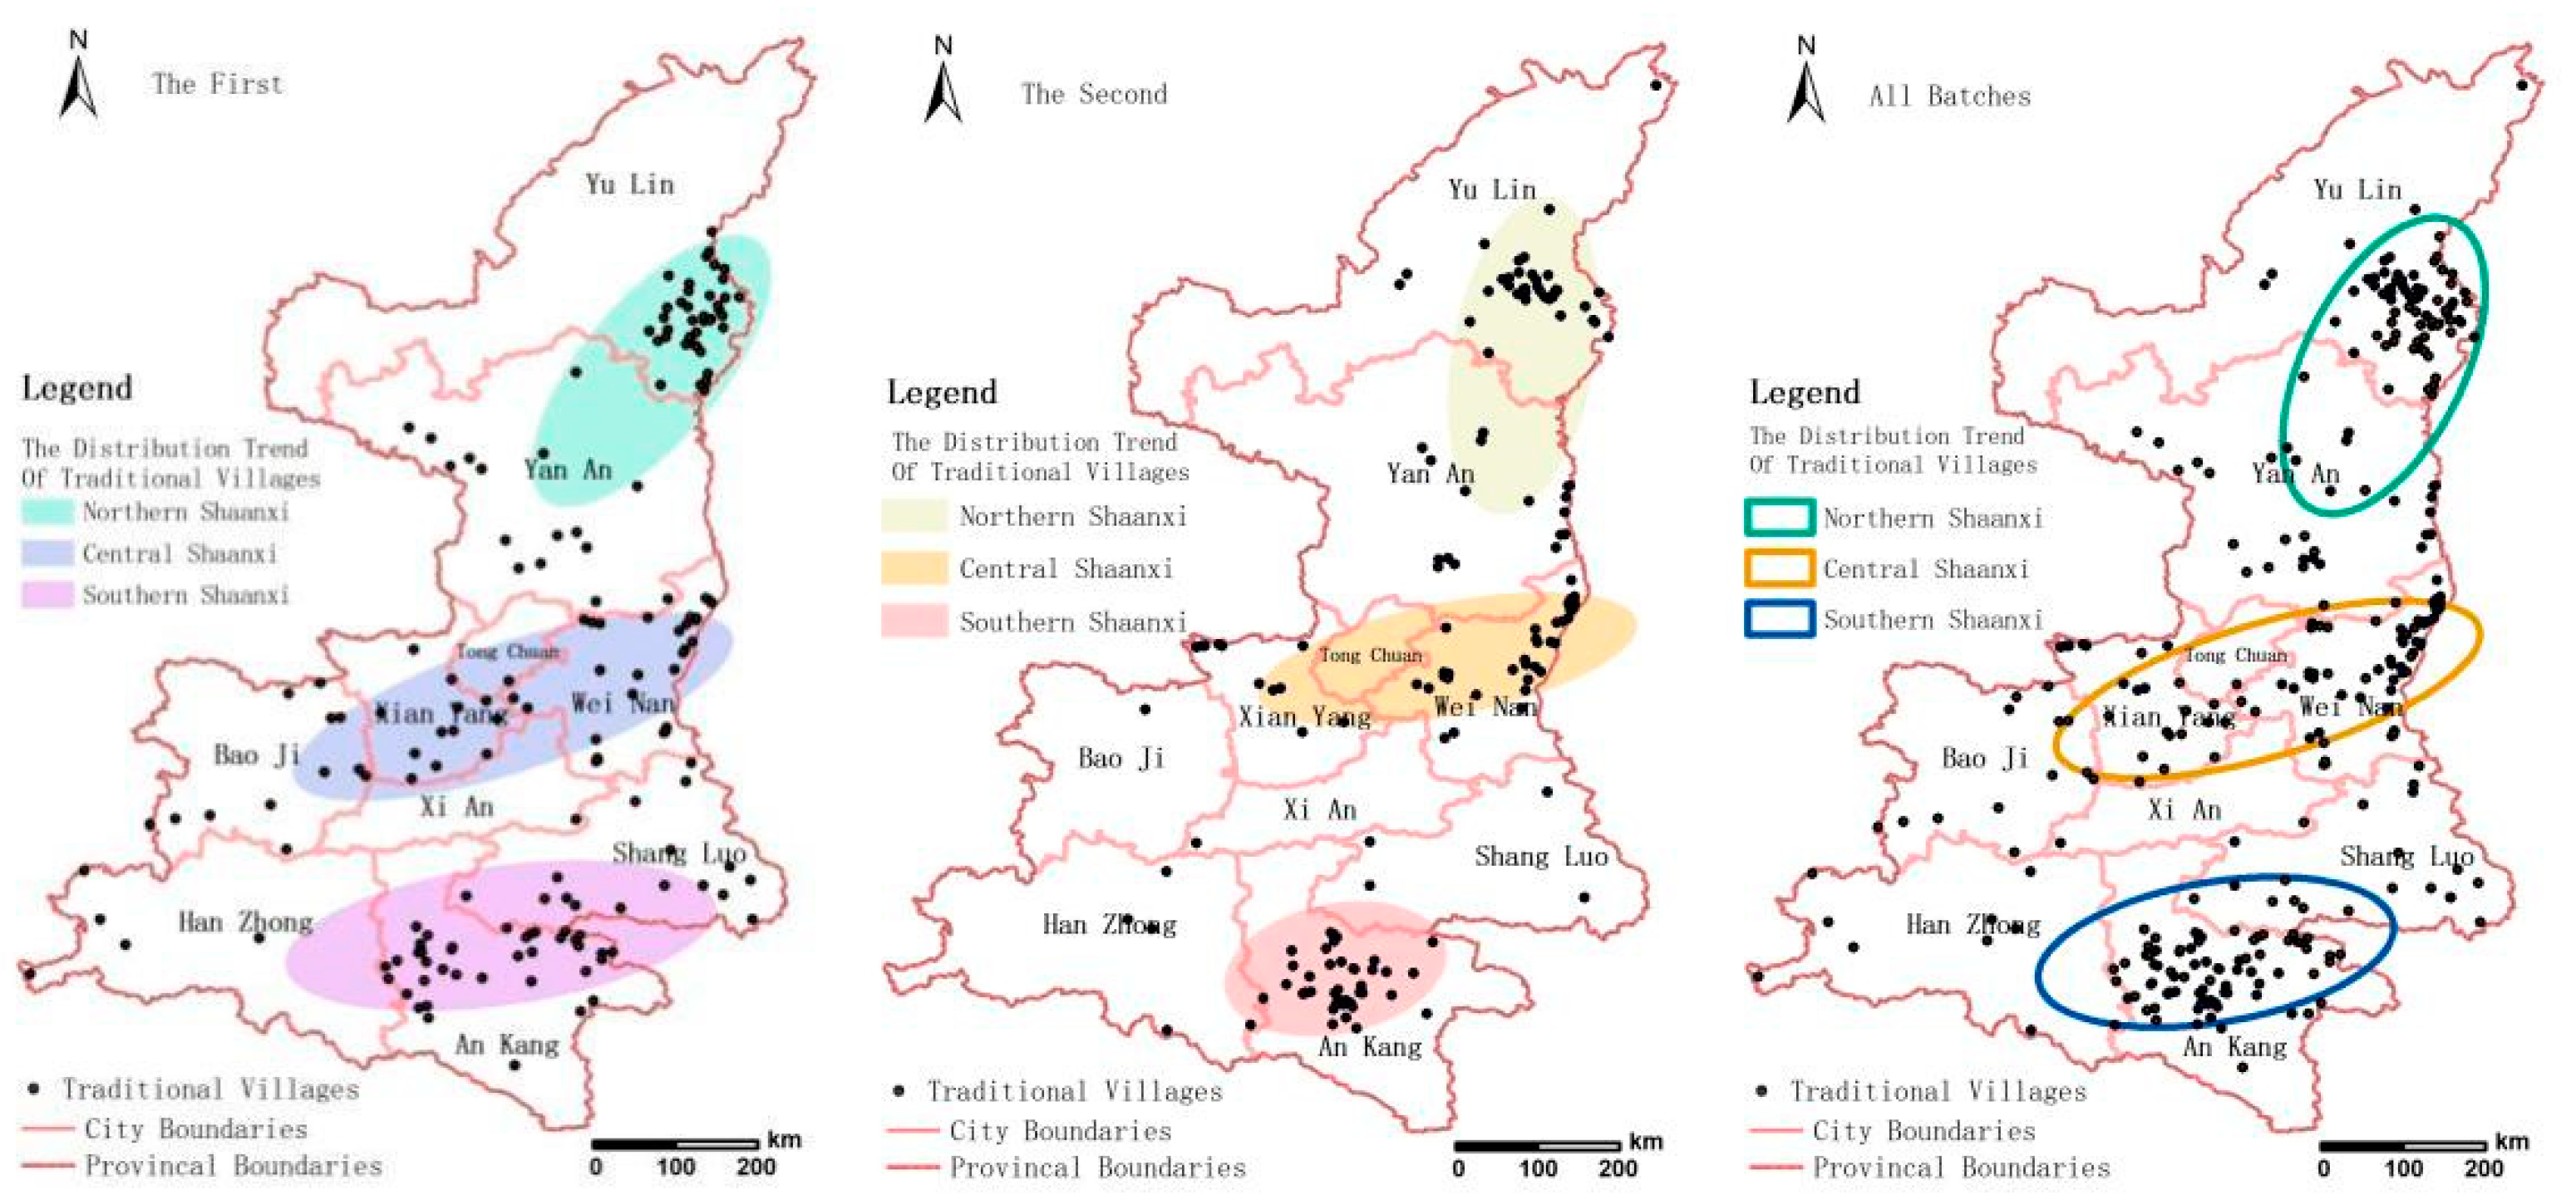
Figure 6.
LISA agglomeration patterns of different batches of traditional villages in Shaanxi Province.
Figure 6.
LISA agglomeration patterns of different batches of traditional villages in Shaanxi Province.
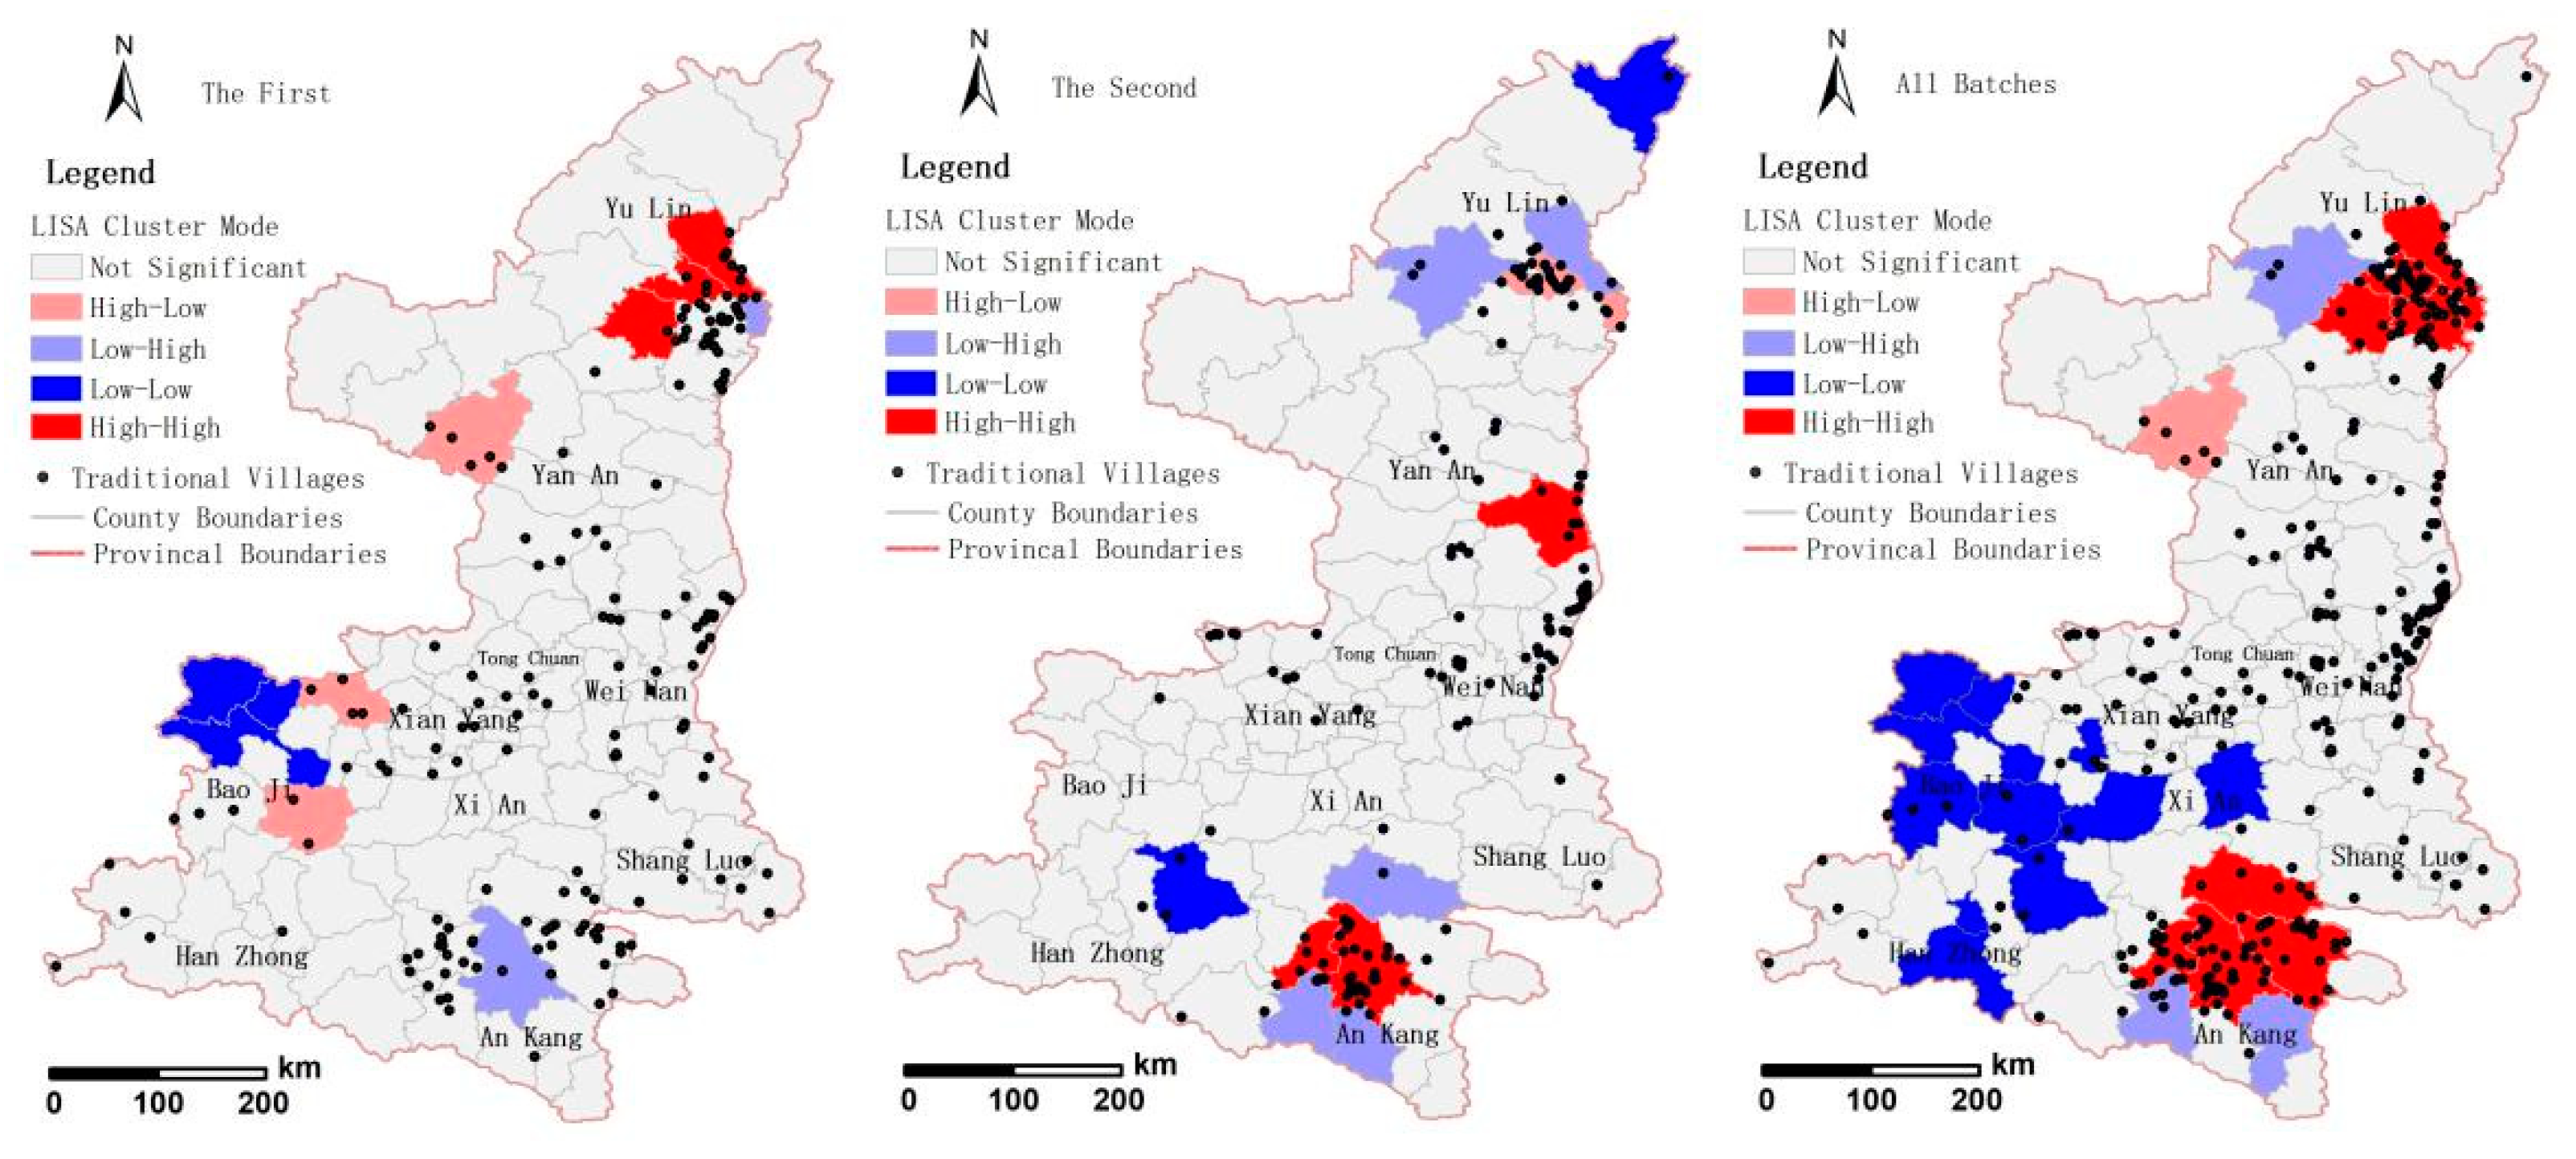
Figure 7.
Spatial distribution map of traditional villages in Shaanxi Province at different elevations.
Figure 7.
Spatial distribution map of traditional villages in Shaanxi Province at different elevations.
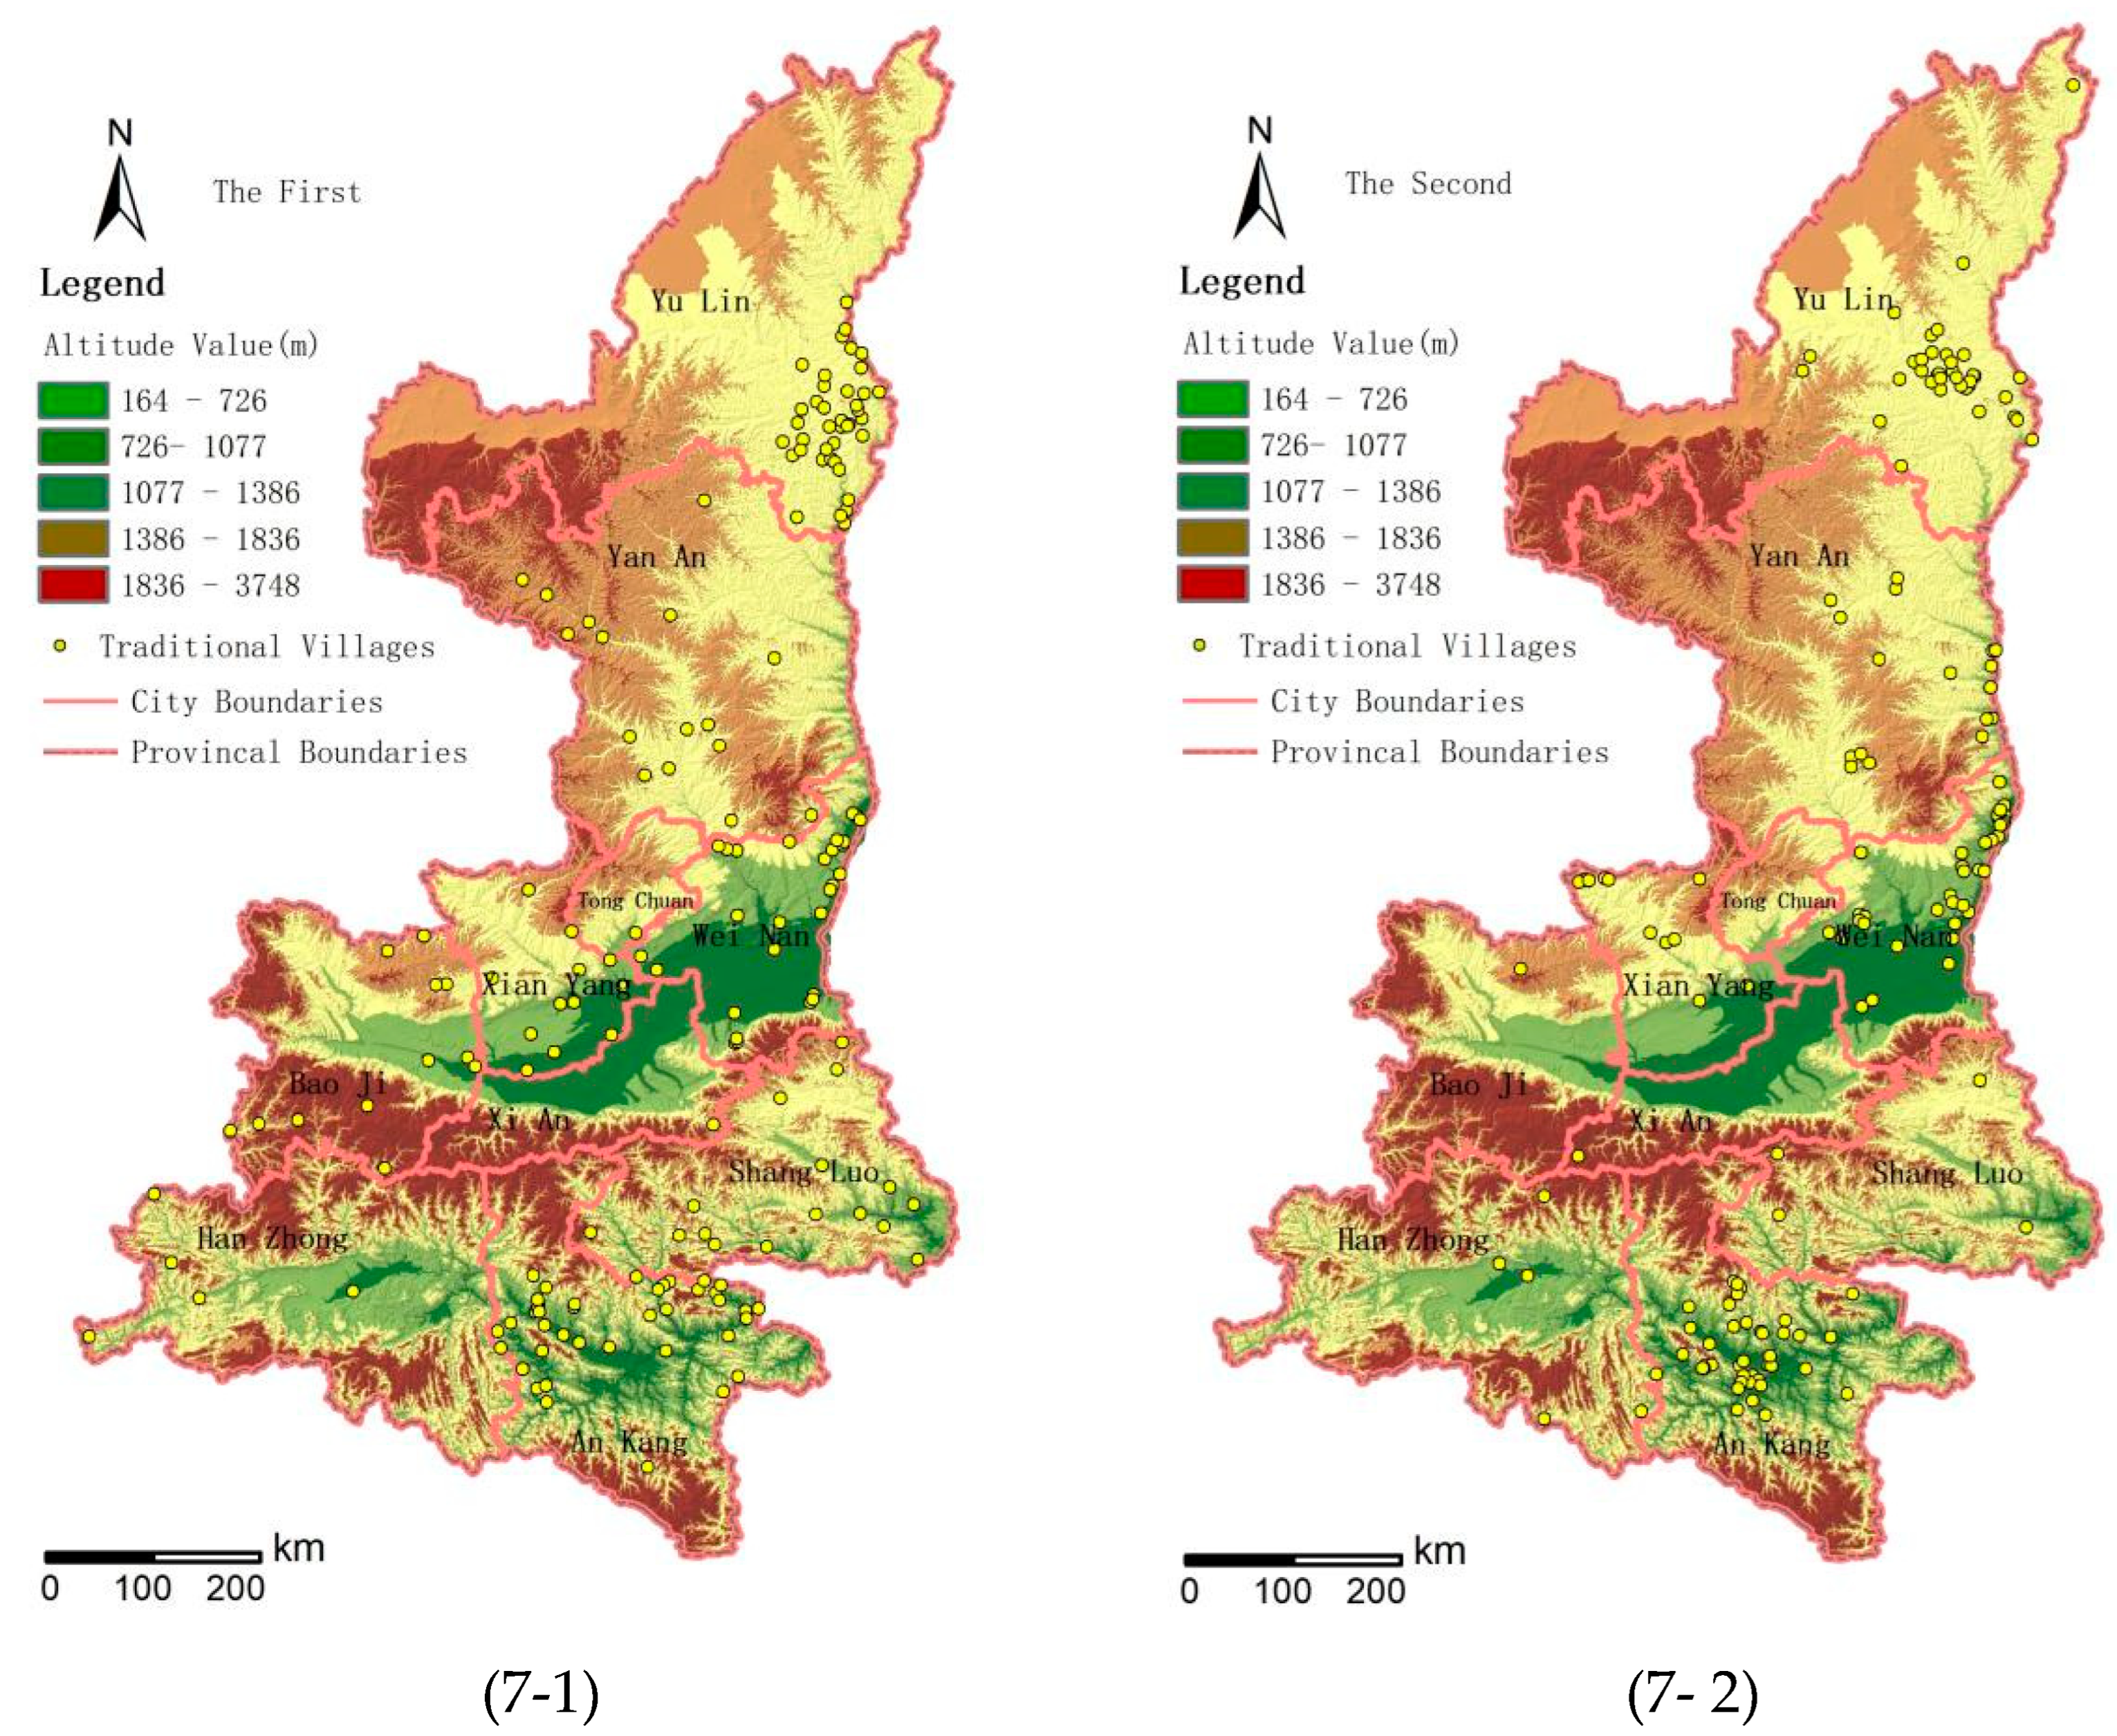
Figure 10.
Spatial distribution map of traditional villages in different terrains in Shaanxi Province.
Figure 10.
Spatial distribution map of traditional villages in different terrains in Shaanxi Province.

Figure 13.
Distribution map of traditional villages and GDP grid in Shaanxi Province.
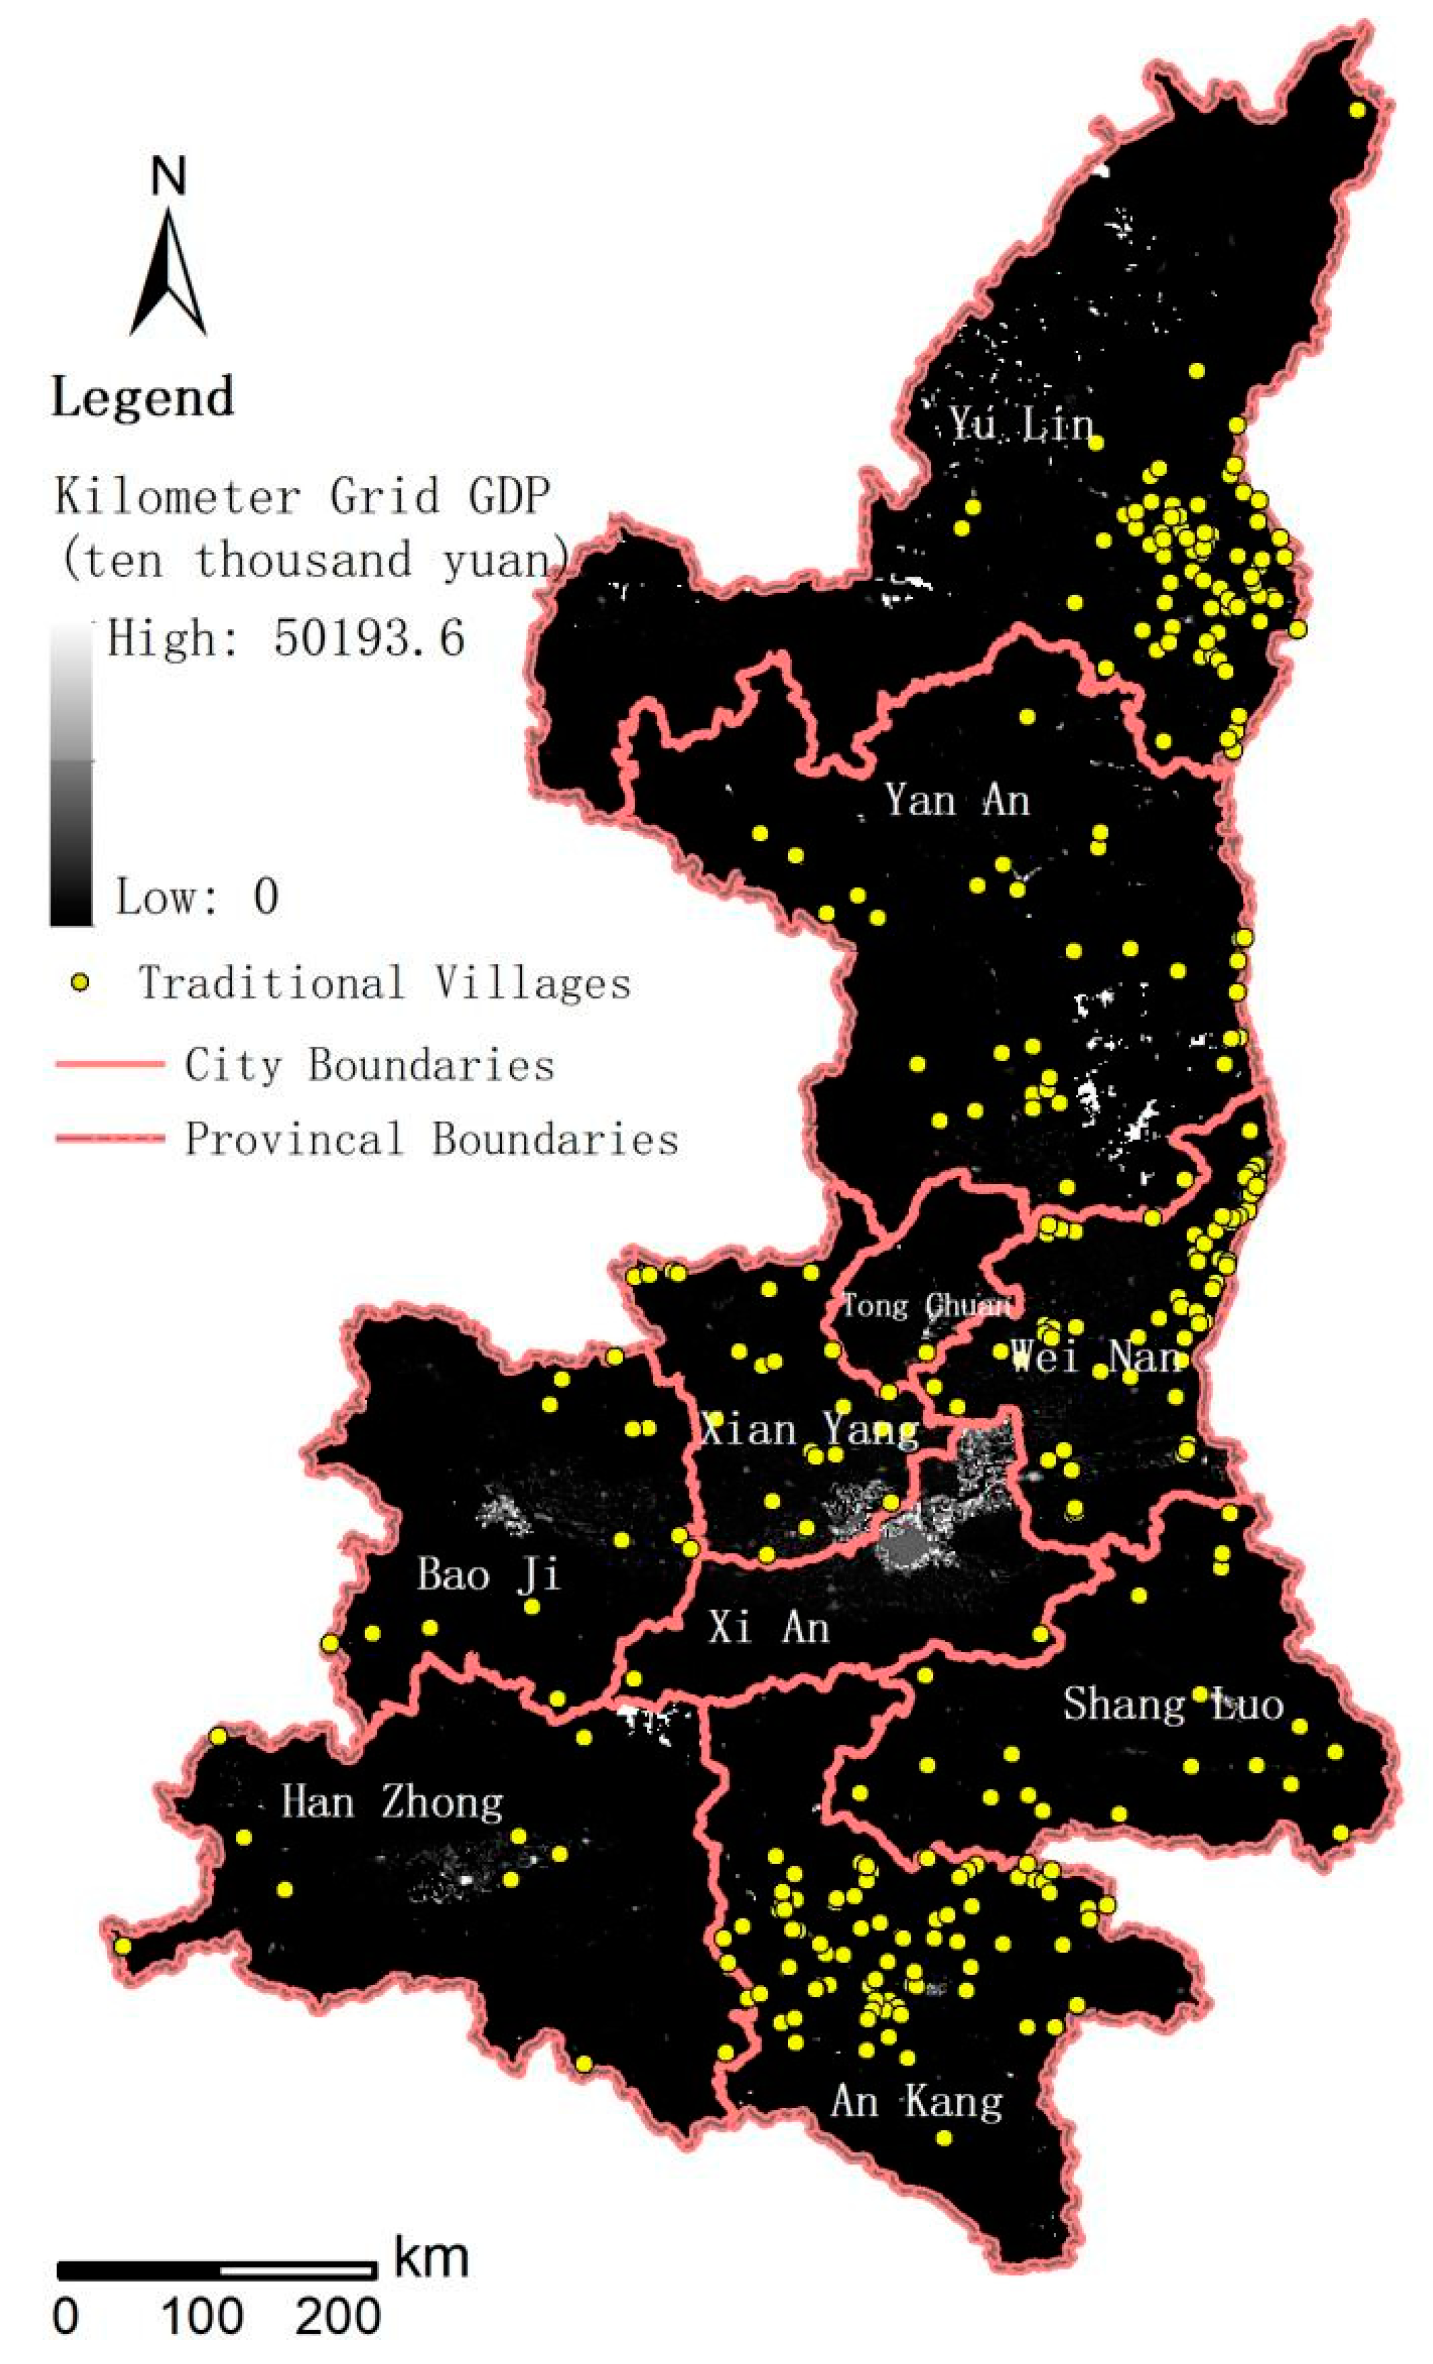
Table 1.
Clustering analysis for different batches of traditional villages.
| Number | Observed Value | Expected Value | NNI | Z-score | P price | Distribution Pattern |
|---|---|---|---|---|---|---|
| First batch in northern Shaanxi | 0.122841 | 0.154485 | 0.795166 | -2.932431 | 0.003363 | gather |
| First batch in Guanzhong | 0.138491 | 0.16876 | 0.820641 | -2.518002 | 0.009249 | gather |
| First batch in southern Shaanxi | 0.154868 | 0.203524 | 0.760929 | -3.572089 | 0.000354 | gather |
| Second batch in northern Shaanxi | 0.107903 | 0.165403 | 0.652361 | -4.841698 | 0.000001 | gather |
| Second batch in Guanzhong | 0.10568 | 0.147261 | 0.717634 | -3.781297 | 0.000156 | gather |
| Second batch in southern Shaanxi | 0.140492 | 0.152519 | 0.921144 | -1.055997 | 0.29097 | stochastic |
| All in northern Shaanxi | 0.097354 | 0.142371 | 0.683805 | -6.315378 | 0 | gather |
| All in Guanzhong | 0.093108 | 0.132222 | 0.704179 | -5.544926 | 0 | gather |
| All in southern Shaanxi | 0.105316 | 0.151562 | 0.694866 | -6.122338 | 0 | gather |
| First batch in Shaanxi | 0.132737 | 0.208266 | 0.637344 | -9.072443 | 0 | gather |
| Second batch in Shaanxi | 0.110847 | 0.197286 | 0.561861 | -10.299864 | 0 | gather |
| All in Shaanxi | 0.094399 | 0.164235 | 0.574782 | -14.597231 | 0 | gather |
Table 3.
Distribution of different batches of traditional villages in Shaanxi Province at different elevations.
Table 3.
Distribution of different batches of traditional villages in Shaanxi Province at different elevations.
| Altitude/m | <500 | 500-800 | 800-1200 | 1200-1500 | >1500 | Total/number |
|---|---|---|---|---|---|---|
| First batch in northern Shaanxi | 0 | 11 | 40 | 6 | 0 | 57 |
| First batch in Guanzhong | 18 | 18 | 12 | 5 | 1 | 54 |
| First batch in southern Shaanxi | 26 | 23 | 11 | 0 | 0 | 60 |
| Second batch in northern Shaanxi | 0 | 9 | 40 | 4 | 0 | 53 |
| Second batch in Guanzhong | 23 | 14 | 9 | 2 | 1 | 49 |
| Second batch in southern Shaanxi | 16 | 25 | 9 | 0 | 0 | 50 |
| All in northern Shaanxi | 0 | 20 | 80 | 10 | 0 | 110 |
| All in Guanzhong | 36 | 37 | 21 | 7 | 2 | 103 |
| All in southern Shaanxi | 42 | 48 | 20 | 0 | 0 | 110 |
| First batch in Shaanxi | 45 | 53 | 61 | 11 | 1 | 171 |
| Second batch in Shaanxi | 39 | 49 | 57 | 6 | 1 | 152 |
| All in Shaanxi | 84 | 102 | 118 | 17 | 2 | 323 |
Table 4.
Distribution of different batches of traditional villages in different levels of terrain relief in Shaanxi Province.
Table 4.
Distribution of different batches of traditional villages in different levels of terrain relief in Shaanxi Province.
| Grade | Level 1 | Level 2 | Level 3 | Level 4 | Level 5 | Level 6 |
|---|---|---|---|---|---|---|
| Train Relief (m) | 0-20 | 20-50 | 50-80 | 80-100 | 100-200 | More than 200 |
| Number of Villages | 139 | 116 | 55 | 10 | 3 | 0 |
Table 5.
Distribution and population density of traditional villages in Shaanxi Province.
| Population Density (Person/km2) | Number of Traditional Villages | Major Distribution Areas | Proportion (%) |
|---|---|---|---|
| <100 | 67 | Uniform distribution | 20.74 |
| 100-500 | 185 | Yulin, Ankang, Weinan | 57.28 |
| 501-1000 | 31 | Weinan | 9.60 |
| 1001-5000 | 37 | Scattered distribution, more in Guanzhong | 11.46 |
| >5000 | 3 | Yulin, Weinan | 0.93 |
Table 6.
Distribution of traditional villages and GDP density in Shaanxi Province.
| GDP Value (10,000 CNY/km2) | Number of Traditional Villages | Major Distribution Areas | Proportion (%) |
| <100 | 147 | Yulin, Yanan, Ankang | 45.51 |
| 100-300 | 66 | Yulin, Weinan | 20.43 |
| 300-500 | 11 | Yulin, Weinan, Xianyang | 3.41 |
| 500-1000 | 14 | Weinan, Xianyang | 4.33 |
| 1000-2000 | 25 | Weinan, Xianyang | 7.74 |
| 2000-5000 | 35 | Guanzhong is more evenly distributed, second in northern Shaanxi | 10.84 |
| 5000-10000 | 14 | Weinan, Yanan, Yulin | 4.33 |
| 10000-20000 | 10 | The whole province is scattered | 3.10 |
| >20000 | 1 | Shangluo | 0.31 |
Disclaimer/Publisher’s Note: The statements, opinions and data contained in all publications are solely those of the individual author(s) and contributor(s) and not of MDPI and/or the editor(s). MDPI and/or the editor(s) disclaim responsibility for any injury to people or property resulting from any ideas, methods, instructions or products referred to in the content. |
© 2024 by the authors. Licensee MDPI, Basel, Switzerland. This article is an open access article distributed under the terms and conditions of the Creative Commons Attribution (CC BY) license (http://creativecommons.org/licenses/by/4.0/).
Copyright: This open access article is published under a Creative Commons CC BY 4.0 license, which permit the free download, distribution, and reuse, provided that the author and preprint are cited in any reuse.


