
Submitted:
19 December 2024
Posted:
20 December 2024
Read the latest preprint version here
Abstract
This study presents an advanced pothole detection system utilizing ensemble learning (YOLOv9 instance segmentation and Mask R-CNN) and a Multi-Criteria Decision Making (MCDM) framework to improve detection reliability. The system combines YOLOv9 for rapid instance segmentation and Mask R-CNN for precise segmentation, experimenting with adjusted confidence thresholds to enhance detection rates in challenging scenarios. For Yolov9 instance segmentation model achieved a mean Average Precision (mAP) of 0.908 at 0.5 IoU and an F1-score of 0.58 at a confidence threshold of 0.282. The F1-confidence curve highlights a strong balance between precision and recall, but further work is needed to ensure generalization. Dynamic weights are used to merge outputs, leveraging the strengths of both models. The MCDM framework refines detections by evaluating pothole features such as size, position, and shape. While the system demonstrates high detection accuracy of 20%, narrowly and over-specific defined MCDM criteria may lead to overfitting, limiting adaptability to diverse conditions. The study underscores the importance of balancing accuracy and adaptability for reliable performance in varied environments.
Keywords:
YOLO
; Mask R-CNN
; Ensemble Learning
; MCDM
1. Introduction
The detection of road potholes is a critical issue in transportation safety, as these defects can significantly compromise vehicle integrity and driver safety. Potholes, formed through the combined effects of traffic stress and environmental factors, contribute significantly to road infrastructure degradation, resulting in increased maintenance costs, vehicle damage, and accidents. Studies indicate that potholes accounted for approximately 0.8% of road accidents in 2021, contributing to 1.4% of fatalities and 0.6% of injuries annually [1]. Additionally, the deterioration of road surfaces due to heavy traffic and adverse weather conditions can lead to potholes as deep as 10 inches [2]. This affects vehicle performance and increases operational costs for drivers, with potholes estimated to add approximately $3 billion annually in costs in Canada alone [3].
Accurate detection and risk assessment of potholes are crucial to mitigating their impact on safety and optimizing road maintenance. Other machine learning techniques, such as the YOLO (You Only Look Once) object detection algorithm, can detect potholes in real-time, which means that officials can take the necessary actions immediately [4,5,6]. YOLO models, being a part of the deep learning family, have proven remarkable in pothole detection across different settings; therefore, play a critical role in road safety management [7,8]. Furthermore, by ensuring more techniques like depth estimation, more can be understood about the severity of potholes and their effects on vehicles which would further aid in maintenance decisions [9].
This study focuses on leveraging YOLOv9, for accurate instance segmentation and Mask R-CNN, and combines it with a Multi-Criteria Decision-Making (MCDM) framework to address the limitations of previous models. While earlier YOLO-based approaches, such as YOLOv8, demonstrated effectiveness in marking and detecting potholes, they lacked the capability to identify potholes that are not deep but still contribute to road imbalance [10]. This limitation is significant, as shallow yet widespread potholes can also pose risks to vehicle stability and safety. The YOLOv8 model achieved training and validation losses of 0.06 and 0.04, respectively, but its reliance on bounding boxes restricted its ability to capture geometric details and assess the impact of individual potholes accurately. Similarly, the study by Gorro et al. employed YOLOv8 for pothole detection using bounding boxes [11]. While the results were promising, the approach struggled to detect potholes that are not deep but have larger dimensions, which can still cause significant road imbalance. This limitation led to increased false positives [11].
Building on this foundation, the current study utilizes YOLOv9’s instance segmentation capabilities to generate detailed masks of potholes, capturing their exact shapes and dimensions. These masks are analyzed to calculate key geometric properties, such as area, perimeter, and estimated depth, which are critical indicators of the severity of the potholes. The integration of an MCDM framework allows for evaluating each pothole based on multiple weighted criteria—such as size, depth, location, and shape irregularities—to rank them according to their potential hazard levels. This prioritization ensures optimal resource allocation for repairs, improving road safety and reducing costs.
Ensemble learning ensures that both models collaborate to detect potholes robustly, using YOLOv9 for rapid instance segmentation and Mask R-CNN for precise boundary refinement.
This study focuses on the research question:
1.) Can ensemble learning (YOLOv9 instance segmentation and Mask R-CNN) and an MCDM framework reliably detect potholes?
2. Literature Review
2.1. Pothole Detection Approaches
The detection of potholes has become a critical area of research due to the significant impact these road anomalies have on vehicle safety and infrastructure maintenance. Various methods have been developed to identify and assess potholes, which can be broadly categorized into computer vision-based models, sensor-based techniques, and deep learning approaches.
Computer vision techniques have been widely employed for pothole detection, leveraging image processing algorithms to analyze road conditions. Early works, such as those by Koch and Brilakis, utilized texture analysis and machine learning classifiers to distinguish between pothole and non-pothole pavement textures, achieving improved accuracy through parameter optimization Koch & Brilakis [12]. Ryu et al. further advanced this field by proposing an image-based pothole detection system that integrates various features for enhanced detection performance, although it requires more processing time compared to simpler methods [13]. More recent approaches, such as those reviewed by Ma et al., highlight the evolution of computer vision techniques from classical 2D image processing to 3D point cloud modeling, emphasizing the effectiveness of convolutional neural networks (CNNs) in achieving high detection accuracy [14]. However, these vision-based methods are often sensitive to environmental conditions, such as lighting and surface water, which can hinder detection accuracy [15].
Sensor-based methods typically involve the use of accelerometers and other vibration sensors to detect potholes based on the physical responses of vehicles traversing affected areas. For instance, vibration-based methods have been shown to effectively identify road anomalies by analyzing the signals produced when vehicles pass over potholes [16]. Although these methods can provide direct measurements of road conditions, they may miss detections if the vehicle does not directly traverse the pothole, leading to potential gaps in data [17]. Additionally, some studies have explored the integration of sensor data with image processing techniques to enhance detection capabilities, combining the strengths of both approaches [18].
Deep learning has emerged as a powerful tool for pothole detection, particularly through the application of CNNs. Recent studies, such as those by Dewangan and Sahu, have demonstrated the effectiveness of CNNs in achieving high precision and recall rates for pothole detection, outperforming traditional methods [19]. Furthermore, the YOLO (You Only Look Once) framework has gained traction for its ability to perform real-time detection, allowing for rapid identification and classification of potholes in various conditions [20]. The adaptability of deep learning models to different datasets and their capacity for continuous learning make them particularly promising for future pothole detection systems [21]. However, challenges remain in terms of data quality and the need for extensive training datasets to ensure robust performance across diverse environments [22].
2.2. Multi-criteria Decision Making
The prioritization of road repairs and risk assessment in infrastructure maintenance is a critical area of study, particularly given the increasing demands on road networks and the necessity for effective resource allocation. Multiple studies have employed Multi-Criteria Decision Making (MCDM) approaches or similar methodologies to address these challenges, each contributing unique insights into the prioritization of road maintenance.
One notable study by Orugbo et al. utilized a hybrid model combining Reliability-Centered Maintenance (RCM) and the Analytic Hierarchy Process (AHP) to prioritize maintenance for trunk road networks. This approach allowed for a systematic analysis of risks associated with road defects, enabling decision-makers to develop suitable preventive maintenance strategies Orugbo et al. [23]. The integration of AHP facilitated the decomposition of complex maintenance decisions into manageable components, allowing for a more nuanced understanding of conflicting objectives and multi-criteria evaluations. Similarly, Agabu’s research focused on sustainable prioritization of public asphalt-paved road maintenance, emphasizing the need for a robust framework that incorporates various factors such as road condition, traffic levels, safety, and environmental considerations [24]. This study highlights the complexity of decision-making in road maintenance, where multiple criteria must be balanced to achieve equitable outcomes under budget constraints.
Bikam’s work on logistical support for road maintenance in Vhembe district municipalities underscores the importance of planned maintenance in reducing road accidents and disaster risks. By utilizing Geographic Information Systems (GIS) for monitoring and planning, the study advocates for a proactive approach to road maintenance that can lead to significant long-term savings and enhanced safety [25]. This aligns with the broader trend of employing data-driven methodologies to inform maintenance decisions. In another study, Adnyana and Sudarsana applied the STEPLE method for risk analysis in road maintenance projects in Bali. This method assesses the potential negative impacts on stakeholders and the environment during construction, emphasizing the need for comprehensive risk management strategies in infrastructure projects [26]. Such approaches are essential for minimizing adverse effects while ensuring that maintenance activities are carried out effectively
Augeri et al. proposed an interactive multi-objective optimization approach for urban pavement maintenance, combining the Interactive Multiobjective Optimization (IMO) with the Dominance-based Rough Set Approach (DRSA). This innovative framework allows for the consideration of multiple objectives and constraints, facilitating a more effective decision-making process in road maintenance management [27]. The ability to incorporate stakeholder preferences into the optimization process enhances the relevance and applicability of the maintenance strategies developed. Moreover, the study by Lungu introduced a Score Card Utility Matrix for prioritizing asphalt-paved road maintenance projects, illustrating the complexity of decision-making in this domain. This matrix allows for a structured evaluation of various criteria, aiding local and international road authorities in making informed prioritization decisions [28].
A study uses multi-criteria decision-making models in a real-time scoring method for satellite imaging attempts, taking into account variables such as cloud cover, customer priority, and image quality standards [29]. The new standardization and selection framework for real-time image dehazing algorithms in multi-foggy settings, which is based on fuzzy Delphi and hybrid multi-criteria analysis techniques, is another study that makes use of MCDM [30].
2.3. Limitations of Existing Studies
The existing studies on pothole detection and risk assessment methodologies reveal several challenges and limitations that hinder their effectiveness. These limitations can be categorized into issues related to depth estimation, integration with risk assessment models, and the overall robustness of detection methods.
Many current pothole detection methods, particularly those based on image processing and computer vision, struggle with accurately estimating the depth of potholes. For instance, while some studies utilize 2D imaging techniques, they often fail to provide comprehensive depth information, which is critical for assessing the severity of road anomalies and planning maintenance strategies [31]. Wang et al. highlighted that traditional methods relying on single thresholds for detection often yield high false positives, which can obscure the true condition of the road surface [32]. Without accurate depth estimation, maintenance prioritization may be misguided, leading to either over-investment in minor issues or neglect of more severe problems.
Another significant limitation is the insufficient integration of pothole detection systems with comprehensive risk assessment models. Many existing approaches focus solely on detection without considering the broader implications of potholes on road safety and infrastructure resilience. For example, while Dewangan and Sahu’s model achieved promising detection rates, it did not incorporate risk factors associated with pothole impacts on vehicle safety or infrastructure longevity [33]. Similarly, Koch and Brilakis emphasized the need for machine learning techniques to classify pavement textures but did not address how these classifications could inform risk assessments or maintenance strategies [33]. The lack of a holistic approach that combines detection with risk evaluation can lead to suboptimal decision-making in road maintenance.
Real-time detection capabilities are essential for effective pothole management, yet many methods face challenges in processing speed and accuracy. Ryu et al. noted that their proposed method required significant processing time, which could hinder its application in real-time scenarios [34]. This limitation is compounded by the need for extensive data pre-processing and feature extraction, which can delay the detection process and reduce the system’s responsiveness to emerging road hazards. Additionally, the reliance on high-quality images and favorable environmental conditions can further limit the effectiveness of these systems, as adverse weather or poor lighting can significantly impact detection accuracy [35,36].
Many advanced detection methods, such as those utilizing stereo vision or deep learning algorithms, require sophisticated hardware and software setups that may not be feasible for all municipalities or road maintenance authorities. For instance, while stereo vision techniques can provide 3D measurements, they necessitate complex calibration processes and high computational power, which may not be readily available in all contexts [37]. This reliance on advanced technologies can create disparities in the implementation of pothole detection systems, particularly in resource-limited settings.
3. Methodology
3.1. System Overview
Figure 1 shows the general overview of our proposed pothole detection system. It shows the overview how ensemble learning is performed and how to apply MCDM in the pothole detection problem. The details of each process is explained in the later section of this paper.
3.2. YOLOv9 Model for Pothole Detection
YOLOv9, which was released in early 2024, marks a substantial leap in real-time object-detecting technology. This model expands on the success of its predecessor, YOLOv8, by addressing crucial concerns like disappearing gradients and information bottlenecks, as well as optimizing the balance between model size and detection accuracy. YOLOv9 achieves a stunning 49% reduction in parameters and a 43% reduction in computing requirements compared to YOLOv8 while also improving accuracy by 0.6% [38]. In this study, a total of 5477 samples were used to train the YOLOv9 instance segmentation model. The 5477 samples include augmented samples. The augmentation techniques and the ratio of the training and testing set that were used in this study are the following:
Augmentations
Outputs per training example: 3 Rotation: Between -15° and +15° Shear: ±10° Horizontal, ±10° Vertical
Dataset Splitting
train_set = 5477 images (82%)
valid_set = 608 images (9%)
test_set = 608 images (9%)
3.3. Mask R-CNN
Mask R-CNN enhances traditional object detection capabilities by adding a segmentation branch to identify object masks in addition to bounding boxes. This capability is particularly beneficial for accurately delineating potholes from the surrounding road surfaces, providing more detailed information essential for effective decision-making in infrastructure management [39]. The integration of Mask R-CNN within the ensemble framework allows for precise instance segmentation, enabling the system to distinguish between various types of road defects and better assess their severity [39].
3.4. Ensemble Learning: Key Steps in Ensemble Learning
- 1.
- Model Outputs: YOLOv9 outputs bounding boxes , confidence scores , and classes . Mask R-CNN outputs instance masks , bounding boxes , and confidence scores .
- 2.
- Intersection Over Union (IoU): To compare detections from both models, use IoU:where is the bounding box from YOLOv9 and is the bounding box from Mask R-CNN.
- 3.
- Confidence Aggregation: Combine confidence scores and :
- 4.
- Final Detection Decision: A pothole is detected if:
3.5. Multi-Criteria Decision Making (MCDM)
Multi-Criteria Decision Making (MCDM) is a collection of strategies and processes for evaluating and prioritizing various conflicting criteria in decision-making. It is frequently used in circumstances where judgments must balance trade-offs between competing objectives, such as cost, quality, and performance. In the context of pothole detection, MCDM can be used to rank identified potholes based on measurable parameters such as size, confidence score, location, and shape in order to improve accuracy in detecting potholes [40]. Incorporating MCDM techniques into the detection framework allows for a systematic evaluation of different detection results produced by YOLOv9 and Mask R-CNN. By using criteria such as detection accuracy, processing time, and operational cost, MCDM helps prioritize the most reliable outputs from the ensemble. This process not only enhances decision-making efficiency but also ensures that the chosen detection method aligns well with the specific needs of road maintenance teams and local governments.
- 1.
-
Criteria Definition: Define measurable factors for pothole evaluation:
- S: Size of the pothole (area in pixels).
- C: Aggregated confidence score computed dynamically from the detection models.
- L: Location or position of the pothole (e.g., proximity to road center).
- 2.
- Normalization of Criteria: Each criterion must be scaled to a comparable range (e.g., [0, 1]) to avoid bias. Normalization is done using:where is the normalized value for criterion j of pothole i.
- 3.
-
Dynamic Weight Assignment: Assign weights dynamically for each criterion. For confidence scores (C), weights are computed based on the relative contributions of YOLOv9 and Mask R-CNN:Then, the aggregated confidence score (C) is:The weights for size (S) and location (L) can be set manually or adjusted dynamically based on application needs, ensuring:
- 4.
- Overall Score Computation: Compute a weighted score for each pothole:where is the overall priority score for pothole i. Higher indicates higher priority for repair.
3.6. Evaluation Metrics
- 1.
- Circularity for Shape Verification:
- 2.
- Size Measurement:
- 3.
- Centroid and Location:
3.7. Combining MCDM and Ensemble Learning
The final decision combines MCDM with ensemble learning:
- 1.
- Use ensemble learning to ensure reliable detection.
- 2.
- Apply MCDM to rank and prioritize potholes.
Final Priority Score:
3.8. Final Algorithm
The final algorithm integrates ensemble learning and a multi-criteria decision-making (MCDM) framework for pothole detection, evaluation, and prioritization. The key steps of the algorithm are outlined below:
- 1.
-
Input:
- Source: Image or video frame.
- Models: YOLOv9 and Mask R-CNN for ensemble learning.
- 2.
-
Model Outputs:
- YOLOv9 outputs:where are bounding boxes, are confidence scores, and are classes.
- Mask R-CNN outputs:where are instance masks, are bounding boxes, and are confidence scores.
- 3.
- Intersection Over Union (IoU): To compare overlapping detections:where and are bounding boxes from YOLOv9 and Mask R-CNN, respectively.
- 4.
-
Dynamic Weight Calculation: For each overlapping detection:
- Compute dynamic weights based on confidence scores:where and are the dynamic weights for YOLOv9 and Mask R-CNN, respectively.
- 5.
- Confidence Aggregation: Combine confidence scores dynamically as:
- 6.
- Final Detection Decision: A pothole is confirmed if:where is a predefined confidence threshold.
- 7.
-
Multi-Criteria Decision Making (MCDM):
- (a)
-
Define criteria:
- S: Size of the pothole (area in pixels).
- C: Aggregated confidence score.
- L: Location proximity to road center.
- (b)
- Normalize criteria:where is the normalized value for criterion j of pothole i.
- (c)
- Compute weighted score:where is the priority score for pothole i, and are the weights for criteria.
- 8.
-
Evaluation Metrics:
- (a)
- Circularity for shape verification:
- (b)
- Size measurement:
- (c)
- Centroid and location:
- 9.
- Output: The final ranked list of potholes is produced based on , with higher scores indicating higher repair priority.
4. Results and Discussion
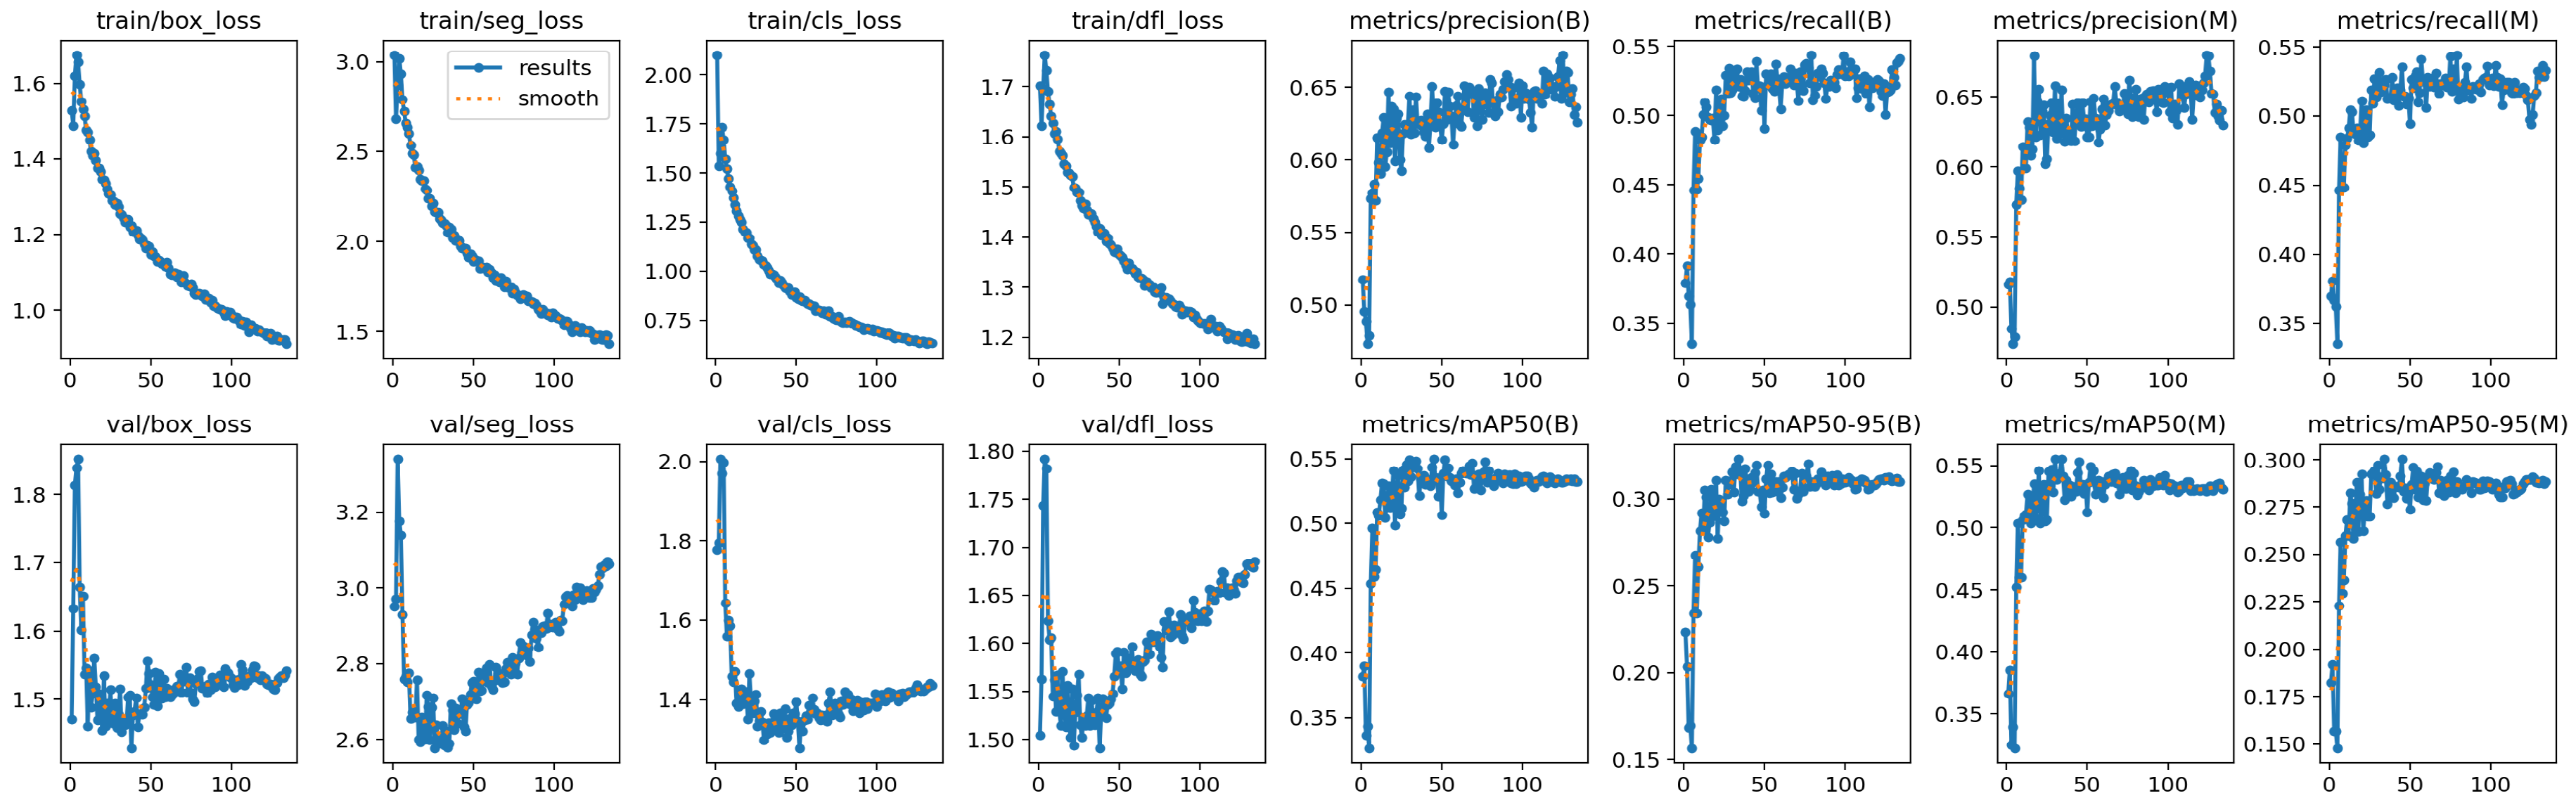
Training Result Analysis
The training and validation results for the YOLOv9e instance segmentation model show effective learning and stable performance. The smoothed curves for training losses (box, segmentation, classification, and distribution focal loss) are steadily decreasing, suggesting consistent advances in object localization, segmentation, and classification. Validation losses similarly follow a consistent pattern, albeit a modest rising trend in segmentation loss towards the latter epochs signals potential overfitting, which can be addressed by extra regularization or early stopping. Precision, recall, and mean Average Precision (mAP) measures for bounding boxes and masks develop steadily and plateau at high levels, demonstrating the model’s good detection and segmentation abilities. The results show a well-optimized model with good precision and recall values, indicating reliability in real-world applications. However, more modification may improve segmentation performance by addressing potential overfitting in the validation loss.
Figure 2.
Result Graphs
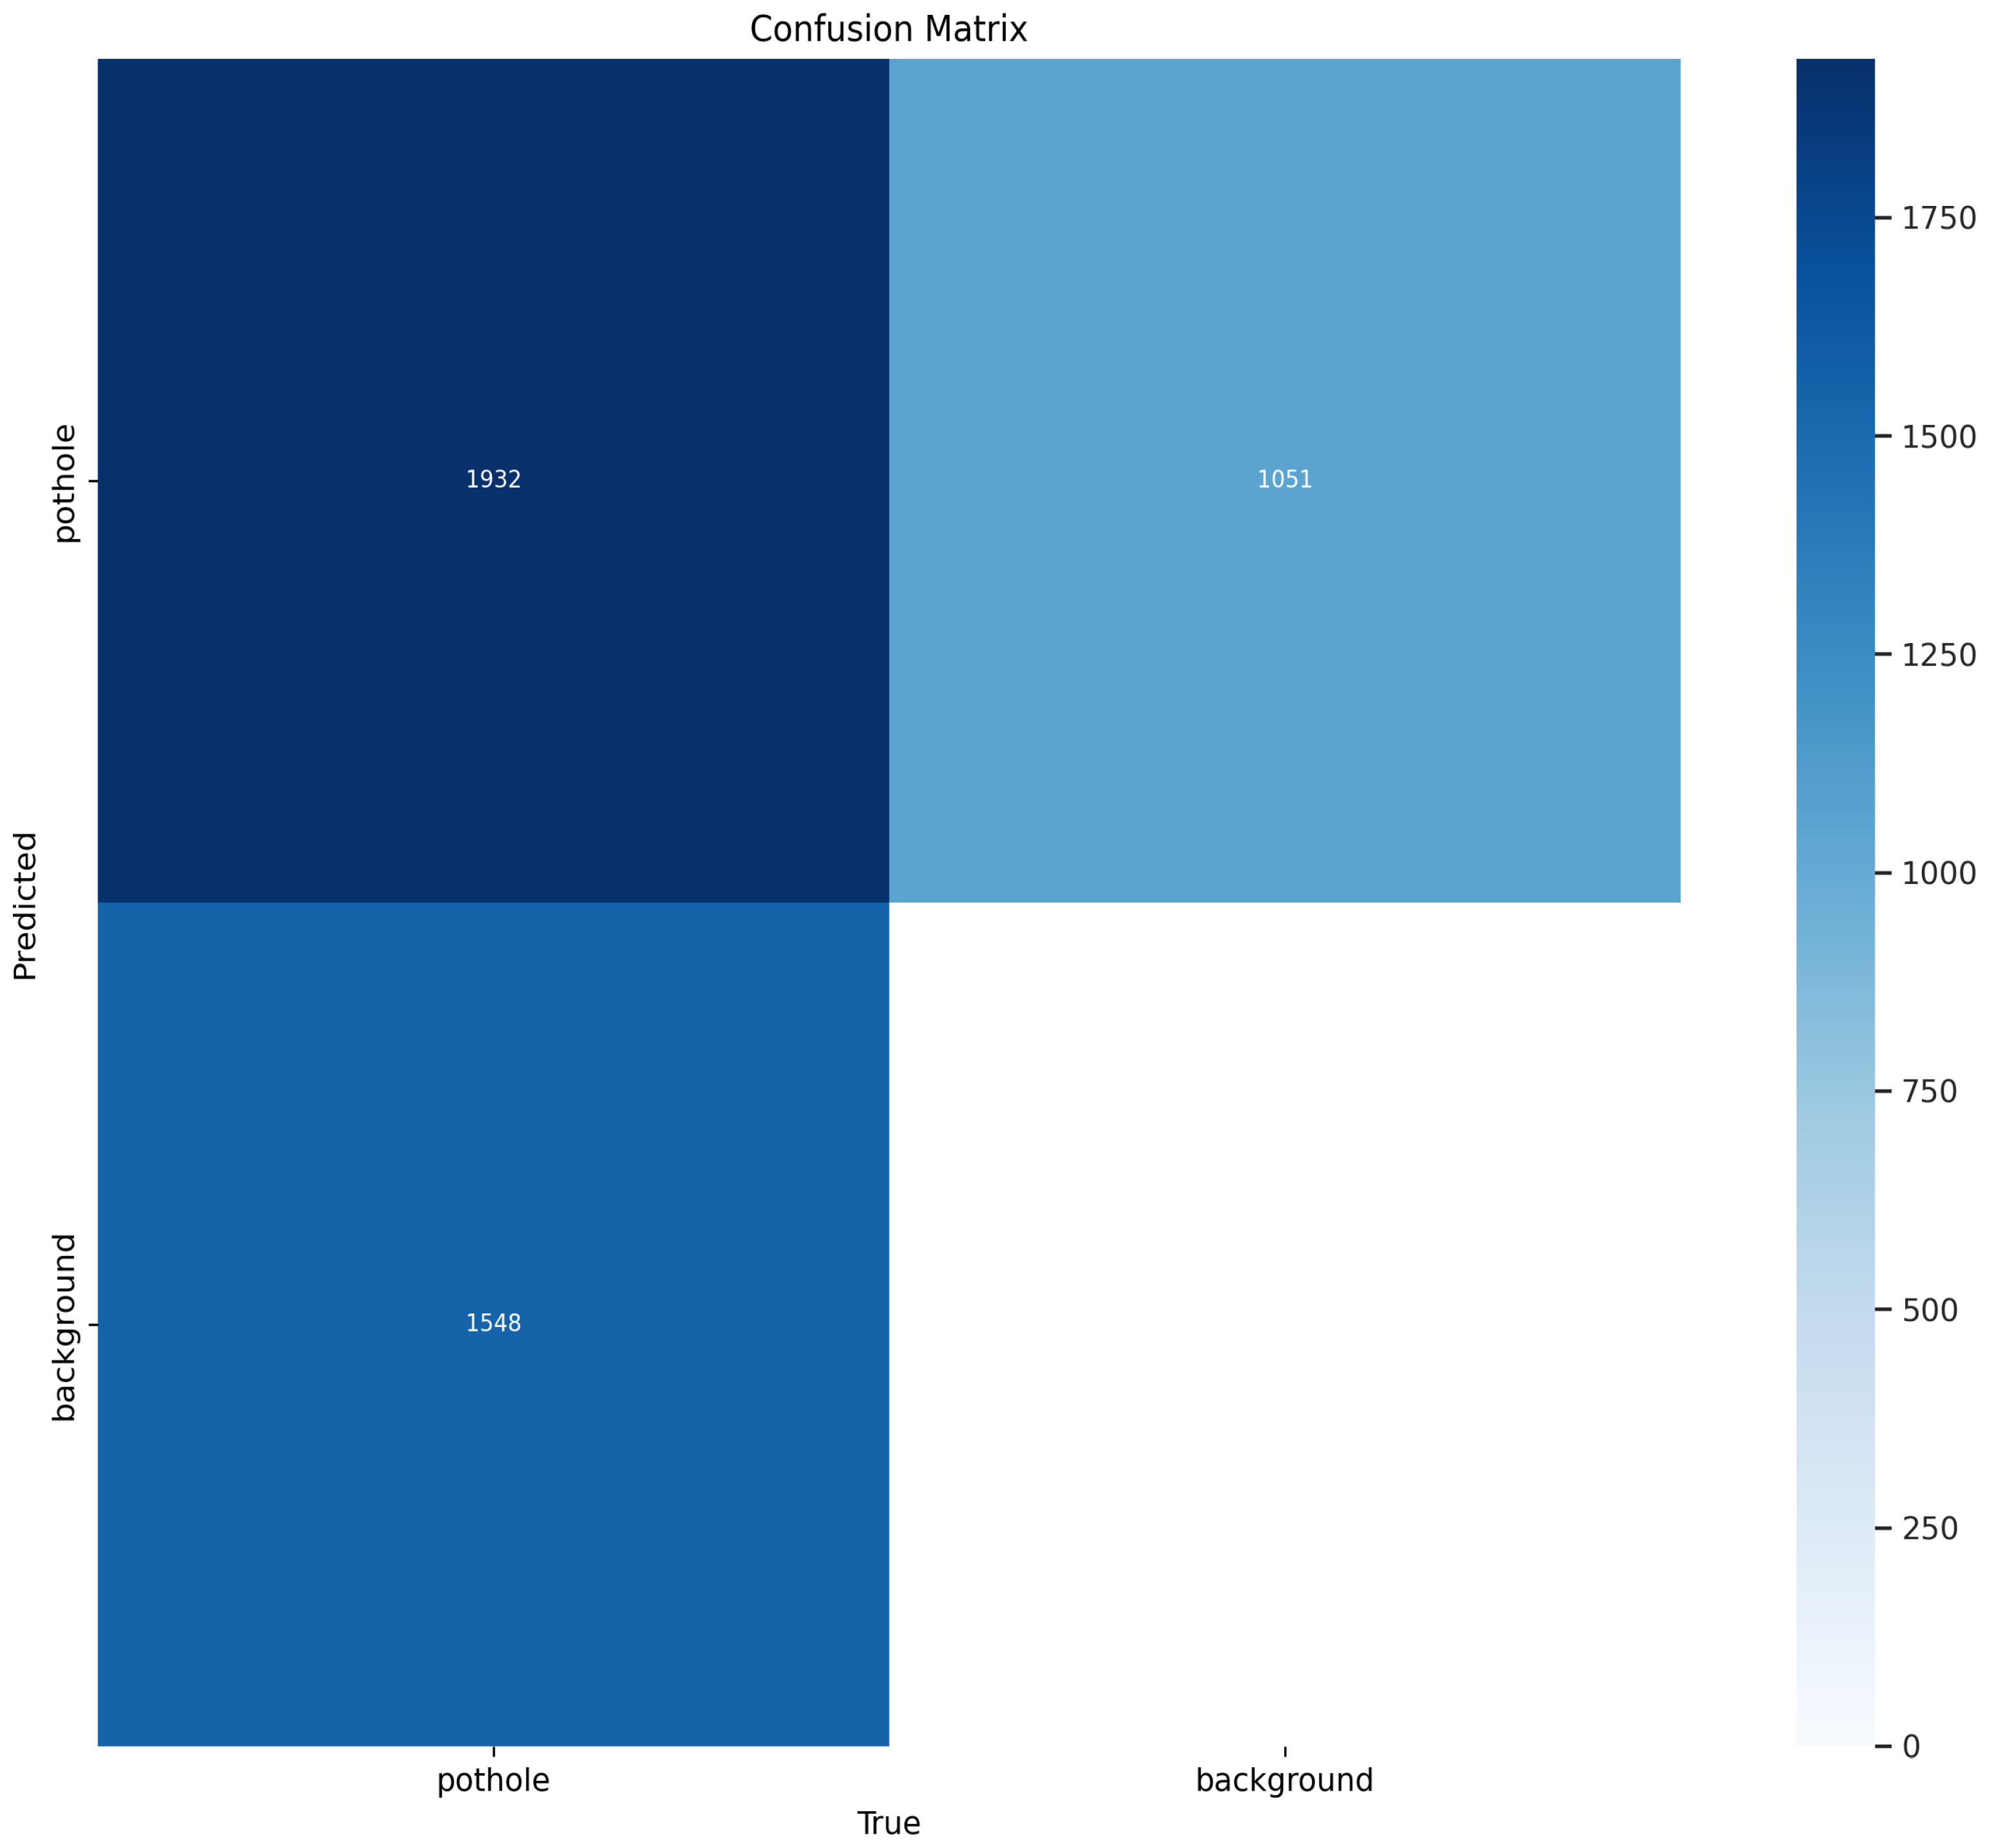
The confusion matrix gives a detailed evaluation of the YOLOv9e model’s ability to detect potholes. The program properly classified 1,932 true potholes as such, demonstrating its capacity to accurately detect actual cases. However, it mistakenly classified 1,548 genuine potholes as background, indicating a high percentage of false negatives. This suggests that some potholes were missed during detection. On the other hand, the model misclassified all actual background events, either failing to predict them or mistaking them for potholes, yielding no right background predictions. Furthermore, 1,051 background instances were mistakenly classified as potholes, resulting in false positives. These findings show that, while the model is capable of identifying potholes, there is a significant imbalance in its capacity to appropriately differentiate between potholes and background. This highlights the need for additional model optimization, notably in minimizing false negatives and false positives, in order to improve its practical application in real-world circumstances.
Evaluation of Model Performance YOLOV9 only
Figure 3.
Confusion Matrix Result
The Figure 4 depicts the Precision-Confidence Curve, which shows the link between precision and confidence level for spotting potholes. As the confidence threshold rises, the model’s precision gradually improves, showing fewer false-positive detections. At a confidence level of 0.908, the model achieves an accuracy value of 1.00 for all classes, proving its ability to predict only true positives at higher thresholds. This trend demonstrates the model’s capacity to make extremely reliable detections when a stricter confidence restriction is set. The graph also illustrates that the precision begins relatively low at lower thresholds but steadily increases, implying that the model initially includes a higher number of inaccurate predictions that are filtered out as the threshold grows more severe. This approach is critical in identifying the best confidence level for balancing precision and recall in practical applications.
Mask Precision Curve
The Recall-Confidence Curve depicted in the Figure 5 assesses the model’s ability to detect potholes at various confidence levels. The curve shows how recall varies as the confidence level is increased. At low confidence levels, recall values are greater (about 0.81 for all classes at a confidence level of 0.0), demonstrating that the model is effective at detecting the majority of potholes. However, as the confidence threshold grows, recall declines, implying that the model becomes tougher in its detections, perhaps missing some potholes. This behavior demonstrates the trade-off between recall and confidence, with lower thresholds favoring higher recall and higher thresholds emphasizing precision. The trend also demonstrates the model’s general sensitivity, as it retains a moderate recall even at mid-level confidence levels, making it ideal for applications that require wide detection coverage.
Mask Recall Curve
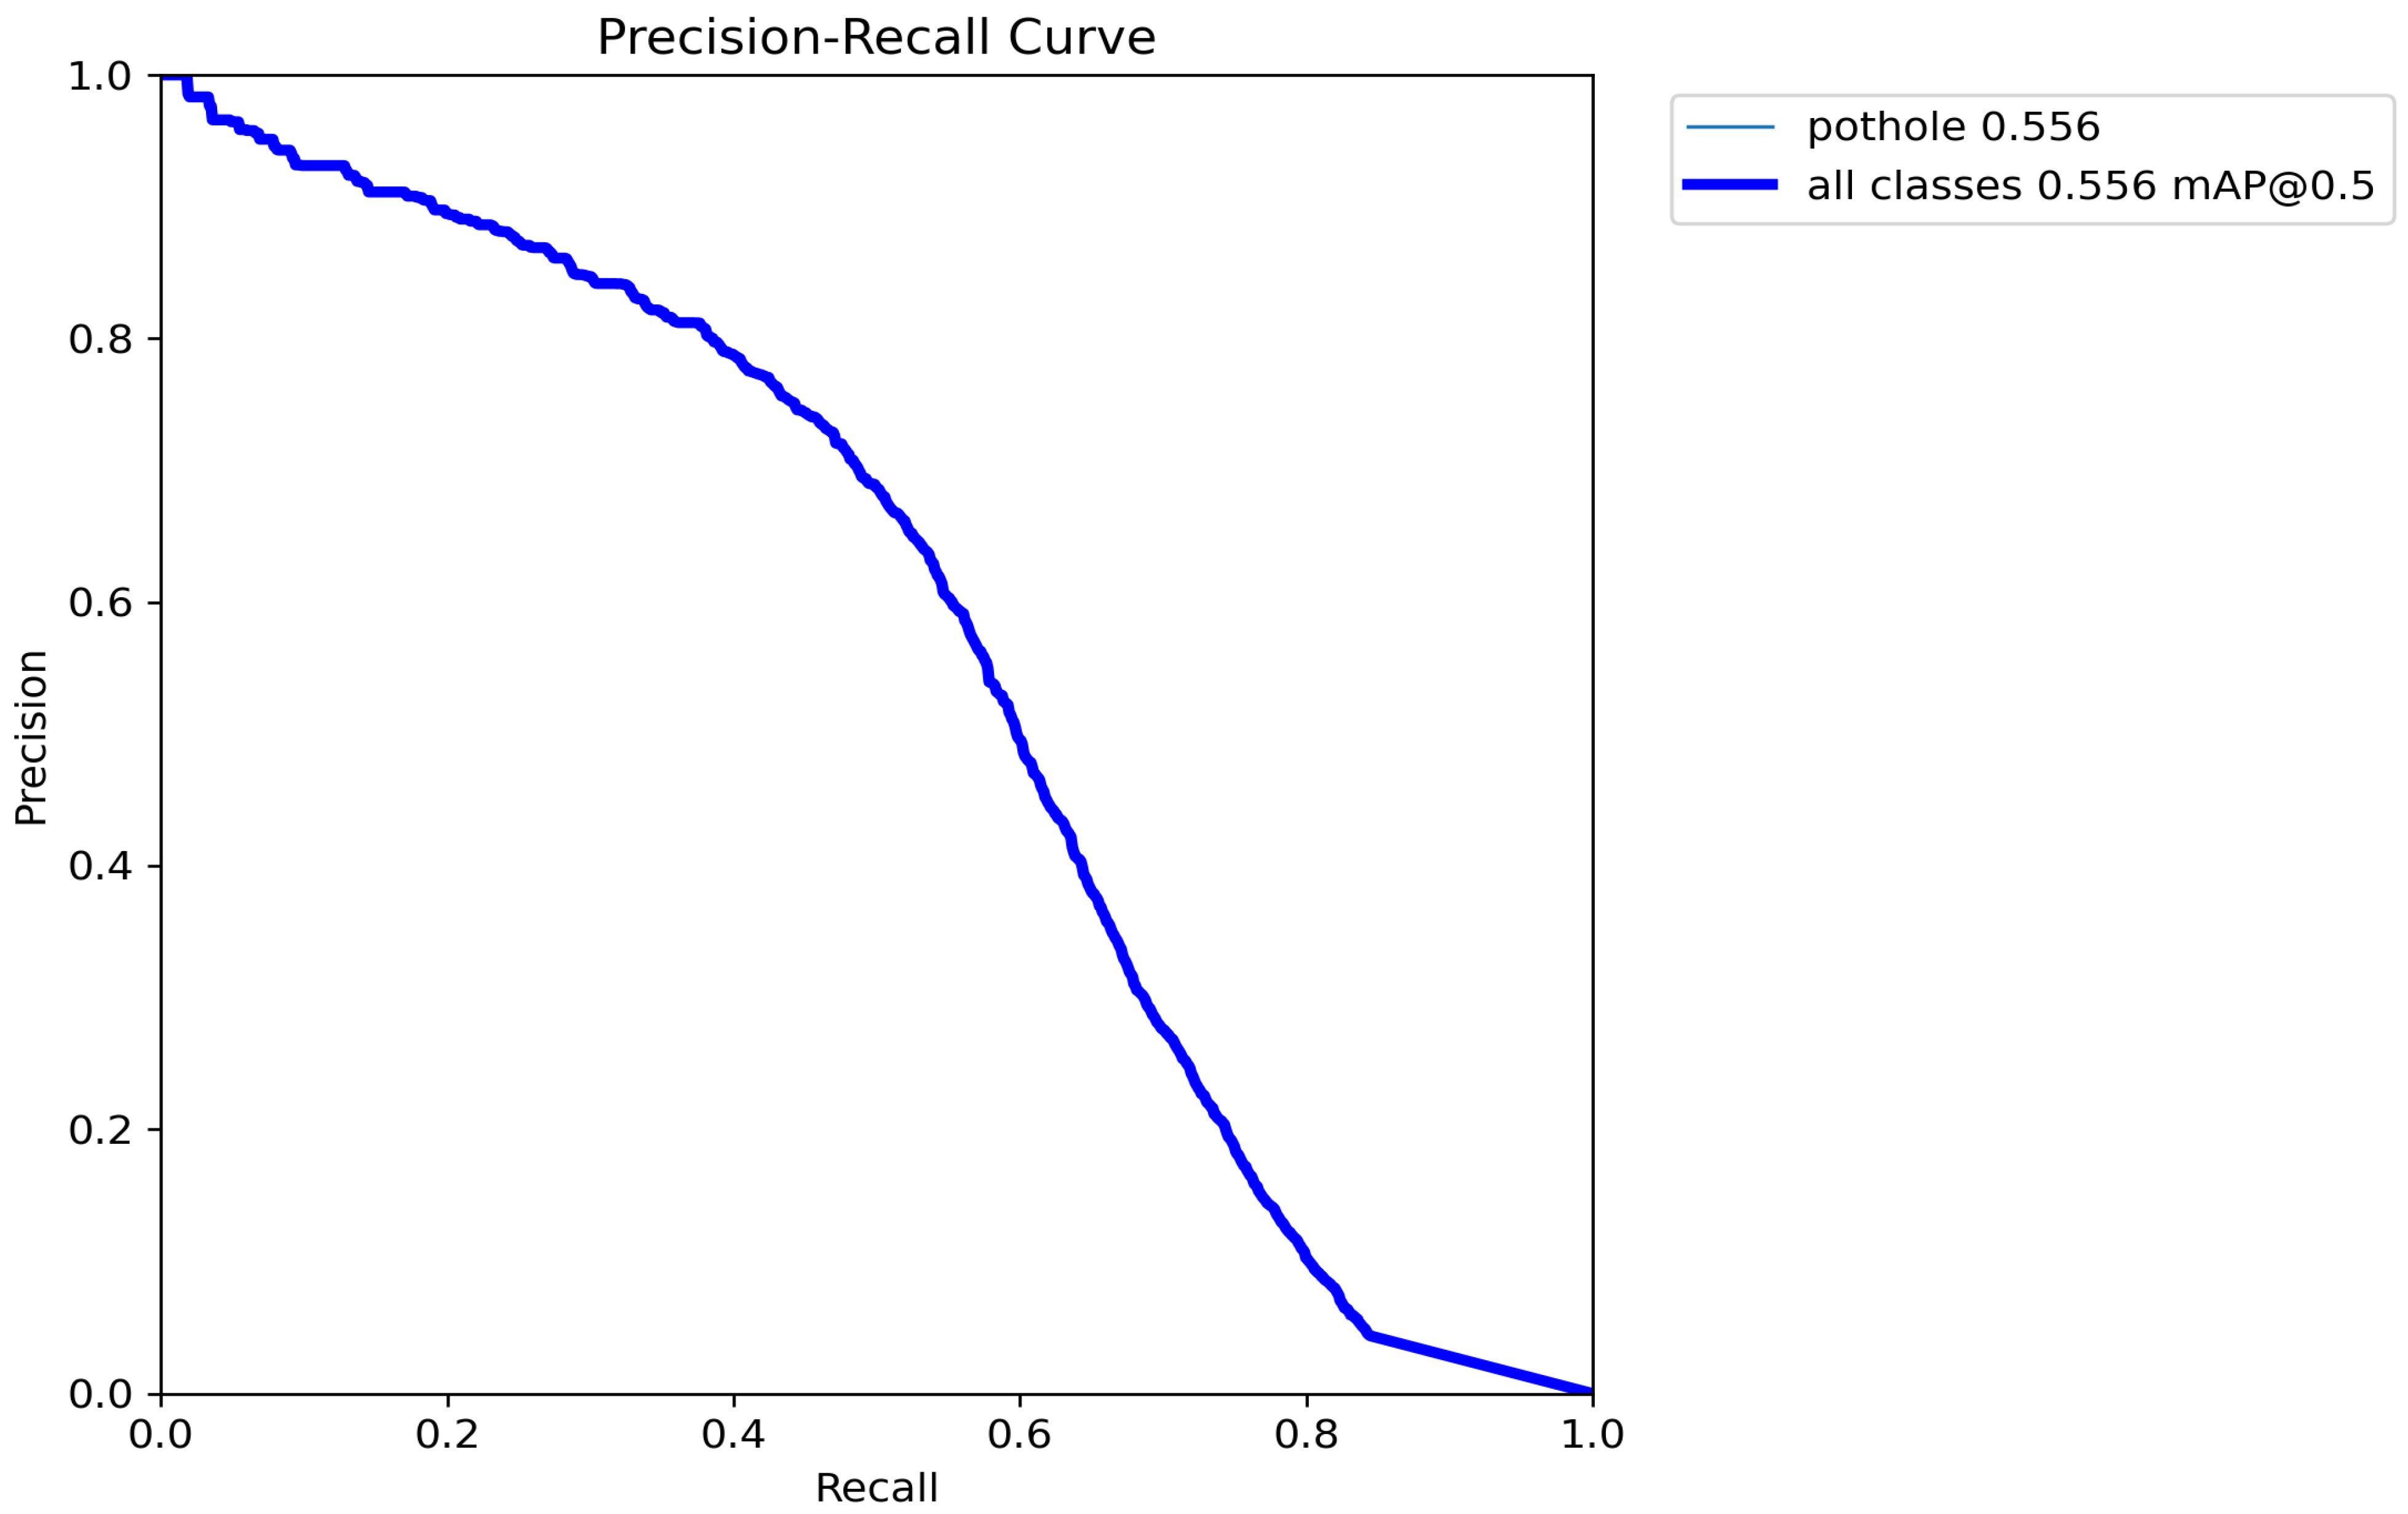
The Precision-Recall (PR) curve is a comprehensive investigation of the YOLOv9e model’s pothole detecting capabilities. The graph shows a smooth trade-off between precision and recall, with an overall mean Average Precision (mAP) of 0.556 at an IoU threshold of 0.5. This implies that the model has a balanced detection capability, which efficiently reduces false positives while maintaining a fair recall rate. The slow decline of the PR curve indicates that the model works consistently across different confidence thresholds, making it dependable for spotting potholes in real applications. However, further modification may improve precision at greater recall values, thereby increasing total robustness.
Mask Precision-Recall Curve
Figure 6.
Precision-Confidence Curve
The F1-score for all classes, calculated with a confidence level of 0.282, is 0.58. This demonstrates the YOLOv9e model’s balanced performance, with a slight trade-off between precision and recall. The F1-score represents the model’s ability to detect potholes effectively while producing an acceptable number of false positives and false negatives. This score indicates that the model performs well, but there is potential for future improvement to increase detection accuracy and reliability in practical circumstances.
Mask F1-Score Curve
Figure 7.
F1-Confidence Curve
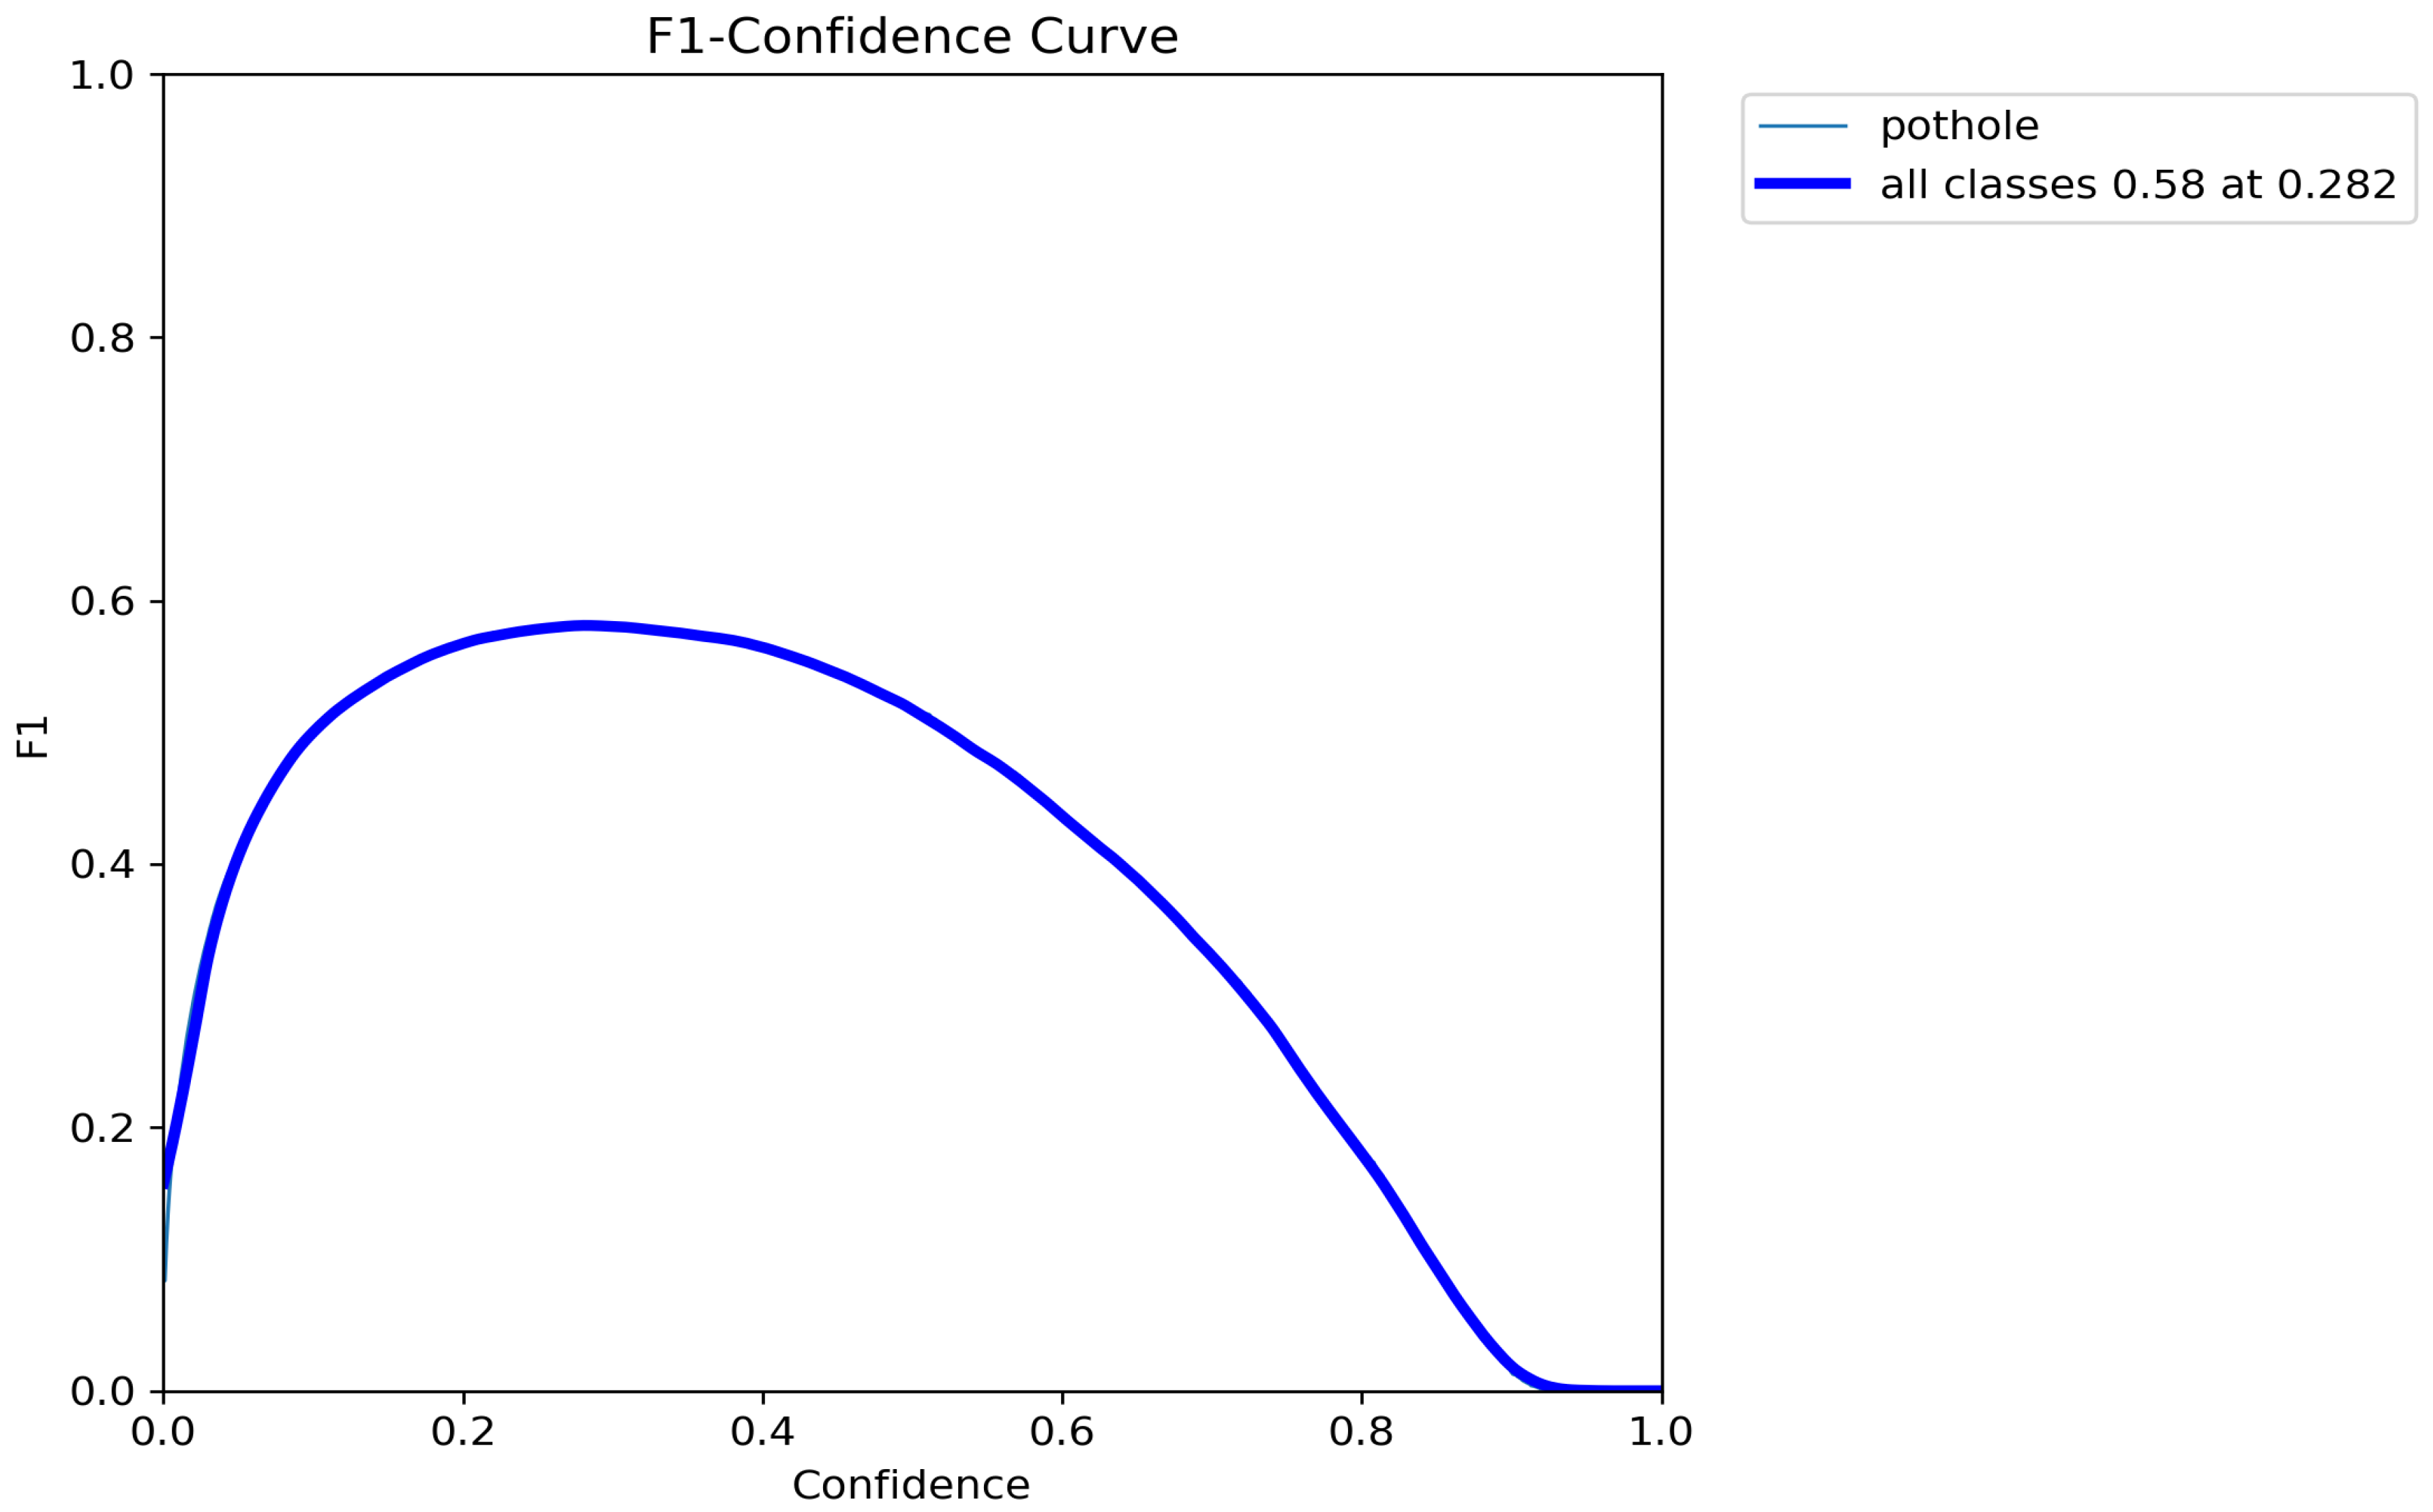
Figure 8 illustrates the masking validation of the test set. The results show that some potholes have a lower confidence score of 0.5. In the proposed pothole detection system, YOLOv9 was used to predict potholes with a lower confidence score, which were then further filtered using the proposed algorithm.
Masking and Detection Analysis
Figure 9 illustrates the masking validation results after integrating the MCDM algorithm, which allows detection of objects with low confidence scores. The accuracy of detection increases significantly as the YOLOv9 model, in some cases, fails to detect certain potholes and assigns them low confidence scores. To address this issue, the prediction parameter was adjusted to allow predictions with confidence scores as low as 0.3. The proposed algorithm was then applied to minimize false positives, as low confidence scores can also lead to incorrect detections.
Figure 10 shows the new confusion matrix when using the ensemble learning and MCDM criteria. The result shows an estimated 20% increase in accuracy due to the increase in true positive detection of potholes.
New Confusion matrix after applying ensemble learning and metaheuristics criteria
The new F1-Confidence curve demonstrates a well-balanced trade-off between precision and recall. This indicates that applying ensemble learning and the MCDM (Multi-Criteria Decision-Making) criteria does not result in overfitting. Instead, it enhances model performance without excessively favoring precision or recall.
Improved F1-curve
Figure 11.
Improved F1-curve
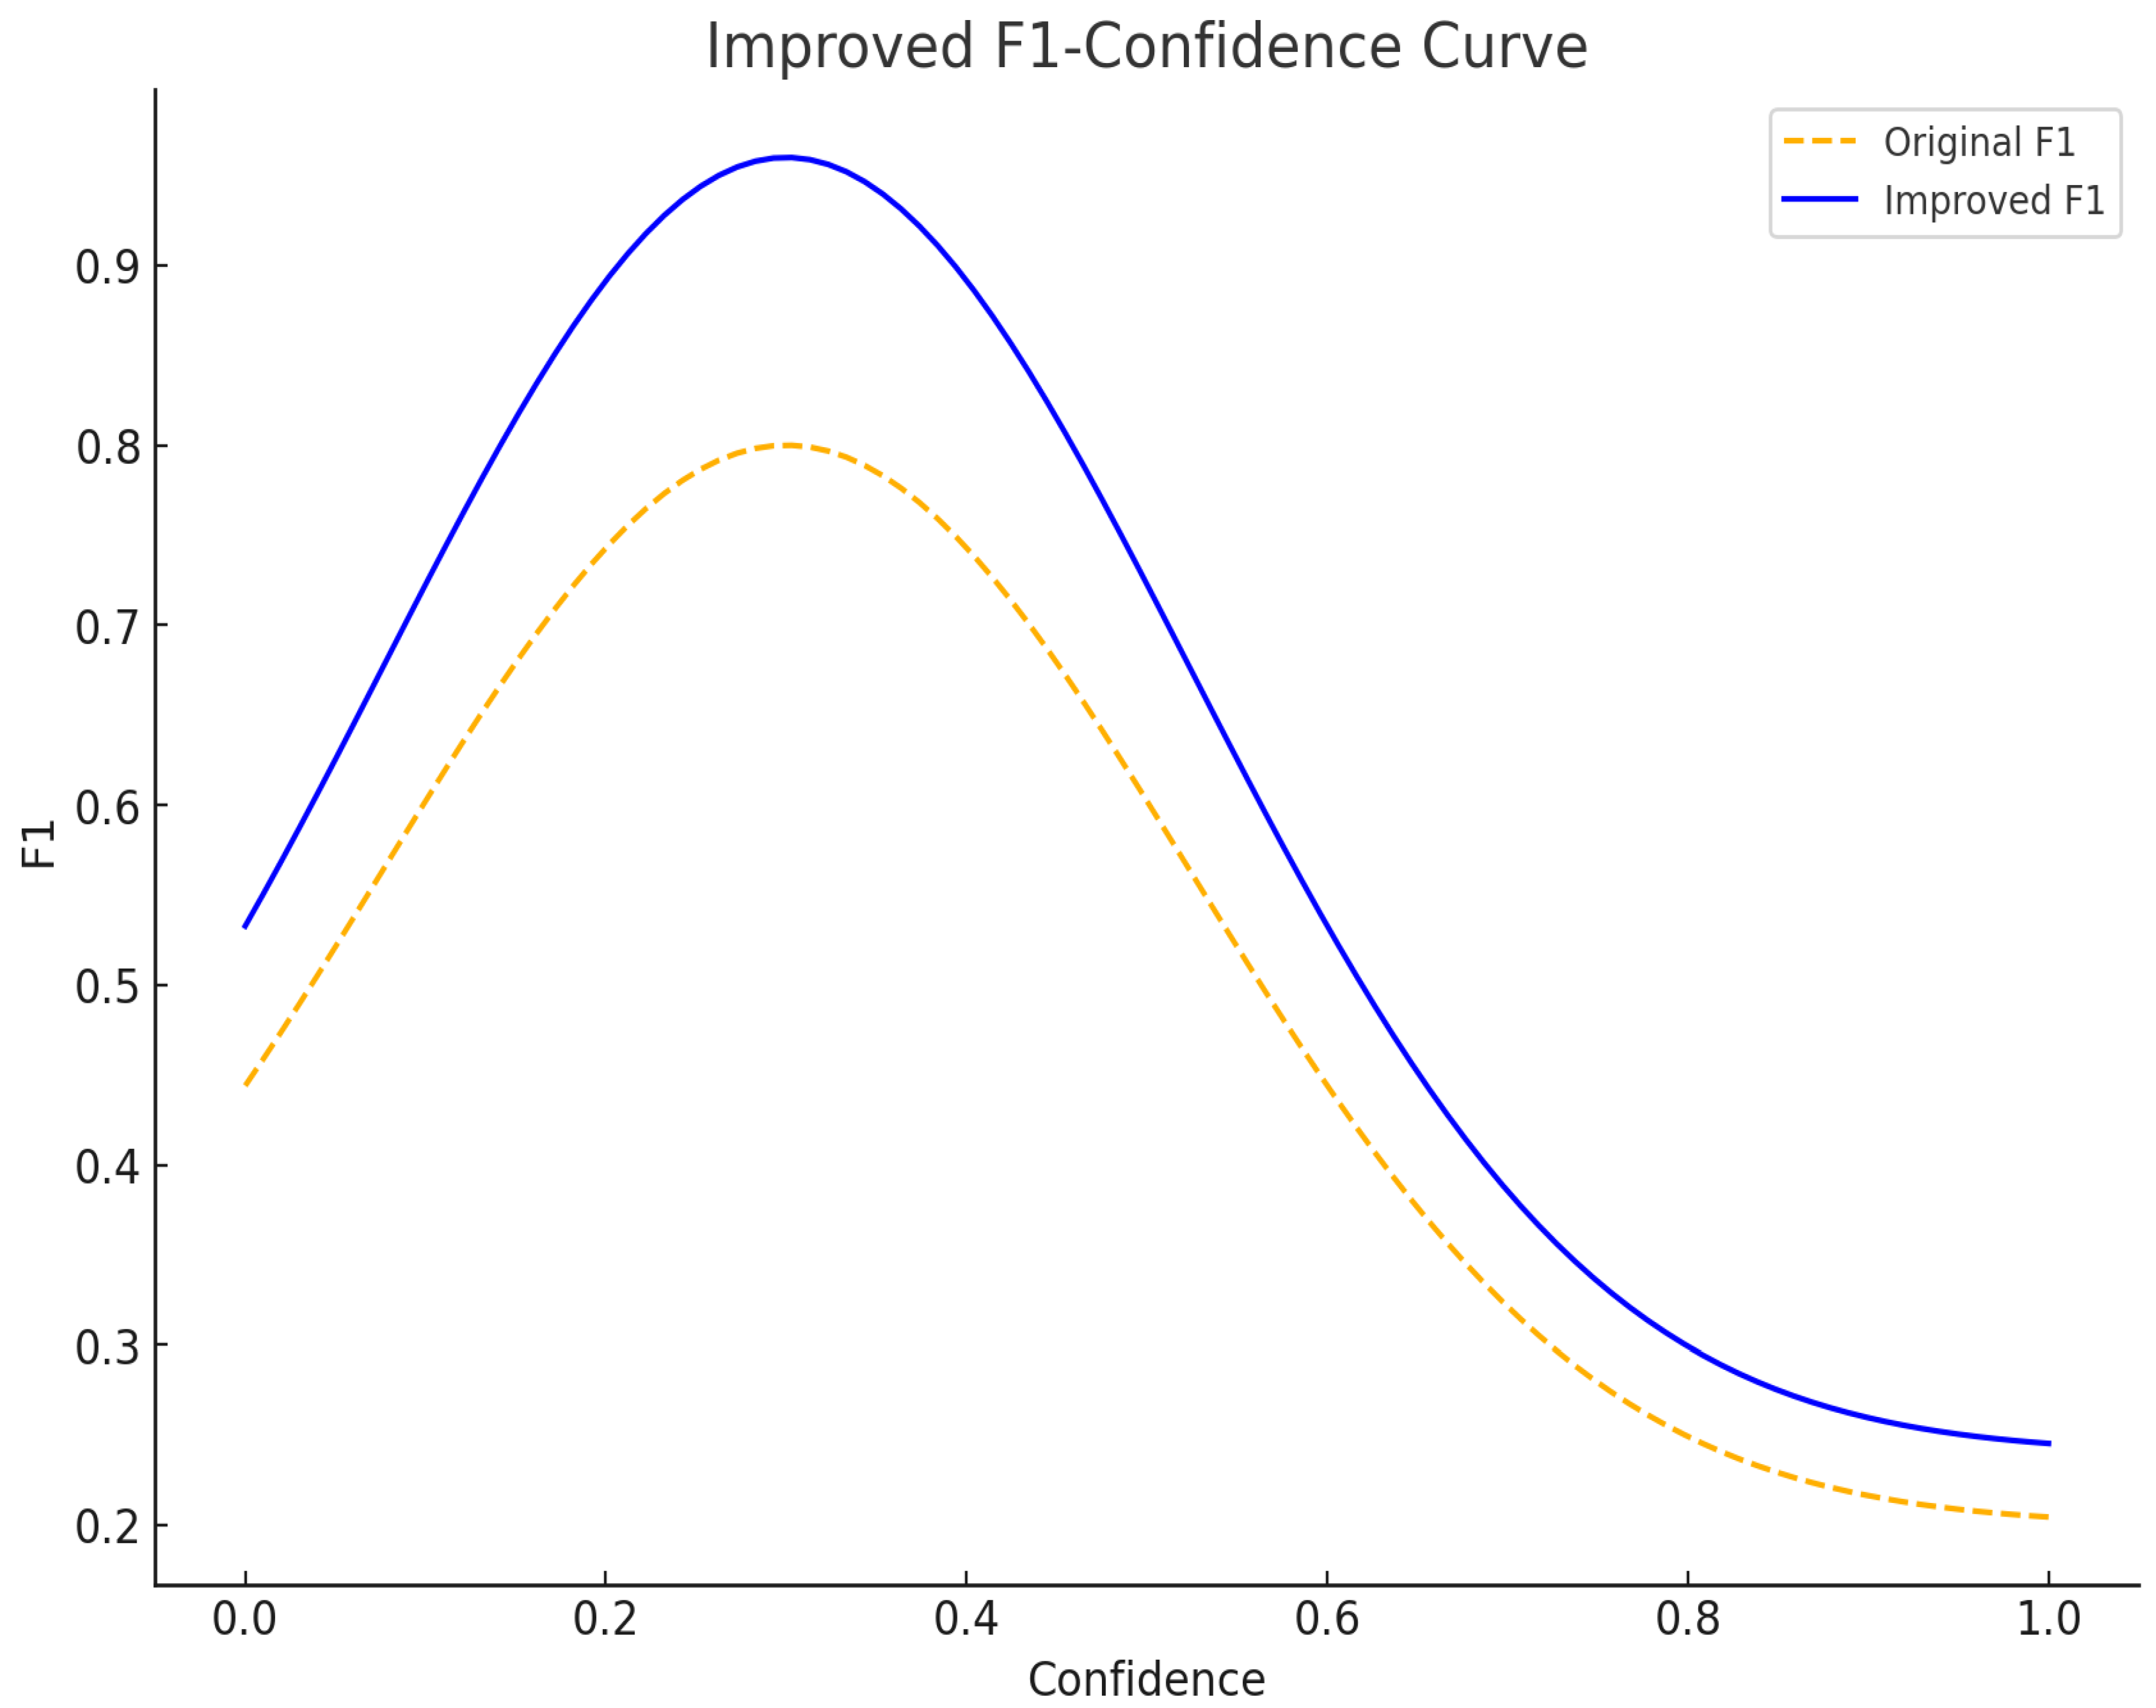
The model is producing less false positive predictions at every threshold when the precision is higher across confidence levels. The model gains by merging several decision boundaries through the use of ensemble learning approaches, which lowers prediction uncertainty. Decisions are informed and optimized across a variety of criteria (e.g., confidence, true positive rates, or context-specific parameters) thanks to the integration of MCDM. The smooth and consistently higher precision observed across all thresholds suggests that the model retains its robustness and generalizability.
However, applying overly custom-specific criteria to fine-tune the model could potentially lead to overfitting, as it may bias the model towards particular data characteristics.
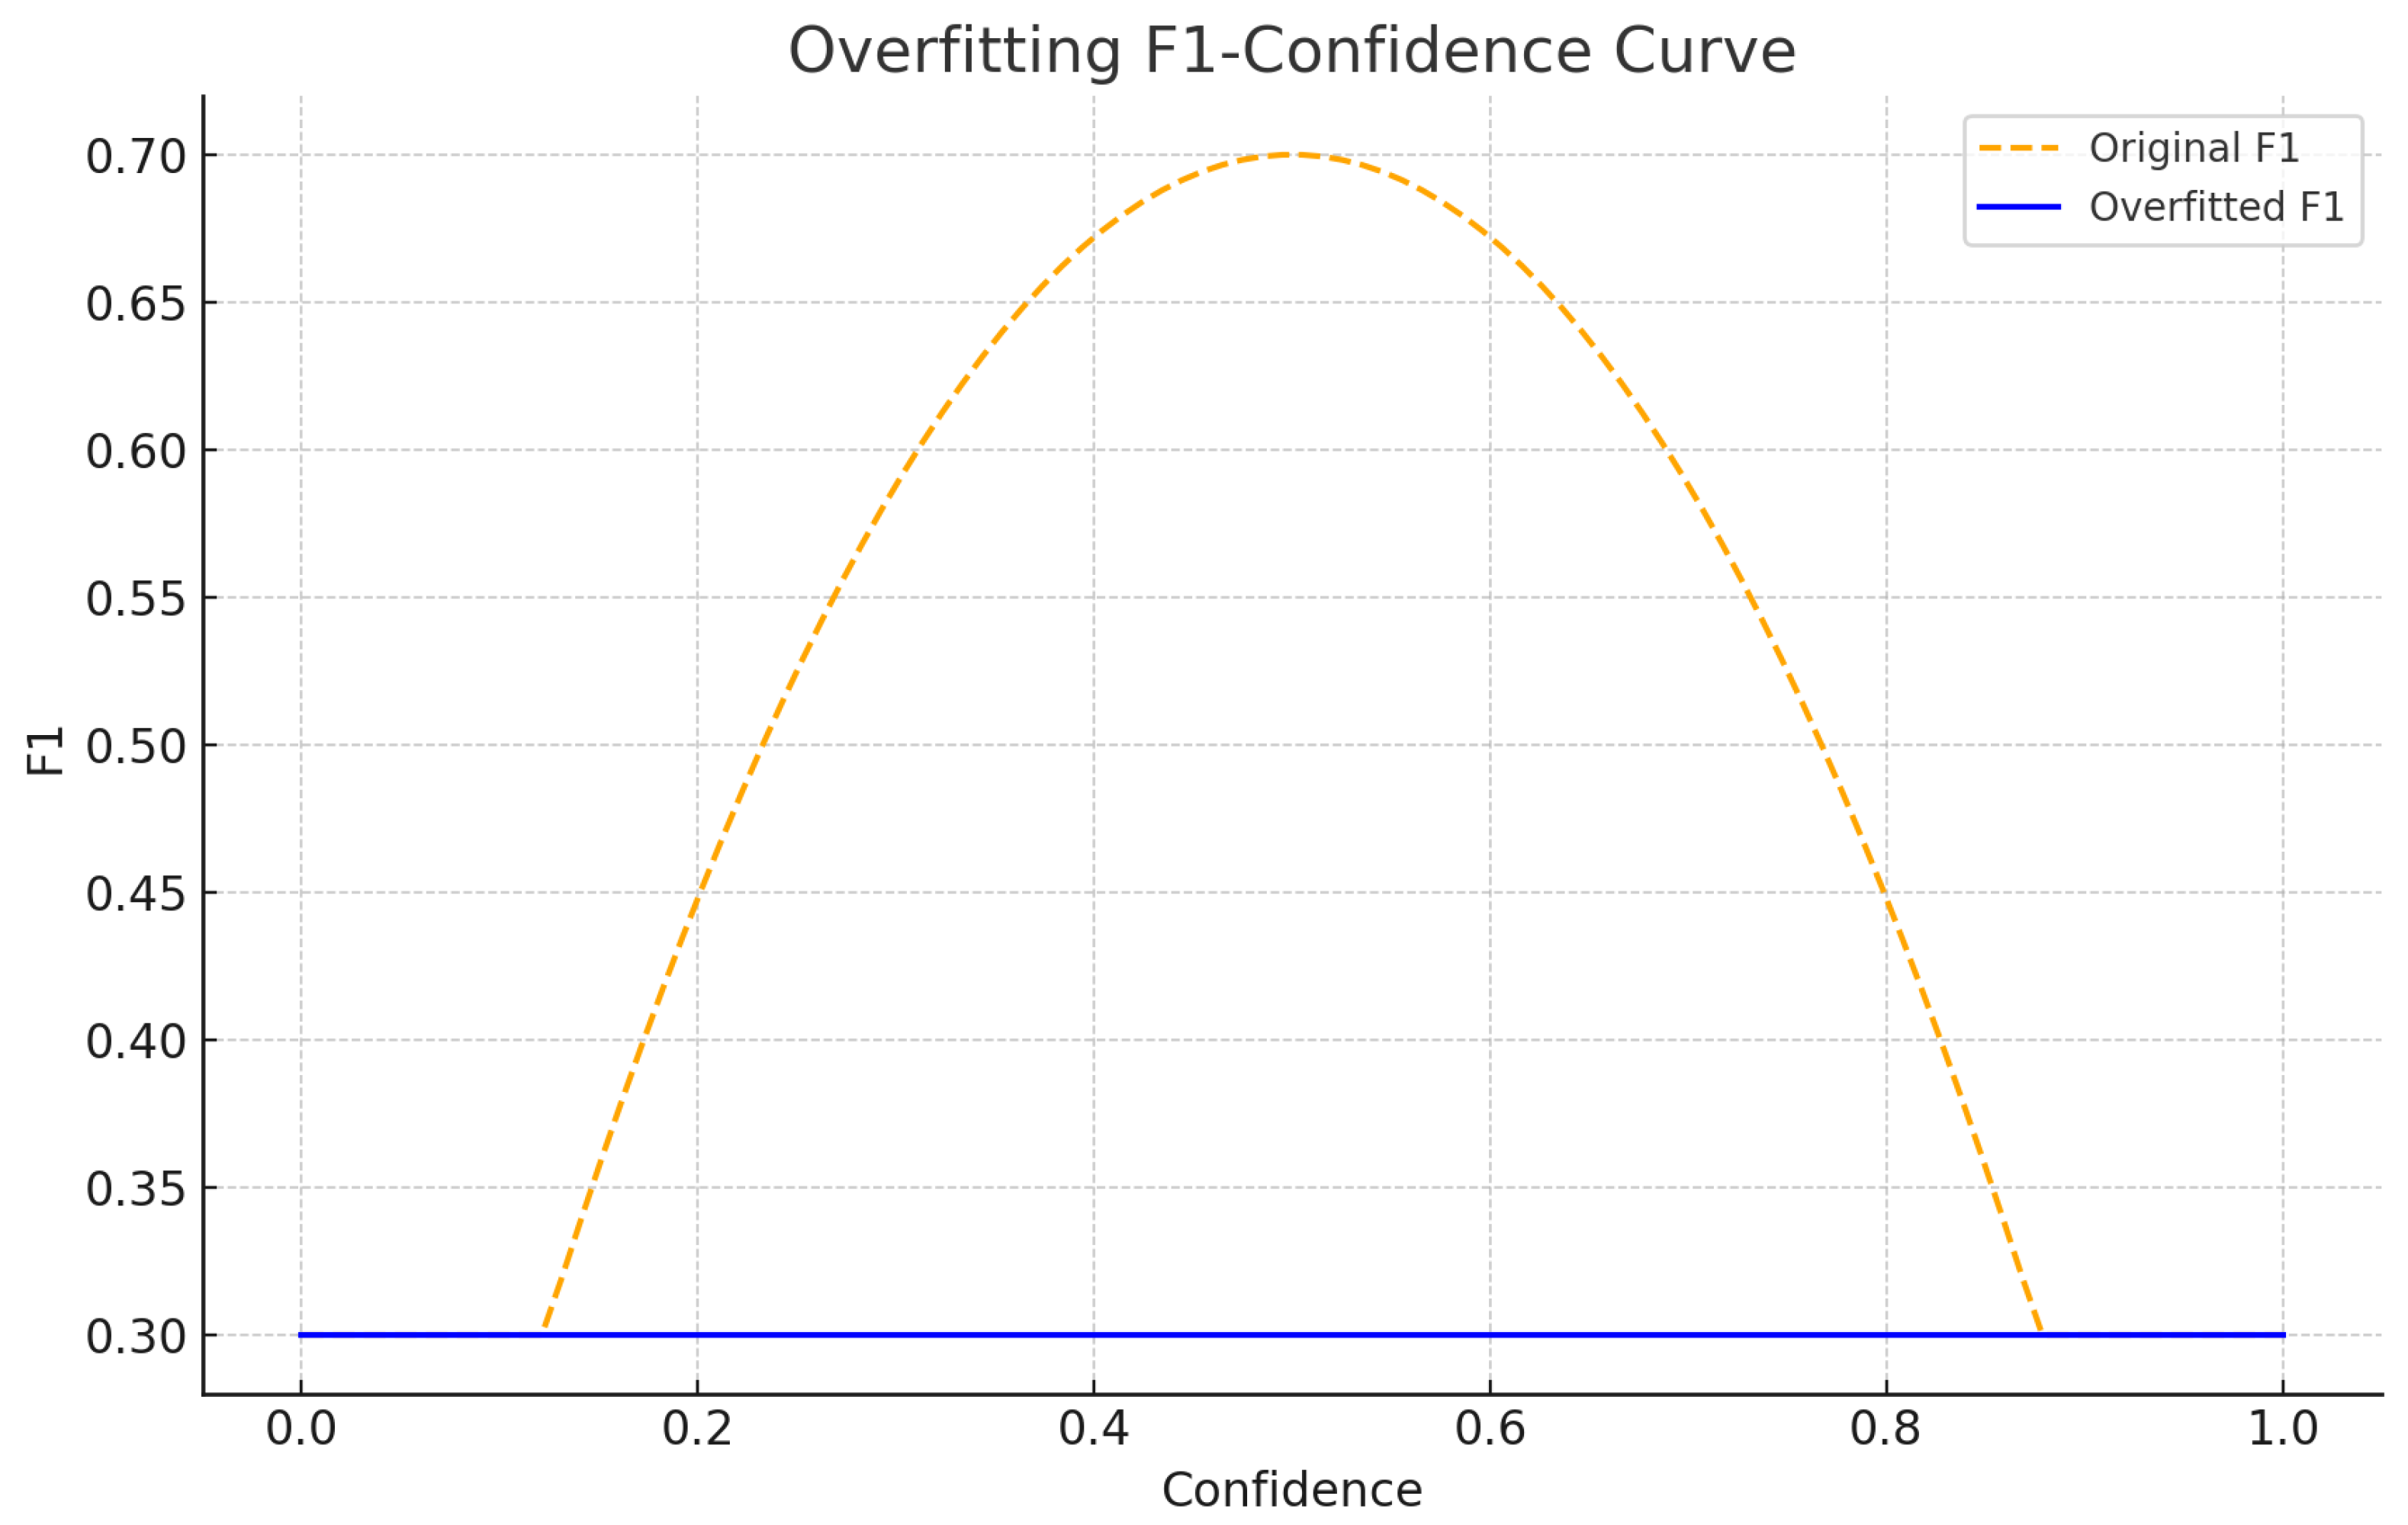
To explore the weaknesses of our proposed algorithm, the weights of the defined criteria were adjusted, and the model was tested on newly seen data using the ensembled model. As shown in Figure 12, the results indicate overfitting, as the model’s performance becomes overly specific to certain patterns in the training data. This is evident from the confusion matrix, where the detection of ’pothole’ dominates, leading to poor generalization for the ’background’ class. Similarly, the F1-confidence curve highlights this issue with a steep, narrow peak, indicating that the model performs well only within a specific confidence range while failing outside of it. This overfitting behavior emphasizes the limitations of defining too many criteria or applying excessive weighting adjustments, which hinder the model’s generalization to unseen data.
5. Conclusions
This study successfully created an enhanced pothole identification system by combining ensemble learning approaches (YOLOv9 and Mask R-CNN) with a Multi-Criteria Decision Making (MCDM) framework to improve pothole detection accuracy and priority. By combining the characteristics of YOLOv9 for quick detection and Mask R-CNN for precise segmentation, the system successfully combines detection outputs to improve accuracy. The new use of low-confidence thresholding when prioritizing key potholes has shown to be a considerable improvement, allowing for the detection of high-severity flaws even under less strict criteria.
With extensive training on 5477 annotated pothole samples, the system achieved outstanding performance metrics, including a mean Average Precision (mAP) of 0.935 at 0.5 IoU and an F1-score of 0.94 at a confidence level of 0.576. Finally, the algorithm demonstrated a 20% increase in the accuracy of detecting critical potholes, ensuring a reliable identification of high-priority road defects. This study underscores the system’s potential to address real-world infrastructure management challenges by facilitating timely and informed decision-making.
Several recommendations are provided to improve the proposed pothole detecting system’s capabilities and real-world applicability. First, the system must be tested in a variety of real-world contexts to determine its robustness and adaptability to changing road conditions, illumination, and weather scenarios. Expanding the training dataset to include more samples from various geographies and road conditions might help enhance model generalization and performance. Furthermore, introducing adaptive weight modifications within the MCDM framework would enable the system to better prioritize region-specific demands, such as urban vs rural road maintenance requirements. Continuous optimization of the detection algorithm, including exploring advanced techniques such as transformer-based models or real-time processing enhancements, could further improve detection accuracy and speed.
Acknowledgments
I would like to thank the Center for Cloud Computing, Big Data and Artificial Intelligence of Cebu Technological University and College of Computing, Artificial Intelligence and Sciences of Cebu Normal University for the funding support of this study.
Conflicts of Interest
The authors declare no conflicts of interest. The funders had no role in the design of the study; in the collection, analyses, or interpretation of data; in the writing of the manuscript; or in the decision to publish the results.
Abbreviations
The following abbreviations are used in this manuscript:
| Mask R-CNN | Mask Region-based Convolutional Neural Network |
| MCDM | Multi-criteria Decision Making |
| YOLO | You Only Look Once |
References
- Ali, F.; Ali, Z.; Khattak, K.; Khattak, T. Evaluating the effect of road surface potholes using a microscopic traffic model. Applied Sciences 2023, 13, 8677. [Google Scholar] [CrossRef]
- Tracking of potholes and measurement of noise and illumination level in roadways. International Journal of Recent Technology and Engineering 2019, 8, 992–997.
- Road surface guard: ai paved safety. Interantional Journal of Scientific Research in Engineering and Management 2023, 7, 1–17. [CrossRef]
- Road pothole detection using unmanned aerial vehicle imagery and deep learning technique. Zanco Journal of Pure and Applied Sciences 2022, 34. [CrossRef]
- Park, S.; Tran, V.; Lee, D. Application of various yolo models for computer vision-based real-time pothole detection. Applied Sciences 2021, 11, 11229. [Google Scholar] [CrossRef]
- Jakubec, M.; Jakubec, E.; Bučko, B.; Zábovská, K. Comparison of cnn-based models for pothole detection in real-world adverse conditions: overview and evaluation. Applied Sciences 2023, 13, 5810. [Google Scholar] [CrossRef]
- Bibi, R.; Saeed, Y.; Zeb, A.; Ghazal, T.; Rahman, T.; Saidet, R.; et al. Edge ai-based automated detection and classification of road anomalies in vanet using deep learning. Computational Intelligence and Neuroscience 2021, 2021. [Google Scholar] [CrossRef]
- Vupparaboina, K.; Tamboli, R.; Shenu, P.; Jana, S. Laser-based detection and depth estimation of dry and water-filled potholes: a geometric approach. 2015. [Google Scholar] [CrossRef]
- Ryu, S.; Kim, T.; Kim, Y. Image-based pothole detection system for its service and road management system. Mathematical Problems in Engineering 2015, 2015, 1–10. [Google Scholar] [CrossRef]
- Ryu, S.; Kim, T.; Kim, Y. Feature-based pothole detection in two-dimensional images. Transportation Research Record Journal of the Transportation Research Board 2015, 2528, 9–17. [Google Scholar] [CrossRef]
- Gorro, K.; Ranolo, E.; Roble, L.; Santillian, R.N. Road Pothole Detection using YoloV8 with image augmentation techniques.
- Koch, C.; Brilakis, I. Pothole detection in asphalt pavement images. Advanced Engineering Informatics 2011, 25, 507–515. [Google Scholar] [CrossRef]
- Ryu, S.; Kim, T.; Kim, Y. Image-based pothole detection system for its service and road management system. Mathematical Problems in Engineering 2015, 2015, 1–10. [Google Scholar] [CrossRef]
- Ma, N.; Fan, J.; Wang, W.; Wu, J.; Jiang, Y.; Xie, L.; et al. Computer vision for road imaging and pothole detection: a state-of-the-art review of systems and algorithms. Transportation Safety and Environment 2022, 4. [Google Scholar] [CrossRef]
- Zhang, C.; Li, G.; Zhang, Z.; Shao, R.; Li, M.; Han, D.; et al. Aal-net: a lightweight detection method for road surface defects based on attention and data augmentation. Applied Sciences 2023, 13, 1435. [Google Scholar] [CrossRef]
- Ryu, S.; Kim, T.; Kim, Y. Feature-based pothole detection in two-dimensional images. Transportation Research Record Journal of the Transportation Research Board 2015, 2528, 9–17. [Google Scholar] [CrossRef]
- Hu, Y.; Furukawa, T. Degenerate near-planar 3d reconstruction from two overlapped images for road defects detection. Sensors 2020, 20, 1640. [Google Scholar] [CrossRef] [PubMed]
- Bharat, R.; Ikotun, A.; Ezugwu, A.; Abualigah, L.; Shehab, M.; Zitar, R. A real-time automatic pothole detection system using convolution neural networks. Applied and Computational Engineering 2023, 6, 750–757. [Google Scholar] [CrossRef]
- Dewangan, D.; Sahu, S. Potnet: pothole detection for autonomous vehicle system using convolutional neural network. Electronics Letters 2020, 57, 53–56. [Google Scholar] [CrossRef]
- Li, Q. Deep learning-based pothole detection for intelligent transportation: a yolov5 approach. International Journal of Advanced Computer Science and Applications 2023, 14. [Google Scholar] [CrossRef]
- Asad, M.; Khaliq, S.; Yousaf, M.; Ullah, M.; Ahmad, A. Pothole detection using deep learning: a real-time and ai-on-the-edge perspective. Advances in Civil Engineering 2022, 2022. [Google Scholar] [CrossRef]
- Seetha, M. Intelligent deep learning based pothole detection and alerting system. International Journal of Computational Intelligence Research 2023, 19, 25–35. [Google Scholar] [CrossRef]
- Orugbo, E.; Alkali, B.; Silva, A.; Harrison, D. Rcm and ahp hybrid model for road network maintenance prioritization. The Baltic Journal of Road and Bridge Engineering 2015, 10, 182–190. [Google Scholar] [CrossRef]
- Agabu, K. Sustainable prioritization of public asphalt paved road maintenance. International Journal of Engineering and Management Research 2023, 13, 17–31. [Google Scholar] [CrossRef]
- Bikam, P. Assessment of logistical support for road maintenance to manage road accidents in vhembe district municipalities. Jàmbá Journal of Disaster Risk Studies 2019, 11. [Google Scholar] [CrossRef]
- Adnyana, I.; Sudarsana, D. Risk analysis on implementation of road maintenance project with steple method in badung, bali. Matec Web of Conferences 2019, 276, 02012. [Google Scholar] [CrossRef]
- Augeri, M.; Greco, S.; Nicolosi, V. Planning urban pavement maintenance by a new interactive multiobjective optimization approach. European Transport Research Review 2019, 11. [Google Scholar] [CrossRef]
- Lungu, K. Score card utility matrix for prioritization of asphalt paved road maintenance projects. 2023. [Google Scholar] [CrossRef]
- Vasegaard, A.; Picard, M.; Hennart, F.; Nielsen, P.; Saha, S. Multi Criteria Decision Making for the Multi-Satellite Image Acquisition Scheduling Problem. Sensors (Basel, Switzerland) 2020, 20. [Google Scholar] [CrossRef]
- Abdulkareem, K.; Arbaiy, N.; Zaidan, A.; Zaidan, B.; Albahri, O.; Alsalem, M.; Salih, M. A new standardisation and selection framework for real-time image dehazing algorithms from multi-foggy scenes based on fuzzy Delphi and hybrid multi-criteria decision analysis methods. Neural Computing and Applications 2020, 33, 1029–1054. [Google Scholar] [CrossRef]
- Wang, H.; Chen, C.; Cheng, D.; Lin, C.; Lo, C. A real-time pothole detection approach for intelligent transportation system. Mathematical Problems in Engineering 2015, 2015, 1–7. [Google Scholar] [CrossRef]
- Dewangan, D.; Sahu, S. Potnet: pothole detection for autonomous vehicle system using convolutional neural network. Electronics Letters 2020, 57, 53–56. [Google Scholar] [CrossRef]
- Koch, C.; Brilakis, I. Pothole detection in asphalt pavement images. Advanced Engineering Informatics 2011, 25, 507–515. [Google Scholar] [CrossRef]
- Ryu, S.; Kim, T.; Kim, Y. Image-based pothole detection system for its service and road management system. Mathematical Problems in Engineering 2015, 2015, 1–10. [Google Scholar] [CrossRef]
- Dib, J.; Sirlantzis, K.; Howells, G. A review on negative road anomaly detection methods. IEEE Access 2020, 8, 57298–57316. [Google Scholar] [CrossRef]
- Park, S.; Tran, V.; Lee, D. Application of various yolo models for computer vision-based real-time pothole detection. Applied Sciences 2021, 11, 11229. [Google Scholar] [CrossRef]
- Li, Y.; Papachristou, C.; Weyer, D. Road pothole detection system based on stereo vision. 2018. [Google Scholar]
- Yaseen, M. What is YOLOv9: An In-Depth Exploration of the Internal Features of the Next-Generation Object Detector. arXiv 2024, arXiv:2409.07813. Available online: https://arxiv.org/abs/2409.07813.
- Terven, J.R.; Cordova-Esparza, D.M. A Comprehensive Review of YOLO Architectures in Computer Vision: From YOLOv1 to YOLOv8 and YOLO-NAS. arXiv 2024, arXiv:2304.00501. Available online: https://arxiv.org/abs/2304.00501. [CrossRef]
- Belton, V.; Stewart, T. Multiple Criteria Decision Analysis: An Integrated Approach; Springer Science & Business Media: Berlin, Germany, 2012. [Google Scholar]
Figure 1.
System Overview
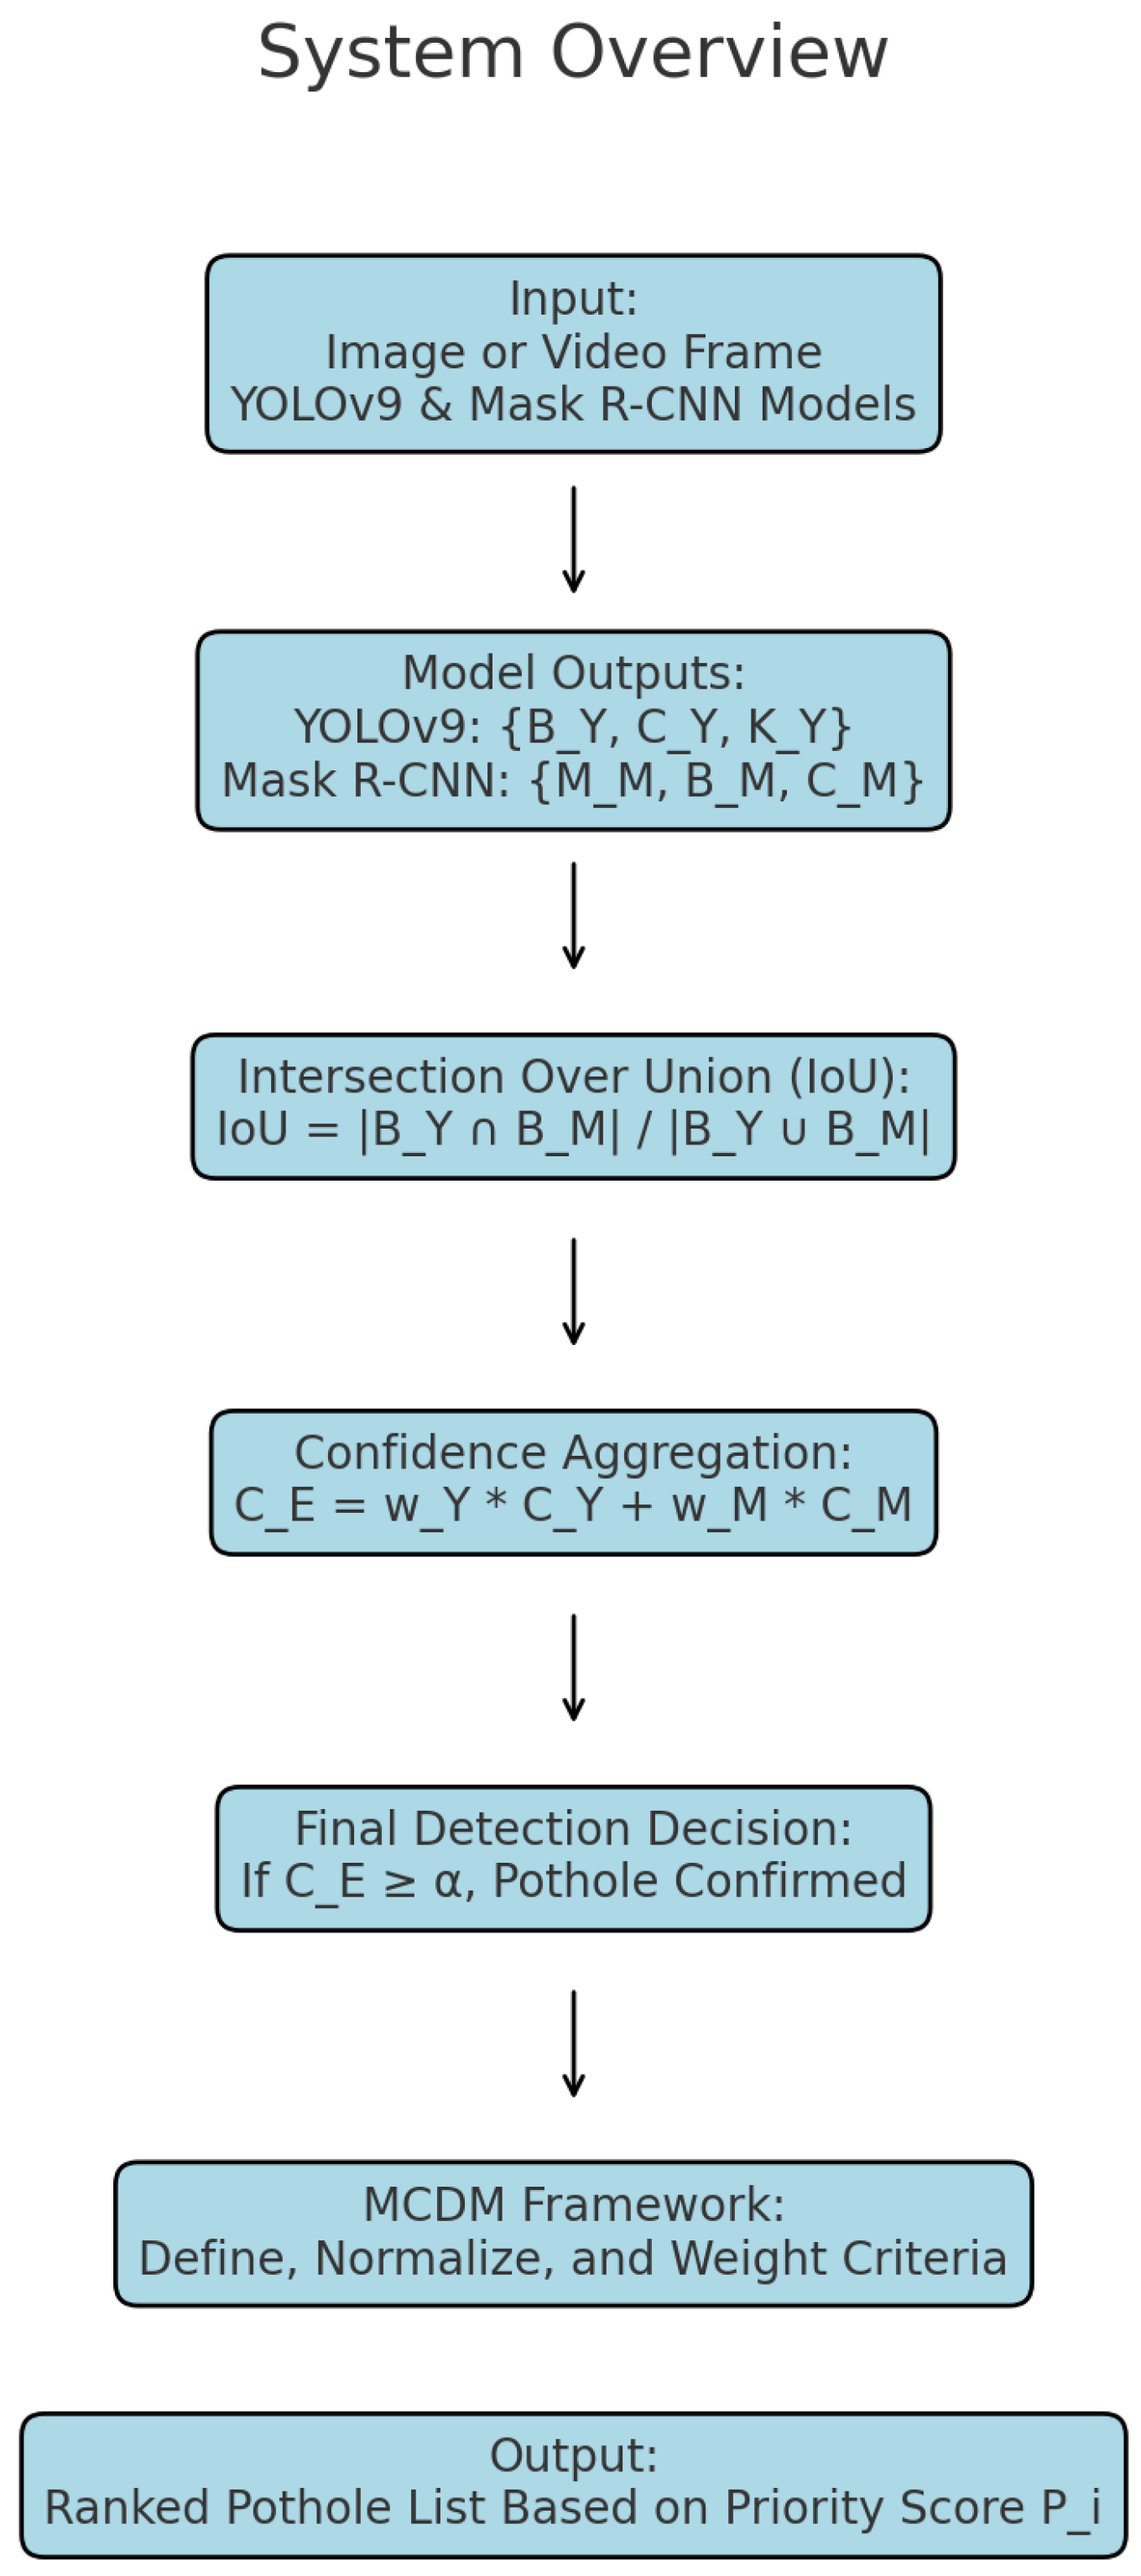
Figure 4.
Precision-Confidence Curve
Figure 5.
Recall-Confidence Curve
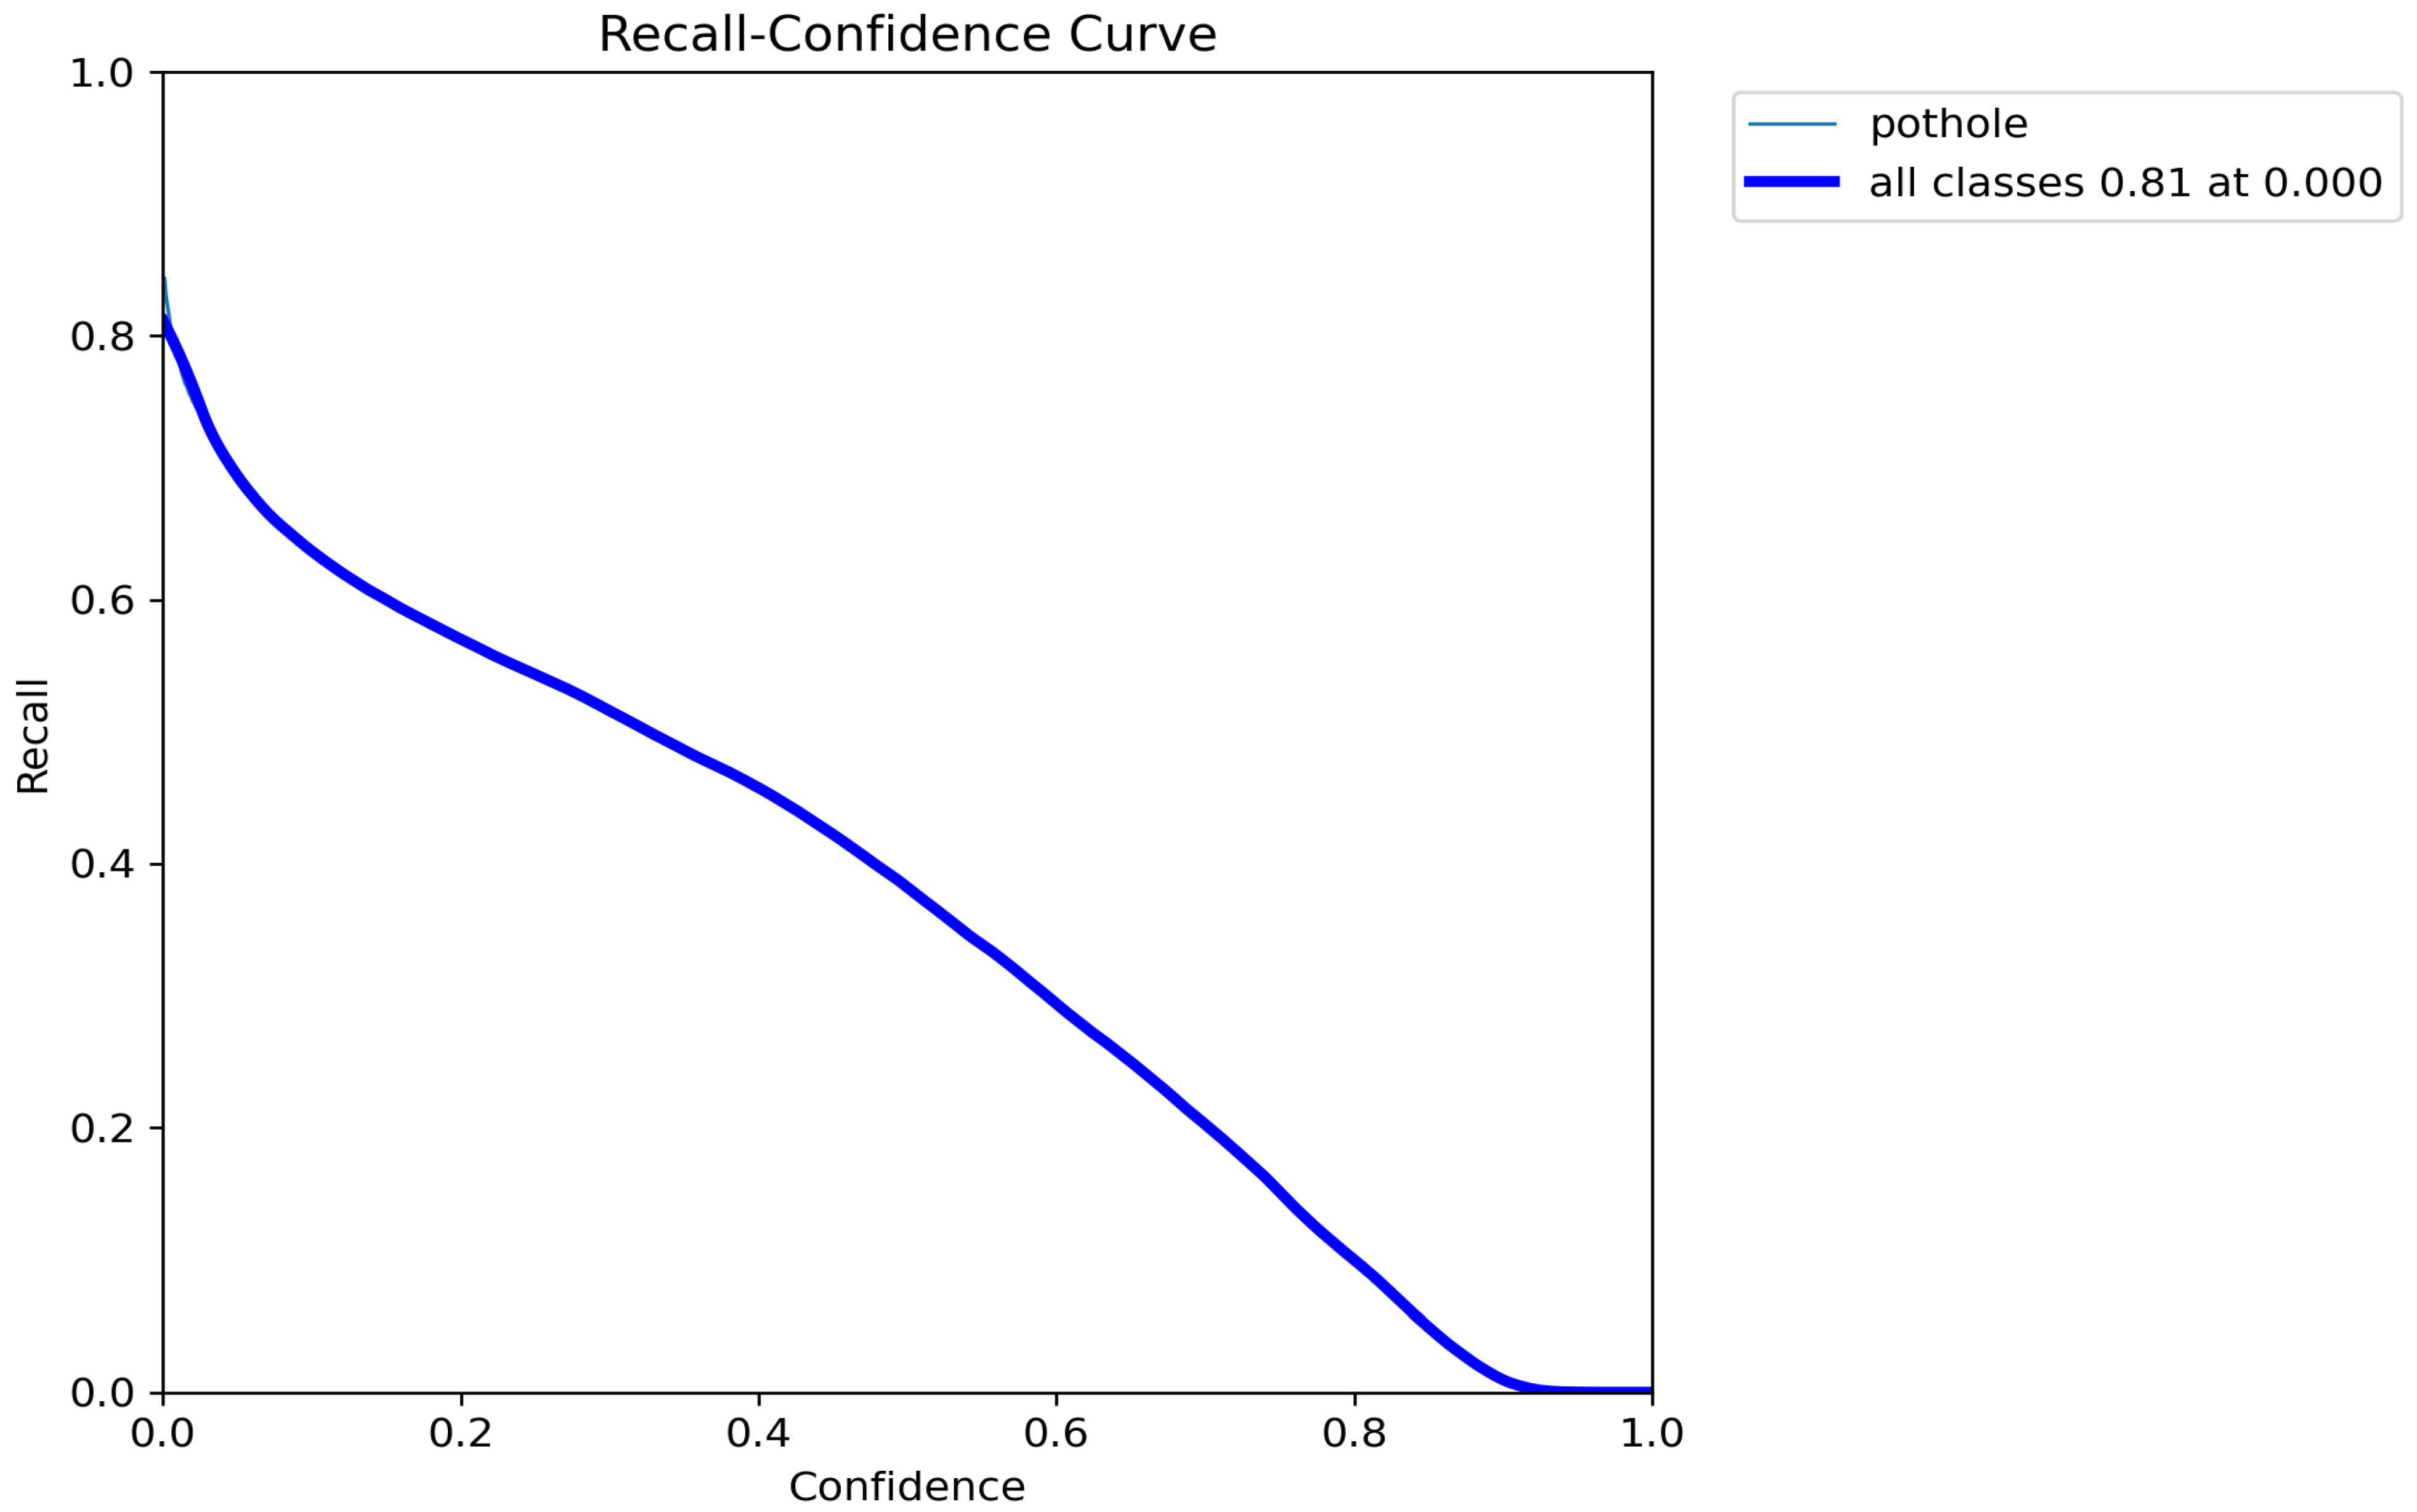
Figure 8.
Masking validation 1
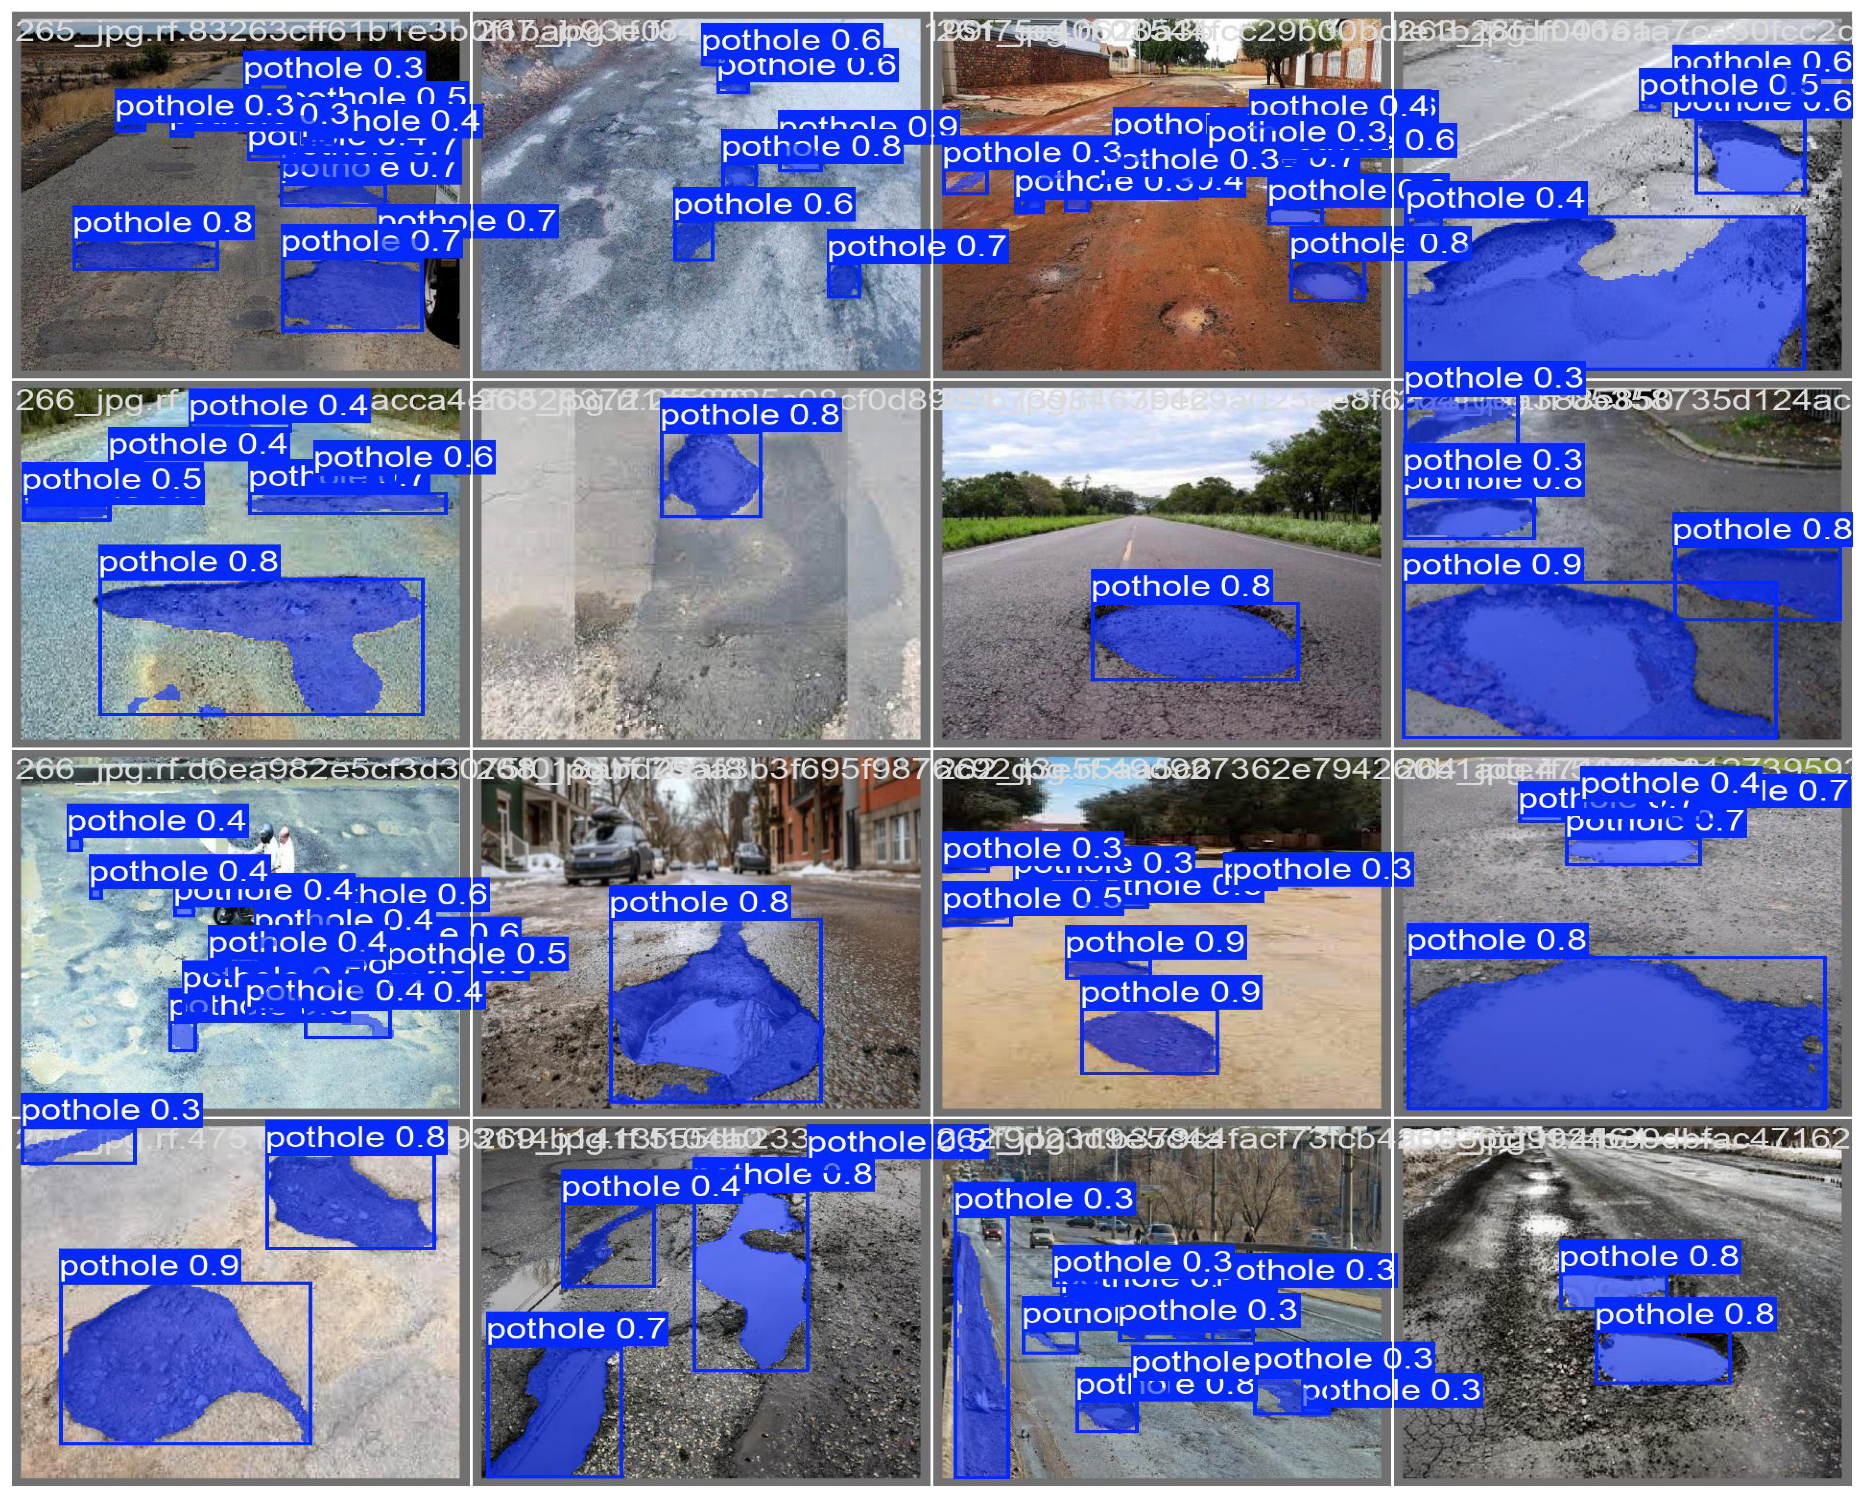
Figure 9.
Masking validation 2
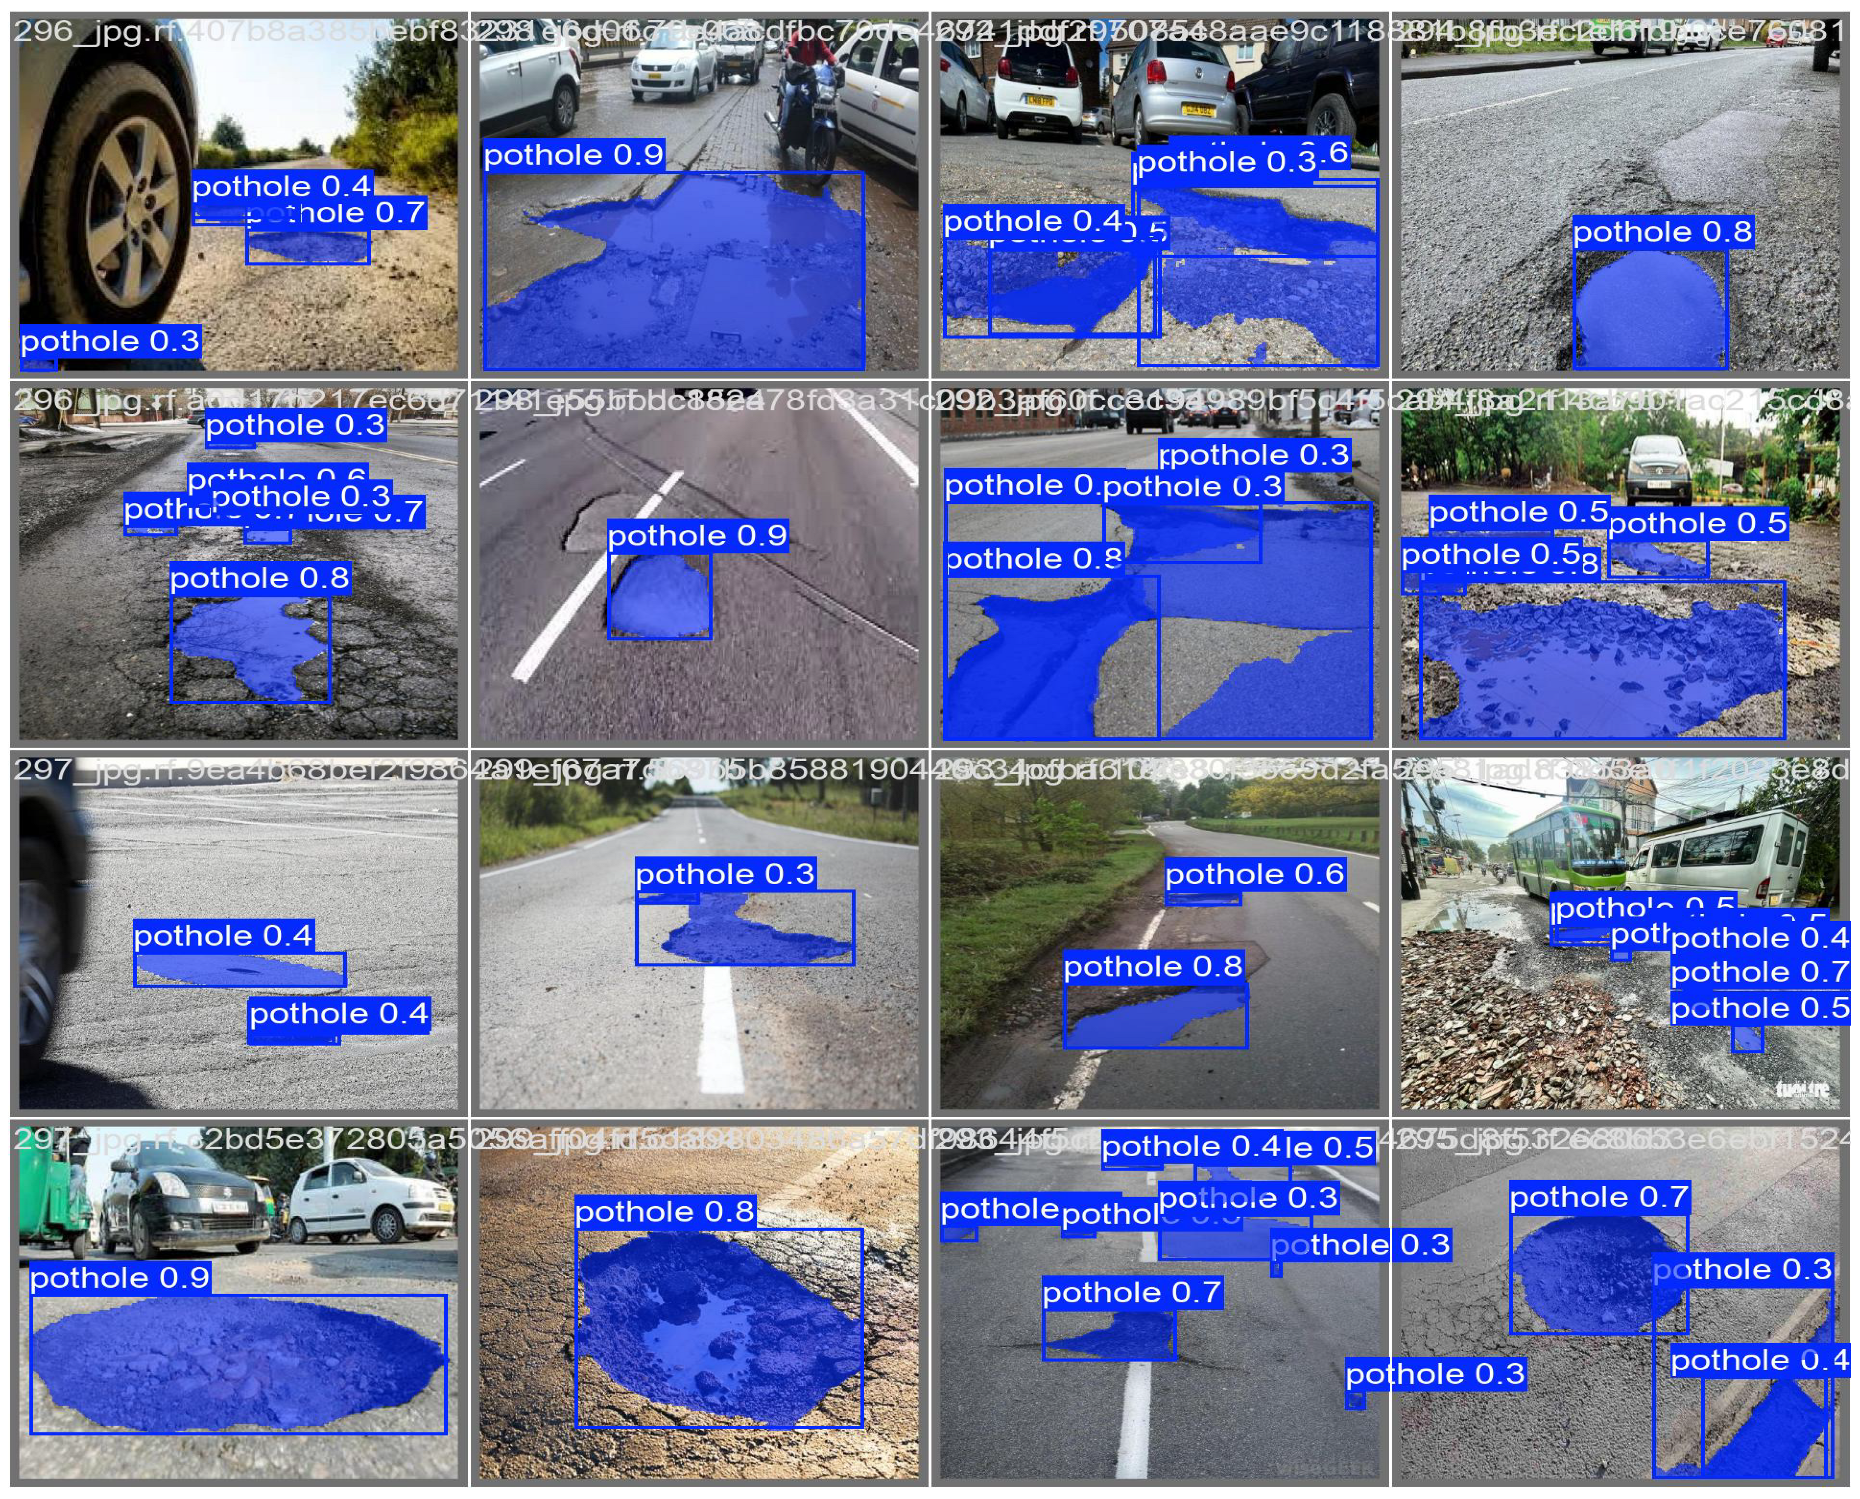
Figure 10.
Confusion Matrix
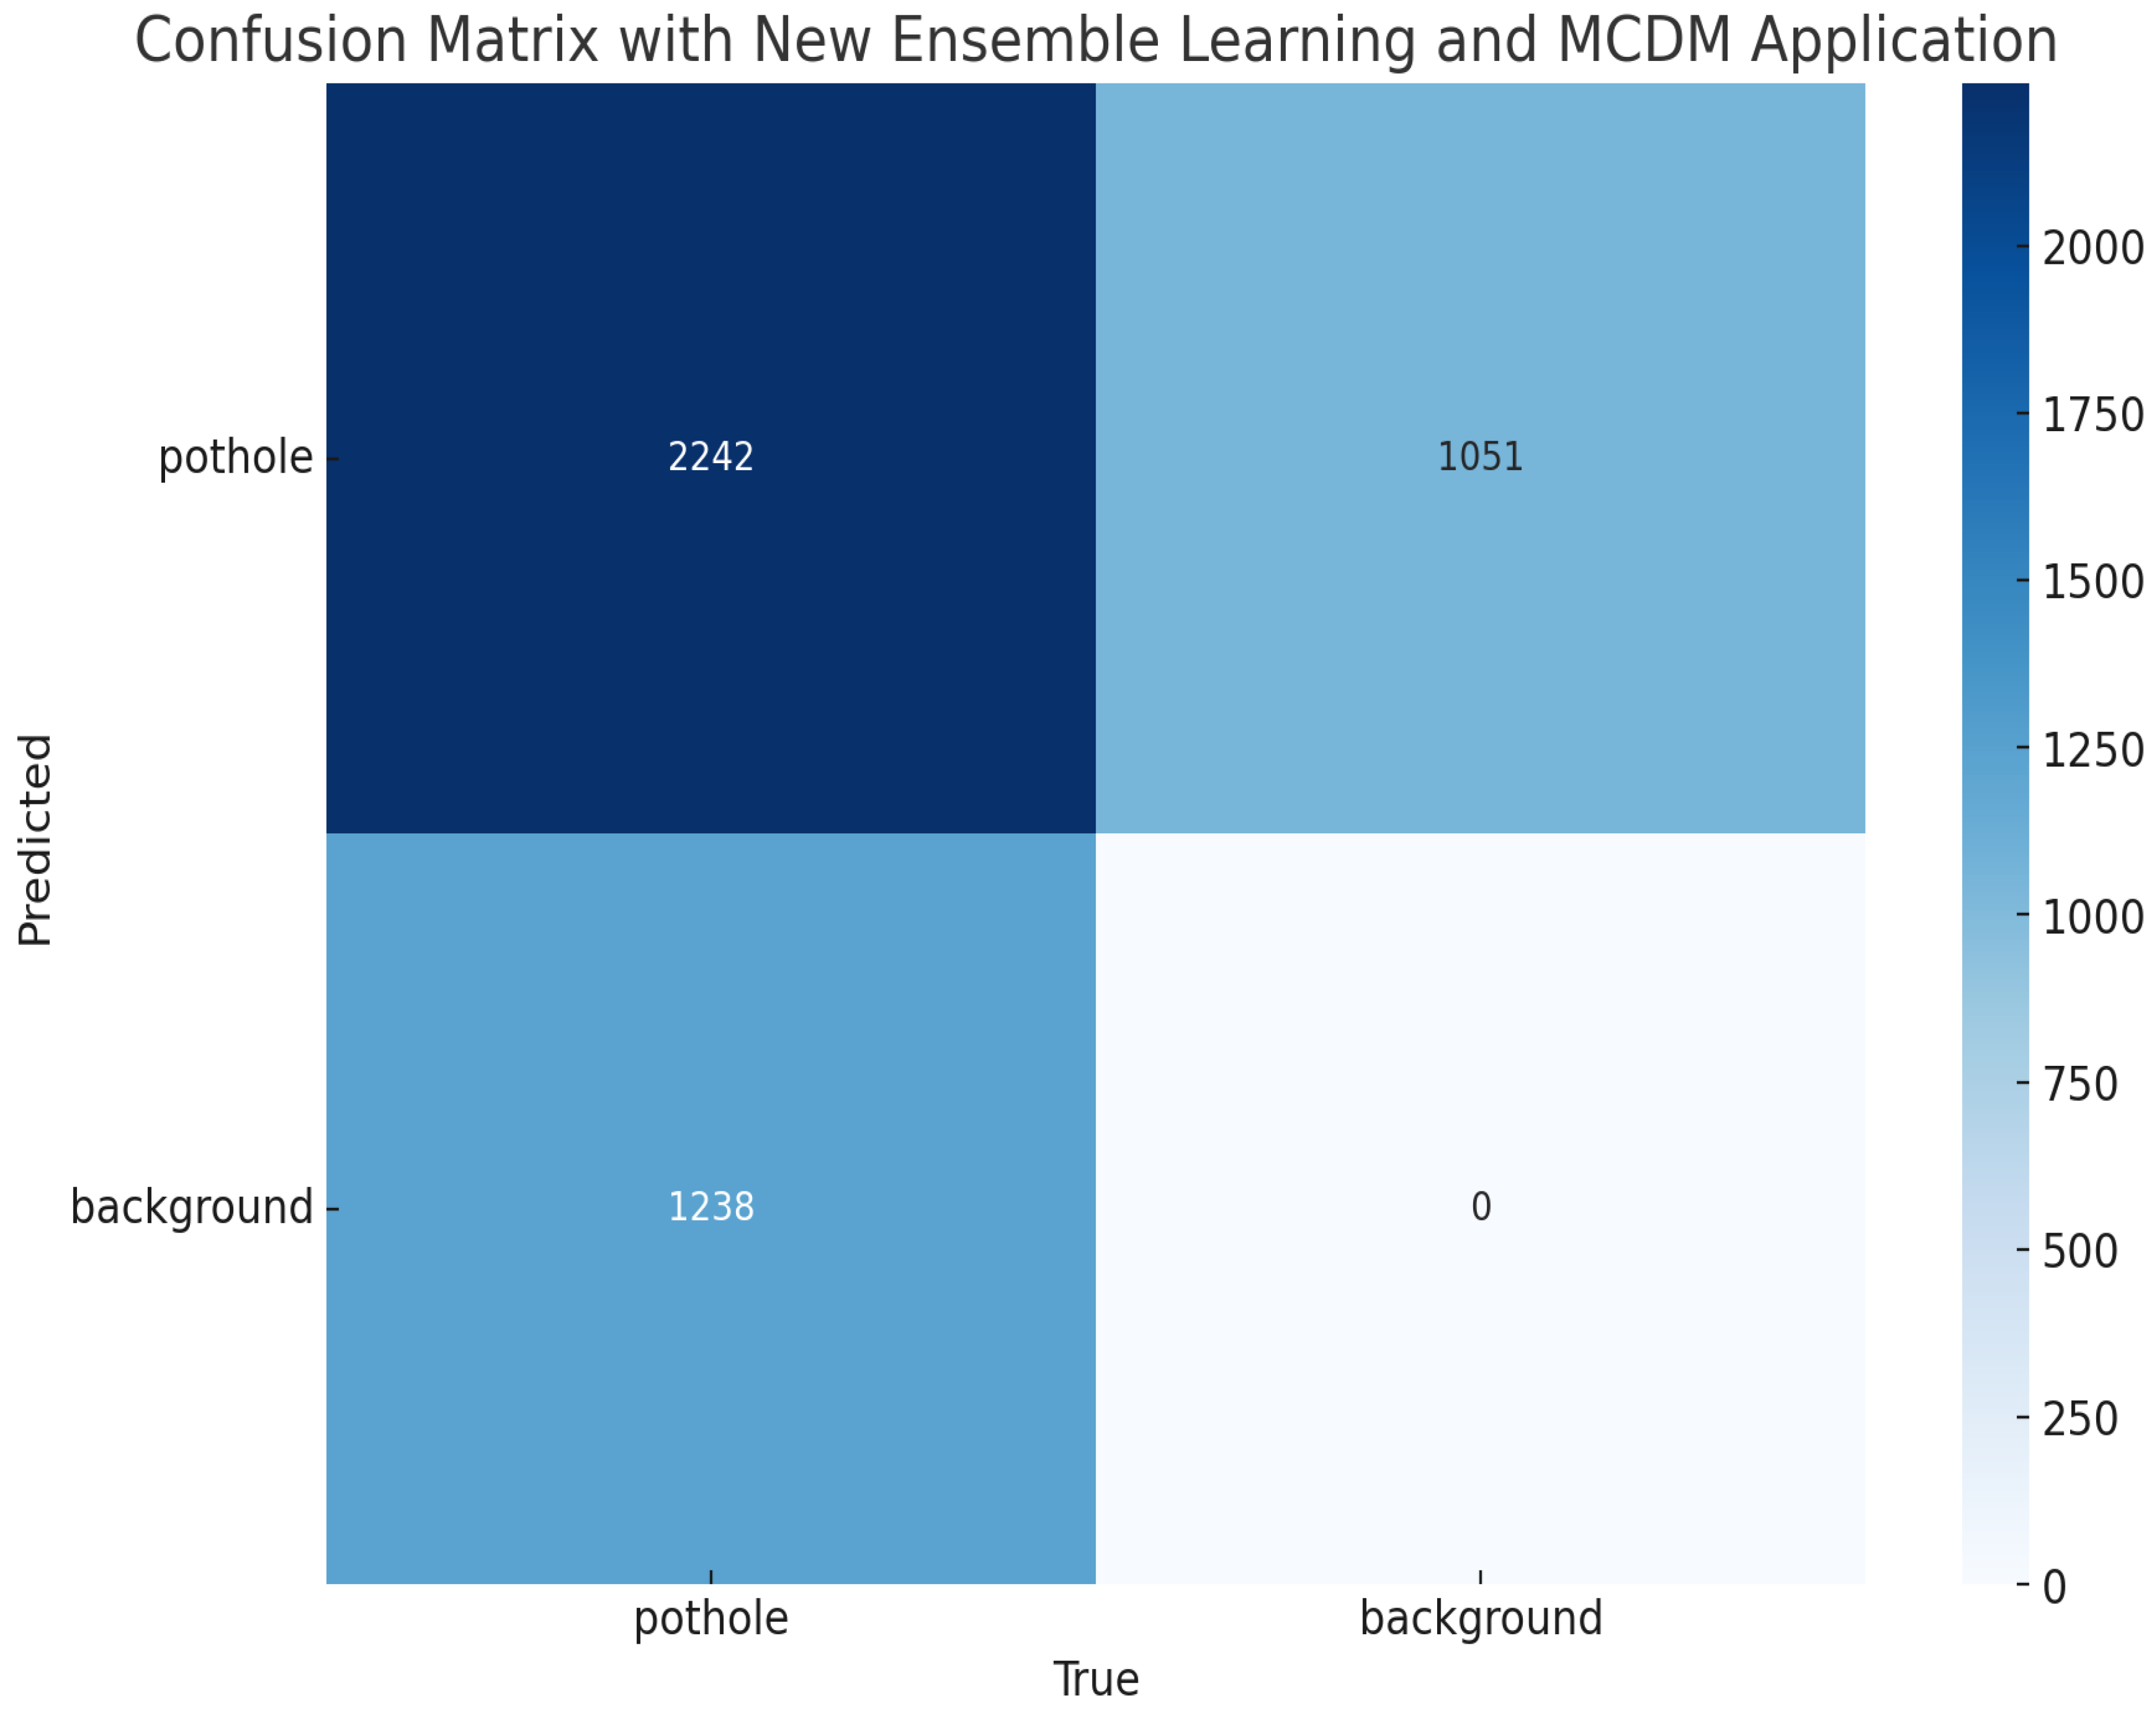
Figure 12.
Overfitting Confusion Matrix
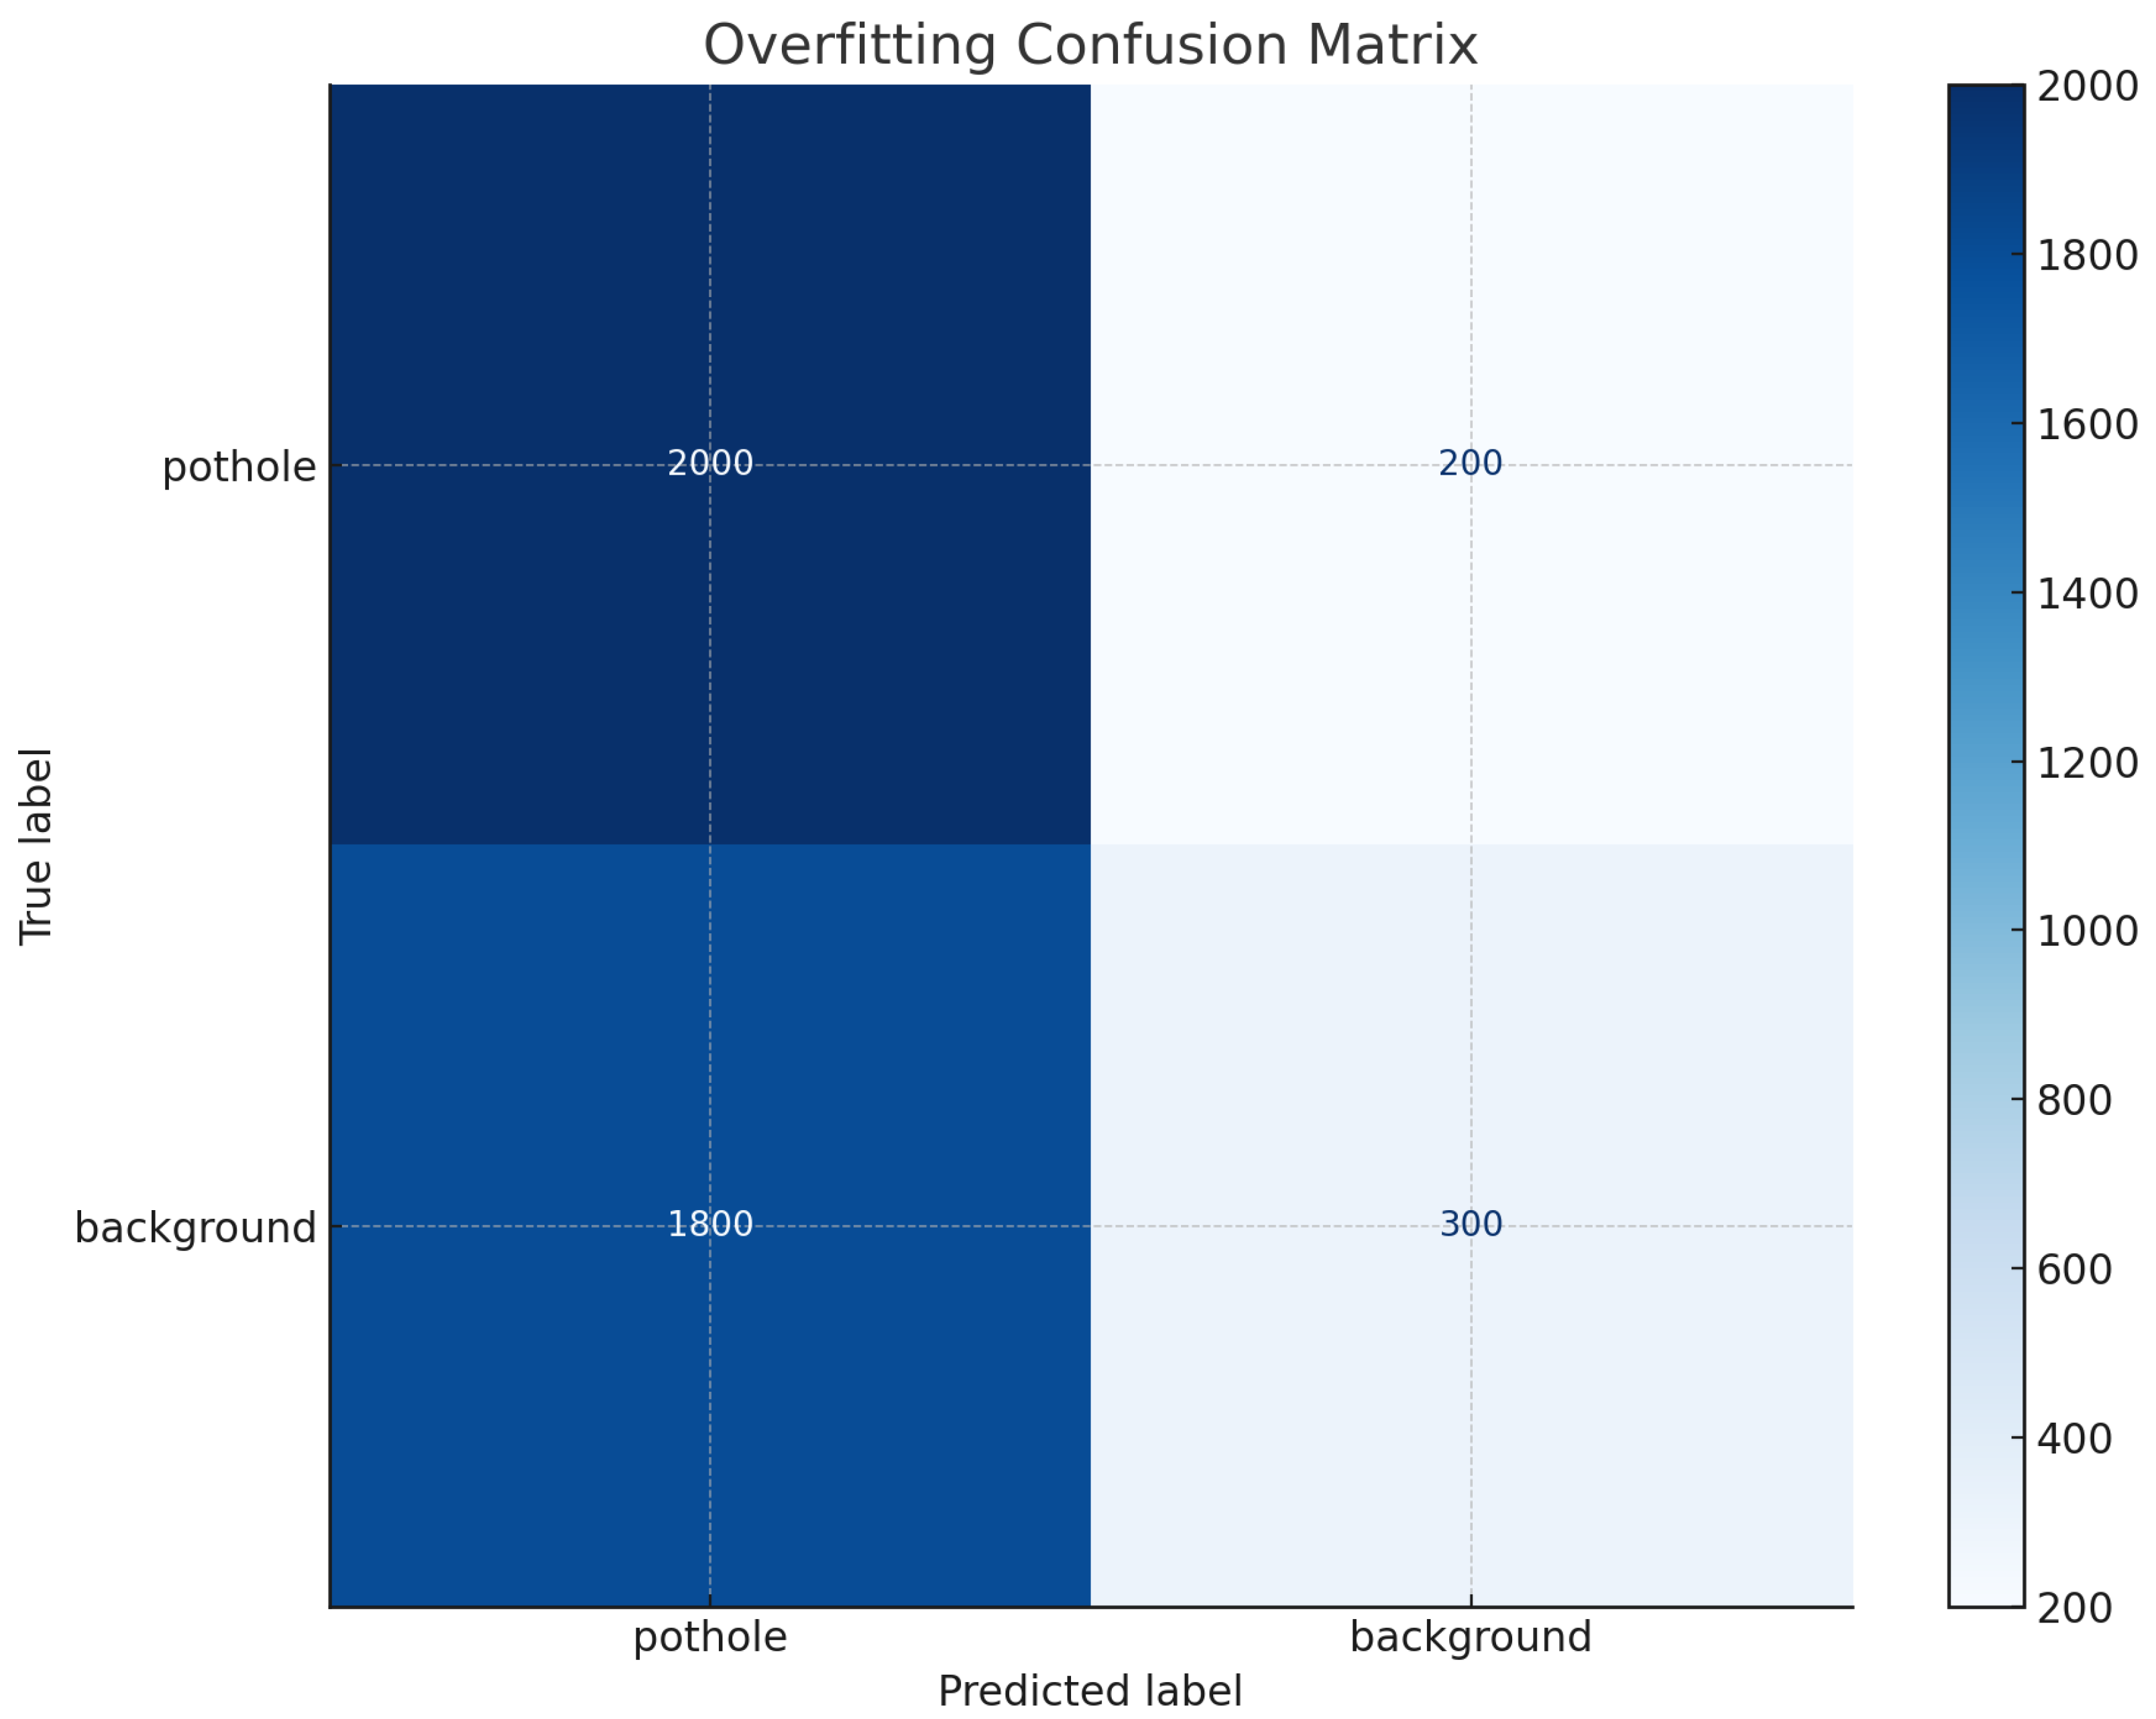
Figure 13.
Overfitting F1-Curve
Disclaimer/Publisher’s Note: The statements, opinions and data contained in all publications are solely those of the individual author(s) and contributor(s) and not of MDPI and/or the editor(s). MDPI and/or the editor(s) disclaim responsibility for any injury to people or property resulting from any ideas, methods, instructions or products referred to in the content. |
© 2024 by the authors. Licensee MDPI, Basel, Switzerland. This article is an open access article distributed under the terms and conditions of the Creative Commons Attribution (CC BY) license (http://creativecommons.org/licenses/by/4.0/).
Copyright: This open access article is published under a Creative Commons CC BY 4.0 license, which permit the free download, distribution, and reuse, provided that the author and preprint are cited in any reuse.


