Submitted:
19 December 2024
Posted:
20 December 2024
You are already at the latest version
Abstract
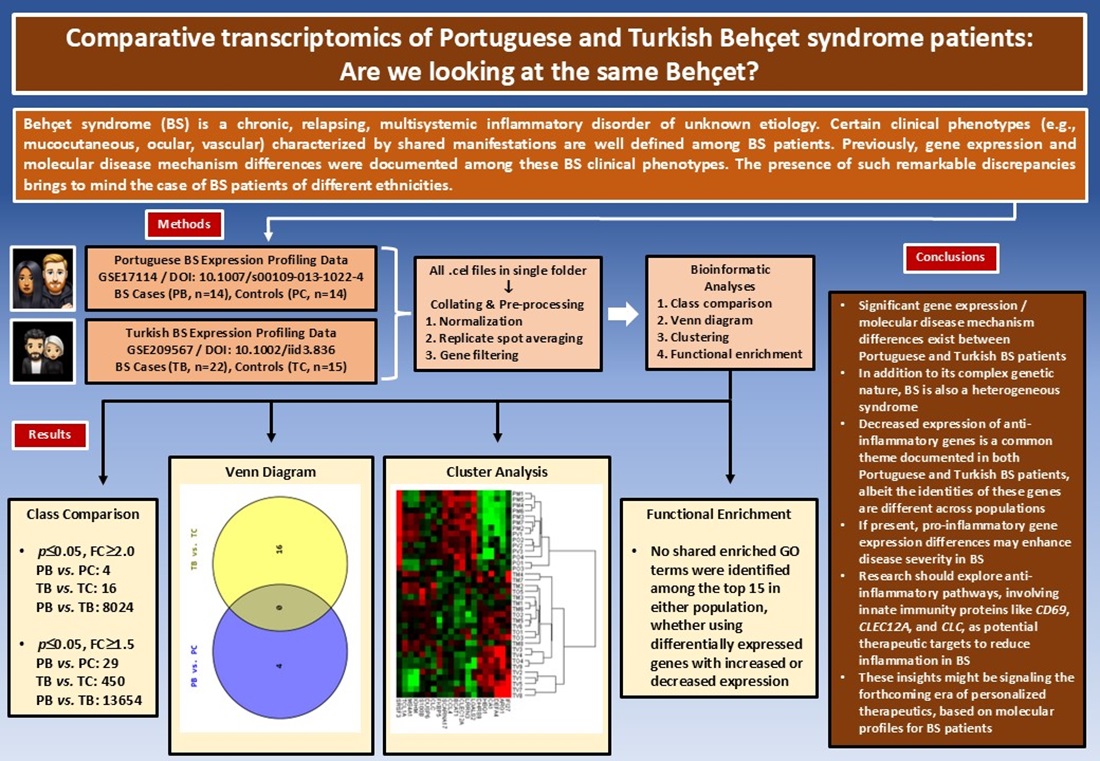
Background and Objectives: Behçet syndrome (BS) is a multisystemic inflammatory disorder of unknown etiology. Currently, BS is classified as a complex autoinflammatory disorder presenting with a variable vessel vasculitis. Inconsistent, sometimes contrasting immunological findings observed in BS studies and considerable geographic variation in BS’s disease expression are in need of explanation. Significant gene expression and molecular disease mechanisms differences were documented between BS clinical phenotypes. Such differences among patients of the same population brings to mind the case across different populations. This study aimed to compare gene expression profiles of Portuguese and Turkish BS patients. Materials and Methods: Publicly available (GEO repository) transcriptome datasets from Portuguese (GSE17114) and Turkish (GSE209567) BS cohorts were retrieved and analyzed. Differentially expressed genes (DEGs) were identified using p≤0.05 and fold-change (FC) thresholds of ≥1.5 and ≥2. BRB-ArrayTools for class comparisons, Venny 2.1.0 for Venn diagram analyses, Cluster 3.0 and Java Treeview for clustering analyses, and WebGestalt for functional enrichment analyses were used. Results: Substantial differences in DEG profiles were observed between Portuguese and Turkish BS patients. During the class comparison PBvs.TB (PB: Portuguese and TB: Turkish BS patients), 8024 DEGs were documented with an FC≥2. Venn diagram analysis showed no shared genes at the intersection PBvs.PC TBvs.TC (PC: Portuguese and TC: Turkish controls). Both populations demonstrated decreased anti-inflammatory gene expressions, albeit with distinct gene identities. A set of 20 genes including IFI27 successfully clustered PB&TB. No enriched gene ontology terms were shared during functional enrichment analyses. Conclusions: Significant molecular differences exist between Portuguese and Turkish BS patients. In addition to its complex genetic background, BS is a heterogeneous syndrome. Decreased expression of anti-inflammatory genes is common in BS. The identities of these genes are different across populations. Pro-inflammatory genes may further enhance disease severity in BS. A forthcoming era of personalized therapeutics based on molecular profiles may be approaching.
Keywords:
Behcet syndrome
; gene expression profiling
; transcriptome
; Portugal
; Turkey
; cluster analysis
; gene ontology
1. Introduction
Behçet syndrome (BS), also known as Behçet disease, is a chronic, relapsing, multisystemic inflammatory disorder of unknown etiology [1]. Initially described by Dr. Hulusi Behçet as a “triple symptom complex” of oral and genital ulcers and uveitis, BS is currently classified as a complex autoinflammatory disease characterized by a variable vessel vasculitis pathology [2–4]. In addition to the hallmark mucocutaneous manifestations of BS, the syndrome may also present with diverse ocular, musculoskeletal, gastrointestinal, pulmonary, cardiovascular, and central nervous system lesions [1,4,5].
Since its first definition in 1937, some important characteristics of BS have drawn considerable attention, albeit with no clear explanations [2]. The classical high prevalence geography of BS coinciding with the ancient trade route “Silk Road,” the discordant, sometimes paradoxical immunological findings present in BS studies, the divergent clinical phenotypes of the syndrome observed in different geographic regions, and the occurrence of predefined disease clusters with shared clinical manifestations among the BS patients are some of these characteristics waiting for explanations [4,6–8]. Still another interesting observation is that, even though BS occurs all around the globe, except for its characteristic “Silk Road” geography BS tends to follow a milder clinical course [9,10].
Previously, Oguz et al. were able to document significant gene expression and molecular disease mechanism differences among BS clinical subsets/phenotypes in two different populations (i.e., Portuguese and Turkish) [11,12]. The presence of such remarkable discrepancies, even among the BS patients of the same population, brings to mind the case of BS patients of different ethnicities.
The present study, which contrasted the gene expression profiling data sets of two populations of different ethnicities (i.e., Portuguese and Turkish), first documented the differentially expressed gene (DEG) sets and then analyzed these DEG sets further with multiple bioinformatics tools and thus aimed to display molecular level similarities and/or discrepancies between Portuguese and Turkish BS patients.
2. Materials and Methods
The design of the study enabled the researchers to proceed without receiving an ethics committee approval. The flowchart summarizing the study is presented in Figure 1.
2.1. The Gene Expression Profiling Studies by Xavier et al. and Oguz et al.
Although their designs showed certain differences, the profiling studies by Xavier et al. and Oguz et al. both included BS patients diagnosed according to the internationally recognized criteria, used GeneChip® Human Genome U133 Plus 2.0 (Affymetrix, Santa Clara, CA, USA) microarrays for hybridization, and were conducted and reported in accordance with the Minimum Information About Microarray Experiment (MIAME) guidelines [12–14].
2.2. Retrieval of the Expression Data
The raw microarray data of the study by Xavier et al. was previously retrieved from Gene Expression Omnibus (GEO) data repository using the GEO Accession GSE17114 on August 25th, 2015 [13,15]. The metadata, raw, and final/normalized data of the study by Oguz et al. were deposited to GEO with the accession GSE209567 on July 22nd, 2022 [12,15].
2.3. The Demographic and Clinical Data of the Study Population and the Definition of the Clinical Subsets of Patients with Behçet Syndrome
The demographic and clinical data relevant to the study population is extracted from the papers of Xavier et al. (DOI: 10.1007/s00109-013-1022-4) and Oguz et al. (DOI: 10.1002/iid3.836) [12,13]. The BS patients included in these two studies were grouped into four clinical phenotypes as mucocutaneous BS (MB), ocular BS (OB), vascular BS (VB), and other BS (DB), according to their individual clinical characteristics and the criteria presented in Table 1. The group inclusive of all BS patients was named B, while the control group was given the name C. For Portuguese individuals, the initial P and for Turkish individuals, the initial T was also added.
2.4. Excluded Samples/Cases
Following Oguz et al.’s two studies, the sample GSM428038 from Xavier et al.’s dataset (as an outlier in the PVB group) and the samples GSM6376933, GSM6376934, GSM6376935, GSM6376936, GSM6376937, GSM6376938, and GSM6376939 from Oguz et al.’s dataset (as complex phenotype BS patients in the TDB group) were excluded from the study (Figure 1) [11,12].
2.5. Statistical Analysis of the Demographic Characteristics
As the demographic data of the study population did not follow a normal distribution, the median as a measure of central tendency, and the minimum and the maximum values were presented. For the comparisons between two independent groups, the Independent-Samples Median Test and the Chi-Square tests were used. The p values of the analyses were presented with their absolute numerical values and a p value of ≤0.05 was considered statistically significant. Statistical analyses of the demographic data were performed using “SPSS for Windows, Version 16.0” software (SPSS Inc. Released 2007. SPSS for Windows, Version 16.0. Chicago, SPSS Inc.).
2.6. Pre-Processing of the Microarray Data
Before continuing with the downstream analyses, pre-processing of the microarray data was performed using BRB-ArrayTools Version 4.6.1 Stable Release developed by Dr. Richard Simon and BRB-ArrayTools Development Team (Figure 1) [16]. The gene expression data present as individual raw .cel files was collated by the data import function of BRB-ArrayTools. The Robust Multiarray Average (RMA) algorithm was implemented for the normalization of the microarray data [17]. Following the normalization step, the replicate spots within each array were averaged and finally, gene filters were used which helped to exclude genes that were not likely to be informative. For this purpose, a “minimum fold-change filter” in addition to a “percent missing filter” were used, which were ready-to-use functions of the BRB-ArrayTools software [16].
2.7. Bioinformatics Analyses of the Gene Expression Data
Class comparison analyses were performed using BRB-ArrayTools (Version 4.6.1 Stable Release) [16]. Two-sample t-test with a random variance model was implemented for class comparison analysis of two classes. Differentially expressed genes were selected using a p value of ≤0.05 and fold changes (FC) of ≥1.5 and ≥2.
Comparisons of the DEG sets with Venn diagrams were performed using Venny 2.1 by Juan Carlos Oliveros [18]. For Venn diagram analyses, DEGs with p≤0.05 and FC≥2 were used.
BRB-ArrayTools’ (Version 4.6.1 Stable Release) built-in clustering tools, Cluster 3.0 (developed by Michael Eisen and the Stanford group and modified by Michiel de Hoon), and Java Treeview softwares were used for clustering analyses [16,19,20]. A hierarchical clustering algorithm using Euclidean distance metric and average linkage was implemented and both the samples/cases and the genes were clustered.
Functional enrichment analyses of the DEG sets were performed with the WEB-Based Gene Set Analysis Toolkit (WebGestalt) and the chosen method of Over-Representation Analysis (ORA) specifically focused on the functional database of gene ontology biological process [21]. In order to provide sufficient number of genes with the uploaded gene lists to WebGestalt, DEG lists with p≤0.05 and FC≥1.5 were used. For the reference set, “affy hg u133 plus 2” was chosen.
3. Results
3.1. Demographics of the Study Population
The essential demographic characteristics of the study population are presented in Table 2 (Supplementary Material Table S1). Regarding the basic demographic characteristics, the Portuguese and Turkish populations were similar.
3.2. Pre-Processing Results of the Microarray Data
The box-and-whisker plots of the normalized microarray expression data are presented in Figure 2.
Following the pre-processing steps performed on the collated 65 .cel files, 16060 probe sets out of the 54675 present on the GeneChip® Human Genome U133 Plus 2.0 microarrays passed the adjusted filters and were used during the subsequent bioinformatics analyses.
3.3. Class Comparison Analyses
Details regarding the number of the DEGs obtained during the class comparison analyses are shown in Table 3 (country/population specific) (Supplementary Material Table S2 [FC≥1.5] and Supplementary Material Table S3 [FC≥2.0]) and Table 4 (between the two populations) (Supplementary Material Table S4 [FC≥1.5] and Supplementary Material Table S5 [FC≥2.0]).
The top 10 most differentially expressed genes documented during the class comparison analyses (p≤0.05 and FC≥1.5 for all) are listed according to their FC values and presented in Table 5 (country/population specific) and Table 6 (between the two populations). Remarkably, CA1 (Carbonic Anhydrase 1) gene was the one and only shared gene, when the country/population specific class comparisons’ top 10 lists were intersected (Table 5). Likewise, genes (i.e., CD69, IFI27, CLC, CLEC12A) which were previously shown to potentially contribute to BS pathogenesis in Portuguese and Turkish populations, were not shared among the country/population specific top 10 lists (Table 5).
3.4. Venn Diagram Analyses
The illustrations of the PB vs. PC ∩ TB vs. TC, PMB vs. PC ∩ TMB vs. TC, POB vs. PC ∩ TOB vs. TC, and PVB vs. PC ∩ TVB vs. TC Venn diagram analyses are presented in Figure 3 (Supplementary Material Table S3). It was striking to see the PB vs. PC ∩ TB vs. TC and the PMB vs. PC ∩ TMB vs. TC intersection sets empty (i.e., no shared genes) and the POB vs. PC ∩ TOB vs. TC intersection set with only 2 genes (Figure 3).
3.5. Cluster Analyses
The dendrogram and heatmap representations of the results of the cluster analyses of the Portuguese and Turkish BS patients and patient subsets are presented in Figure 4 (Supplementary Material Table S6). As shown in Figure 4, the gene sets used and the algorithm implemented successfully clustered both Portuguese and Turkish BS patients and Portuguese and Turkish BS clinical subsets. Important to note, the gene sets used for clustering purposes were constructed from the top 10 most differentially expressed genes observed during the population specific class comparison analyses.
3.6. Functional Enrichment Analyses
The results of the population specific functional enrichment analyses performed individually with DEG sets with increased and decresed expression are schematically presented in Figure 5 (DEGs with increased expression) and Figure 6 (DEGs with decreased expression) and given in detail in Supplementary Material Table S7. Strikingly and unexpectedly, not even a single gene ontology biological process term was common in the Portuguese and the Turkish populations’ functional enrichment analyses top 15 terms (Figure 5 and Figure 6).
4. Discussion
This study sought to investigate the molecular immunopathogenetic similarities and differences underlying BS across two different ethnic populations, Portuguese and Turkish. As Oguz et al.’s two previous studies pointed to the potential pathogenetic role of certain innate immunity genes (i.e., CD69, CLEC12A, CLC, and IFI27) in BS, specific focus was on BS’s fundamental innate immunity pathology [11,12]. Our main findings highlighted significant gene expression and molecular disease mechanism differences between Portuguese and Turkish BS patients, particularly regarding the anti-inflammatory and the pro-inflammatory genes. As the authors we comment that, the anti-inflammatory and the pro-inflammatory genes are the key to understand the immunopathogenesis of BS [12] and the documented expression differences in this study among the two different ethnicities may account for the observed discordant, sometimes paradoxical immunological findings present in BS studies and also the divergent clinical phenotypes of the syndrome observed in different geographic regions. Additionally, the distinct DEGs and the different molecular mechanisms observed across ethnicities, reinforces the concept of BS as a syndrome rather than a single disease entity.
Analysis of demographic characteristics revealed that BS and control groups, as well as the three BS clinical phenotypes (i.e., mucocutaneous, ocular, and vascular), were comparable in terms of age and gender distribution across the two different ethnicities (Table 2). While Turkish BS patients showed a slight male predominance, Portuguese BS patients had an equal Male/Female ratio, which aligns well with the existing literature [4,8,10]. Furthermore, a gender-based difference in severity was observed among Turkish BS patients, males were more prominent in vascular BS, while the mucocutaneous subset showed a Male/Female ratio of 1/7 (Table 2). This pattern was absent in the Portuguese population, consistent with the literature indicating a male predominance in more severe BS phenotypes [4,8].
Class comparison analyses revealed notable differences between populations. When comparing each population’s BS patients to its respective control, the DEG counts ranged from single to triple digits (min.: 4, max.: 549, p≤0.05, FC≥2.0) (Table 3). In contrast, comparisons between Portuguese and Turkish BS groups revealed DEG counts in the four-digit range (min.: 7466, max.: 8642, p≤0.05, FC≥2.0) (Table 4). Subtracting the Portuguese Control vs. Turkish Control class comparison’s DEGs (6549, p≤0.05, FC≥2.0) did not substantially lower these DEG counts and this finding suggests that, the gene expression differences observed in BS groups are not solely attributable to ethnic background. These substantial molecular discrepancies between the BS groups reinforce the idea that distinct pathways underlie BS across different populations [1]. Comparison of the top 10 DEGs demonstrated minimal overlap between Portuguese and Turkish BS patients, with only CA1 shared among the two populations (Table 5). Notably, previously identified innate immunity genes with potential pathogenetic contribution to BS (i.e., CD69, IFI27, CLEC12A, and CLC) were not shared in the top 10 DEG lists of the two populations (Table 5). This finding indicates that while gene functions may be similar, the exact molecular drivers differ across populations in BS. The same finding also aligns with our hypothesis that the gene expression and molecular mechanisms involved in BS likely vary by ethnicity, further supporting the notion of BS as a heterogeneous syndrome.
In Portuguese BS patients, CD69 showed increased expression across patient subgroups relative to Turkish counterparts (Table 6). The CD69 gene, previously associated with milder disease expression in Portuguese BS patients by Oguz et al., suggests a protective, anti-inflammatory role that might contribute to milder BS manifestations in Portuguese patients [11,22–24]. Conversely, the involvement of genes such as IFI27, CLEC12A, and CLC in Turkish BS patients suggests a more severe clinical presentation in this population (Table 5). Together, these findings support a model where distinct genetic profiles influence BS severity across ethnicities, potentially providing a molecular basis for population-specific therapeutic strategies in future.
Venn diagram analyses revealed no shared DEGs in the intersections of PB vs. PC ∩ TB vs. TC and PMB vs. PC ∩ TMB vs. TC (Figure 3). It was striking, especially not to see even one shared gene in the PB vs. PC ∩ TB vs. TC set. When the relatively more severe forms of BS (i.e., ocular and vascular BS) were analyzed, the number of shared DEGs increased (2 for POB vs. PC ∩ TOB vs. TC [out of 166 genes] and 32 for PVB vs. PC ∩ TVB vs. TC [out of 733 genes]) (Figure 3). This finding may be reflecting gene expression modifications secondary to prolonged and severe tissue damage and therapeutic effects. In cases of severe BS, especially in those patients with organ and/or life threatening disease, common immunosuppressive or immunomodulatory treatments are often used to limit the disease activity with potential consequences in gene expression profiles [25].
Clustering analyses successfully distinguished Portuguese and Turkish BS patients and their respective clinical phenotypes using only around 20 genes per analysis (Figure 4). Notably, IFI27 emerged as the only shared gene across clustering DEG lists, underlining its potential importance as a key pro-inflammatory gene in Turkish BS patients [12]. This finding may (1) support the view that IFI27 may play a pivotal role in distinguishing BS patients across ethnicities, (2) emphasize its relevance in BS pathogenesis in Turkish population, and (3) further underline innate immunity and inflammatory mechanisms as central in BS pathogenesis. Also, as the authors we hypothesize that, given the role of IFI27 in driving pro-inflammatory pathways, it may represent a key therapeutic target for BS management [12,26,27].
The functional enrichment results further confirmed significant molecular differences between Portuguese and Turkish BS patients. No shared enriched gene ontology terms were identified among the top 15 in either population whether using DEGs with increased or decreased expression (Figure 5 and Figure 6). Functional enrichments differed significantly between Portuguese and Turkish BS patients, with Portuguese patients showing pathways related to neutrophil degranulation and immune response, while Turkish patients displayed enrichment in Type I interferon signaling and T-cell receptor pathways (Figure 5 and Figure 6). This lack of common functional enrichments between the two populations again supports the hypothesis that BS’s molecular mechanisms vary by ethnicity.
We must acknowledge several limitations regarding the study. First, this in-silico study was relying on microarray data, which, while valuable, lacks the advantages of next-generation sequencing methods. As is well known, RNA sequencing could capture rare transcripts and identify genetic variants which are not detectable in microarrays, potentially expanding our understanding of BS pathogenesis [28]. Furthermore, this study was limited to Portuguese and Turkish populations, which clearly is not able to represent BS heterogeneity globally. Additionally, treatment effects on gene expression cannot be ruled out as BS patients enrolled in the study were known to continue their pharmacological therapies. Finally, the present study did not include BS patients with complex clinical phenotypes involving multiple organs/organ systems. Future research with larger treatment-naive BS patients, across more diverse geographic regions could provide further insights into BS’s immunopathogenesis and immunopathogenetic diversity.
5. Conclusions
In conclusion, this study demonstrated significant gene expression and molecular disease mechanism differences between Portuguese and Turkish BS patients. This finding strongly supported the complex autoinflammatory disorder classification of BS and added that, in addition to its complex genetic nature, BS is also a heterogeneous syndrome. The observed interethnic differences of gene expression and molecular mechanisms may account for the inconsistent, sometimes contrasting immunological findings observed in BS research and the distinct clinical phenotypes of BS cumulating in certain geographic regions of the globe. Decreased expression of anti-inflammatory genes was a common theme documented in both Portuguese and Turkish BS patients, albeit the identities of these genes differed across populations. This finding occurred to such an extent that, important anti-inflammatory genes with potential pathogenetic roles in one population were not detected in the other. Additionally, if present, pro-inflammatory gene expression differences seemed to enhance disease severity. Future research should explore the anti-inflammatory pathways, especially involving innate immunity proteins like CD69, CLEC12A, and CLC, as potential therapeutic targets to reduce inflammation in BS. These insights signal the forthcoming era of personalized therapeutics based on molecular profiles for BS patients.
Supplementary Materials
The following supporting information can be downloaded at the website of this paper posted on Preprints.org, Supplementary Material Table S1: Essential demographics of the study population; Supplementary Material Table S2: Population specific class comparison results, FC≥1.5; Supplementary Material Table S3: Population specific class comparison results, FC≥2.0; Supplementary Material Table S4: Cross-population class comparison results, FC≥1.5; Supplementary Material Table S5: Cross-population class comparison results, FC≥2.0; Supplementary Material Table S6: Cluster analysis gene lists; Supplementary Material Table S7: Population specific functional enrichment analysis results.
Author Contributions
Conceptualization, S.T. and A.K.O.; methodology, A.K.O.; formal analysis, S.T.; investigation, T.I. and A.Z.; writing—original draft preparation, T.I. and A.Z.; writing—review and editing, C.S.O. and A.K.O.; All authors have read and agreed to the published version of the manuscript.
Funding
This research received no external funding.
Institutional Review Board Statement
Ethical review and approval were waived for this study because the study design involved secondary bioinformatic analysis of publicly available genomic data sets.
Informed Consent Statement
Not applicable.
Data Availability Statement
All the bioinformatics data supporting the findings of this study are either presented within the manuscript or with the Supplementary Material Files accompanying the manuscript. The microarray expression data of the studies by Xavier et al. and Oguz et al. can be obtained through Gene Expression Omnibus data repository with the accession numbers GSE17114 and GSE209567, respectively.
Acknowledgments
The authors express their sincere gratitude to all the scientists who share their valuable research data with their colleagues for the benefit of humanity.
Conflicts of Interest
The authors declare no conflicts of interest.
References
- Yazici, Y.; Hatemi, G.; Bodaghi, B.; et al. Behçet syndrome. Nat Rev Dis Primers 2021, 7, 67. [Google Scholar] [CrossRef] [PubMed]
- Behçet, H.; Matteson, E.L. On relapsing, aphthous ulcers of the mouth, eye and genitalia caused by a virus. 1937. Clin Exp Rheumatol 2010, 28, S2-5. http://www.ncbi.nlm.nih.gov/pubmed/20868561.
- Jennette, J.C.; Falk, R.J.; Bacon, P.A.; et al. 2012 Revised International Chapel Hill Consensus Conference Nomenclature of Vasculitides. Arthritis Rheum 2013, 65, 1–11. [Google Scholar] [CrossRef] [PubMed]
- Gül, A. Behçet Disease. In Textbook of Autoinflammation; Hashkes, P.J., Laxer, R.M., Simon, A., Eds.; Springer International Publishing: Cham, Switzerland, 2019; pp. 647–665. [Google Scholar] [CrossRef]
- Mat, M.C.; Bang, D.; Lee, E.S.; Kutlubay, Z. The Mucocutaneous Manifestations and Pathergy Reaction in Behçet Syndrome. In Behçet Syndrome; Yazici, Y., Hatemi, G., Seyahi, E., Yazici, H., Eds.; Springer International Publishing: Cham, Switzerland, 2020; pp. 37–50. [Google Scholar] [CrossRef]
- Keino, H.; Okada, A.A. Behcet’s disease: global epidemiology of an Old Silk Road disease. British Journal of Ophthalmology 2007, 91, 1573–1574. [Google Scholar] [CrossRef] [PubMed]
- Direskeneli, H.; Saruhan-Direskeneli, G. Disease Mechanisms. In Behçet Syndrome; Yazici, Y., Hatemi, G., Seyahi, E., Yazici, H., Eds.; Springer International Publishing: Cham, Switzerland, 2020; pp. 209–222. [Google Scholar] [CrossRef]
- Yurdakul, S. Epidemiology of Behçet Syndrome and Regional Differences in Disease Expression. In Behçet Syndrome; Yazici, Y., Hatemi, G., Seyahi, E., Yazici, H., Eds.; Springer International Publishing: Cham, Switzerland, 2020; pp. 21–35. [Google Scholar] [CrossRef]
- Leccese, P.; Yazici, Y.; Olivieri, I. Behcet’s syndrome in nonendemic regions. Curr Opin Rheumatol 2017, 29, 12–16. [Google Scholar] [CrossRef] [PubMed]
- Leonardo, N.M.; McNeil, J. Behcet’s Disease: Is There Geographical Variation? A Review Far from the Silk Road. Int J Rheumatol 2015, 2015, 1–7. [Google Scholar] [CrossRef] [PubMed]
- Oğuz, A.K.; Yılmaz, S.T.; Oygür, Ç.Ş.; et al. Behçet’s: A Disease or a Syndrome? Answer from an Expression Profiling Study. PLoS One 2016, 11, e0149052. [Google Scholar] [CrossRef] [PubMed]
- Oğuz, A.K.; Oygür, Ç.Ş.; Taşır, S.; Özdağ, H.; Akar, M.N. Behçet syndrome: The disturbed balance between anti- (CLEC12A, CLC) and proinflammatory (IFI27) gene expressions. Immun Inflamm Dis 2023, 11. [Google Scholar] [CrossRef] [PubMed]
- Xavier, J.M.; Krug, T.; Davatchi, F.; et al. Gene expression profiling and association studies implicate the neuregulin signaling pathway in Behçet’s disease susceptibility. J Mol Med 2013, 91, 1013–1023. [Google Scholar] [CrossRef]
- Brazma, A.; Hingamp, P.; Quackenbush, J.; et al. Minimum information about a microarray experiment (MIAME)—toward standards for microarray data. Nat Genet 2001, 29, 365–371. [Google Scholar] [CrossRef] [PubMed]
- Gene Expression Omnibus. https://www.ncbi.nlm.nih.gov/geo/.
- BRB-ArrayTools. https://brb.nci.nih.gov/BRB-ArrayTools/.
- Irizarry, R.A. Exploration, normalization, and summaries of high density oligonucleotide array probe level data. Biostatistics 2003, 4, 249–264. [Google Scholar] [CrossRef]
- Venny 2.1.0. https://bioinfogp.cnb.csic.es/tools/venny/index.html.
- Cluster 3.0. http://bonsai.hgc.jp/~mdehoon/software/cluster/.
- Java TreeView. https://jtreeview.sourceforge.net/.
- WebGestalt. https://www.webgestalt.org/.
- González-Amaro, R.; Cortés, J.R.; Sánchez-Madrid, F.; Martín, P. Is CD69 an effective brake to control inflammatory diseases? Trends Mol Med 2013, 19, 625–632. [Google Scholar] [CrossRef] [PubMed]
- Radulovic, K.; Niess, J.H. CD69 is the crucial regulator of intestinal inflammation: a new target molecule for IBD treatment? J Immunol Res 2015, 2015, 497056. [Google Scholar] [CrossRef]
- Gorabi, A.M.; Hajighasemi, S.; Kiaie, N.; et al. The pivotal role of CD69 in autoimmunity. J Autoimmun 2020, 111, 102453. [Google Scholar] [CrossRef] [PubMed]
- Patterson, R.M.; Germolec, D.R. Gene expression alterations in immune system pathways following exposure to immunosuppressive chemicals. Ann N Y Acad Sci 2006, 1076, 718–727. [Google Scholar] [CrossRef]
- Suomela, S.; Cao, L.; Bowcock, A.; Saarialho-Kere, U. Interferon alpha-inducible protein 27 (IFI27) is upregulated in psoriatic skin and certain epithelial cancers. J Invest Dermatol 2004, 122, 717–721. [Google Scholar] [CrossRef]
- Gao, J.; Zhu, X.; Wu, M.; Jiang, L.; Wang, F.; He, S. IFI27 may predict and evaluate the severity of respiratory syncytial virus infection in preterm infants. Hereditas 2021, 158, 3. [Google Scholar] [CrossRef] [PubMed]
- Rao, M.S.; Van Vleet, T.R.; Ciurlionis, R.; et al. Comparison of RNA-Seq and Microarray Gene Expression Platforms for the Toxicogenomic Evaluation of Liver From Short-Term Rat Toxicity Studies. Front Genet 2018, 9, 636. [Google Scholar] [CrossRef]
Figure 1.
The flowchart of the study. BS, Behçet syndrome; DOI, Digital Object Identifier; GEO, Gene Expression Omnibus; NCBI, National Center for Biotechnology Information; PB, group inclusive of all Portuguese BS patients; PC, Portuguese control group; PMB, Portuguese mucocutaneous BS group; POB, Portuguese ocular BS group; PVB, Portuguese vascular BS group; RMA, Robust Multiarray Average; TB, group inclusive of all Turkish BS patients; TC, Turkish control group; TDB, Turkish complex phenotype BS group; TMB, Turkish mucocutaneous BS group; TOB, Turkish ocular BS group; TVB, Turkish vascular BS group.
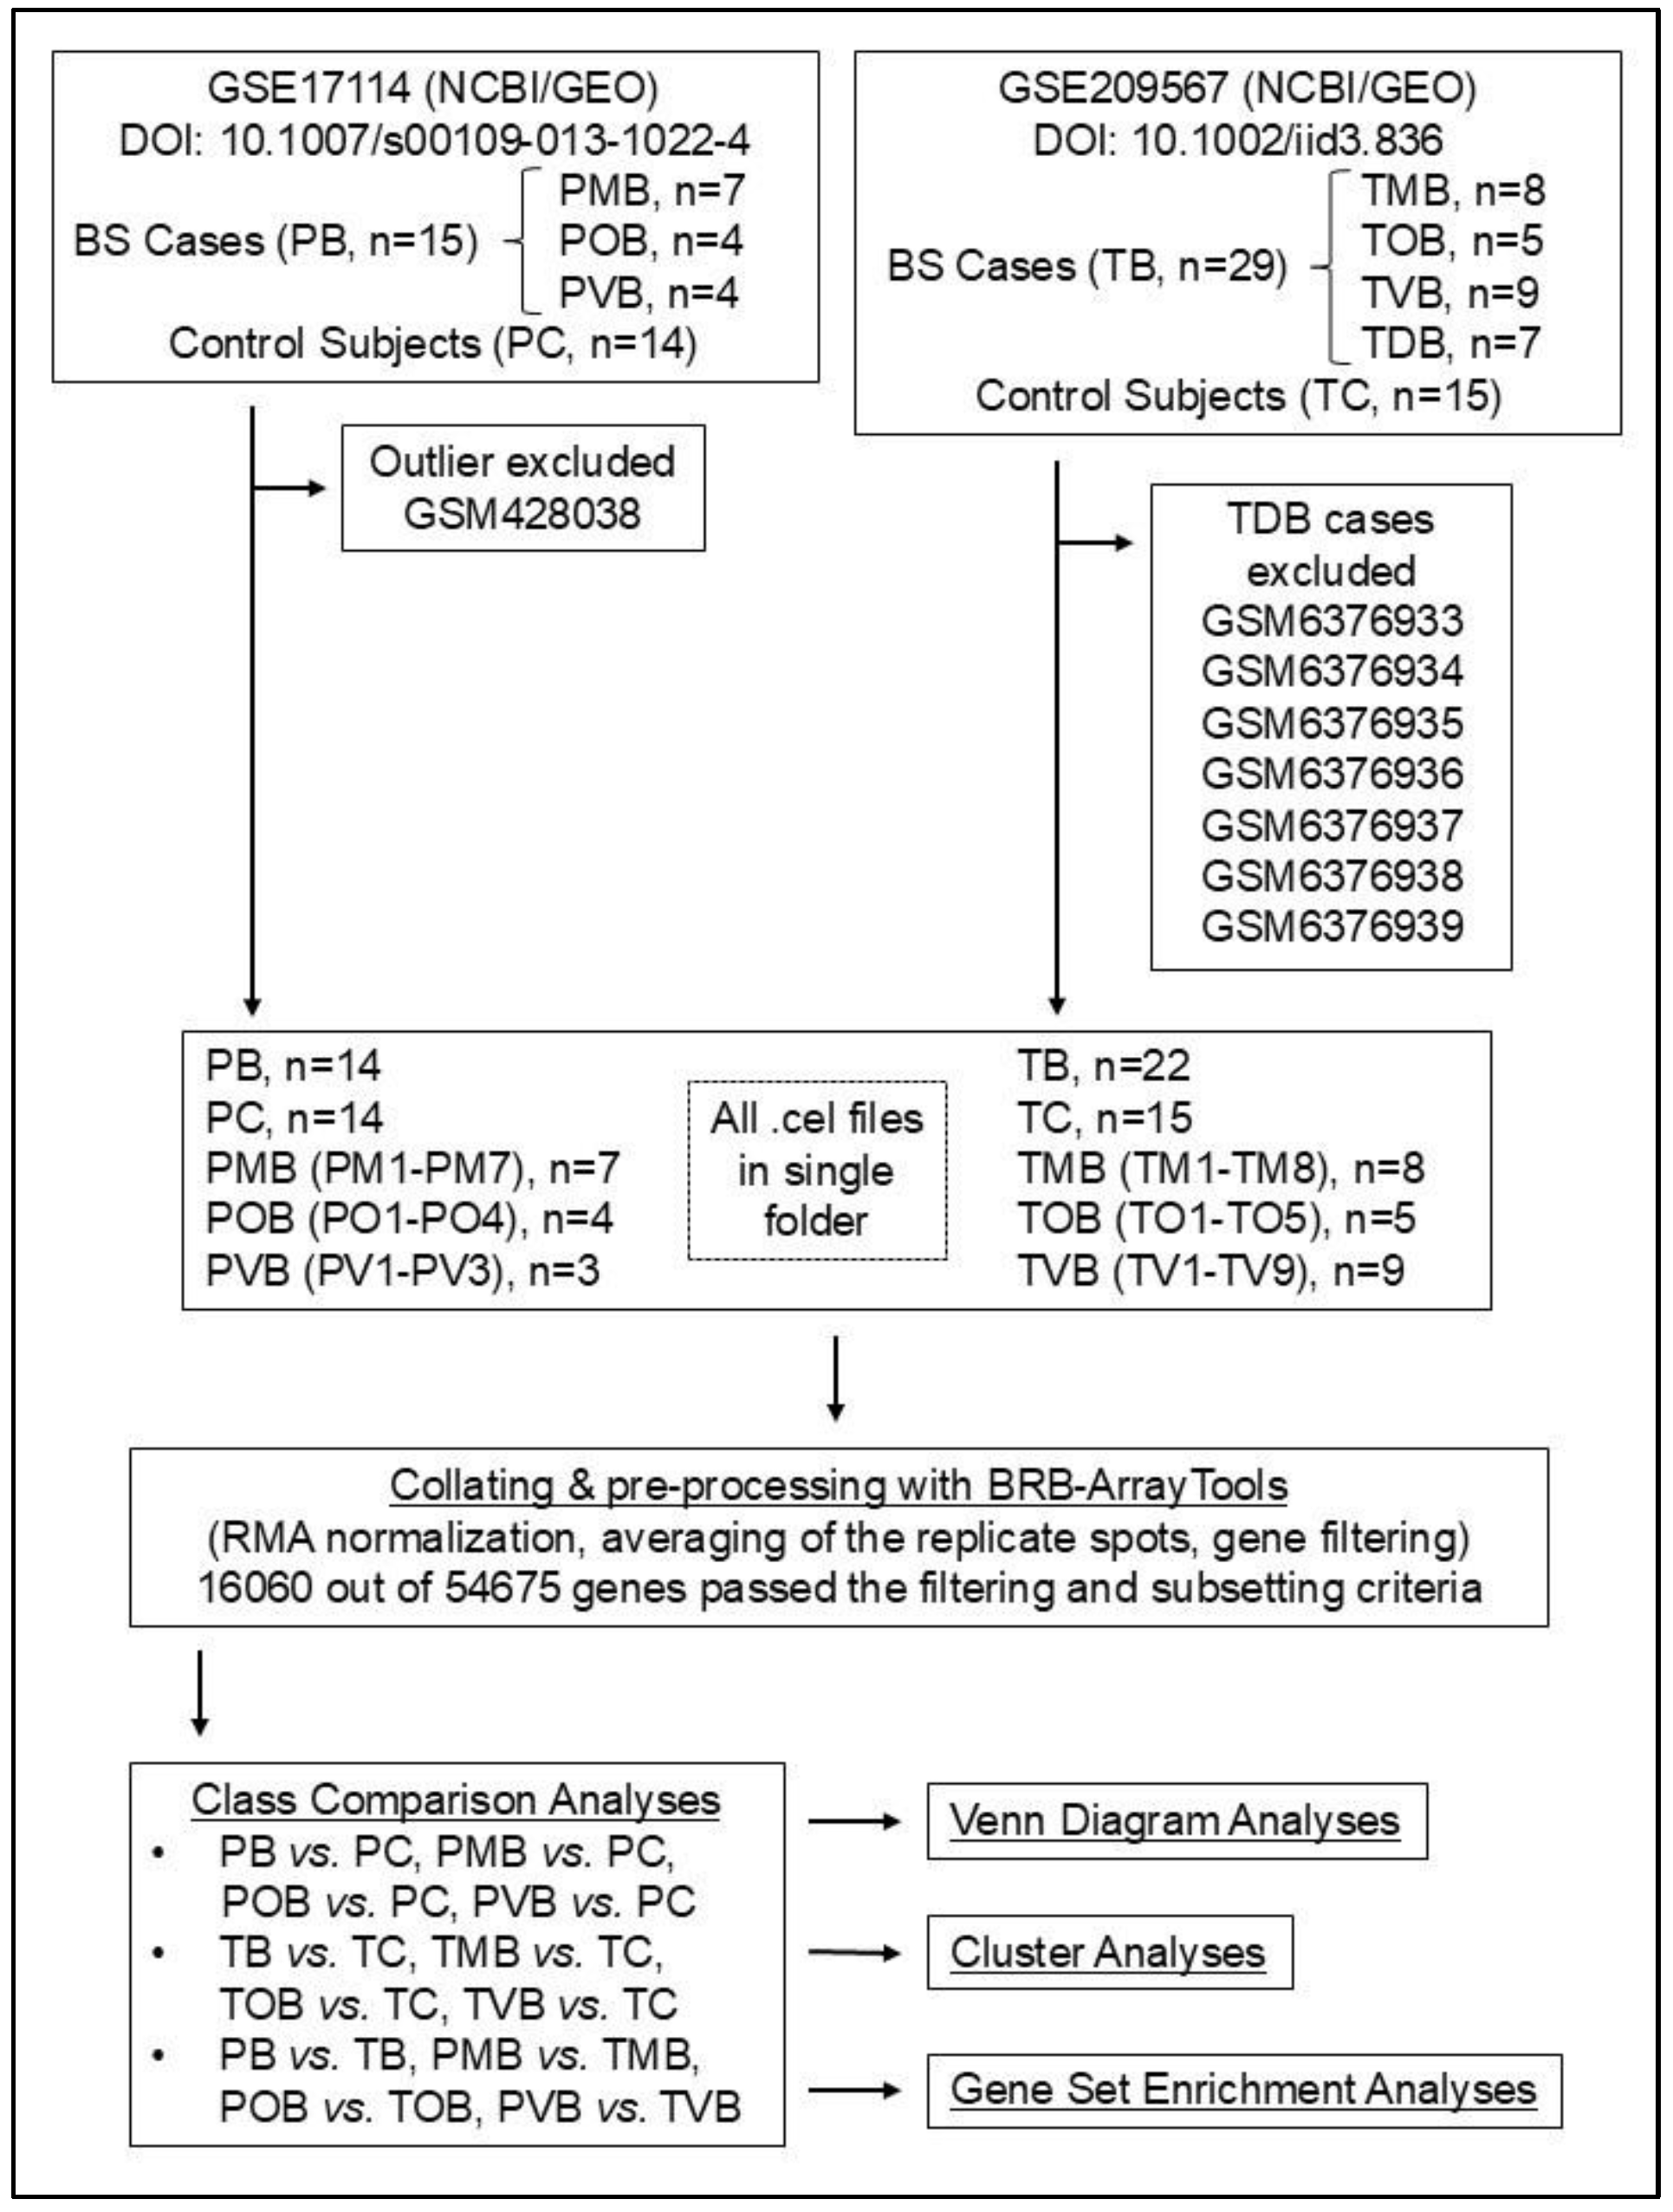
Figure 2.
The box-and-whisker plots of the gene expression data normalized using RMA. Samples/cases are along the horizontal axis while log2 intensity values for each gene are plotted on the vertical axis. The black line in the middle of each box plot is the median value for that sample.
Figure 2.
The box-and-whisker plots of the gene expression data normalized using RMA. Samples/cases are along the horizontal axis while log2 intensity values for each gene are plotted on the vertical axis. The black line in the middle of each box plot is the median value for that sample.
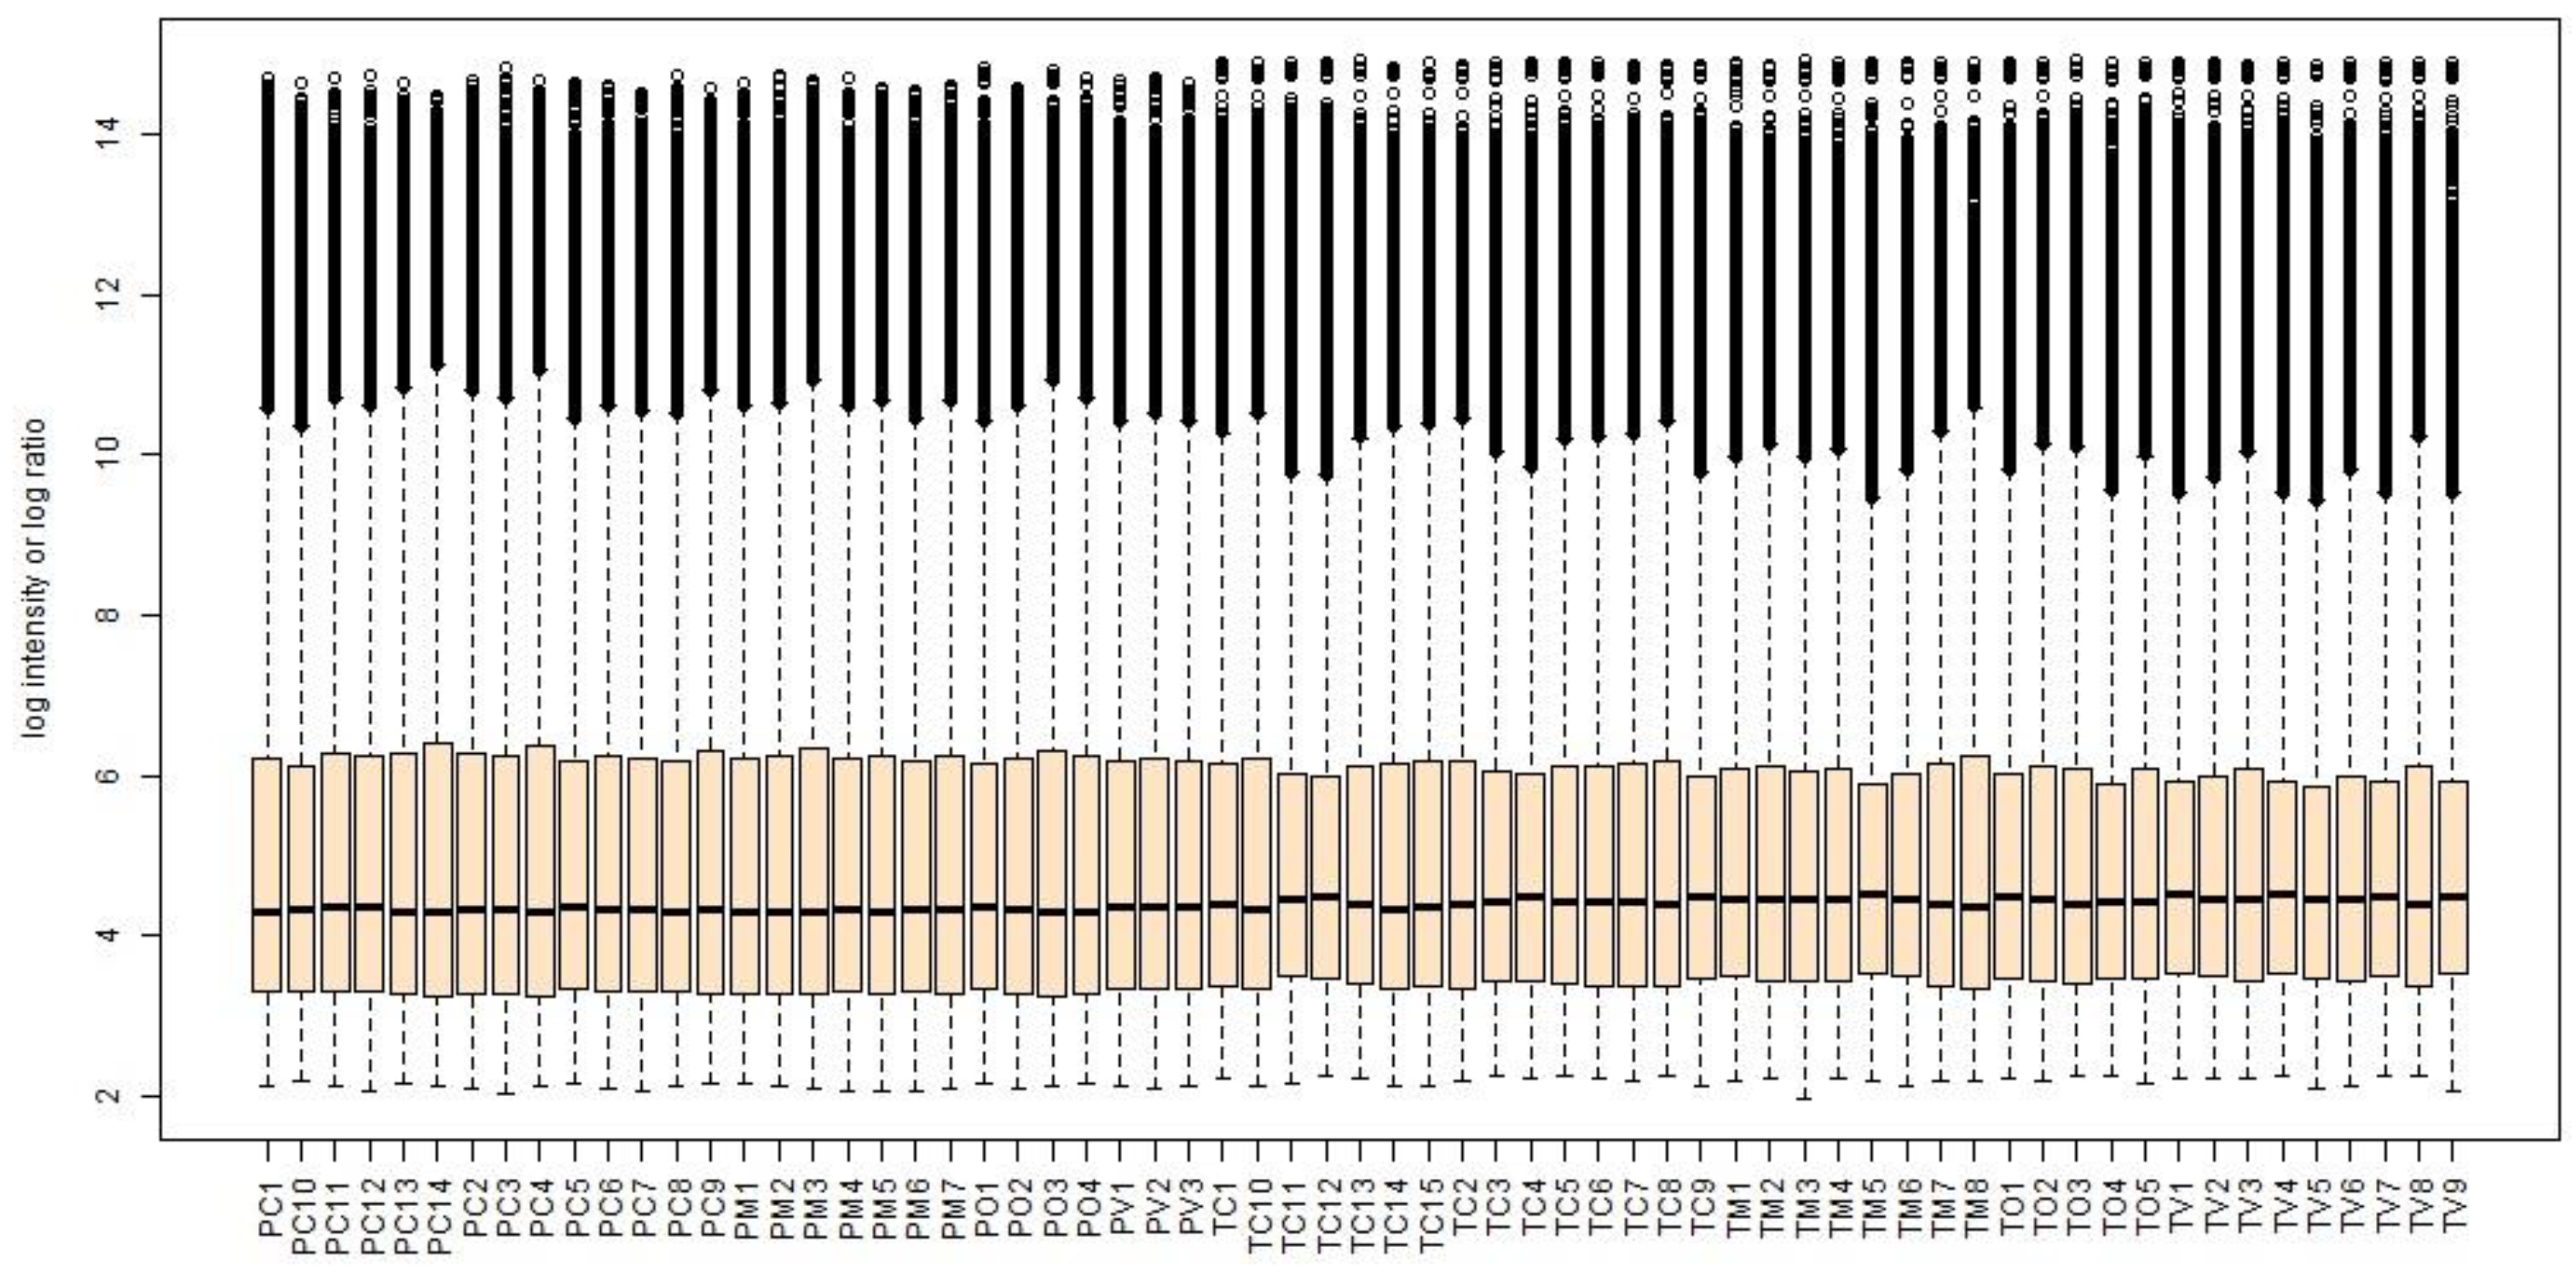
Figure 3.
The diagrams of the: (A) PB vs. PC ∩ TB vs. TC, (B) PMB vs. PC ∩ TMB vs. TC, (C) POB vs. PC ∩ TOB vs. TC, and (D) PVB vs. PC ∩ TVB vs. TC Venn diagram analyses (genes in POB vs. PC ∩ TOB vs. TC: CA1, DEFA4, and in PVB vs. PC ∩ TVB vs. TC: DCAF16, SLC16A7, IL18R1, EBLN3P, UBA2, PM20D2, HSPA13, SESN3, TMEM267, GFM1, SLC6A8, SLAIN1, PRSS23, TTC37, SNCA, SRSF10, GTF2H3, ETNK1, MEX3C, SHPRH, PYHIN1, TRIM13, MDFIC, IFT80, PRNP, UFL1, EIF1AX, ATF1, PHAX, ATP2B1, HBD, AHSP).
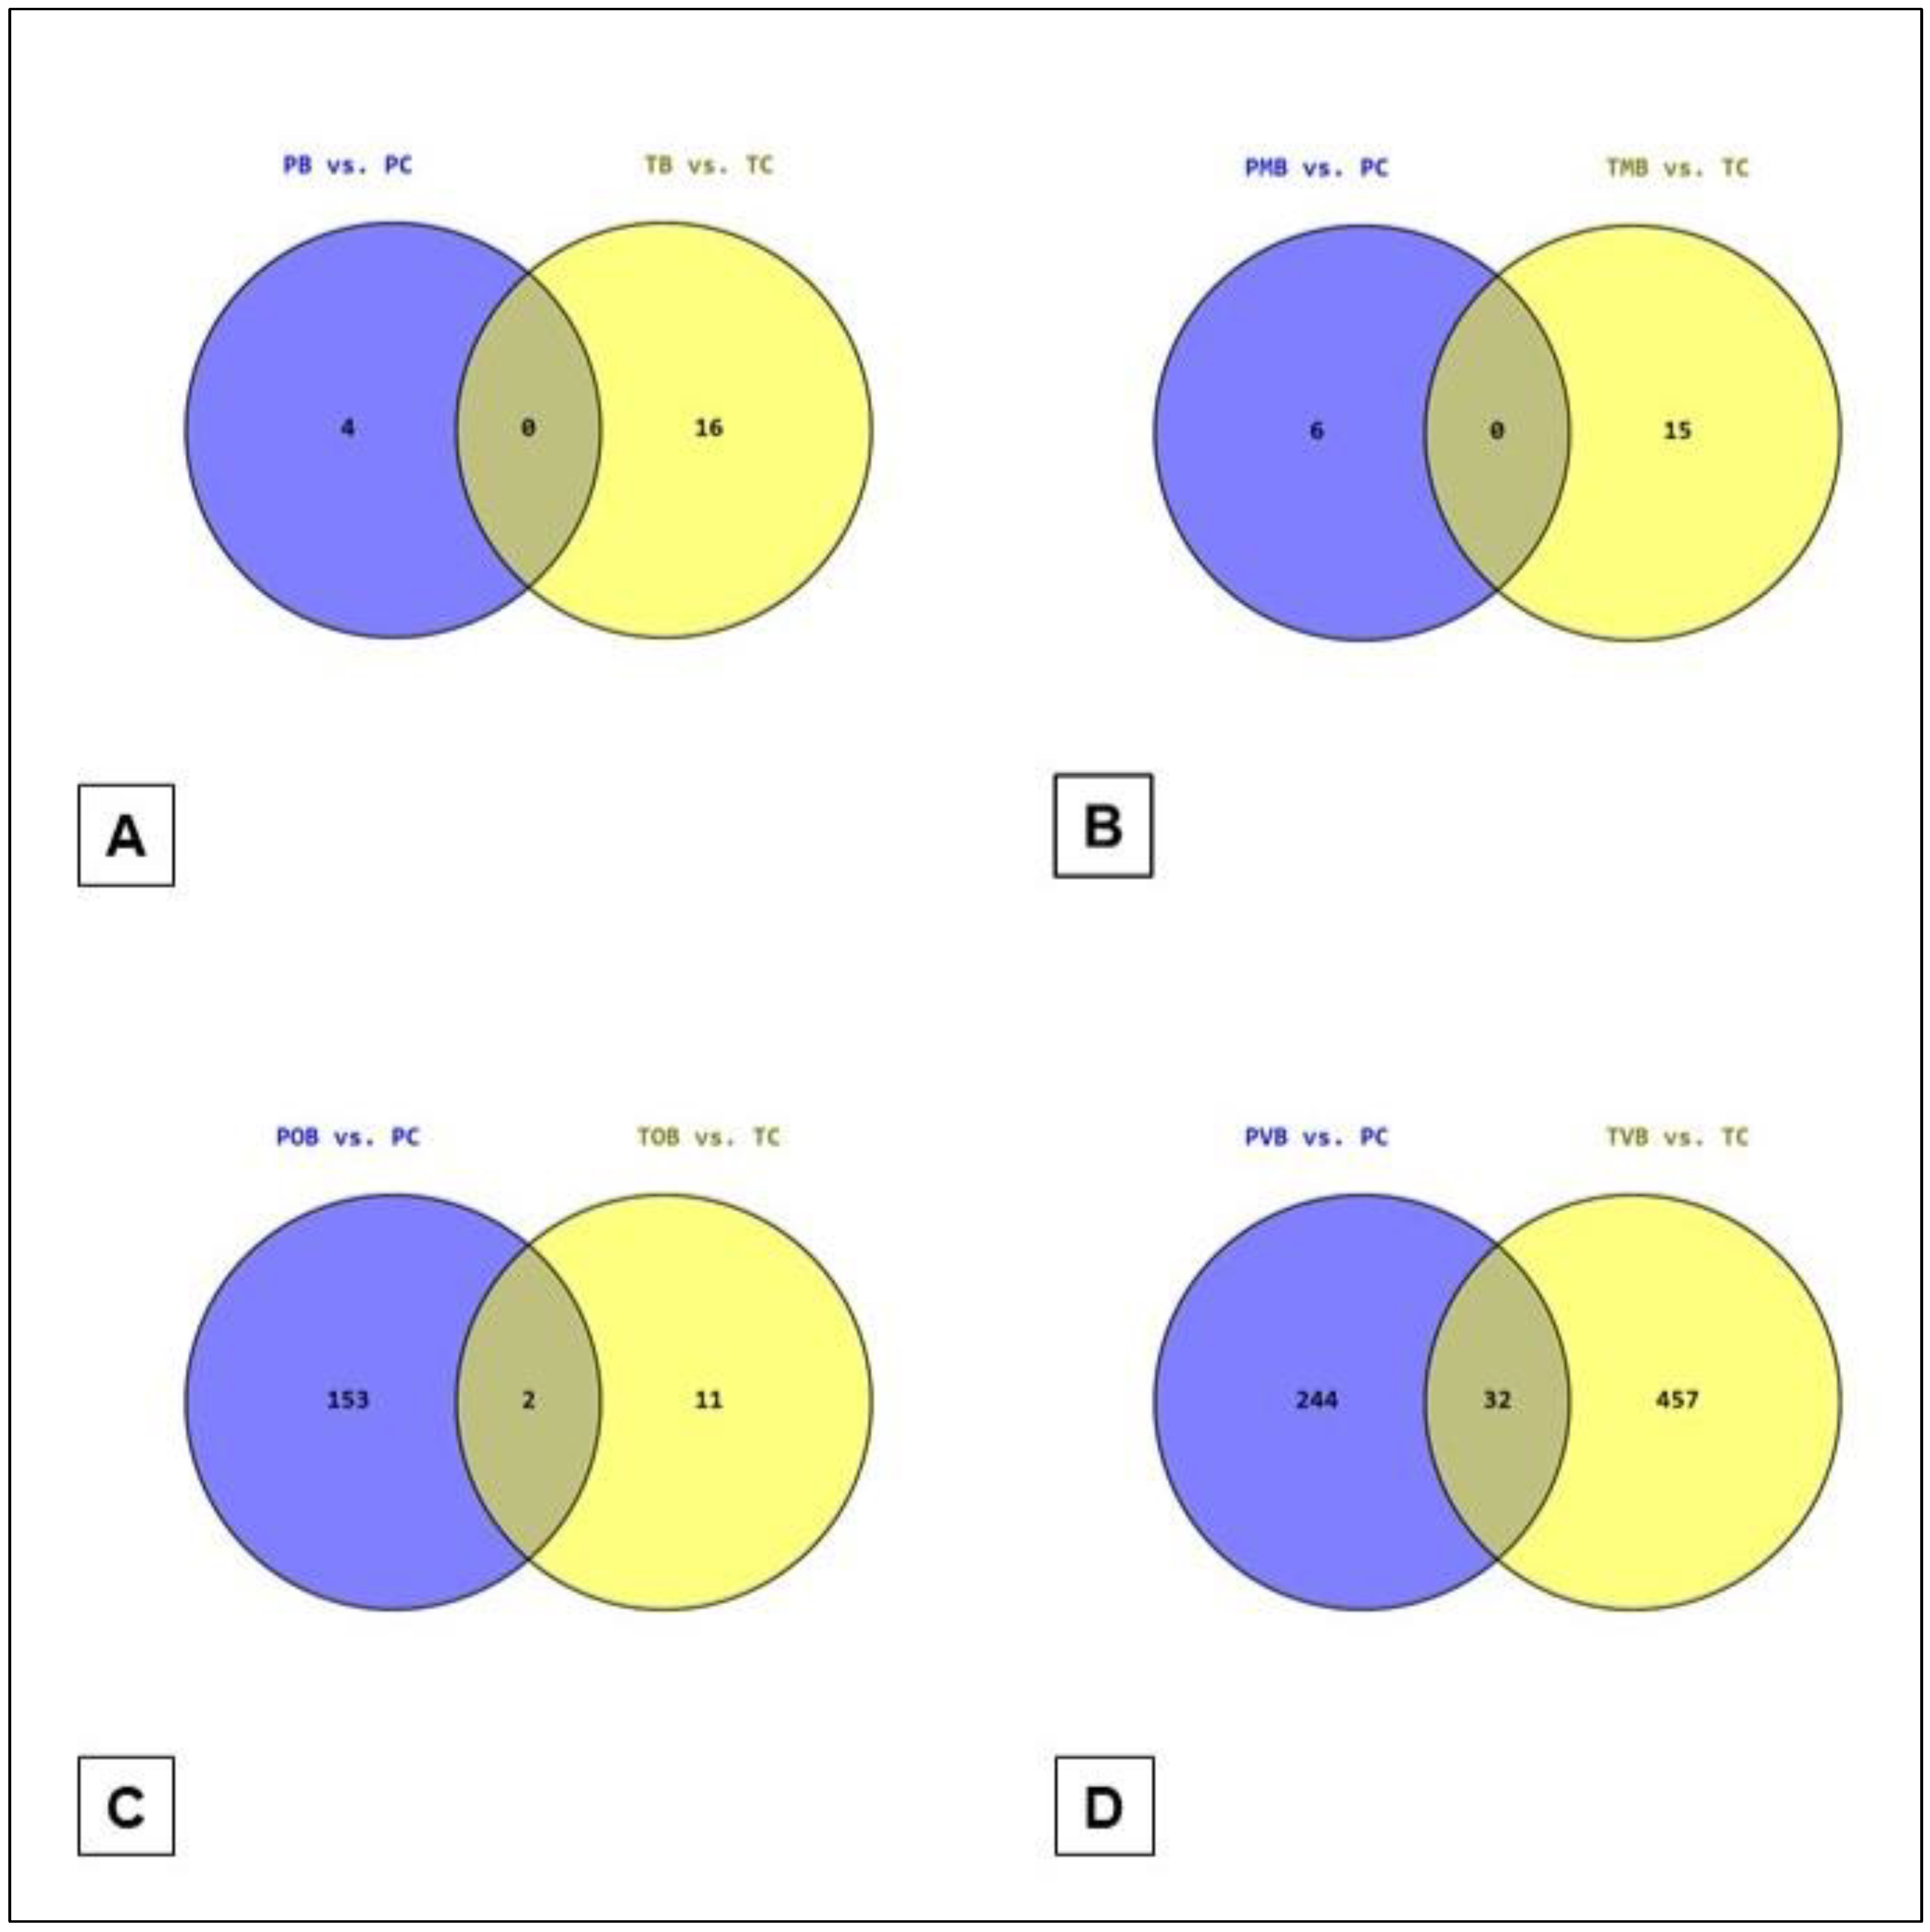
Figure 4.
The dendrogram and heatmap representations of the results of the cluster analyses: (A) PB & TB, (B) PMB & TMB, (C) POB & TOB, and (D) PVB & TVB. Both the patients (columns) and the genes (rows) are clustered and for ease of demonstration, only the dendrograms for clustering of the patients are shown on the heatmaps. The algorithm chosen and the gene sets implemented (Supplementary Material Table S6) successfully clustered Portuguese and Turkish BS patients.
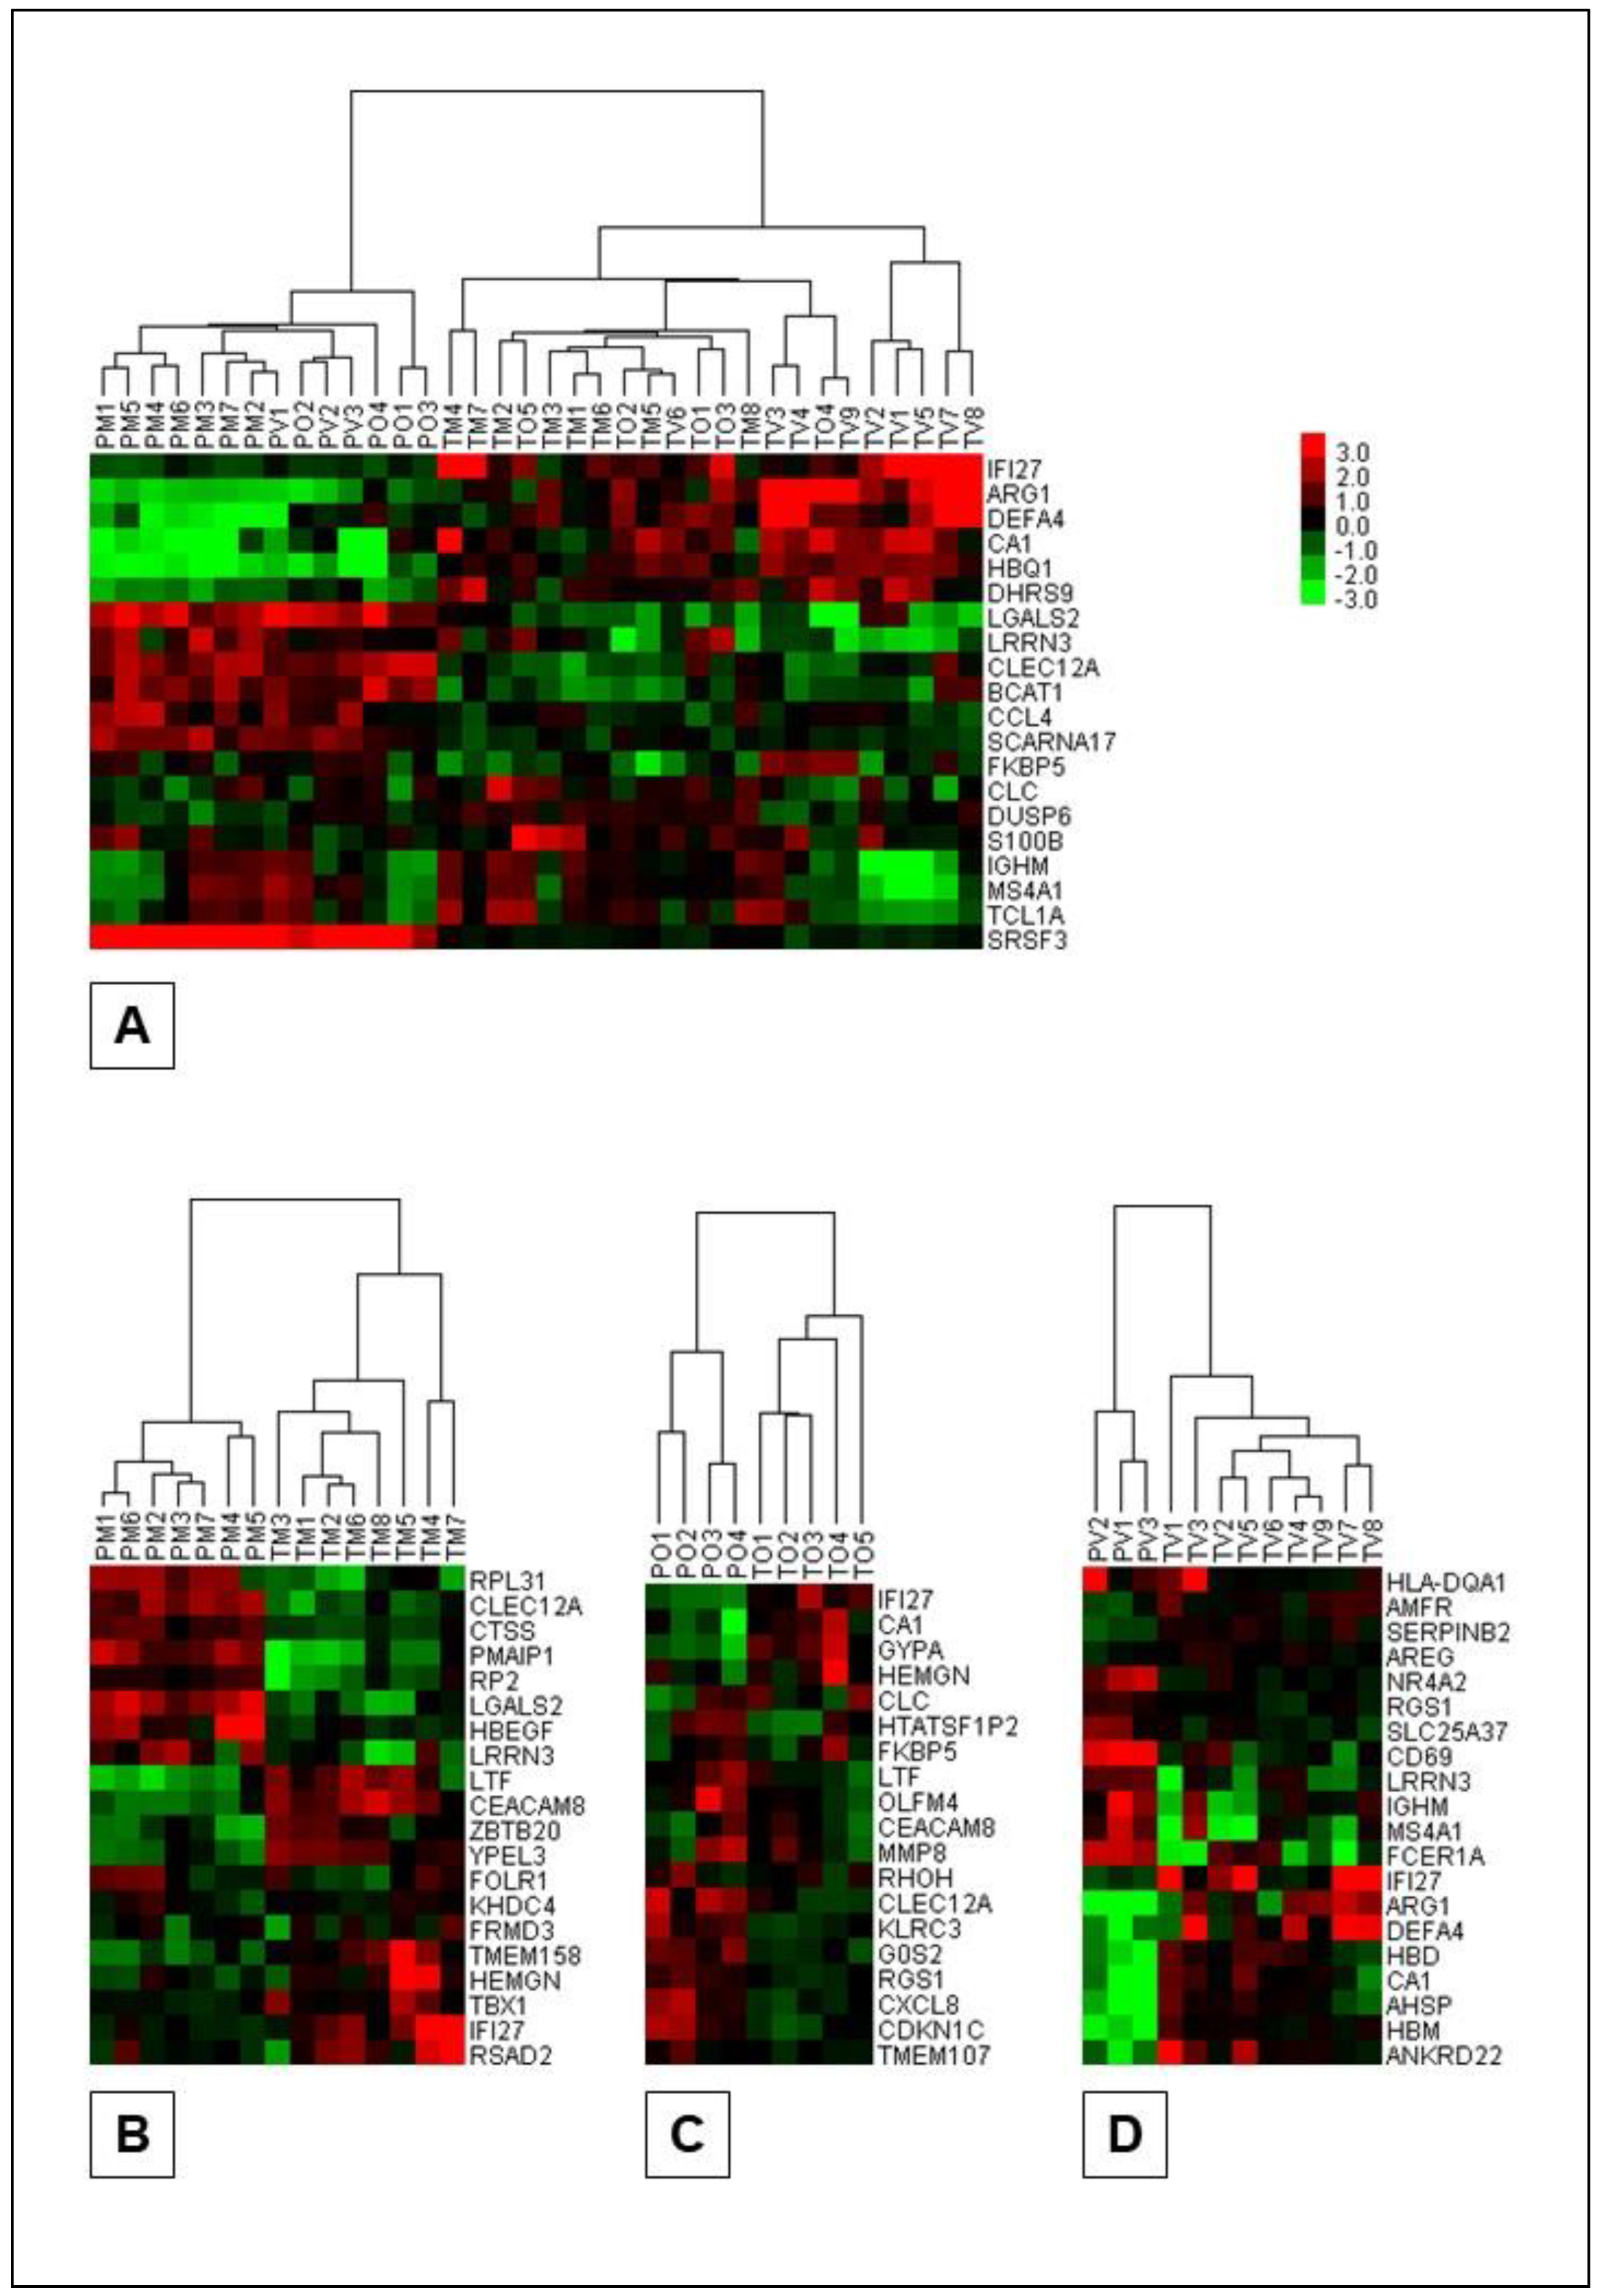
Figure 5.
Schematic presentation of the functional enrichment analyses of the individual Portuguese and Turkish class comparison DEG sets with increased expression levels. PB, group inclusive of all Portuguese Behçet syndrome patients; PC, Portuguese control group; PMB, Portuguese mucocutaneous Behçet syndrome group; POB, Portuguese ocular Behçet syndrome group; PVB, Portuguese vascular Behçet syndrome group; TB, group inclusive of all Turkish Behçet syndrome patients; TC, Turkish control group; TMB, Turkish mucocutaneous Behçet syndrome group; TOB, Turkish ocular Behçet syndrome group; TVB, Turkish vascular Behçet syndrome group.
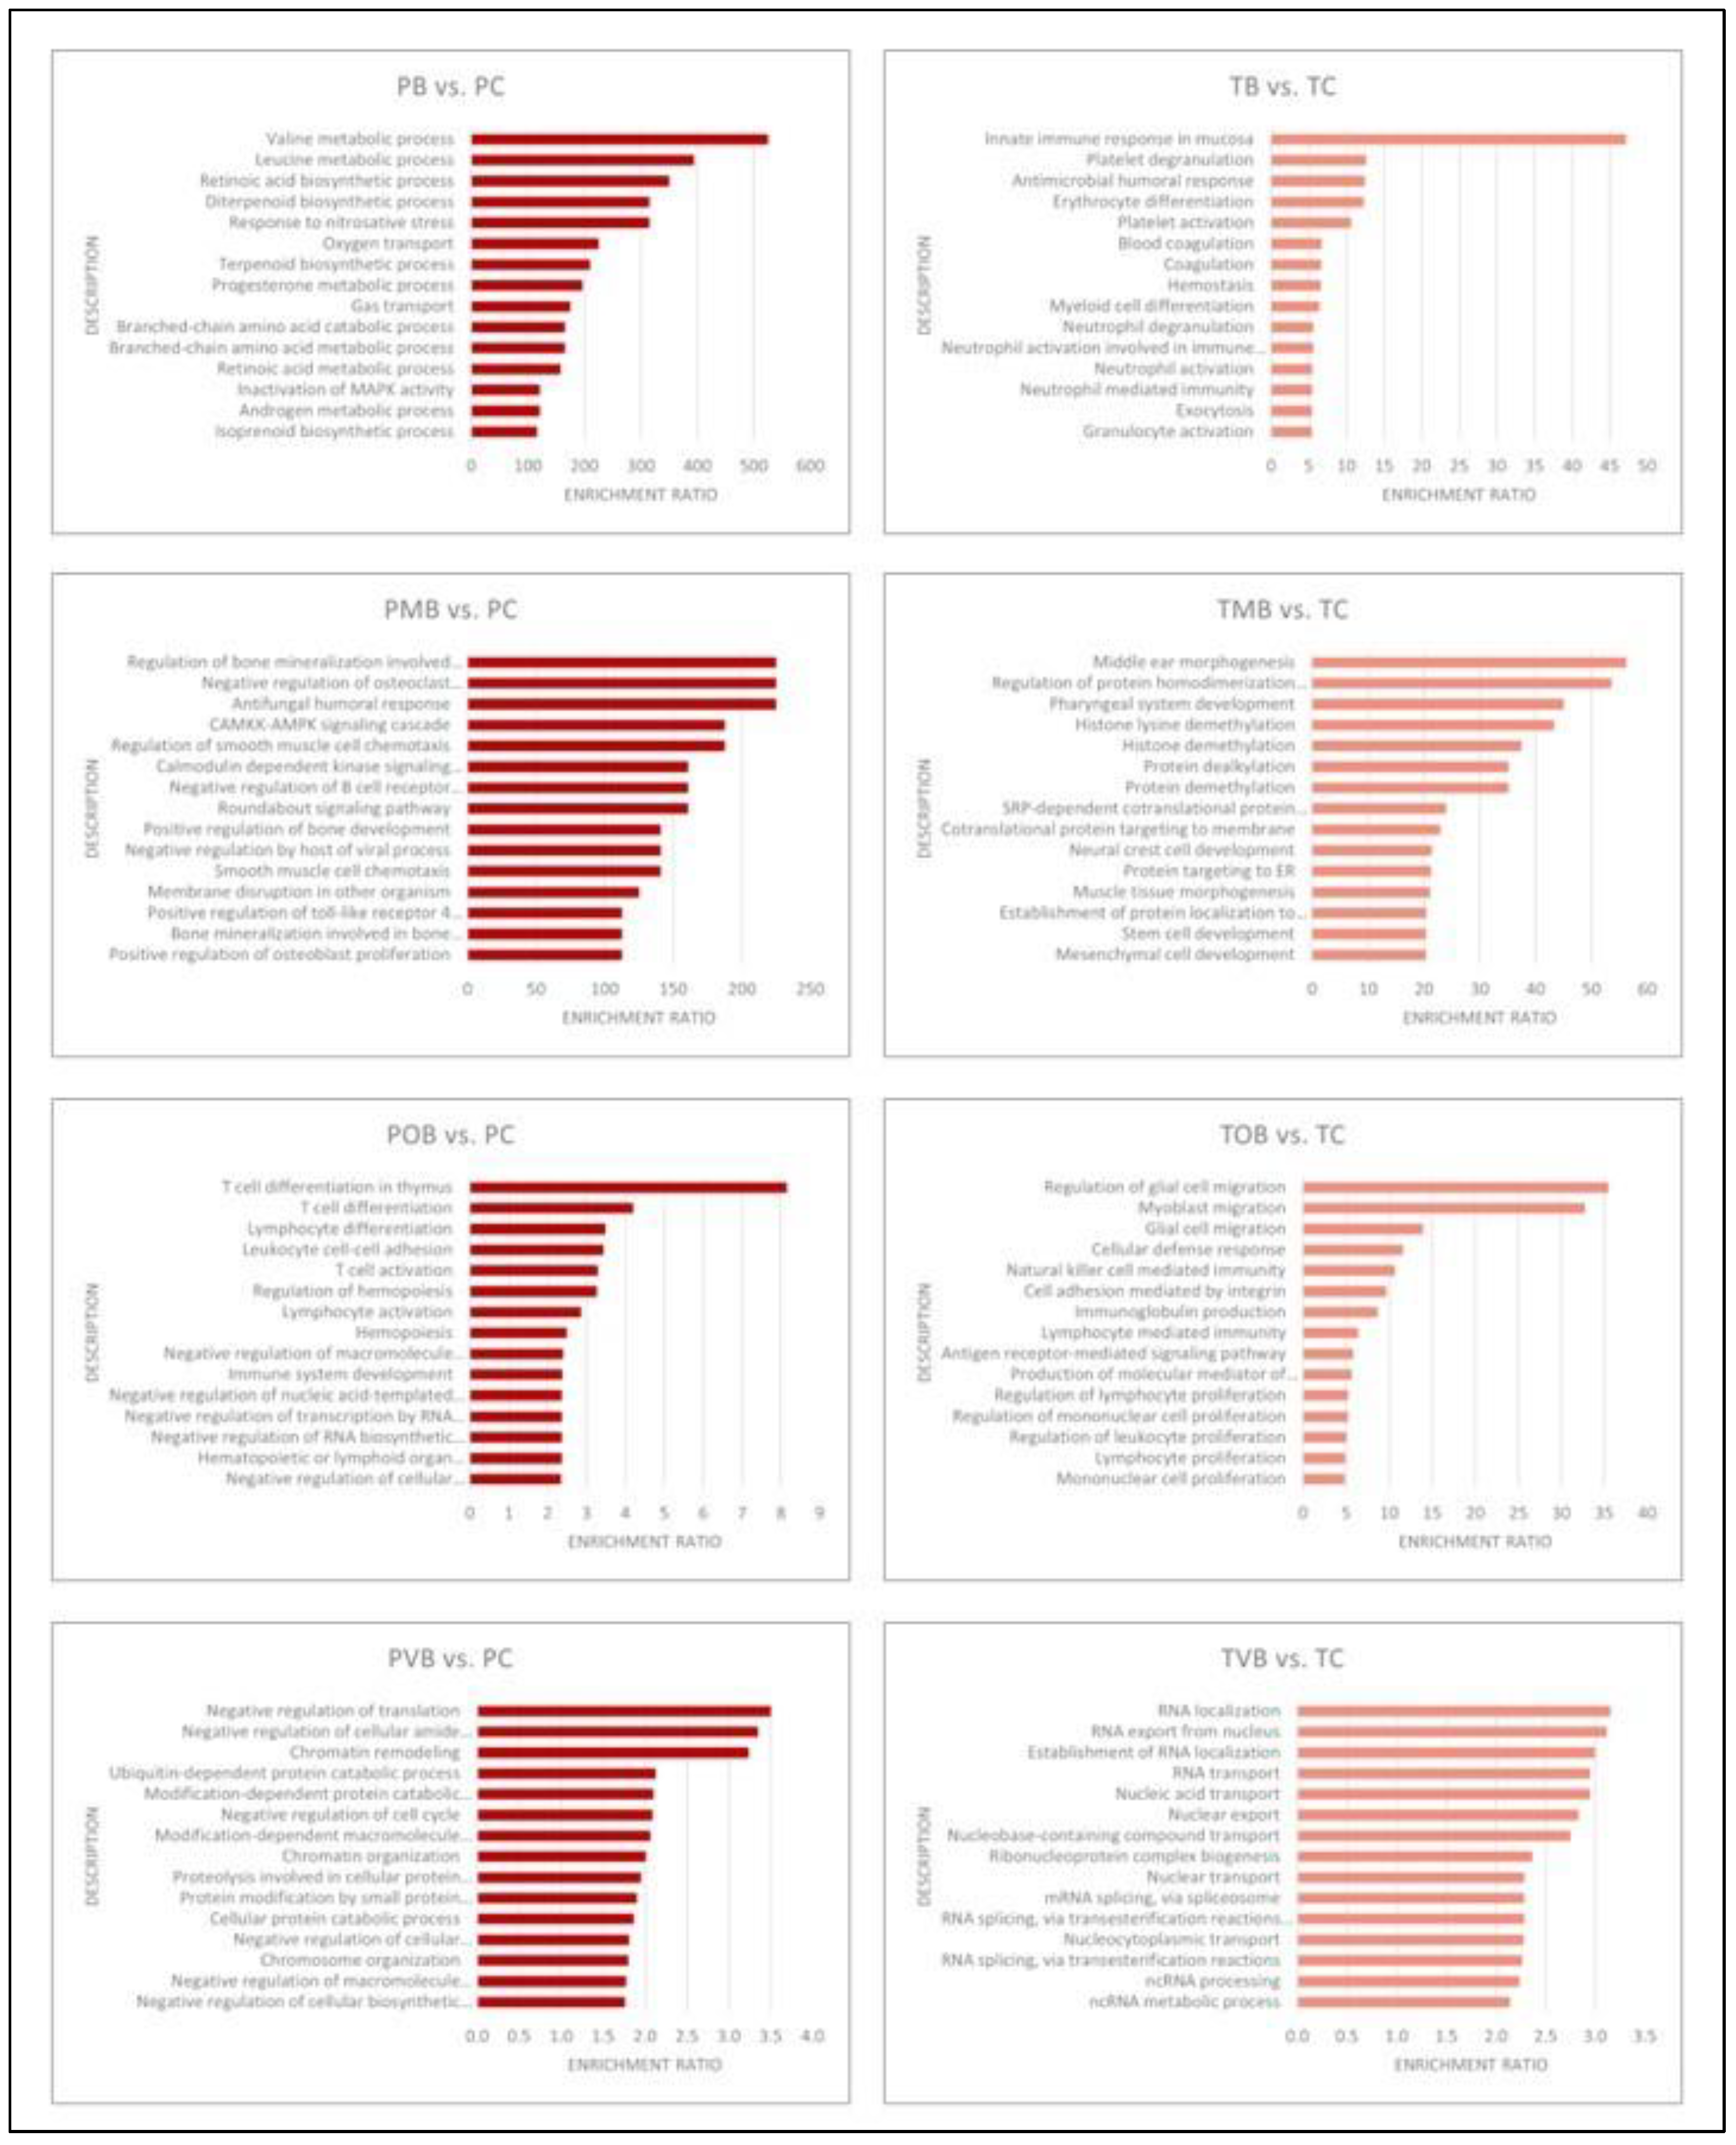
Figure 6.
Schematic presentation of the functional enrichment analyses of the individual Portuguese and Turkish class comparison DEG sets with decreased expression levels. PB, group inclusive of all Portuguese Behçet syndrome patients; PC, Portuguese control group; PMB, Portuguese mucocutaneous Behçet syndrome group; POB, Portuguese ocular Behçet syndrome group; PVB, Portuguese vascular Behçet syndrome group; TB, group inclusive of all Turkish Behçet syndrome patients; TC, Turkish control group; TMB, Turkish mucocutaneous Behçet syndrome group; TOB, Turkish ocular Behçet syndrome group; TVB, Turkish vascular Behçet syndrome group.
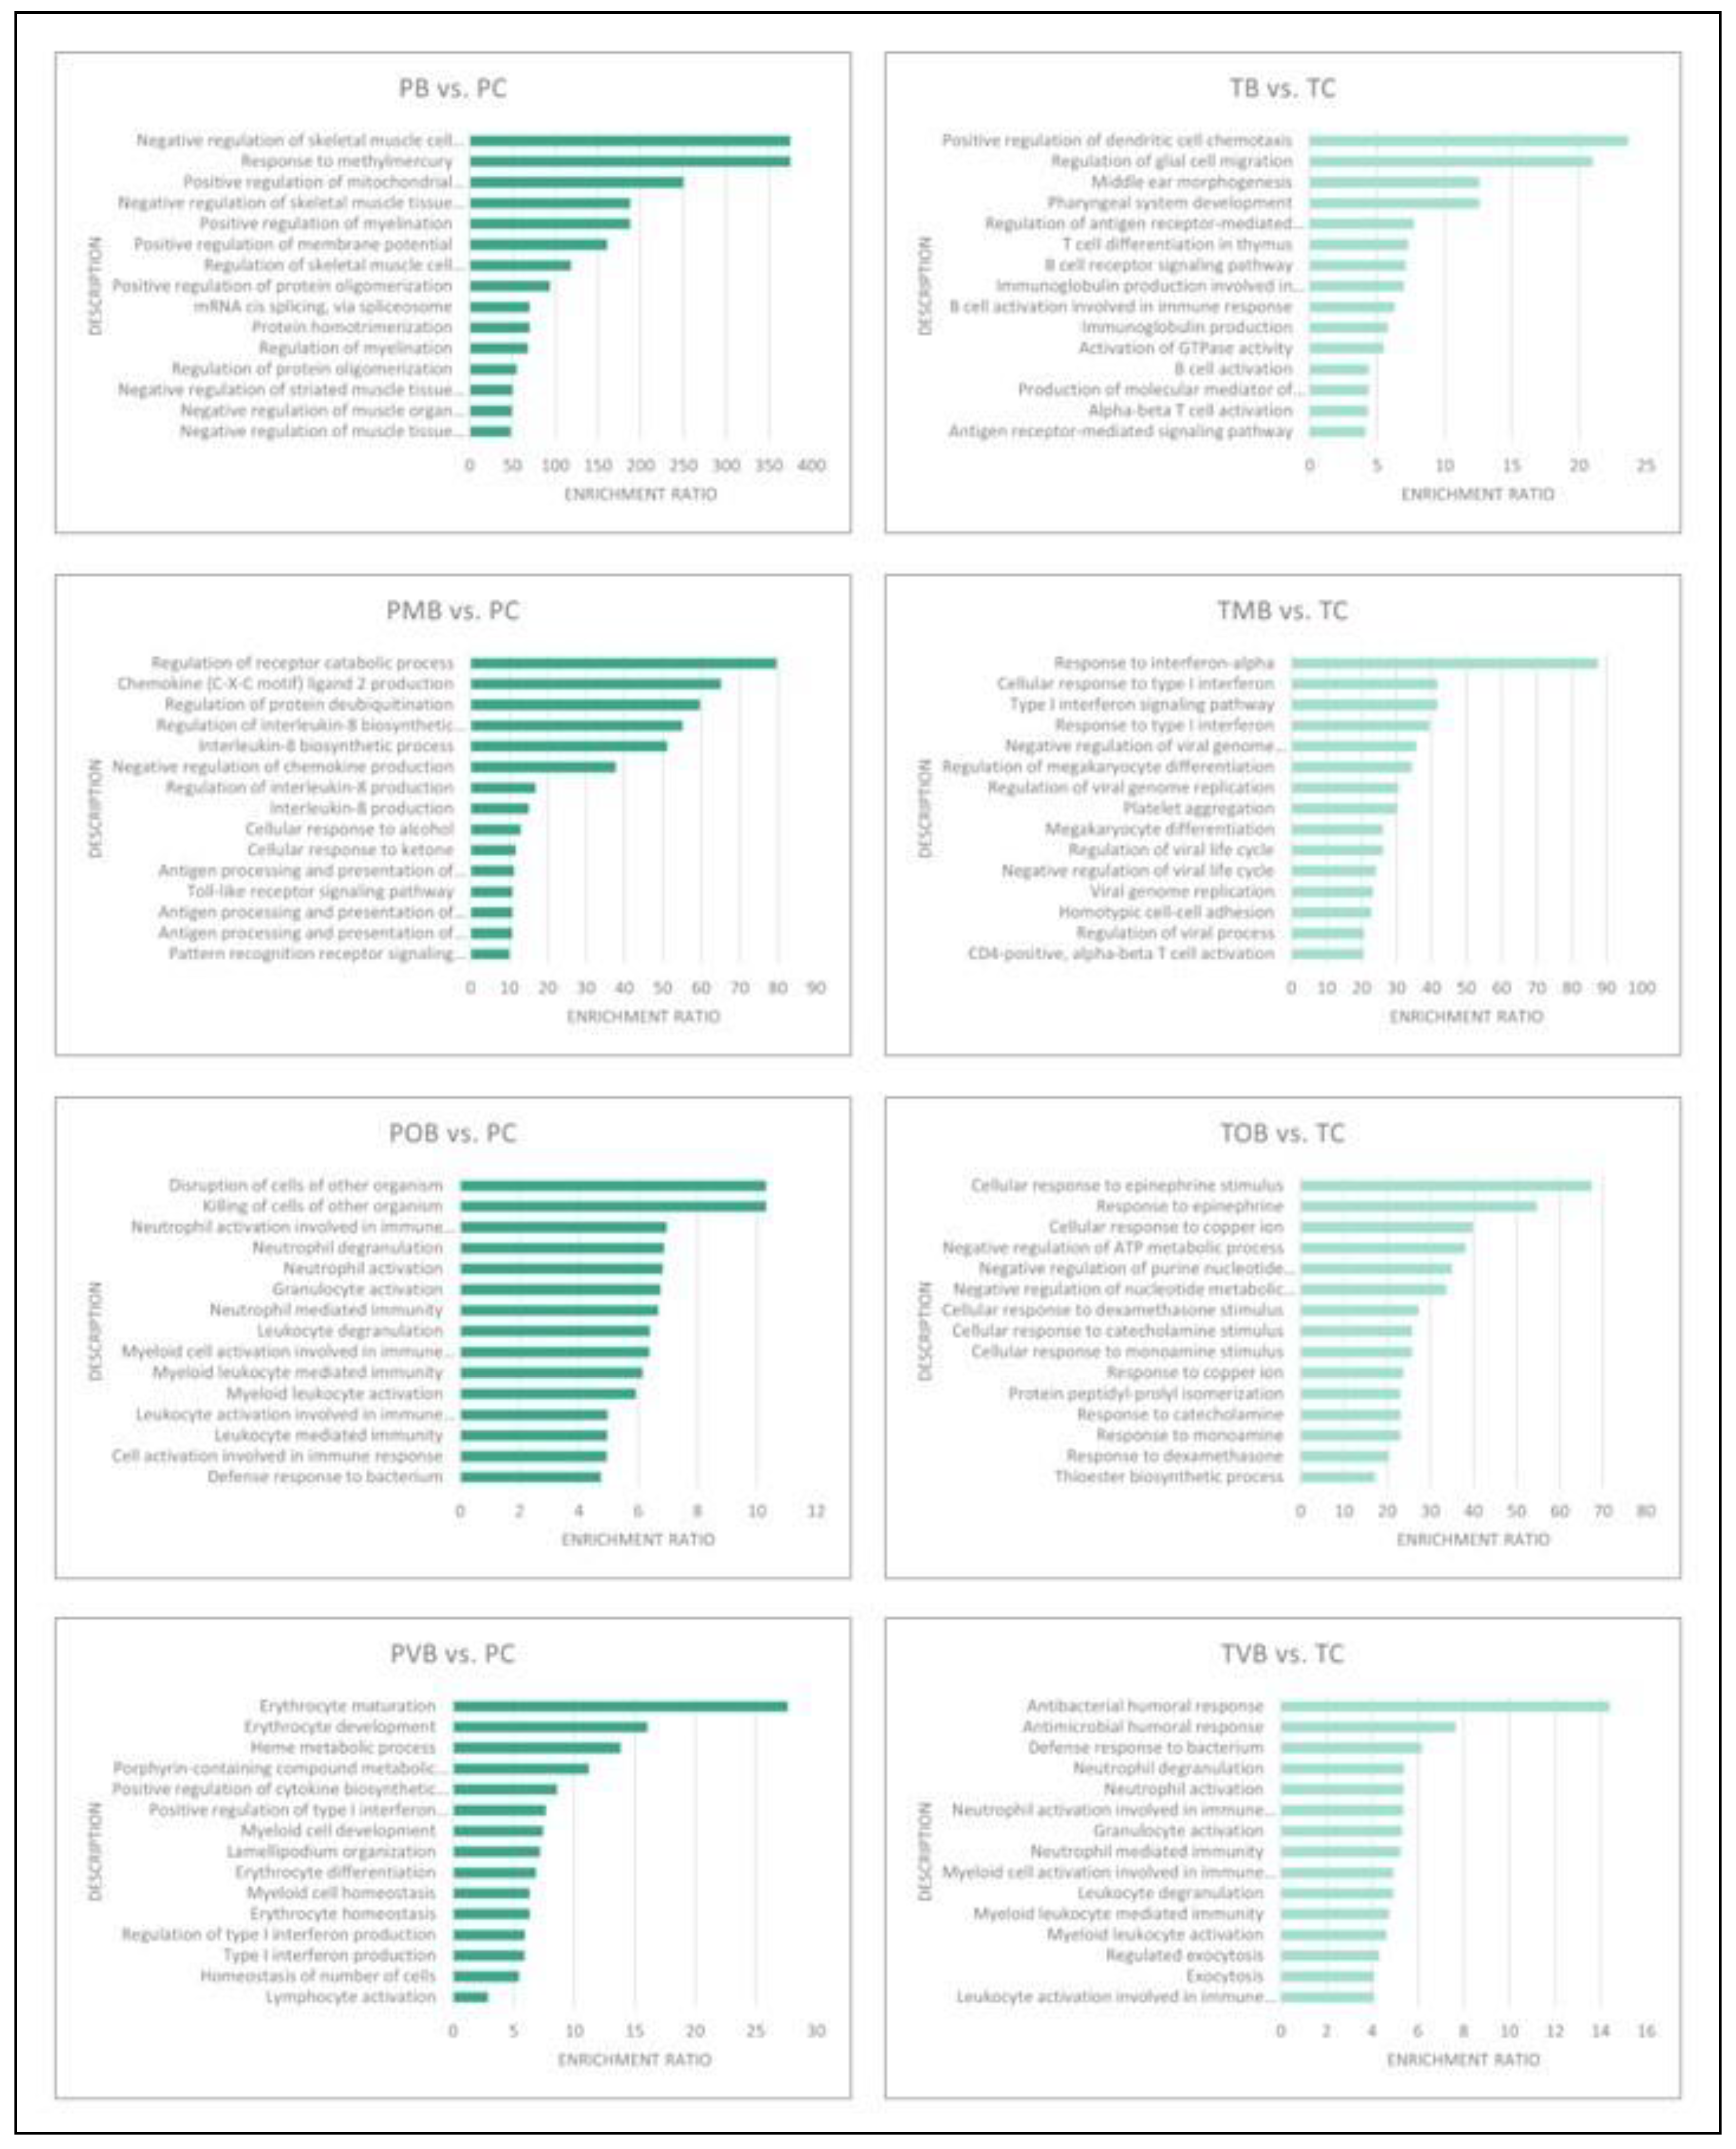

Table 1.
Clinical characteristics defining individual Behçet syndrome clinical phenotypes.
| Clinical Phenotype | Defining Clinical Characteristics |
|---|---|
| Mucocutaneous BS | Only oral ulcers with genital ulcers and/or skin lesions and/or pathergy test positivity (i.e., isolated mucocutaneous findings) are present. |
| Ocular BS | In addition to mucocutaneous findings, there is only ocular BS involvement, which may present with different ocular lesions. |
| Vascular BS | In addition to mucocutaneous findings, there is only vascular BS involvement without ocular involvement, which may present with different vascular lesions. |
| Other BS | In addition to mucocutaneous findings, there is ocular involvement and/or vascular involvement and/or musculoskeletal involvement and/or gastrointestinal system involvement and/or nervous system involvement. |
BS, Behçet syndrome.
Table 2.
Key demographics of the study population.
| Portuguese | Turkish | p | ||
|---|---|---|---|---|
| Behçet1 | Age2 | 32/20-57 | 34/18-58 | .939 |
| Gender3 | 7/7 | 12/10 | .790 | |
| Control | Age2 | 32/21-62 | 36/19-57 | .715 |
| Gender3 | 7/7 | 10/5 | .362 | |
| Mucocutaneous | Age2 | 29/20-55 | 44/25-57 | .315 |
| Gender3 | 2/5 | 1/7 | .438 | |
| Ocular | Age2 | 39/28-57 | 26/18-58 | 1.000 |
| Gender3 | 3/1 | 2/3 | .294 | |
| Vascular | Age2 | 46/30-50 | 33/27-56 | 1.000 |
| Gender3 | 2/1 | 9/- | .070 | |
1 The group inclusive of all Behçet syndrome patients. 2 Age at enrollment, in years, presented as median/min-max. 3 Gender presented as Male/Female ratio.
Table 3.
The number of the DEGs obtained during the country specific class comparison analyses.
| Classes Compared | Number of Differentially Expressed Genes | |||||
| Portuguese | Turkish | |||||
| Total | Increased1 | Decreased2 | Total | Increased1 | Decreased2 | |
| p≤0.05, FC≥1.5 | ||||||
| B vs. C | 29 | 15 | 14 | 450 | 85 | 365 |
| M vs. C | 101 | 79 | 22 | 92 | 41 | 51 |
| O vs. C | 1035 | 376 | 659 | 186 | 58 | 128 |
| V vs. C | 1407 | 313 | 1094 | 3603 | 508 | 3095 |
| p≤0.05, FC≥2.0 | ||||||
| B vs. C | 4 | 3 | 1 | 17 | 6 | 11 |
| M vs. C | 6 | 3 | 3 | 22 | 10 | 12 |
| O vs. C | 178 | 59 | 119 | 13 | 7 | 6 |
| V vs. C | 299 | 60 | 239 | 549 | 81 | 468 |
1 Increased expression in the first class (e.g., B) compared to the second class (e.g., C). 2 Decreased expression in the first class (e.g., B) compared to the second class (e.g., C). B, the group inclusive of all Behçet syndrome patients; C, the control group; FC, fold change; M, mucocutaneous Behçet syndrome group; O, ocular Behçet syndrome group; V, vascular Behçet syndrome group.
Table 4.
The number of the DEGs obtained during the class comparison analyses between the two (Portuguese and Turkish) study populations.
Table 4.
The number of the DEGs obtained during the class comparison analyses between the two (Portuguese and Turkish) study populations.
| Classes Compared | Number of Differentially Expressed Genes | |||||
| p≤0.05, FC≥1.5 | p≤0.05, FC≥2.0 | |||||
| Total | Increased1 | Decreased2 | Total | Increased1 | Decreased2 | |
| PC vs. TC | 12479 | 7726 | 4753 | 6549 | 3898 | 2651 |
| PB vs. TB | 13654 | 8756 | 4898 | 8024 | 5415 | 2609 |
| PMB vs. TMB | 12882 | 8136 | 4746 | 7601 | 4940 | 2661 |
| POB vs. TOB | 12435 | 7840 | 4595 | 7466 | 4814 | 2652 |
| PVB vs. TVB | 12539 | 8047 | 4492 | 8642 | 5827 | 2815 |
1 Increased expression in the first class (e.g., PC) compared to the second class (e.g., TC). 2 Decreased expression in the first class (e.g., PC) compared to the second class (e.g., TC). FC, fold change; PB, group inclusive of all Portuguese Behçet syndrome patients; PC, Portuguese control group; PMB, Portuguese mucocutaneous Behçet syndrome group; POB, Portuguese ocular Behçet syndrome group; PVB, Portuguese vascular Behçet syndrome group; TB, group inclusive of all Turkish Behçet syndrome patients; TC, Turkish control group; TMB, Turkish mucocutaneous Behçet syndrome group; TOB, Turkish ocular Behçet syndrome group; TVB, Turkish vascular Behçet syndrome group.
Table 5.
The top 10 most differentially expressed genes observed during the population specific class comparison analyses.1, 2, 3.
Table 5.
The top 10 most differentially expressed genes observed during the population specific class comparison analyses.1, 2, 3.
| Portuguese | Turkish | ||||||
| Gene Symbol | FC | p | Gene Symbol | FC | p | ||
| B vs. C | |||||||
| 1 | LGALS2 | 1.992 | 0.002764 | 1 | IFI27 | 3.433 | 0.001199 |
| 2 | HBQ1 | 1.647 | 0.020998 | 2 | ARG1 | 2.408 | 0.005611 |
| 3 | DUSP6 | 1.617 | 0.008132 | 3 | CA1 | 2.366 | 0.003222 |
| 4 | DHRS9 | 1.562 | 0.015752 | 4 | DEFA4 | 2.169 | 0.013169 |
| 5 | BCAT1 | 1.554 | 0.009325 | 5 | FKBP5 | 2.080 | 0.000919 |
| 6 | SCARNA17 | -1.573 | 0.023432 | 6 | IGHM | -2.223 | 0.006240 |
| 7 | SRSF3 | -1.610 | 0.028504 | 7 | CLC | -2.467 | 0.000130 |
| 8 | TCL1A | -1.764 | 0.020299 | 8 | LRRN3 | -2.473 | 0.004112 |
| 9 | CCL4 | -1.851 | 0.037743 | 9 | CLEC12A | -2.544 | 1.88e-05 |
| 10 | S100B | -1.912 | 0.010533 | 10 | MS4A1 | -2.573 | 0.002132 |
| M vs. C | |||||||
| 1 | PMAIP1 | 2.094 | 0.017740 | 1 | IFI27 | 3.180 | 0.014886 |
| 2 | HBEGF | 1.978 | 0.045537 | 2 | RSAD2 | 2.586 | 0.046990 |
| 3 | CTSS | 1.957 | 0.028778 | 3 | TMEM158 | 2.437 | 0.006344 |
| 4 | LGALS2 | 1.954 | 0.015461 | 4 | FRMD3 | 1.957 | 0.001215 |
| 5 | RP2 | 1.885 | 0.028528 | 5 | HEMGN | 1.939 | 0.029605 |
| 6 | KHDC4 | -1.618 | 0.022498 | 6 | RPL31 | -1.767 | 0.007869 |
| 7 | YPEL3 | -1.624 | 0.019027 | 7 | TBX1 | -1.770 | 0.002394 |
| 8 | ZBTB20 | -1.689 | 0.027927 | 8 | FOLR1 | -1.849 | 0.000802 |
| 9 | CEACAM8 | -2.110 | 0.030067 | 9 | LRRN3 | -1.919 | 0.020264 |
| 10 | LTF | -2.403 | 0.026766 | 10 | CLEC12A | -2.917 | 0.000339 |
| O vs. C | |||||||
| 1 | LTF | 6.248 | 0.000890 | 1 | FKBP5 | 2.541 | 9.44e-05 |
| 2 | CEACAM8 | 4.601 | 0.002517 | 2 | IFI27 | 2.530 | 6.90e-05 |
| 3 | MMP8 | 4.282 | 0.000217 | 3 | CA1 | 2.396 | 0.037106 |
| 4 | OLFM4 | 4.191 | 0.000123 | 4 | HEMGN | 2.391 | 0.006561 |
| 5 | CA1 | 3.813 | 0.010158 | 5 | GYPA | 2.147 | 0.021081 |
| 6 | RHOH | -3.299 | 0.000195 | 6 | KLRC3 | -1.979 | 0.011210 |
| 7 | G0S2 | -3.576 | 0.015248 | 7 | CDKN1C | -2.019 | 0.000490 |
| 8 | RGS1 | -4.346 | 0.019787 | 8 | HTATSF1P2 | -2.110 | 0.042364 |
| 9 | TMEM107 | -5.634 | 0.002141 | 9 | CLC | -2.484 | 0.004392 |
| 10 | CXCL8 | -7.431 | 0.028743 | 10 | CLEC12A | -2.550 | 0.007083 |
| V vs. C | |||||||
| 1 | HBD | 3.515 | 0.036049 | 1 | ARG1 | 5.825 | 1.20e-06 |
| 2 | AMFR | 3.409 | 0.019229 | 2 | DEFA4 | 4.453 | 0.000350 |
| 3 | HBM | 3.357 | 0.020985 | 3 | IFI27 | 4.353 | 0.000137 |
| 4 | SLC25A37 | 3.008 | 0.016352 | 4 | ANKRD22 | 3.402 | 0.000538 |
| 5 | AHSP | 2.972 | 0.045883 | 5 | CA1 | 3.364 | 0.000554 |
| 6 | SERPINB2 | -3.869 | 0.026684 | 6 | LRRN3 | -4.004 | 8.90e-06 |
| 7 | CD69 | -4.088 | 0.001281 | 7 | FCER1A | -4.234 | 0.000431 |
| 8 | AREG | -5.157 | 0.038336 | 8 | HLA-DQA1 | -4.528 | 0.005208 |
| 9 | RGS1 | -5.895 | 0.014062 | 9 | IGHM | -4.750 | 3.59e-05 |
| 10 | NR4A2 | -6.351 | 0.012487 | 10 | MS4A1 | -5.483 | 1.56e-05 |
1 The table displays the top 5 genes with increased and the top 5 genes with decreased expressions for each class comparison. 2 The gene lists exclude gonosomal genes occurring as a result of Male/Female ratio disparities between the compared classes. 3 Increased and decreased expression of genes are always in the patient group with respect to control group. B, the group inclusive of all Behçet syndrome patients; C, the control group; FC, fold change; M, mucocutaneous Behçet syndrome group; O, ocular Behçet syndrome group; V, vascular Behçet syndrome group.
Table 6.
The top 10 most differentially expressed genes observed during the class comparison analyses between the two (Portuguese and Turkish) study populations.1.
Table 6.
The top 10 most differentially expressed genes observed during the class comparison analyses between the two (Portuguese and Turkish) study populations.1.
| Increased2 | Decreased3 | ||||||
| Gene Symbol | FC | p | Gene Symbol | FC | p | ||
| PB vs. TB | |||||||
| 1 | EGR1 | 60.465 | <1e-07 | 1 | KRT23 | -26.933 | <1e-07 |
| 2 | ANP32E | 58.879 | <1e-07 | 2 | CXCR2 | -27.348 | <1e-07 |
| 3 | PFDN4 | 27.579 | <1e-07 | 3 | MMP9 | -28.789 | <1e-07 |
| 4 | CD69 | 24.972 | <1e-07 | 4 | CMTM2 | -28.891 | <1e-07 |
| 5 | EIF1 | 23.771 | <1e-07 | 5 | CREB5 | -29.943 | <1e-07 |
| 6 | TOB1 | 22.885 | <1e-07 | 6 | KCNJ2 | -30.468 | <1e-07 |
| 7 | RSL24D1 | 20.719 | <1e-07 | 7 | TNFAIP6 | -32.131 | <1e-07 |
| 8 | CXCL8 | 20.430 | <1e-07 | 8 | TNFRSF10C | -32.371 | <1e-07 |
| 9 | PGGT1B | 17.339 | <1e-07 | 9 | CHI3L1 | -37.464 | <1e-07 |
| 10 | MTPAP | 17.304 | <1e-07 | 10 | CYP4F3 | -68.138 | <1e-07 |
| PMB vs. TMB | |||||||
| 1 | EGR1 | 94.318 | <1e-07 | 1 | KCNJ15 | -27.853 | <1e-07 |
| 2 | ANP32E | 62.871 | <1e-07 | 2 | CXCR2 | -28.159 | <1e-07 |
| 3 | RGS1 | 42.910 | <1e-07 | 3 | S100P | -28.366 | <1e-07 |
| 4 | CXCL8 | 38.483 | 0.000013 | 4 | HBM | -28.711 | <1e-07 |
| 5 | CD69 | 36.208 | <1e-07 | 5 | ANXA3 | -28.808 | <1e-07 |
| 6 | PFDN4 | 34.907 | <1e-07 | 6 | KCNJ2 | -30.677 | <1e-07 |
| 7 | EIF1 | 33.547 | <1e-07 | 7 | CREB5 | -34.032 | <1e-07 |
| 8 | TOB1 | 30.600 | <1e-07 | 8 | TNFRSF10C | -35.714 | <1e-07 |
| 9 | DUSP1 | 27.391 | <1e-07 | 9 | CHI3L1 | -49.331 | <1e-07 |
| 10 | SRSF3 | 21.989 | <1e-07 | 10 | CYP4F3 | -74.579 | <1e-07 |
| POB vs. TOB | |||||||
| 1 | ANP32E | 46.044 | <1e-07 | 1 | KCNJ15 | -19.891 | <1e-07 |
| 2 | PFDN4 | 37.971 | <1e-07 | 2 | CMTM2 | -20.443 | <1e-07 |
| 3 | ENO1 | 22.530 | <1e-07 | 3 | PTPRC | -22.346 | <1e-07 |
| 4 | RSL24D1 | 21.910 | <1e-07 | 4 | CXCR2 | -23.248 | <1e-07 |
| 5 | EIF1 | 20.350 | <1e-07 | 5 | TNFRSF10C | -23.901 | <1e-07 |
| 6 | VCAN | 17.577 | <1e-07 | 6 | KRT23 | -27.567 | <1e-07 |
| 7 | CD69 | 17.484 | <1e-07 | 7 | KCNJ2 | -32.120 | <1e-07 |
| 8 | CCR2 | 17.234 | <1e-07 | 8 | TNFAIP6 | -32.919 | 0.000001 |
| 9 | EAF2 | 16.839 | <1e-07 | 9 | WASF2 | -36.497 | <1e-07 |
| 10 | CD74 | 15.582 | <1e-07 | 10 | CYP4F3 | -37.242 | <1e-07 |
| PVB vs. TVB | |||||||
| 1 | EGR1 | 145.449 | <1e-07 | 1 | IL1R2 | -36.898 | 4.00e-07 |
| 2 | ANP32E | 63.300 | <1e-07 | 2 | MGAM | -37.428 | <1e-07 |
| 3 | TOB1 | 26.834 | <1e-07 | 3 | KCNJ15 | -39.927 | <1e-07 |
| 4 | CCR2 | 25.893 | <1e-07 | 4 | CMTM2 | -43.716 | <1e-07 |
| 5 | SET | 23.423 | <1e-07 | 5 | PI3 | -43.869 | <1e-07 |
| 6 | PGGT1B | 22.069 | <1e-07 | 6 | CHI3L1 | -49.435 | 1.00e-07 |
| 7 | MTPAP | 21.498 | <1e-07 | 7 | TNFAIP6 | -49.585 | <1e-07 |
| 8 | JAK1 | 20.178 | <1e-07 | 8 | ANXA3 | -57.418 | <1e-07 |
| 9 | CXCL8 | 19.765 | <1e-07 | 9 | MMP9 | -58.385 | <1e-07 |
| 10 | RASSF5 | 19.421 | <1e-07 | 10 | CYP4F3 | -93.282 | <1e-07 |
1 The table displays the top 10 genes with increased and the top 10 genes with decreased expressions for each class comparison. 2 Increased expression in the first class (e.g., PB) compared to the second class (e.g., TB). 3 Decreased expression in the first class (e.g., PB) compared to the second class (e.g., TB). FC, fold change; PB, group inclusive of all Portuguese Behçet syndrome patients; PMB, Portuguese mucocutaneous Behçet syndrome group; POB, Portuguese ocular Behçet syndrome group; PVB, Portuguese vascular Behçet syndrome group; TB, group inclusive of all Turkish Behçet syndrome patients; TMB, Turkish mucocutaneous Behçet syndrome group; TOB, Turkish ocular Behçet syndrome group; TVB, Turkish vascular Behçet syndrome group.
Disclaimer/Publisher’s Note: The statements, opinions and data contained in all publications are solely those of the individual author(s) and contributor(s) and not of MDPI and/or the editor(s). MDPI and/or the editor(s) disclaim responsibility for any injury to people or property resulting from any ideas, methods, instructions or products referred to in the content. |
© 2024 by the authors. Licensee MDPI, Basel, Switzerland. This article is an open access article distributed under the terms and conditions of the Creative Commons Attribution (CC BY) license (http://creativecommons.org/licenses/by/4.0/).
Copyright: This open access article is published under a Creative Commons CC BY 4.0 license, which permit the free download, distribution, and reuse, provided that the author and preprint are cited in any reuse.


