
Submitted:
20 December 2024
Posted:
20 December 2024
You are already at the latest version
Abstract
Atmospheric lightning is an outcome of interplay among the meteorological parameters under the influence of convective processes occurring in troposphere. Radiation, temperature and wind are the prime driving parameters of the convective phenomena. Often, the reanalysis data has been utilized to understand the precursor of the lightning occurrences. As the lightning is a disaster where nowcasting is important, for operational utilization, it is deemed to utilize space-borne near real-time measurements. The present study investigates the utilization of existing near real-time Indian remote sensing Satellite data to identify the signatures of of the lightning occurrences. Results reveal a lead-time of about 2.5 hours can be achieved when these precursors are used for lightning occurrences. The study provides first step into the prediction of the lightning occurrences over India using the Indian remote sensing geostationary satellite.
Keywords:
Atmospheric Lightning
; Meteorology
; INSAT
; Prediction
1. Introduction
Atmospheric Convection is vertical movement of air driven by temperature differentials. Convection plays pivotal role in the thunderstorm genesis by fostering the ascent of warm moist air and the subsequent releasing the latent heat (e.g., Charney and Eliassen, 1949; Lorenz, 1963; Doswell et al., 1996). Thunderstorms are generally deep convective systems in the atmosphere formed due to thermal instability of the boundary layer. It has been observed that the tropics are more prone to thunderstorm activity compared to higher latitude regions (Williams, 1992). When the air parcel gets uplifted in the troposphere crossing the freezing level, it leads to co-existence of all three phases of water. These conditions lead to the formation of ice crystals and graupel which are believed to be the leading factors for intense electrification and occurrence of the lightning in thunderstorms (e.g., Latham, 1981; Illingworth, 1985).
The traditional thunderstorm dipole, as described by Wilson (1920, 1929), consists of a positively charged upper region and a negatively charged lower region, creating a vertical electric field. Intracloud lightning serves to neutralize these charges, while cloud-to-ground lightning transfers negative charge from the storm's negative charge center to the Earth's surface. Moore et al. 1976 has summarized many studies which have reported with evidence that lightning is preceded by the development of intense thunderclouds and the organized transport of charge by convection is also demonstrated.
The dynamical variability of meteorological parameters on different land surface types may lead to the variations in the cloud behavior due to varying microphysical and dynamical characteristics (Gultepe, I, 2000; Hernandez-Deckers, 2022). Hence, thunderclouds in different regions and seasons may exhibit varying lightning activity. There have been investigations that elaborate the relation of these lightning occurrences with updraft processes. In particular, Cherna and Stansbury (1986) used precipitation measurements from radar and compared electrical activity with thunderstorm height. Goodman et al. (1988) studied lightning activity development for a single thunderstorm event and showed a sudden increase in lightning discharge with the vertical development of storm and a decrease in lightning activity with storm collapse. Overall, the available literature suggests that humidity, temperature and winds are the most important precursor parameters for the lightning occurrences (e.g., Mostajabi, 2019).
Convective systems usually follow a diurnal cycle which can be studied using the presence of clouds, brightness temperature and surface temperature information, which has been shown by Gruber (1976) and Yang and Slingo (2001). As convective updrafts drive the vertical movement of air and the development of thunderstorms, they influence the emission of longwave radiation from the cloud tops. This can be explained using variations in outgoing longwave radiation (OLR) information. In particular, Kumar and Kamra (2012), Siingh et al. (2014) have shown that OLR and thunderstorm activity have significant impact on the lightning occurrences. However, a recent investigation by Yadava et al. (2023) indicated that lightning is not significantly correlated with OLR. Apart from the OLR, the temperature changes on diurnal, seasonal and inter-annual level affect lightning and thunderstorm formation which has been shown in Price (1993). In addition, Bourscheidt et al. (2016) has shown that for 2000 to 2009 as the minimum temperatures increase during winter time, lightning activity is also shown to increase over Sao Paolo.
Of the importance to note is that all the above studies on the impact of OLR, Land Surface Temperature (LST) and Wind on the lightning occurrences are confined to the models, polar orbiting satellite or in-situ data with discussions on singular system specific case studies. Even though satellite data provide large coverage, most data used in these studies are obtained from polar satellites which have their own limitations due to their temporal resolution. In-situ data provides good temporal coverage but is limited in spatial coverage. For the operational purposes in Indian context, one may rely on Indian National Satellite (INSAT) – 3D which was launched in 2013. The INSAT-3D is an Indian meteorological satellite launched by Indian Space Research Organisation (ISRO) that can measure OLR, LST and winds at every 30 mins over the whole country. The present study uses the INSAT-3D data to investigate the operational utilization.
The National Remote Sensing Center (NRSC), ISRO has setup a ground-based Lightning Detection sensor Network (LDSN) under the National Information System for Climate and Environmental Studies (NICES) program which covers the whole country and collects data on cloud-to-ground (CG) lightning flash in real time. The INSAT-3D data together with the LDSN data provides an opportunity to study the relation between OLR, LST, wind and lightning at very fine spatial of 4 km and temporal resolution of 30 mins which could have not been done before. In this study we explore this relation at every 30 mins over Indian region for pre-monsoon and monsoon season of the year 2023. Our investigation highlights the usefulness of INSAT-3D in estimating possible Cloud-to-Ground (CG) lightning strikes over India for the purpose of nowcasting as the CG lightning has direct impacts to life and property.
2. Materials and Methods
Present study uses INSAT-3D data for OLR, LST and winds. CG lightning data is obtained from the NRSC-LDSN. Details of these data are as follows.
INSAT 3D is an Indian meteorological satellite launched in 2013. It has two sensors onboard namely Imager and Sounder which measure different parameters like brightness temperature in visible, short-wave infrared and thermal infrared band, outgoing longwave radiation, profiles of temperature and pressure. The Imager has 6 channels covering the regions - 0.52 - 0.72 µm, VIS (Visible) 1.55 - 1.70 µm, SWIR (Short Wave Infrared) 3.80 - 4.00 µm, MWIR (Mid Wave Infrared) 6.50 - 7.00 µm, WV (Water Vapor) 10.2 - 11.2 µm, TIR-1 (Thermal Infrared) 11.5 - 12.5 µm, TIR-2 (Thermal Infrared). All datasets from INSAT 3D mentioned below have spatial resolution of 4 km and data is available at every 30 mins.
In this study we have used OLR retrieved from INSAT 3D using WV, TIR1 and TIR2 channels (Mahakur, et. al, 2013). The INSAT 3D OLR has been compared with contemporary sensors like CERES (Clouds and the Earth’s Radiant Energy System) onboard the Suomi-NPP (Suomi National Polar-orbiting Partnership (Suomi NPP) and reported correlation to be ~0.93 with a bias of ~ -5 W/M2 (e.g., Kumar et al., 2019). Further comparison with High resolution Infrared Radiation Sounder (HIRS) onboard the MetOp satellite and Advanced Very High Resolution Radiometer (AVHRR) onboard the National Oceanic and Atmospheric Administration (NOAA) family of polar orbiting platforms (POES) revealed a positive bias of ~ 1.12 W/m2 and 5.93 W/m2, respectively (Mishra et al; 2024; Yadav et. al, 2022).
LST data is derived from TIR1 and TIR2 channels of INSAT 3D (Singh et al. 2016) using Genetic Algorithm (Szpiro, 1997; Alvarez et al., 2000) which is used to derive best relation between independent and dependent variables. The bias between MODIS LST and INSAT 3D LST was found to be -0.64K with a correlation of 0.9.
INSAT 3D data from the MWIR band can be used to retrieve atmospheric cloud motion vectors. Due to the high temporal resolution of 30 mins for INSAT 3D data, these motion vectors can be used to derive wind vectors using the movement of clouds (INSAT 3D, ATBD Document, 2015). The product has an accuracy of 4-6 m/s.
The LDSN is a network of 46 long-range lightning detection sensors across India, operating in the 1 Hz to 30 MHz range. The system uses the time-of-arrival method for geolocating strikes, recording a strike only if at least 4 sensors detect it. The sensors are spaced about 200 km apart, providing 50% coverage overlap. Data is geolocated per strike without gridding. The network has 98% detection efficiency within 300 km, with a geolocation error of 200m for CG lightning. IC lightning is not classified due to higher uncertainties and the need for short sensor baselines (Taori et al. 2022).The waveforms are detected by multiple sensors established across the country and geolocation of every strike is performed in near-real time at the central server located at NRSe which is disseminated to the users through Bhuvan (https://bhuvan-app1.nrsc.gov.in/lightning/) and National Database for Emergency Management (NDEM) (https://ndem.nrsc.gov.in/meteorological_lightiningecv.php) portals of NRSC.
In the present study we use the above-mentioned datasets for pre-monsoon and monsoon months of 2023 to understand the inter-relationship between OLR, LST, Winds and Lightning over Indian Region using geostationary satellite data and ground network on very short time scales of around 3 hours. The pre-monsoon season months taken are March, April and May whereas the monsoon months taken are June, July, August and September. The steps adopted in the methodology followed here are elaborated in Figure 1. The lightning data of cloud-to-ground lightning is available for every strike along with the geolocation as and when it occurs. INSAT-3D OLR, LST and wind data is available at every 30 mins. The total lightning strike counts over the country at every 3-hourly interval are calculated and plotted along with OLR, LST and wind data for which moving window average is taken for every 3 hours. To focus on longer-period variations and reduce short-term fluctuations, we apply a 3-hour moving average. This smooths brief changes, capturing only sustained variations. If fluctuations last across the 3-hour window, they are preserved; otherwise, they are smoothed out, highlighting longer-term patterns (days or months). Figure 2 shows the actual data vs. the 3-hour moving average for 3 days, illustrating how the moving average preserves broader trends while smoothing isolated variations. Gaps in the figure represent missing data.
In the case of OLR, LST and winds the data is used only for locations where lightning strikes are happening. This is done using a K-means clustering algorithm which classifies the OLR data in 5 different classes based on their values. In this case only OLR is used to identify such locations. Figure 3 shows the implementation of k-means clustering algorithm where lower values are filtered by taking OLR values from the class which represents the lowest values. It can be seen lightning strikes are at the locations where OLR is low and is applicable almost everywhere. Hence, OLR can be used as a proxy for filtering regions for LST and winds too using this understanding. It was also observed that the region where OLR is lowest and LST is high was the same region where lightning strikes are happening. This can be clearly seen in Figure 3. The figure shows time series of OLR, LST and winds in comparison with lightning strikes for the months of March-September of 2023. A 3-hourly moving mean is applied on the INSAT 3D datasets to reduce sudden variations which may occur because of data non-availability or any other reasons.
3. Results and Discussions
The INSAT derived OLR values (shown in blue to green scale) together with the LDSN lightning occurrence data (yellow dots) are shown in Figure 3 for June 11, 2023 and September 29, 2023 as an example. It is noted that locations where the lightning strikes are observed only on the regions where there is a dip in OLR values. The OLR values range typically between 110-180 W/m2 with indicative convective activity with colder cloud tops. It is noteworthy that lightning occurs often at the edges of the OLR minima. It is also evident that lightning do not have one to one association with the OLR dips, while, whenever there are sharp spatial changes, the lightning occurs on those OLR transition locations with minimum values.
Further, to identify the lightning precursor signatures using the INSAT 3D data, a correlation study is performed on the temporal evolution. Figure 4 explains this relation for the pre-monsoon months of March, April, May and for the monsoon months of June, July, August and September of the year 2023. We note that the OLR trough values are below 225 W/m2 for the months of March, April and September with lows above 150 W/m2. Whereas the OLR troughs values varies between 200 to 250 W/m2 for the most of the period with occasional dips upto 150 W/m2 which shows the range is very high during this period of May, June, July, August and September. Overall the combined data set shows that the fall in OLR during the day is followed by increasing lightning activity.
On the contrary to the relation between the OLR and lightning, the diurnal behavior of the LST data follows the pattern similar to that of the lightning occurrences, i.e., their variation is positively correlated. LST peaks during the day when sunlight is at its maximum. Also, higher LST is corresponding to increase in lightning strikes. The range of LST values are very high during the course of the day and range from 180K to 290K for the months of March, April, May, August, September. The range gets reduced during July and August ranging from 240-280K which may be due to presence of cloudy conditions owing to the onset of monsoon.
Several studies have suggested a strong correlation between the convectively available potential energy (CAPE) and lightning occurrences (e.g., Dewan et al., 2017; Mishra et al., 2022). In this regard, as on the INSAT-3D which is the only geostationary satellite available over India, we incorporated the cloud motion wind vector data as a representative. It is observed that wind speeds are generally lower during May-September period and does not follow any specific diurnal pattern. Winds speeds in March and April have reached as high as 20 m/s which can be attributed to local heating due to summer in the Indian Subcontinent causing changes in surface pressure and possible convection. As mentioned above, the convective processes have shown to be precursors to lightning activity. From Fig 3 we can see that higher wind speeds are always preceded by lightning activity but this relation is unclear for lower wind speeds. LDSN data has recorded 5000 to 25000 strikes for the whole duration except for two different days in July 2023 when the lightning strike count crossed the 35000 mark. These strikes are calculated as the cumulative count in a 3-hourly period. This 3-hourly period is the same period where the mean of OLR is taken. The absence of lightning activity from 9-12 July and 5-8 August-12 is a result of data non-availability due to operational reasons. As we need to omit these days, the OLR, LST and wind data is also not considered for the same period.
Overall the results in the Figure 1 reveals that low OLR location boundaries have more lightning occurrences compared to the neighborhood regions. It is evident that the spatial and time series analysis suggests that both lightning data and OLR exhibit a close relationship. This indicates that the diurnal variation of OLR can provide prior insights into lightning occurrences. It can be seen that the OLR data follows distinct diurnal pattern in the months of March, April, August and September which seem to be the months reported with highest lightning activity (e.g., Taori et al. 2022). From Figure 4 it can be observed that there is a certain lag in the development of lightning activity as compared to OLR. This relation can be better understood using cross-correlation analysis. Kumar and Kamra (2012) reported a correlation of -0.49 to -0.32 between OLR activity and lightning strike activity over Peninsular India for a period of 11 years from 1995 to 2005. In their study lightning data was used from Optical Transient Detector (OTD) and Lightning Imaging Sensor (LIS) on board the Tropical Rainfall Measuring Mission (TRMM) satellite. It is to be noted that OTD and LIS sensors do not differentiate the IC and CG lightning, however, as they operate at 774 nm line emission which is often opaque under the presence of clouds, there is high probability that all the CG may not be detected by them. In a recent study, Yadava et al., (2023) used LIS data onboard TRMM and emphasized a negative correlation over most of India whereas a positive correlation over Western Himalaya region. Important to state here is that the studies performed so far were using LIS data onboard TRMM which is a polar satellite and provide around passes per day in a given region. This severely limits the understanding on the evolution of lightning activity due to development of thunderstorm. Hence, we explore the combination of OLR, LST and winds from INSAT-3D at every 30 mins and ground-based lightning detection network covering entire country to check if the relation can be better expressed. We study the correlation and time lag between all parameters at every 30 min time scales to understand this dynamical relationship as it progresses.
From Figure 5 we can see that OLR and LST show highest correlation around the same time lag in all the months indicating a strong relation of these parameters with the lightning occurrences. The grey region represents the range of time lags with the best correlation for each month, showing the minimum and maximum time lags across all months. But for winds we see that the dependence of winds on lightning strike is not clearly seen in any of the months which may be partially because it is the vertical wind shear which helps in the charge polarization process during the thunderstorm evolution process. Table 1 shows the correlation and time lags for every month from March-September 2023 for between INSAT 3D parameters and lightning strike activity. We see a highest average correlation of OLR with lightning is about -0.58 at a time lag of about -3.7 hours. Negative correlation of OLR indicates that lightning activity increases with decrease in OLR and negative time lag indicates that lightning activity is preceded by OLR troughs. The highest average correlation of LST with lightning was observed to be 0.49 which peaked at an average of -5.07 hours. Here positive correlation indicates increase in LST is analogous to increase in lightning activity and negative time lag indicates that increase in lightning activity is preceded by increase in LST. Winds show an average correlation of 0.2 with randomly distributed time lags indicating no definite relation.
The results indicate that OLR and LST data from INSAT 3D can be used for the potential satellite based nowcasting of the CG lightning occurrences. We believe that INSAT-3D wind data is not very useful because these are horizontal winds which do not provide desired information on convective activity. Unless the winds are strong, the correlation between lightning and wind related parameters will be poor. Vertical wind information on the other hand can be useful to determine increase in convective activity and can be complemented with OLR and LST to provide accurate lightning strike predictions and may be used as proxies.
Furthermore, since the relation of CG lightning with the meteorological parameters from INSAT-3D is favorable we can use a combined variable comprising of OLR, LST and winds which can express this relation in a simplified and direct manner. This can be achieved through principal component analysis where each variable can be assigned weights based on their variance in their contribution to the combined variable.
To know the contribution of each parameter from INSAT-3D (viz. OLR, lightning and Winds) Figure 7 shows the distribution of explained variance from each parameter. It can be see that 88% of the variance in the data can be attributed to OLR and LST itself which means they also have the highest contribution to lightning strike activity too as explained earlier. Clearly, we can use INSAT 3D to estimate possible lightning strike activity over Indian Region in advance.
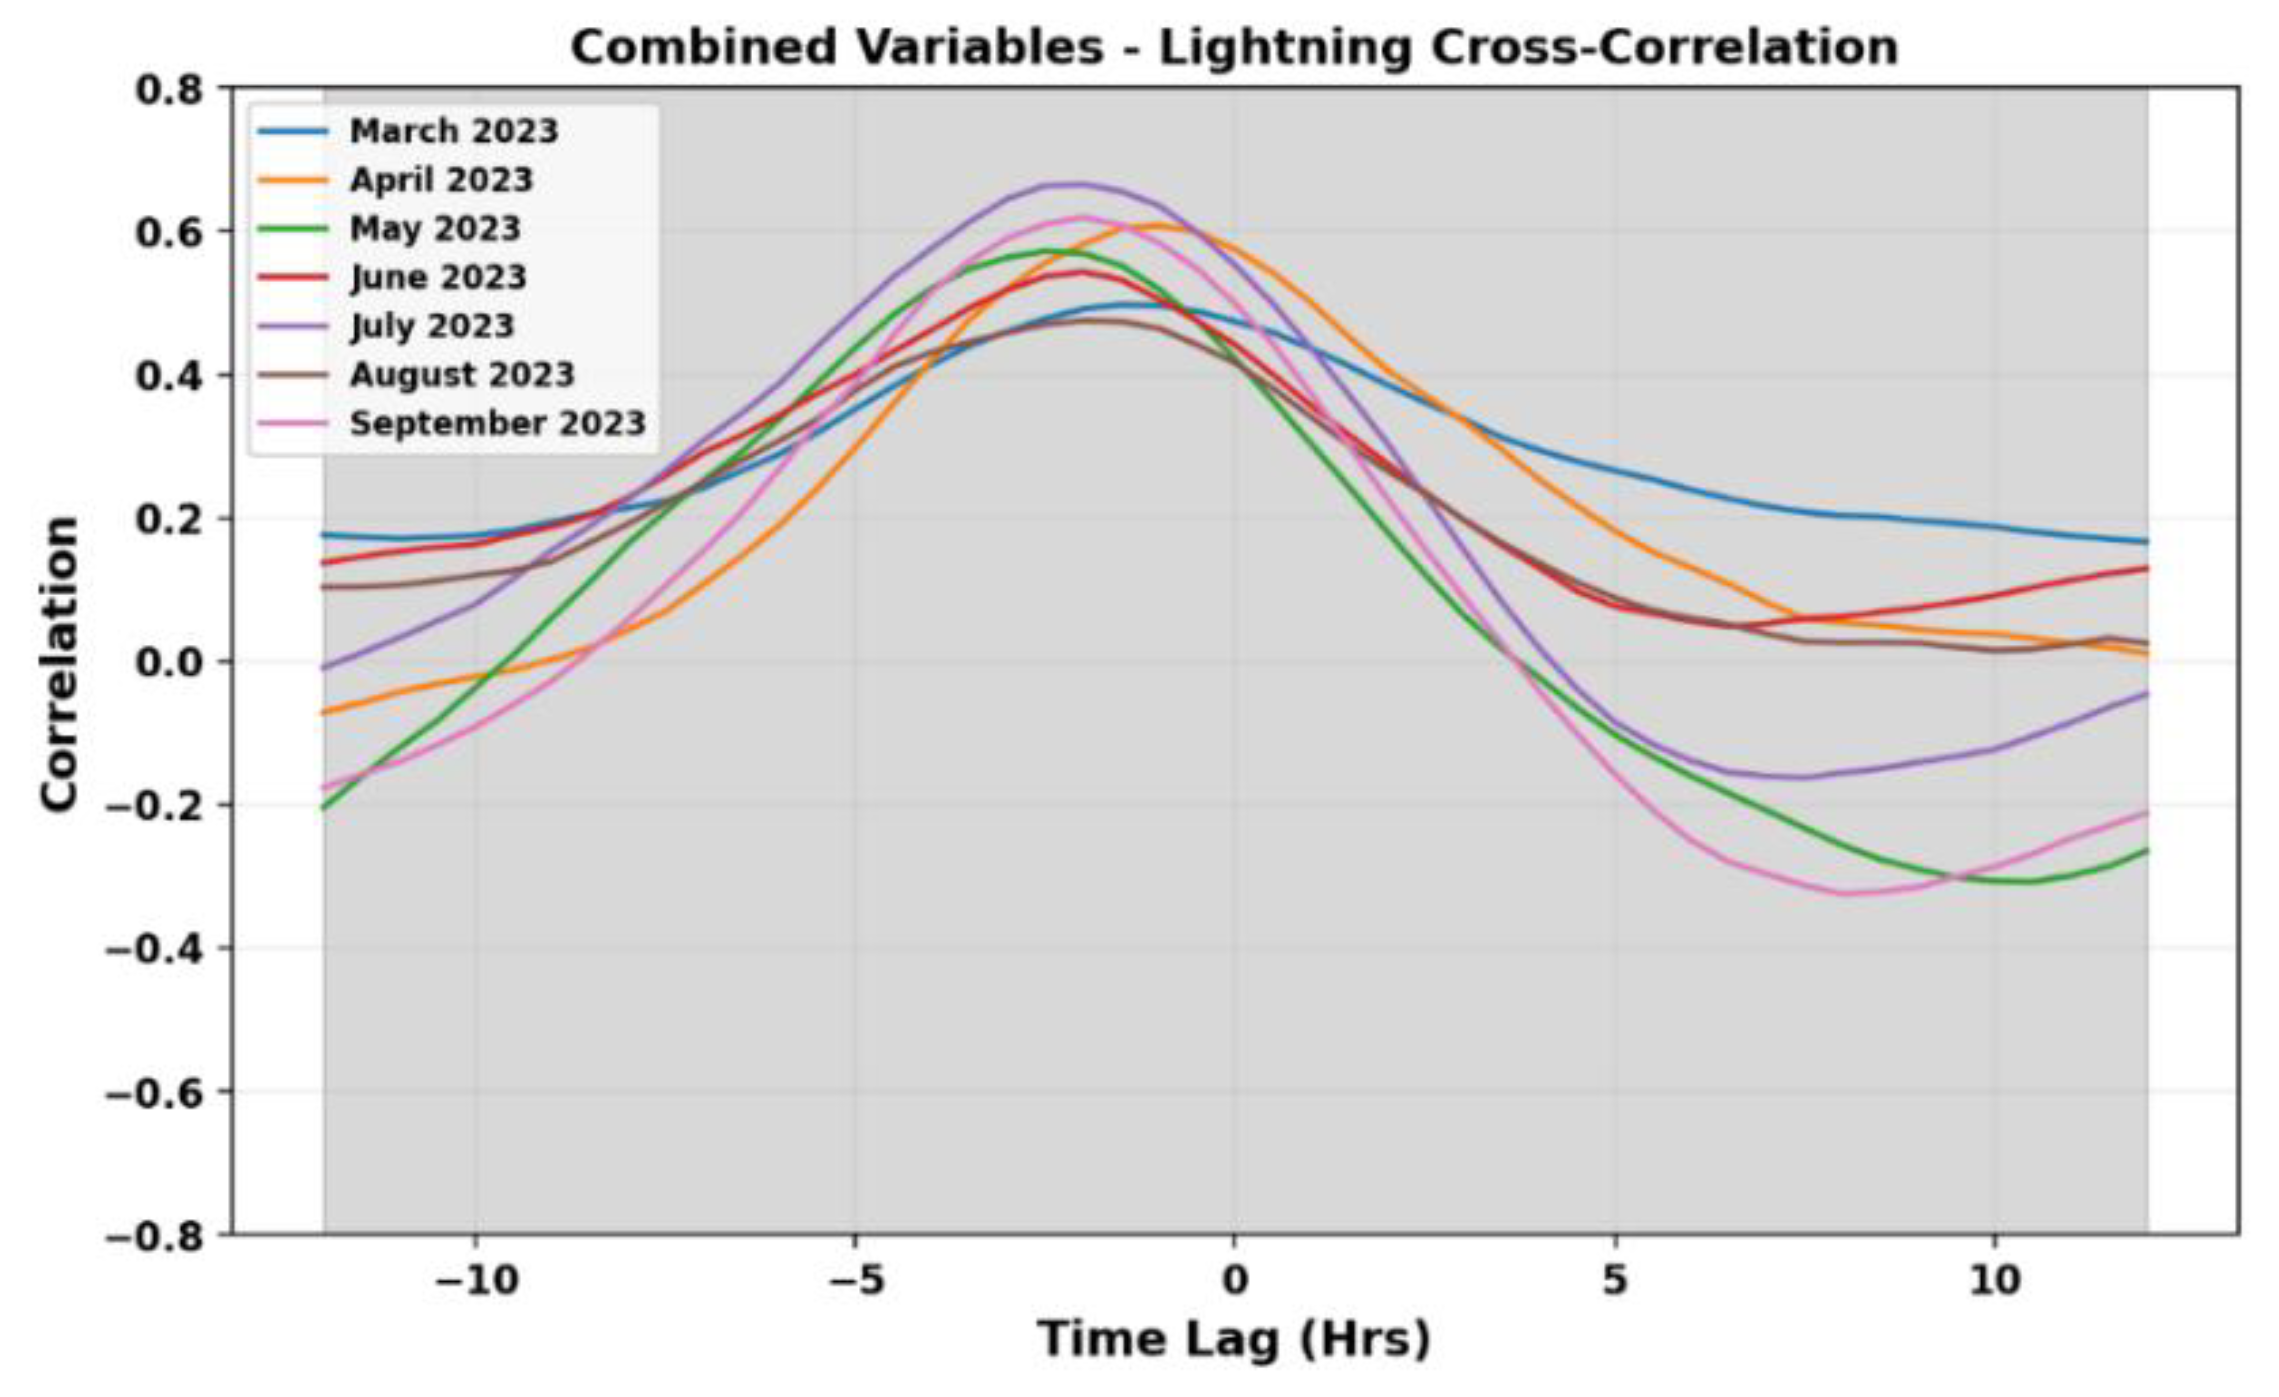
Figure 6 shows the time series of the combined variable for the months of March-September 2023 along with lightning strikes over the same regions as mentioned in Figure 3. It can be seen that the variable ranges from 0-2500 (unitless) depending on the lightning strike activity. It is interesting to note that this variable is highest when lightning strikes are highest and lowest when lightning strikes are lowest. Which means not only it related well with lightning strike activity it is also showing good relation with lightning strike intensity. This can be very useful for operational purposes are this time lag can also be quantified and related to the lightning strike activity. Figure 8 shows the cross-correlation between the combined variable and lightning strikes for March-September 2023. The overall correlation is positive and varies between 0.5-0.7 indicating that increase in value of combined variable corresponds to increase in lightning strike activity. Also, the time lag is found to be varying between -2.5 to -3 hours. The negative time lag indicates increase in the combined variable precedes the lightning strike activity. Also, we can positively indicate occurrence of lightning strike before-hand by at least 2.5 hours.
Figure 6.
3-hourly moving mean time series of combined variable generated using OLR, LST and Winds vs Lightning strikes for March, April, June, July, August, September in 2023 (a-g) over Indian Region.
Figure 6.
3-hourly moving mean time series of combined variable generated using OLR, LST and Winds vs Lightning strikes for March, April, June, July, August, September in 2023 (a-g) over Indian Region.
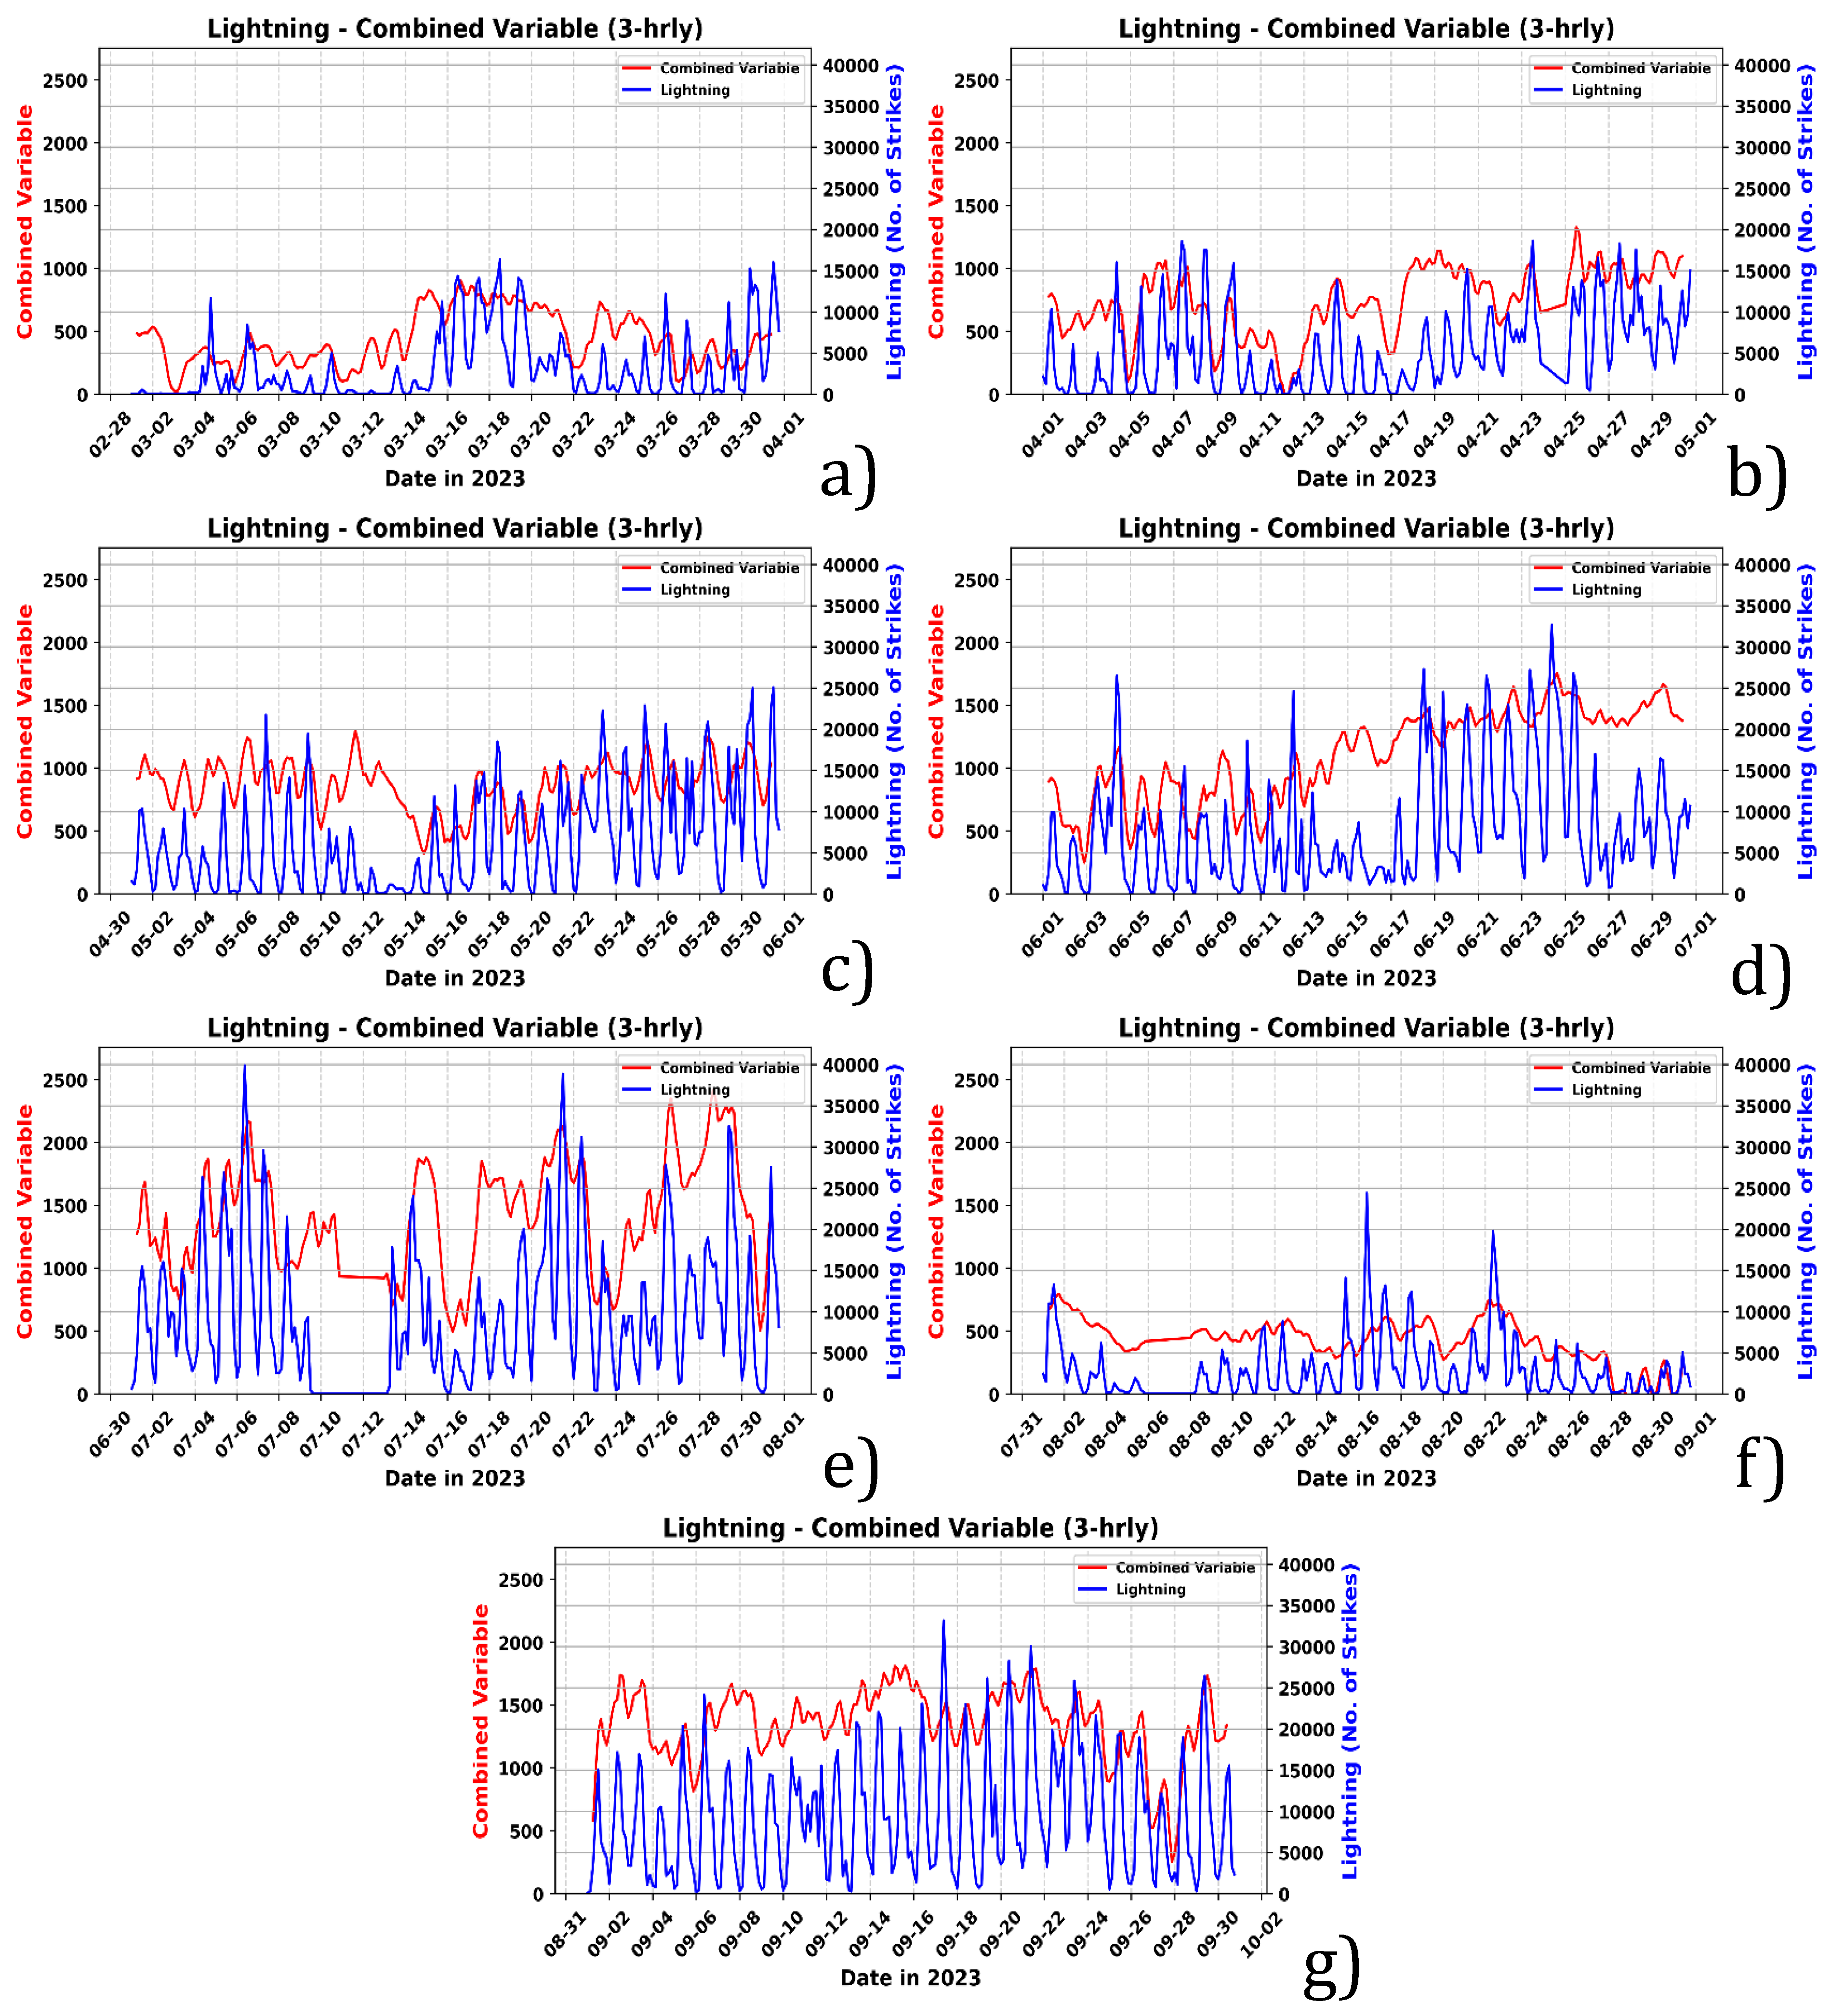
Figure 7.
Explained variance by the principal components (OLR, LST and Winds) towards the combined variable.
Figure 7.
Explained variance by the principal components (OLR, LST and Winds) towards the combined variable.
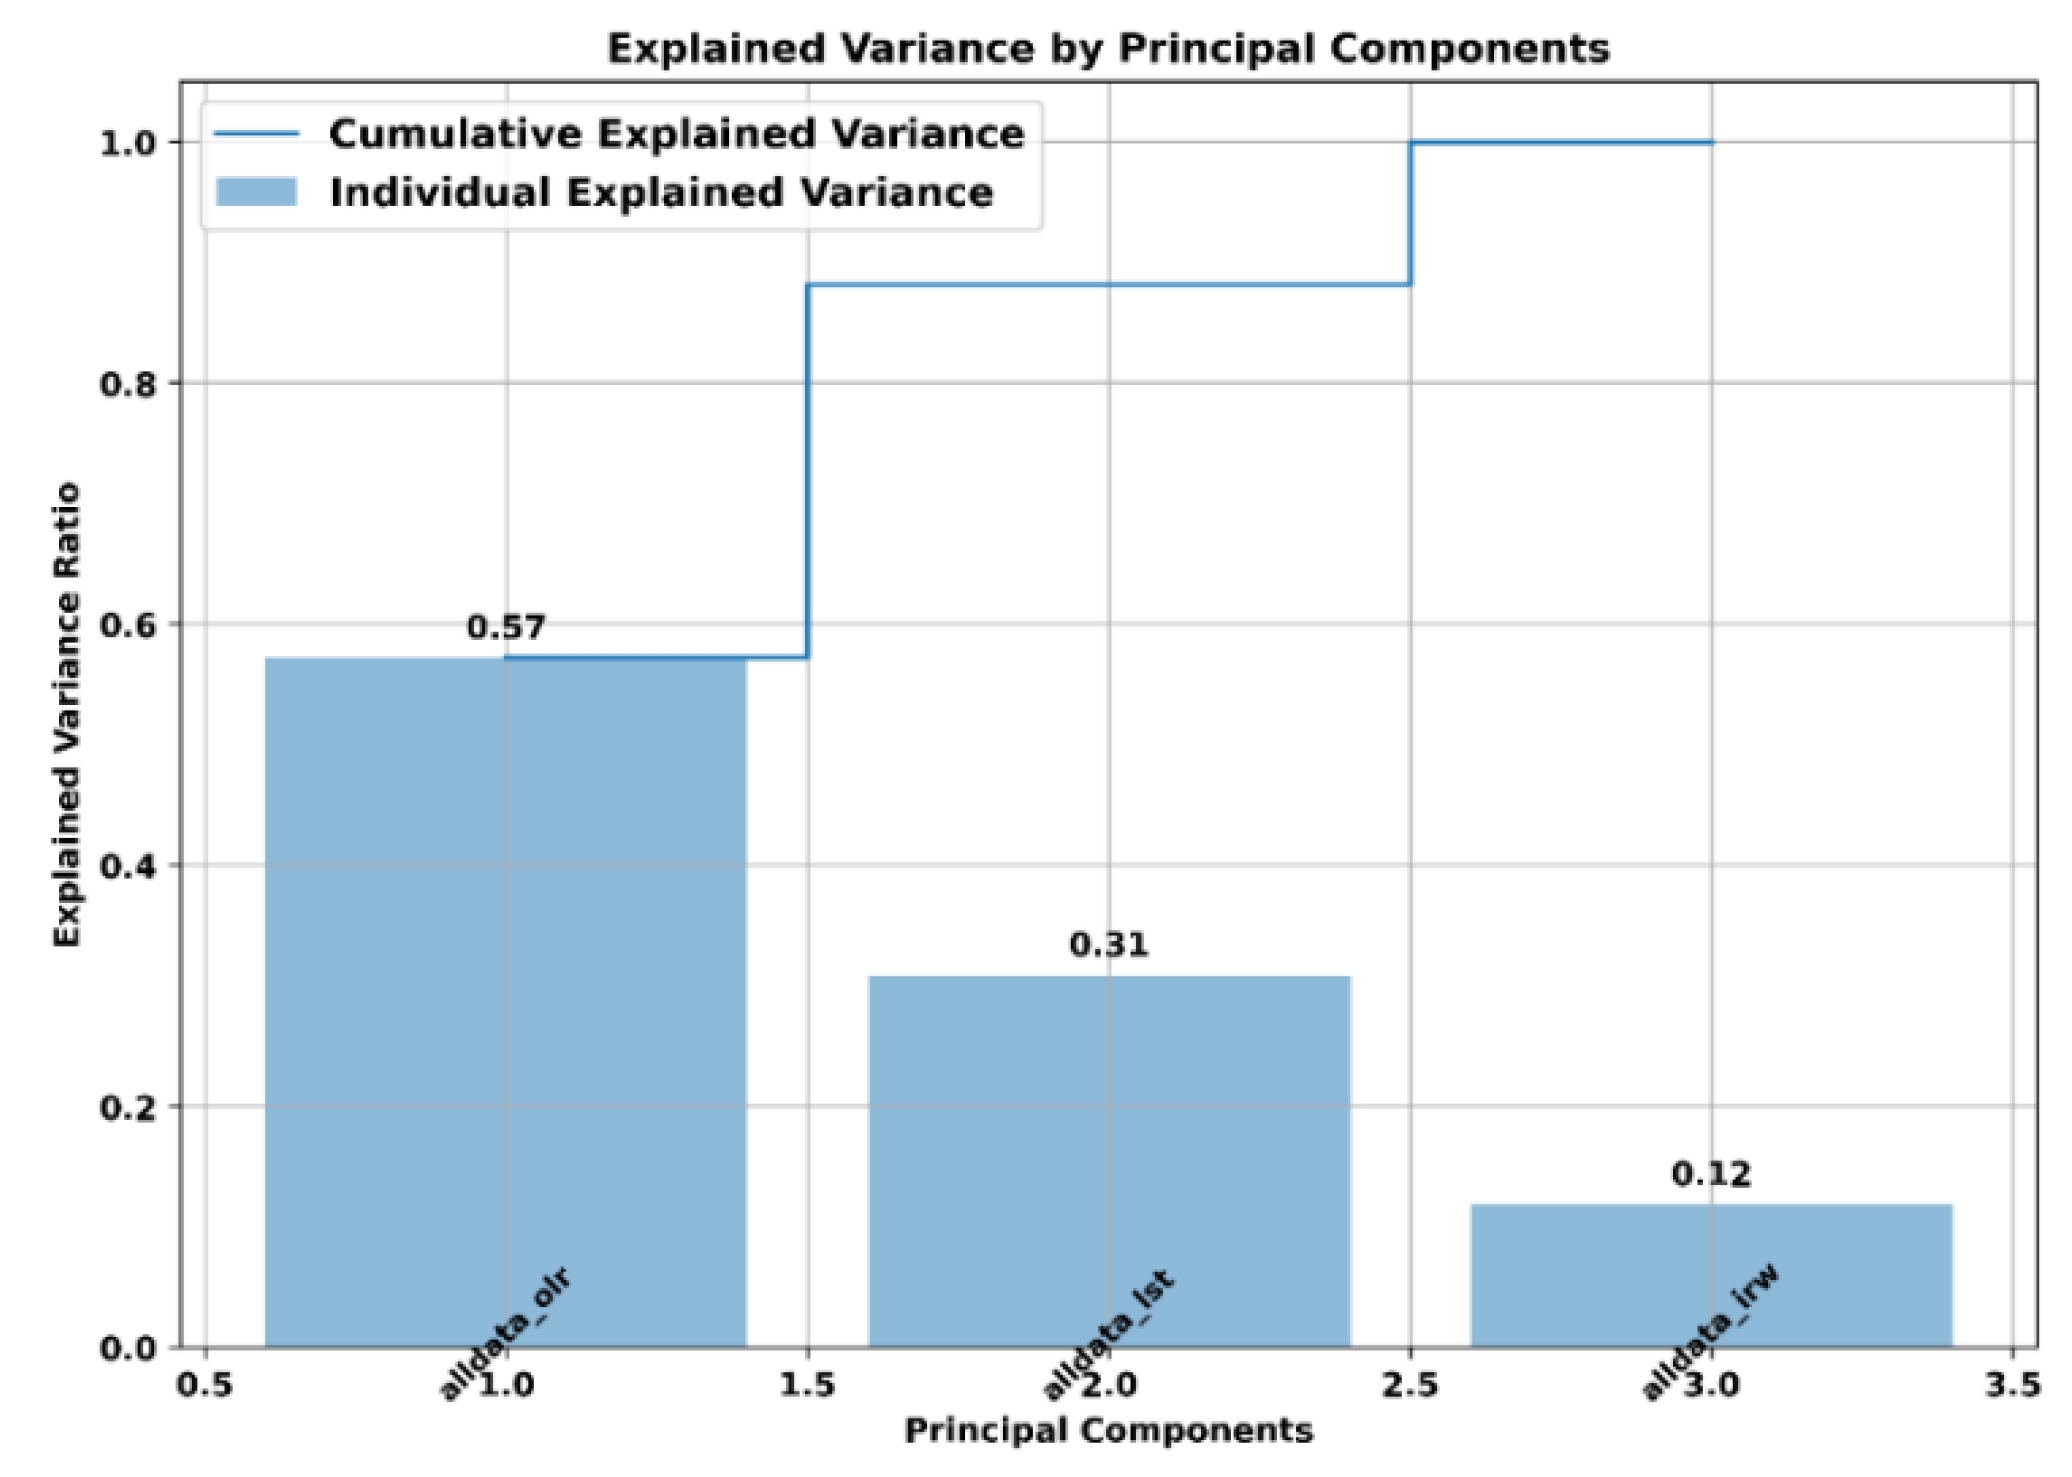
Figure 8.
24-hour Cross-Correlation of combined variable using OLR, LST and Winds with Lightning for March-Sep, 2023.
Figure 8.
24-hour Cross-Correlation of combined variable using OLR, LST and Winds with Lightning for March-Sep, 2023.
To validate our prediction with lightning strikes, we obtained 1 day of Electric Field Mill (EFM) data from the Atmospheric Science Research Facility (ASRF) at Balasore (21.5833N, 87.000E) for August 23, 2023. As shown in Figure 9, voltage fluctuations up to 15 kV/m occurred simultaneously with lightning strikes within 50 km of the site. Lightning strikes were aggregated every 30 minutes. Two isolated strikes at 0700 and 2100, likely distant from the EFM, did not trigger voltage surges. We also adjusted the 3-hour combined variable and calculated the difference between consecutive values to track changes in the predicted variable. The decrease in the combined predicted variable aligns with LDSN-detected lightning strikes, including those at 0700 and 2100, which the EFM did not detect.
4. Conclusion
Our investigation reveals that existing operational products from INSAT 3D (which is the only available geostationary satellite over India) show a close relationship with the lightning occurrences. The lightning occurrences over India have a positive correlation with the LST data while a negative correlation with the OLR while the combined product explaining more than 75% of the variability in the lightning occurrences. Our study reveals that a combination of these products can be used for a possible prediction and a lead time of about 2.5-3 hours is achievable. This method can be further improved if near real time vertical winds and surface temperature data are available in future satellite missions.
Author Contributions
AT and Rounaq conceived the work. VD and AS helped provided LDSN data and upkeep of LDSN network. AG provided Electric Field Mill data. RG and AT performed and the analysis and interpretation of results. SG, VAO and GSR helped in overall administration and provided support towards the LDSN project.
Funding
The NRSC-LDSN is supported by National Information System for Climate and Environment Studies (NICES) program of NRSC/ISRO.
Acknowledgments
The NRSC-LDS network is funded through the NICES program of NRSC, ISRO, Dept. of Space. Authors acknowledge Mr. M. Mallikarjun for maintenance and day to day operation of LDSN. The authors would also like to acknowledge Director, NRSC for their kind suport.
Conflicts of Interest
Authors declare that there is no conflict of interest in any sense about the data presentation and conclusions drawn.
References
- Álvarez, A.; López, C.; Riera, M.; Hernández-García, E.; Tintoré, J. Forecasting the SST Space-time variability of the Alboran Sea with genetic algorithms. Geophys. Res. Lett. 2000, 27, 2709–2712. [Google Scholar] [CrossRef]
- Bourscheidt, V.; Pinto, O.; Naccarato, K.P. The effects of Sao Paulo urban heat island on lightning activity: Decadal analysis (1999–2009). J. Geophys. Res. Atmos. 2016, 121, 4429–4442. [Google Scholar] [CrossRef]
- Cherna, E.V.; Stansbury, E.J. Sferics rate in relation to thunderstorm dimensions. J. Geophys. Res. 1986, 91, 8701–8707. [Google Scholar] [CrossRef]
- Eady, E.T. Long Waves and Cyclone Waves. Tellus 1949, 1, 33–52. [Google Scholar] [CrossRef]
- Dewan, A.; Ongee, E.T.; Rafiuddin, M.; Rahman, M.; Mahmood, R. Lightning activity associated with precipitation and CAPE over Bangladesh. Int. J. Clim. 2017, 38, 1649–1660. [Google Scholar] [CrossRef]
- Doswell, C.A.; Burgess, D.W. On Some Issues of United States Tornado Climatology. Mon. Weather. Rev. 1996, 116, 495–501. [Google Scholar] [CrossRef]
- Goodman, S.J.; Buechler, D.E.; Wright, P.D.; Rust, W.D. Lightning and precipitation history of a microburst-producing storm. Geophys. Res. Lett. 1988, 15, 1185–1188. [Google Scholar] [CrossRef]
- Gruber, A. An Estimate of the Daily Variation of Cloudiness Over the GATE A/B Area. Mon. Weather. Rev. 1976, 104, 1036–1039. [Google Scholar] [CrossRef]
- Gultepe, I.; Isaac, G.; Hudak, D.; Nissen, R.; Strapp, J.W. Dynamical and Microphysical Characteristics of Arctic Clouds during BASE. J. Clim. 2000, 13, 1225–1254. [Google Scholar] [CrossRef]
- Hernandez-Deckers, D.; Matsui, T.; Fridlind, A.M. Updraft dynamics and microphysics: On the added value of the cumulus thermal reference frame in simulations of aerosol–deep convection interactions. Atmos. Chem. Phys. 2022, 22, 711–724. [Google Scholar] [CrossRef]
- Illingworth, A.J. Charge separation in thunderstorms: Small scale processes. J. Geophys. Res. 1985, 90, 6026–6032. [Google Scholar] [CrossRef]
- Kumar, A.; Singh, V.; Mukherjee, S.; Singh, R. Quality assessment of Outgoing Longwave Radiation (OLR) derived from INSAT-3D Imager: Impact of GSICS correction. MAUSAM 2021, 70, 309–320. [Google Scholar] [CrossRef]
- Kumar, P.R.; Kamra, A. Land–sea contrast in lightning activity over the sea and peninsular regions of South/Southeast Asia. Atmos. Res. 2012, 118, 52–67. [Google Scholar] [CrossRef]
- Latham, J. The electrification of thunderstorms. Q. J. R. Meteorol. Soc. 1981, 107, 277–298. [Google Scholar] [CrossRef]
- Lorenz, E.N. Deterministic Nonperiodic Flow. J. Atmos. Sci. 1963, 20, 130–141. [Google Scholar] [CrossRef]
- Mahakur, M.; Prabhu, A.; Sharma, A.K.; Rao, V.R.; Senroy, S.; Singh, R.; Goswami, B.N. A High-Resolution Outgoing Longwave Radiation Dataset from Kalpana-1 Satellite during 2004–2012. Curr. Sci. 2013, 105, 1124–1133. [Google Scholar]
- Mishra, A.K.; Tomar, C.S.; Kumar, G.; Mitra, A.K.; Bhan, S.C. Performance Evaluation of INSAT-3D Derived Outgoing Long Wave Radiation Over India Using Remotely Sensed Observations. J. Indian Soc. Remote. Sens. 2024. [Google Scholar] [CrossRef]
- Moore, C.B. An Assessment of Thunderstorm Electrification Mechanisms. In: Dolezalek, H., Reiter, R., Landsberg, H.E. (eds) Electrical Processes in Atmospheres. Steinkopff. 1976. https://www.mosdac.gov.in/docs/INSAT_3D_ATBD_MAY_2015.pdf. [CrossRef]
- Mostajabi, A.; Finney, D.L.; Rubinstein, M.; Rachidi, F. Nowcasting lightning occurrence from commonly available meteorological parameters using machine learning techniques. Nat. Clim. Atmos. Sci. 2019, 2, 41. [Google Scholar] [CrossRef]
- Mishra, M.; Acharyya, T.; Santos, C.A.G.; da Silva, R.M.; Chand, P.; Bhattacharyya, D.; Srivastava, S.; Singh, O. Mapping main risk areas of lightning fatalities between 2000 and 2020 over Odisha state (India): A diagnostic approach to reduce lightning fatalities using statistical and spatiotemporal analyses. Int. J. Disaster Risk Reduct. 2022, 79. [Google Scholar] [CrossRef]
- Price, C. Global surface temperatures and the atmospheric electrical circuit. Geophys. Res. Lett. 1993, 20, 1363–1366. [Google Scholar] [CrossRef]
- Yadav, R.; Giri, R.; Bhan, S. High-resolution outgoing long wave radiation data (2014–2020) of INSAT-3D Imager and its comparison with Clouds and Earth’s Radiant Energy System (CERES) data. Adv. Space Res. 2022, 70, 976–991. [Google Scholar] [CrossRef]
- Siingh, D.; Singh, R.P.; Kulkarni, M.N.; Gautam, A.S.; Singh, A.K. Solar Activity, Lightning and Climate. Surv. Geophys. 2011, 32, 659–703. [Google Scholar] [CrossRef]
- Singh, R.; Singh, C.; Ojha, S.P.; Kishtawal, C.M.; Kumar, A.S.K. Land surface temperature from INSAT-3D imager data: Retrieval and assimilation in NWP model. J. Geophys. Res. Atmos. 2016, 121, 6909–6926. [Google Scholar] [CrossRef]
- Szpiro, G.G. Forecasting chaotic time series with genetic algorithms. Phys. Rev. E 1997, 55, 2557–2568. [Google Scholar] [CrossRef]
- Taori, A.; Suryavanshi, A.; Pawar, S.; Seshasai, M.V.R. Establishment of lightning detection sensors network in India: Generation of essential climate variable and characterization of cloud-to-ground lightning occurrences. Nat. Hazards 2021, 111, 19–32. [Google Scholar] [CrossRef]
- Yang, G.; Slingo, J. The diurnal cycle in the tropics. Mon. Weather Rev. 2001, 129, 784–801. [Google Scholar] [CrossRef]
- Yadava, P.K.; Sharma, A.; Payra, S.; Mall, R.K.; Verma, S. Influence of meteorological parameters on lightning flashes over Indian region. J. Earth Syst. Sci. 2023, 132, 179. [Google Scholar] [CrossRef]
- Williams, E.R. The Schumann Resonance: A Global Tropical Thermometer. Science 1992, 256, 1184–1187. [Google Scholar] [CrossRef]
- Wilson, C.T.R. III. Investigations on lighting discharges and on the electric field of thunderstorms. Philos. Trans. R. Soc. London. Ser. A, Contain. Pap. a Math. or Phys. Character 1921, 221, 73–115. [Google Scholar] [CrossRef]
- Wilson, C.T.R. Some thundercloud problems. J. Frankl. Inst. 1929, 208, 1–12. [Google Scholar] [CrossRef]
Figure 1.
Flowchart of methodology.
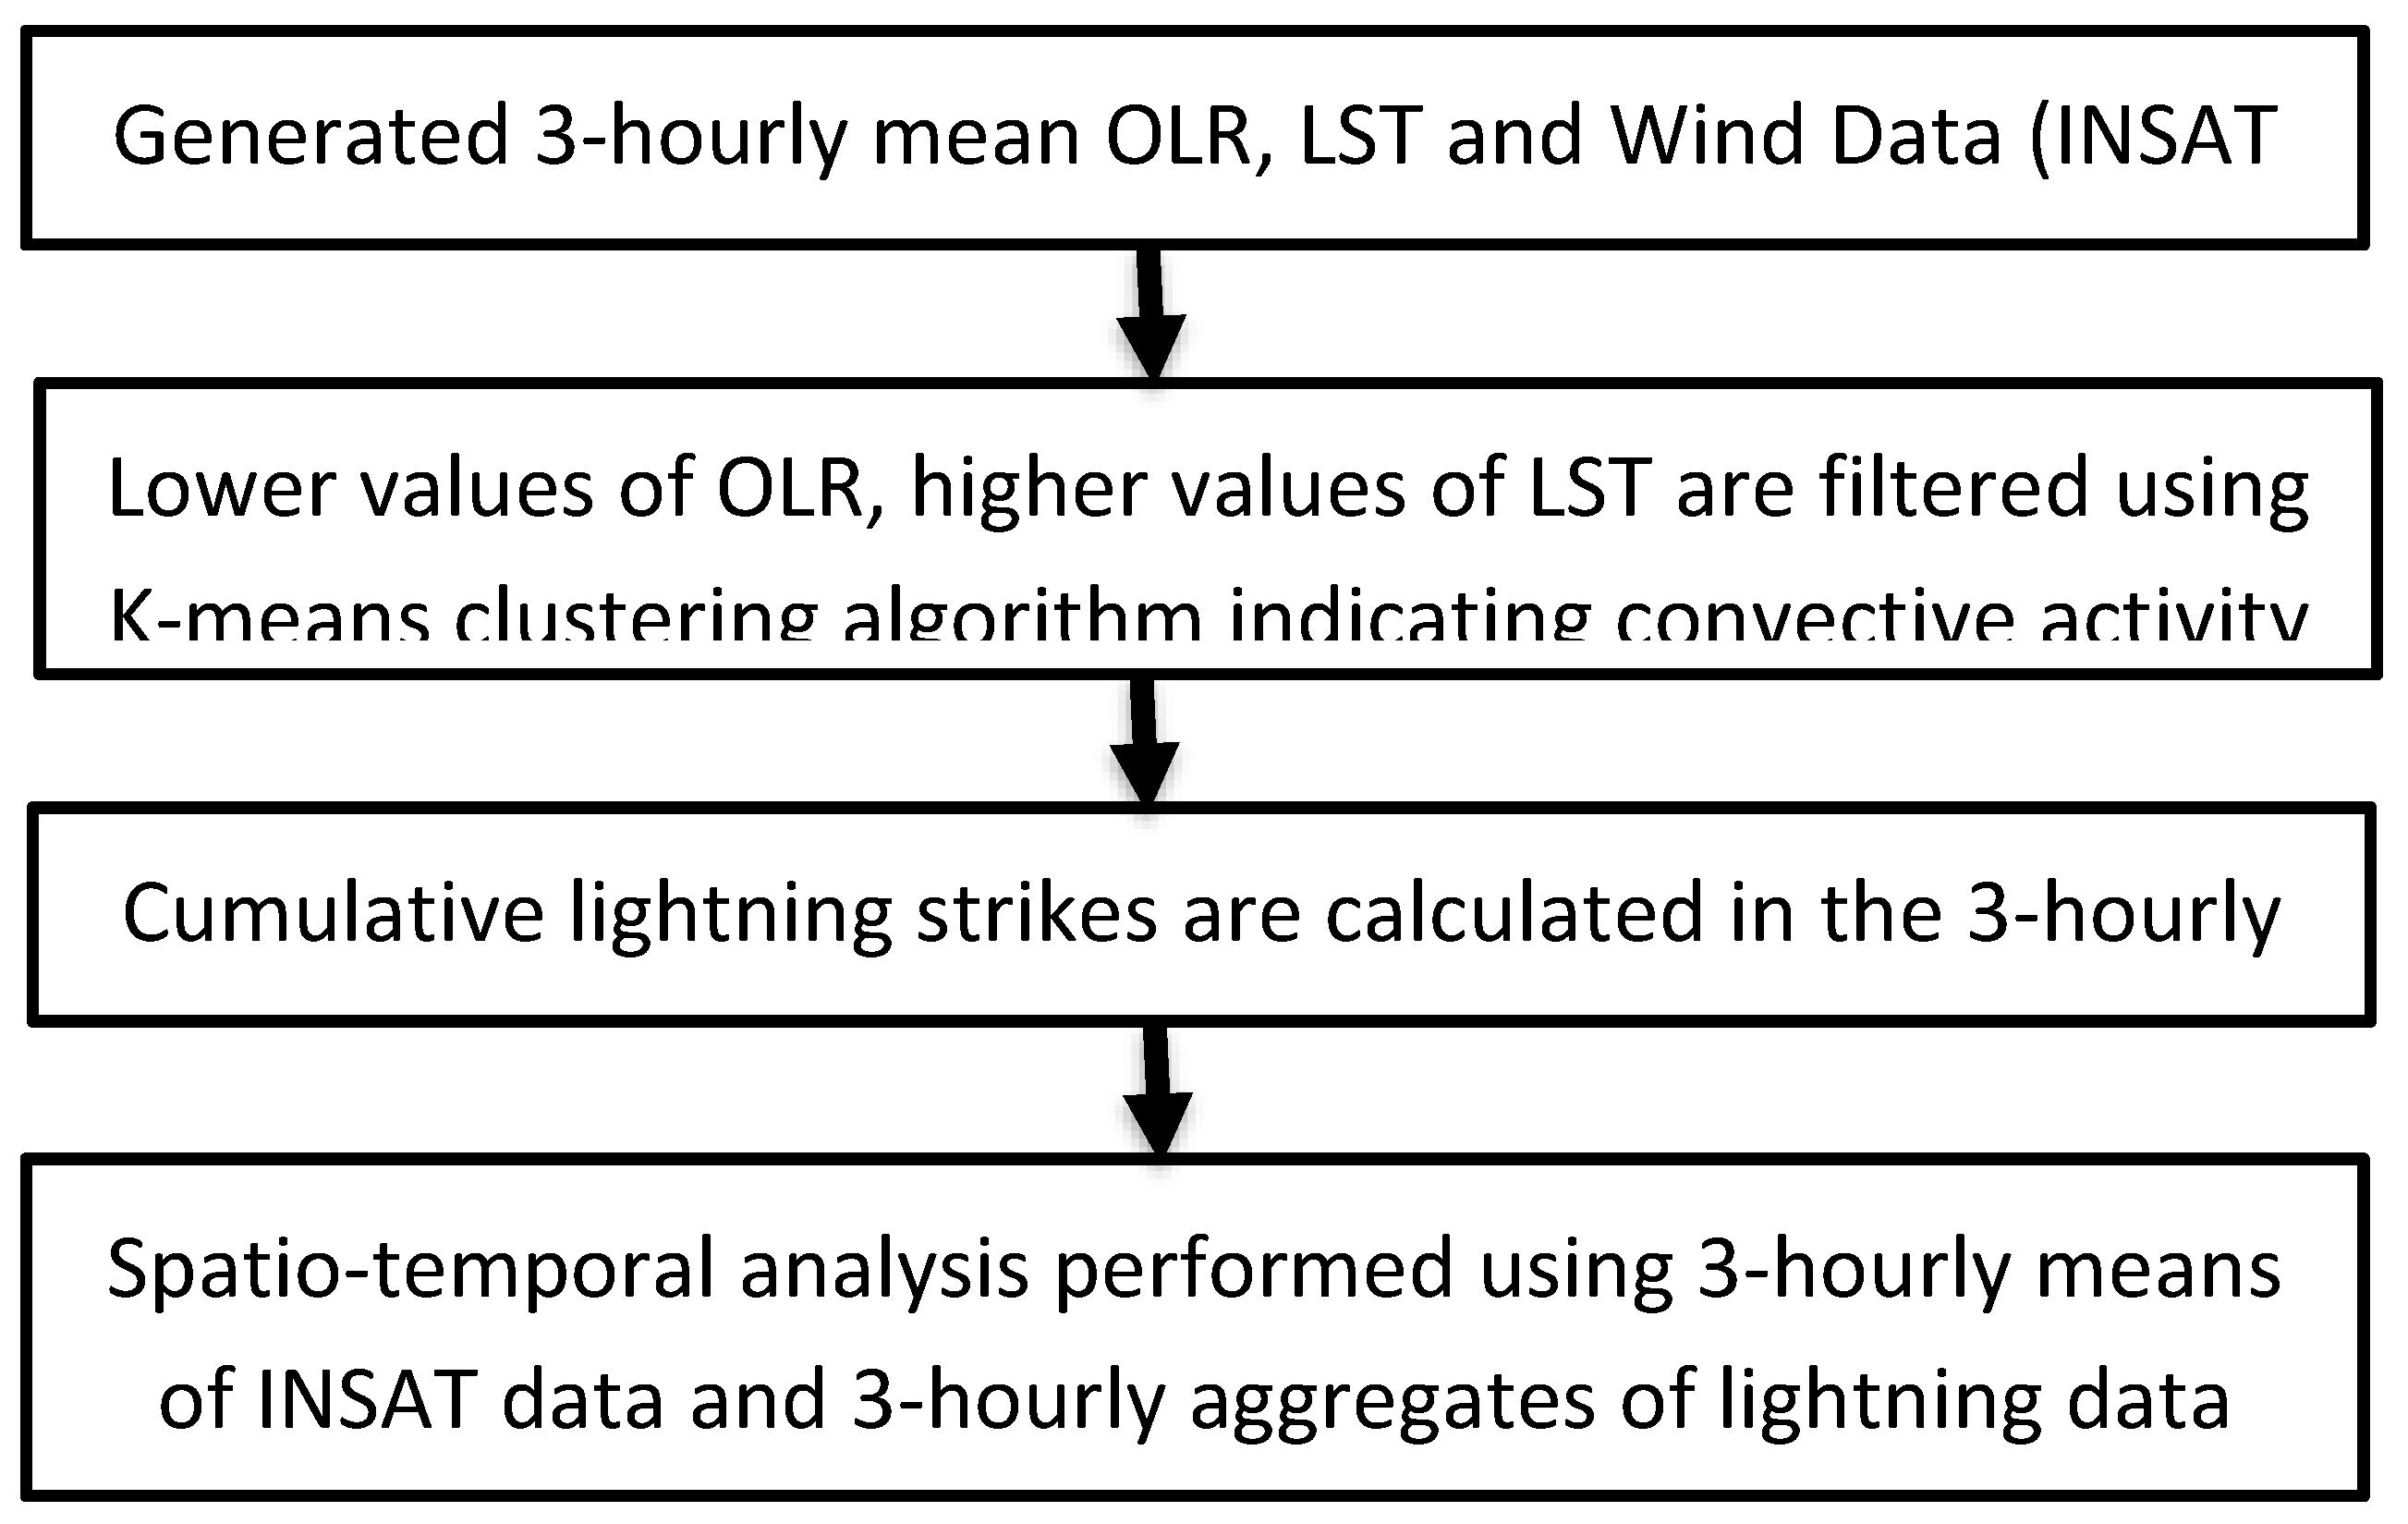
Figure 2.
Comparison of actual OLR data vs 3-hourly moving mean.
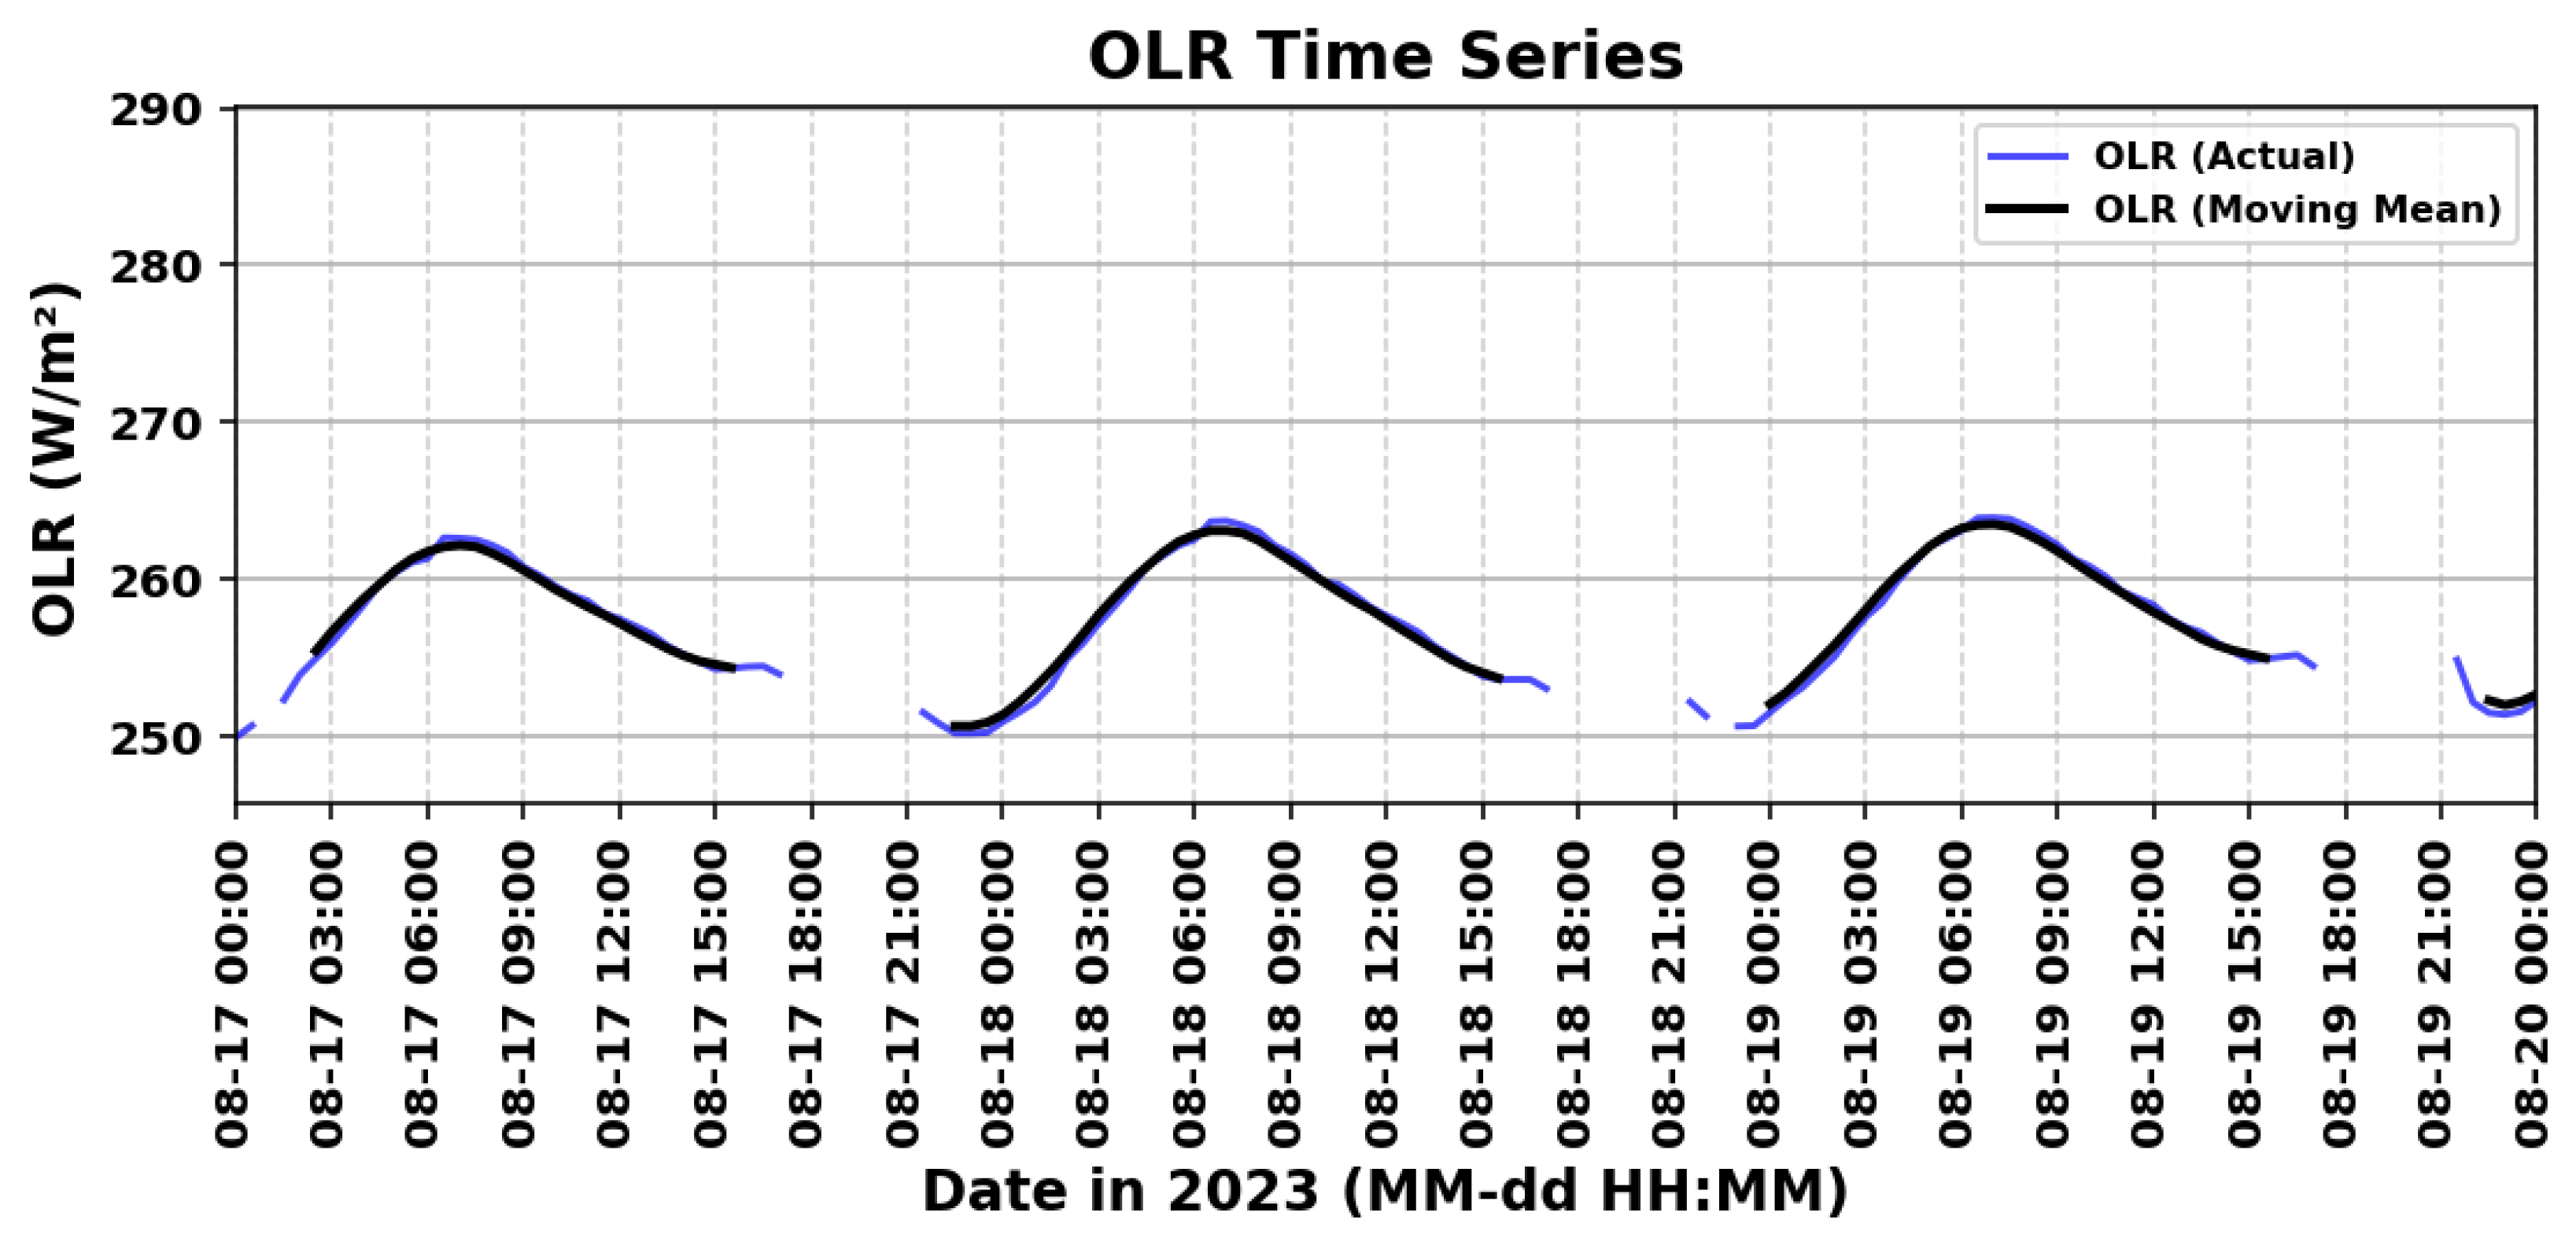
Figure 3.
OLR (W/M2) vs total Lightning (strikes) in 24 hours on June11, 2023 and Sep 29, 2023 before K-mean (A) and (C) and after K-mean (B) and (D). Yellow color represents lightning strikes over observed locations.
Figure 3.
OLR (W/M2) vs total Lightning (strikes) in 24 hours on June11, 2023 and Sep 29, 2023 before K-mean (A) and (C) and after K-mean (B) and (D). Yellow color represents lightning strikes over observed locations.
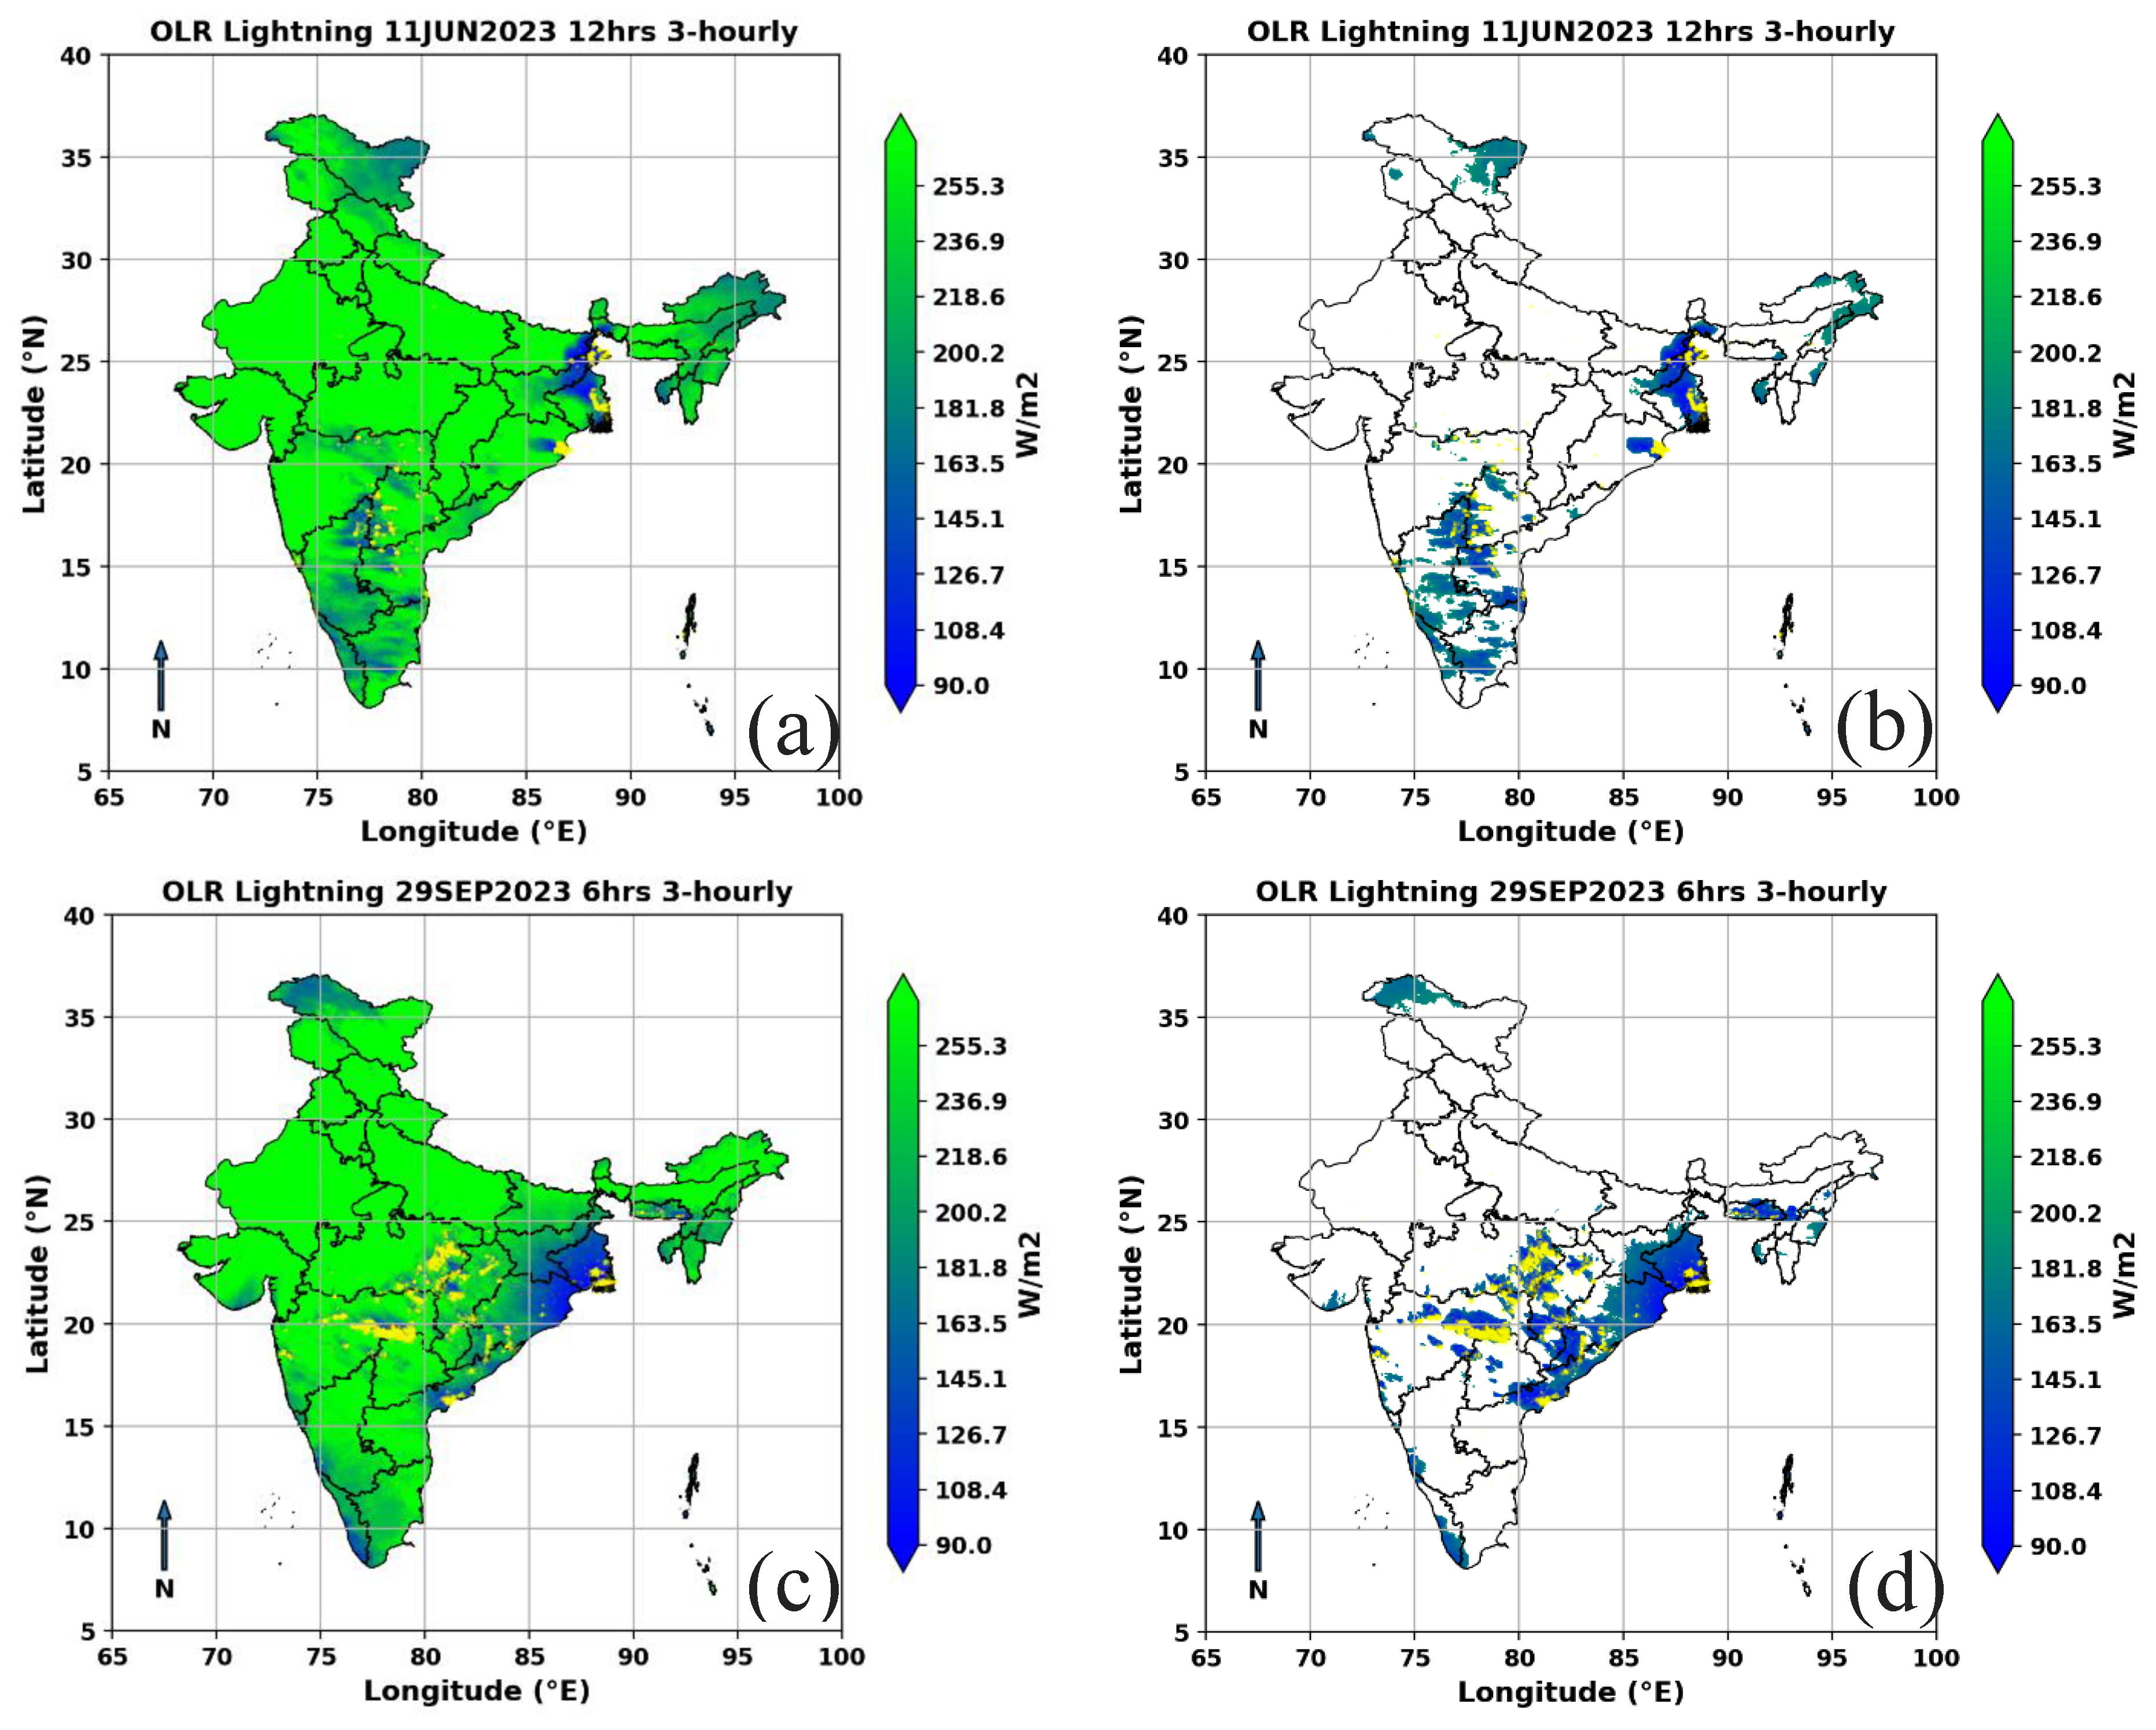
Figure 4.
3-hourly moving mean time series of OLR, LST and Winds vs Lightning strikes for March, April, May, June, July, August, September in 2023 (a-g) over Indian Region.
Figure 4.
3-hourly moving mean time series of OLR, LST and Winds vs Lightning strikes for March, April, May, June, July, August, September in 2023 (a-g) over Indian Region.
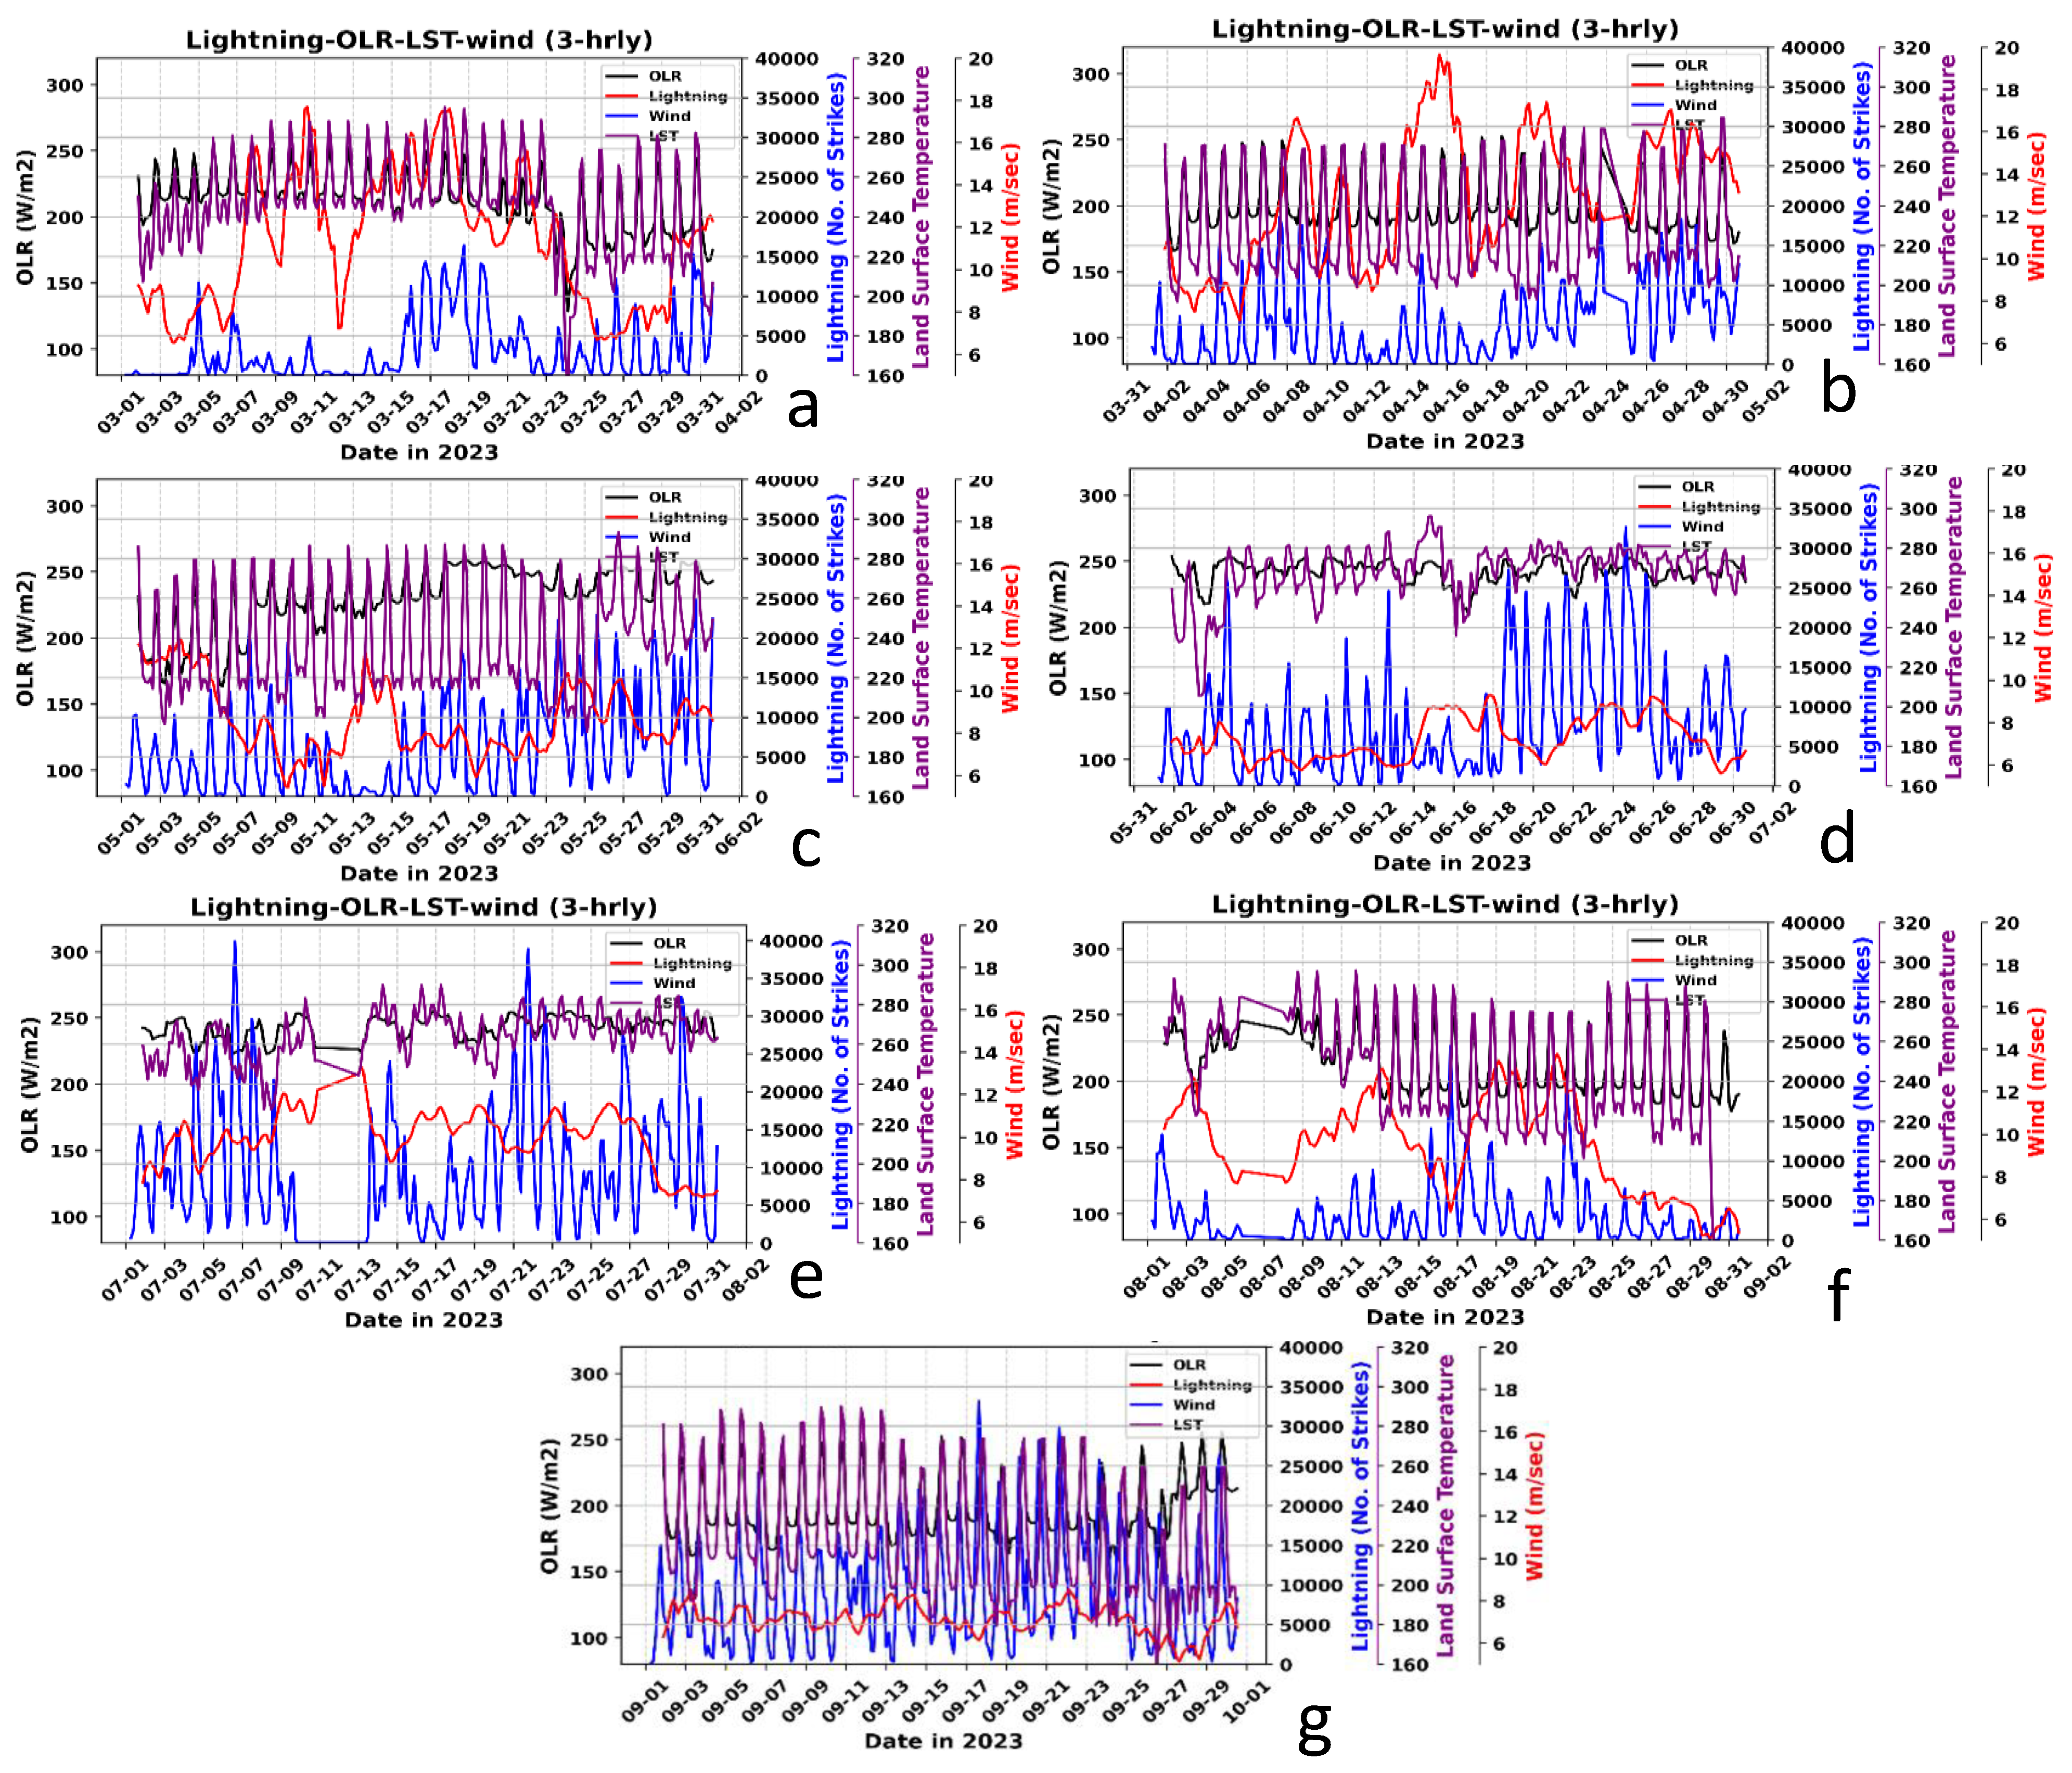
Figure 5.
24hour Cross-Correlation of OLR (a), LST (b) and Winds (c) with Lightning for March-Sep, 2023.
Figure 5.
24hour Cross-Correlation of OLR (a), LST (b) and Winds (c) with Lightning for March-Sep, 2023.
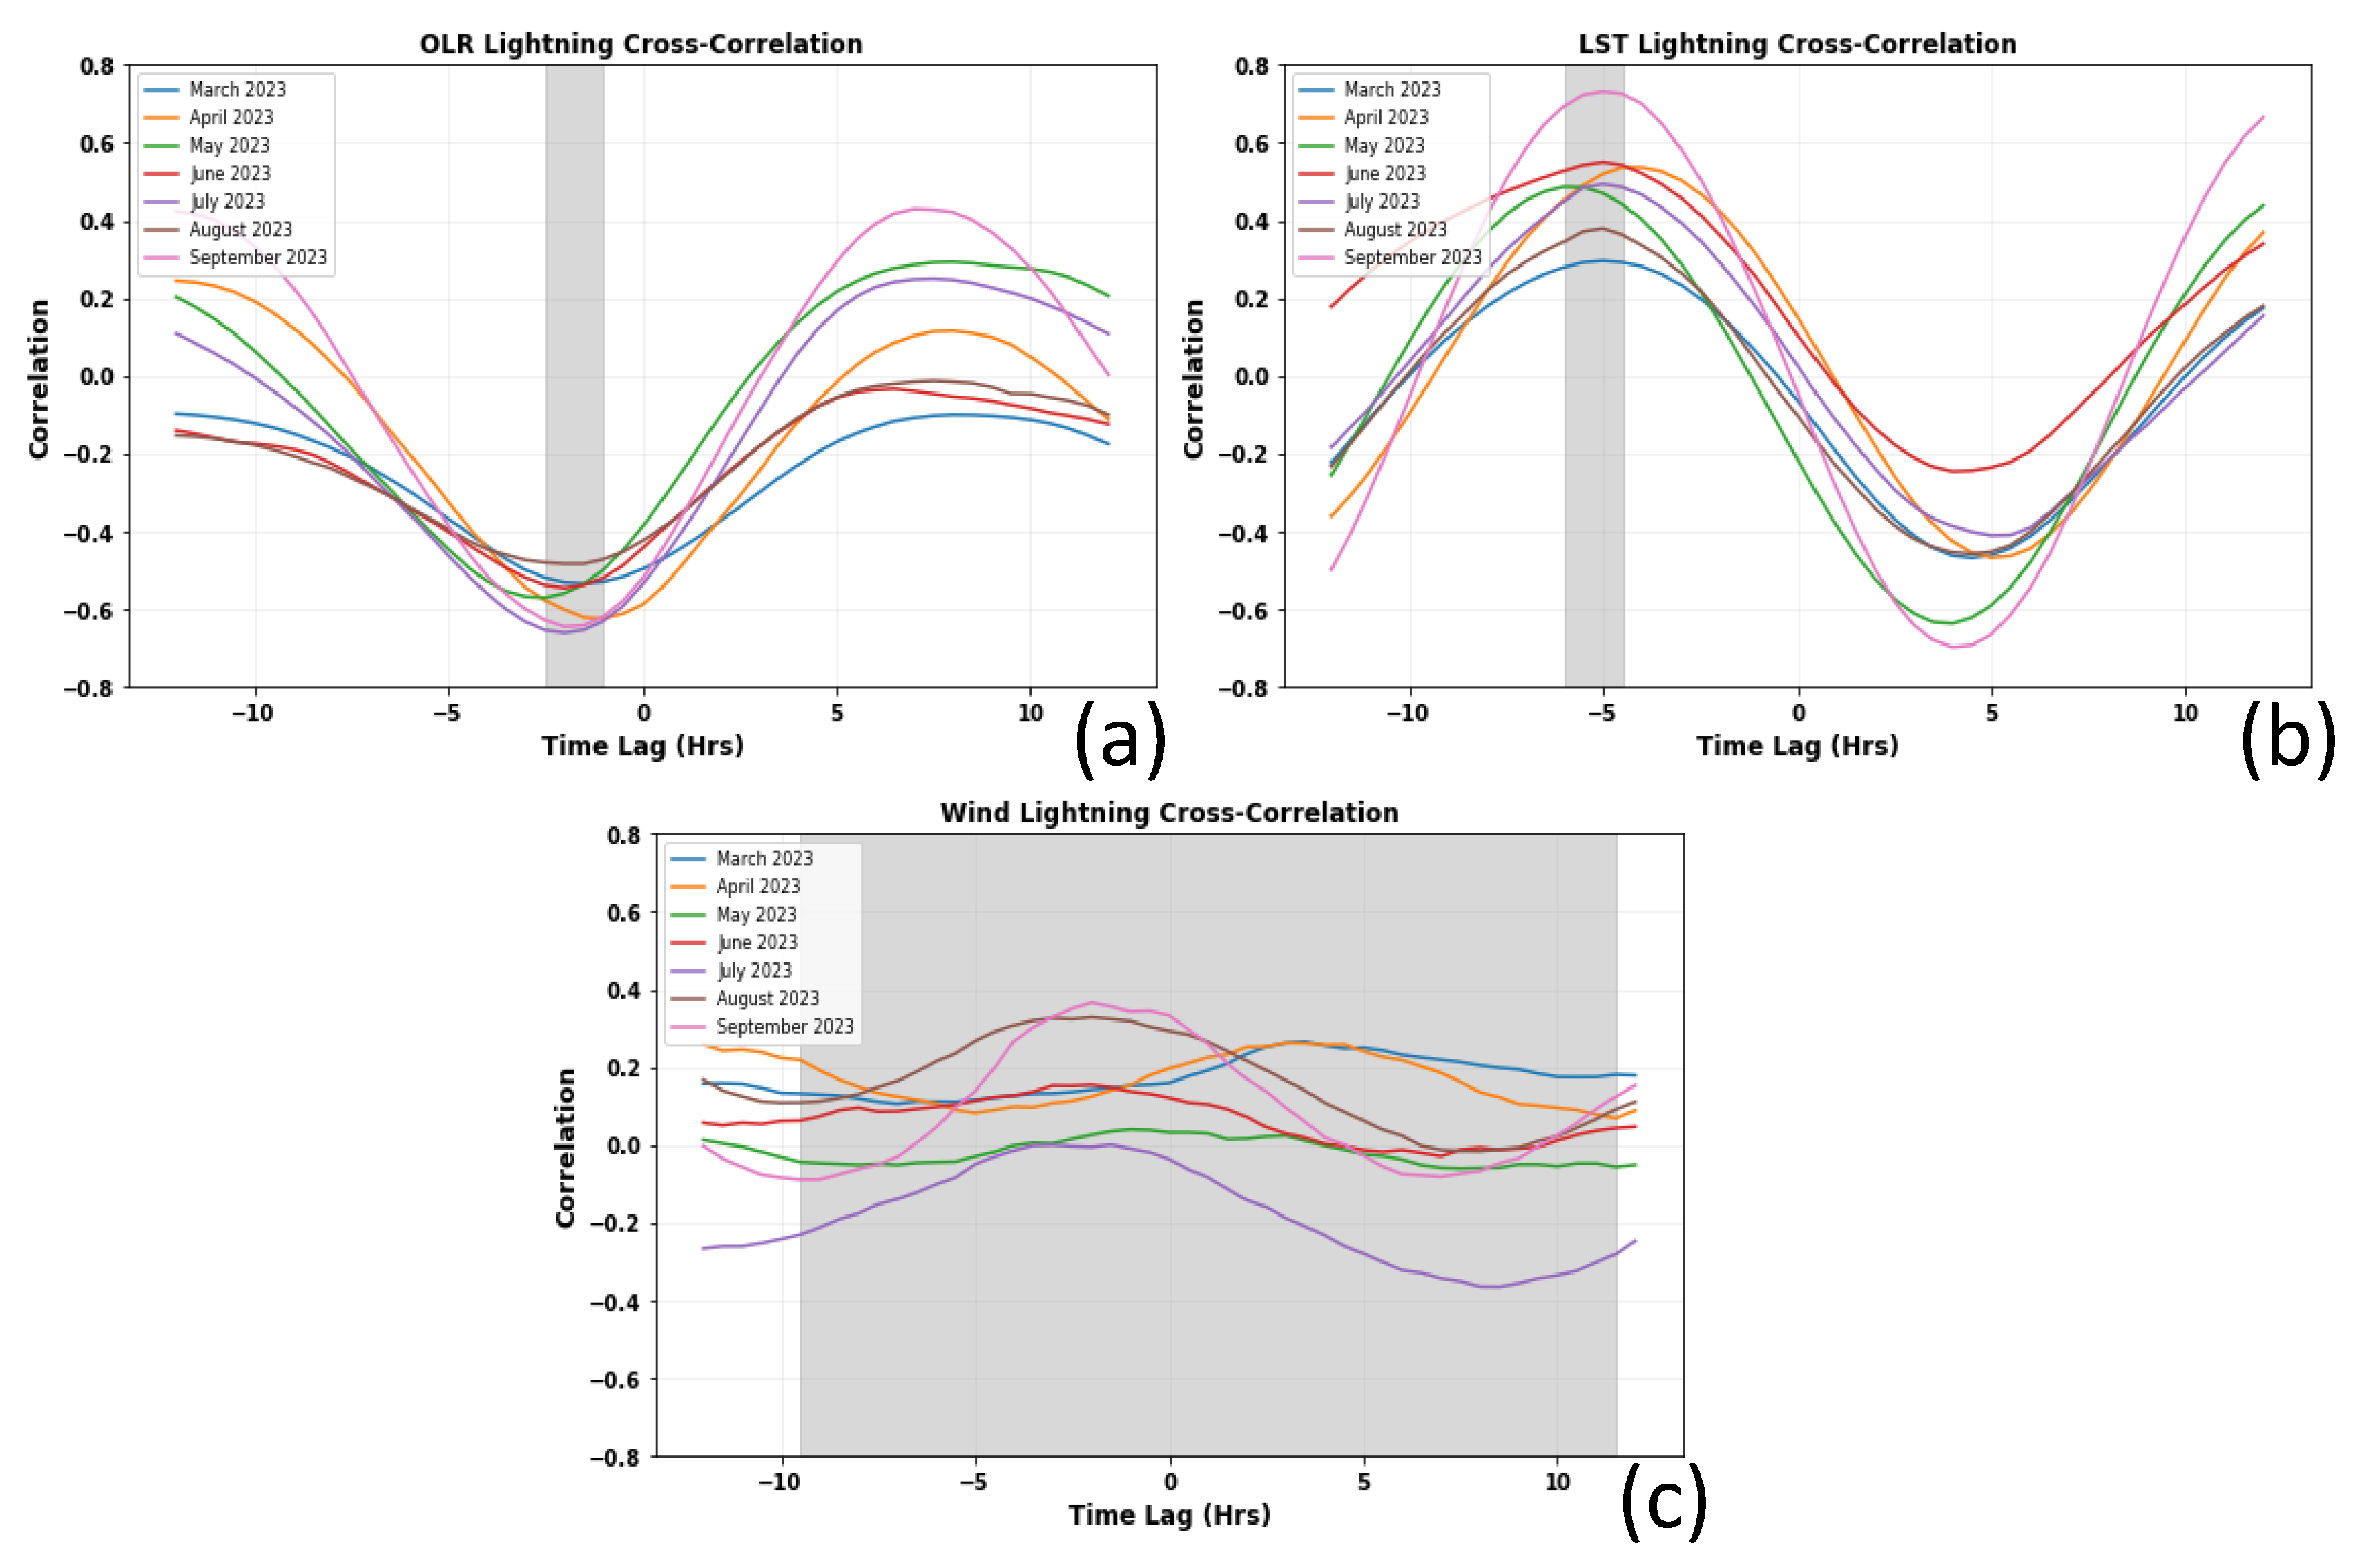
Figure 9.
Comparison of LDSN lightning strike (Ltn counts, no. of strikes) with predicted combined variable (Predicted Var, unitless) and Electric Field Mill Data (EFieldMill, KVolt/m) on 23 Aug, 2023.
Figure 9.
Comparison of LDSN lightning strike (Ltn counts, no. of strikes) with predicted combined variable (Predicted Var, unitless) and Electric Field Mill Data (EFieldMill, KVolt/m) on 23 Aug, 2023.
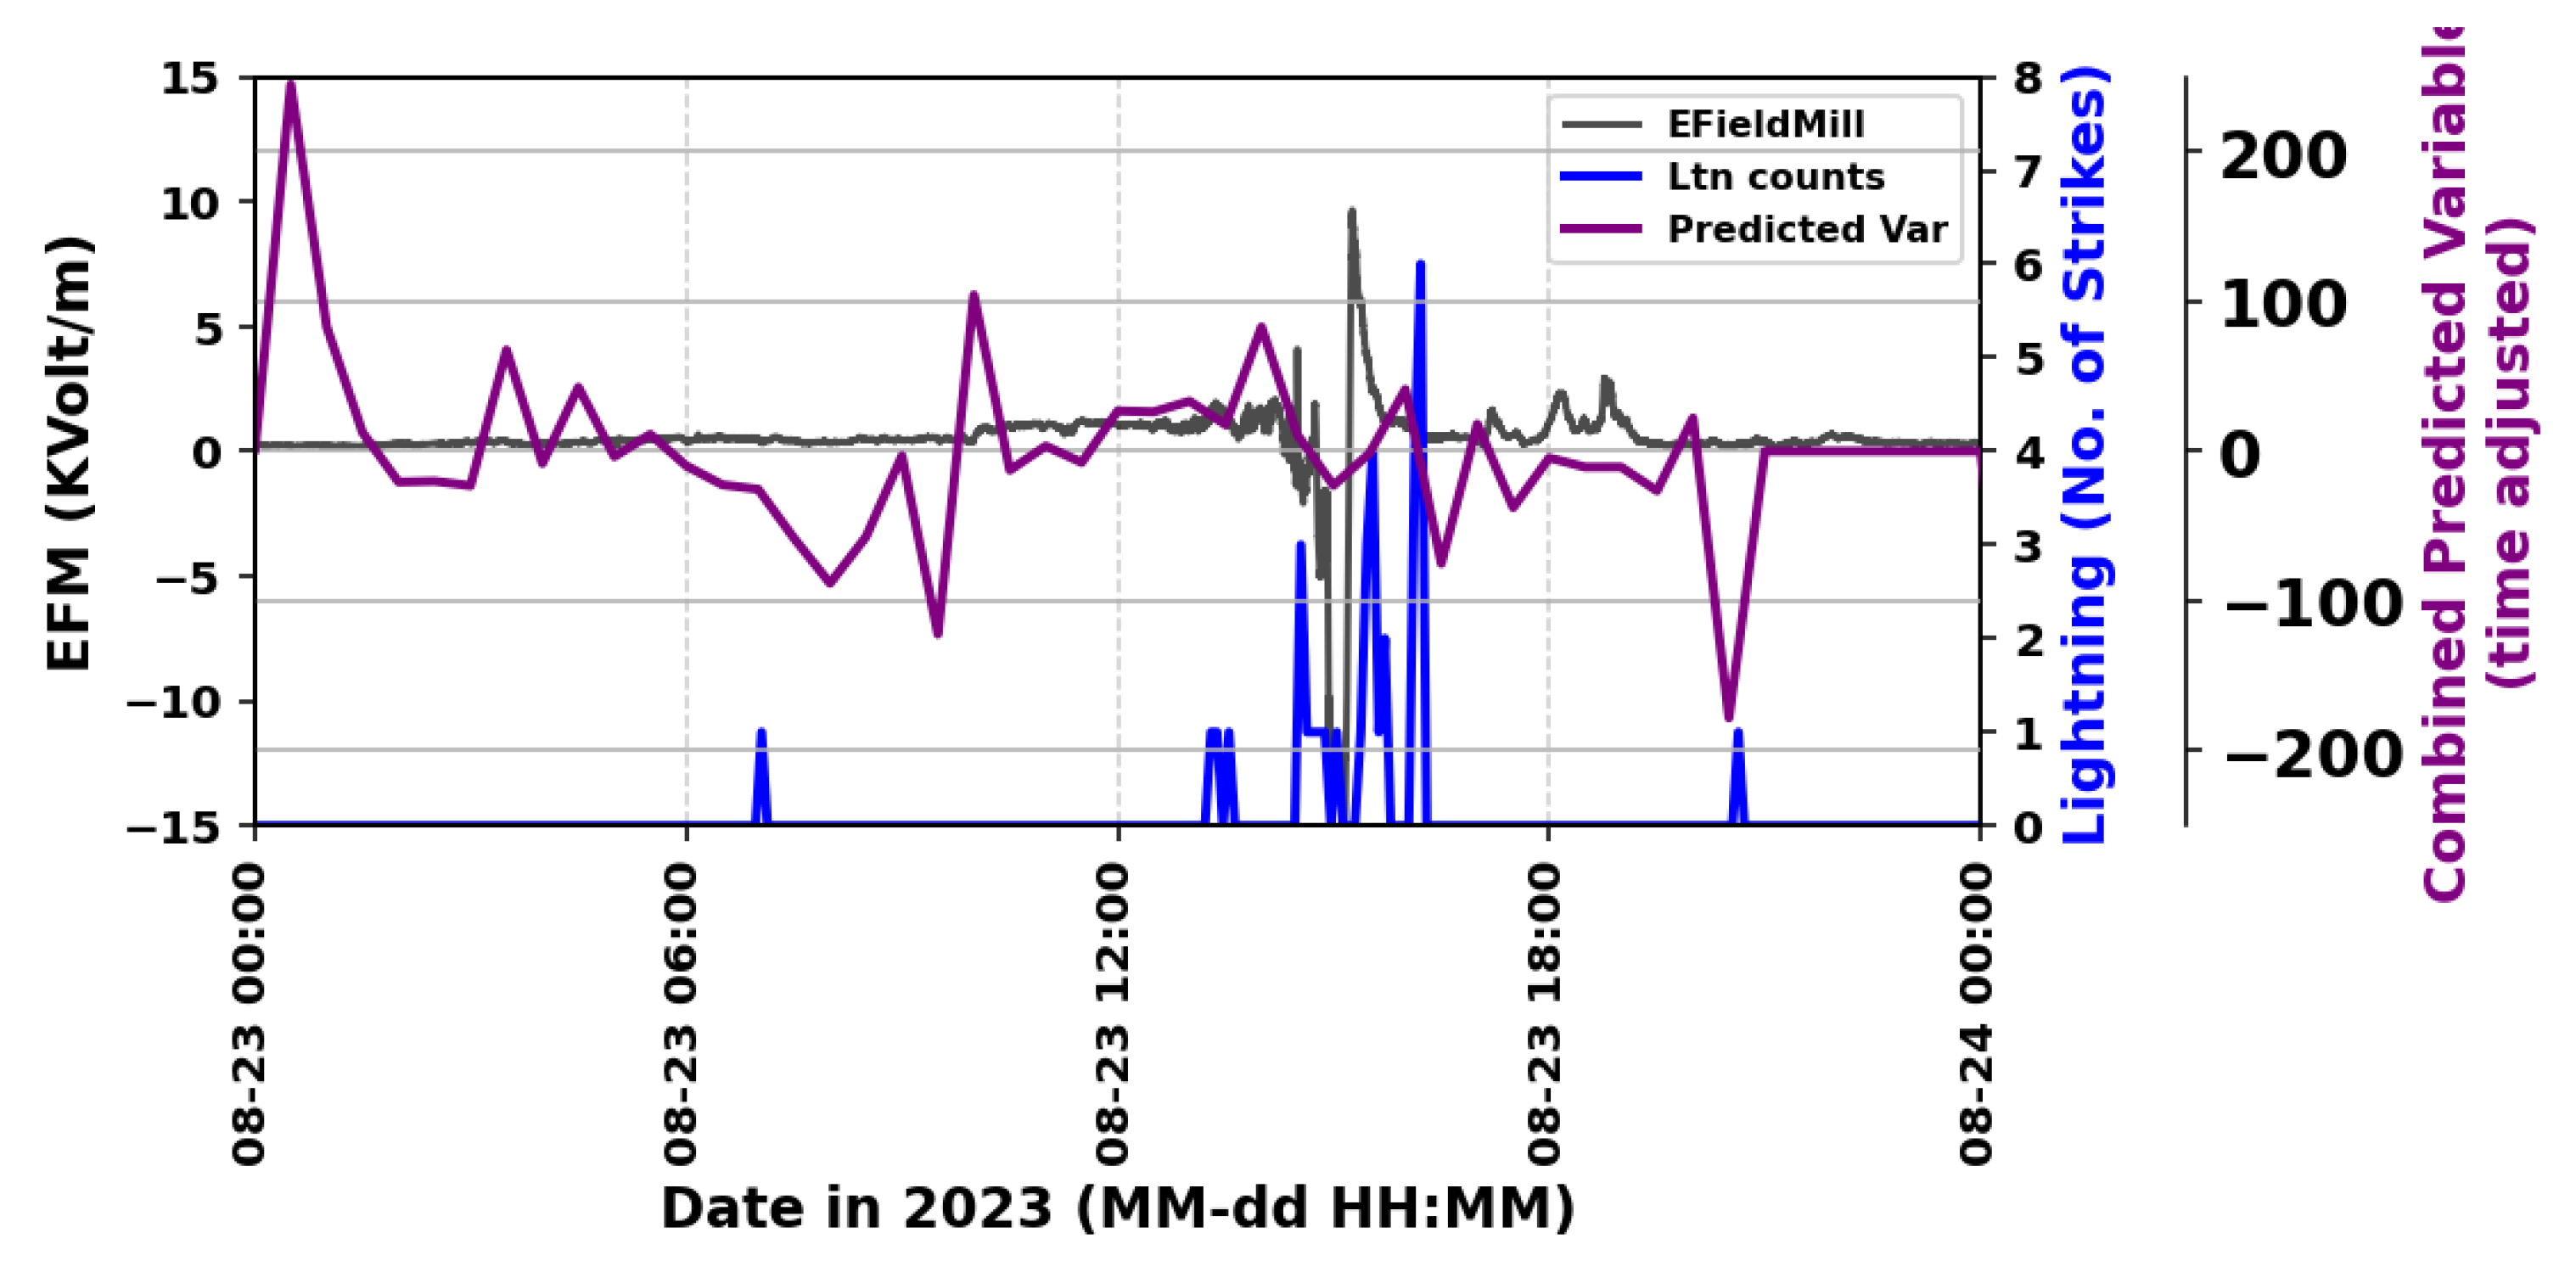

Table 1.
Maximum correlation and corresponding time lags for cross-correlation analysis of OLR, LST and Winds vs Lightning for March-September 2023.
Table 1.
Maximum correlation and corresponding time lags for cross-correlation analysis of OLR, LST and Winds vs Lightning for March-September 2023.
| OLR | LST | Wind | ||||
| Month (2023) | Correlation | Time Lag (Hrs) | Correlation | Time Lag (Hrs) | Correlation | Time Lag (Hrs) |
| March | -0.53604 | -3 | 0.296044 | -5 | 0.265402 | -7 |
| April | -0.62624 | -2 | 0.536538 | -4.5 | 0.262086 | 11.5 |
| May | -0.57222 | -5 | 0.486151 | -6 | 0.038604 | 7.5 |
| June | -0.54725 | -4 | 0.549293 | -5 | 0.15396 | 7 |
| July | -0.66258 | -4 | 0.492955 | -5 | -0.00039 | 8.5 |
| August | -0.48491 | -4 | 0.378641 | -5 | 0.327874 | 8 |
| September | -0.64709 | -4 | 0.731527 | -5 | 0.365462 | -9.5 |
Disclaimer/Publisher’s Note: The statements, opinions and data contained in all publications are solely those of the individual author(s) and contributor(s) and not of MDPI and/or the editor(s). MDPI and/or the editor(s) disclaim responsibility for any injury to people or property resulting from any ideas, methods, instructions or products referred to in the content. |
© 2024 by the authors. Licensee MDPI, Basel, Switzerland. This article is an open access article distributed under the terms and conditions of the Creative Commons Attribution (CC BY) license (http://creativecommons.org/licenses/by/4.0/).
Copyright: This open access article is published under a Creative Commons CC BY 4.0 license, which permit the free download, distribution, and reuse, provided that the author and preprint are cited in any reuse.


