
Submitted:
20 December 2024
Posted:
23 December 2024
You are already at the latest version
Abstract
This study had two primary objectives (1) to determine relative differences in soil infiltrability in thicketized oak woodlands; and (2) to compare the effectiveness of three infiltration measurement techniques—rainfall simulation, the Automated Simplified Steady Beerkan Infiltration (SSBI) method, and measurement by Saturo dual-head infiltrometer. Consistent with past studies in woody-plant-encroached rangelands, we found significantly higher infiltrability in the thicketized woodlands, with the greatest differences in areas characterized by clay soils and moderate grazing. With respect to measurement techniques, we found significant differences related to their unique strengths and limitations. Infiltrability results from rainfall simulation exhibited less variability than either the SSBI or the Saturo method, with coefficients of variability ranging from 15.5% to 54.3%. In addition, rainfall simulation was better able to detect differences in infiltrability between adjacent woodland and grassland sites. Infiltrability values and variability were both significantly higher with the Saturo method than with either of the other two, which did not differ significantly from one another (p = 0.627). Although rainfall simulation is probably the gold standard for determining soil infiltrability, it is labor-intensive and resource-demanding. The Saturo infiltrometer has the advantage of automated measurements, but it is bulky and prone to malfunctions. In contrast, the Automated SSBI method strikes a practical balance between efficiency and reliability, enabling multiple replicates with minimal water usage. Our findings have twofold importance: first, they demonstrate that thicketization of oak savannas results in higher soil infiltrability; and second, they demonstrate that the SSBI methodology is a suitable substitute for rainfall simulation for determining soil infiltrability.
Keywords:
woody plant encroachment
; soil infiltrability
; field saturated hydraulic conductivity
; Post Oak Savanna
; Oak Woodlands
1. Introduction
Thicketization is a form of woody plant encroachment (WPE) that over time leads to the closing of woody plant canopies. It is a common process in oak woodlands and savannas in the central and eastern United States [1] that has been facilitated and accelerated by a combination of fire suppression and agricultural land abandonment [2,3]. It is especially prevalent in the Post Oak Savannah ecoregion of Texas, with the expansion of understory shrubs such as Yaupon (Ilex decidua, Ilex vomitoria) as well as of eastern red cedar trees (Juniperus virginiana) [4].
The impact of thicketization on the hydrological aspects of oak woodlands has received relatively little attention. What work has been done suggests that the impact is significant. For example, in the Cross Timbers region of Oklahoma, field and modeling work has demonstrated that thicketization will lead to significant decreases in both groundwater recharge [5] and streamflows [6,7]. Similarly, Basant et al. [2] found that in sites overlying the regionally important Carrizo–Wilcox Aquifer, groundwater recharge was effectively eliminated in thicketized woodlands, whereas in open areas annual recharge rates ranging from 3 to 18 cm were recorded.
One of the most important soil attributes that affect the water cycle is the ability to absorb water. This attribute, often referred to as soil infiltrability, or field saturated hydraulic conductivity (Kfs), is influenced by many factors—including soil texture, organic matter content, and soil water repellency or hydrophobicity [8]. Soil physical properties such as bulk density, porosity, water retention capacity, and aggregate stability play crucial roles in the infiltrability of soils. Changes in vegetation cover can alter these properties, consequently altering infiltration rates and related processes such as soil water storage, groundwater recharge, and streamflow [9].
With respect to how WPE may influence soil infiltrability, it has been broadly reported that in general, soil infiltrability and soil macroporosity are higher under trees or shrubs than in adjacent open areas [10,11,12]—most likely owing to root activity and the incorporation of organic matter [10]. To date, little if any work has evaluated the influence of thicketization on soil infiltrability in the Post Oak Savanna. However, in the Cross Timbers region of Oklahoma, which is ecologically similar, Zou et al. [7] found that soil infiltrability was three times higher under eastern red cedar canopies than in open grasslands.
Various methods have been developed to determine soil infiltrability in a variety of settings—the most commonly employed being rainfall simulators and ring infiltrometers [13]. Each method offers advantages and limitations in measuring soil water dynamics and providing data useful for understanding the underlying processes. Rainfall simulators, for example, provide information not only on soil infiltrability at the plot scale [14,15], but also on runoff and soil erosion rates [16,17,18]. Because rainfall simulation is generally applied to areas larger than those for which ponding methods are used, it is better able to capture the spatial variability of surface and subsurface conditions (such as macropores). At the same time, rainfall simulation often requires heavy equipment, large amounts of water, and more than one operator—factors that can make multiple measurements difficult. Ring infiltrometers can be a practical alternative, but when measurements are performed manually, this method can also be time-consuming [19].
Additionally, different techniques can yield contrasting results. Many studies have compared various methods [19,20], but the conclusions drawn are often contrasting and highly site-specific [13]. These studies provide valuable insights into how infiltration measurements obtained via different techniques are influenced by soil differences—but research comparing these techniques across a range of soil types and plant communities remains remarkably scarce. For example, to our knowledge no studies have compared different measurement techniques in woodland and grassland areas with different soil textures. Thus, there is a substantial gap in our understanding of how different vegetation covers and natural landscapes influence the performance and accuracy of each. Such comparative studies are crucial for addressing this gap and enabling us to select appropriate techniques in varying environmental conditions.
Our study had two primary objectives: (1) to determine the extent, if any, to which thicketization of oak savannas and woodlands may alter soil infiltrability; and (2) to compare three different methodologies for estimating soil infiltrability, each of which has distinct advantages and disadvantages. The three methodologies we compared are rainfall simulation with a drip rainfall simulator [21], the Automated Simplified Steady Beerkan Infiltration (SSBI) method, employing a constant-head infiltrometer [22], and measurement via a Saturo dual-head infiltrometer (Meter Group Inc., Pullman, WA, USA). Figure 1 shows photographs of the three methodologies deployed in two different vegetation cover settings.
2. Study Sites
This research was conducted at three sites, each representing a different soil type (clay, loamy sand, and sandy) and each consisting of paired grassland and woodland covers. The clay site was located at the Texas A&M University Beef Cattle Center in College Station, Texas (30° 32’ 49” N, 96° 25’ 03” W, 68 m above sea level); the loamy-sand site was located at the Texas A&M University Ecology and Natural Resources Teaching Area in College Station, Texas (30° 34’ 39” N, 96° 21’ 04” W, 88 m above sea level); and the sandy site was located at the Gus Engeling Wildlife Management Area, 32 km northwest of Palestine, Texas (31° 56’ 21” N, 95° 53’ 45” W, 104 m above sea level). The average annual temperature and precipitation are 21°C and 1011 mm, respectively, at the clay and loamy-sand sites, and 19.6°C and 1083 mm, respectively, at the sandy site (National Oceanic and Atmospheric Administration, 2024). All sites are located within the Post Oak Savannah ecoregion of Texas and have a humid, subtropical climate.
The overstory component of the woodland zones at all three sites is dominated by Post oak (Quercus stellata), blackjack oak (Quercus marilandica), winged elm (Ulmus alata), and a few large individuals of Eastern redcedar (Juniperus virginiana). The dense shrub understory consists mainly of encroaching species—Yaupon holly (Ilex vomitoria), the exotic Chinese privet (Ligustrum sinense), and young individuals of Eastern redcedar. The little herbaceous cover in the woodland zones is mostly C3 grasses such as Inland sea oats (Chasmanthium latifolium) and a few forb species.
The grassland zones at the loamy-sand and sandy sites are dominated by native C4 grasses, including Little bluestem (Schizachyrium scoparium) and Switchgrass (Panicum virgatum), and many forb species. Neither of these sites has any recent history of grazing. At the clay site, the grassland zones are composed mainly of the introduced bermudagrass (Cynodon dactylon). This site experiences rotational grazing annually at relatively low stocking densities (approximately 1 animal unit/ha).
3. Materials and Methods
3.1. Experimental Design
At each site and within each cover type, we selected five measurement locations, spaced three meters apart along a linear transect. The transects for grassland and woodland zones were drawn parallel to each other and approximately 10 meters from the boundary separating the two cover types. At each measurement location, a 65-cm x 65-cm runoff plot was established, enclosed by galvanized steel sheets inserted to a shallow depth (approximately 5 cm), for the rainfall simulations. After the simulations had been completed, two corners of the plot were randomly selected for infiltrability measurements with the Automated SSBI method, and a third corner was chosen for measurements with the Saturo infiltrometer (Figure 2).
3.2. Infiltrability Methods and Instruments
3.2.1. Rainfall Simulation Method
We utilized a drip-type rainfall simulator that has been widely employed by previous researchers [23,24,25,26] and is described in detail by Blackburn et al. [21]. The simulator is placed approximately 40 cm above the soil surface and delivers droplets of water to a 90-cm by 90-cm surface area at a maximum rate of 154 mm h-1. At each measurement location, we conducted a rainfall simulation over the 65-cm x 65-cm plot. Because we expected some high infiltrability, especially in the woodland zones, we applied the maximum rainfall intensity of 154 mm h-1 in order to maximize the chances of obtaining runoff. Runoff was collected for 30 seconds immediately after it commenced, followed by 30-second collections every 5 minutes until four consecutive runoff volumes were approximately the same. These four volumes were averaged to calculate a terminal runoff value, which was then subtracted from the rainfall intensity to obtain the steady-state infiltration rate [27,28]. The steady-state infiltration rate can be considered an approximation of the soil’s infiltrability, or field saturated hydraulic conductivity (Kfs; mm h-1) [27], particularly under the assumption that lateral matrix flow is negligible owing to the buffering effect created by water falling outside the plot [29].
3.2.2. Automated Simplified Steady Beerkan Infiltration (SSBI) Method
The automated infiltrometers described in Leite et al. [22] were used to determine field saturated hydraulic conductivity (Kfs), a widely used measure for assessing soil infiltrability for different vegetation covers [10,23,30]. The Kfs values were calculated from steady-state infiltration rates obtained via the SSBI method [31]. A 10-cm-diameter ring was inserted to a depth of 1 cm and the infiltrometers (see Figure 1b), filled with 2.2 liters of water, were used to sustain a hydraulic head of about 1 cm within the ring. The test was conducted for a period of 60 minutes or until all water drained from the infiltrometer. Pressure readings were recorded every five seconds by a HOBO U20 datalogger (Onset, Bourne, MA, USA) and were subsequently used to generate cumulative infiltration curves via the calibration function provided in Leite et al. [22]. Steady-state infiltration rates (is; mm h-1) were then derived from the linear (stable) segments of the infiltration curves and used to calculate Kfs (mm h-1) according to Bagarello et al. [31] as follows:
where r denotes the radius of the ring in millimeters, and are dimensionless constants, and a* is an empirical parameter that captures the effects of gravitational and capillary forces. We adopted an a* value of 0.012 mm, which is considered a good approximation for most soils [31]. We performed two tests per plot at least one week after the rainfall simulations. The Kfs values for each plot represent the average of these two measurements.
3.2.3. Saturo Method
A Saturo dual-head infiltrometer (Meter Group Inc., Pullman, WA, USA) with a 15.2-cm-diameter ring and a 5-cm insertion depth was employed to measure Kfs at one point per plot (Figure 1c). This methodology has been broadly applied for determining soil infiltrability in a number of settings [32,33]. Comparisons with other head-based methods have indicated comparable results [34].
The instrument is fully automated and allows for setting different configurations—such as pressure heads, soak and hold times, and number of pressure cycles. We used pressure heads of 10- and 100-mm H2O, a soak time and hold time of 10 minutes, and three pressure cycles, for a total test duration of 70 minutes.
The final Kfs value is calculated by means of the simplified version of the two-ponding head technique developed by Reynolds and Elrick [35], as follows:
where D1 represents the higher-pressure head (mm H2O), D2 denotes the lower pressure head (mm H2O), and Δ is calculated as 0.993 times the ring insertion depth (mm) plus 0.578 times the ring radius (mm). The variables i1 and i2 are the steady-state infiltration rates (mm h−1) at D1 and D2,respectively.
3.3. Additional Data
For each test, we also collected 5-cm-diameter soil cores at the 0- to 5-cm and 5- to 10-cm depth intervals for measuring bulk density via a standard oven-drying technique (105ºC for 48 h). After the rainfall simulations and prior to the other infiltration tests, we collected all the live (clipped at ground level) and dead plant tissues from the surface of each plot to determine live and dead plant biomass. The samples were taken to the laboratory and oven- dried at 65ºC for 48 h.
3.4. Data Analysis
Infiltrability differences between land cover types (woodland vs. grassland) for the three sites (clay soil, loamy-sand soil, and sandy soil) were tested using t-tests, and comparisons of the three measurement methodologies were analyzed with one-way ANOVA and Tukey’s HSD post-hoc test. Prior to these tests, skewness and heteroscedasticity were taken into account by the application of log transformations that met parametric assumptions. We then conducted paired t-tests to assess whether, across all sites and treatments, the infiltrability values obtained from the Automated SSBI and Saturo methods differed significantly from those obtained via rainfall simulation. Finally, we conducted simple linear regressions to evaluate how vegetation biomass (live and dead) and bulk density correlated with infiltrability values obtained with each method. All analyses were performed using R version 4.4.1.
4. Results
4.1. Rainfall Simulation Method
The results obtained with the rainfall simulator showed significantly higher infiltration rates for the thicketized woodland zones than for the grassland zones at all three sites (clay, loamy sand, and sandy) (Figure 3, Table 1). Specifically, at the clay-soil sites, mean infiltrability values in the WPE-affected zones we an order of magnitude higher than those in the grassland zones; and at the loamy-sand and sandy-soil sites they were more than twice as high as those in grassland zones. At the sandy site, infiltrability for the thicketized woodland exceeded rainfall intensity (154 mm h-1) in four of the five plots. The mean from the rainfall simulation is likely underestimated, as there was no runoff from those four plots, even at the maximum simulated rainfall intensity of 154 mm h⁻¹. For this reason, statistical comparisons between methodologies were not performed for the woodland tests at this site.
4.2. Automated SSBI Method
With the Automated SSBI method, we found significantly higher infiltrability for the woodland-cover zones than for the grassland-cover zones at the clay- and sandy- soil sites, but no significant difference at the loamy-sand site (Figure 4, Table 1). For the clay and sandy soils, mean infiltrability in woodland zones was an order of magnitude higher than in grassland zones.
4.3. Saturo Method
Measurements with the Saturo infiltrometer indicated higher median infiltrability in thicketized woodlands for the clay- and sandy-soil sites (Figure 4) but in both cases the difference was not significant (Table 1) because of the higher variability of this instrument. Similarly, for the grassland zone at the clay-soil site, the Saturo-obtained mean infiltrability was an order of magnitude higher than those obtained with the other two methods; and for the grassland zone at the sandy-soil site, the Saturo-obtained mean value was five times higher than that obtained via rainfall simulation and eight times higher than that obtained with the Automated SSBI method (Table 1).
4.4. Variability Among Methodologies
With respect to variability, rainfall simulation generally showed the least of the three methods. Coefficients of variability (CV) ranged from 15.5% to 54.3% for the rainfall simulator, from 15.6% to 128.9% for the Automated SSBI, and from 39.3% to 152.5% for the Saturo. At the same time, differences in variability were significant only for the grassland-cover zone of the sandy-soil site (Levene’s test p-value = 0.016), where the Automated SSBI method showed the lowest coefficient of variability (15.6%) and the Saturo showed the highest (75.3%).
When we compared the rainfall simulation and Automated SSBI infiltrability values for all sites and both cover types, the paired t-test yielded a t-value of -0.49, a p-value of 0.627, and a mean difference of -5.42 mm h⁻¹. In other words, there was no significant difference between the two methods. Conversely, when we compared the rainfall simulation and the Saturo methods in the same way, the paired t-test revealed a significant difference (t = 2.15, p = 0.041), with the Saturo method producing higher infiltrability values on average (mean difference = 34.28 mm h⁻¹). In other words, the Saturo method may overestimate infiltrability relative to rainfall simulation.
4.5. Influence of Biomass and Bulk Density on Infiltrability
With respect to the influence of biomass on infiltrability, we found that the rainfall simulation and Automated SSBI methods both indicated a significant negative correlation (adj R2 = 0.32, p < 0.001 and adj R2 = 0.28, p = 0.002, respectively) between live biomass and infiltrability (Figure 5)—which suggests that higher live biomass was associated with reduced infiltration rates. The Saturo method, however, showed an insignificant correlation (adj R2 = -0.03, p < 0.874), indicating that this method was less sensitive to changes in live biomass. Additionally, both the rainfall simulation (adj. R² = 0.74, p = 0.001) and the Automated SSBI (adj. R² = 0.46, p < 0.001) methods showed strong positive correlations between dead biomass and infiltrability, suggesting that an increase in dead biomass significantly enhances soil infiltration. This effect is likely due to decomposed organic matter and aggregate breakdown, which slow runoff and facilitate infiltration. The Saturo method, on the other hand, showed a result similar to that regarding live biomass. i.e., no significant relationship between dead biomass and infiltrability (adj. R² = 0.02, p = 0.213).
Finally, with respect to the effects of bulk density on infiltration, both rainfall simulation and the Automated SSBI method yielded significant negative correlations, on the basis of measurements at two depth intervals (0–5 cm and 5–10 cm). For the 0- to 5-cm depth, the adjusted R² values for rainfall simulation and for Automated SSBI were, respectively, 0.25 (p = 0.003) and 0.65 (p < 0.001); and in the 5- to 10-cm depth, they were 0.37 (p < 0.001) and 0.65 (p < 0.001)—implying that higher bulk density reduces infiltrability, likely via reduction of pore space due to compaction. In contrast, the Saturo method showed non-significant relationships at both the 0- to 5-cm and 5- to 10-cm depths, with adjusted R² values of -0.08 (p = 0.067) and -0.04 (p = 0.166), respectively.
5. Discussion
We designed this study with two objectives in mind. The first was to evaluate differences in soil infiltrability in thicketized woodlands vs more open grasslands in the Post Oak Savannah, and the second was to compare three field-based methods for determining soil infiltrability.
5.1. Effects of Thicketization on Soil Infiltrability
We found that regardless of soil texture, soil infiltrability was higher in thicketized woodlands than in open grasslands. This finding is based primarily on the results obtained via rainfall simulation, which (as we explain below) we consider the gold standard for determining soil infiltrability. At the same time, this finding is generally supported by the other methodologies we tested as well.
Higher infiltrability in the thicketized woodland zones is broadly consistent with what has been demonstrated elsewhere [10,11,12]. The closest comparison to our site would be the Cross Timbers region, where juniper is encroaching upon grasslands and open woodlands. As noted previously, Zou et al [7] found that infiltrability was three times higher in juniper-encroached areas than in open grasslands—most likely as a result of the addition of organic matter from leaf litter. As shown in Figure 5, soil infiltrability at our sites was highly correlated with dead biomass or leaf litter, a finding that also aligns with numerous other studies reporting that litter enhances soil infiltrability [36,37]. The lower bulk densities for soils in thicketized areas (Figure 5) are also likely a reflection of additions of organic matter. The negative relationship between bulk density, which is an expression of soil compaction, and soil infiltrability has been shown repeatedly [10,14,38].
One counter-intuitive result that we found was a negative correlation between infiltrability and live biomass (Figure 5). For the thicketized zones, the fact that there was relatively little live biomass on the ground surface compared with the grassland zones explains the negative correlation. At other locations, grass biomass has been positively correlated with soil infiltrability [14]. It is unlikely that live biomass reduces infiltrability, although findings from some studies have suggested that the dense root systems associated with high levels of herbaceous cover may contribute to reduced free pore spaces, which impedes the movement of water into the soil [39].
5.2. Comparison of Methodologies
Rainfall simulators have been widely used to measure surface runoff and infiltration rates across different land uses and vegetation covers. As noted above, rainfall simulation is often considered the gold standard for determining soil infiltrability [40,41,42] because it is more comparable to natural rainfall than ponding methods; its gradual wetting of the soil avoids problems such as air entrapment and rapid soil slaking [43]. Another advantage over ring infiltration methods is that rainfall simulations are normally performed over a larger soil surface, enabling them to capture greater spatial variability of factors that influence infiltrability (e.g, microtopography and infiltration hotspots such as soil macropores. The net result is less variability in infiltrability values [41,44]. In the case of our study, the larger measurement area of the rainfall simulations offers a plausible explanation for the generally higher values than those obtained with the Automated SSBI method and the lower variability in values than observed with both the SSBI and Saturo methods.
Some types of rainfall simulators attempt to mimic natural rainfall events to take into account the effect of raindrops’ kinetic energy on aggregate breakdown and soil sealing. In our study, we opted to perform simulations from a short distance above the soil to make results more comparable with those obtained by the two ring infiltrometers. Nonetheless, one potential reason for differences between the rainfall simulation results and those of the other methods could be the protective effect of leaf litter and herbaceous cover. Because leaf litter and herbaceous cover—which are known to protect the soil against surface sealing by soil aggregate breakdown [45]— were removed for the infiltration tests with the Automated SSBI and Saturo infiltrometers, only the rainfall simulations would have benefited from this protective effect. This could partially explain why the infiltrometers generally yielded lower infiltrability values, especially for the loamy-sand and sandy soils. Previous studies have demonstrated that surface sealing can lead to major reductions in infiltrability measured with infiltrometers [28,46,47], and that the effect can be accentuated for coarser-textured soils (which tend to have lower aggregate stability than finer- textured soils) [19]. In addition, protocols for the use of ring infiltrometers usually recommend removal of plant matter from inside the rings [48].
Consistent with what has been found elsewhere, the Saturo method generally yielded higher infiltrability values than the other methods [34]. This difference could be explained by the methodological approach of the Saturo. In contrast to rainfall simulation and the Automated SSBI method, with which ponding and water-pressure heads are mostly negligible, the Saturo requires at least one relatively high-pressure head (10 cm in our study)—which could exaggerate the role of preferential flow. Higher-pressure heads could cause water to flow to a disproportionately greater extent through preferential pathways, such as macropores or cracks in the soil, than through the soil matrix [34]. And the fact that these pathways are more common (and more stable) in finer-textured soils [32] would explain why the difference in values was particularly striking at the clay-soil site.
One drawback of rainfall simulators is that they are labor-intensive and often require large volumes of water, making them less suitable for use in areas with difficult access and limiting the number of replicates. The Saturo infiltrometer, while fully automated and capable of providing Kfs values without the need for additional data processing, shares some of these drawbacks. Like a rainfall simulator, it is relatively bulky and water-demanding, limiting its applicability in certain field situations. Additionally, the maximum rainfall intensity of simulators imposes an upper limit on measurable infiltrability values—in our case, 154 mm h⁻¹. As a result, soils with exceptionally high infiltrability, such as those observed in the woodland at our sandy site, may exceed this limit, leading to imprecise measurements and potentially undermining meaningful statistical analysis.
The Automated SSBI method offers a practical compromise between the two. Its infiltrometer is lightweight, requires less water, and produces results that fall within a range similar to those of the other two methods—while in general exhibiting better comparability with rainfall simulation than with the Saturo method. Given its single-ring infiltrometer, the SSBI method unsurprisingly exhibits more variability than does rainfall simulation; in fact, when used on clay or loamy-sand soils, its variability is similar to that of the Saturo, and when used on sandy soils can be even lower. However, because of its relatively low cost and ease of implementation, this variability can be managed effectively by increasing the number of tests per plot, enabling better capture of spatial variability across sites.
The Automated SSBI method’s ability to collect more replicates in a shorter time offers a clear advantage over both rainfall simulation and the Saturo method. The Automated SSBI infiltrometer is also more affordable and much lighter weight than the other two instruments, making it a more accessible option, particularly for studies with limited budgets and/or multiple field sites. During our study, one operator using 10 Automated SSBI infiltrometers (at the cost of a single Saturo unit) was able to collect all 20 data points per site in less than four hours. In contrast, collection of 10 data points with either the Saturo or a rainfall simulator took two days because of the time required for setup and testing. Additionally, with the Saturo device, it is crucial to monitor the equipment carefully; if the water runs out, the test can be interrupted and the results lost. In such a case, the need to repeat the test means lost time as well.
Another advantage of the Automated SSBI infiltrometer is that it requires significantly less water per test (2.2 liters or less) than either the Saturo (5–30 liters) or the rainfall simulator (60–80 liters). This reduced water requirement can be a crucial advantage in remote or water-scarce environments, where carrying large volumes of water can be impractical or impossible.
Finally, while the Saturo device automatically calculates Kfs, the Automated SSBI requires post-processing. However, this post-processing is straightforward, and codes and spreadsheets that make the calculations efficient are readily available [22].
6. Summary and Conclusion
This study compared infiltration rates determined through the use of three different measurement methodologies: rainfall simulation, the Automated SSBI method, and measurement with a Saturo dual-head infiltrometer. The tests were carried out at three experimental sites having soils of different textures (clay, loamy sand and sandy) and each having both a grassland and a woodland component. Measurements done with a rainfall simulator revealed significantly higher infiltration rates for the woodland-cover zones than for the grassland zones across all three soil types. For the woodland zones of the loamy-sand and sandy soil sites, mean infiltrability was more than double that found in the grassland zones, and for the woodland zone of the clay-soil site it was nearly ten times higher than for the grassland zone.
Differences observed among the infiltrability values obtained by the three methods were significant for the clay- and the sandy-soil sites. At the clay-soil site, the mean infiltrability value measured in the grassland zone via the Saturo method was an order of magnitude higher than those recorded with the other two methods. Conversely, at the sandy-soil site, the mean infiltrability value obtained in the grassland zone with the Automated SSBI method was five times lower than that measured via rainfall simulation and eight times lower than that measured via the Saturo method.
Infiltrability results from rainfall simulation showed less variability than either of the other methods, with coefficients of variability (CV) ranging from 15.5% to 54.3%. The Automated SSBI method had a CV range of 15.6% to 128.9%, while the Saturo method ranged from 39.3% to 152.5%. Significant differences in variability were observed only for the grassland zone of the sandy-soil site, where the Automated SSBI displayed the lowest CV (15.6%) and the Saturo the highest (75.3%).
We conclude from our findings that the Automated SSBI method presents a distinct advantage over both rainfall simulation and the Saturo method, owing primarily to its ability to collect a greater number of replicates in a shorter time, its light weight, and its lower water requirement. The differences in results among the three methods tested in this study can be related to (a) the flow geometry of the soil environment, (b) the methodologic approach, and (c) the conditions of the area where the method is applied.
References
- Scifres, C.J.; Kelly, D. Range Vegetation Response to Burning Thicketized Live Oak Savannah. Texas FARMER Collection 1979. [Google Scholar]
- Basant, S.; Wilcox, B.P.; Parada, C.; Wyatt, B.M.; Newman, B.D. Thicketized oak woodlands reduce groundwater recharge. Science of The Total Environment 2023, 862, 160811. [Google Scholar] [CrossRef] [PubMed]
- Dyksterhuis, E. The savannah concept and its use. Ecology 1957, 38, 435–442. [Google Scholar] [CrossRef]
- Olariu, H.G.; Wilcox, B.P.; Popescu, S.C. Examining changes in woody vegetation cover in a human-modified temperate savanna in Central Texas between 1996 and 2022 using remote sensing. Frontiers in Forests and Global Change 2024, 7. [Google Scholar] [CrossRef]
- Acharya, B.S.; Hao, Y.H.; Ochsner, T.E.; Zou, C.B. Woody plant encroachment alters soil hydrological properties and reduces downward flux of water in tallgrass prairie. Plant and Soil 2017, 414, 379–391. [Google Scholar] [CrossRef]
- Qiao, L.; Zou, C.B.; Will, R.E.; Stebler, E. Calibration of SWAT model for woody plant encroachment using paired experimental watershed data. Journal of Hydrology 2015, 523, 231–239. [Google Scholar] [CrossRef]
- Zou, C.B.; Turton, D.J.; Will, R.E.; Engle, D.M.; Fuhlendorf, S.D. Alteration of hydrological processes and streamflow with juniper (Juniperus virginiana) encroachment in a mesic grassland catchment. Hydrological Processes 2014, 28, 6173–6182. [Google Scholar] [CrossRef]
- Hillel, D. Soil and Water: Pysical Principles and Processes; Elsevier: 2012.
- Ding, J.; Eldridge, D.J. Contrasting global effects of woody plant removal on ecosystem structure, function and composition. Perspectives in Plant Ecology, Evolution and Systematics 2019, 39, 125460. [Google Scholar] [CrossRef]
- Leite, P.A.M.; Wilcox, B.P.; McInnes, K.J. Woody plant encroachment enhances soil infiltrability of a semiarid karst savanna. Environ. Res. Commun. 2020, 2, 12. [Google Scholar] [CrossRef]
- Van Dijk, A.I.; Keenan, R.J. Planted forests and water in perspective. 2007, 251, 1-9.
- Alaoui, A.; Caduff, U.; Gerke, H.H.; Weingartner, R. Preferential flow effects on infiltration and runoff in grassland and forest soils. Vadose Zone Journal 2011, 10, 367–377. [Google Scholar] [CrossRef]
- Thompson, S.; Harman, C.; Heine, P.; Katul, G. Vegetation-infiltration relationships across climatic and soil type gradients. Journal of Geophysical Research: Biogeosciences 2010, 115. [Google Scholar] [CrossRef]
- Wilcox, B.P.; Wood, M.K.; Tromble, J.M. Factors influencing infiltrability of semiarid mountain slopes. Journal of Range Management 1988, 41, 197–206. [Google Scholar] [CrossRef]
- Leite, P.A.M.; de Souza, E.S.; dos Santos, E.S.; Gomes, R.J.; Cantalice, J.R.; Wilcox, B.P. The influence of forest regrowth on soil hydraulic properties and erosion in a semiarid region of Brazil. Ecohydrology 2018. [Google Scholar] [CrossRef]
- Taucer, P.I.; Munster, C.L.; Wilcox, B.P.; Owens, M.K.; Mohanty, B.P. Large-Scale Rainfall Simulation Experiments on Juniper Rangelands. Transactions of the Asabe 2008, 51, 1951–1961. [Google Scholar] [CrossRef]
- Seyfried, M.S. Infiltration patterns from simulated rainfall on a semiarid rangeland soil. Soil Science Society of America Journal 1991, 55, 1726–1734. [Google Scholar] [CrossRef]
- Williams, C.J.; Pierson, F.B.; Kormos, P.R.; Al-Hamdan, O.Z.; Nouwakpo, S.K.; Weitz, M.A. Vegetation, Hydrologic, and Erosion Responses of Sagebrush Steppe 9 Yr Following Mechanical Tree Removal. Rangeland Ecology & Management 2019, 72, 47–68. [Google Scholar] [CrossRef]
- Di Prima, S.; Bagarello, V.; Lassabatere, L.; Angulo-Jaramillo, R.; Bautista, I.; Burguet, M.; Cerdà, A.; Iovino, M.; Prosdocimi, M. Comparing Beerkan infiltration tests with rainfall simulation experiments for hydraulic characterization of a sandy-loam soil. Hydrological Processes 2017, 31, 3520–3532. [Google Scholar] [CrossRef]
- Castellini, M.; Di Prima, S.; Moret-Fernández, D.; Lassabatere, L. Rapid and accurate measurement methods for determining soil hydraulic properties: A review. Journal of Hydrology and Hydromechanics 2021, 69, 121–139. [Google Scholar] [CrossRef]
- Blackburn, W.H.; Meeuwig, R.O.; Skau, C.M. A mobile infiltrometer for use on rangeland. Journal of Range Management 1974, 27, 322–323. [Google Scholar] [CrossRef]
- Leite, P.A.M.; Di Prima, S.; Schmidt, L.M.; Wilcox, B.P. A simple infiltrometer automated with a user-friendly pressure datalogger. Vadose Zone Journal 2024, n/a, e20366. [Google Scholar] [CrossRef]
- Basant, S.; Wilcox, B.P.; Leite, P.M.; Morgan, C.L. When savannas recover from overgrazing, ecohydrological connectivity collapses. Environ. Res. Lett. 2020, 15. [Google Scholar] [CrossRef]
- Wilcox, B.P.; Wilding, L.P.; Woodruff, C.M. Soil and topographic controls on runoff generation from stepped landforms in the Edwards Plateau of Central Texas. Geophysical Research Letters 2007, 34, L24S24. [Google Scholar] [CrossRef]
- McCalla, G.R.; Blackburn, W.H.; Merrill, L.B. Effects of livestock grazing on infiltration rates, Edwards Plateau of Texas. Journal of Range Management 1984, 37, 265–269. [Google Scholar] [CrossRef]
- Knight, R.W.; Blackburn, W.H.; Merrill, L.B. Characteristics of Oak Mottes, Edwards Plateau, Texas. Journal of Range Management 1984, 37, 534–537. [Google Scholar] [CrossRef]
- White, I.; Sully, M.; Melville, M. Use and hydrological robustness of time-to-incipient-ponding. Soil Science Society of America Journal 1989, 53, 1343–1346. [Google Scholar] [CrossRef]
- Di Prima, S.; Concialdi, P.; Lassabatere, L.; Angulo-Jaramillo, R.; Pirastru, M.; Cerda, A.; Keesstra, S. Laboratory testing of Beerkan infiltration experiments for assessing the role of soil sealing on water infiltration. Catena 2018, 167, 373–384. [Google Scholar] [CrossRef]
- Bowyer-Bower, T.; Burt, T. Rainfall simulators for investigating soil response to rainfall. Soil technology 1989, 2, 1–16. [Google Scholar] [CrossRef]
- Zimmermann, B.; Elsenbeer, H. Spatial and temporal variability of soil saturated hydraulic conductivity in gradients of disturbance. Journal of Hydrology 2008, 361, 78–95. [Google Scholar] [CrossRef]
- Bagarello, V.; Di Prima, S.; Iovino, M. Estimating saturated soil hydraulic conductivity by the near steady-state phase of a Beerkan infiltration test. Geoderma 2017, 303, 70–77. [Google Scholar] [CrossRef]
- Tecca, N.P.; Nieber, J.; Gulliver, J. Bias of stormwater infiltration measurement methods evaluated using numerical experiments. Vadose Zone Journal 2022, 21, e20210. [Google Scholar] [CrossRef]
- Ebrahimian, A.; Sample-Lord, K.; Wadzuk, B.; Traver, R. Temporal and spatial variation of infiltration in urban green infrastructure. Hydrological Processes 2020, 34, 1016–1034. [Google Scholar] [CrossRef]
- Naik, A.P.; Norbu, T.; Pekkat, S. Comparison of flux-based and head-based methods for determination of near-surface saturated hydraulic conductivity. Hydrological Sciences Journal 2024, 69, 275–293. [Google Scholar] [CrossRef]
- Reynolds, W.; Elrick, D. Ponded infiltration from a single ring: I. Analysis of steady flow. Soil Science Society of America Journal 1990, 54, 1233–1241. [Google Scholar] [CrossRef]
- Xia, L.; Song, X.; Fu, N.; Cui, S.; Li, L.; Li, H.; Li, Y. Effects of forest litter cover on hydrological response of hillslopes in the Loess Plateau of China. Catena 2019, 181, 104076. [Google Scholar] [CrossRef]
- Xin, Y.; Xie, Y.; Liu, Y.; Liu, H.; Ren, X. Residue cover effects on soil erosion and the infiltration in black soil under simulated rainfall experiments. Journal of Hydrology 2016, 543, 651–658. [Google Scholar] [CrossRef]
- Wilcox, B.P.; Caldeira, M.C.; Leite, P.A.M.; Lobo-do-Vale, R.; Bugalho, M.N. Understory shrubs improve soil infiltrability in overgrazed Mediterranean oak woodlands, but have little impact on ungrazed woodlands. Forest Ecology and Management 2024, 569, 122186. [Google Scholar] [CrossRef]
- Liu, Y.; Guo, L.; Huang, Z.; López-Vicente, M.; Wu, G.-L. Root morphological characteristics and soil water infiltration capacity in semi-arid artificial grassland soils. Agricultural Water Management 2020, 235, 106153. [Google Scholar] [CrossRef]
- Simelane, M.P.Z.; Soundy, P.; Maboko, M.M. Effects of Rainfall Intensity and Slope on Infiltration Rate, Soil Losses, Runoff and Nitrogen Leaching from Different Nitrogen Sources with a Rainfall Simulator. Sustainability 2024, 16, 4477. [Google Scholar] [CrossRef]
- Gupta, R.; Rudra, R.; Dickinson, W.; Patni, N.; Wall, G. Comparison of saturated hydraulic conductivity measured by various field methods. Transactions of the ASAE 1993, 36, 51–55. [Google Scholar] [CrossRef]
- Szabó, J.A.; Centeri, C.; Keller, B. The use of various rainfall simulators in the determination of the driving forces of changes in sediment concentration and clay enrichment. Water (Switzerland) 2020, 12. [Google Scholar] [CrossRef]
- Ogden, C.; Van Es, H.; Schindelbeck, R. Miniature rain simulator for field measurement of soil infiltration. Soil Science Society of America Journal 1997, 61, 1041–1043. [Google Scholar] [CrossRef]
- Lai, J.; Ren, L. Assessing the size dependency of measured hydraulic conductivity using double-ring infiltrometers and numerical simulation. Soil Science Society of America Journal 2007, 71, 1667–1675. [Google Scholar] [CrossRef]
- Blanco-Sepúlveda, R.; Lima, F.; Aguilar-Carrillo, A. An assessment of the shade and ground cover influence on the mitigation of water-driven soil erosion in a coffee agroforestry system. Agroforestry Systems 2024, 1–12. [Google Scholar] [CrossRef]
- Moldenhauer, W.; Long, D.C. Influence of rainfall energy on soil loss and infiltration rates: I. Effect over a range of texture. Soil Science Society of America Journal 1964, 28, 813–817. [Google Scholar] [CrossRef]
- Liu, H.; Lei, T.; Zhao, J.; Yuan, C.; Fan, Y.; Qu, L. Effects of rainfall intensity and antecedent soil water content on soil infiltrability under rainfall conditions using the run off-on-out method. Journal of Hydrology 2011, 396, 24–32. [Google Scholar] [CrossRef]
- Xu, X.; Lewis, C.; Liu, W.; Albertson, J.; Kiely, G. Analysis of single-ring infiltrometer data for soil hydraulic properties estimation: Comparison of BEST and Wu methods. Agricultural Water Management 2012, 107, 34–41. [Google Scholar] [CrossRef]
Figure 1.
Soil infiltrability was measured via three different methodologies under two vegetation cover conditions. (a) Rainfall simulation in a thicketized woodland; (b) Automated SSBI in a grassland; and (c) Saturo infiltrometry in a grassland.
Figure 1.
Soil infiltrability was measured via three different methodologies under two vegetation cover conditions. (a) Rainfall simulation in a thicketized woodland; (b) Automated SSBI in a grassland; and (c) Saturo infiltrometry in a grassland.
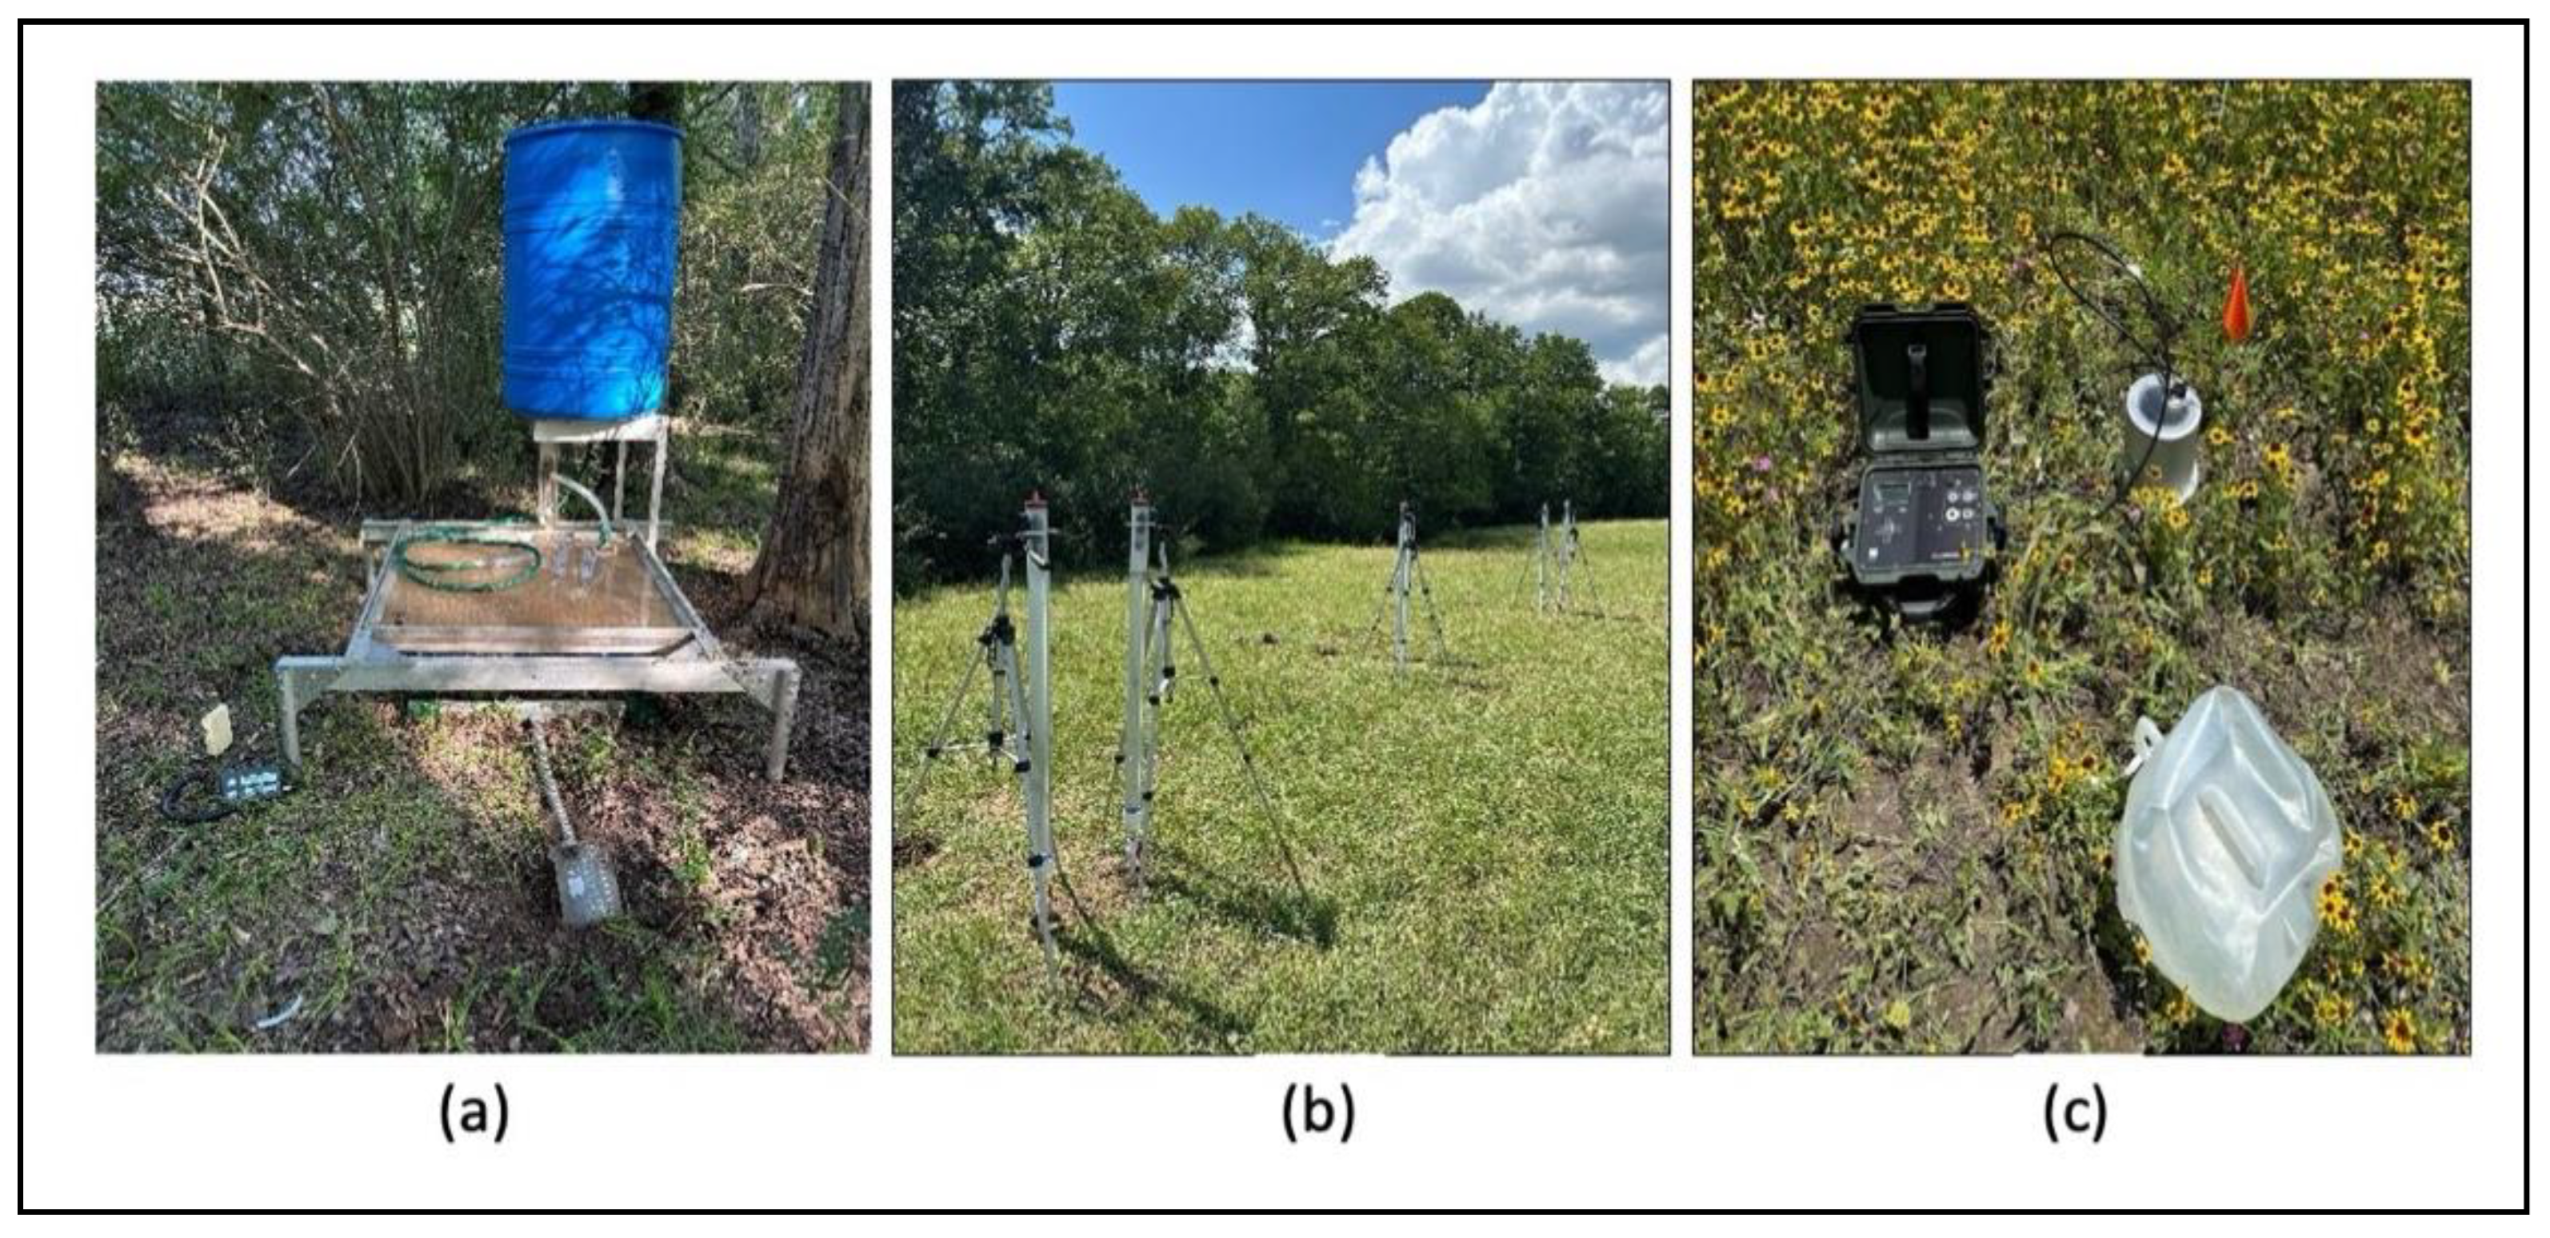
Figure 2.
A schematic diagram showing the layout of the five measurement locations along each transect and the infiltration tests performed with the three methods. Green-outlined squares = rainfall simulation plots; black X = measurement via Automated SSBI; blue circle = measurement via Saturo infiltrometer.

Figure 3.
infiltration rate curves from tests conducted with the rainfall simulator. The red dashed line represents the average steady-state infiltration rate (infiltrability) for each site. For the woodland zone in the sandy- soil site, from which there was no runoff in four of the five plots, the infiltration rates shown (measured at the maximum simulated rainfall intensity of 154 mm h⁻¹) are likely underestimations.
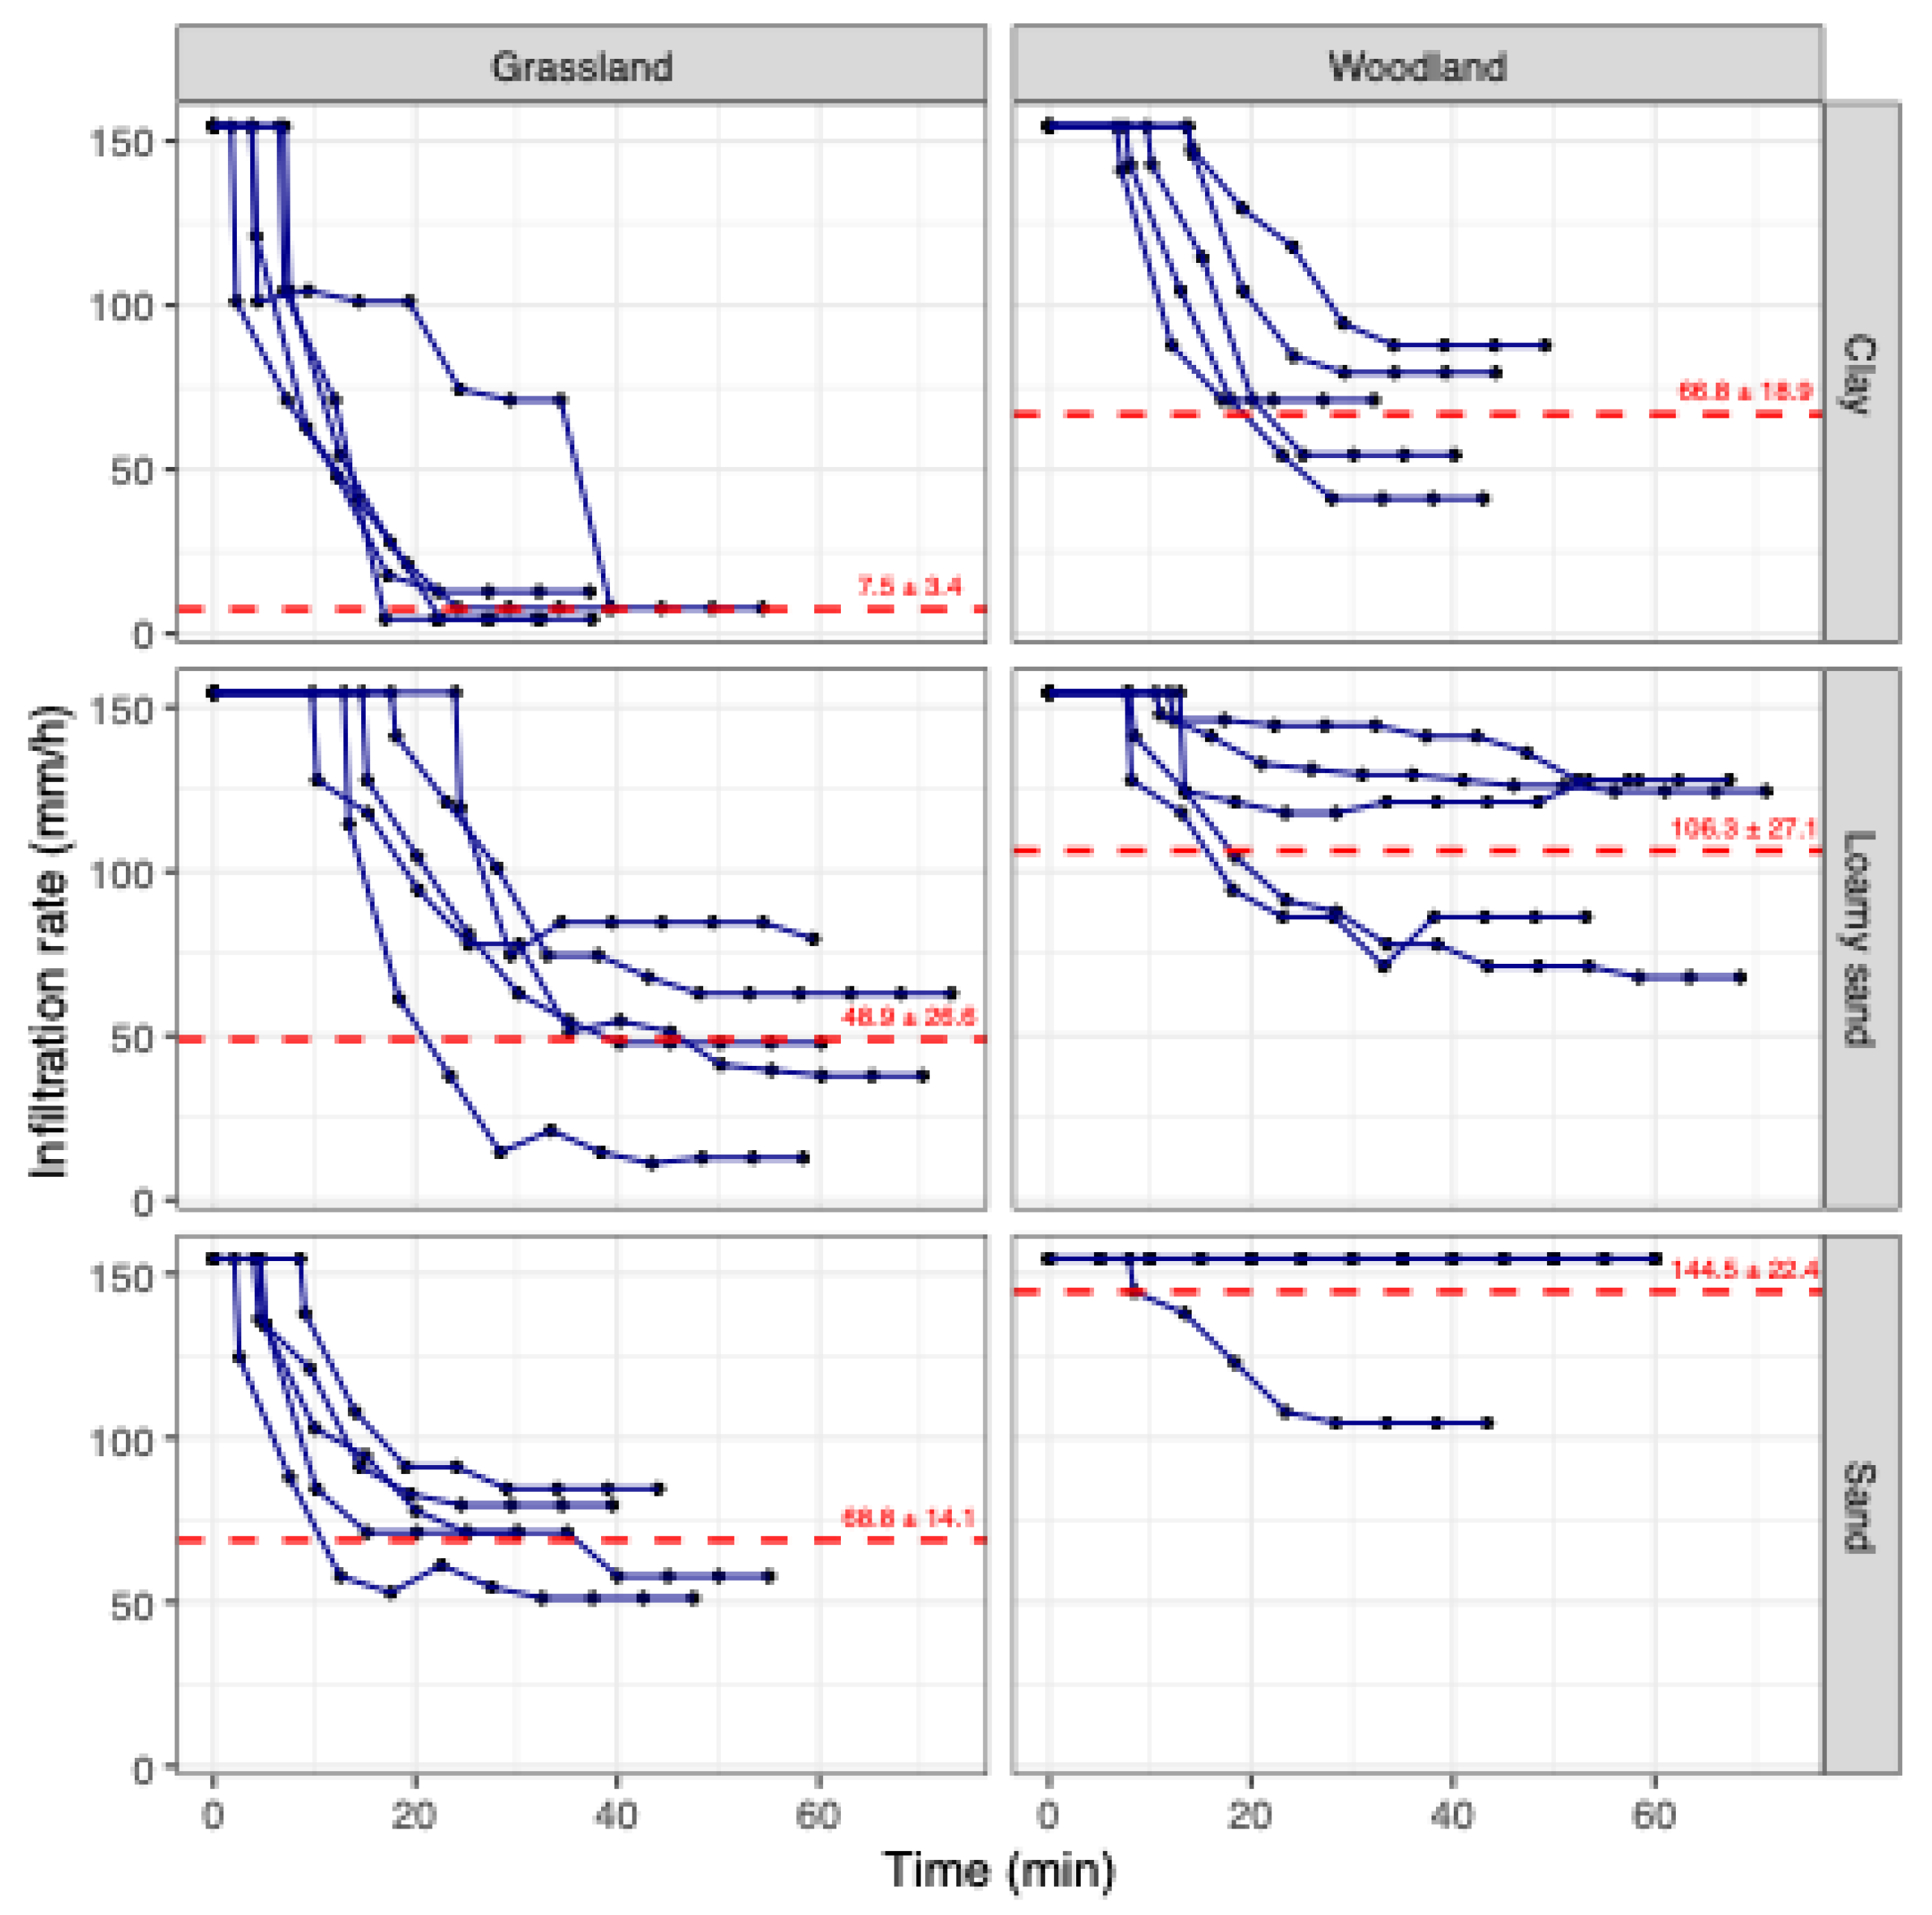
Figure 4.
Box plots of infiltrability values for grassland and woodland zones obtained at the three sites via the three measurement methodologies.
Figure 4.
Box plots of infiltrability values for grassland and woodland zones obtained at the three sites via the three measurement methodologies.
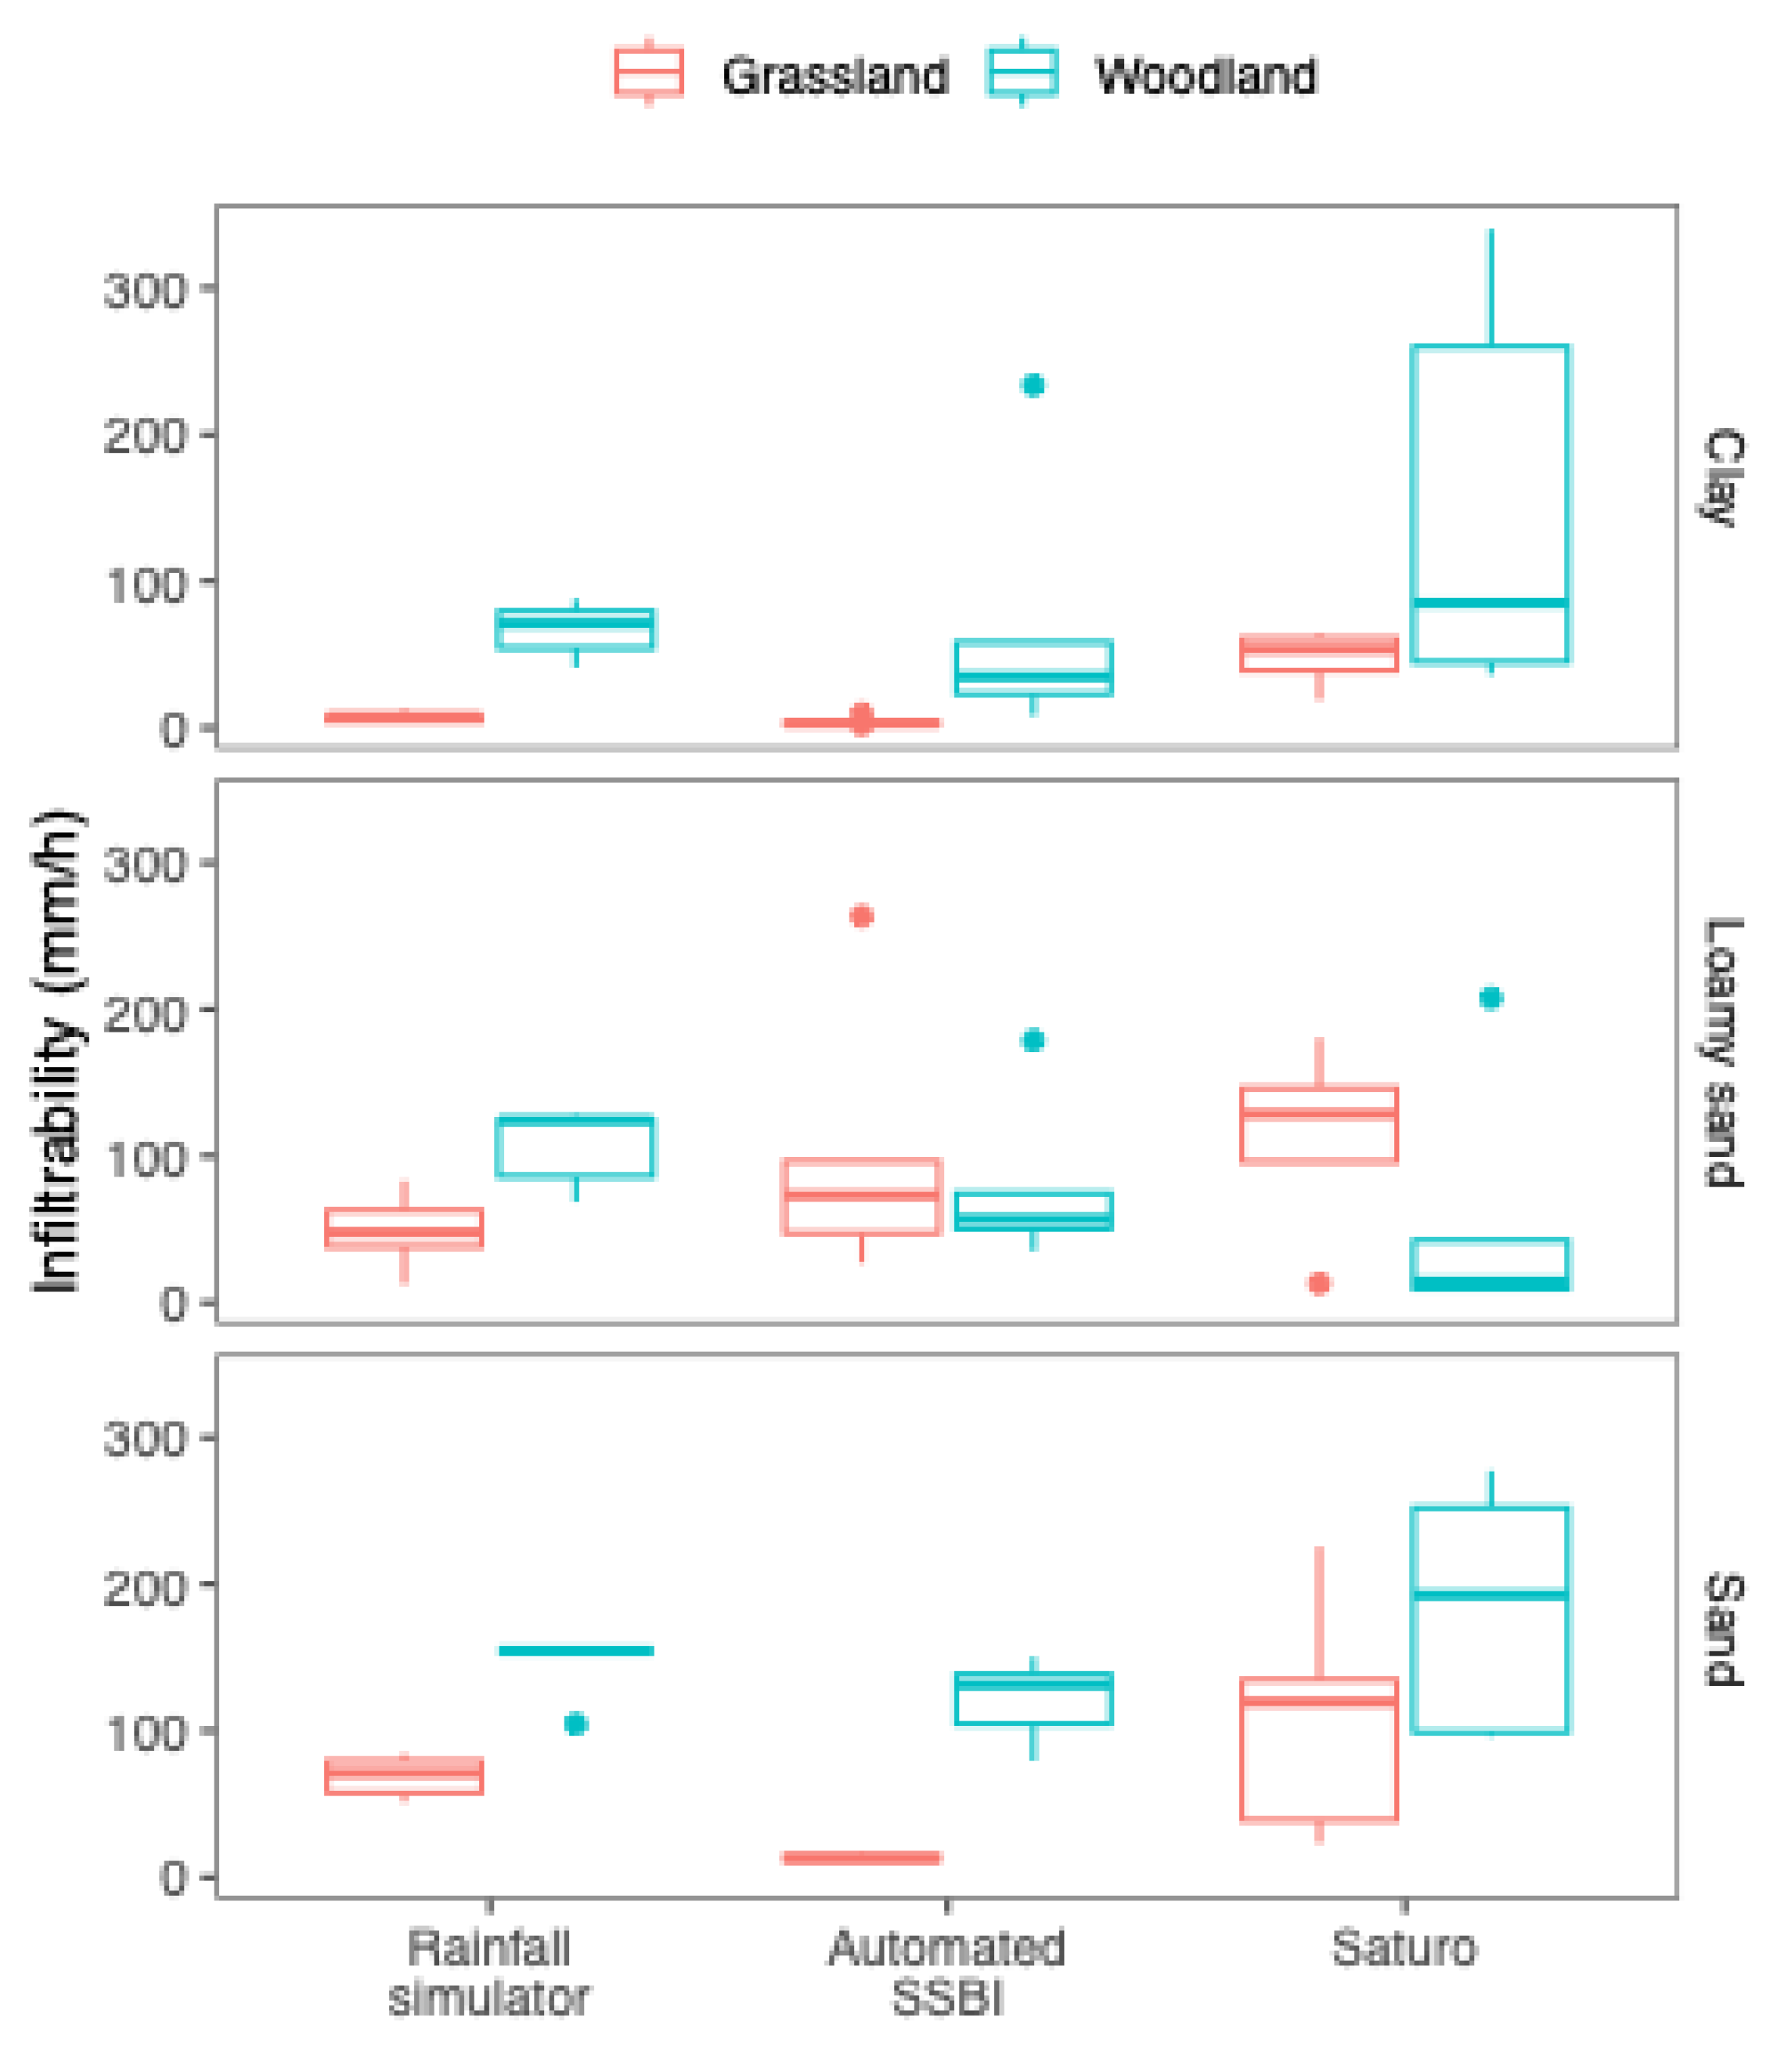
Figure 5.
Correlations between infiltrability values (mm h-1) obtained with each method (rainfall simulation, Automated SSBI, and Saturo) and influencing variables: live biomass, dead biomass (g m-2), and soil bulk density (g cm-3) in the 0- to 5-cm and 5- to 10-cm depth increments. Note that the regression line, adjusted R², and p-values are based on a log-log relationship, but the scales on both axes are presented in their original form for better visualization.
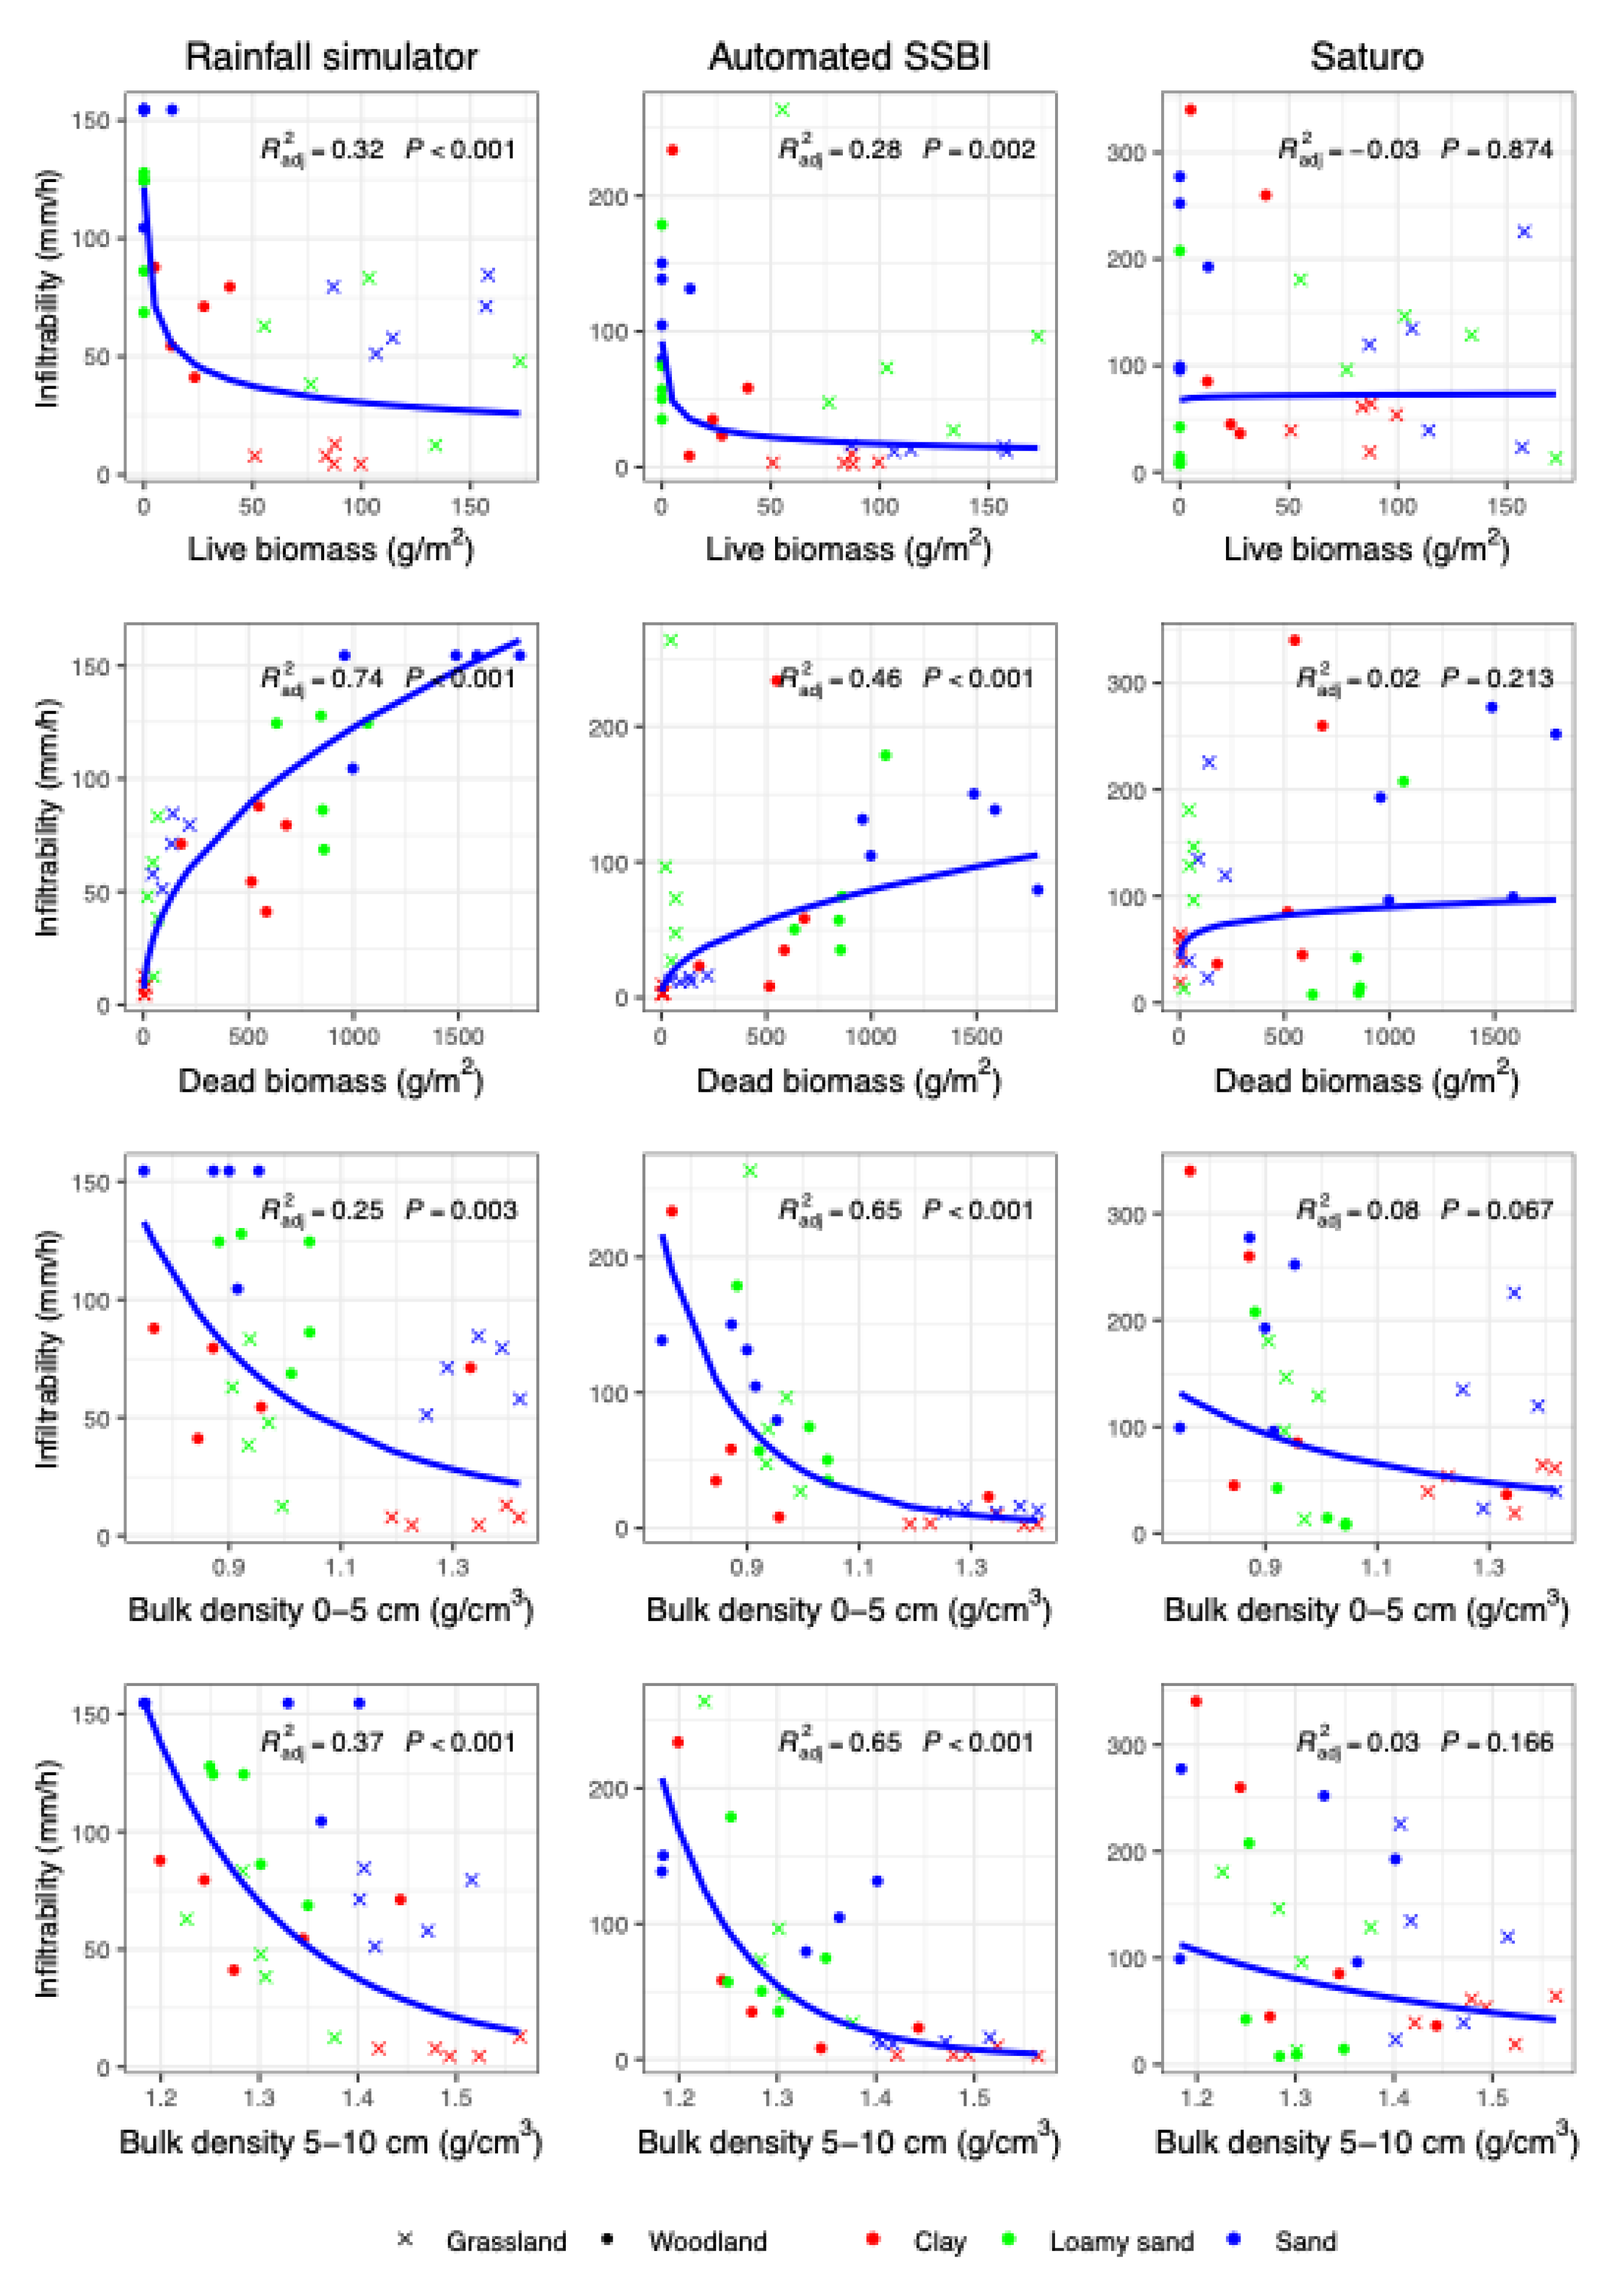

Table 1.
Infiltrability (mean ± standard deviation; mm h⁻¹) values obtained via the three measurement methodologies for each soil type and cover type. ANOVA p-values represent the significance of differences in values found by the different methodologies, while Levene’s test p-values indicate the significance of differences in variances. Capital A or B represents a significant difference in the mean values obtained by each methodology between covers (Grassland vs Woodland) within each site, while lowercase a or b represents a significant difference between the mean values obtained by different methodologies within the same site and cover type.
| Site/ soil type |
Cover type |
Methodology |
ANOVA p-value |
Levene’s p-value |
||
|---|---|---|---|---|---|---|
| Rainfall simulation | Automated SSBI | Saturo | ||||
| Clay | Grassland | 7.5 ± 3.4 A b | 4.3 ± 3 A b | 47.4 ± 18.6 A a | 0.000 | 0.058 |
| Woodland | 66.8 ± 18.9 B a | 71.7 ± 92.4 B a | 153.3 ± 138.2 A a | 0.291 | 0.234 | |
| Loamy sand | Grassland | 48.9 ± 26.6 A a | 101.6 ± 94.3 A a | 113 ± 63.6 A a | 0.421 | 0.521 |
| Woodland | 106.3 ± 27.1 B a | 79.2 ± 57.4 A a | 56.3 ± 85.8 A a | 0.063 | 0.763 | |
| Sandy | Grassland | 68.8 ± 14.1 A a | 13.4 ± 2.1 A b | 108.4 ± 81.6 A a | 0.001 | 0.016 |
| Woodland | 144.5 ± 22.4 B | 120.9 ± 28.6 B | 183.4 ± 84.3 A | – | – | |
Disclaimer/Publisher’s Note: The statements, opinions and data contained in all publications are solely those of the individual author(s) and contributor(s) and not of MDPI and/or the editor(s). MDPI and/or the editor(s) disclaim responsibility for any injury to people or property resulting from any ideas, methods, instructions or products referred to in the content. |
© 2024 by the authors. Licensee MDPI, Basel, Switzerland. This article is an open access article distributed under the terms and conditions of the Creative Commons Attribution (CC BY) license (http://creativecommons.org/licenses/by/4.0/).
Copyright: This open access article is published under a Creative Commons CC BY 4.0 license, which permit the free download, distribution, and reuse, provided that the author and preprint are cited in any reuse.


