
Submitted:
24 December 2024
Posted:
25 December 2024
You are already at the latest version
Abstract
Arsenic, in the form of inorganic arsenite (i-As3+), is toxic to the kidney and can cause acute kidney injury, manifesting as destruction of proximal tubule cells. Nephron repair is possible through the proliferation of resident tubular progenitor cells expressing CD133 and CD24 surface markers. We simulated regenerative repair in the continued presence of i-As3+ using a cell culture model of a renal progenitor cell line expressing CD133 (PROM1) and CD24. Continued exposure and subculturing of progenitor cells to i-As3+ led to a reduction in the expression of PROM1 and CD24 as well as a decrease in the ability to differentiate into tubule-like structures. Cessation of i-As3 and recovery up to 3 passages resulted in continued repression of PROM1 and reduced ability to differentiate. Chronically exposed cells exhibited an ability to form colonies in soft agar suggesting neoplastic transformation. Chronically exposed cells also exhibited an induction of CD44, a cell surface marker commonly found in renal cell carcinoma as well as in tubular repair in chronic renal injury such as in chronic kidney disease. These results demonstrate potential adverse outcomes of renal progenitor cells chronically exposed to a nephrotoxicant as well as in environmental exposure to arsenic.
Keywords:
Arsenite (As+3)
; HRTPT
; kidney progenitor
; RCC
; CD44
1. Introduction
Inorganic arsenic (iAs) is a toxic substance that is distributed throughout the environment and has been implicated in numerous disease states [1]. While the most attention is focused on iAs exposure and cancer in many organ systems, an exception may be the kidney. While renal cancer is a concern, the kidney is the most susceptible of all organ systems to iAs exposure and its effects are associated with alterations in renal function with progression to chronic kidney disease [2,3,4,5,6,7]. As reviewed by Kovesdy (2022), the number of patients affected by CKD is estimated at 843.6 million individuals worldwide as of 2017 and has emerged as a leading cause of worldwide mortality [8]. Importantly, the kidney has the ability for repair and regeneration following nephron damage. Repair and regeneration of damaged tubular epithelium is presumed to be mediated by a sparse and widely dispersed population of renal progenitor cells within the kidney that co-express PROM 1 and CD24 [9,10,11,12,13,14]. Most studies assume that insults and damage only occur to mature and differentiated, functioning cells and not to regenerating progenitor cells. Understanding how progenitor cells themselves respond to injurious agents, such as iAs, may be central in efforts to expand repair and regeneration of renal injury before progression to CKD.
A previous study from this laboratory described the isolation of an immortalized culture of human renal progenitor cells (HRTPT) based on their co-expression of CD133 and CD24. The HRTPT cells also displayed the properties of growth and differentiation expected from in vivo and in vitro studies of CD133/CD24 human progenitor cells [15,16]. The HRTPT cells were used to demonstrate that exposure to iAs caused the cells to shift from an epithelial morphology to a mesenchymal morphology. Genomic analysis over 10 serial passages (15 population doublings) confirmed a change in gene expression associated with a shift to a mesenchymal genotype. Interestingly removal of iAs at passage 10 allowed the cells to revert to an epithelial morphology and genotype like the control cells not exposed to iAs [17]. This study also formed the foundation to undertake a longer-term study on the effects of iAs exposure on the HRTPT cells. There is limited information regarding the lifespan of renal progenitor cells within the adult kidney [18]. The previous data demonstrated that the iAs exposed HRTPT cells at P10 still express PROM1 and CD24 and can revert to the unexposed state when iAs exposure is stopped. The first goal of the present study was to determine if further iAs exposure past P10 would result in the loss of PROM1 and CD24 along with loss of pluripotency. The second goal, if such was the case above, is to determine if extended iAs exposure can result in conversion of the loss of progenitor properties of the HRTPT cells with progression to those displaying characteristics of malignant transformation.
2. Results
2.1. Growth, Morphology and PROM1 and CD24 Expression of HRTPT Cells Exposed to 4.5 µM iAs for 30 Population Doublings
The exposure of the HRTPT cells to 4.5 µM i-As+3 followed the identical protocol described previously except that the iAs exposure was extended from P8 to P19 [17]. The light level morphology of the iAs exposed HRTPT cells maintained a mesenchymal-like morphology at P8 through P19 when compared to the HRTPT control (Figure 1A). The time to confluency following a 1:3 subculture of the iAs exposed cells compared to control (7 days) showed that time to confluency for iAs exposed cells was increased at P8 (65 Days) and P12 (12 days) but similar to control cells at P15 and P19. This result shows the late passage iAs exposed HRTPT cells increase their growth similar to control cells. The cells at P19 showed no evidence of multilayer growth or the formation of raised foci ocells above the monolayer. An analysis of PROM1 express showed that the iAs exposed cells had a significantly reduced expression of PROM1 mRNA and low levels of PROM1 protein (Figure 1B). A similar analysis for CD24 showed a reduced expression on mRNA and protein at passage 8 and 15 with a strong rebound in CD24 mRNA and protein at passage 19 (Figure 1C).
2.2. Progenitor Properties of HRTPT Cells Exposed to 4.5 µM iAs for 15 Serial Passages (20.25) Population Doublings
The iAs exposed HRTPT cells at P15 retained the ability to form spheroids when sub-cultured into ultra-low attachment culture dishes (Figure 2A). The number of spheroids generated by the iAs exposed cells was significantly increased compared to control cells not treated with iAs. This suggests the iAs exposed cells at P15 retain the property of self-renewal at a significantly reduced expression of PROM1 protein. A further test of progenitor properties involved the ability of the iAs exposed cells to form tubule-like structures when grown on the surface of Matrigel (Figure 2B). Compared to control cells able to form tubule-like structures, the iAs cells at P15 showed no evidence of the ability to form these structures (Figure 2b). The ability of the iAs exposed cells at P15 to undergo differentiation was tested using gene expression markers commonly used to provide evidence for tubulogenic, adipogenic, osteogenic, and neurogenic differentiation in the HRTPT cells [15,19]. The results showed that the markers for tubulogenic differentiation (AQP1) and adipogenic differentiation (ADIPO) were significantly elevated and the marker for osteogenic differentiation (RUNX2) significantly decreased compared to control cells (Figure 2C). The markers for neurogenic differentiation (ENO2 and NES) were close to the value of control cells but did reach significance. Except for osterogenic differentiation, the iAs exposed cells at P15 retained their ability to differentiate when placed in an appropriately defined growth formulation.
2.3. Epithelial Mesenchymal Transition (EMT) in HRTPT Cells Exposed to iAs for 19 Passages (30 Population Doublings)
The previous study exposing HRTPT cells to iAs at shorter serial passages suggested a shift to mesenchymal morphology and a gene expression profile suggesting the development of EMT [17]. An analysis of the HRTPT cells exposed to iAs for 20 passages were assessed for E-cadherin (CDH1), N-cadherin (CDH2), and vimentin (VIM) to determine if the shift to EMT had undergone progression. The results show a marked reduction of E-cadherin, and a marked increase in N-cadherin and vimentin mRNA expression, further confirming the development of EMT (Figure 3). The expression of CDH1 mRNA was like control through P11 and then decreased sequentially starting a P13 through P20 (Figure 3 A). The CDH1 protein was also reduced but lagged behind CDH1 mRNA presumably due to the time of degradation of the CDH1 protein (Figure 3 B & C). The expression of CDH2 mRNA remained at the low expression levels found in control cells through P13 and then increased significantly by P20. CDH2 protein was similarly increased, again with a lag time between mRNA and protein expression (Figure 3 D & E). The pattern of expression of VIM mRNA and protein was similar to that of CDH2 (Figure. H & I). Confocal images of CDH1, CDH2 and VIM were obtained at P15 and show equivalent localization for CDH1 and CDH2 at this cross-over point of protein expression, with VIM showing an increase in protein expression (Figure 3 F, G, and J). The results show that EMT progressed as the time of iAs exposure increased for the HRTPT cells.
2.4. As3+ Anchorage-Independent Growth and CD44 Expression of HRTPT Cells Exposed to iAs for 19 Passages (30 population Doublings)
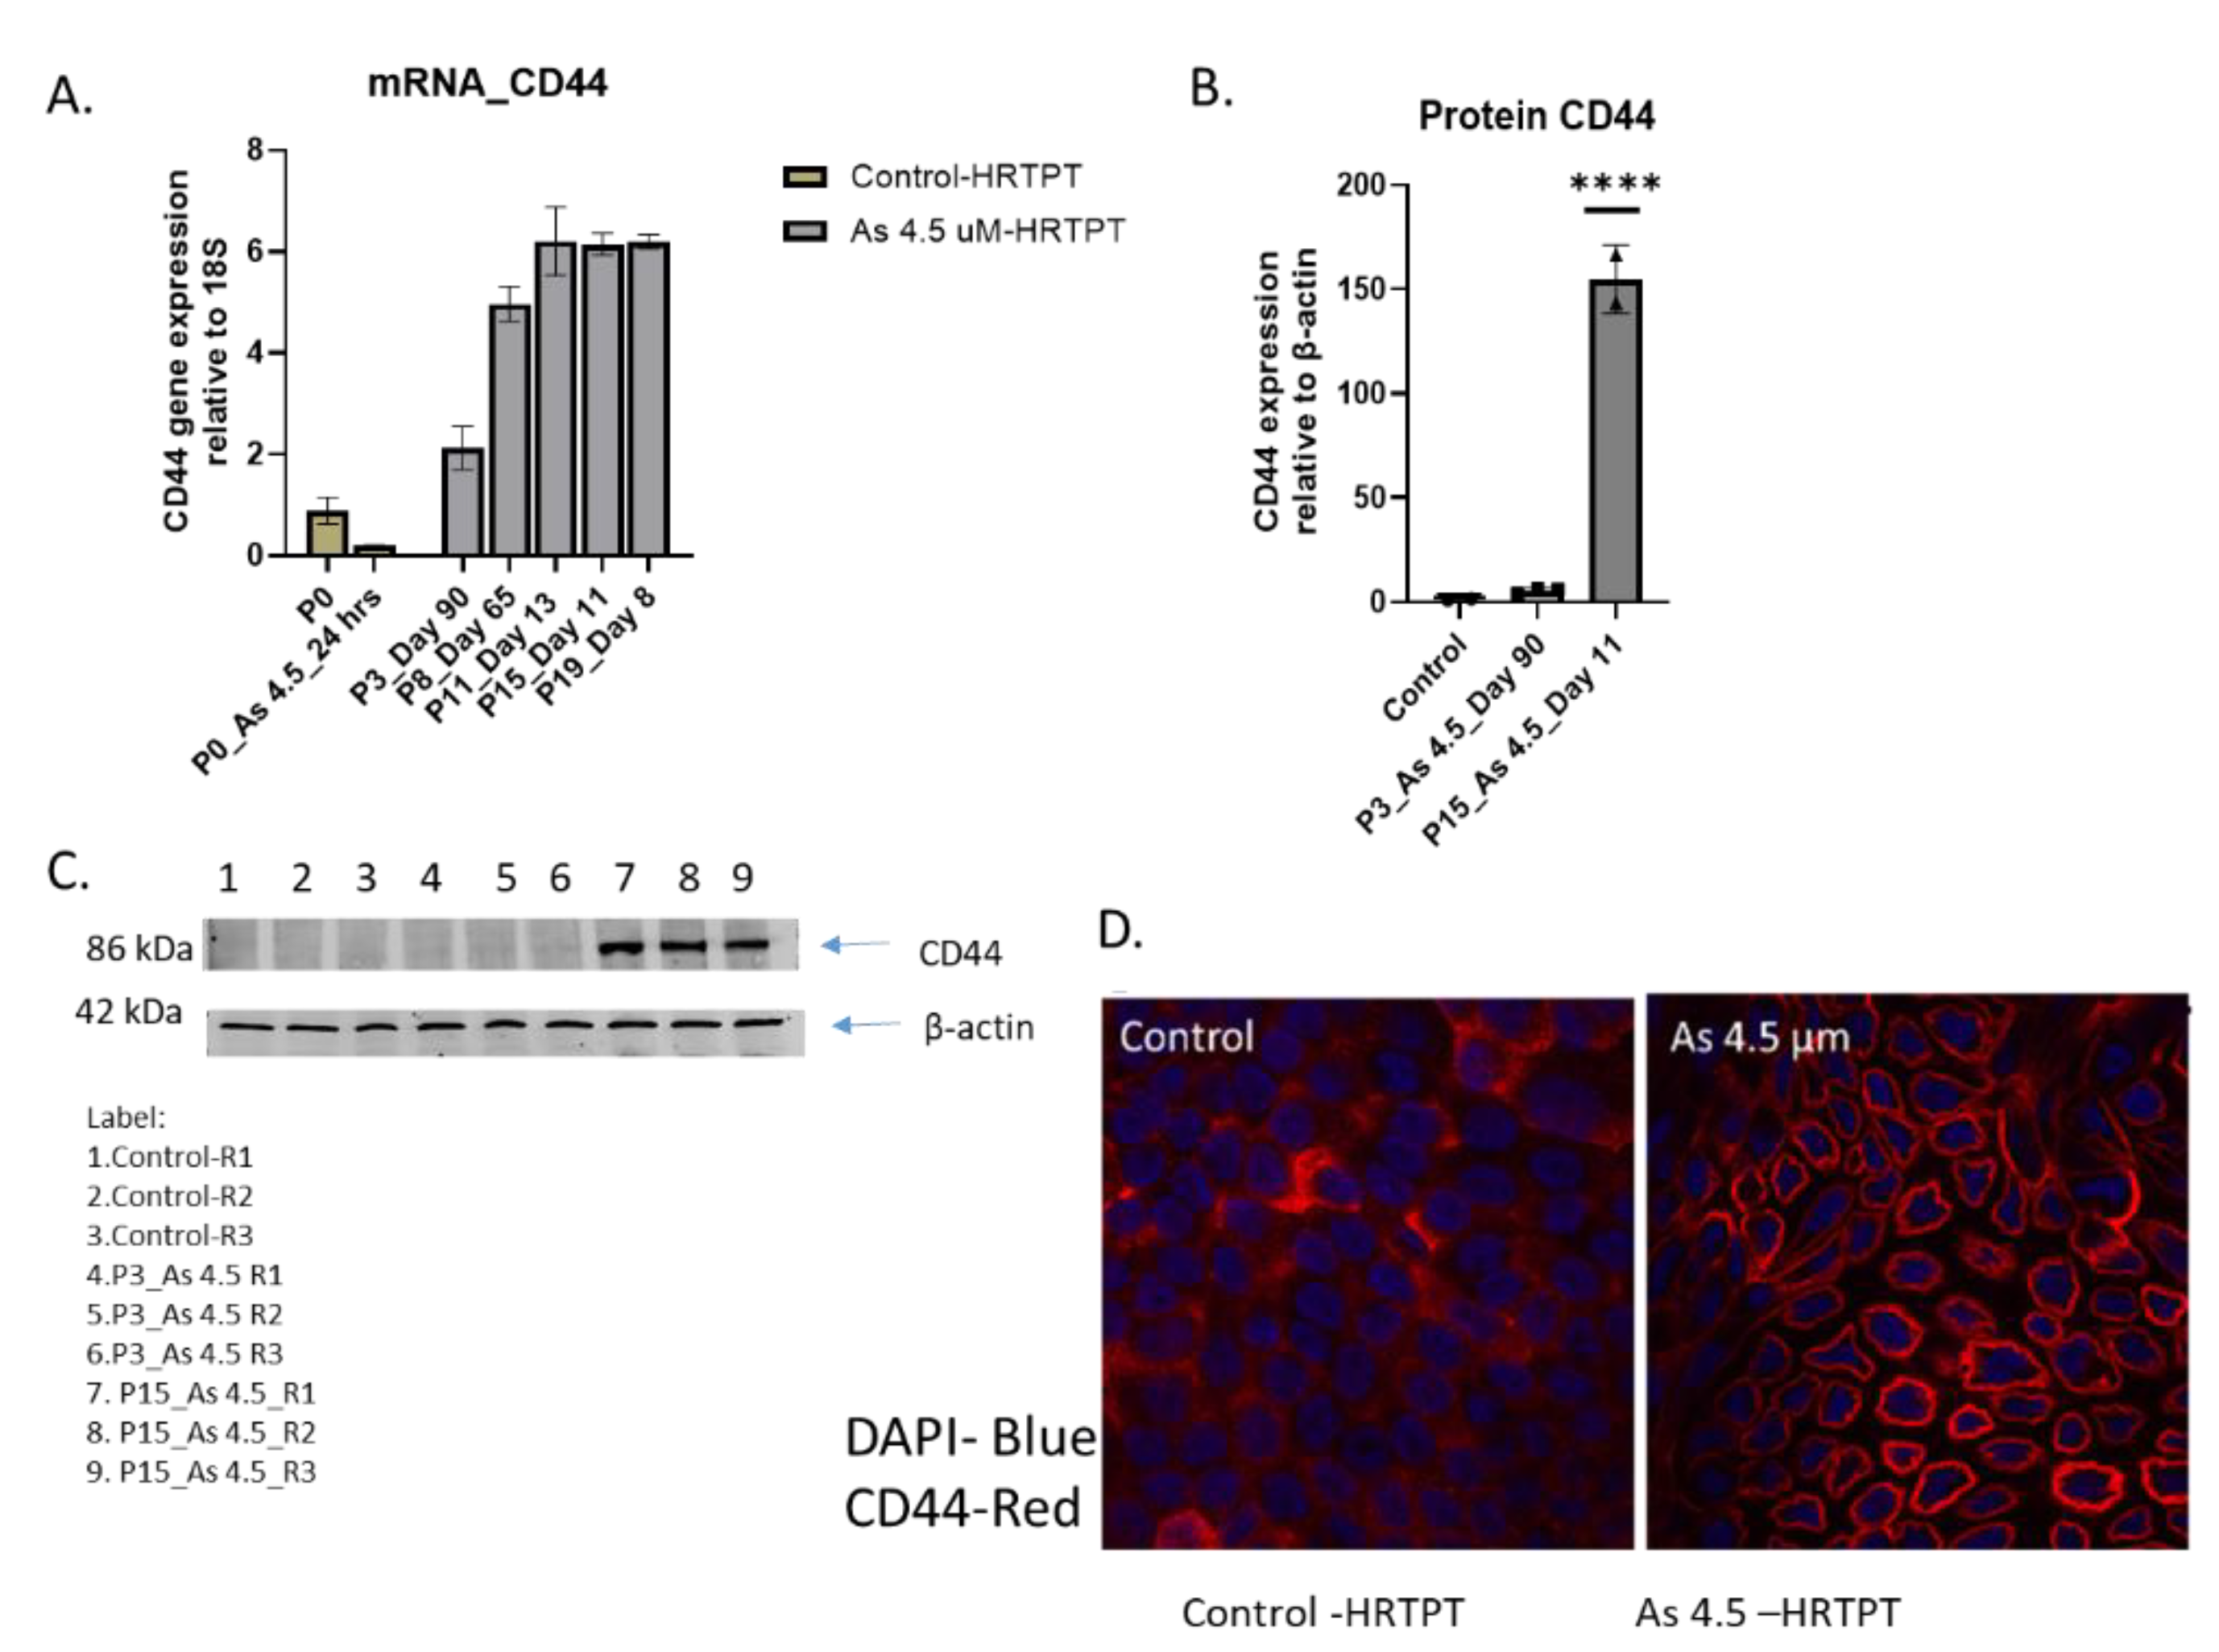
The soft agar colony formation assay is an established method to evaluate anchorage-independent growth of cells independent of a solid surface and is an established hallmark of carcinogenesis and tumorigenic potential [20,21]. The results of this study showed that the iAs exposed HRTPT cells at P19 were able to form colonies in soft agar (Figure 4A). The control cells showed no evidence for the formation of colonies in soft agar. The CD44 gene was also examined for its expression in the iAs exposed HRTPT cells. This gene was chosen since it is a known cancer stem cell marker with prognostic significance for patients with clear cell renal carcinoma [22]. The results show that control cells have a low expression of CD44 compared to iAs exposed cells at P3 through P20, with P20 cells displaying a 6-fold increase compared to control Figure 4B). The level of CD44 protein expression increased 150-fold over control at P15. Confocal analysis showed a marked increase in the cell surface expression of CD44 for the iAs exposed cells at P15 compared to control.
2.5. Effect of iAs Removal from HRTPT Cells Exposed to iAs for 19 Passages
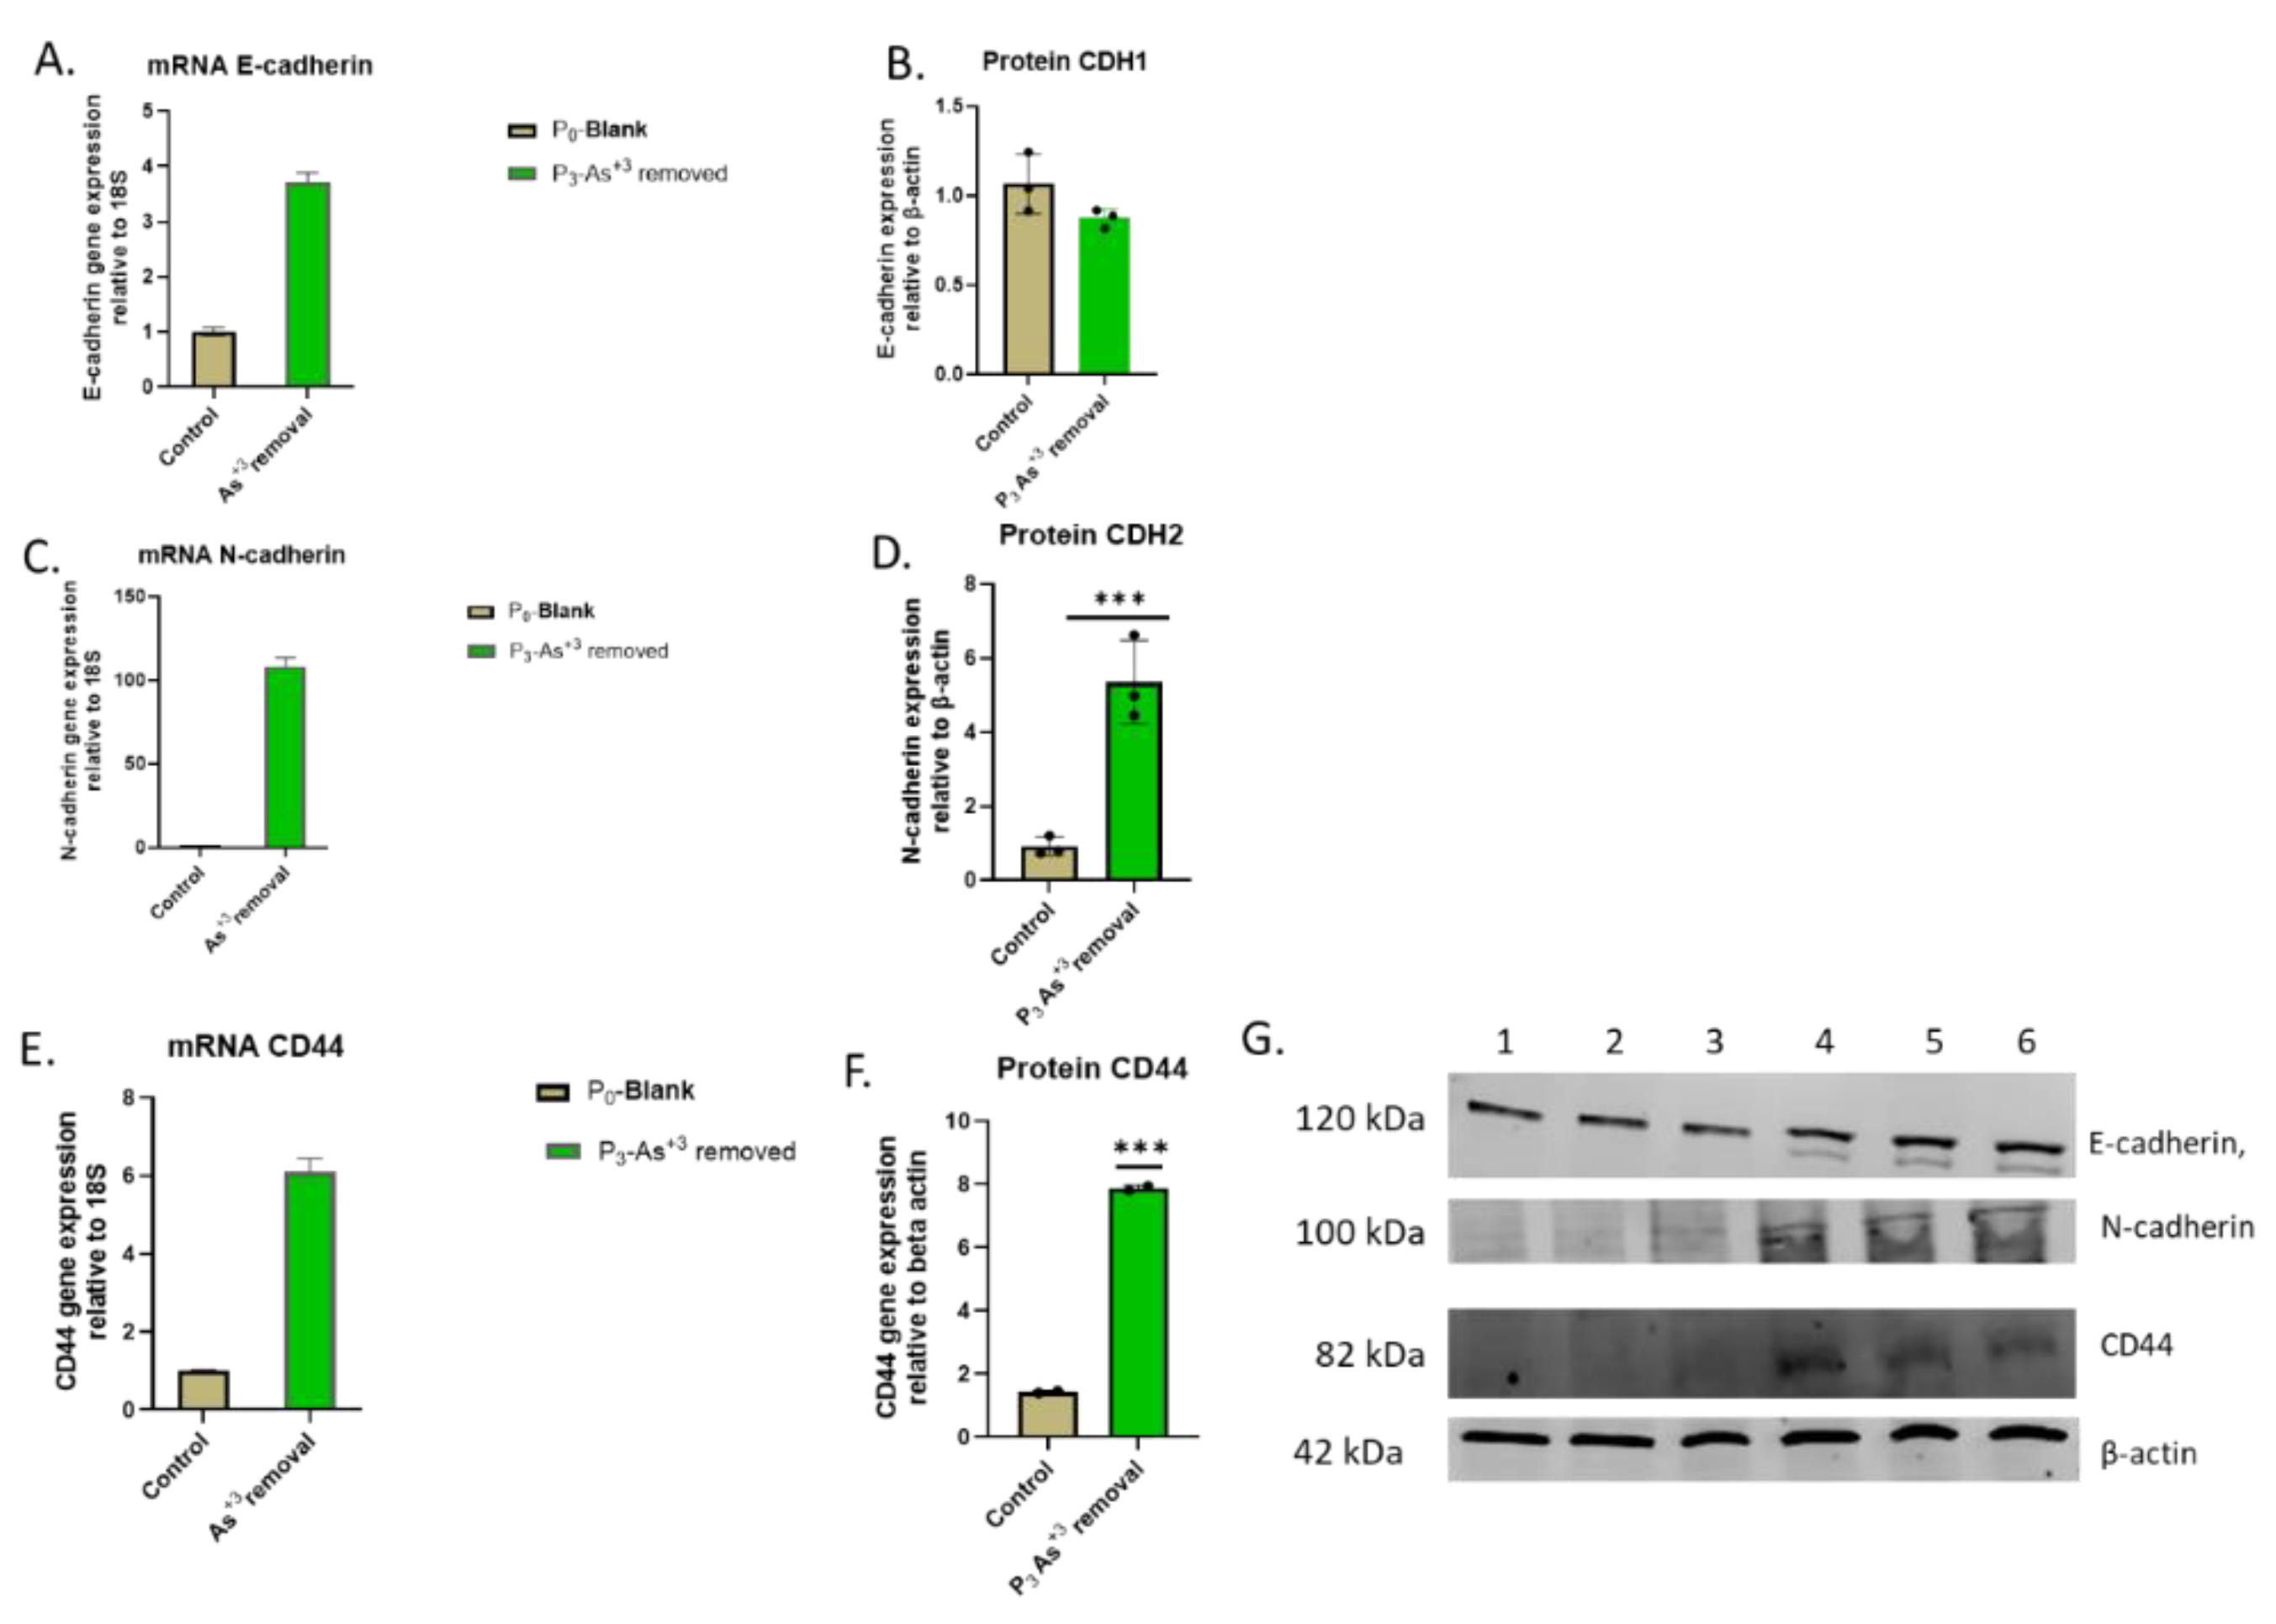
The effect of removing iAs from the growth media was tested for 3 passages on the HRTPT cells exposed to iAs for 20 passages (23 passages of total cell growth). The light level morphology of the cells was assessed for control cells, iAs treated cells at P20, and iAs treated cells following removal of iAs from the growth media for 3 serial passages (Figure 5A). The results show that the iAs exposed cells at P20 and the 3 passages where iAs was removed displayed a similar morphology. The control cells never exposed to iAs had a more epithelial morphology and produced domes, a feature only occurring in epithelial cells. The iAs exposed cells and those with iAs removed displayed no domes and a more mesenchymal morphology. The 3 passages of the P20 cells where iAs was removed retained the ability to form spheroids on low attachment flasks, colony formation in soft agar, and the inability to form tubule-like structures on the surface of Matrigel (Figure 5B,C,D). The cultures that were placed in iAs-free media for 3 passages showed an increase in CDH1 mRNA compared to control, but CDH1 protein had a similar expression compared to control. The expression of CDH2 and CD44 mRNA and protein were significantly higher than control for the P3 cells in the absence of iAs. When compared to iAs exposed cells at P20, CDH1 mRNA and protein were elevated, CDH2 and CD44 mRNA and protein remained elevated at levels similar to iAs exposed cells at P20. The expression of CD133 mRNA and protein was reduced compared to control cells and similar to iAs exposed cells at P20. The expression of CD24 mRNA and protein at P3 was similar to control and P20 iAs exposed cells.
Figure 5.
A. Light microscopic images of As3+-removed HRTPT cells from As3+-exposed cells (A) As+3 exposed HRTPT cells; (B) As+3 removed cells for 24hrs (P0); (C) P1- As+3-removed cells; (D) P2- As+3-removed cells; (E) P3-As+3-removed cells; The green arrow indicates images of As+3-removed passages, scale bar =500 µm and magnification 20x.
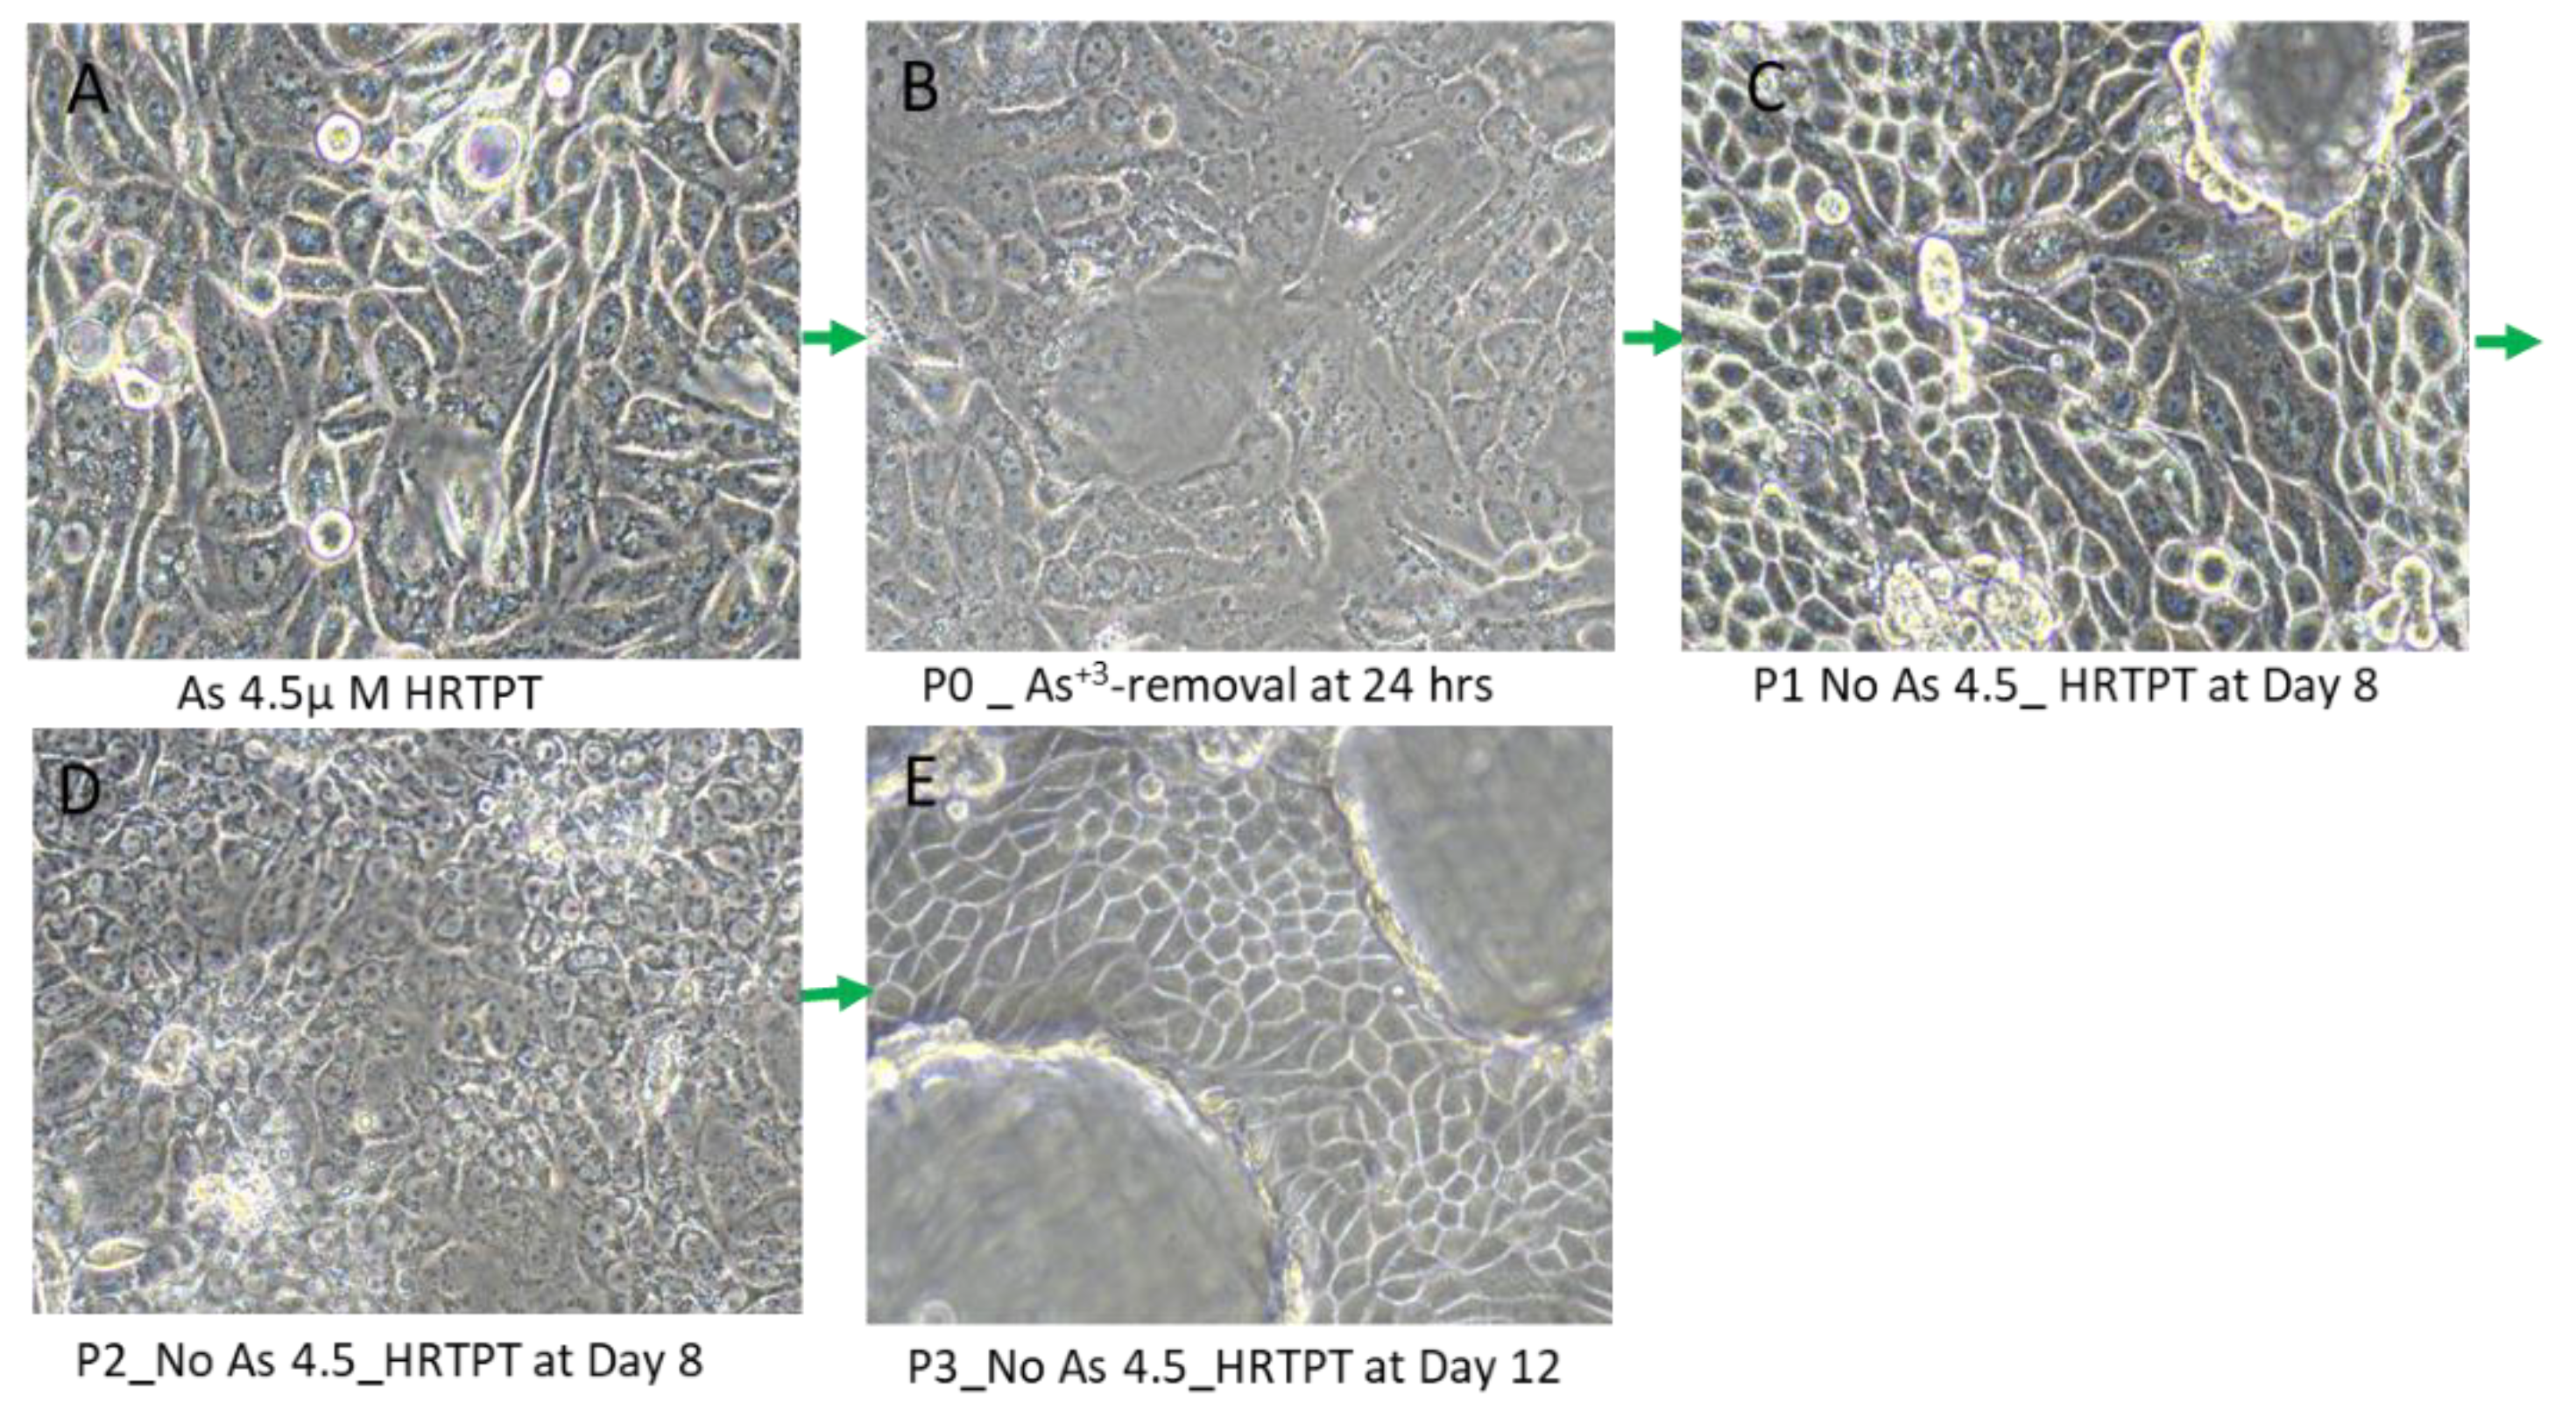
Figure 5.
B. Light level microscopy of spheroids generated from –Control-HRTPT, and P3-As+3 removed-HRTPT cells. The spheroid images taken at 20x magnification generated from (A) Control-HRTPT cells; (B) P3-As+3 removed-HRTPT cells; and (C) bar graph shows number of sphere; ****; ***; **; * indicates significant differences in number of spheres compared to the control 0.0 µM arsenite concentration at p-value of ≤ 0.0001; ≤ 0.001; ≤ 0.01; ≤ 0.05 respectively. All the images were taken after 28 days of seeding in the ultra-low attachment flasks.
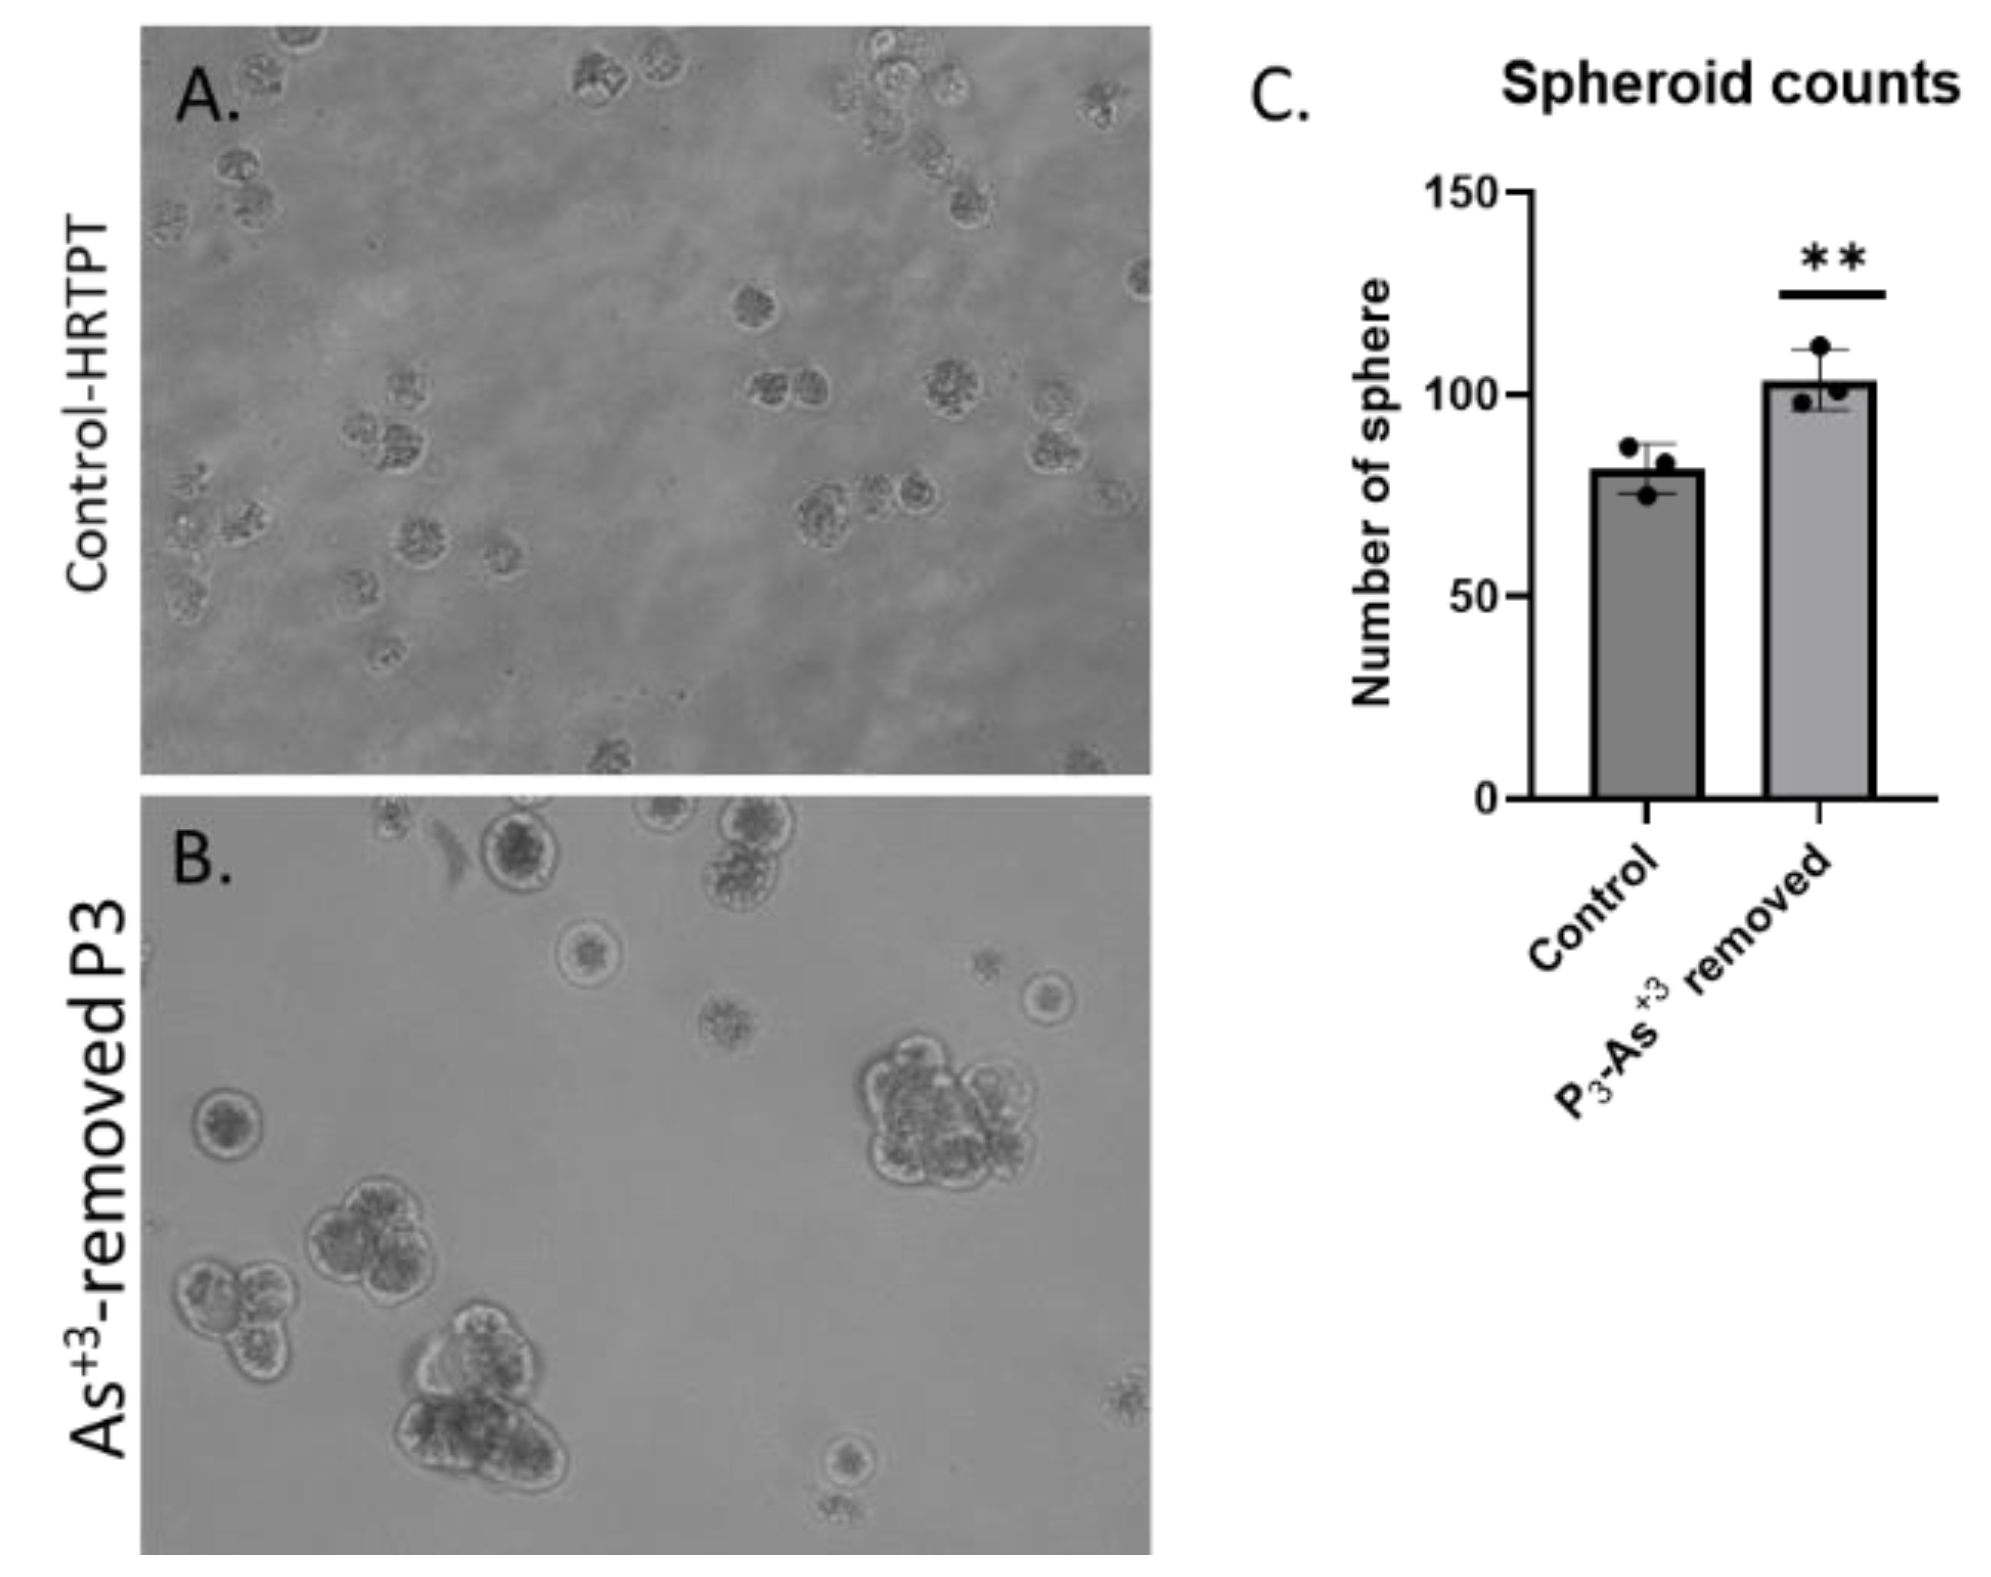
Figure 5.
C. Light level microscopy of Control-HRTPT, and P3-As+3 removed cells plated on soft agar plate up to 28 days. (A) HRTPT Control; (B) P3_As+3 removed cells grown on soft agar. (C) t-test for control Vs As+3 removed cells; 8-10 cell colonies and cluster size > 106 μm2. All images taken at 10x magnification at 28 days after seeding.
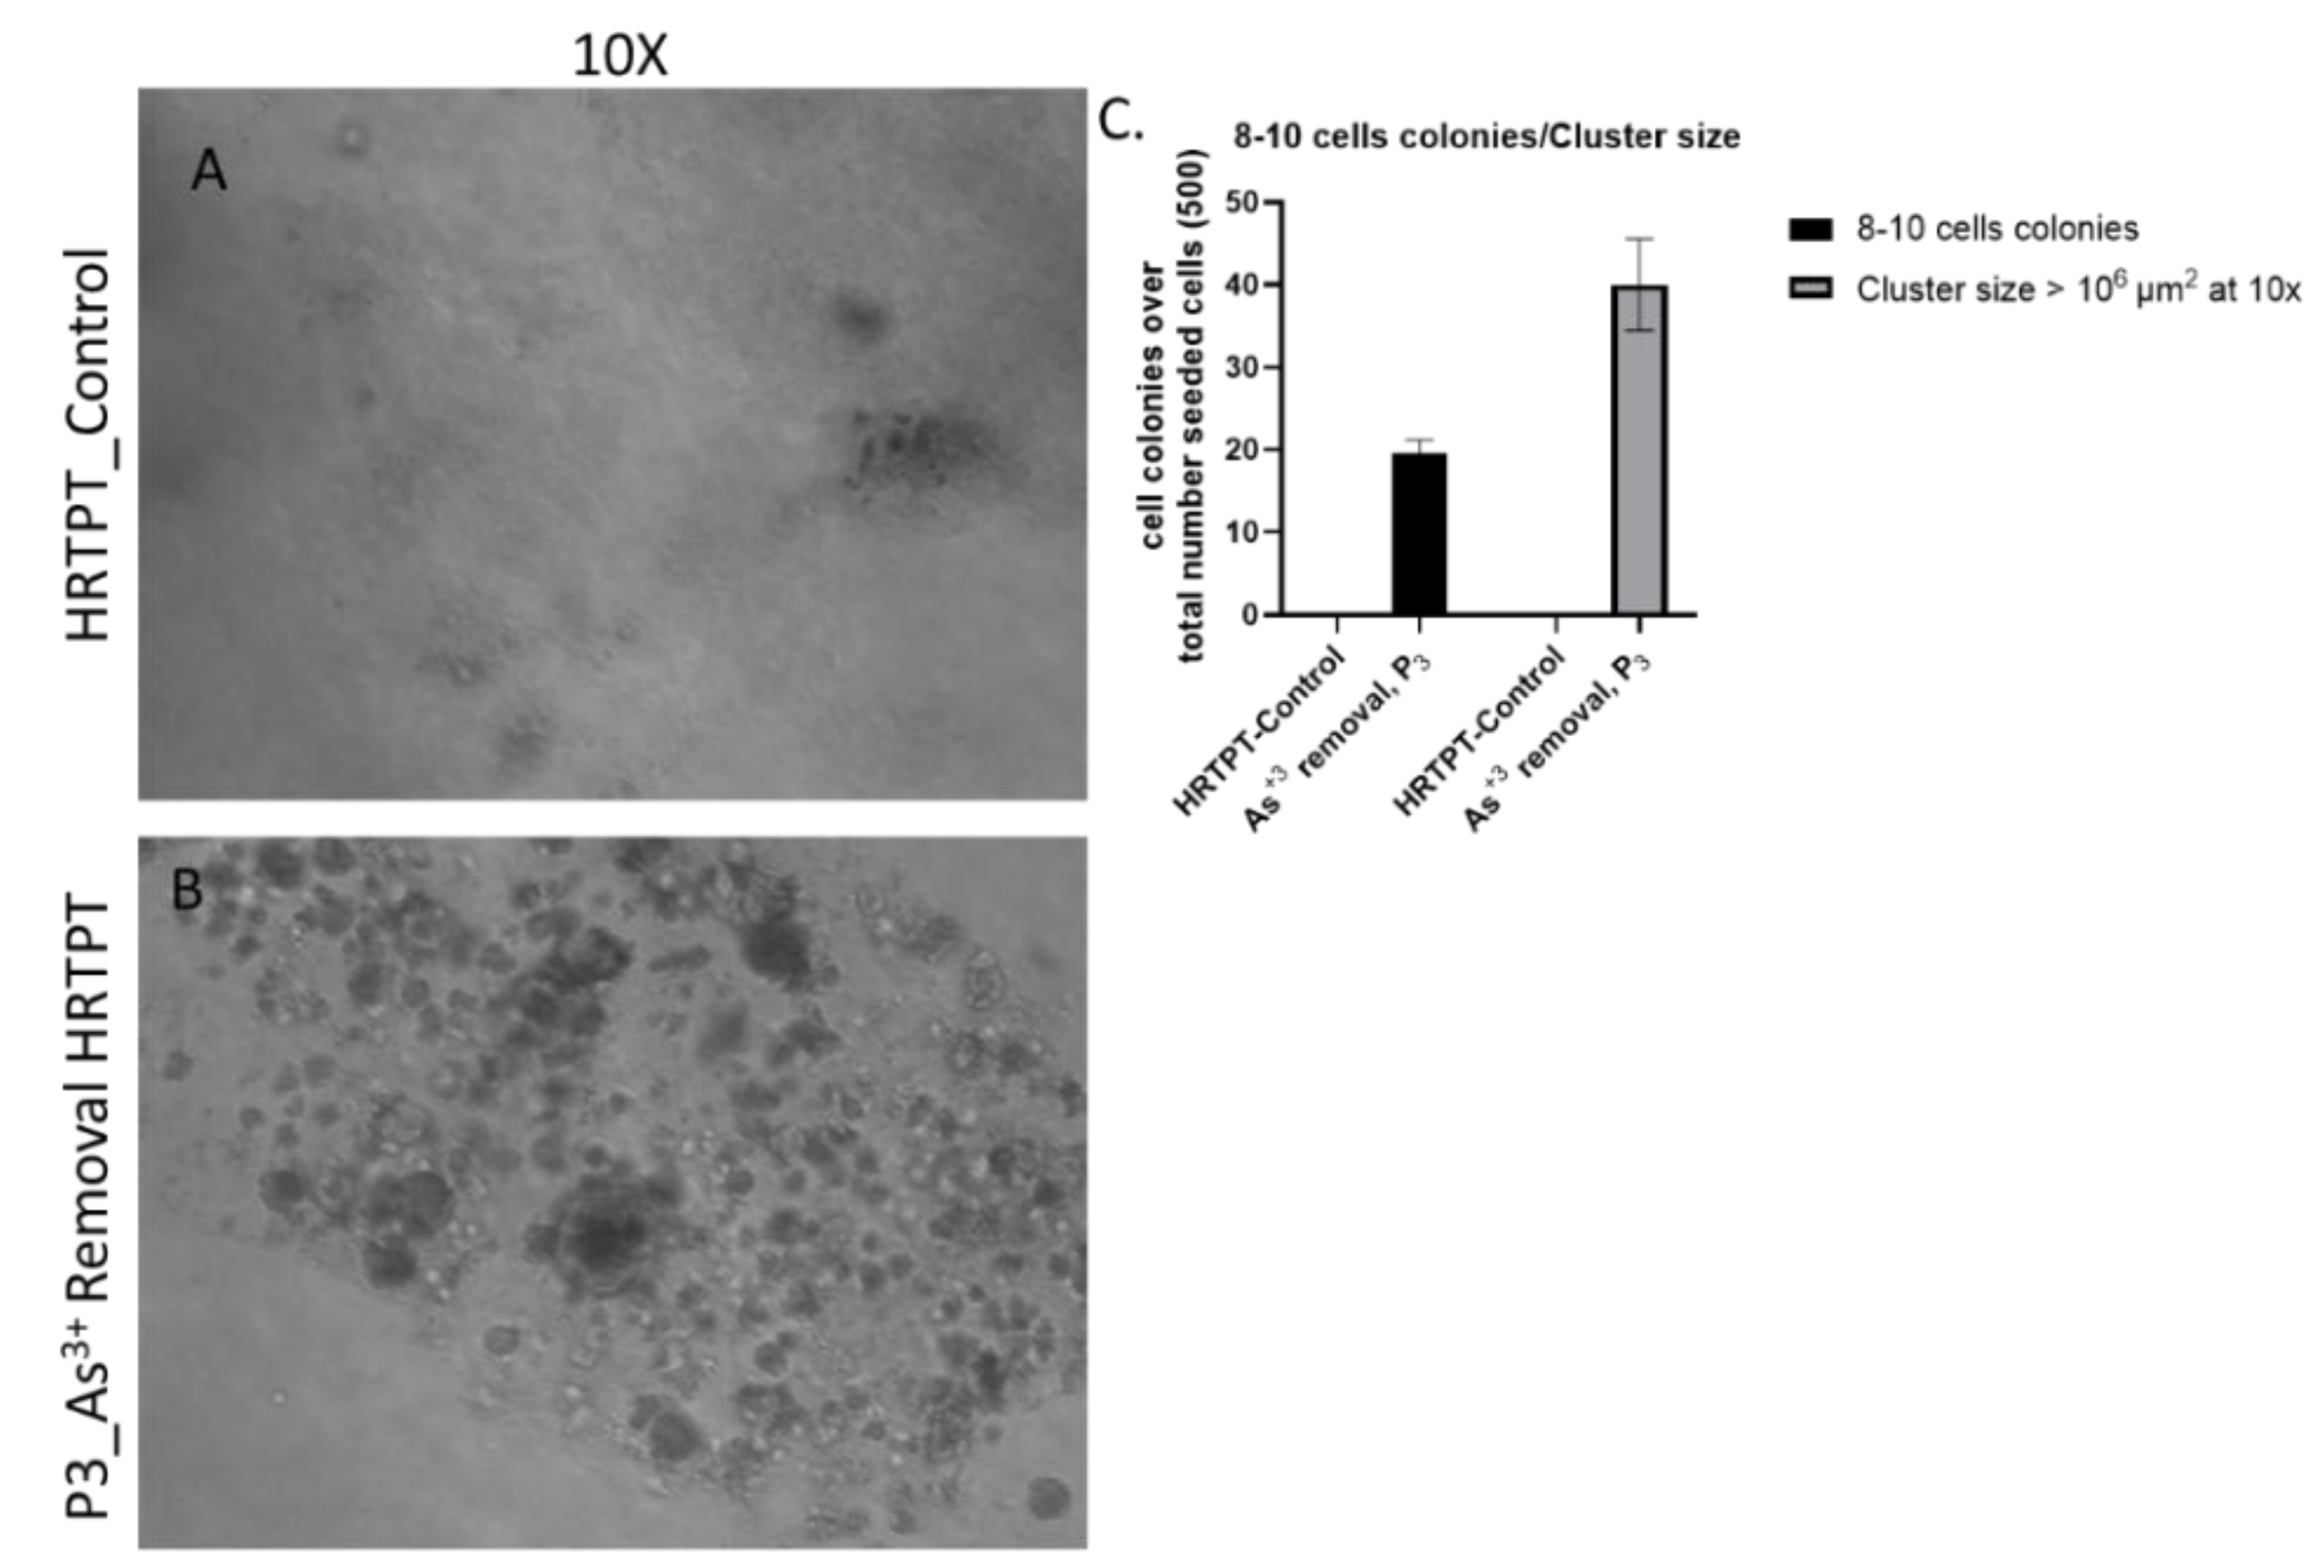
Figure 5.
D. Light level microscopy of Control-HRTPT, and P3 As+3 removed cells plated on the surface of thin matrigel coated 48-well plate. (A-B) HRTPT Control; (C-D) P3 As+3 removed cells grown on the surface of the matrigel coat. All images taken at 10X, and 20x magnification.
Figure 5.
D. Light level microscopy of Control-HRTPT, and P3 As+3 removed cells plated on the surface of thin matrigel coated 48-well plate. (A-B) HRTPT Control; (C-D) P3 As+3 removed cells grown on the surface of the matrigel coat. All images taken at 10X, and 20x magnification.
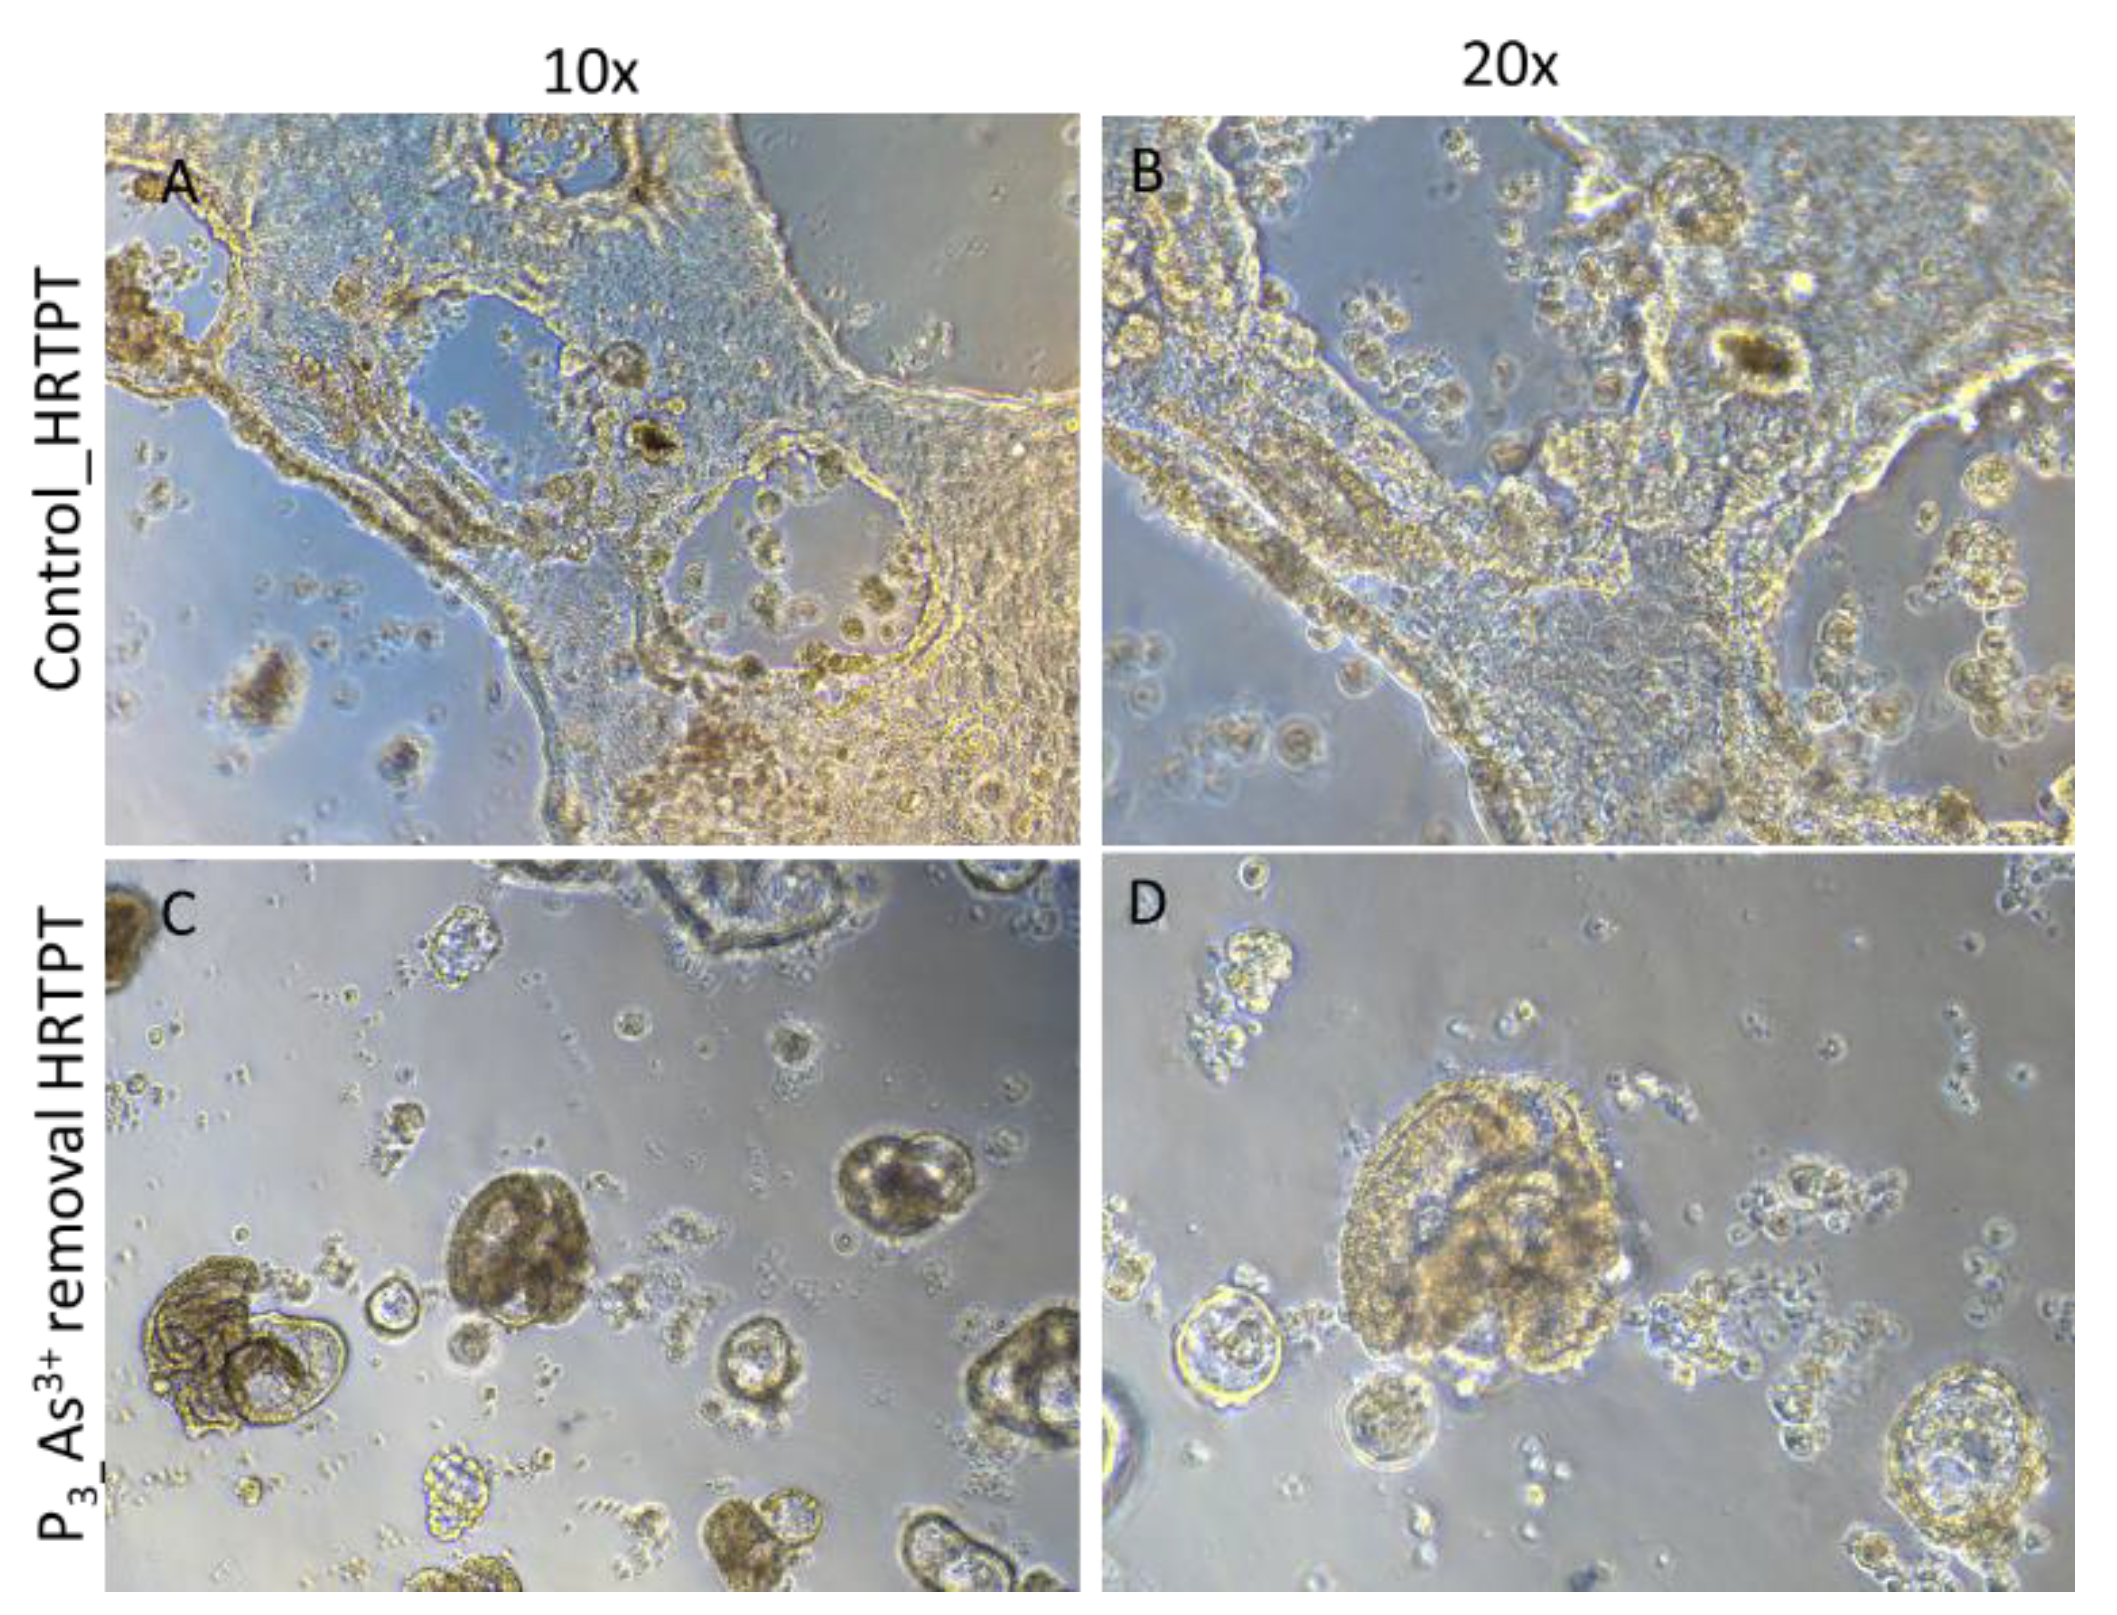
Figure 5.
E. mRNA and protein level of progenitor markers in HRTPT cell lines after removal of arsenite Vs. non- arsenite exposure. (A) mRNA_CD133- RT-qPCR analysis & (B & C) Protein_CD133 -Jess analysis, (D) mRNA_CD24- RT-qPCR analysis (E & F) protein_CD24-wetern blot analysis, ****; ***; **; * indicates significant differences in protein expression level compared to the control 0.0 µM arsenite concentration at p-value of ≤ 0.0001; ≤ 0.001; ≤ 0.01; ≤ 0.05 respectively.
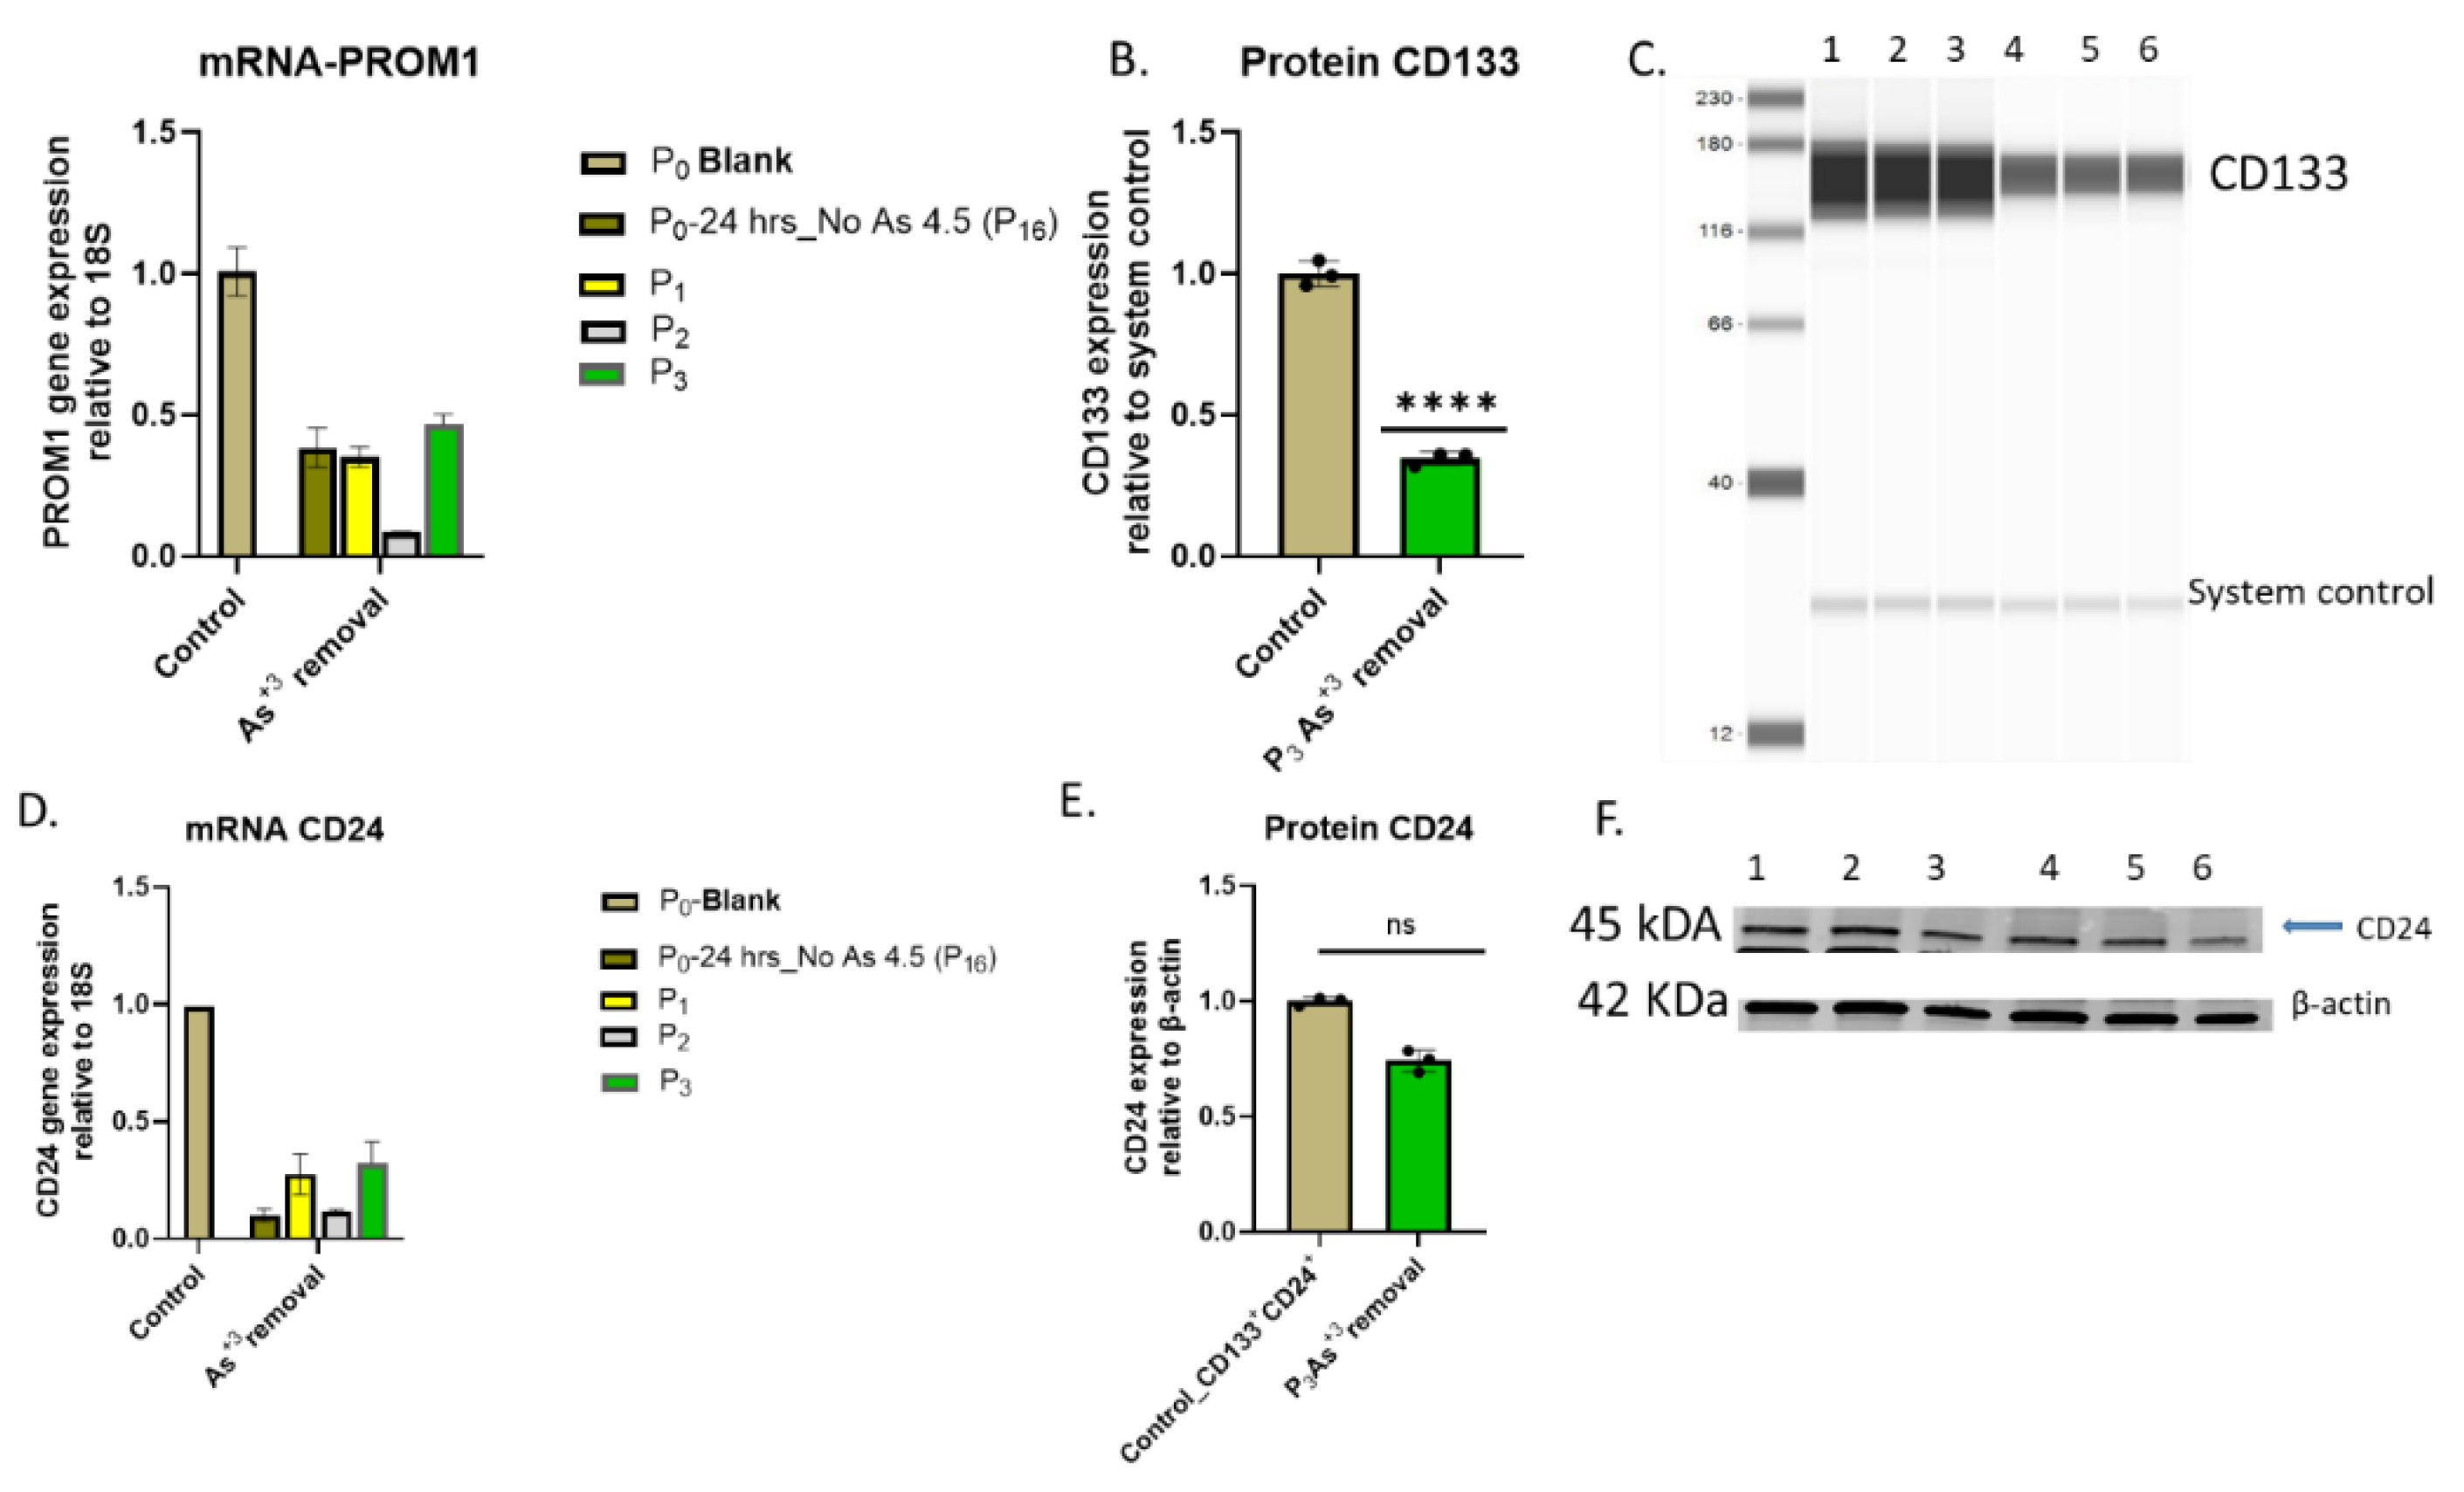
Figure 5.
F. mRNA and protein level of EMT markers in HRTPT cell lines after removal of arsenite Vs. non-As+3 exposure control. (A) mRNA_E-cadherin- RT-qPCR analysis & (B & G) Protein_CDH1 –western blot analysis, (C) mRNA_N-cadherin- RT-qPCR analysis (D & G) protein_CDH2-wetern blot analysis, (E) mRNA_CD44- RT-qPCR analysis (F & G) protein_CD44-wetern blot analysis ****; ***; **; * indicates significant differences in protein expression level compared to the control 0.0 µM arsenite concentration at p-value of ≤ 0.0001; ≤ 0.001; ≤ 0.01; ≤ 0.05 respectively.
3. Discussion
The present study shows that iAs exposure can induce EMT in HRTPT cells that co-express PROM1 and CD24 and demonstrate the properties expected of a renal progenitor cell. The two most frequently studied markers of EMT are E-cadherin (CDH1) and N-cadherin. CDH1 is one of the main epithelial markers that is downregulated in the process of EMT. CDH2 is contradictory to CDH1, and its increased expression is a marker of ongoing EMT [23,24]. Cadherin switching to high N-cadherin and low E-cadherin expression is essential for EMT. VIM functions as a positive regulator of EMT and upregulation is strongly related to induction of EMT [25]. The expression of these markers in the HRTPT cells exposed to iAs for 20 passages reinforce the notion that iAs exposure caused the cells to undergo EMT. Three types of EMT have been defined; type 1 is involved in embryogenesis and organ development, type-2 is associated with tissue regeneration, wound healing, and organ fibrosis, and type-3 is implicated in cancer progression through the occurrence of genetic and epigenetic alterations promoting clonal outgrowth and the formation of localized tumors [26]. Within these definitions of EMT, there is ambiguity beyond just cadherin switching due to evidence of partial EMT in both type 2 and type 3 EMT, making it difficult to determine where the iAs exposed HRTPT cell fall within this process. Type 1 EMT can be eliminated from consideration since it is involved in embryonic development. There appears to be considerable overlap between type 2 and 3 as many associated markers are present in both types. An example of this in the present study is the increased expression of CD44 over 30 population doublings of the iAs exposed cells. Increased expression of CD44 is both an independent risk factor for patient death in ccRCC and is also found in renal tubular cells undergoing repair and regeneration [22,27]. This overlap in expression was also shown for the iAs exposed HRTPT cells when gene expression correlated with cycle tubules in damaged kidneys and with gene expression in cancer cell lines. At least for cells in culture, the only definitive separation is if the iAs exposed cells form tumors upon xenotransplantation in immune compromised mice. Since the HRTPT cells exposed to iAs for 20 passages did not form tumors, thus the requirement for a fully developed EMT in type 3 EMT falls short. However, the HRTPT cells retained the ability for spheroid formation and growth in soft agar. Thus, the HRTPT cells exposed to iAs for 20 serial passages fall somewhere between type 2 EMT involved in renal repair and type 3 EMT that is progressing to tumorigenicity.
The finding that the results can encompass both type 2 and type 3 EMT is not mutually exclusive. Exposure to iAs is implicated in both CKD and ccRCC [2,4,5,28,29]. However, what is important is that the iAs exposed cell at extended passage still maintained the expression of PROM1 and CD24 along with properties expected of a progenitor cell. Theoretically, this means that the HRTPT cells at extended iAs exposure could progress to damaged cells associated with the development of CKD or ccRCC. Cells co-expressing PROM1 and CD24 have been isolated from ccRCC tumors as a small overall component of the tumor but with progenitor properties [30]. Their low abundance in ccRCC tumors would likely be below that detectable using immunohistochemical studies of formalin fixed, paraffin embedded tissue from patients treated for ccRCC. Like their normal adult renal progenitor counterparts (ARPCs), these RCC-derived cells (RDCs) displayed self-renewal ability, clonogenic multipotency, stemness-related elements. Like the iAs exposed HRTPT cells, the PROM1 expressing RCC cells did not form tumors upon xenotransplantation, but when co-transplanted with RCC cells, they enhanced tumor engraftment, vascularization, and growth [31].
Implicating iAs exposure to ARPCs and the progression to CKD does not have a convenient endpoint like cancer formation since the involved cells are replaced by fibrotic tissue. It has been known for many years that the kidney is susceptible to acute exposure to iAs [32]. The role for iAs exposure in the development of CKD relies on epidemiological studies on human populations [4,33]. These 2 studies from Tiawan assessed low to moderate exposures to iAs. Other than the previous publication from this laboratory [17] and the current study, there are few, if any, long term or acute studies on the effect of iAs or other toxicants on human ARPCs. The immortalized HRTPT cell line was used to close this gap in the literature as it can undergo extended serial passage and the individual cells co-express PROM 1 and CD24 as determined by flow cytometry. These properties allowed the first in vitro examination of iAs exposure to human ARPCs over an extended period in culture and clearly showed that iAs can produce EMT of the ARPCs. The removal of iAs after 20 serial passages provided evidence that the iAs induced changes remained for at least 3 passages in the absence of iAs. This included the large increase in the expression of CD44 that occurred upon extended passage of the iAs exposed cells. The iAs was removed from the confluent cells 48 hours prior to the initial subculture. This is in contrast with the earlier study where iAs removal rapidly returned the HRTPT cells to the morphology and the gene expression pattern of the parent control cells [17]. This provides initial evidence that the long-term changes due to iAs exposure might be long-lasting or permanent with retainment of progenitor properties.
A major role of cell culture is to provide in vitro clues for subsequent examination in human disease, in this case CKD. The limitations of cell culture are well known and include the lack of interaction with the ECM, the immune system, the adjacent cell types, and the secreted factors from other organs and distant cells. Conversely, these disadvantages also provide an advantage for the testing of effector agents. The serum-free growth media allows testing without the interference from fetal calf serum. Cell culture provides an avenue to test the consequences of renal toxicants on progenitor cells. However, to data there are very few studies using a system where a culture system is composed of only cells co-expressing CD24 and PROM1. One study that was identified used primary cultures of ARPCs in co-culture experiments to demonstrate ARPCs could mediate cisPT damage to a putative culture of human proximal tubule cells [34]. The finding that the reduction in toxicity was mediated by exosomes from the ARPC demonstrates a novel way ARPC may alter adjacent cell behavior. Overall, primary and immortalized cultures of ARPC are needed to study how external agents might affect renal repair and regeneration.
4. Materials and Methods
4.1. Cell Culture and Reagents
Parental RPTEC-TERT cells were obtained from American Type Culture Collection (ATCC) and the HRTPT cell line has been established previously described [16,35]. The culture medium consisted of a 1:1 mixture of DMEM: F12 serum-free media supplemented with selenium (5 ng/mL), insulin (5 μg/mL), transferrin (5 μg/mL), hydrocortisone (36 ng/mL), triiodothyronine (4 pg/mL), and epidermal growth factor (10 ng/mL). Confluent cultures of HRTPT cells were exposed to 4.5 µM iAs+3 (sodium arsenite) for 24 hrs and then subcultured at a 1:3 ratio in the continued presence of iAs until confluent. Following confluence, the cells were serially subcultured again in the presence of iAs until confluent. This was repeated for 19 serial passages. Every passage was examined microscopically, and harvested cells were preserved for RT-qPCR and protein analysis.
4.2. RNA Extraction and RT-qPCR
The mRNA and protein expression of individual genes was determined using RT qPCR, and western blotting as described previously [16,35,36]. Confluent cell cultures were harvested to make RNA cell pellets, which were then flash-frozen under liquid nitrogen. After lysing the cell pellets with 350 µL RLT® buffer (Qiagen, Hilden, Germany), they were dissociated using Qiashredder tubes (Qiagen) for 2 minutes at 12,500 rpm. Isolation of RNA was carried out using QIAGEN's RNeasy Mini Plus Kit (#74034) and QIAcube instrument (Hilden, Germany), according to manufacturer's protocols. NanoDrop spectrophotometer was used to quantify RNA (Thermo Fisher Scientific, Waltham, MA, USA). We synthesized cDNA from the total RNA using a LunaScript® RT SuperMix Kit (New England Biolabs #E3010L, Ipswich, MA, USA) as recommended by the manufacturer. A final concentration of 20 ng/µL was obtained by diluting cDNA with nuclease-free water. Two micro liters of cDNA (20ng) were used for qPCR, and the results were analyzed using the BioRad CFX96 Touch Real-Time PCR Detection System (Hercules, CA, USA) and the Luna® Universal qPCR Master Mix (New England Biolabs #M3003E). The parameters for the qPCR cycle were one 2-minute cycle at 95°C, forty 5-second cycles at 95°C, and thirty seconds at the 60°C annealing temperature. Using 18S as the reference control gene, expression levels were calculated using threshold cycle (Ct) values using the 2-∆∆Ct technique.
4.3. Western Blot
Protein expression was determined by Western blot analysis using protocols that have been previously published by this laboratory [16,35,36,37]. The HRTPT cell pellets were lysed in an ice-cold RIPA buffer containing equal volumes of protease inhibitors, phenylmethylsulfonyl fluoride (PMSF) and sodium orthovanadate (Santa Cruz) and incubated 15 mins on ice by shaking. The extracts were seared using a sonicator for about 15 Seconds two times, keeping them on ice and centrifuged for 13000xg for 10 mins at 4oC. The supernatants were transferred to fresh, cold microfuge tubes and protein quantification was performed using BCA assay (ThermoScientific). After quantifying the samples, if required, each sample was diluted to 50 μg with RIPA; mixed with Laemmli buffer (Bio-Rad) and boiled for 5 mins at 95oC. The samples are quickly centrifuged for 10 secs and loaded on a TGX AnyKd SDS polyacrylamide gel (Bio-Rad Laboratories) and transferred to a nitrocellulose membrane (Amersham Biosciences, Piscataway, NJ). The blots were blocked in Tris-buffered saline (TBS) containing 0.1% Tween-20 (TBS-T) and 5% [wt/vol] nonfat dry milk for 1 hour at room temperature on the same day after being rinsed for 5 minutes in TBST. Following blocking, the membranes underwent three 15-minute TBS-T washes before being probed with the corresponding primary antibody for a whole night at 4°C in a shaker. The primary antibodies were made using 3% BSA or 5% non-fat milk in TBS-T, and they were diluted using the proper dilution factor.
4.4. Immunofluorescence
Immunolocalization experiment was done following previously described procedures [38,39]. Cells grown on number 1.5 (0.17 mm thickness) coverslips to confluency and fixed with 3.7% paraformaldehyde (Pre-warmed at 37°C) in PBS (500 µL/each well) for 15 min, followed by three PBS- wash each for 5 minutes. Next step, permeabilization which is 500 µL of 0.1% Triton-X 100 in 1X PBS- for 10 min. The coverslips were washed three times using PBS for 5 mins followed by blocking with 1% BSA in 1X PBS for 30 min, quick rinse with two times wash with 1X PBS, rinse three times 5 minutes, and incubated with primary antibody (1%BSA in 1 X PBS-, 66 µL of antibody solution/per cover slip, vortex to mix and spin briefly) for 45 min in room temperature. The primary antibodies were diluted in PBS and an appropriate dilution factor was utilized (Table II-2). The cells were washed three times with PBS- for 3 mins each. Secondary antibody (60 µL) was added to the coverslip and incubated for 45 min in room temperature. The primary antibody was detected by incubating cells with Alexa-Fluor 488 secondary antibody for 30 mins at 37 oC incubator. The coverslips were washed three times with PBS for 3 mins and mounted upside down with Prolong Diamond Antifade Mountant with DAPI (Life Technologies). The stained cells were observed and imaged using Olympus FV 3000 confocal microscope. Two coverslips per sample were set up and a minimum of 5 fields per coverslips were examined.
4.5. Sphere Formation Assay
This experiment was performed following previously described protocols [16,35,40,41,42]. Confluent culture of As+3-exposed HRTPT (P15) cells, and unexposed-HRTPT cells were detached with the BD Biosciences accutase enzyme (Cat # 561527, 2 ml for each T25 flasks) for 15 min and centrifuged with 4 ml of PBS (2000rpm, 3 min) [40]. Subsequently, PBS was removed, and cell pellets were resuspended in 1 ml media, and the cell count was done by an automated cell counter (Countess3, Invitrogen) (Trypan blue 50 ul + 50 ul of cell suspension media), and 5000 cells were seeded into two six well plate Corning™ ultra-low attachment flask (#03723038, Thermo Fisher Scientific) supplemented with 2 mL of serum free growth medium. Cells were allowed to grow undisturbed for ten days at 37 ◦C in a 5% CO2 incubator. The mechanical counter was used to count the number of spheres under a microscope for each condition. Three biological replicates were performed for each condition. To determine the statistical significance, a one-way ANOVA was used on the Graph Pad.
4.6. Matrigel™ Tubular Differentiation
This experiment was performed following previously described protocols [16,35,40,41,42]. A 48-well plate was coated with 250 µL of Okamatrix Matrigel (#354230, OkaSciences, Kelowna, BC, Canada) before solidifying for 30 minutes [40]. Each condition was seeded with 5000 cells per well with three replicates of As+3-exposed HRTPT (P15) cells, and unexposed HRTPT cells. In the following steps, 500 µL of serum-free culture medium was supplemented with 4.5 µM As+3 and control cells without As+3 were added on top of each condition. Cells were allowed to attach for 72 h at 37 ◦C in an 5% CO2 incubator. The medium was refreshed every 48 hours as the cells grew. After seven days, 14 days, and 21 days, tubular formation was monitored using light microscopy.
4.7. Soft Agar Assay
This experiment was performed following previously described protocols [20,21,43,44]. he bottom layer consisted of 0.5% agar in growth medium and the top layer consisted of 0.4% agar in growth medium. Cells were suspended in the 0.4% growth medium at 500 cells per dish prior to pouring the top layer. Petri dishes were placed in an incubator on a tray alongside an autoclaved water beaker. Cell clumps or colonies (8-10 cells aggregates was defined as cluster) were counted using a dissecting microscope after four weeks. Depending on the rate of cell cluster development, the plates were incubated for 21 to 30 days at 37°C in a humidified incubator.
4.8. Strategies for Arsenite Removal from Freeze-Down Chronic Arsenite Exposed Cells
A previously described protocol was followed for this experiment [17]. Freeze-down chronic arsenite-exposed cell pellets were taken out from -80°C, and thawed in the water bath at 42°C. Each cell pellet with DMSO was transferred into 15 ml Falcon tubes and dissolved with 9 ml of regular growth medium. Then, they were centrifuged for 3 minutes. Supernatant was removed with suction pipe and pellets was dissolved in regular growth medium & i-As+3 4.5 µM. Once HRTPT i-As exposed cells were confluent, they were washed with PBS and exposed to regular growth medium for 24 hours (P0-Arsenite removal). The next day, the confluent cells were washed twice with PBS buffer, centrifuged, and subcultured at a 1:3 ratio with regular growth medium until confluent. Three serial passages were performed in this manner. As described previously, cells were harvested for RNA and protein analysis.
Author Contributions
D. Sens, S. Garrett, S. Somji, and Md Ehsanul Haque Conceptualization, Md Ehsanul Haque and S. Garrett designed and performed experiments, analyzed data and manuscript preparation. Md Ehsanul Haque performed experiments, curated and analyzed data. Md Ehsanul Haque analyzed data and revised and helped prepare the manuscript. All authors have read and agreed to the published version of the manuscript.
Funding
The research described was supported by funds provided by the Department of Pathology and the School of Medicine and Health Sciences, University of North Dakota. Undergraduate research, graduate student mentoring, core facilities for bioinformatics, microscopy, statistics, and gene expression were supported by the ND INBRE IDeA program P20 GM103442 from the National Institute of General Medical Sciences, NIH. University of North Dakota School of Medicine and Health Sciences pilot grant.
Institutional Review Board Statement
Not applicable.
Informed Consent Statement
Not applicable.
Data Availability Statement
The original contributions presented in this study are included in the article/supplementary material. Further inquiries can be directed to the corresponding author.
Conflicts of Interest
“The authors declare no conflict of interest.”.
References
- Fatoki, J.O.; Badmus, J.A. Arsenic as an environmental and human health antagonist: A review of its toxicity and disease initiation. Journal of Hazardous Materials Advances 2022, 5, 100052. [Google Scholar] [CrossRef]
- Cohen, S.M.; Arnold, L.L.; Eldan, M.; Lewis, A.S.; Beck, B.D. Methylated arsenicals: the implications of metabolism and carcinogenicity studies in rodents to human risk assessment. Crit Rev Toxicol 2006, 36, 99–133. [Google Scholar] [CrossRef]
- Hughes, M.F.; Beck, B.D.; Chen, Y.; Lewis, A.S.; Thomas, D.J. Arsenic exposure and toxicology: a historical perspective. Toxicol Sci 2011, 123, 305–332. [Google Scholar] [CrossRef] [PubMed]
- Hsu, L.I.; Hsieh, F.I.; Wang, Y.H.; Lai, T.S.; Wu, M.M.; Chen, C.J.; Chiou, H.Y.; Hsu, K.H. Arsenic Exposure From Drinking Water and the Incidence of CKD in Low to Moderate Exposed Areas of Taiwan: A 14-Year Prospective Study. Am J Kidney Dis 2017, 70, 787–797. [Google Scholar] [CrossRef] [PubMed]
- Sotomayor, C.G.; Groothof, D.; Vodegel, J.J.; Gacitúa, T.A.; Gomes-Neto, A.W.; Osté, M.C.J.; Pol, R.A.; Ferreccio, C.; Berger, S.P.; Chong, G.; et al. Circulating Arsenic is Associated with Long-Term Risk of Graft Failure in Kidney Transplant Recipients: A Prospective Cohort Study. J Clin Med 2020, 9. [Google Scholar] [CrossRef] [PubMed]
- Robles-Osorio, M.L.; Sabath-Silva, E.; Sabath, E. Arsenic-mediated nephrotoxicity. Ren Fail 2015, 37, 542–547. [Google Scholar] [CrossRef] [PubMed]
- Peters, B.A.; Hall, M.N.; Liu, X.; Neugut, Y.D.; Pilsner, J.R.; Levy, D.; Ilievski, V.; Slavkovich, V.; Islam, T.; Factor-Litvak, P.; et al. Creatinine, arsenic metabolism, and renal function in an arsenic-exposed population in Bangladesh. PLoS One 2014, 9. [Google Scholar] [CrossRef]
- Kovesdy, C.P. Epidemiology of chronic kidney disease: an update 2022. Kidney Int Suppl (2011) 2022, 12, 7–11. [Google Scholar] [CrossRef]
- Smeets, B.; Boor, P.; Dijkman, H.; Sharma, S.V.; Jirak, P.; Mooren, F.; Berger, K.; Bornemann, J.; Gelman, I.H.; Floege, J.; et al. Proximal tubular cells contain a phenotypically distinct, scattered cell population involved in tubular regeneration. J Pathol 2013, 229, 645–659. [Google Scholar] [CrossRef] [PubMed]
- Romagnani, P.; Remuzzi, G. CD133+ renal stem cells always co-express CD24 in adult human kidney tissue. Stem cell research 2014, 12, 828–829. [Google Scholar] [CrossRef] [PubMed]
- Romagnani, P.; Lasagni, L.; Remuzzi, G. Renal progenitors: an evolutionary conserved strategy for kidney regeneration. Nat Rev Nephrol 2013, 9, 137–146. [Google Scholar] [CrossRef] [PubMed]
- Huang, J.; Kong, Y.; Xie, C.; Zhou, L. Stem/progenitor cell in kidney: characteristics, homing, coordination, and maintenance. Stem Cell Res Ther 2021, 12. [Google Scholar] [CrossRef] [PubMed]
- Lindgren, D.; Boström, A.K.; Nilsson, K.; Hansson, J.; Sjölund, J.; Möller, C.; Jirström, K.; Nilsson, E.; Landberg, G.; Axelson, H.; et al. Isolation and characterization of progenitor-like cells from human renal proximal tubules. Am J Pathol 2011, 178, 828–837. [Google Scholar] [CrossRef] [PubMed]
- Becherucci, F.; Roperto, R.M.; Materassi, M.; Romagnani, P. Chronic kidney disease in children. Clin Kidney J 2016, 9, 583–591. [Google Scholar] [CrossRef] [PubMed]
- Shrestha, S.; Singhal, S.; Kalonick, M.; Guyer, R.; Volkert, A.; Somji, S.; Garrett, S.H.; Sens, D.A.; Singhal, S.K. Role of HRTPT in kidney proximal epithelial cell regeneration: Integrative differential expression and pathway analyses using microarray and scRNA-seq. Journal of cellular and molecular medicine 2021, 25, 10466–10479. [Google Scholar] [CrossRef] [PubMed]
- Shrestha, S.; Somji, S.; Sens, D.A.; Slusser-Nore, A.; Patel, D.H.; Savage, E.; Garrett, S.H. Human renal tubular cells contain CD24/CD133 progenitor cell populations: Implications for tubular regeneration after toxicant induced damage using cadmium as a model. Toxicology and applied pharmacology 2017, 331, 116–129. [Google Scholar] [CrossRef] [PubMed]
- Singhal, S.; Garrett, S.H.; Somji, S.; Schaefer, K.; Bansal, B.; Gill, J.S.; Singhal, S.K.; Sens, D.A. Arsenite Exposure to Human RPCs (HRTPT) Produces a Reversible Epithelial Mesenchymal Transition (EMT): In-Vitro and In-Silico Study. International journal of molecular sciences 2023, 24. [Google Scholar] [CrossRef] [PubMed]
- Bahrami, M.; Darabi, S.; Roozbahany, N.A.; Abbaszadeh, H.A.; Moghadasali, R. Great potential of renal progenitor cells in kidney: From the development to clinic. Exp Cell Res 2024, 434. [Google Scholar] [CrossRef]
- Shrestha, S.; Singhal, S.; Sens, D.A.; Somji, S.; Davis, B.A.; Guyer, R.; Breen, S.; Kalonick, M.; Garrett, S.H. Elevated glucose represses lysosomal and mTOR-related genes in renal epithelial cells composed of progenitor CD133+ cells. PloS one 2021, 16, e0248241–e0248241. [Google Scholar] [CrossRef]
- Roberts, A.B.; Anzano, M.A.; Wakefield, L.M.; Roche, N.S.; Stern, D.F.; Sporn, M.B. Type beta transforming growth factor: a bifunctional regulator of cellular growth. Proc Natl Acad Sci U S A 1985, 82, 119–123. [Google Scholar] [CrossRef]
- Du, F.; Zhao, X.; Fan, D. Soft Agar Colony Formation Assay as a Hallmark of Carcinogenesis. Bio Protoc 2017, 7. [Google Scholar] [CrossRef] [PubMed]
- Chrabańska, M.; Rynkiewicz, M.; Kiczmer, P.; Drozdzowska, B. Does the Immunohistochemical Expression of CD44, MMP-2, and MMP-9 in Association with the Histopathological Subtype of Renal Cell Carcinoma Affect the Survival of Patients with Renal Cancer? Cancers (Basel) 2023, 15. [Google Scholar] [CrossRef]
- Loh, C.Y.; Chai, J.Y.; Tang, T.F.; Wong, W.F.; Sethi, G.; Shanmugam, M.K.; Chong, P.P.; Looi, C.Y. The E-Cadherin and N-Cadherin Switch in Epithelial-to-Mesenchymal Transition: Signaling, Therapeutic Implications, and Challenges. Cells 2019, 8. [Google Scholar] [CrossRef] [PubMed]
- Wheelock, M.J.; Shintani, Y.; Maeda, M.; Fukumoto, Y.; Johnson, K.R. Cadherin switching. J Cell Sci 2008, 121 Pt 6, 727–735. [Google Scholar] [CrossRef] [PubMed]
- Xu, H.; Xu, W.H.; Ren, F.; Wang, J.; Wang, H.K.; Cao, D.L.; Shi, G.H.; Qu, Y.Y.; Zhang, H.L.; Ye, D.W. Prognostic value of epithelial-mesenchymal transition markers in clear cell renal cell carcinoma. Aging (Albany NY) 2020, 12, 866–883. [Google Scholar] [CrossRef] [PubMed]
- Marconi, G.D.; Fonticoli, L.; Rajan, T.S.; Pierdomenico, S.D.; Trubiani, O.; Pizzicannella, J.; Diomede, F. Epithelial-Mesenchymal Transition (EMT): The Type-2 EMT in Wound Healing, Tissue Regeneration and Organ Fibrosis. Cells 2021, 10. [Google Scholar] [CrossRef] [PubMed]
- Matsushita, K.; Toyoda, T.; Akane, H.; Morikawa, T.; Ogawa, K. Role of CD44 expressed in renal tubules during maladaptive repair in renal fibrogenesis in an allopurinol-induced rat model of chronic kidney disease. J Appl Toxicol 2024, 44, 455–469. [Google Scholar] [CrossRef]
- Huang, C.Y.; Su, C.T.; Chung, C.J.; Pu, Y.S.; Chu, J.S.; Yang, H.Y.; Wu, C.C.; Hsueh, Y.M. Urinary total arsenic and 8-hydroxydeoxyguanosine are associated with renal cell carcinoma in an area without obvious arsenic exposure. Toxicol Appl Pharmacol 2012, 262, 349–354. [Google Scholar] [CrossRef]
- Saint-Jacques, N.; Brown, P.; Nauta, L.; Boxall, J.; Parker, L.; Dummer, T.J.B. Estimating the risk of bladder and kidney cancer from exposure to low-levels of arsenic in drinking water, Nova Scotia, Canada. Environ Int 2018, 110, 95–104. [Google Scholar] [CrossRef] [PubMed]
- Lasorsa, F.; Rutigliano, M.; Milella, M.; Ferro, M.; Pandolfo, S.D.; Crocetto, F.; Autorino, R.; Battaglia, M.; Ditonno, P.; Lucarelli, G. Cancer Stem Cells in Renal Cell Carcinoma: Origins and Biomarkers. Int J Mol Sci 2023, 24. [Google Scholar] [CrossRef] [PubMed]
- Corrò, C.; Moch, H. Biomarker discovery for renal cancer stem cells. J Pathol Clin Res 2018, 4, 3–18. [Google Scholar] [CrossRef] [PubMed]
- Saha, J.C.; Dikshit, A.K.; Bandyopadhyay, M.; Saha, K.C. A Review of Arsenic Poisoning and its Effects on Human Health. Critical Reviews in Environmental Science and Technology 1999, 29, 281–213. [Google Scholar] [CrossRef]
- Cheng, Y.-Y.; Chang, Y.-T.; Cheng, H.-L.; Shen, K.-H.; Sung, J.-M.; Guo, H.-R. Associations between arsenic in drinking water and occurrence of end-stage renal disease with modifications by comorbidities: A nationwide population-based study in Taiwan. The Science of the total environment 2018, 626, 581–591. [Google Scholar] [CrossRef] [PubMed]
- Franzin, R.; Stasi, A.; De Palma, G.; Picerno, A.; Curci, C.; Sebastiano, S.; Campioni, M.; Cicirelli, A.; Rizzo, A.; Di Lorenzo, V.F.; et al. Human Adult Renal Progenitor Cells Prevent Cisplatin-Nephrotoxicity by Inducing CYP1B1 Overexpression and miR-27b-3p Down-Regulation through Extracellular Vesicles. Cells 2023, 12. [Google Scholar] [CrossRef] [PubMed]
- Shrestha, S.; Garrett, S.H.; Sens, D.A.; Zhou, X.D.; Guyer, R.; Somji, S. Characterization and determination of cadmium resistance of CD133+/CD24+ and CD133−/CD24+ cells isolated from the immortalized human proximal tubule cell line, RPTEC/TERT1. Toxicology and applied pharmacology 2019, 375, 5–16. [Google Scholar] [CrossRef]
- Mehus, A.A.; Jones, M.; Trahan, M.; Kinnunen, K.; Berwald, K.; Lindner, B.; Al-Marsoummi, S.; Zhou, X.D.; Garrett, S.H.; Sens, D.A.; et al. Pevonedistat Inhibits SOX2 Expression and Sphere Formation but Also Drives the Induction of Terminal Differentiation Markers and Apoptosis within Arsenite-Transformed Urothelial Cells. International journal of molecular sciences 2023, 24. [Google Scholar] [CrossRef]
- Cao, L.; Zhou, X.D.; Sens, M.A.; Garrett, S.H.; Zheng, Y.; Dunlevy, J.R.; Sens, D.A.; Somji, S. Keratin 6 expression correlates to areas of squamous differentiation in multiple independent isolates of As+3-induced bladder cancer. Journal of applied toxicology 2010, 30, 416–430. [Google Scholar] [CrossRef]
- Kalyan, G.; Slusser-Nore, A.; Dunlevy, J.R.; Bathula, C.S.; Shabb, J.B.; Muhonen, W.; Somji, S.; Sens, D.A.; Garrett, S.H.; Theilig, F. Protein interactions with metallothionein-3 promote vectorial active transport in human proximal tubular cells. PloS one 2022, 17. [Google Scholar] [CrossRef] [PubMed]
- Larson, J.; Yasmin, T.; Sens, D.A.; Zhou, X.D.; Sens, M.A.; Garrett, S.H.; Dunlevy, J.R.; Cao, L.; Somji, S. SPARC gene expression is repressed in human urothelial cells (UROtsa) exposed to or malignantly transformed by cadmium or arsenite. Toxicology letters 2010, 199, 166–172. [Google Scholar] [CrossRef]
- Al-Marsoummi, S.; Mehus, A.A.; Shrestha, S.; Rice, R.; Rossow, B.; Somji, S.; Garrett, S.H.; Sens, D.A. Proteasomes Are Critical for Maintenance of CD133+CD24+ Kidney Progenitor Cells. International journal of molecular sciences 2023, 24. [Google Scholar] [CrossRef]
- McLaren, J.; Whiting, P.; Simpson, J.; Hawksworth, G. Isolation and characterisation of human proximal tubular cells derived from kidney cortical segments. Human & experimental toxicology 1995, 14, 916–922. [Google Scholar] [CrossRef]
- Sagrinati, C.; Netti, G.S.; Mazzinghi, B.; Lazzeri, E.; Liotta, F.; Frosali, F.; Ronconi, E.; Meini, C.; Gacci, M.; Squecco, R.; et al. Isolation and characterization of multipotent progenitor cells from the Bowman's capsule of adult human kidneys. J Am Soc Nephrol 2006, 17, 2443–2456. [Google Scholar] [CrossRef] [PubMed]
- San, R.H.; Laspia, M.F.; Soiefer, A.I.; Maslansky, C.J.; Rice, J.M.; Williams, G.M. A survey of growth in soft agar and cell surface properties as markers for transformation in adult rat liver epithelial-like cell cultures. Cancer research (Chicago, Ill.) 1979, 39, 1026–1034. [Google Scholar]
- Sens, D.A.; Park, S.; Gurel, V.; Sens, M.A.; Garrett, S.H.; Somji, S. Inorganic Cadmium- and Arsenite-Induced Malignant Transformation of Human Bladder Urothelial Cells. Toxicological sciences 2004, 79, 56–63. [Google Scholar] [CrossRef] [PubMed]
Figure 1.
A. Light microscopic images of HRTPT cells exposed to 4.5 µM of arsenite shows EMT-like morphological change at passage at P8 (C) scale bar =500 µm and magnification x 20. A (P0) & B (P1) Control unexposed cells; C-F- Cells exposed to 4.5 µM of arsenite passaged up to P20 (including P0-24 hrs Arsenite exposure) and grown in 1:1 DMEM/F12 media.

Figure 1.
B. mRNA and Protein level of PROM1 in HRTPT cell lines treated with 4.5 µM of i-As up to P19 passages. (A) mRNA_PROM1-RT-qPCR analysis, (B) Protein CD133 (C & D) Western analysis of CD133, ****; ***; **; * indicates significant differences in protein expression level compared to the control 0.0 µM arsenite concentration at p-value of ≤ 0.0001; ≤ 0.001; ≤ 0.01; ≤ 0.05 respectively.
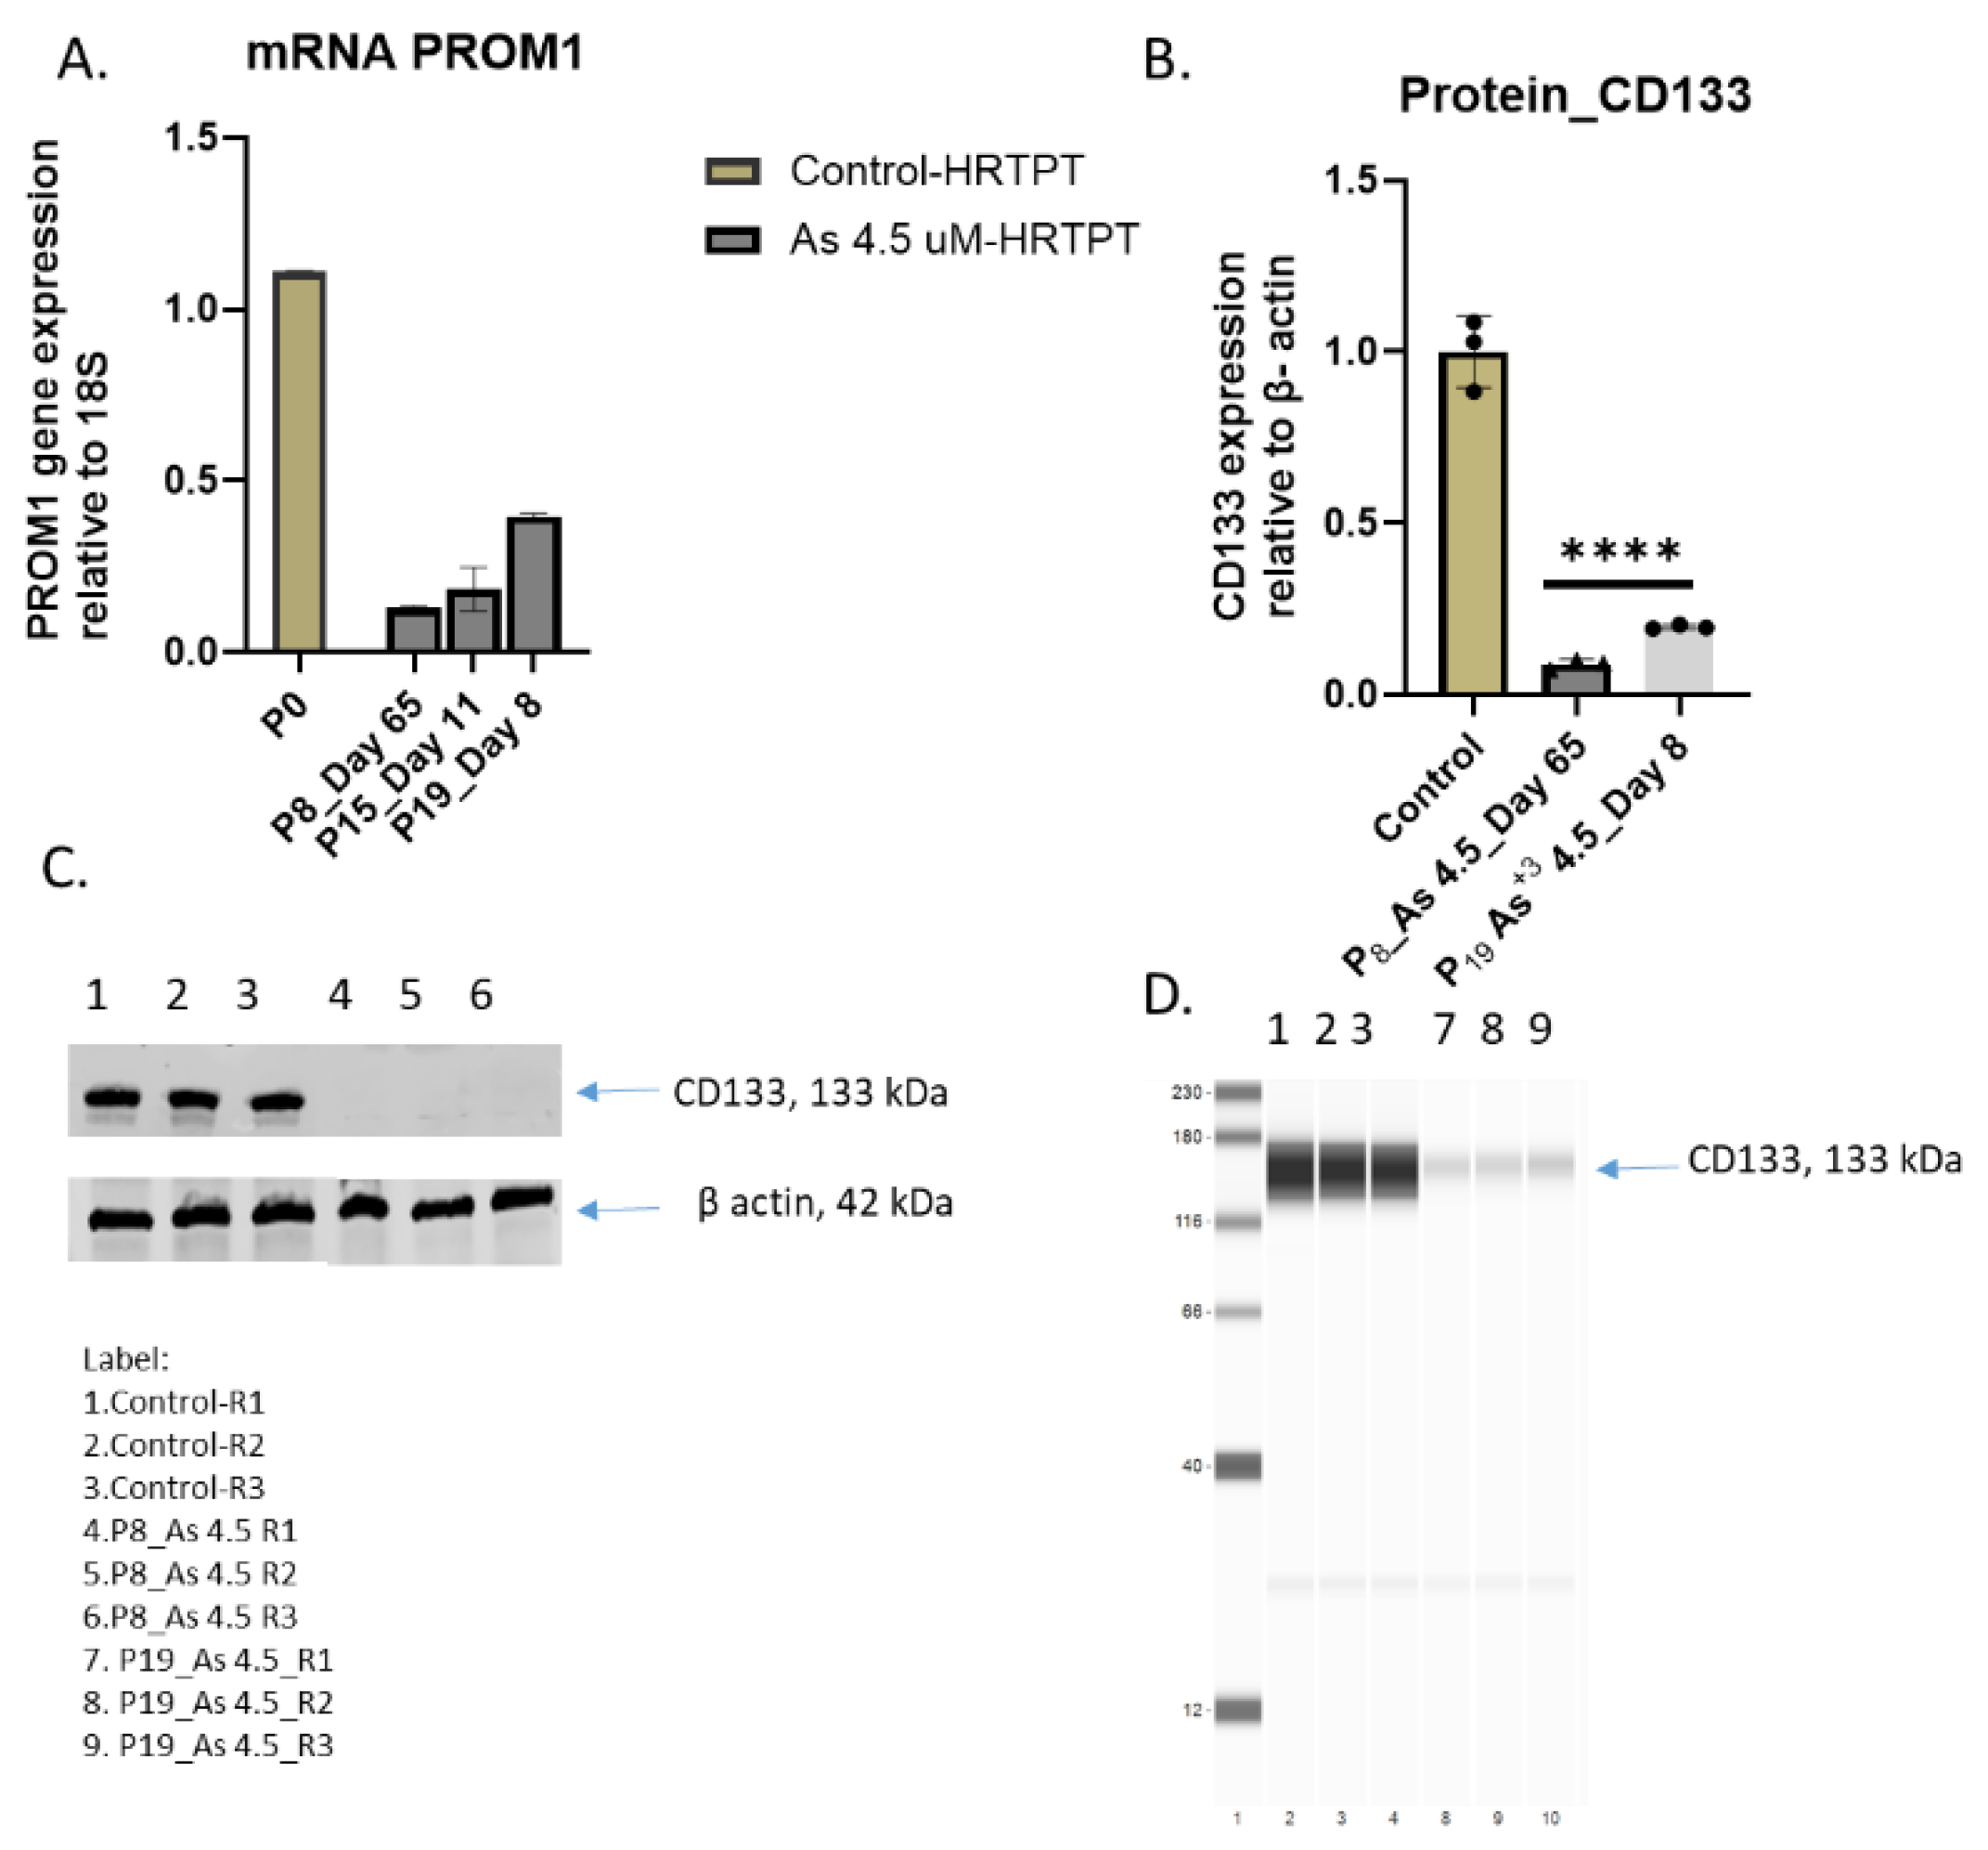
Figure 1.
C. mRNA and Protein level of CD24 in HRTPT cell lines treated with 4.5 µM of i-As up to P19 passages. (A) mRNA_CD24-RT-qPCR analysis, (B) Protein CD24 (C) Western analysis of CD24, ****; ***; **; * indicates significant differences in protein expression level compared to the control 0.0 µM arsenite concentration at p-value of ≤ 0.0001; ≤ 0.001; ≤ 0.01; ≤ 0.05 respectively.
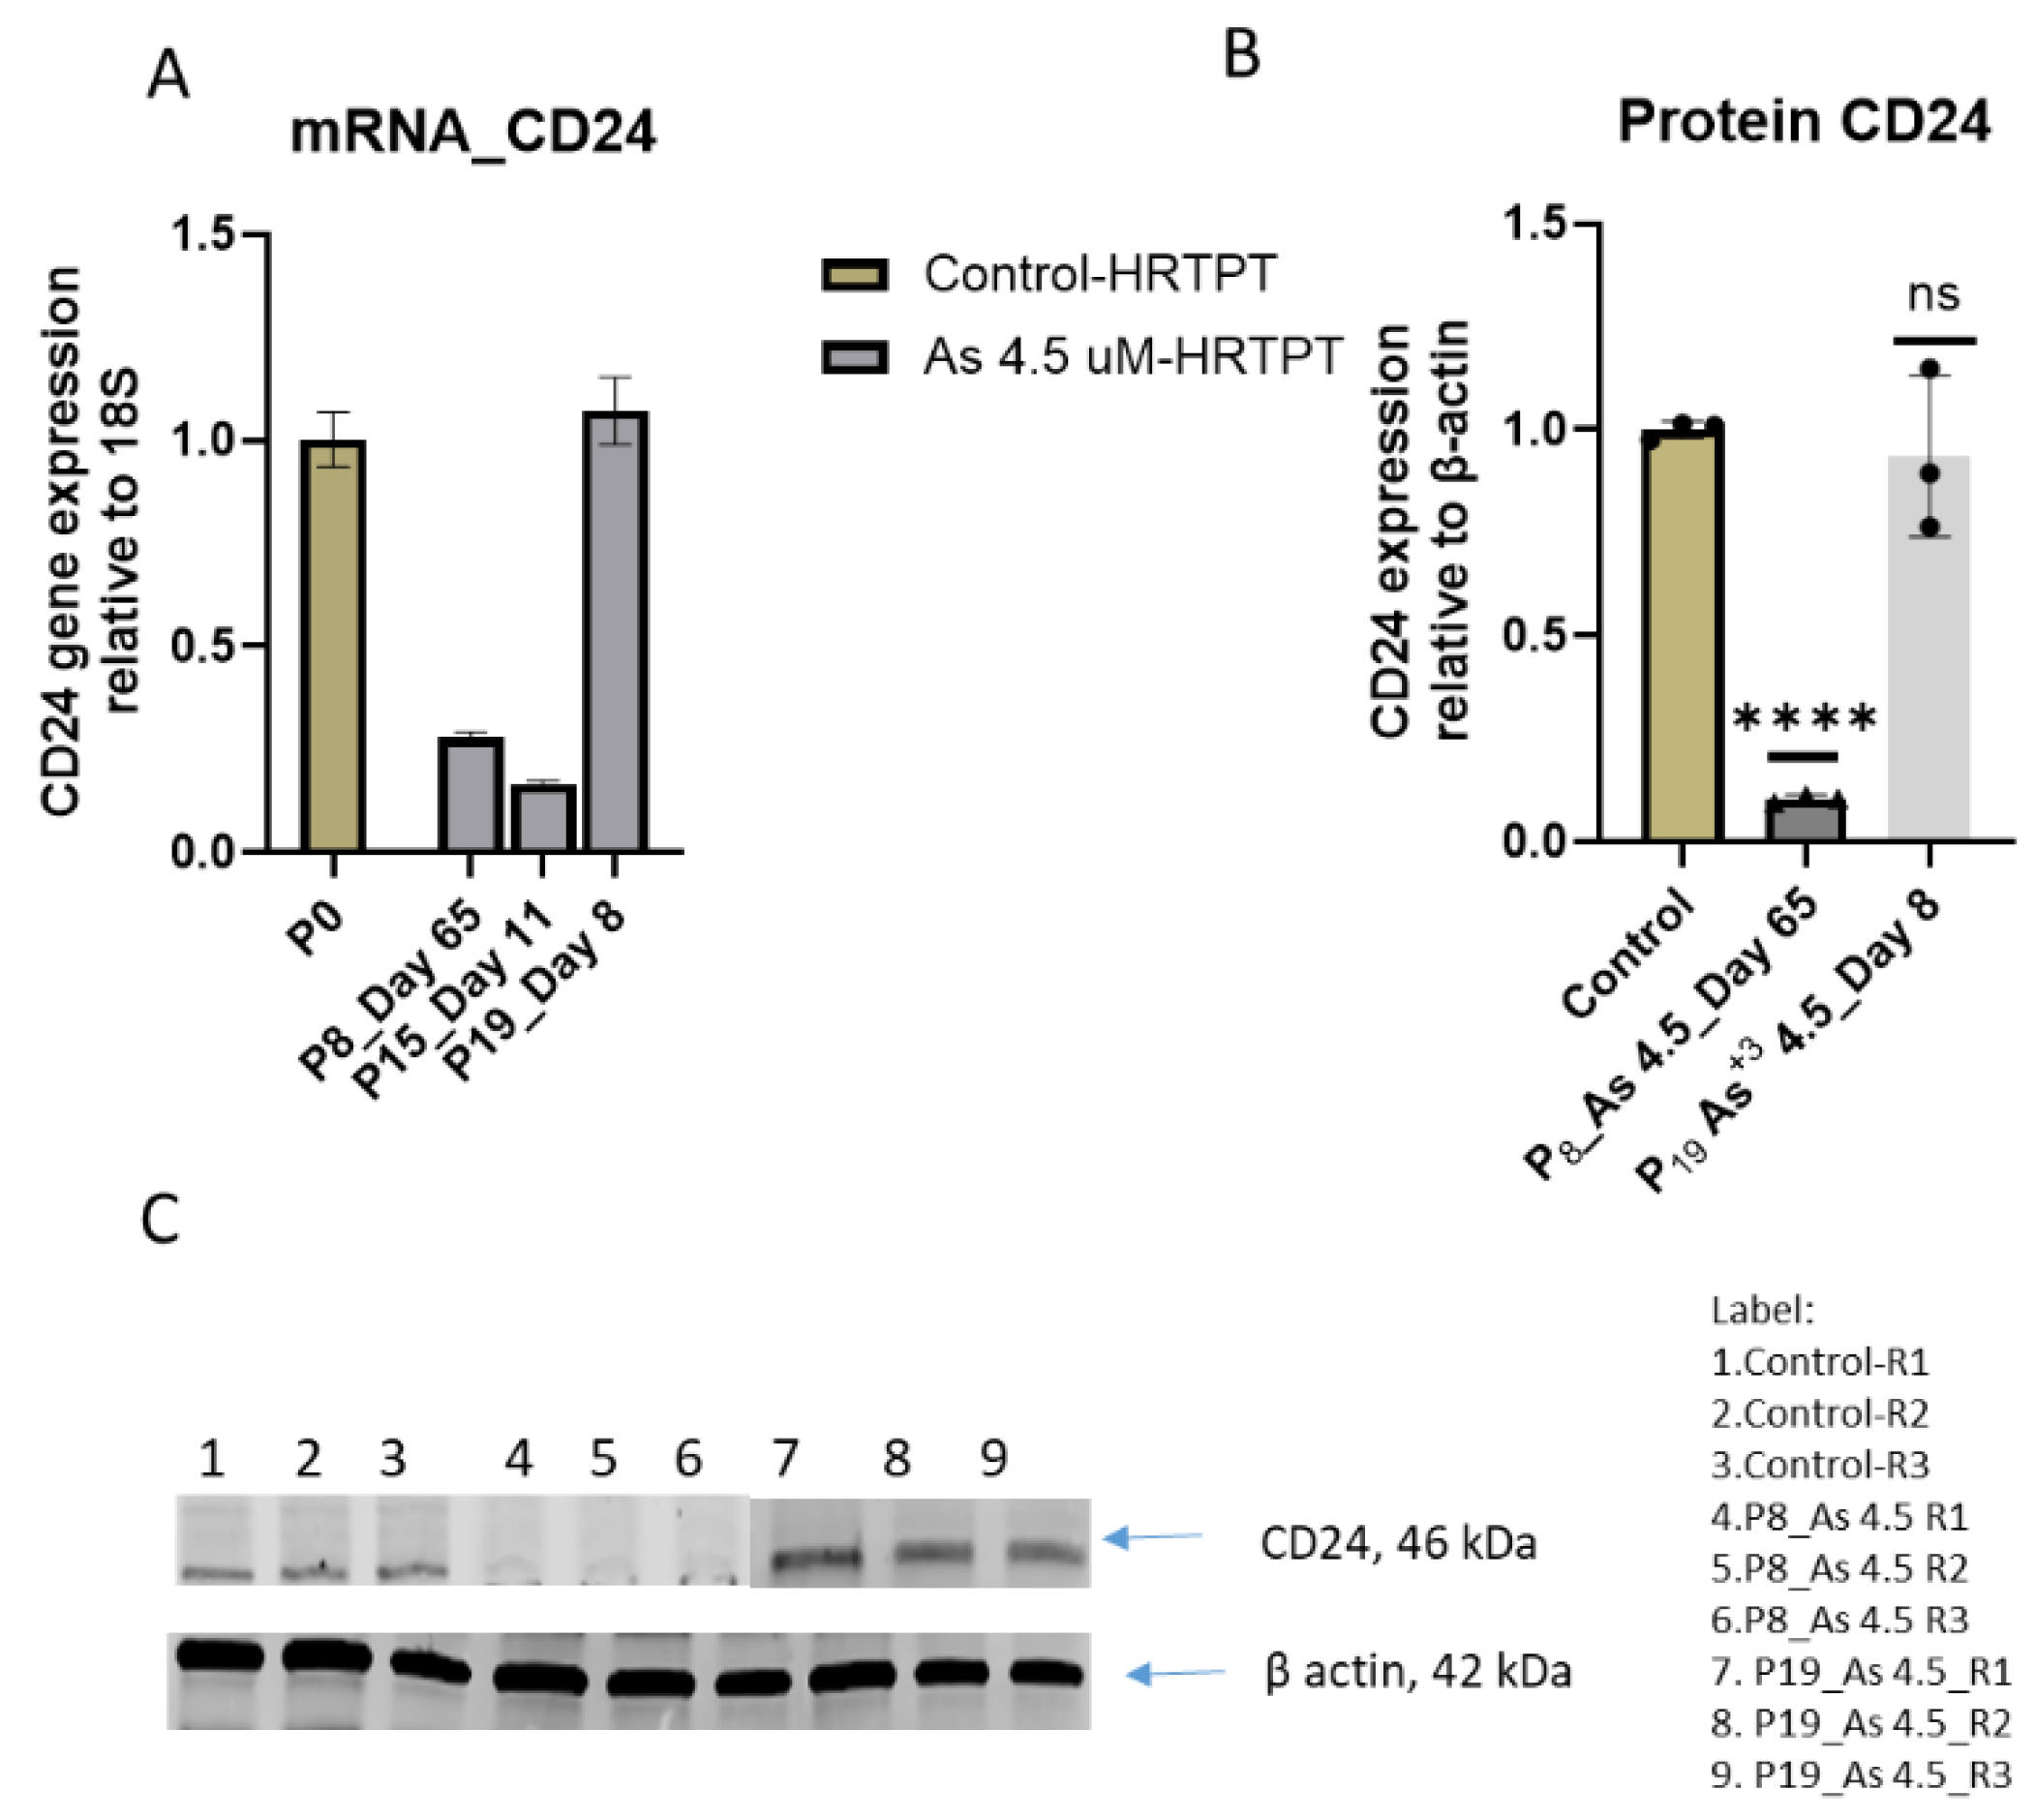
Figure 2.
A. Light level microscopy of spheroids generated from –Control-HRTPT, As 4.5µM-HRTPT (P15) cells. The spheroid images taken at 20x magnification generated from (A) Control-HRTPT cells; (B) As 4.5 µM HRTPT (p15) cells; and (C) Bar graph shows number of sphere; ****; ***; **; * indicates significant differences compared to the control 0.0 µM arsenite concentration at p-value of ≤ 0.0001; ≤ 0.001; ≤ 0.01; ≤ 0.05 respectively. All the images were taken after 21 days of seeding in the ultra-low attachment flasks.
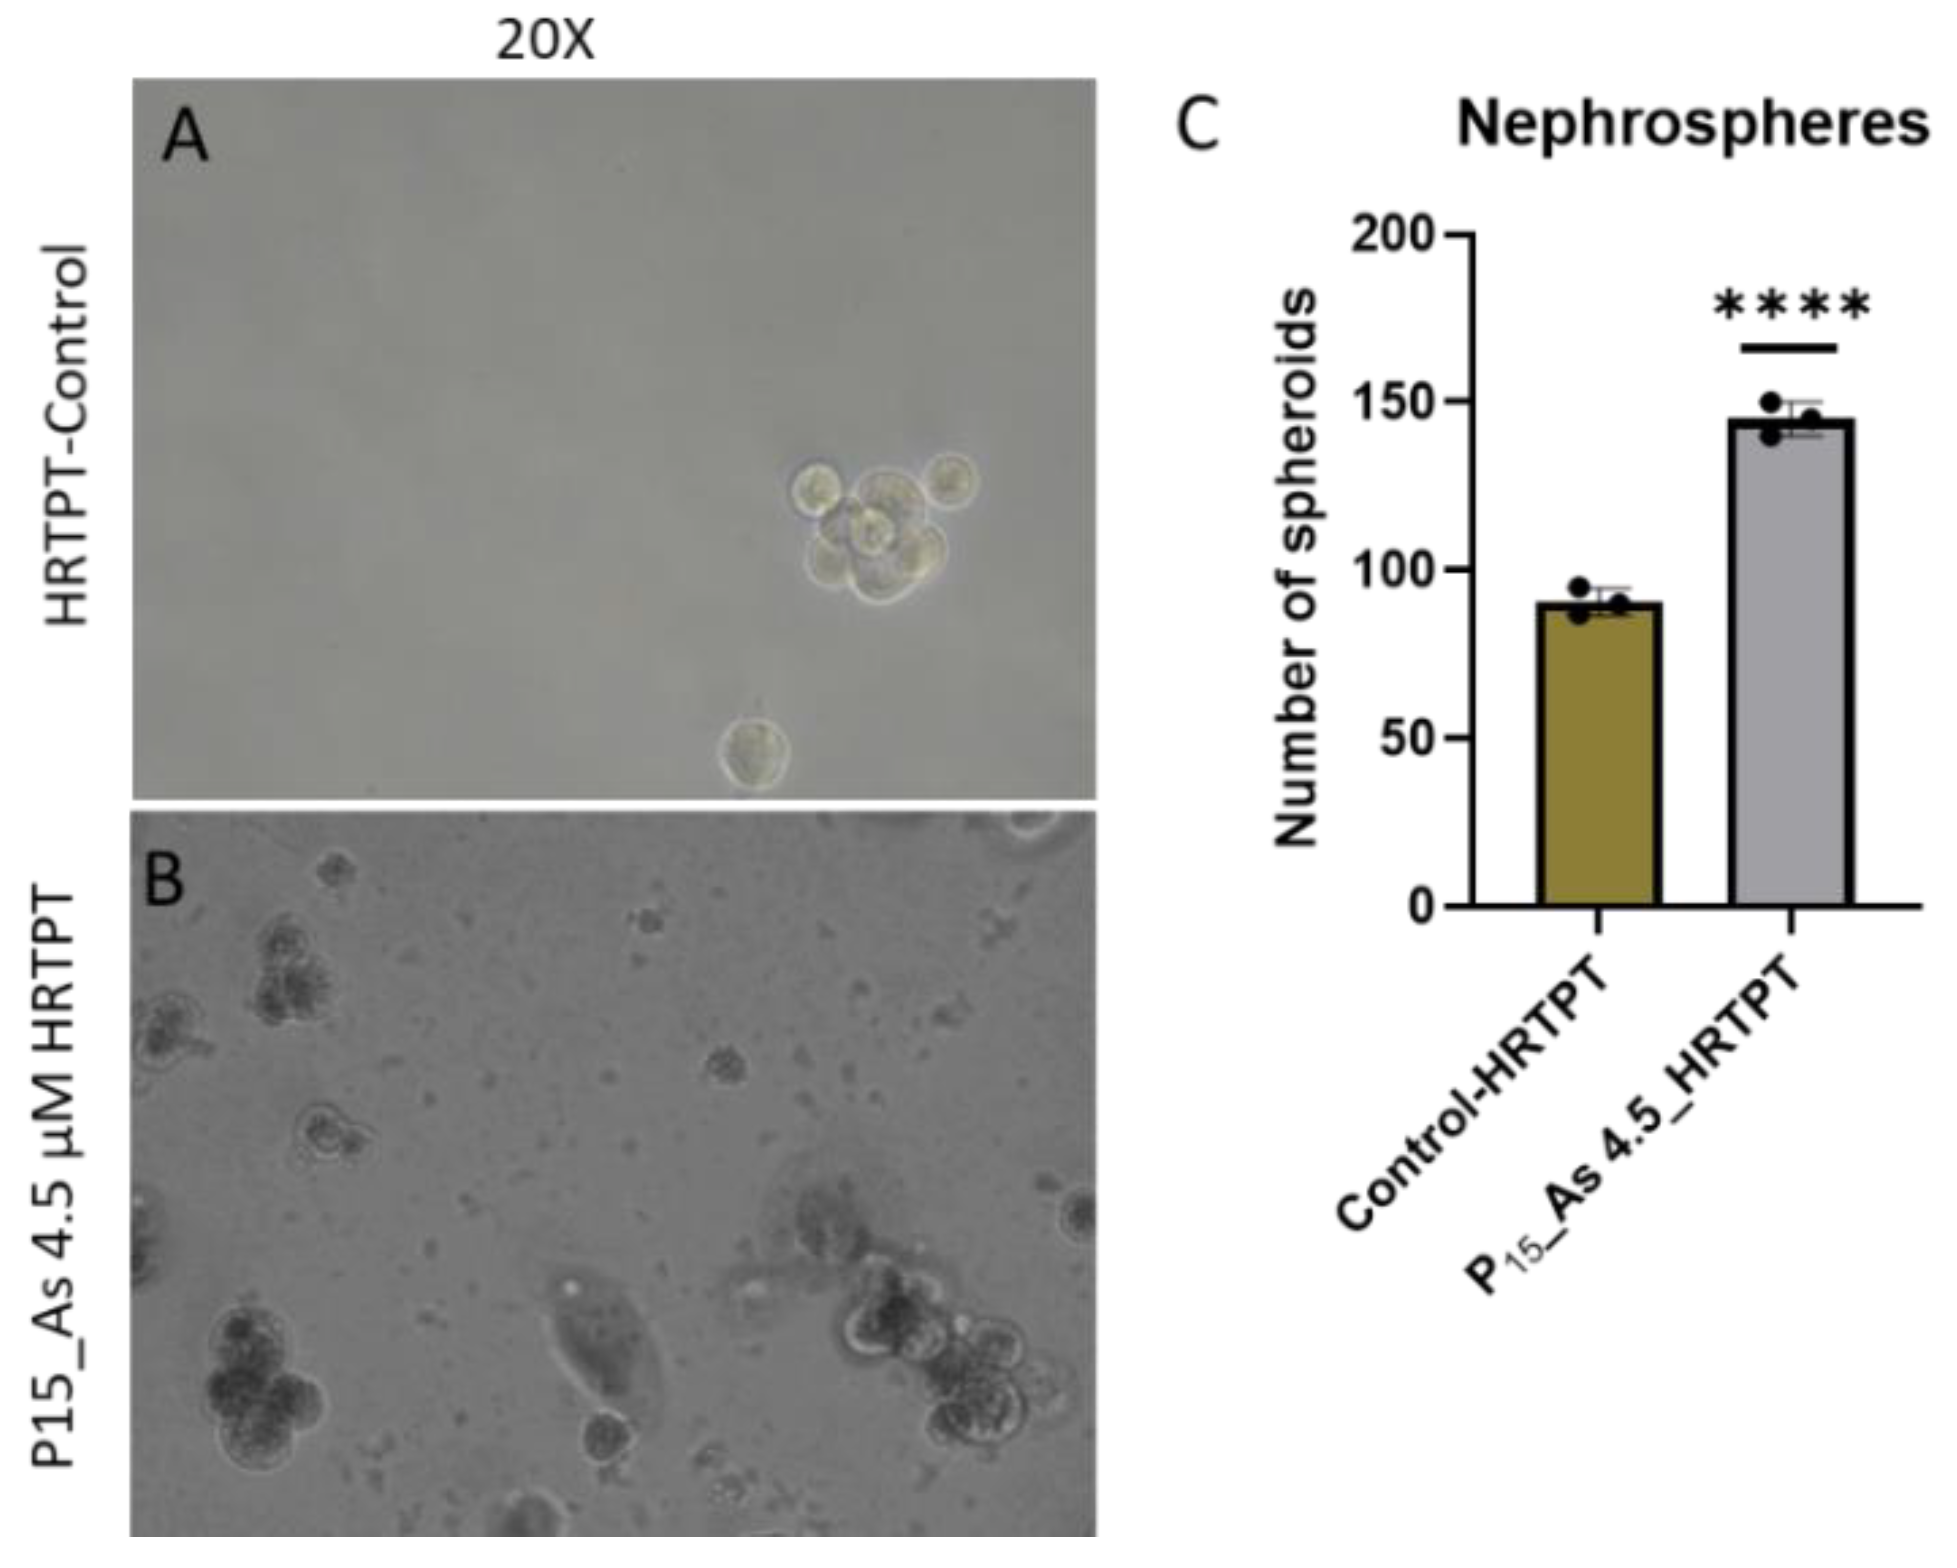
Figure 2.
B. Light level microscopy of Control-HRTPT, and As 4.5 uM-HRTPT (P15) cells plated on the surface of thin matrigel coated 48-well plate. (A-B) HRTPT Control; (C-D) As 4.5 uM-HRTPT-P15 grown on the surface of the matrigel coat. All images taken at 10X, and 20x magnification.
Figure 2.
B. Light level microscopy of Control-HRTPT, and As 4.5 uM-HRTPT (P15) cells plated on the surface of thin matrigel coated 48-well plate. (A-B) HRTPT Control; (C-D) As 4.5 uM-HRTPT-P15 grown on the surface of the matrigel coat. All images taken at 10X, and 20x magnification.
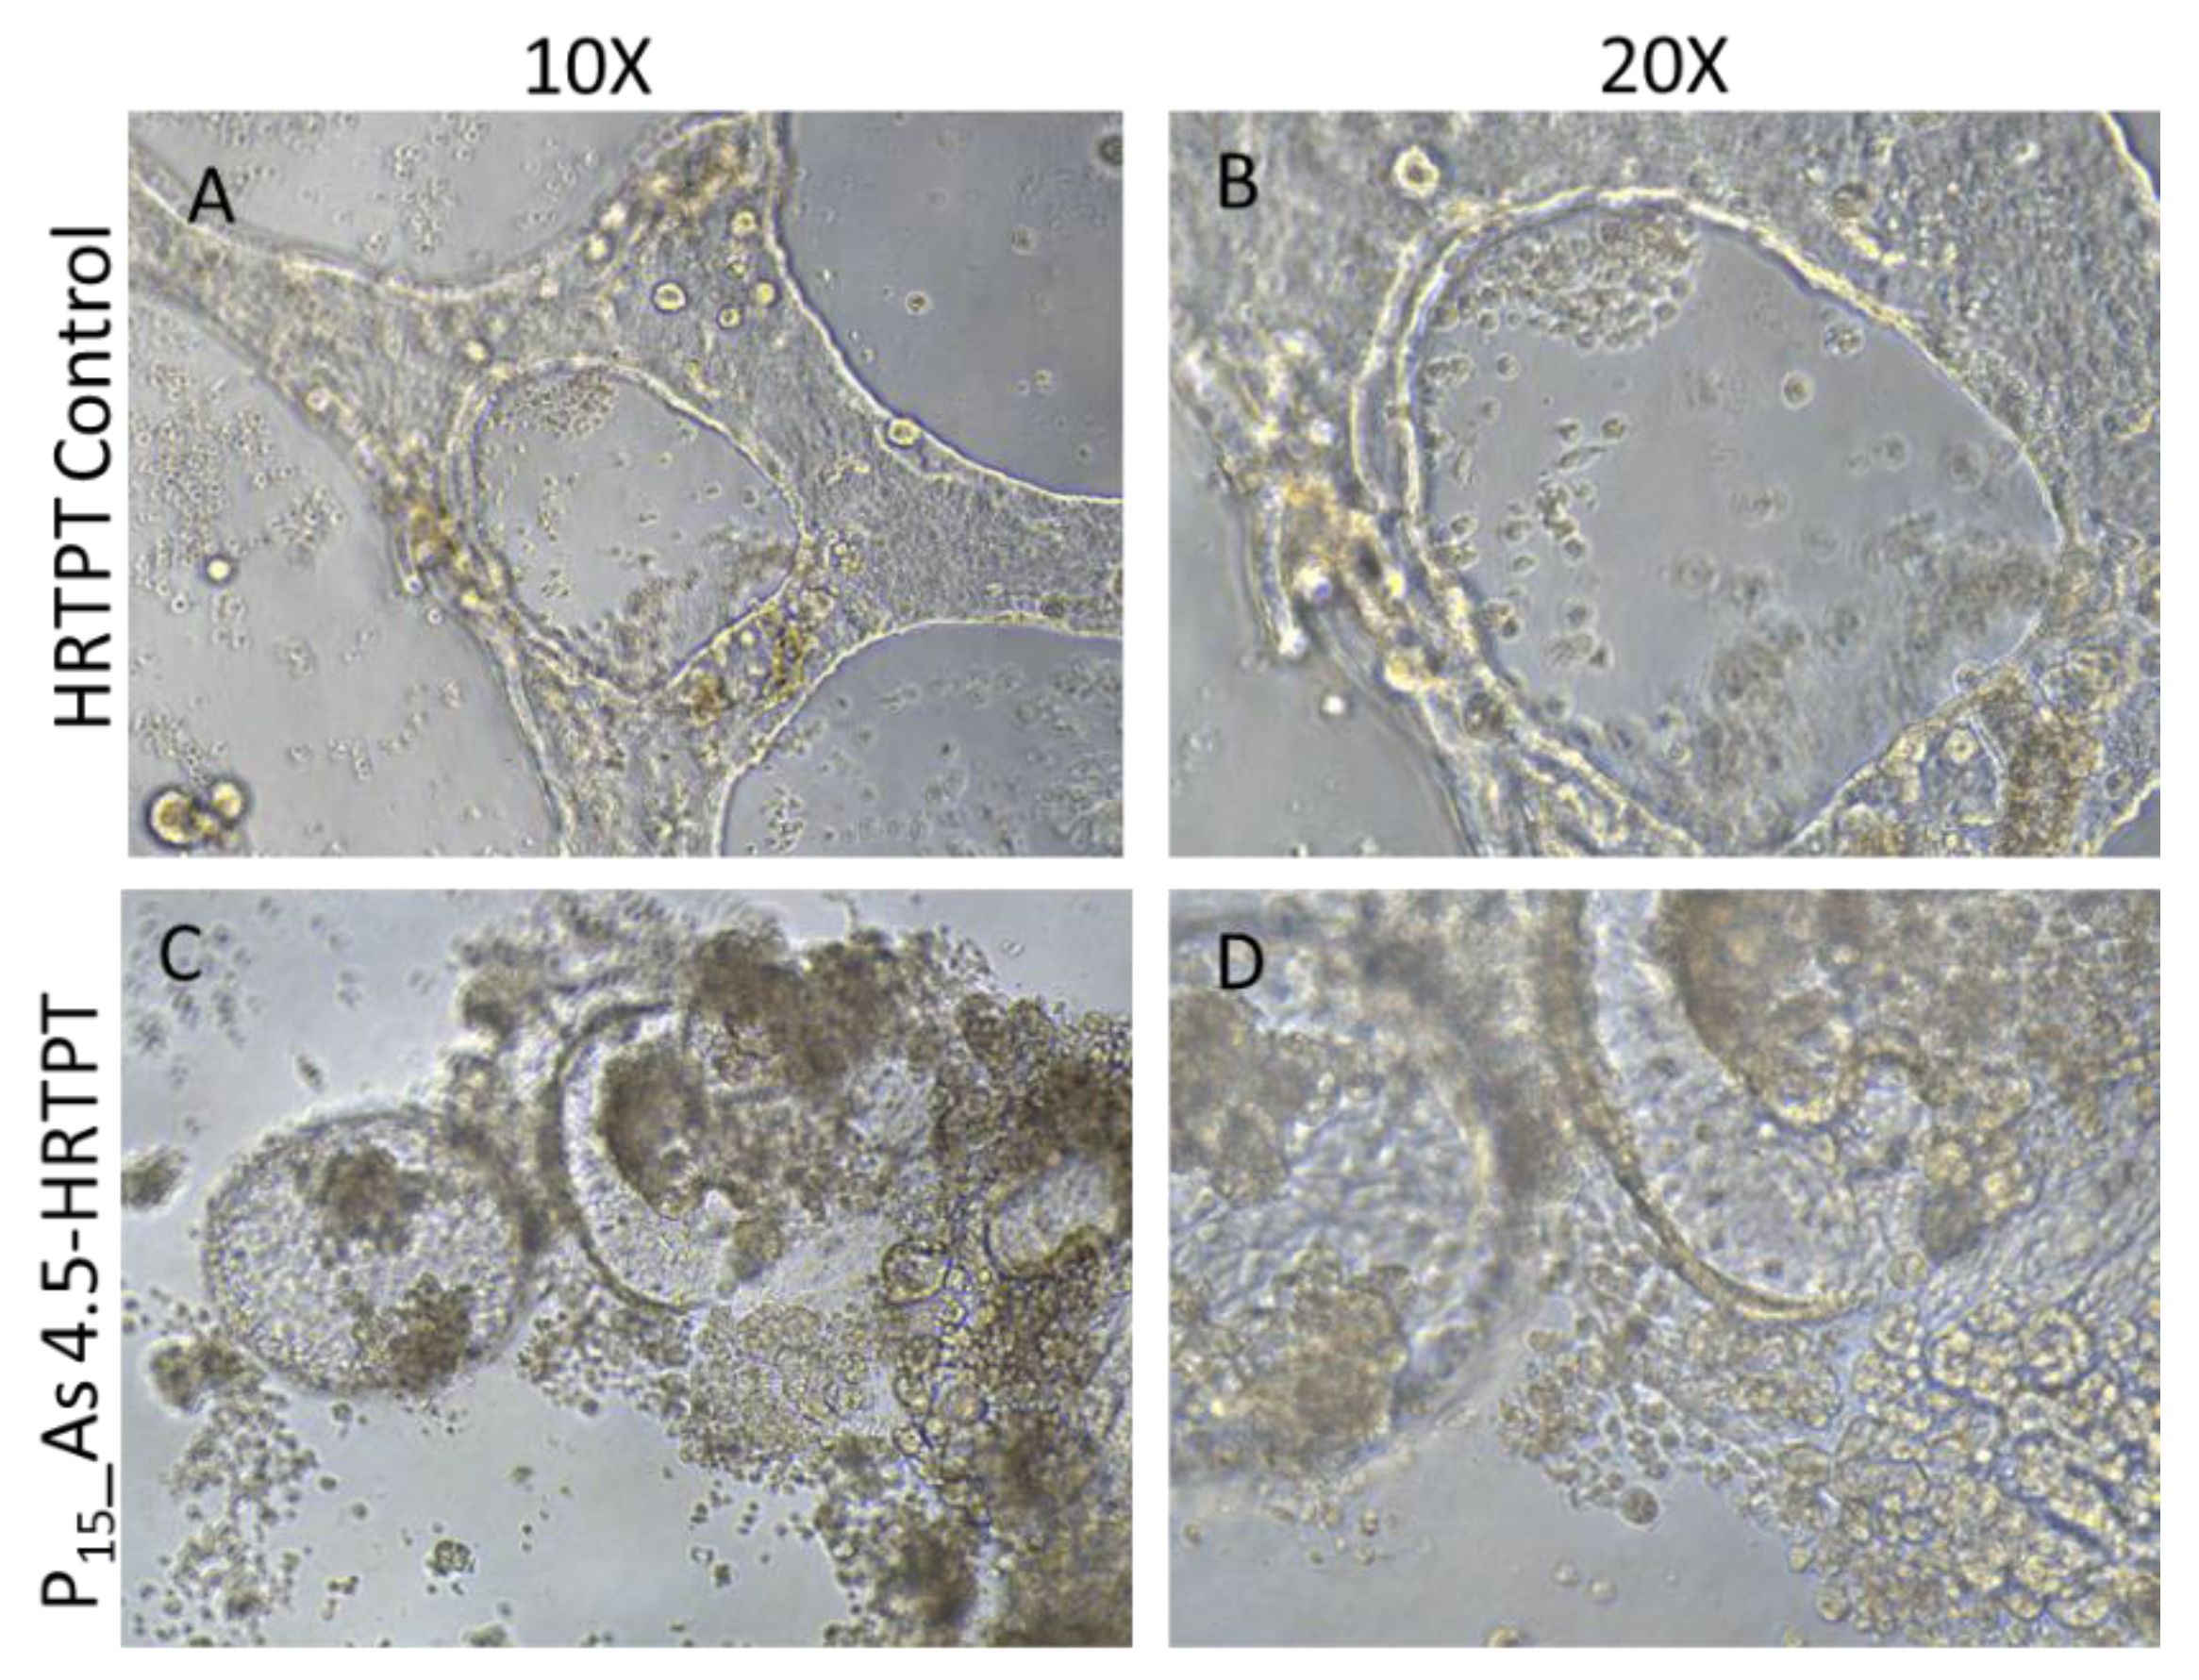
Figure 2.
C. mRNA level of cell type specific differentiation markers in Control-HRTPT, and P15-As 4.5 uM -HRTPT. (A) mRNA_AQP1 (Tubulogenic cell differentiation marker)-RT-qPCR analysis & (B) mRNA-ADIPO (Adipogenic cell differentiation marker)-RT-qPCR analysis (C) mRNA RunX2 (Osteogenic induction marker)-RT-qPCR analysis, (D) mRNA_NES & ENO2 (Neurogenic cell differentiation marker) ****; ***; **; * indicates significant differences in mRNA level compared to the control 0.0 µM arsenite concentration at p-value of ≤ 0.0001; ≤ 0.001; ≤ 0.01; ≤ 0.05 respectively.
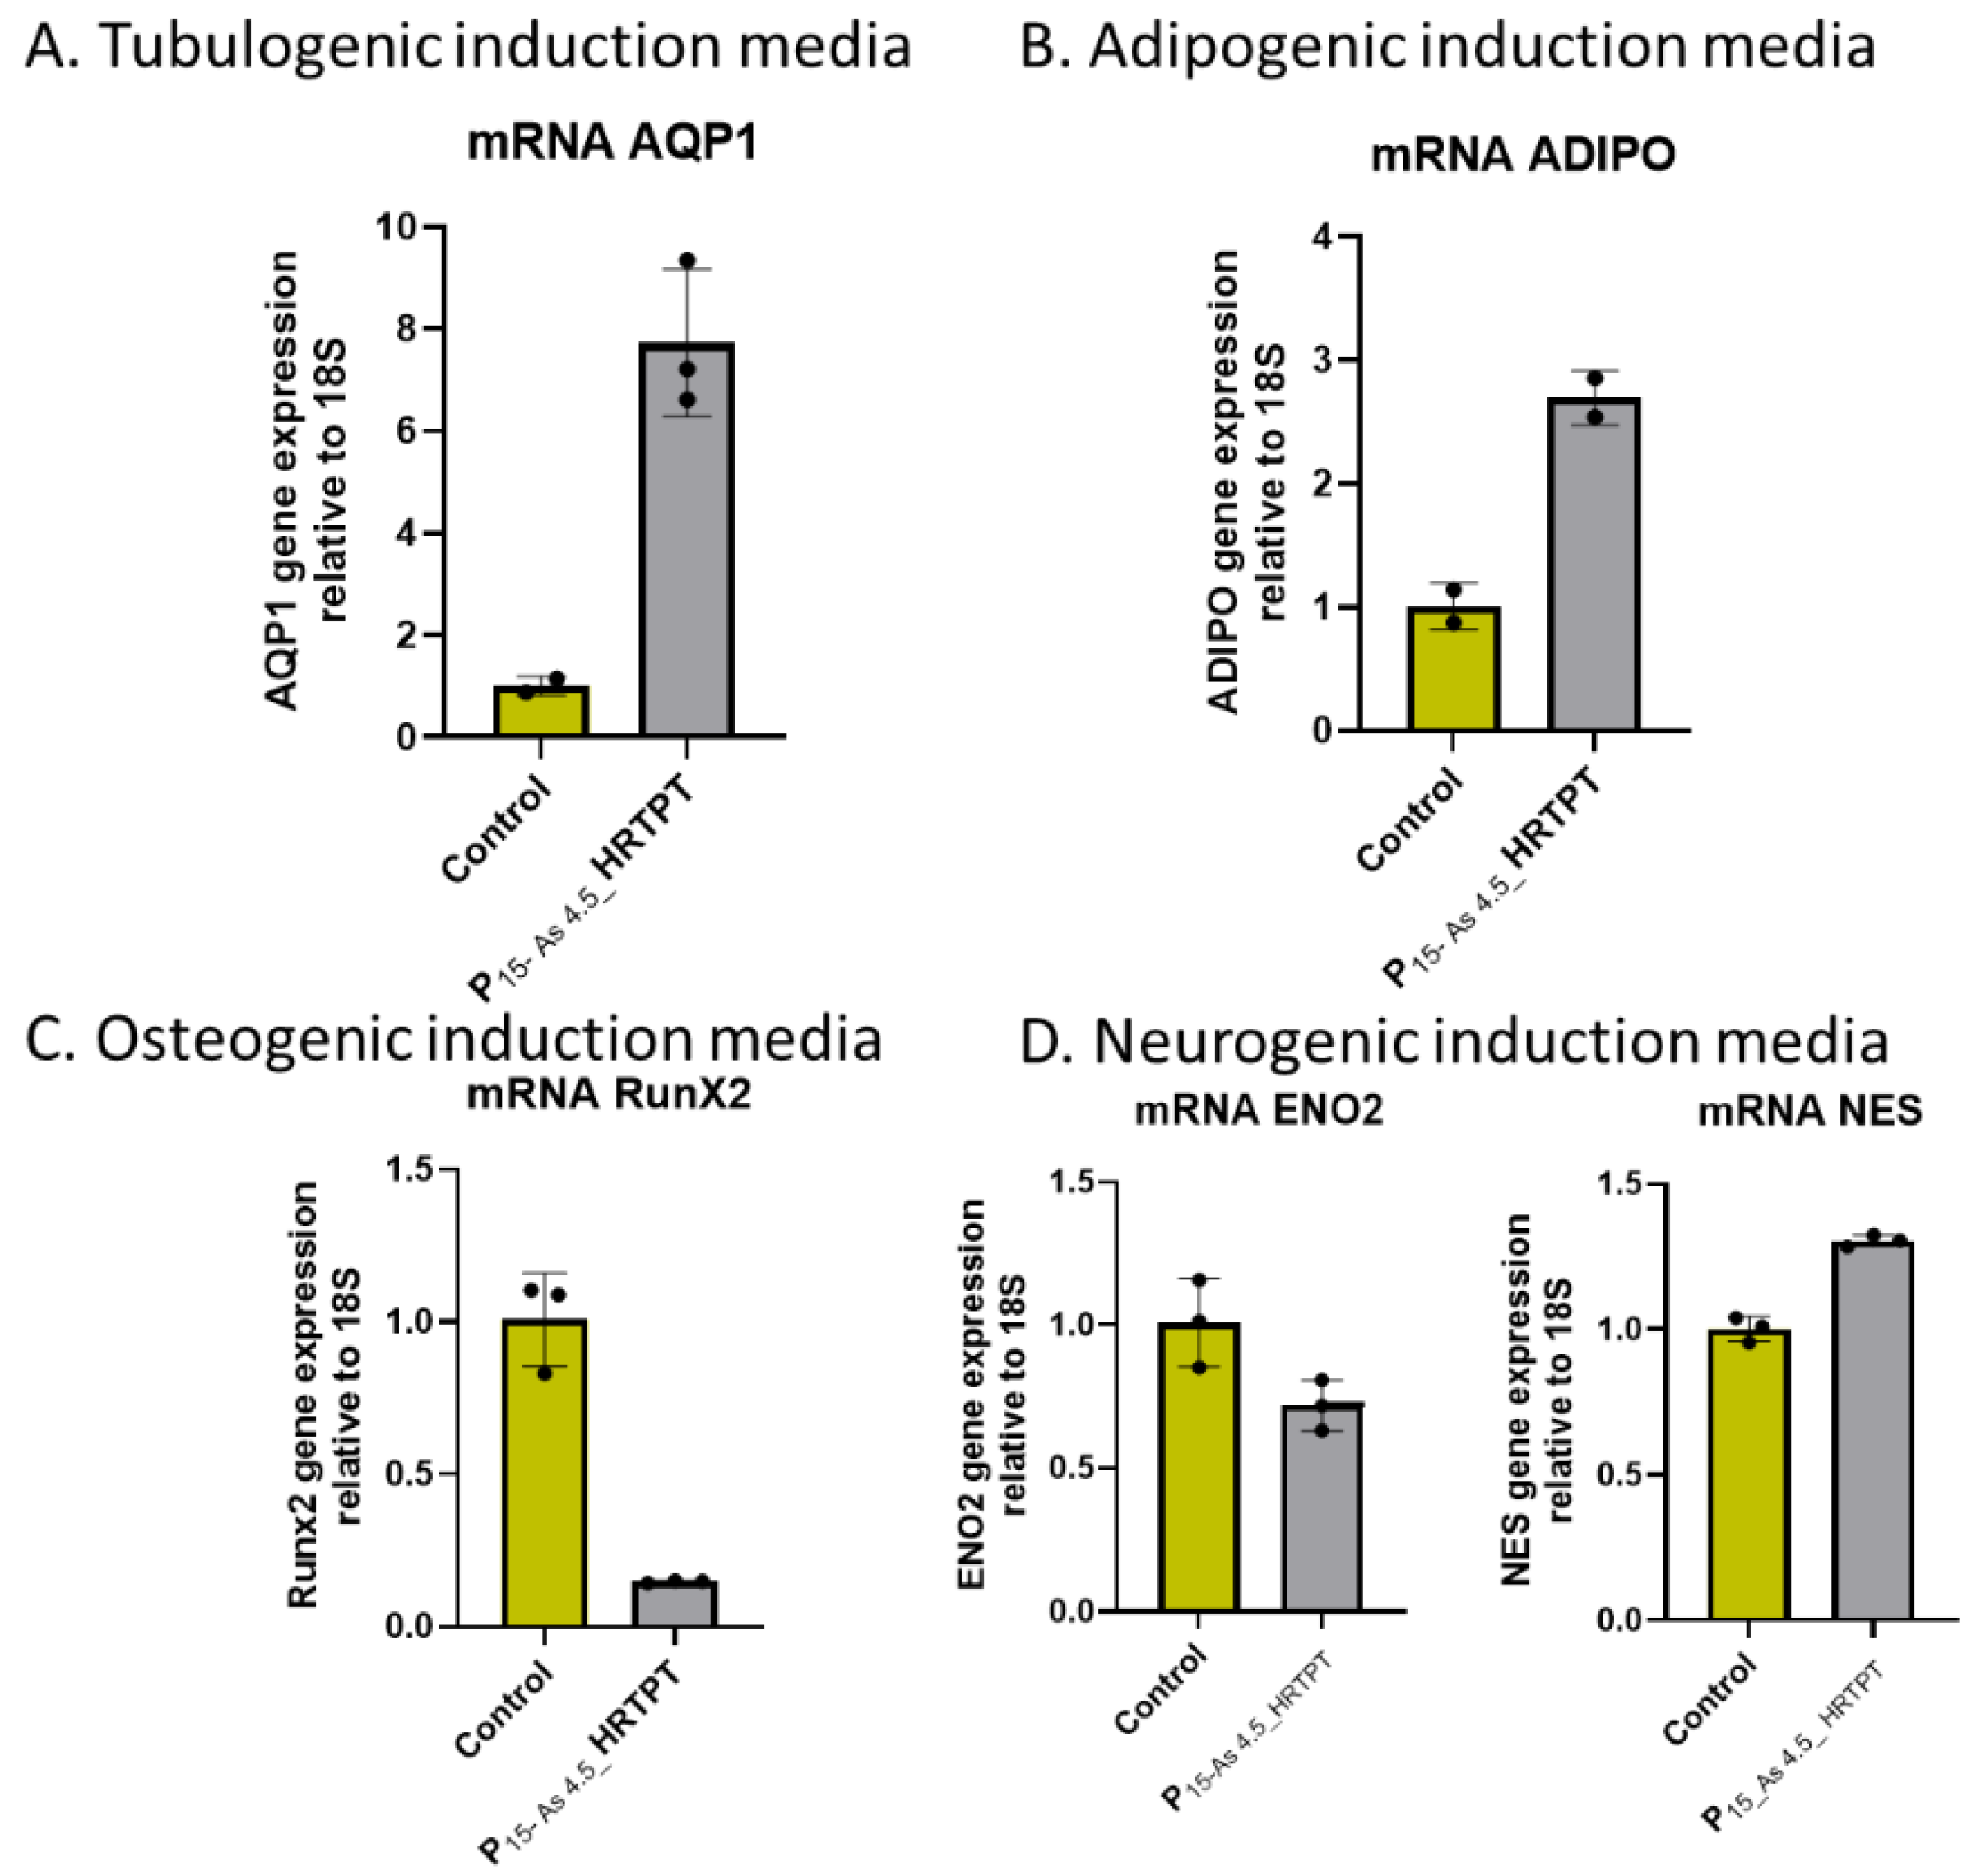
Figure 3.
mRNA and Protein level of EMT markers in HRTPT cell lines exposed with 4.5 µM of i-As up to P19 passages. (A) mRNA_E-cadherin, (B) protein_CDH1, (C)Western blot results confirmed protein level expression, (D) mRNA_N-cadherin, (E)protein_CDH2 (H) mRNA Vimentin, (I)protein_Vimentin, RT-qPCR & Western blot analysis for protein, ****; ***; **; * indicates significant differences in protein expression level compared to the control 0.0 µM arsenite concentration at p-value of ≤ 0.0001; ≤ 0.001; ≤ 0.01; ≤ 0.05 respectively. Immunofluorescence of CDH1 (F), CDH2 (G), and Vimentin (J) in HRTPT cell line exposed to As+3 4.5 µM (P15), (F) CDH1 expression control Vs. As+3 (P15), (G) CDH2 expression control Vs. As+3(P15), Vimentin expression control Vs. As+3 (P15), green represents expression of CDH1/CDH2/Vim and blue represents DAPI.
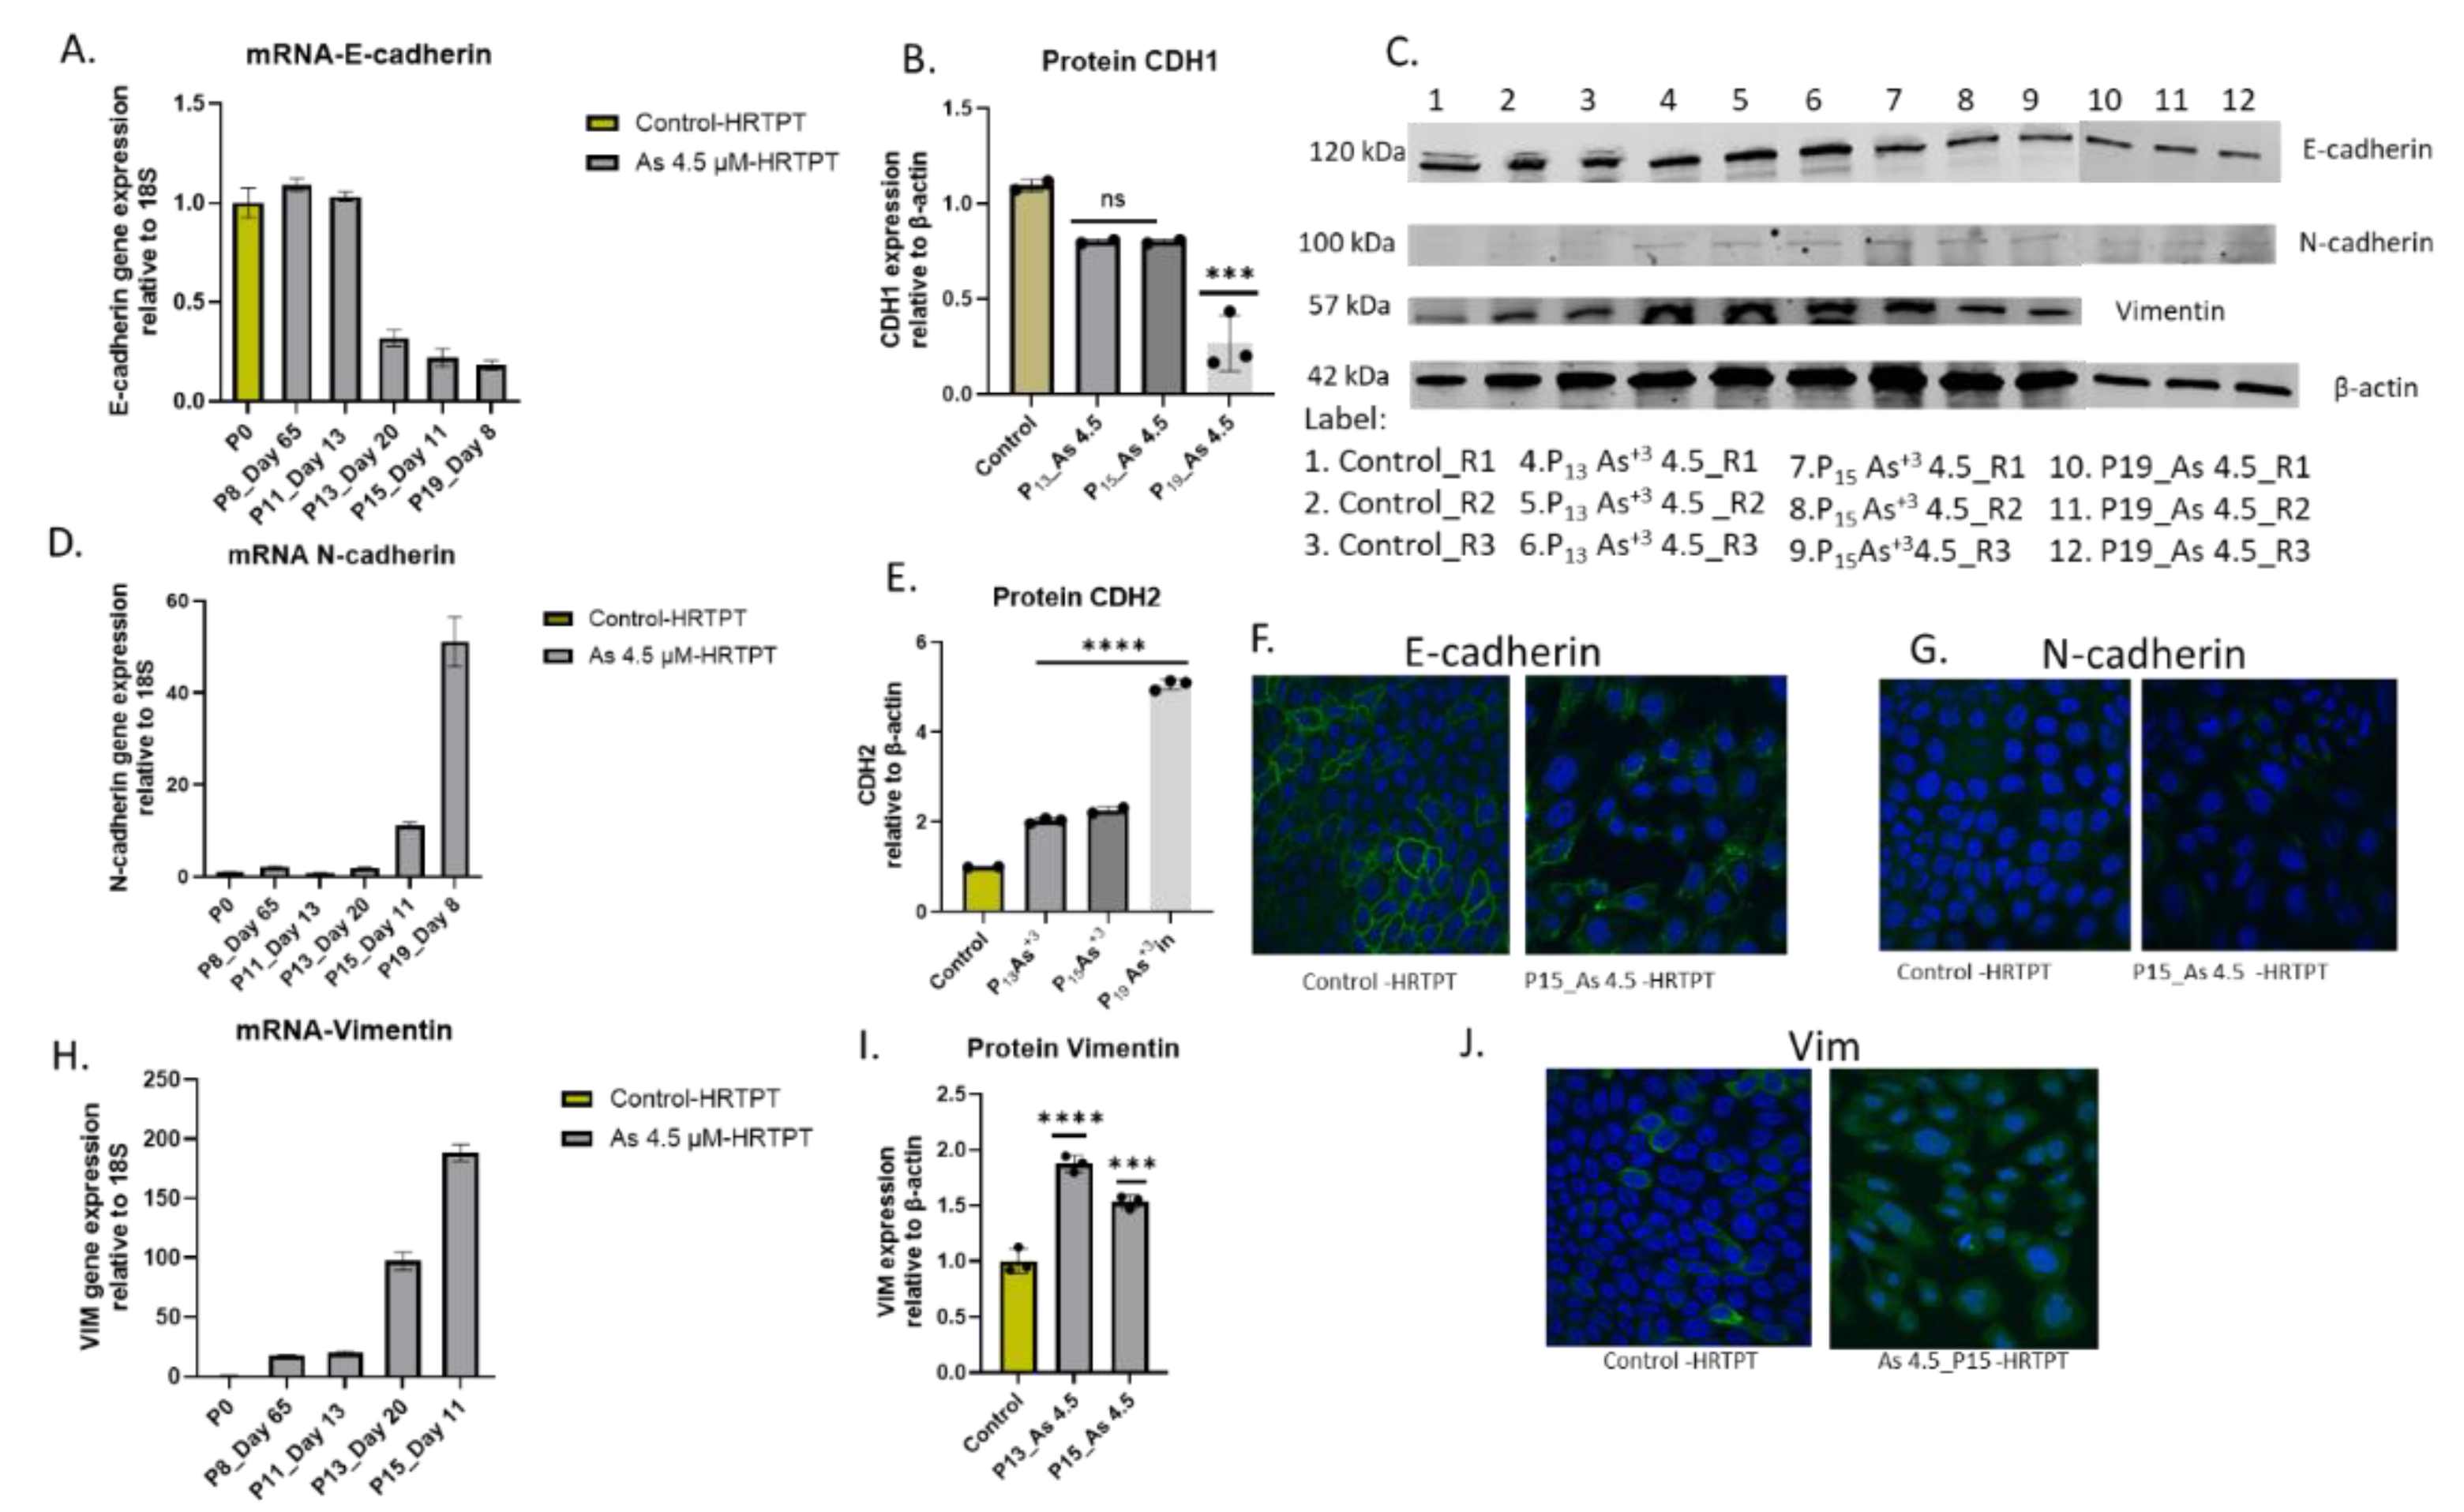
Figure 4.
A. Light level microscopy of Control-HRTPT, and chronic As+3 exposed cells (P19) plated on soft agar plate up to 28 days. (A) HRTPT Control; (B) chronic As+3 exposed cells grown on soft agar. (C) t-test for control Vs P19_As+3; 8-10 cell colonies and cluster size > 106 μm2. Images were taken at 10x magnification at 28 days after seeding.
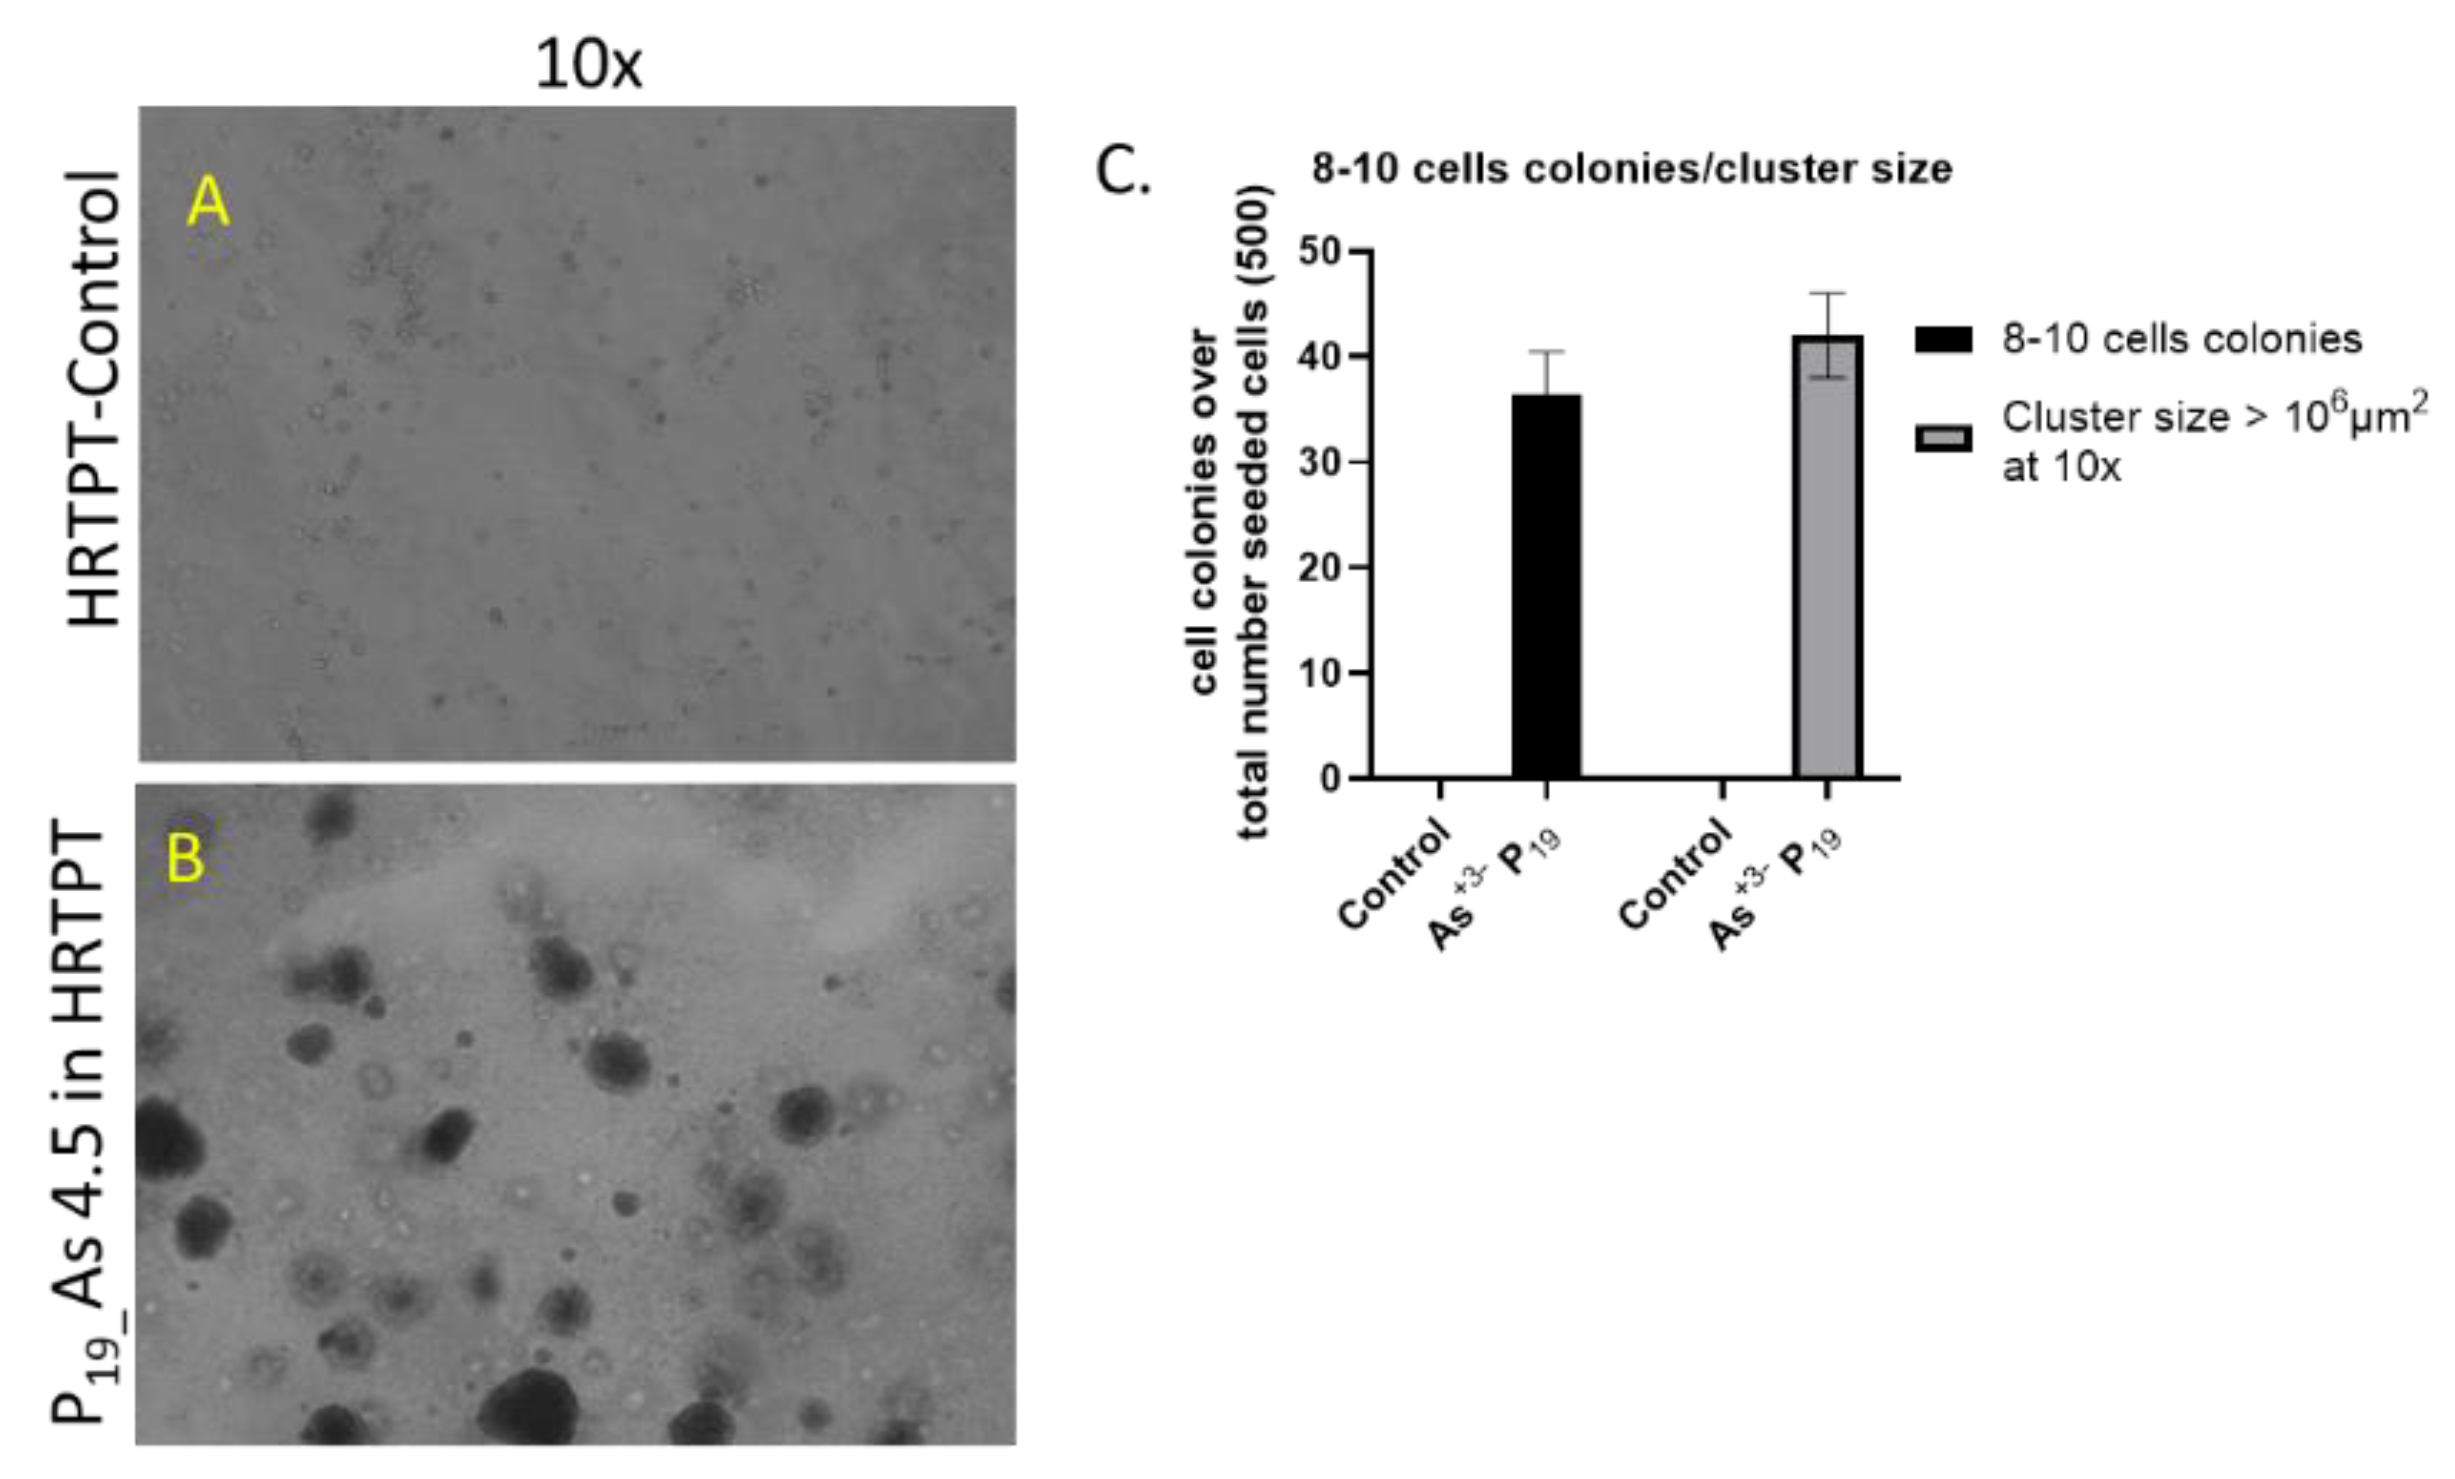
Figure 4.
B. mRNA and protein level of CD44 markers in HRTPT cell lines exposed with 4.5 µM of i-As up to P19 passages. (A) mRNA_CD44-RT-qPCR analysis, (B & C) Protein_CD44-Western analysis, (D) Immunofluorescence of CD44 Control Vs As+3-exposed cells (P15); ****; ***; **; * indicates significant differences in protein expression level compared to the control 0.0 µM arsenite concentration at p-value of ≤ 0.0001; ≤ 0.001; ≤ 0.01; ≤ 0.05 respectively.
Disclaimer/Publisher’s Note: The statements, opinions and data contained in all publications are solely those of the individual author(s) and contributor(s) and not of MDPI and/or the editor(s). MDPI and/or the editor(s) disclaim responsibility for any injury to people or property resulting from any ideas, methods, instructions or products referred to in the content. |
© 2024 by the authors. Licensee MDPI, Basel, Switzerland. This article is an open access article distributed under the terms and conditions of the Creative Commons Attribution (CC BY) license (http://creativecommons.org/licenses/by/4.0/).
Copyright: This open access article is published under a Creative Commons CC BY 4.0 license, which permit the free download, distribution, and reuse, provided that the author and preprint are cited in any reuse.


