
Submitted:
27 December 2024
Posted:
27 December 2024
You are already at the latest version
Abstract
The Oxidative Coupling of Methane (OCM) is a promising process for converting methane directly into more valuable ethane and ethylene. In this work, high-time-resolution online mass spectrometry was employed to track the OCM reaction over a commercial La2O3 catalyst, focusing on the effects of methane to oxygen ratio, Gas Hourly Space Velocity (GHSV), and the presence of H2O and CO in the feed gas on methane conversion and C2 yield. The results demonstrated that an optimized GHSV (44640 to 93000 mL·g−1·h−1) and methane to oxygen ratio (CH4/O2= 3) would achieve the highest methane conversion and C2 yield at 740 °C. Furthermore, the introduction of 1% H2O into the reaction mixture resulted in a twofold increase in C2 yield at 650 °C, while the addition of 1% CO led to a threefold increase in C2 yield at 550 °C. A model in which only the front-end catalyst is active was also developed to show excellent agreement with the experimental data. The relationship between catalytic performance and the effective catalyst position in the catalyst bed provides important insights into optimizing reactor design and operating conditions to maximize C2 yield and selectivity in the OCM reaction.
Keywords:
oxidative coupling of methane
; La2O3 catalyst
; online mass spectrometry
; effect of operating parameters
; kinetic study
1. Introduction
Methane, as the primary component of natural gas, holds substantial industrial value due to its abundance and versatility. It serves as a fundamental feedstock in the chemical industry, where it is converted into high-value products such as ethane and ethylene [1,2]. Among the various pathways for methane conversion, the oxidative coupling of methane (OCM) presents an effective and promising route for the direct transformation of methane into these valuable industrial compounds [3,4,5,6]. Due to its high activity in OCM and its high selectivity towards C2 hydrocarbons at low temperature, La2O3 has been widely investigated and explored in research [7,8,9,10].However, the C2 yield achieved by the La2O3 catalyst falls short of meeting broadly accepted techno-economic targets of ~35% C2 product yield and 90% C2 selectivity [4,11]. To further enhance methane conversion and C2 yield in La2O3-based systems, thereby bringing the OCM process closer to achieving its desired industrial targets, an in-depth investigation of the reaction conditions is required.
Many researchers have extensively investigated the reaction conditions for the OCM process [12,13,14,15,16]. Yaghobi et al.[12] conducted a parameter study on the GHSV and the methane to oxygen ratio in the OCM reaction. They found that, in the Sn/BaTiO3 system, the optimal conditions for achieving the highest C2 yield occur when the methane to oxygen ratio is 2 and the GHSV ranges from 8000 to 12000 mL·g−1·h−1. Ahari et al.[14] demonstrated that at higher GHSV ranges (12765-15790 mL·g−1·h−1), increasing GHSV significantly enhances C2 selectivity. In contrast, Karimi et al. [13], investigating the same catalytic system at lower GHSV ranges (1300-2200 mL·g−1·h−1), reported that higher GHSV leads to a decrease in C2 yield. This difference suggests that high GHSV and low GHSV may involve different reaction mechanisms. Therefore, a systematic analysis across a broader GHSV range is necessary to fully elucidate the impact of GHSV on both C2 selectivity and yield. Achieving a balance between selectivity and yield through a unified perspective is crucial for optimizing catalyst design and enhancing catalytic performance.
Another direction to change the operating parameters is to introduce H2O into feed gas. Ni et al.[17] investigated the effect of H2O on the Mn2O3-Na2WO4/TiO2 catalyst (CH4:O2= 3:1, total GHSV of 7200 mL·g−1·h−1). Adding 20% H2O increased methane conversion from 33.0% to 35.5% and improved C2-C3 selectivity from 62.1% to 66% at 700 °C, demonstrating that H2O enhances catalytic performance. In addition, Aydin et al.[18] separately investigated the role of water in the OCM reaction (O2–OCM) and the OCM reaction with N2O (N2O–OCM) systems. The results indicated that H2O can enhance methane conversion and C2 selectivity, with this positive promoting effect being more pronounced in the O2–OCM system. Other researchers have also explained the promoting effect of water from the perspective of water-mediated enhancement of selective surface O species [19] or ·OH radicals [20]. However, studies on the promoting effect of water in the literature are primarily limited to the Mn2O3-Na2WO4 system, with very few investigations related to the La2O3 system. Considering the unique catalytic properties of La2O3, further research on its interaction with water could provide valuable insights into optimizing OCM performance.
The above literature has studied the effects of parameters such as GHSV, the methane to oxygen ratio, and the addition of H2O into the feed gas on the catalytic performance of the OCM reaction. However, while valuable insights have been provided, the conclusions have shown some variation and may benefit from more systematic and comprehensive investigation to fully understand these influences. To gain a clearer understanding of how these parameters influence the catalytic performance of the La2O3 system, this work conducted a comprehensive experimental investigation of the operating parameters. The specific operating parameters include the methane to oxygen ratio, GHSV, and the addition of H2O and CO to the feed gas. By tracking the reaction process by online mass spectrometry, we were able to directly observe the impact of these parameters on crucial catalytic performance indicators such as methane conversion, C2 yield, and C2 selectivity in the OCM reaction. Further analysis discusses the location of the active catalytic position within the reactor and establishes a model in which only the front-end catalyst remains active, while the rest gradually deactivates due to poisoning as the OCM reaction progresses. This model explains the observed effects of various experimental parameters on catalytic performance indicators.
2. Materials and Methods
2.1. Catalyst
Investigations are performed over a commercial La2O3 (L812319, ≥99.99%) catalyst supplied by Shanghai Macklin Biochemical Co., Ltd. (Shanghai, China). The BET surface area of commercial La2O3 is 3.4 m2·g−1 (measured under Kr atmosphere) [21]. Samples with a mass of 6 mg to 25 mg are diluted with quartz powder (high-purity grade, 150Å pore size, 200-425 mesh), to a total loading is 100 mg. According to previous publication [21,22], the commercial La2O3 undergoes carbonation and hydroxylation upon exposure to air (contacting H2O and CO2), resulting in a decrease in the activity of the catalyst. Therefore, before using commercial La2O3 (hereinafter referred to as commercial La2O3) for OCM reaction, it is necessary to perform in situ pre-calcination to remove carbonates and hydroxides. The pretreatment steps are as follows: the La2O3 sample is placed in a microreactor, heated to 800 °C (heating rate: 10 °C/min) under argon atmosphere (argon flow rate: 20 mL·min-1), and then cooled to room temperature for subsequent experiments. Previous XPS [22] and XRD [21] study show that when the sample is calcined to 800 °C under argon, a pure La2O3 phase can be obtained, and the catalyst surface is a clean surface.
2.2. Reactor
The kinetics experiments in this paper were conducted using our custom-designed microreactor, which is loaded with a ¼-inch quartz tube [23]. This microreactor is equipped with an efficient heat dissipation system, effectively preventing temperature runaway effect caused by the significant exothermic nature of the OCM reaction. Additionally, the position of the microreactor where the catalyst is loaded is heated uniformly. The detailed temperature profiles of the microreactor were provided in previous publications [24].
2.3. Online MS and Reaction Conditions
The analysis of OCM products was achieved using a Pfeiffer Prisma quadrupole mass spectrometer. Detailed information on this equipment and the MS calibration procedure can be found in our previous publication [24].
Information on experimental settings such as sample mass, GHSV, and feed gas flow rate for the comparative experiments with varying operational parameters is listed in Table S1 in the Supporting Information. To unify standards, the GHSV in this study is calculated solely based on the flow rates of methane and oxygen. The La2O3 catalyst at a GHSV of X mL·g−1·h−1, with n% concentrations of H2O/CO added to the reaction gas, is denoted as La2O3-XmL-nH2O/CO. In all OCM experiments, 1.4 mL·min−1 of Ar was added as an internal flow standard in the feed gas, and 147 mL·min-1 of Ar was used as a diluent in the exhaust gas before MS analysis. The temperature ramping was programmed from RT to 740 °C with a heating rate of 10 °C/ min. The carbon balance for all OCM reactions discussed in this paper is shown in Figure S1-S4 in the Supporting Information. The carbon balance results indicate that for most OCM experiments, the carbon balance was below 100% at 600 °C, while at 740 °C, it reached approximately 110%, with a few cases exceeding this value. This discrepancy can be attributed to the partial adsorption of products on the catalyst surface at lower temperatures, followed by their desorption at elevated temperatures. The CH4 conversion rate, C2 selectivity, and yields of C2 and CO2 are calculated by the following equation:
Where n in Equations (2) and (3) is the carbon number of the product molecules.
The mass activity is determined using the following equation:
Where m is the loading quality of the sample; yield is calculated by Equation (2).
3. Results
3.1. Effect of Methane to Oxygen Ratio
The effect of the methane to oxygen ratio was investigated by comparing the CH4 conversion, CO2 yield, and C2 yield in the OCM reaction over the La2O3 catalyst. Three distinct methane to oxygen ratios, namely 3:1, 5:1, and 10:1, were selected for the experimental investigations. As shown in Figure 1A, for GHSV= 44640 mL·g−1·h−1, the best results for methane conversion are achieved at CH4:O2= 3:1, indicating that a higher oxygen content improves the catalytic activity of La2O3 catalyst in OCM reaction. When CH4:O2= 3:1, the curve of methane conversion rises rapidly with increasing temperature, stabilizing only around 650 °C. The C2 yield follows a similar trend. In contrast, under conditions with a higher methane to oxygen ratio, the rate of increase in methane conversion slows down around 520 °C. As shown in Figures 1B and 1C, this slowdown in methane conversion can be explained by the stabilization of CO2 production after 520 °C, while C2 products have not yet started to form. This indicates that under low oxygen partial pressure conditions, methane activation is limited, hindering further conversion.
Figure 1D shows that the selectivity of C2 products at different methane to oxygen ratios is similar at 740 °C. However, at 650 °C, significant differences in C2 selectivity are observed. Specifically, for a methane to oxygen ratio of 3:1, the C2 selectivity reaches 69%, while for ratios of 5:1 and 10:1, it is 38% and 43%, respectively. These indicates that a higher oxygen concentration (at a CH4/O2 ratio of 3:1) significantly enhances the C2 selectivity at lower temperatures. To further investigate the impact of oxygen content, we examined the oxygen consumption under different methane to oxygen ratios. In Figure S5, under the conditions of a methane to oxygen ratio of 3:1, the higher oxygen concentration ensures that oxygen is fully consumed at 740 °C, even though the reaction rate is relatively slow. In contrast, at methane to oxygen ratios of 5:1 and 10:1, oxygen is consumed more rapidly initially but not fully depleted. The experimental observation can be explained by the role of a higher oxygen partial pressure in facilitating the formation of methyl radicals (·CH3). As reported in the literature [25], at lower CH4/O2 ratios, the formation of methyl radicals was improved by the high partial pressure of O2 to achieve high CH4 conversion. However, at higher CH₄/O2 ratios, the excess methane may competitively occupy oxidative active sites on the catalyst surface, limiting the oxygen's ability to generate sufficient methyl radicals. As a result, the lower oxygen partial pressure under these conditions reduces the formation of methyl radicals, which in turn hinders methane activation and reduces methane conversion.
3.2. Effect of GHSV
In this work, the influence of GHSV is investigated by varying the sample mass and flow rate. The GHSV values range from 14880 to 186000 mL·g−1·h−1. The specific experimental settings are listed in Table S1. It should be noted that the methane to oxygen ratio in all experiments was optimized to 3:1. In these tests, methane conversion, C2 yields, C2 selectivity, and mass activity were all measured at a constant temperature of 740 °C. As shown in Figure 2A-C, both methane conversion, C2 yields and C2 selectivity first increase and then decrease with the rise in GHSV, reaching their optimal values within the GHSV range of 44640-93000 mL·g−1·h−1. In this study, the trend in C2 selectivity is consistent with that of methane conversion and C2 yield. Moreover, within a specific range of GHSV (44640-93000 mL·g−1·h−1), both C2 selectivity and yield remain at high levels. By enhancing C2 selectivity without compromising C2 yield, this study offers a new pathway for the industrial feasibility of direct methane conversion into high-value C2 products.
Figure 2D further illustrates the relationship between GHSV and mass activity (in mol·g⁻¹·h⁻¹). In a reactor with uniform temperature, the mass activity of the catalyst generally does not change with changes in GSHV. However, in this study, the mass activity increased with rising GHSV, suggesting that not all parts of the catalyst are equally active throughout the reactor. Even when the GHSV reaches 186000 mL·g−1·h−1, with a catalyst mass as low as 6 mg, the mass activity remains significant, with methane conversion still close to 19% and C2 selectivity exceeding 56% (Table 1). This indicates that even a minimal amount of catalyst can exhibit considerable catalytic activity in a microreactor setup.
3.3. Effect of H2O in the Reaction Gas
To investigate the impact of adding water to the reaction gas on catalyst performance, two sets of OCM experiments were designed. Each set of experiments was conducted under two different GHSV conditions: 14880 mL·g−1·h−1 and 44640 mL·g−1·h−1, representing the lowest and the optimal GHSV values within the range explored in this study. For each GHSV condition, one group included the addition of 1% water in the reaction gas, while the other served as a control group in the absence of water.
As shown in Figure 3A, at a GHSV of 14880 mL·g−1·h−1, the addition of 1% water not only lowered the activation temperature for C2 product formation by approximately 100 °C (from 540 °C to 440 °C), but also nearly doubled the C2 yield in both the low temperature (650 °C) and high temperature (740 °C) ranges. At the same time, it can be seen from Table 2 and Figure 3C that the methane conversion of the system with water added increased by 5% and the C2 selectivity increased by 14.4%. These results suggest that the addition of water significantly enhances the performance of the La2O3 catalyst. As shown in Figure 3B and D, at 44640 mL·g−1·h−1 (the optimized GHSV), the C2 yield and C2 selectivity curves for the water-added group (blue) and the non-water group (orange) completely overlap, indicating that the addition of water has no effect on catalytic performance. The effect of adding water to the reaction gas varies significantly under different GHSV conditions. This demonstrates that only at lower GHSV, where the contact time between the catalyst and water vapor is sufficiently long, can the catalytic activity be markedly improved.
It is noteworthy that water is also a product of the OCM reaction, accounting for approximately 10%. However, the introduction of just 1% H2O into the reaction gas significantly enhances the catalytic activity. This suggests that the role of added water differs from that of the water produced during the OCM reaction. First, the interaction of added water with the catalyst involves unique chemical pathways, such as the formation of ·OH radicals [20], which are absent or less pronounced in the case of produced water. These radicals play a crucial role in enhancing the reaction kinetics and improving the overall efficiency of the OCM process. Secondly, added water directly participates in the reaction mechanism by promoting the formation of active oxygen species on the catalyst surface. These species facilitate the activation of methane and the subsequent formation of C2 products [19].In contrast, water produced during the reaction does not effectively interact with the catalyst due to its location downstream of the reaction zone. In light of the experimental observation that the addition of water shows no significant effect at high gas flow rates, the second explanation is more convincing. Under high flow conditions, the residence time of water on the catalyst surface is limited, which weakens its ability to promote the formation of active oxygen species. Therefore, the key to water’s role is its effective interaction with the active part of the catalyst, where it contributes to the generation of active oxygen species by ensuring sufficient contact with the active catalytic sites.
3.4. Effect of CO in the Reaction Gas
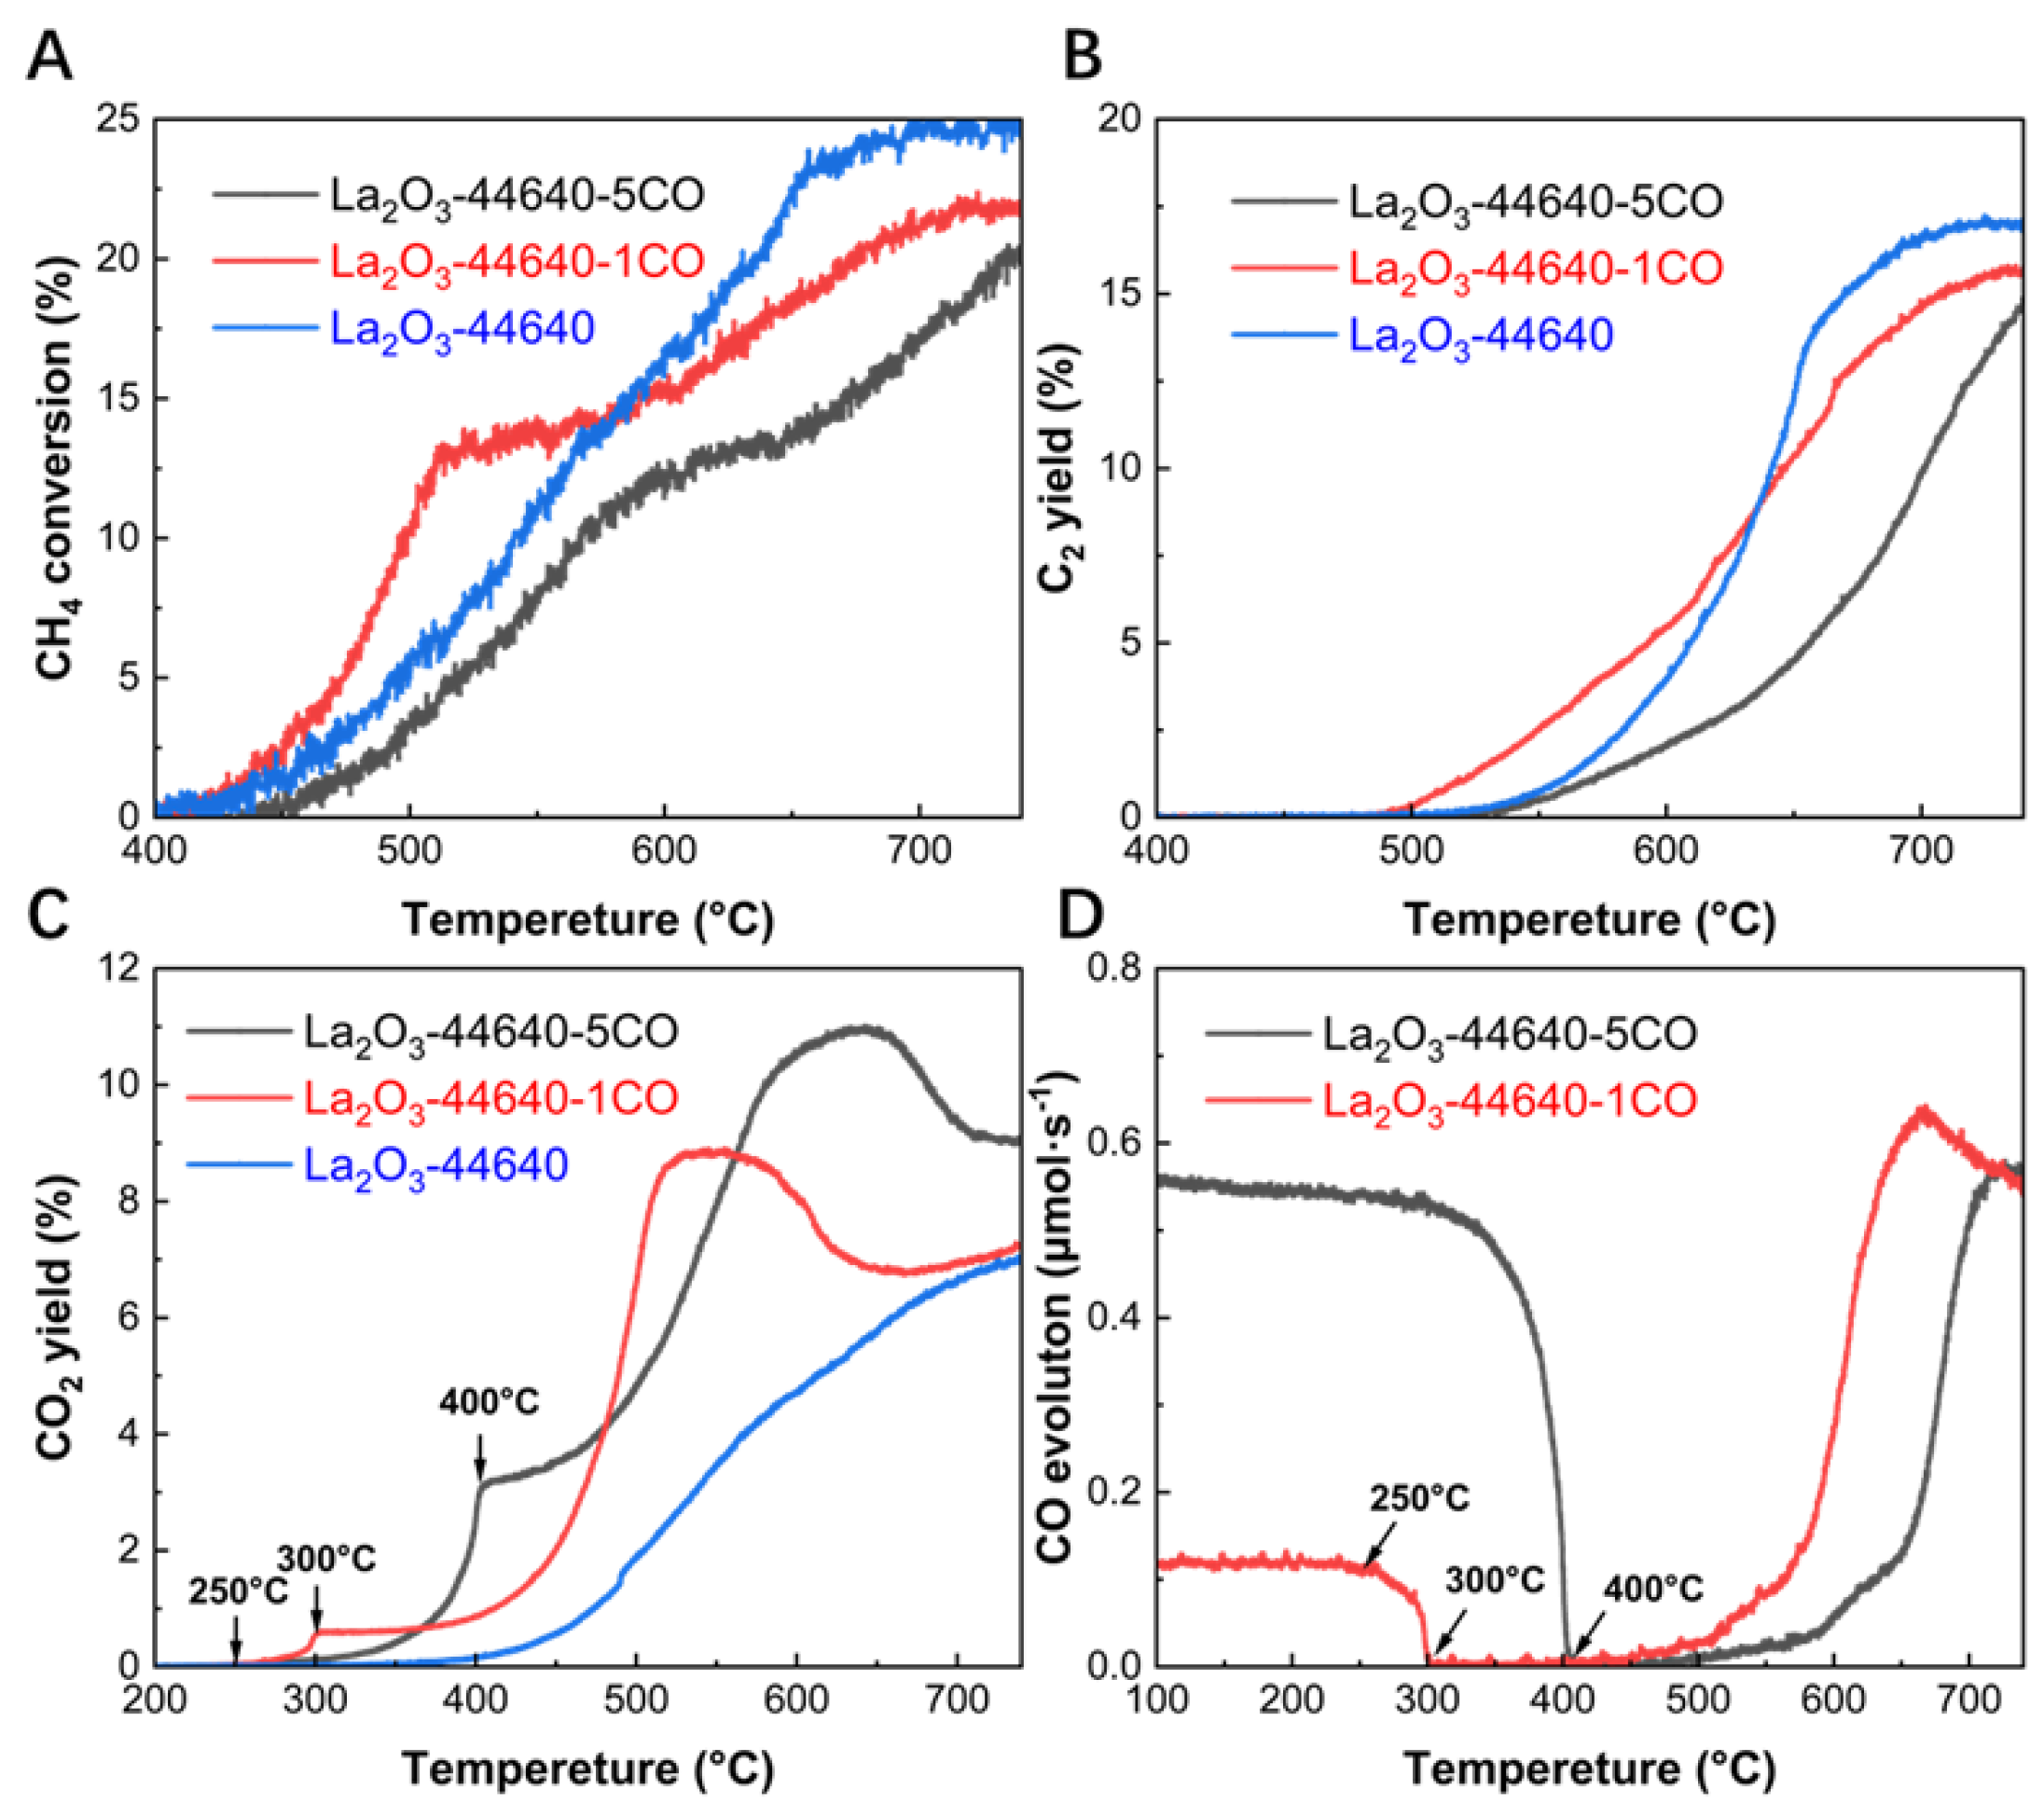
The effect of CO was studied by adding 0%, 1%, and 5% CO into the reaction gas. All experiments were conducted under the optimized methane/oxygen ratio (3:1) and GHSV (44640 mL·g−1·h−1). As shown in Figure 4A and B, after the addition of 5% CO, both CH4 conversion and C2 yield are significantly lower compared to the control group in the absence of CO. This is attributed to the poisoning effect of CO2[21], which is generated from the reaction between the added CO and oxygen. However, similar results were not observed in the experimental group with 1% CO addition. The C2 yield with 1% CO addition is slightly lower than that of the control group without CO. At 550 °C, however, the C2 yield is more than three times higher than the control group. This significant difference highlights the crucial role of CO in enhancing catalytic performance at lower temperatures. It is well known that low-temperature C2 production in the OCM reaction holds substantial economic value, and this effect of CO underscores its important research potential.
The distinctly different effects observed with varying concentrations of CO indicate that only low concentrations of CO can enhance catalytic performance. Figure 4C illustrates the dynamic changes in CO2 production under different CO concentrations. With 1% CO added, a small amount of CO2 begins to form when the reaction temperature reaches around 250 °C. However, with 5% CO, a large amount of CO2 is generated in the temperature range between 300 °C and 400 °C. This suggests that at 1% CO concentrations, CO reacts with the oxygen in the system through CO oxidation around 250 °C. The La2O3 catalyst may have undergone structural changes during this reaction process, which would be a key factor in the subsequent improvement of catalytic activity. At higher CO concentrations, the poisoning effect of excessive CO2 inhibits the promotional effect of this process, which explains why adding high concentrations of CO leads to a decrease in catalytic activity. Figure 4D shows the evolution of CO throughout the entire OCM process. The evolution in CO can be divided into two parts. First, as CO is introduced as a feed gas, 1% CO (0.11 μmol·s-1) begins to decrease at 250 °C and is completely consumed by 300 °C, while 5% CO (0.55 μmol·s-1) starts to decline at 300 °C and is depleted by 400 °C. This trend in CO corresponds precisely with the generation of CO2 (Figure 4C), indicating that this portion of CO is fully converted to CO2 within this temperature range. At temperatures above 500 °C, both the 1% and 5% CO experimental groups begin to gradually generate CO, with this portion of CO accounting for approximately 5% of the total products. This CO can be attributed to the CO generated by the OCM reaction. The impact of CO on catalyst activity occurs within the temperature range of 250–300 °C, during which the oxidation of CO to CO2 ultimately leads to the early appearance of C2 products and a significant increase in yield at lower temperatures.
4. Discussion
In the previous discussion, we suggested that the promotional effect of water originates from its role in facilitating the formation of active oxygen species. In prior research on the active sites of lanthanum oxide [22], XPS results indicate that the catalytic process of C2 formation observed experimentally closely resembles the surface peroxide species predicted by the theoretical model, suggesting that peroxide is the active site. For this research, we infer that the use of H2O as weak oxidants will promote the formation of peroxide sites, thereby increasing the C2 yield and enhancing the OCM reaction. The promotional effect of a small amount of CO on low-temperature OCM reactions may be attributed to the generation of a small amount of CO2, which acts as a weak oxidant similar to water, or to structural changes in the catalyst induced by oxidation reactions occurring at 250–300 °C.
In the OCM reaction, CO and H2O are both products with yields exceeding 5%. In comparison, the addition of only 1% CO to the reaction feed significantly enhances catalytic activity, suggesting that H2O and CO, as OCM products, do not play the same role as the 1% H2O and CO added to the reaction feed. Notably, the low concentrations of H2O and CO are added at the front-end of the catalyst in the reactor, while the H2O and CO generated during the reaction are found at the rear end of the catalyst. The fact that smaller amounts have a greater effect suggests that H2O and CO influence different active position of the catalyst. Tests related to GHSV also support this observation. Typically, when the temperature within the reactor is uniformly maintained and no significant catalyst deactivation or poisoning occurs, each part of the catalyst in the reactor is expected to contribute equally. However, the GHSV experiments show that over a significant range, the mass activity of the catalyst increases as GHSV rises. Additionally, the fact that even a small amount of catalyst exhibits good OCM performance implies that only a small portion of the catalyst mass is actively contributing, and the catalyst's active position is limited to a small region. Based on these insights, we developed a new model to discuss and explain how various experimental parameters influence OCM performance, as shown in Scheme 1.
In Scheme 1, we divided the catalyst bed into two positions: the front-end and the rear end. At around 400 °C, the La2O3 catalyst at the front starts to generate CO2 after the OCM reaction. According to previous study on the poisoning effect of carbonate, the CO2 generated during the OCM reaction gradually accumulates [21]. The La2O2CO3 formed from the CO2 poisons the catalyst surface, leading to a decline in catalyst activity. In this model, The CO2 produced at the front-end of the catalyst bed during the OCM reaction is carried by the gas flow to the rear end of the bed. There, it interacts with La2O3 on the surface to form La2O2CO3, which is identified as a poison for OCM [21]. Therefore, the active position of the catalyst is only present in the La2O3 at the front- end of the catalyst bed. Further studies on the distribution of La2O2CO3 within the reactor based on this model are planned for future work.
The model on the active position of the catalyst explains well the experimental phenomena observed in OCM reaction kinetics. This model provides a comprehensive explanation of the experimental phenomena observed in the kinetics of the OCM reaction. In the GHSV experiments, even at the stage where the reaction rate begins to decline with increasing GHSV, the OCM reaction can still rely on the active portion at the front-end of the catalyst bed. This results in a continuous increase in the mass flow rate per unit of catalyst activity in the front position, thereby enhancing the catalyst's utilization efficiency per unit time. Consequently, while methane conversion and C2 selectivity eventually decrease due to limited reaction time, the mass activity of the catalyst continues to increase with rising GHSV.
The model in which only the front-end catalyst is active explains water's varying effects at different GHSV levels. At low GHSV, the extended residence time in the catalyst's front position allows thorough contact between reactants and active sites. Under these conditions, 1% added water acts as a weak oxidant, promoting peroxide site formation and enhancing C2 selectivity, thereby significantly boosting catalyst performance. However, at high GHSV, reduced residence time limits water's effect, diminishing its impact on enhancing activity. This model also explains the different effects of adding 1% versus 5% CO to the reaction gas on catalytic activity. With 1% CO2, the low concentration undergoes oxidation at 250–300 °C, altering the catalyst's redox state and significantly enhancing C2 yield at low temperature. However, with 5% CO2 the front-end concentration becomes too high, leading to excess CO2 that poisons the catalyst surface, preventing any improvement in catalytic activity. In the OCM reaction, the amounts of self-generated H2O and CO typically exceed 5%, accumulating progressively in the middle-to-late stages, particularly in the rear position of the catalyst. However, according to this model, the rear portion of the catalyst is inactive, so the accumulated H2O and CO in the later stages cannot promote catalysis at the onset as effectively as the 1% H2O and CO added to the front.
5. Conclusions
The effects of operating parameters on OCM over commercial La2O3 catalyst have been studied by using online mass spectrometry. Experimental results show that an optimized GHSV (44640 to 93000 mL·g−1·h−1) and optimum methane to oxygen ratio (CH4/O2 = 3) would achieve the highest methane conversion and C2 yield. Moreover, introducing a small amount of CO and H2O into the reaction mixture can significantly improve the C2 yield of OCM reaction at low temperature. The model we established explains the influence of the operating parameters on OCM performance. With only the front position active, the input of 1% CO and H2O exhibits a distinct catalytic enhancement compared to the effects of self-generated H2O and CO.
Supplementary Materials
The following supporting information can be downloaded at the website of this paper posted on Preprints.org, Figure S1: Carbon balance on La2O3 catalyst by cofeeding 3:1(black),5:1(red) and 10:1(blue) CH4 and O2. Figure S2: Carbon balance on La2O3 catalyst at different GHSV. The GHSV are varied from 14880 L·g-1·h-1 to 186000 mL·g-1·h-1. Figure S3: Carbon balance on La2O3 catalyst by cofeeding 3:1 CH4 and O2 with 1% vol H2O at GHSV=14880 mL·g-1·h-1 and 44640 mL·g-1·h-1. Figure S4: Carbon balance on La2O3 catalyst by cofeeding 3:1 CH4 and O2 with 1% vol CO and 5% vol CO at GHSV=44640 mL·g-1·h-1. Figure S5: Oxygen consumption vs temperature of the OCM reaction over La2O3 catalyst by cofeeding 3:1, 5:1 and 10:1 CH4 and O2. Table S1. Experimental setup for catalysts at different operating parameters.
Author Contributions
Conceptualization, Z.H.Q.; methodology, Z.H.Q. and Y.L.C.; software, Z.H.Q.; validation, Z.H.Q. and Y.L.C.; formal analysis, Z.H.Q. and Y.L.C.; investigation, Z.H.Q.; resources, Z.H.Q.; data curation, Z.H.Q. and Y.L.C.; writing—original draft preparation, Z.H.Q.; writing—review and editing, Z.H.Q. and Y.L.C.; visualization, Z.H.Q.; supervision, Z.H.Q. All authors have read and agreed to the published version of the manuscript.
Funding
This research received no external funding.
Data Availability Statement
The raw data supporting the conclusions of this article will be made available by the authors on request.
Acknowledgments
The authors would like to thank the support from Analytical Instrumentation Center (contract no. SPST-AIC10112914), SPST, ShanghaiTech University.
Conflicts of Interest
The authors declare no conflicts of interest.
References
- Lunsford, J.H. Catalytic conversion of methane to more useful chemicals and fuels: a challenge for the 21st century. Catalysis today 2000, 63, 165–174. [Google Scholar] [CrossRef]
- Schwach, P.; Pan, X.; Bao, X. Direct conversion of methane to value-added chemicals over heterogeneous catalysts: challenges and prospects. Chemical reviews 2017, 117, 8497–8520. [Google Scholar] [CrossRef] [PubMed]
- Lunsford, J.H. The catalytic oxidative coupling of methane. Angewandte Chemie International Edition in English 1995, 34, 970–980. [Google Scholar] [CrossRef]
- Zavyalova, U.; Holena, M.; Schlögl, R.; Baerns, M. Statistical analysis of past catalytic data on oxidative methane coupling for new insights into the composition of high-performance catalysts. ChemCatChem 2011, 3, 1935–1947. [Google Scholar] [CrossRef]
- Keller, G.; Bhasin, M. Synthesis of ethylene via oxidative coupling of methane: I. Determination of active catalysts. Journal of Catalysis 1982, 73, 9–19. [Google Scholar] [CrossRef]
- Ortiz-Bravo, C.A.; Chagas, C.A.; Toniolo, F.S. Oxidative coupling of methane (OCM): An overview of the challenges and opportunities for developing new technologies. Journal of Natural Gas Science and Engineering 2021, 96, 104254. [Google Scholar] [CrossRef]
- Huang, P.; Zhao, Y.; Zhang, J.; Zhu, Y.; Sun, Y. Exploiting shape effects of La2O3 nanocatalysts for oxidative coupling of methane reaction. Nanoscale 2013, 5, 10844–10848. [Google Scholar] [CrossRef]
- Kim, I.; Lee, G.; Na, H.B.; Ha, J.-M.; Jung, J.C. Selective oxygen species for the oxidative coupling of methane. Molecular Catalysis 2017, 435, 13–23. [Google Scholar] [CrossRef]
- Xiong, Z.; Guo, J.; Deng, Y.; Liu, B.; Lou, H.; Zeng, M.; Wang, Z.; Zhou, Z.; Yuan, W.; Qi, F. Elucidating the Mechanism for Oxidative Coupling of Methane Catalyzed by La2O3: Experimental and Microkinetic Modeling Studies. ACS Catalysis 2024, 14, 1267–1280. [Google Scholar] [CrossRef]
- Yue, J.; Xiao, Q.; Zhao, D.; Guan, Y.; Liu, J.; Xu, G. Surfactant-Assisted Preparation of Nanorod La2O3 Catalysts for Oxidative Coupling of Methane. Energy & Fuels 2023, 37, 15986–15994. [Google Scholar]
- Kuo, J.; Kresge, C.; Palermo, R. Evaluation of direct methane conversion to higher hydrocarbons and oxygenates. Catalysis today 1989, 4, 463–470. [Google Scholar] [CrossRef]
- Yaghobi, N. The role of gas hourly space velocity and feed composition for catalytic oxidative coupling of methane: experimental study. Journal of King Saud University-Engineering Sciences 2013, 25, 1–10. [Google Scholar] [CrossRef]
- Karimi, A.; Ahmadi, R.; Zadeh, H.B.; Jolodar, A.J.; Barkhordarion, A. Catalytic oxidative coupling of methane-experimental investigation and optimization of operational conditions. Petroleum & Coal 2007, 49, 36–40. [Google Scholar]
- Ahari, J.S.; Sadeghi, M.T.; Zarrinpashne, S. Effects of operating parameters on oxidative coupling of methane over Na-W-Mn/SiO2 catalyst at elevated pressures. Journal of Natural Gas Chemistry 2011, 20, 204–213. [Google Scholar] [CrossRef]
- Ni, J.; Lan, T.; Liu, P.; Lu, Y. Fluidized-bed OCM reaction: A promising Mn2O3-Na2WO4/TiO2 catalyst and a numerical study. Chemical Engineering Journal 2024, 499, 155845. [Google Scholar] [CrossRef]
- Alturkistani, S.; Wang, H.; Gautam, R.; Sarathy, S.M. Importance of Process Variables and Their Optimization for Oxidative Coupling of Methane (OCM). ACS omega 2023, 8, 21223–21236. [Google Scholar] [CrossRef] [PubMed]
- Ni, J.; Lan, T.; Liu, P.; Lu, Y. Fluidized-bed OCM reaction: A promising Mn2O3-Na2WO4/TiO2 catalyst and a numerical study. Chemical Engineering Journal 2024, 155845. [Google Scholar] [CrossRef]
- Aydin, Z.; Zanina, A.; Kondratenko, V.A.; Rabeah, J.; Li, J.; Chen, J.; Li, Y.; Jiang, G.; Lund, H.; Bartling, S. Effects of N2O and water on activity and selectivity in the oxidative coupling of methane over Mn–Na2WO4/SiO2: role of oxygen species. ACS Catalysis 2022, 12, 1298–1309. [Google Scholar] [CrossRef]
- Sadjadi, S.; Jašo, S.; Godini, H.; Arndt, S.; Wollgarten, M.; Blume, R.; Görke, O.; Schomäcker, R.; Wozny, G.; Simon, U. Feasibility study of the Mn–Na2WO4/SiO2 catalytic system for the oxidative coupling of methane in a fluidized-bed reactor. Catalysis Science & Technology 2015, 5, 942–952. [Google Scholar]
- Takanabe, K.; Iglesia, E. Rate and selectivity enhancements mediated by OH radicals in the oxidative coupling of methane catalyzed by Mn/Na2WO4/SiO2. Angewandte Chemie 2008, 120, 7803–7807. [Google Scholar] [CrossRef]
- Guan, C.; Yang, Y.; Pang, Y.; Liu, Z.; Li, S.; Vovk, E.I.; Zhou, X.; Li, J.P.H.; Zhang, J.; Yu, N. How CO2 poisons La2O3 in an OCM catalytic reaction: A study by in situ XRD-MS and DFT. Journal of Catalysis 2021, 396, 202–214. [Google Scholar] [CrossRef]
- Zhou, X.; Pang, Y.; Liu, Z.; Vovk, E.I.; van Bavel, A.P.; Li, S.; Yang, Y. Active oxygen center in oxidative coupling of methane on La2O3 catalyst. Journal of Energy Chemistry 2021, 60, 649–659. [Google Scholar] [CrossRef]
- Li, J.P.H.; Liu, Z.; Wu, H.; Yang, Y. Investigation of CO oxidation over Au/TiO2 catalyst through detailed temperature programmed desorption study under low temperature and Operando conditions. Catalysis Today 2018, 307, 84–92. [Google Scholar] [CrossRef]
- Liu, Z.; Ho Li, J.P.; Vovk, E.; Zhu, Y.; Li, S.; Wang, S.; van Bavel, A.P.; Yang, Y. Online kinetics study of oxidative coupling of methane over La2O3 for methane activation: what is behind the distinguished light-off temperatures? ACS Catalysis 2018, 8, 11761–11772. [Google Scholar] [CrossRef]
- Yoon, S.; Lim, S.; Choi, J.-W.; Suh, D.J.; Song, K.H.; Ha, J.-M. Study on the unsteady state oxidative coupling of methane: Effects of oxygen species from O2, surface lattice oxygen, and CO2 on the C2+ selectivity. RSC advances 2020, 10, 35889–35897. [Google Scholar] [CrossRef] [PubMed]
Figure 1.
CH4 conversion (A), CO2 yield (B), C2 yield (C) and C2 selectivity (D) vs temperature of the OCM reaction over La2O3 catalyst by co-feeding 3:1 (black), 5:1 (red) and 10:1 (blue) CH4 and O2. OCM reaction conditions: 0.025 g of the catalysts under 20 mL·min−1 CH4: O2: Ar=70:23:7, 77.5:15.5:7, 85:8.5:6.5 flow rate, GHSV= 44640 mL·g−1·h−1, heating rate:10 °C /min.
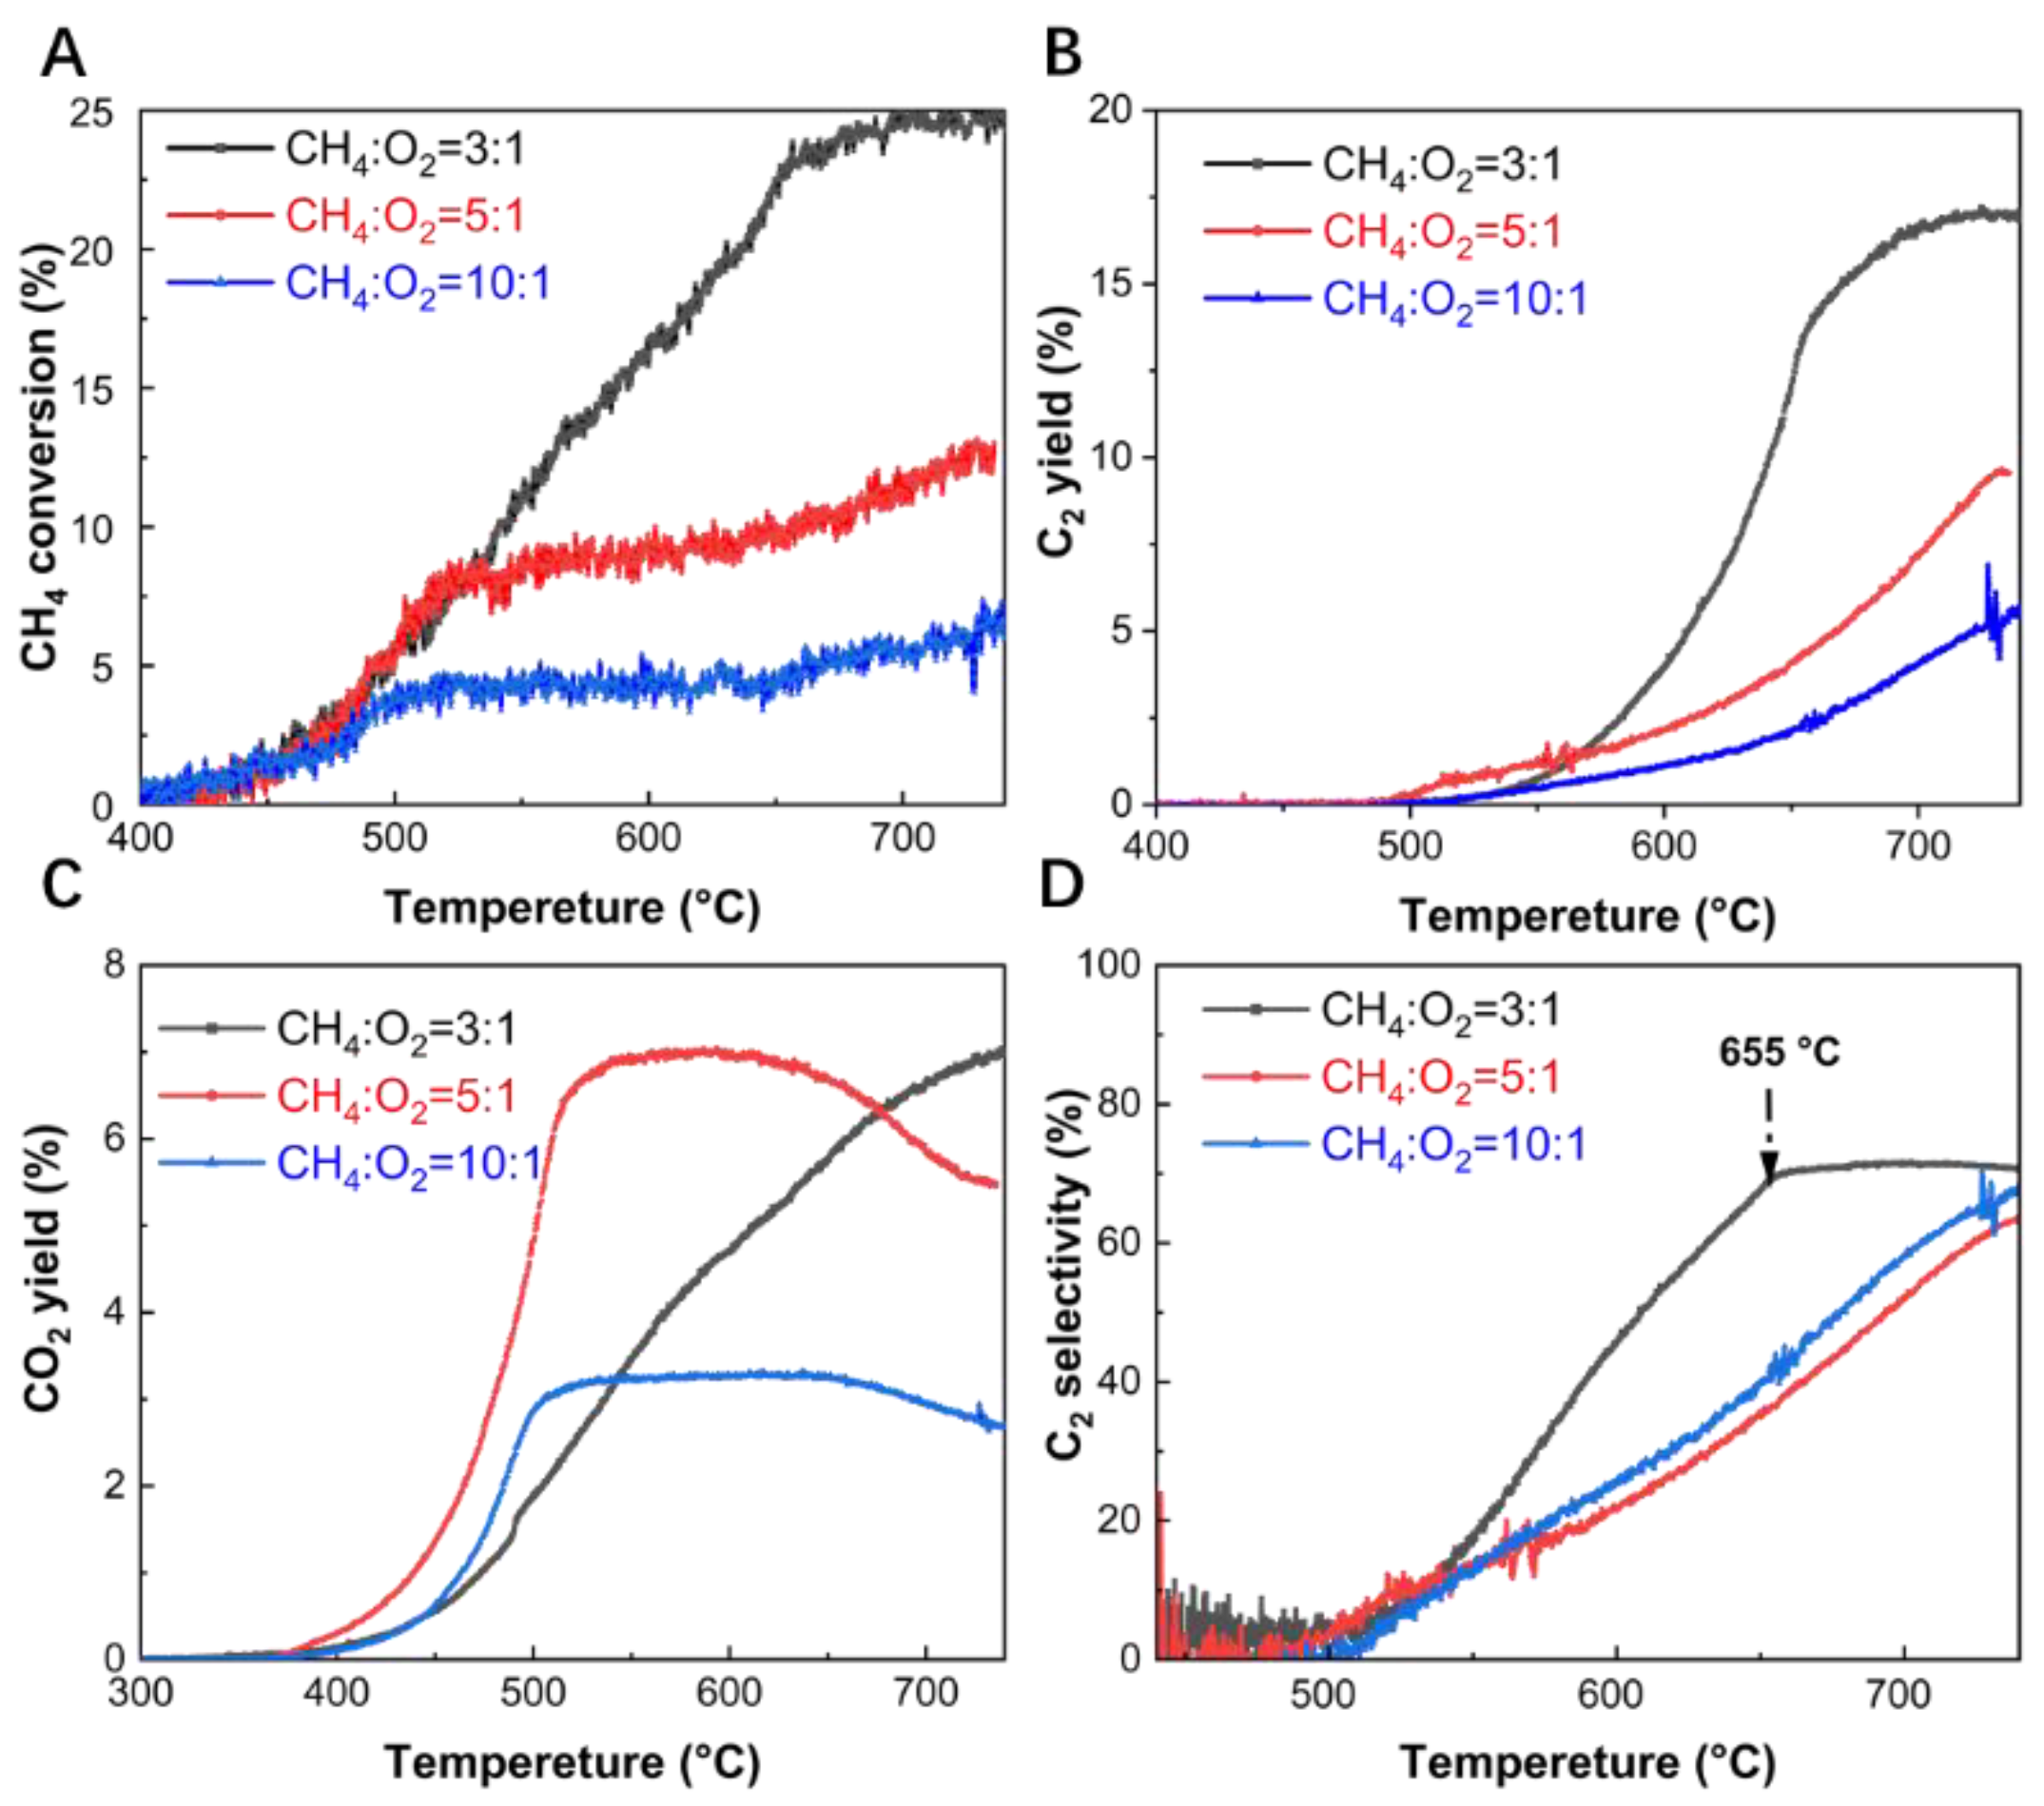
Figure 2.
Comparison of CH4 conversion (A), C2 yield (B), C2 selectivity (C) and mass activity (D) for catalysts at different GHSV, measured at 740 °C. The GHSV are varied from 14880 mL·g−1·h−1 to 186000 mL·g−1·h−1.
Figure 2.
Comparison of CH4 conversion (A), C2 yield (B), C2 selectivity (C) and mass activity (D) for catalysts at different GHSV, measured at 740 °C. The GHSV are varied from 14880 mL·g−1·h−1 to 186000 mL·g−1·h−1.
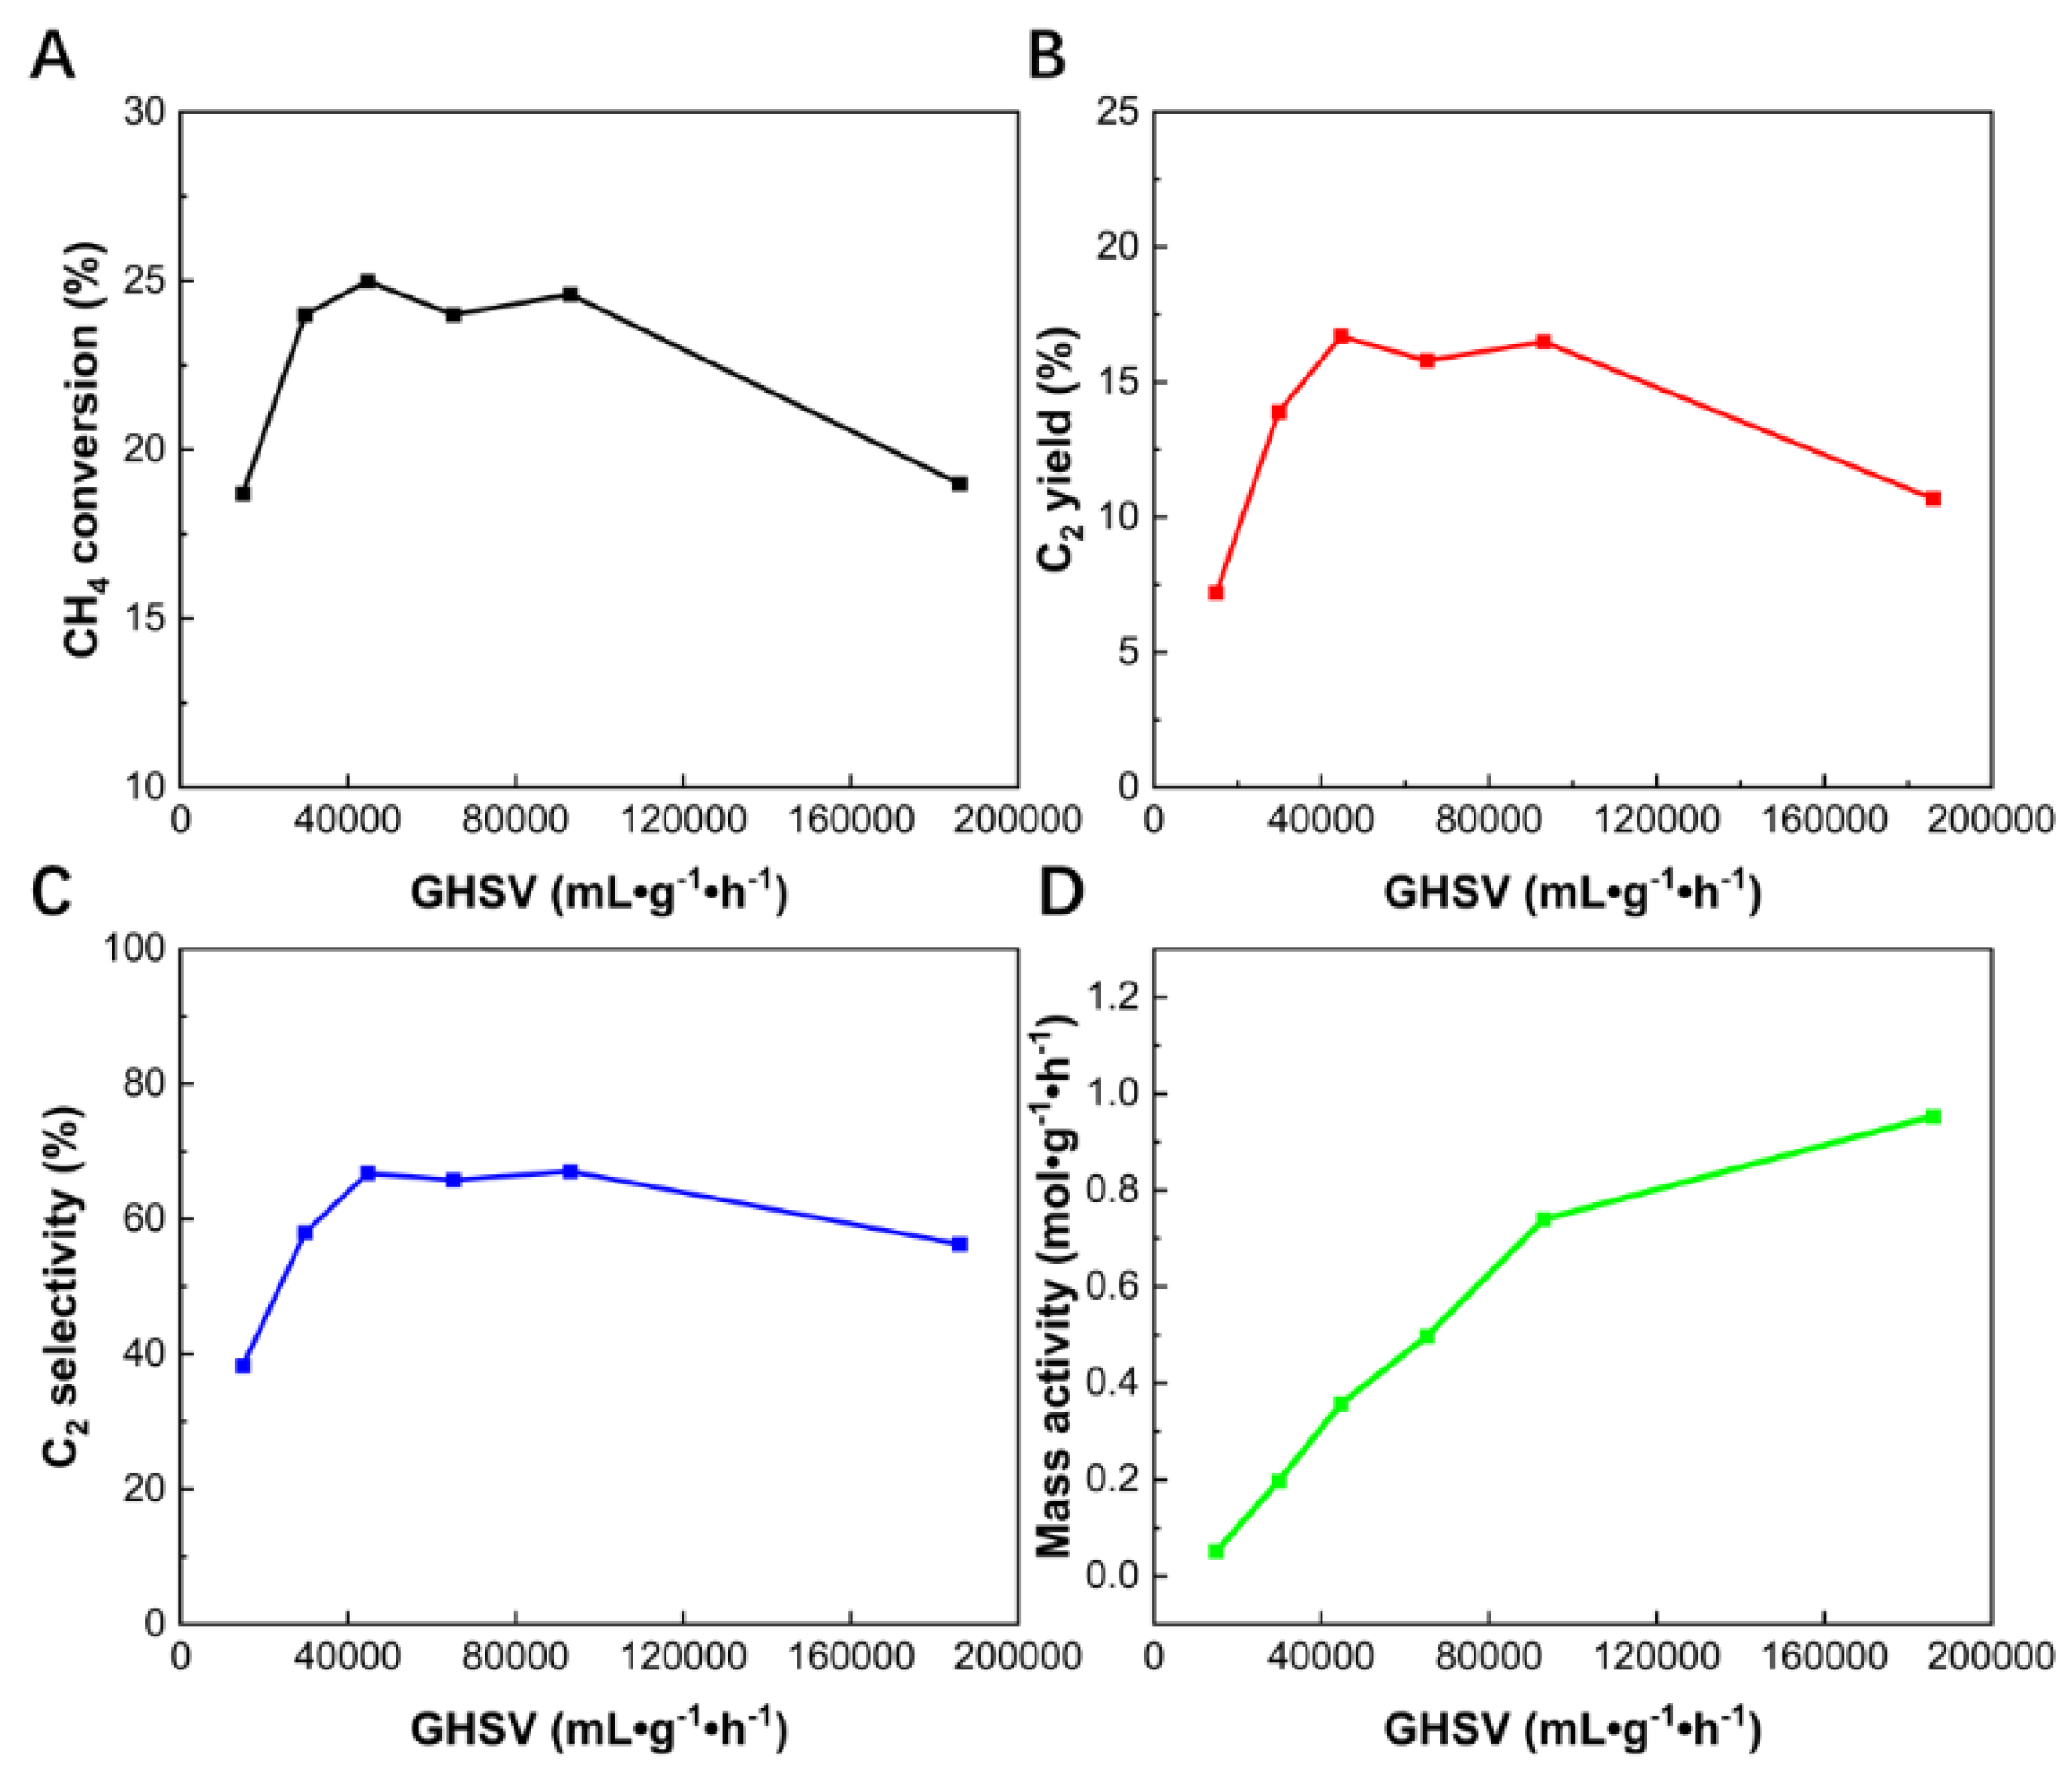
Figure 3.
C2 yield and selectivity vs temperature of the OCM reaction over La2O3 catalyst by co-feeding 3:1 CH4 and O2 with (orange) or without 1% vol H2O (blue) at GHSV=14880 mL·g−1·h−1 (A and C) and 44640 mL·g−1·h−1 (B and D). OCM reaction conditions: 0.025g of the catalysts under 6.7 (A and C) and 20 mL·min−1 (B and D) CH4: O2: Ar=70:23:7 flow rate, heating rate:10 °C /min. The experiment represented by the orange line in Figure 3 correspond to the same experiment as those under the same conditions in Figure 2.
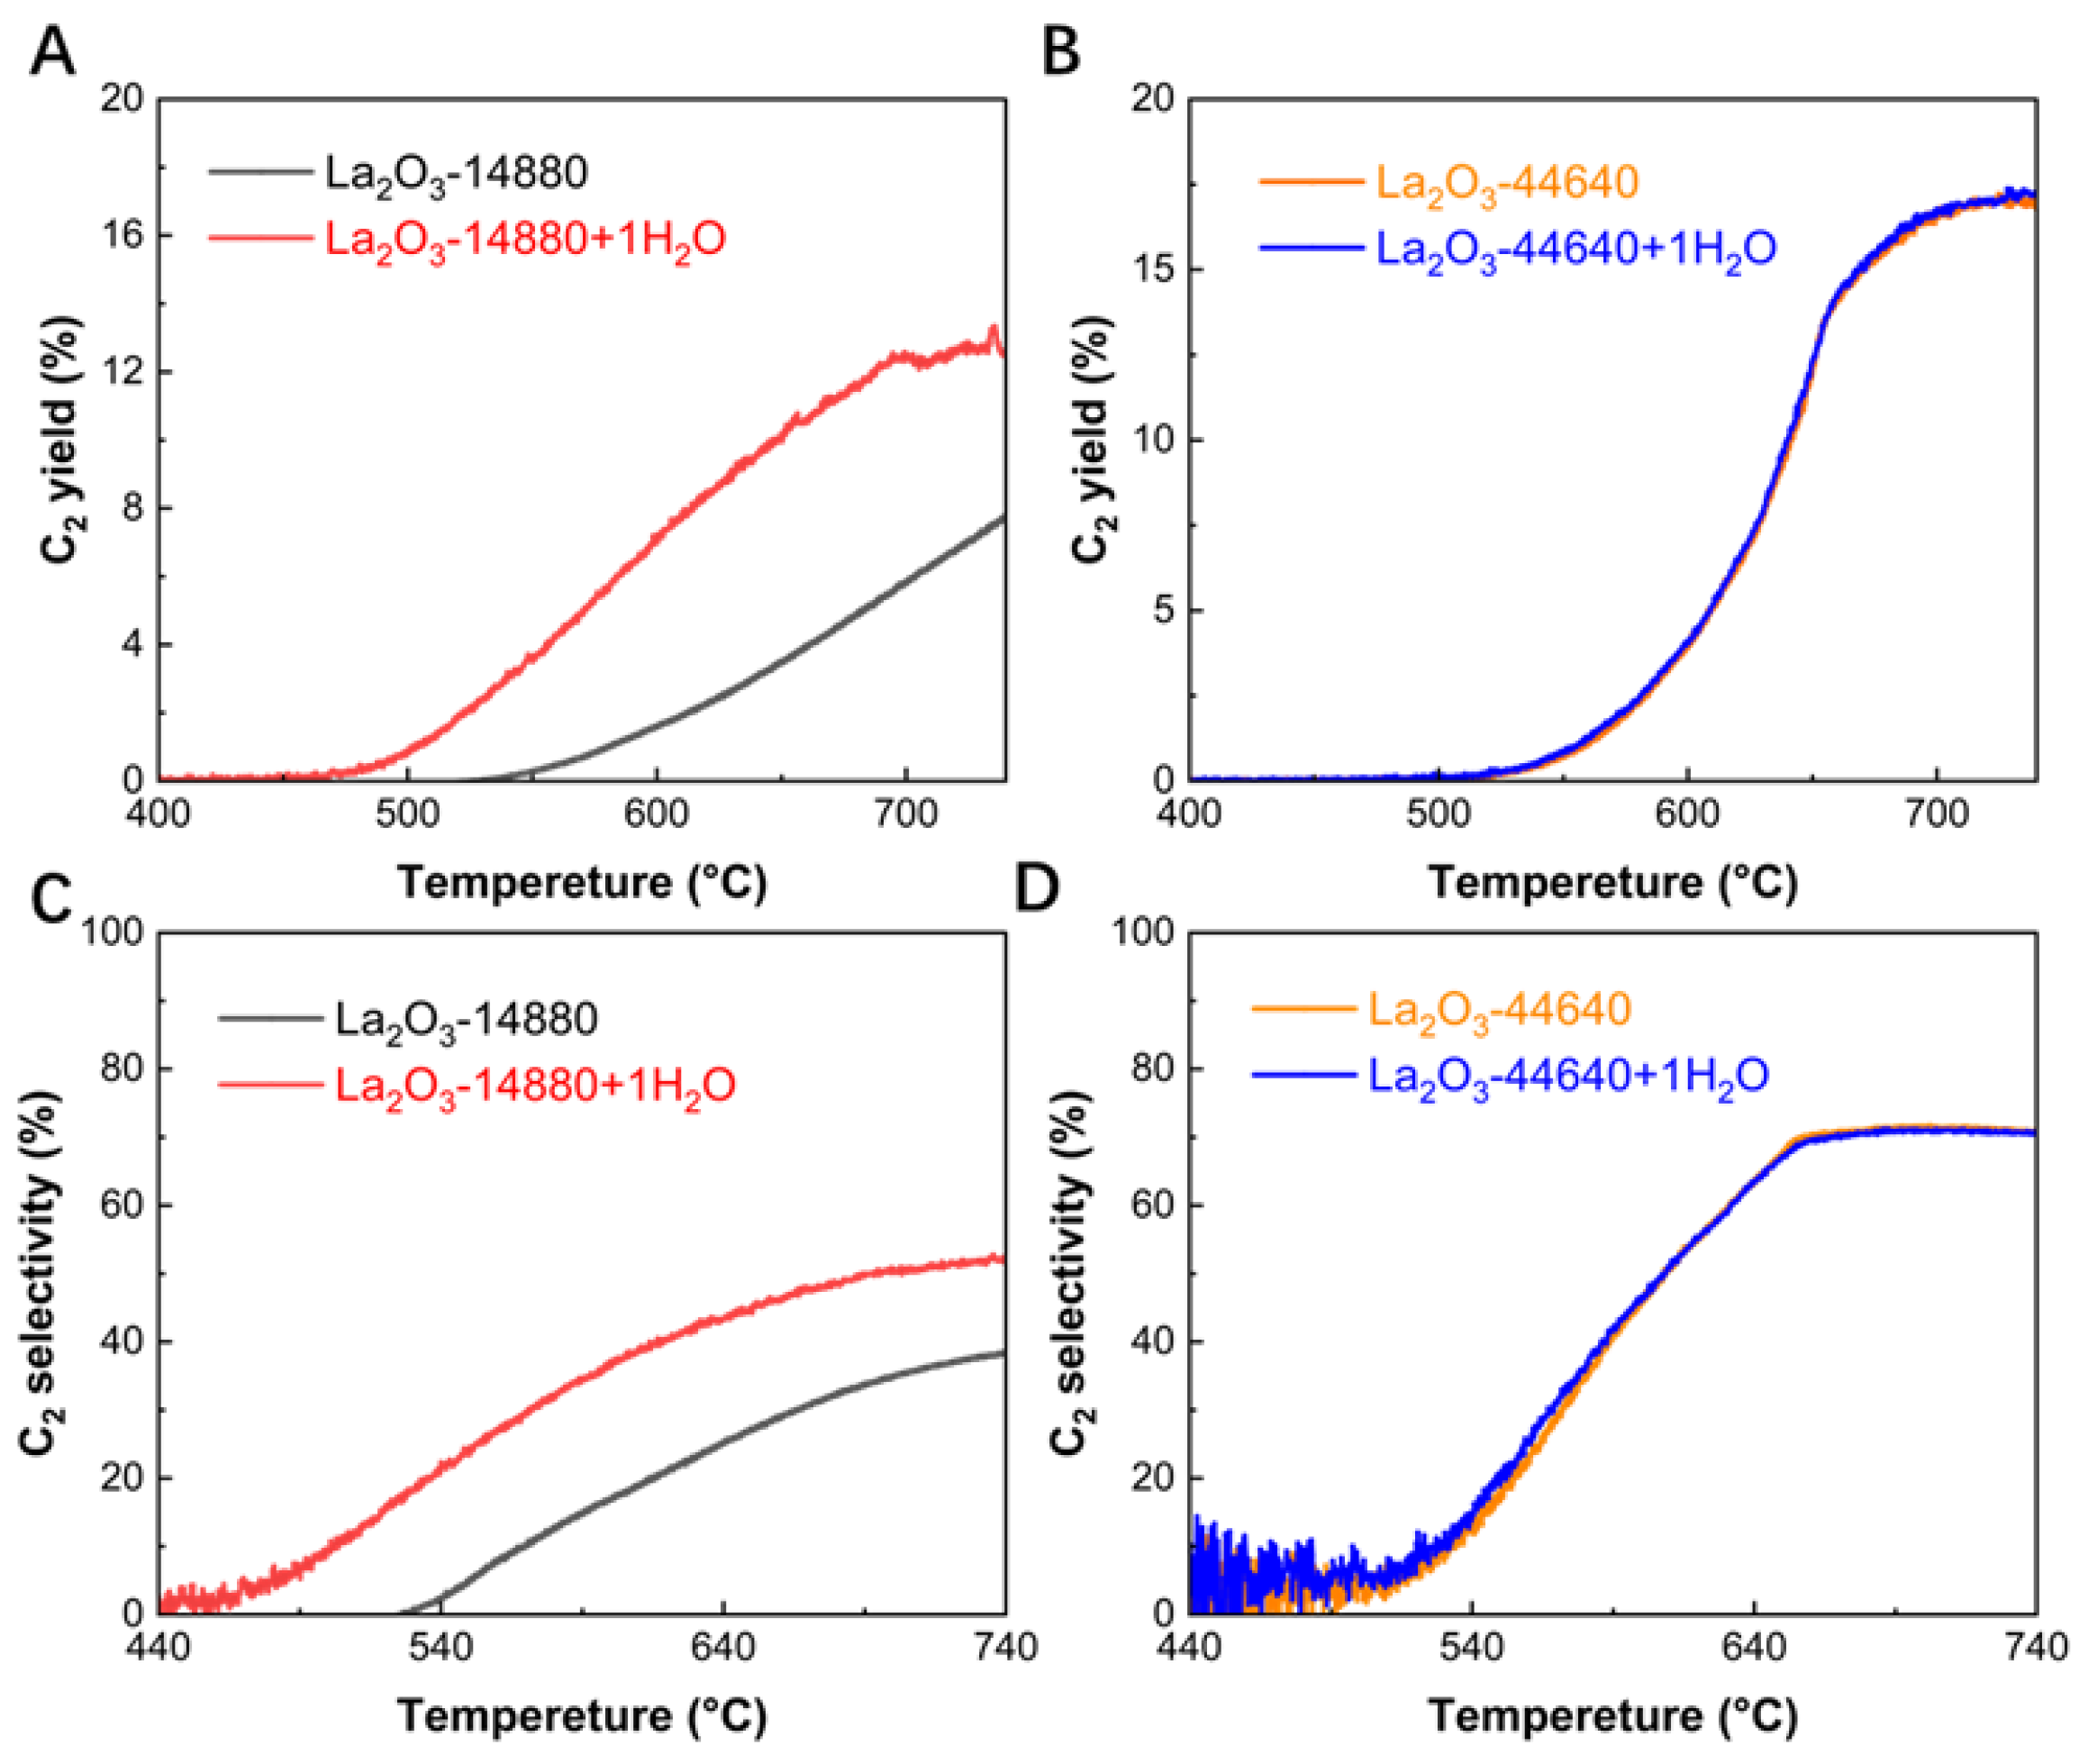
Figure 4.
CH4 conversion (A), C2 yield (B) and CO2 yield (C) vs temperature of the OCM reaction over La2O3 catalyst by adding 1% (black) and 5% (red) concentrations of CO to the reaction gas. The control group (blue) do not add CO. (D) The online MS results of the real time CO in exhaust outputs vs. temperature during the OCM reaction. OCM reaction conditions: 0.025 g of the catalysts under 20 mL·min-1 CH4: O2: Ar: CO=70:23:6:1, 70:23:2:5, 70:23:7:0 flow rate, GHSV= 44640 mL·g−1·h−1, heating rate:10 °C /min.
Scheme 1.
Catalyst reaction activity at different positions in the bed.
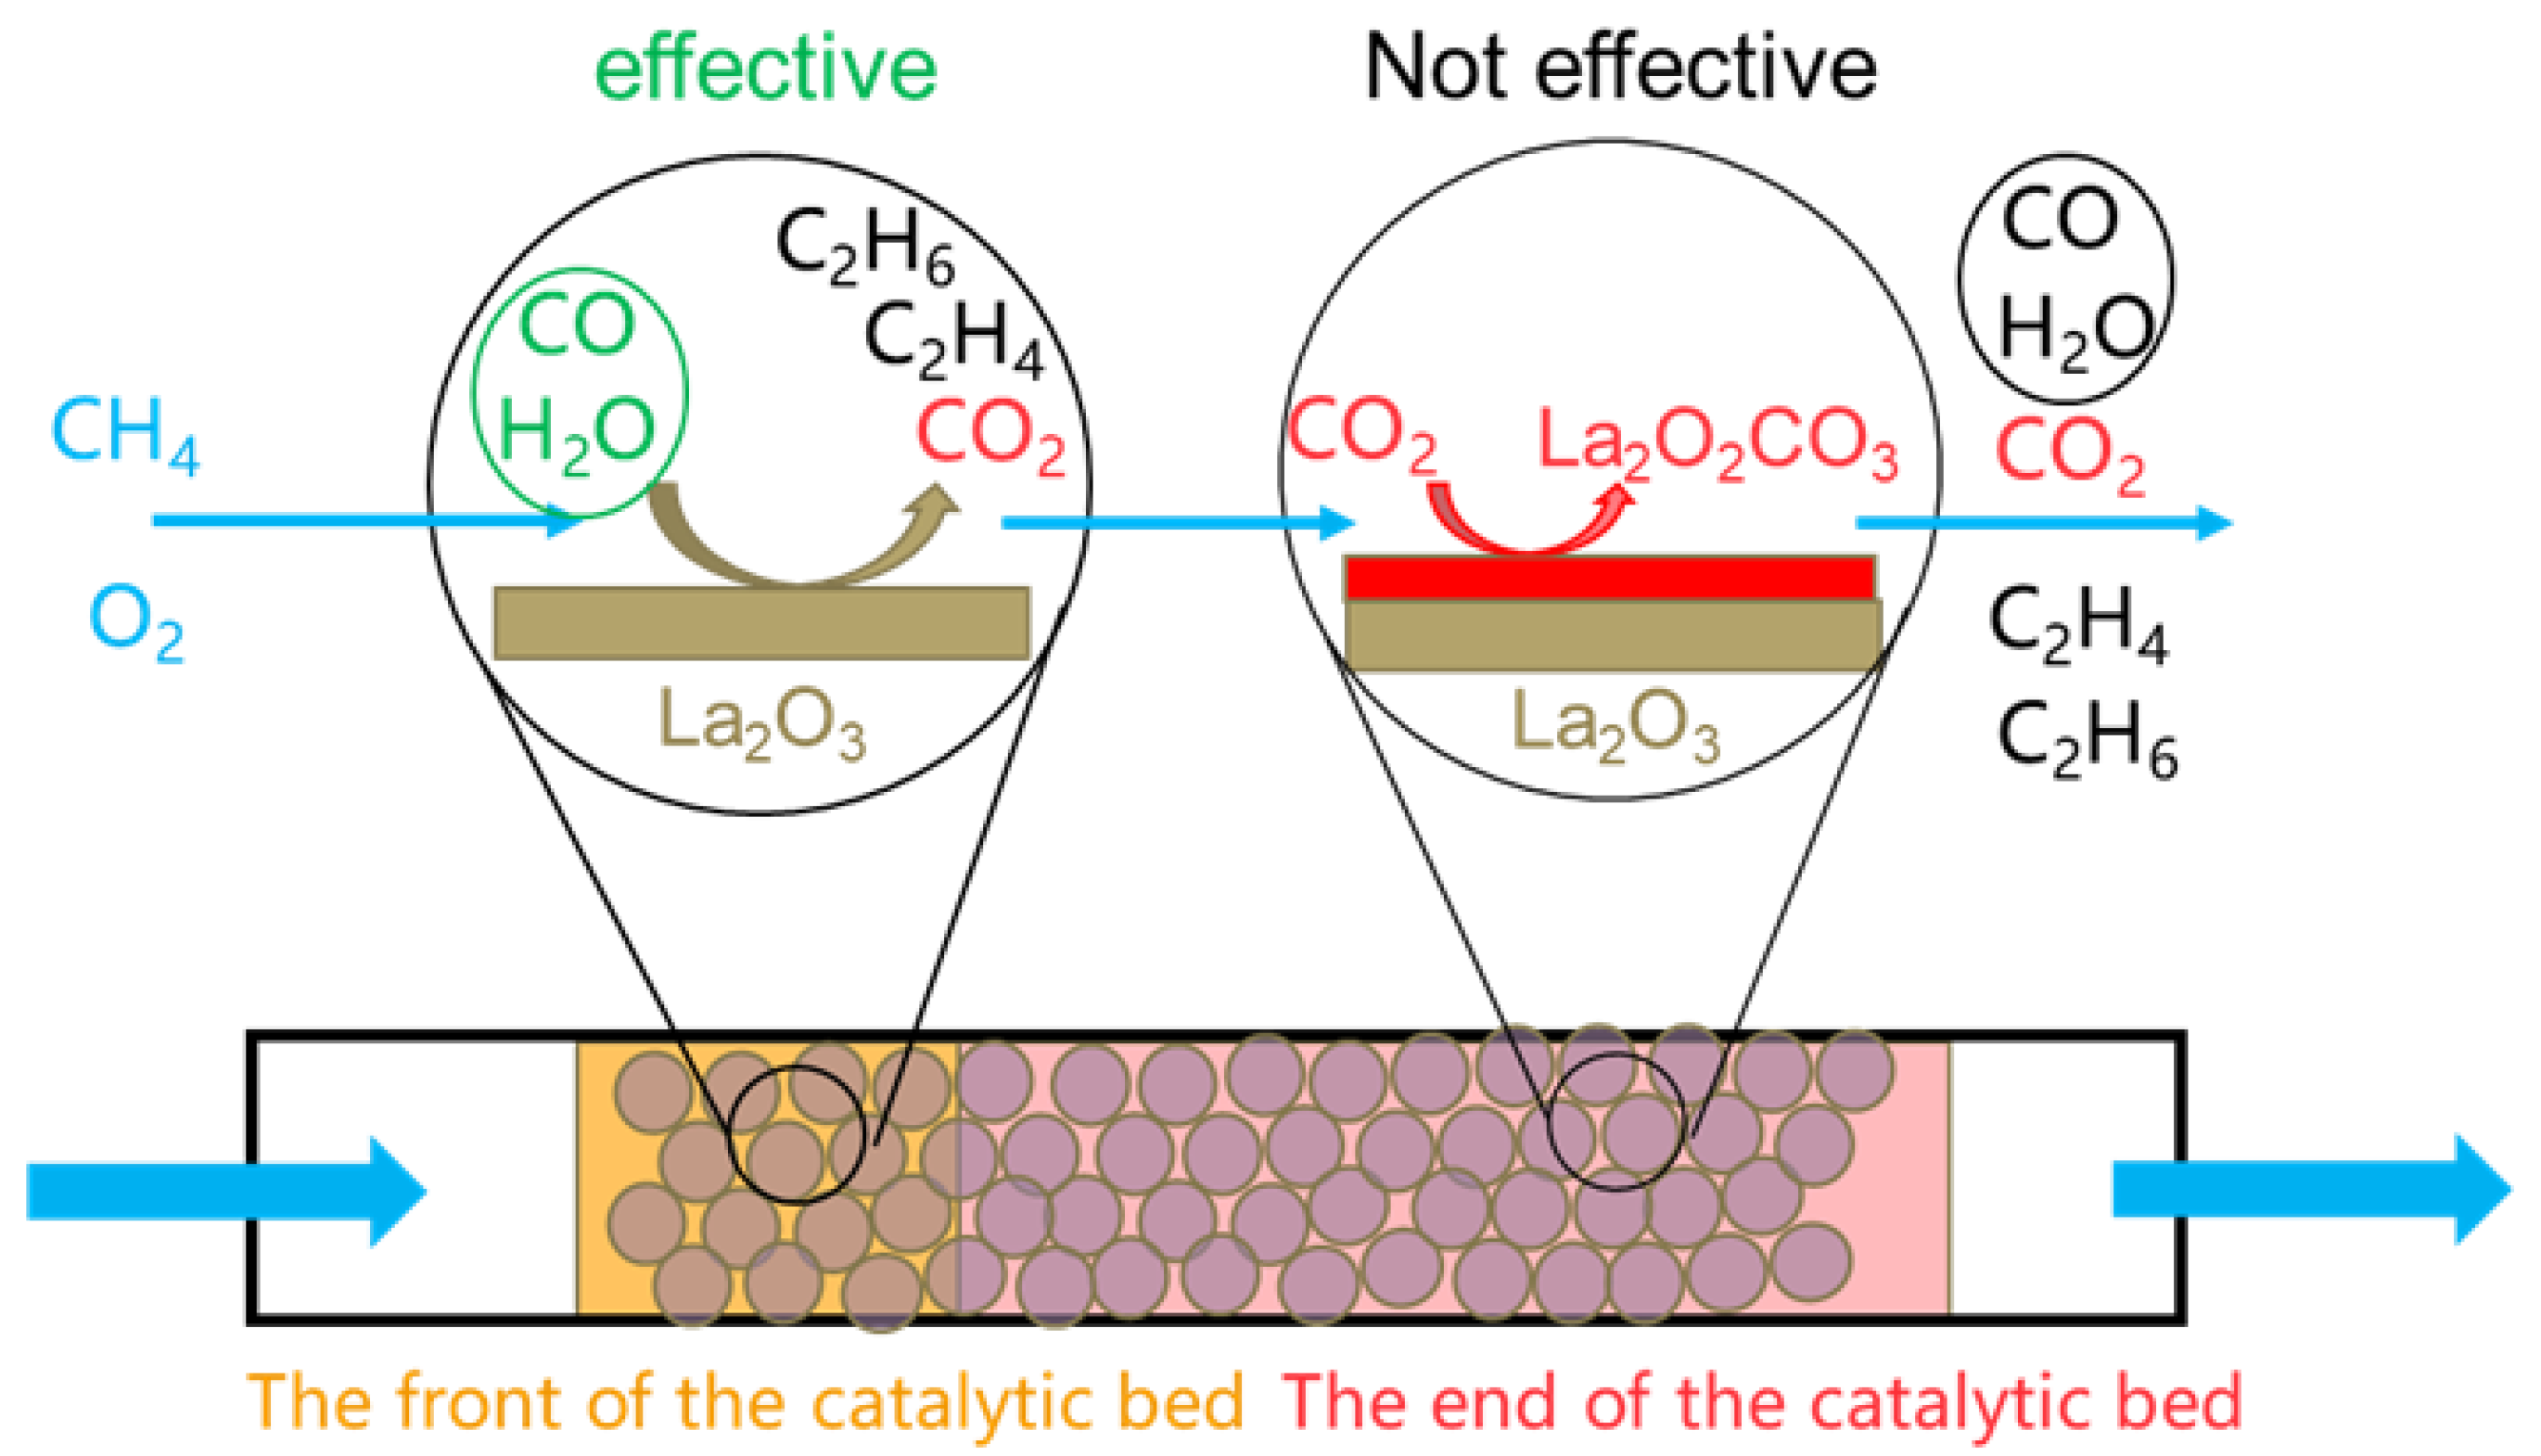

Table 1.
Comparison of CH4 conversion and C2 selectivity for catalysts at different GHSV.
| GHSV (mL·g-1·h-1) | CH4 conversion at 740 °C (%) | C2 selectivity at 740 °C (%) |
|---|---|---|
| 14880 | 18.7 | 38.3 |
| 29760 | 24 | 58.1 |
| 44640 | 25 | 71 |
| 65100 | 24 | 70.3 |
| 93000 | 24.6 | 70.4 |
| 186000 | 19 | 56.3 |
Table 2.
Comparison of CH4 conversion and C2 selectivity for La2O3 with and without water at 14880 L·g-1·h-1. OCM reaction conditions: 0.025 g of the catalysts under 20 mL·min-1 CH4: O2: Ar=70:23:7 flow rate, heating rate:10 °C /min.
Table 2.
Comparison of CH4 conversion and C2 selectivity for La2O3 with and without water at 14880 L·g-1·h-1. OCM reaction conditions: 0.025 g of the catalysts under 20 mL·min-1 CH4: O2: Ar=70:23:7 flow rate, heating rate:10 °C /min.
| Sample | CH4 conversion at 740 °C (%) | C2 selectivity at 740 °C (%) |
|---|---|---|
| La2O3-14880+1%H2O | 25.3 | 52.7 |
| La2O3-14880 | 18.7 | 38.3 |
Table 3.
Comparison of C2 yield for La2O3 with and without 1%, 5% concentrations of CO to the reaction gas at 44640 mL·g−1·h−1. OCM reaction conditions: 0.025 g of the catalysts under 20 mL·min-1 CH4: O2: Ar: CO=70:23:6:1, 70:23:2:5, 70:23:7:0 flow rate, GHSV= 44640 mL·g−1·h−1, heating rate:10 °C /min.
| Sample | C2 yield at 550 °C (%) | C2 yield at 740 °C (%) |
|---|---|---|
| La2O3-44640 | 0.77 | 17.0 |
| La2O3-44640 +1%CO | 2.5 | 15.6 |
| La2O3-44640+5%CO | 0.46 | 14.5 |
Disclaimer/Publisher’s Note: The statements, opinions and data contained in all publications are solely those of the individual author(s) and contributor(s) and not of MDPI and/or the editor(s). MDPI and/or the editor(s) disclaim responsibility for any injury to people or property resulting from any ideas, methods, instructions or products referred to in the content. |
© 2024 by the authors. Licensee MDPI, Basel, Switzerland. This article is an open access article distributed under the terms and conditions of the Creative Commons Attribution (CC BY) license (http://creativecommons.org/licenses/by/4.0/).
Copyright: This open access article is published under a Creative Commons CC BY 4.0 license, which permit the free download, distribution, and reuse, provided that the author and preprint are cited in any reuse.


