
Submitted:
28 December 2024
Posted:
30 December 2024
You are already at the latest version
Abstract
This study presents a method for the simultaneous determination of six acidic herbicides and their metabolites in various matrices, including fruits, vegetables, grains and edible oils. The method employs acidified acetonitrile extraction combined with dispersive solid-phase extraction cleanup(dSPE) using magnesium sulfatem, Florisil, and graphitized carbon black (GCB). The analysis was performed using high-performance liquid chromatography-tandem mass spectrometry (HPLC-MS/MS). Acetonitrile and 2 mmol.L-1 ammonium formate aqueous solution with a volume ratio of 0.1%(v/v) formic acid were used as mobile phases, target pesticides were analyzed by HPLC-MS/MS in both positive and negative at an ESI ion source under multiple reaction monitoring(MRM). The mass concentrations of six herbicide pesticides and their metabolites showed good linearity with the corresponding peak area in the range of 0.5~50 μg/L, and the correlation coefficient was more than 0.993. The limits of method detection(LODs)ranged from 0.0001 to 0.008 mg/kg. The recovery rates of adding recovery experiments to cabbage, chives, pear, wheat flour and soybean oil were 69.8%~120%, and the relative standard deviation (RSD) was 0.6%~19.5%. The results indicate that this method is efficient and fast, and can be used for the detection of actual samples in various matrices.
Keywords:
QuEChERS
; HPLC-MS/MS
; acid herbicides
; residue detection
1. Introduction
Clodinafop-propargyl, quizalofop-P-tefuryl, haloxyfop-methyl and haloxyfop-P-methyl are classified under the phenoxypropanoic acid herbicides. The residue dufinition for clodinafop-propargyl includes the sum of clodinafop-propargyl and its metabolite clodinafop. Similarly, the residue of quizalofop-P-tefuryl is defined as the sum of quizalofop-P-tefuryl and quizalofop, represented as quizalofop-P-tefuryl. The residues of haloxyfop-methyl and haloxyfop-P-methyl are defined as the sum of these compounds and their conjugates, represented by haloxyfop. Cyhalofop-butyl belonging to the aryloxyphenoxypropionate class of herbicides, has a residue sum of cyhalofop-butyl and cyhalopfop acid [1]. Trinexapac-ethyl, a cyclohexane carboxylic acid pesticide initially is used as a plant growth regulator [2], it can also function as a herbicide [3]. The residue of trinexapac-ethyl is the metabolite trinexapac. The structural formulas of the above herbicides are shown in Figure 1, all of which contain carboxyl groups and are acidic herbicides. The registration information of clodinafop-propargyl, quizalofop-P-tefuryl, cyhalofop-butyl, trinexapac-ethyl, haloxyfop-methyl and haloxyfop-P-methyl on the China Pesticide Information Network is increasing, and they have been used to control weeds in crops such as wheat, corn, soybeans, and potatoes [4]. These six pesticides have set temporary limit indicators for some agricultural products in the national standard GB 2763-2021 “National Food Safety Standard Maximum Residue Limits for Pesticides in Food”, but none of them have been recommended testing methods. Currently, Han Hedan et al. [5] have tested the residual levels of clodinafop-propargyl in barley, while Yang Xiaolu et al. [6] have tested the residues of cyhalofop-butyl and cyhalopfop acid in fruits and vegetables, there were a total of seven samples with detected target compounds, and the results were all below the EU limit; Li Yan et al. [7] determined quizalofop-P-tefuryl in potatoes. Although detection methods for these herbicides have been reported, there is no unified method. Therefore, it is urgent to establish efficient and convenient detection methods.
2. Results and Discussion
2.1. Optimization results of Mass Spectrometry Parameters
Using an ESI ion source and in positive and negative ion monitoring mode, the single standard solution of 11 pesticides with a mass concentration of 0.2 mg/L was prepared using a peristaltic pump with a concentration of 7 μL/min flow rate is continuously injected into the ion source, and the abundance and stability of the parent ion and the corresponding voltage value of the casing lens are determined through a full scan mode. Then, a certain collision energy is applied to the determined parent ion to perform sub ion fragment scanning. Two pairs of relatively high abundance and low interference fragment ions are selected for each compound as quantitative and qualitative ion pairs, respectively. The specific optimization parameters of the 11 pesticides are determined in Table 1.
2.2. Purification Optimization of Pre-Treatment
2.2.1. Selection of Purification Agent Types
Seven purification agents, which commonly used for QuEChERS method, were selected for experimental optimization, namely GCB, Florisil, Alumina-N, MgSO4, Ethylenediamine-N-propylsilane(PSA), methyl 3-hydroxyoctadecanoate(C18), and multi walled carbon nanotubes(MWNTs) to investigate the effects of different purification agents on the recovery rate of tested pesticides.
Prepared a standard mixed solution of the 11 pesticides with a mass concentration of 0.05 mg/L using a 0.1% formic acid acetonitrile solution by volume fraction. Took 6 mL standard mixed solution and add it to 150 mg of purification agent. Vortexed and mixed for 2 min, then centrifuged at 5000 r/min for 5 min; Used a disposable syringe to aspirate 2 mL of the supernatant, passing 0.22 μm organic filter membrane, the filtrate is measured according to the optimized conditions of the instrument. Performed 3 parallel tests for each purification plan. Evaluated the adsorption effect of different purifying agents on pesticides by examining the average recovery rate, and ultimately determine the purification plan for the sample. According to Table 2, MgSO4, Florisil, and C18 all meet the requirements for recovery rate, and optimization was carried out by combining the two purification agents.
Figure 2.
Total ion chromatogram of the 11 pesticides standard solution.
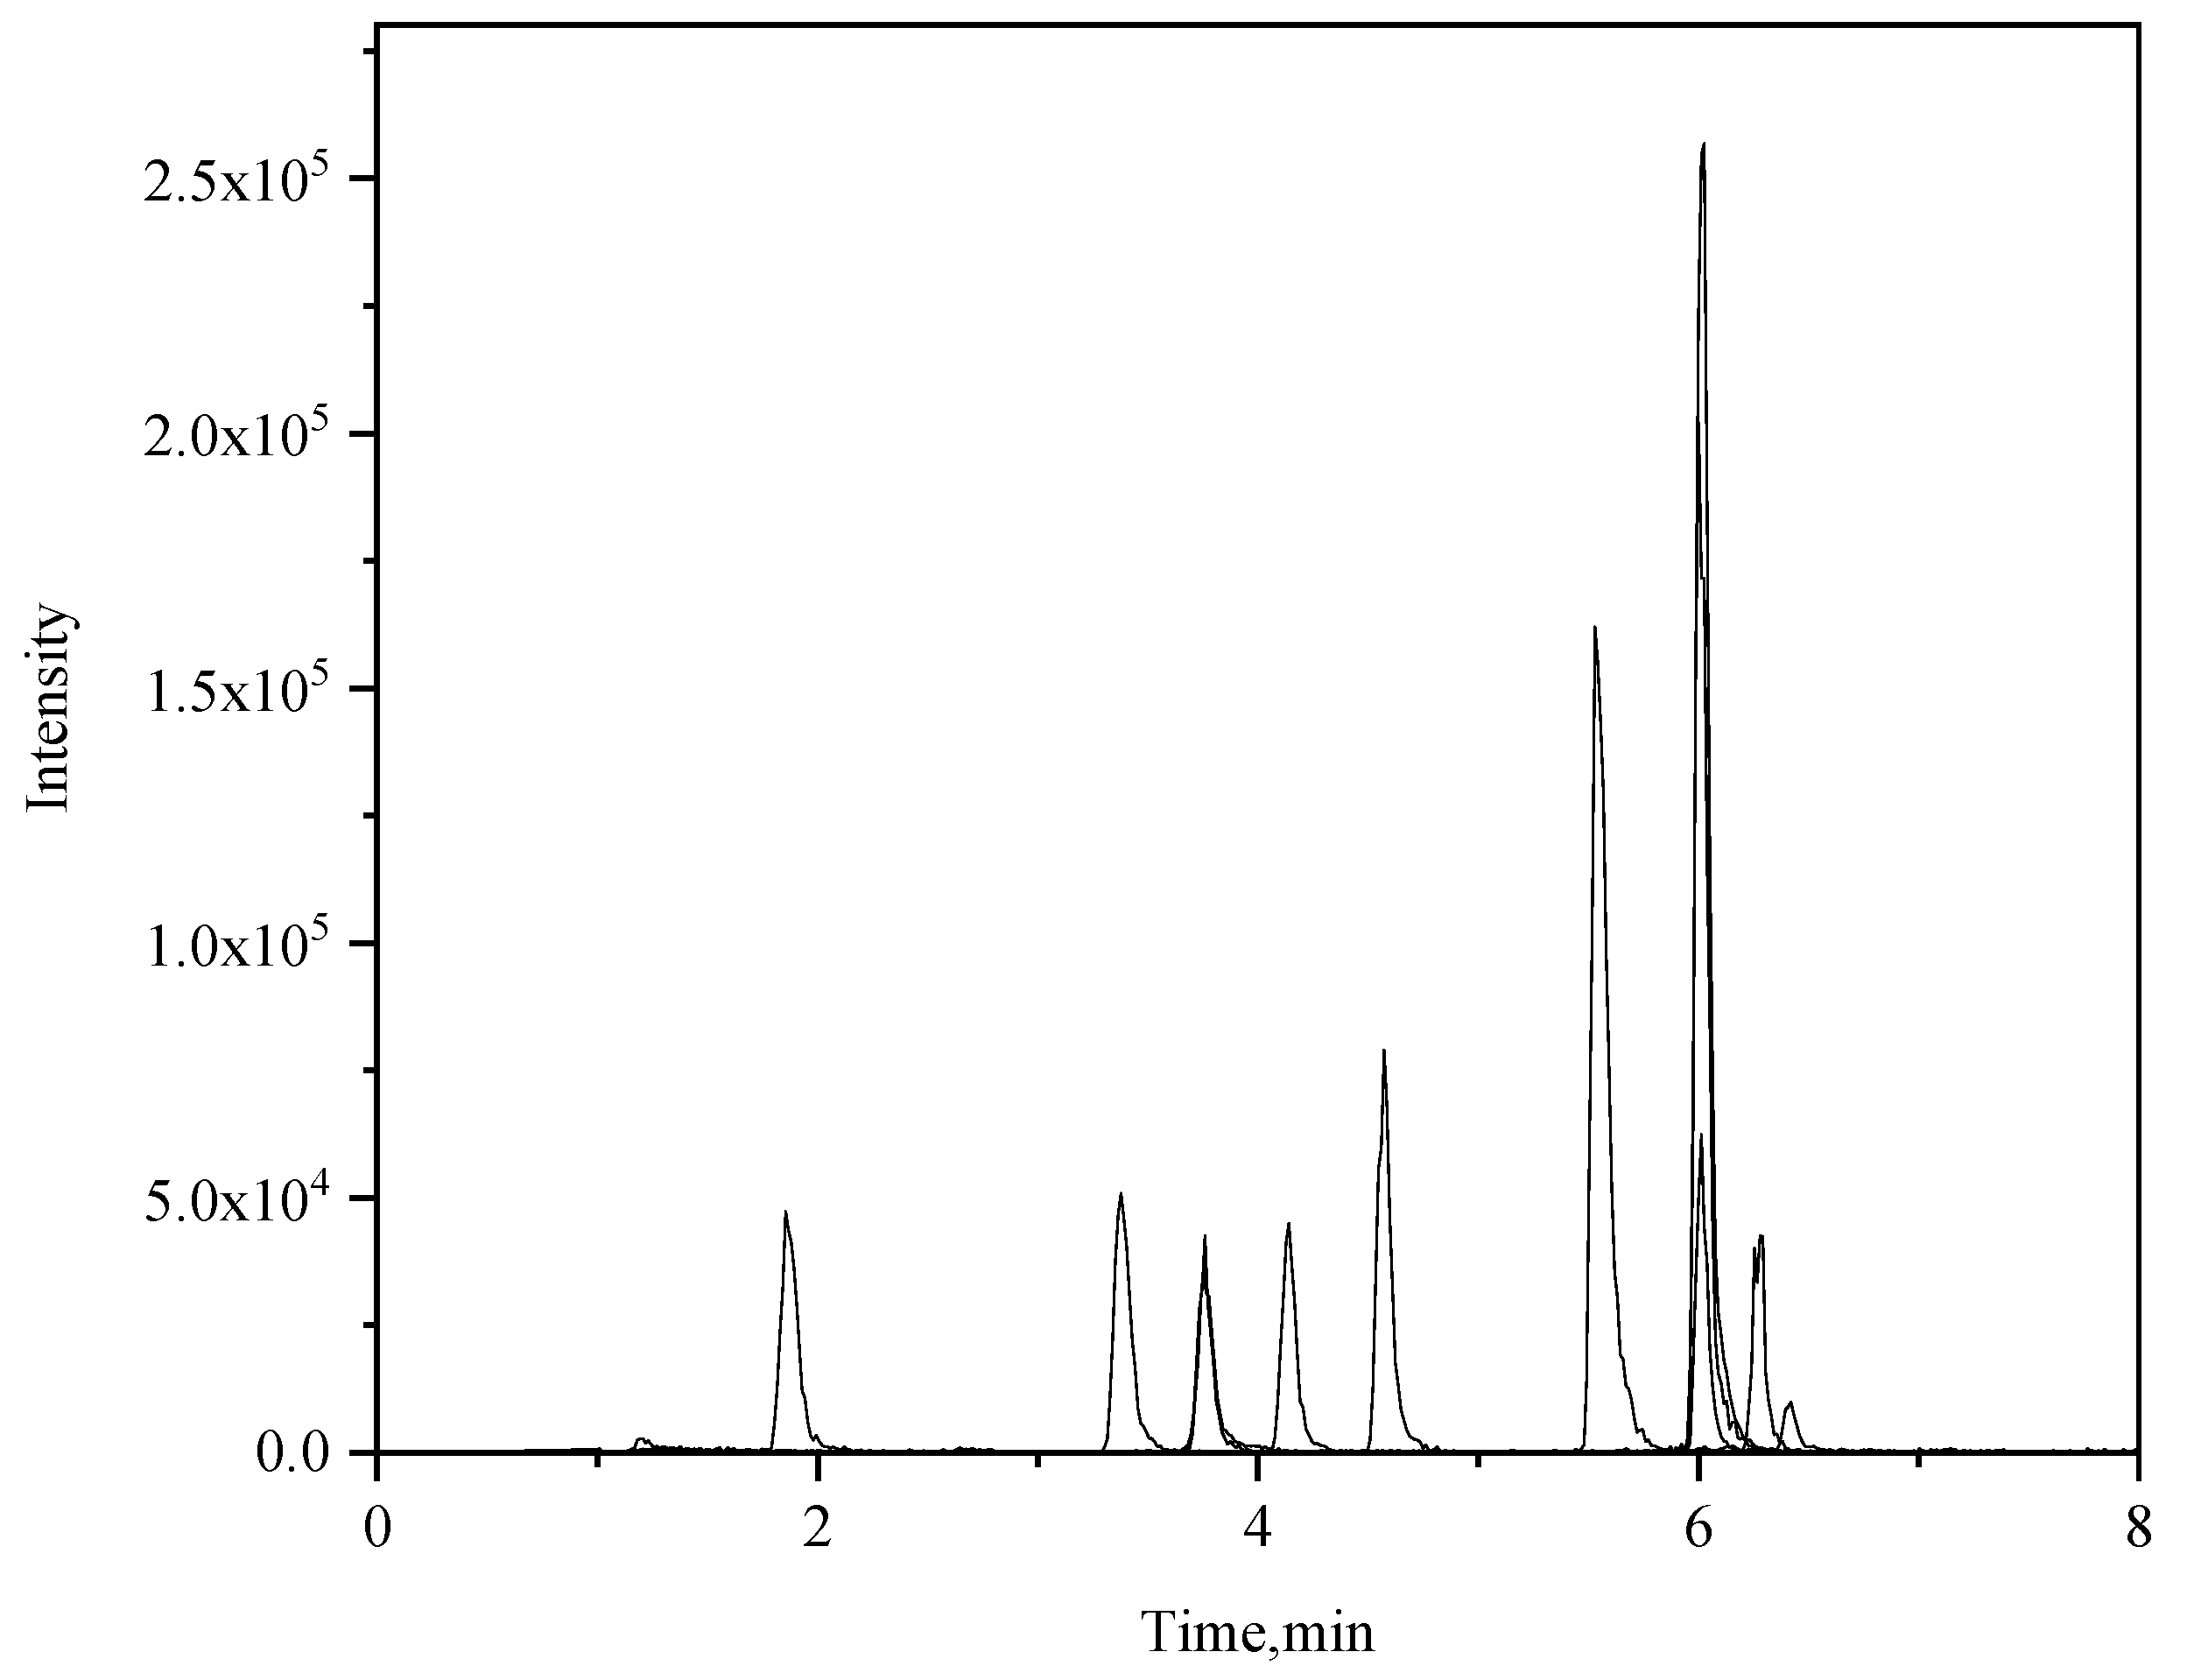
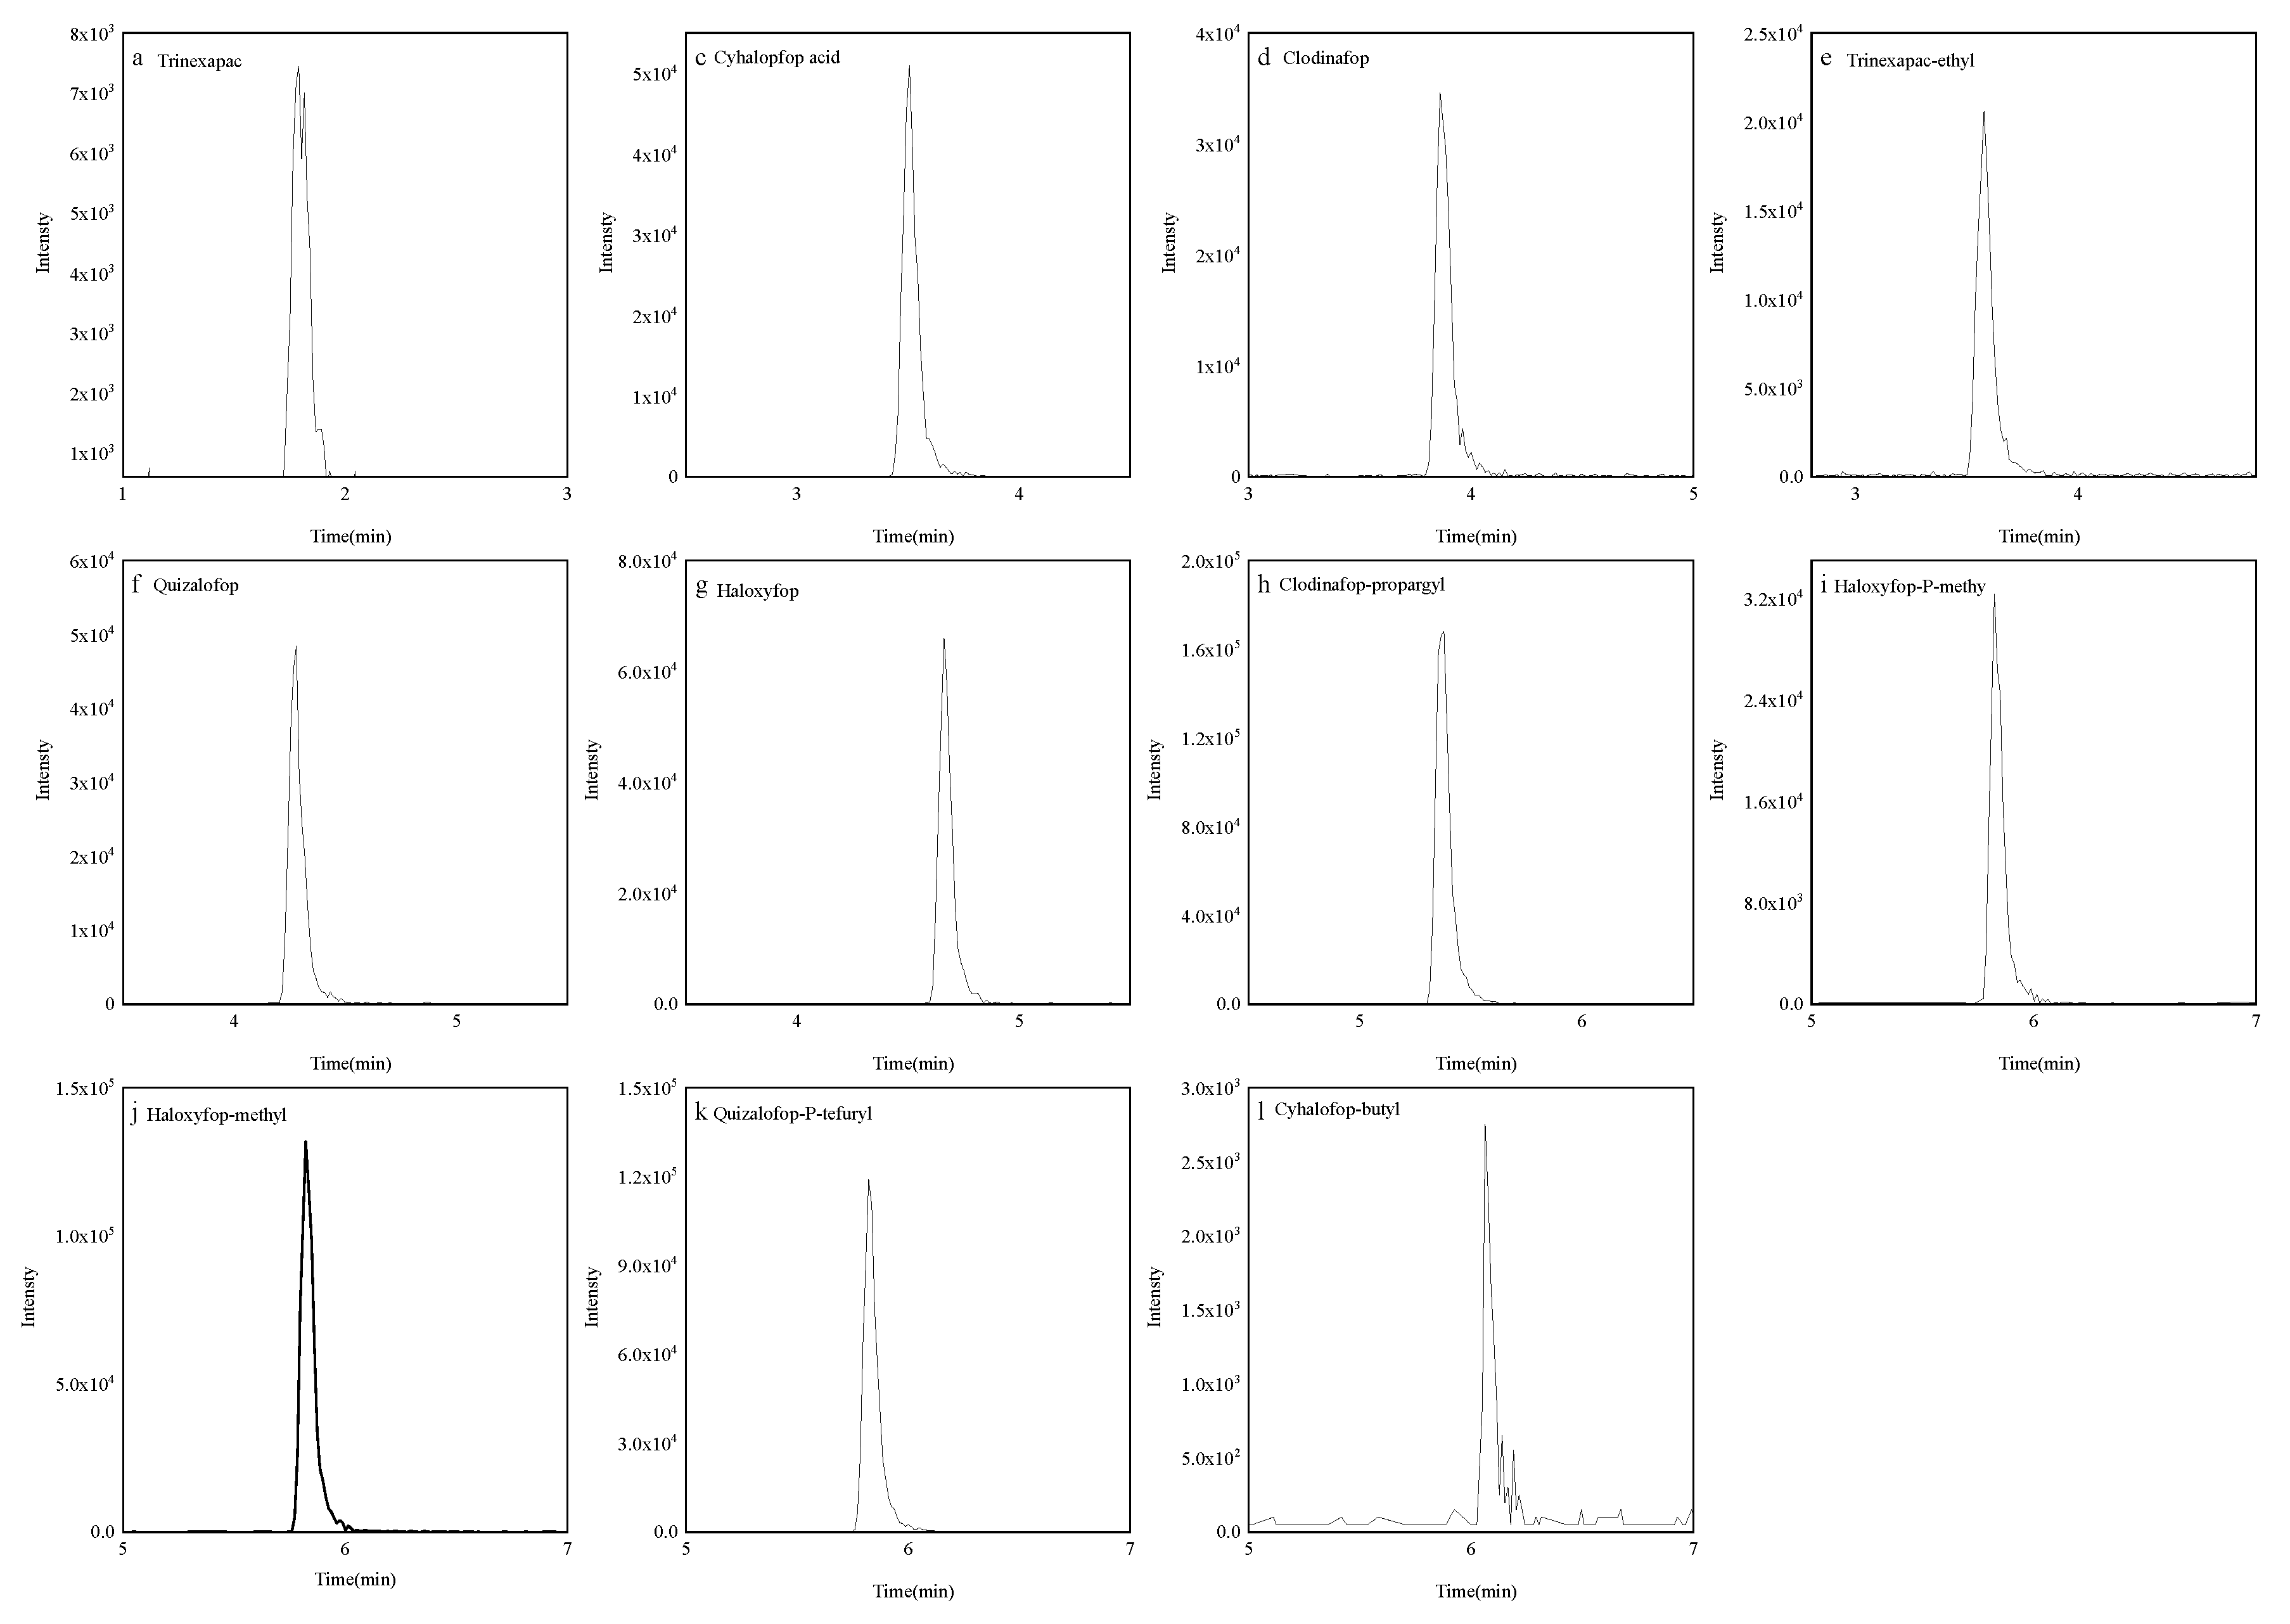
Figure 3.
Quantitative extracted ion chromatograms of 11 pesticides standard.
2.2.2. Optimization of Purifier Content
Fruits and vegetables contain a high amount of water, vitamins, pigments and so on.. Florisil is used to remove polar impurities and fatty acids, C18 is used to adsorb fats, and MgSO4 is used to remove water. Using a combination of MgSO4 and Florisil for further optimization, fixed 150 mg MgSO4 to purify 6 mL of the extraction solution and optimize the amount of Florisil. Design 5 different ratios: 1) 30 mg Florisil+150 mg MgSO4; 2) 90 mg Florisil+150 mg MgSO4; 3) 150 mg Florisil+150 mg MgSO4; 4) 210 mg Florisil+150 mg MgSO4; 5) 270 mg Florisil+150 mg MgSO4. After determining the content of Florisil, optimized the ratio of MgSO4 again and set 5 different weight ratios: 1) Florisil: MgSO4 = 1:0.5; 2) Florisil: MgSO4 = 1:1; 3) Florisil: MgSO4 = 1:2; 4) Florisil: MgSO4 = 1:3; 5) Florisil: MgSO4 = 1:4.
Prepared a standard mixture of 11 pesticides with a certain concentration using blank matrix solution of cabbage as a solvent. Took 6 mL and add it to a centrifuge tube containing the aforementioned dispersant purification agent, then left for 2 h. Vortexed at 2500 r/min for 2 min, centrifuged at 5000 r/min for 5 min, and pass 0.22 μm organic filter membrane, the filtrate was measured according to the optimized working conditions of the instrument. The blank matrix solution used for preparing matrix standard curve was purified according to the conditions in Scheme 1). By evaluating the average recovery rate, the purification effects of different schemes were evaluated, the purification effects of adding recycling were shown in Table 3.
According to the results in Table 3, it could be seen that there was little change in the recovery rate of each pesticide when 6 mL of purified solution corresponds to 30-150 mg Florisil; For trinexapac, the recovery rate decreased with the increase of Florisil content. When the Florisil content reaches a certain level, the recovery rate also shows a decreasing trend for cyhalopfop acid, quizalofop and haloxyfop. The increase in MgSO4 content has little effect on the recovery rate of most pesticides, while for trinexapac, when the ratio of Florisil to MgSO4 exceeds 1:1, the recovery rate of trinexapac shows a downward trend. Therefore, the appropriate content of Florisil should be between 6 mL corresponding to 30-150 mg. In this study, a 6 mL extraction solution was used for purification by mixing 150 mg Florisil and 150 mg MgSO4.
2.2.3. Purification Optimization of Dark Vegetables
For dark vegetables, a small amount of GCB needs to be added to remove pigment interference. Using chives to do the experiment, an appropriate amount of GCB was selected to achieve the effect of color removal while ensuring that the recovery rate of each pesticide was within a good range. The design ratio of 6 mL extraction solution was as follows: ① 150 mg Florisil+150 mg MgSO4+60 mg GCB; ② 150 mg Florisil+150 mg MgSO4+90 mg GCB; ③ 150 mg Florisil+150 mg MgSO4+120 mg GCB; ④ 150 mg Florisil+150 mg MgSO4+150 mg GCB; ⑤ 150 mg Florisil+150 mg MgSO4+180 mg GCB.
Conduct experiments and measurements according to the same pre-treatment steps in 2.2.2. Purify the blank solution of the base standard under scheme ① purification conditions. Evaluated the purification effect of different schemes by examining their average recovery rates, the results were shown in Table 4.
As shown in Table 4, with the increase of GCB dosage, the recovery rates of clodinafop, cyhalopfop acid, quizalofop, haloxyfop and quizalofop-P-tefuryl all showed a downward trend. Among them, quizalofop showed the most obvious downward trend. When 120 mg GCB was added to 6 mL of extraction solution, the recovery rate of quizalofop was 82.1%. When the GCB dosage was increased to 180 mg, the pigments in the purified extraction solution were basically removed, But the recovery rate of quizalofop was only 36.2%. It was recommended to use 150 mg Florisil+150 mg MgSO4+120 mg GCB as the purification agent for chives extract, as it ensured good recovery rates for all 11 target substances and acceptable purification efficiency.
2.3. Detection and Quantification Limits of the Method
Using the matrix standard curve to calculate the blank value and the concentration of the spiked sample quantitatively. According to equation (1) below, calculate the weighted standard deviation (SD), and then calculate the LOD value by using equation (2) [8]. The LOD values for the three substrates of cabbage, pear, chives, wheat flour and soybean oil are shown in Table 5, with R2 values above 0.993.
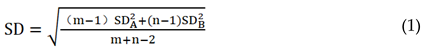
LOD = 2×t0.05(f)×SD/S
In equation (1), “m” is the number of measurements for the blank sample, “n” is the number of repetitions for a certain added concentration, and “SDA” is the standard deviation of the blank sample; “SDB” is the standard deviation of a sample with added concentration; In equation (2), t0.05 (f) can be obtained from the statistical table, and the sensitivity “S” can be estimated from the average recovery value and addition level. S = average sample concentration B/minimum addition concentration concentration (the minimum addition concentration is generally the lowest point on the standard curve or the lowest concentration point that can peak).
In cabbage, pear chives, wheat flour and soybean oil, the limit of quantification (LOQ) of the method is 0.005-0.01 mg/kg. The quantitative limit of this method can meet the detection requirements of the national standard limit, but for the setting of the quantitative limit, considering the addition of herbicides and metabolites, the influence of recovery rate, and the standard limit value, a too low quantitative limit was not set.
2.4. Accuracy and Precision of Methods
Add concentrations of 0.01 mg/kg, 0.05 mg/kg, and 0.2 mg/kg to the blank samples of cabbage; Add concentrations of 0.01 mg/kg, 0.02mg/kg, 0.1 mg/kg to the blank chives, respectively; Add concentrations of 0.01 mg/kg, 0.02 mg/kg, and 0.1 mg/kg to the pear blank sample, respectively; Add concentrations of 0.01 mg/kg, 0.05 mg/kg, and 0.2 mg/kg to the blank wheat flour sample, respectively; Add concentrations of 0.01 mg/kg, 0.05 mg/kg, and 0.2 mg/kg to the blank soybean oil sample, respectively, with 6 replicates at each level. Quantitatively calculate the average recovery rate and RSD using matrix matching standards combined with external standard method, and evaluate the accuracy and precision of the method. The results are shown in Table 6. The results showed that in cabbage and chives, the recovery rates of 11 pesticides at three levels were 69.8%~115%, and the RSD was 0.6%~8.6%; The recovery rates of 11 pesticides in pear at three levels are 80.0%~120%, and the RSD is 0.6-17%; The recovery rates of 11 pesticides in wheat flour at three levels were 73.6%~116%, and the RSD was 1.4~19%, ; The recovery rates of 11 pesticides in soybean oil at three levels were 83.5%~117%, and the RSD was 1.8~10%which meets the requirements of methodology (GB/T 27404-2008) [9].
2.5. Actual Sample Testing
A total of 144 samples were collected from the Shanghai market, including 86 vegetables such as leafy vegetables, eggplants, brassicas, bulbs, rhizomes and potatoes, 28 fruits such as nuts, drupes and berries, 20 grains such as rices, wheat flours, and 10 edible oils such as peanut oils, soybean oils and rapeseed oils. Use the established instrument and pre-treatment methods to detect actual samples, and use blank cabbage for addition and recovery as quality control during the process to ensure the accuracy and stability of the detection results. The target compound were detected in 20 samples, with a total detection rate of 13.8%. As shown in Table 7, among the 20 detected samples, cyhalopfop acid, quizalofop, trinexapac and haloxyfop were detected in Chinese little greens, Hangzhou cabbage, bok choy, amaranth and peach, other herbicides and metabolites were not detected. According to the maximum residue limit requirements of the European Union for pesticides, the limit for cyhalofop-butyl in root vegetables is 0.02 mg/kg, and the limit for quizalofop, trinexapac, and haloxyfop in stem vegetables is 0.01 mg/kg [10]. The detection values of cyhalofop-butyl and cyhalofop acid are below the limit of 0.02 mg/kg, while the detection values of the other three herbicides and their residues are all above the limit of 0.01 mg/kg. However, the overall detected herbicide content is at a relatively low level, with only quizalofop having a detection value exceeding 0.1 mg/kg, and the crops with detected herbicides are not registered. The actual sample testing results indicated that although herbicides were mainly applied to field crops, they may also be applied during the cultivation process of vegetables and fruits.
3. Materials and Methods
3.1. Instrumental Conditions
TQ5500 triple quadrupole mass spectrometer (AB company in the United States); Equity I-Class liquid chromatograph (Waters, USA) and Waters Acquity UPLC BEH C18 column 2.1×100 mm, 1.7 μm) ; AL204-IC electronic analytical balance (METTLER TOLEDO, Switzerland); Talboys digital display vortex oscillator (Shanghai Anpu Company); High speed desktop centrifuge (Sorvall ST 16R, Thermo Scientific, USA); Ultra pure water (18.2 MΩ· cm, Merck, Germany).
3.2. Chemicals and Reagents
Acetonitrile (ACN, HPLC grade, Merck, Germany); Formic acid (FA) and ammonium formate (HPLC grade, CNW, Germany); NaCl (analytical pure, Shanghai Titan Technology Co., Ltd.); Magnesium sulfate (MgSO4, analytical pure, CNW, Germany); Primary secondary amine (PSA, 40-63 μm. CNW, Germany); Graphitized carbon black (GCB, 37-119 μm. CNW, Germany); Octadecyl bonded silica gel (C18, 40-63 μm, CNW, Germany); Neutral alumina (Alumina-N, 46-149 μm. CNW Germany); Multi walled carbon nanotubes (MWNTs, 20-30 nm, Aladdin, Shanghai China) and Florisil (149-209 μm, CNW, Germany) .
Standard substances: Trinexapac-ethyl, Trinexapac, Haloxyfop-methyl (purity: 98.69%, 98.9%, 98.74%, Dr. Ehrenstorfer, Germany); Haloxyfop-P-methyl and Haloxyfop (purity: 96.7%; 98.2%, Anpu, Shanghai China); Quizalofop-P-tefuryl, Quizalofop and Clodinafop (purity: 96.6%, 98.0%, 99.0%, Alta, Tianjin China); Clodinafop-propargyl (purity: 97%, Macklin, Shanghai China); Cyhalofop-butyl and Cyhalopfop acid (purity: 98%, 96%, Yuanye, Shanghai China)
3.3. Preparation of Standard Solutions
Weighed 10 mg (± 0.1 mg) of each standard substance separately, and which were respectively diluted to 10 mL with acetonitrile to prepare a standard stock solution with a concentration of about 1000 mg/L. The standard stock solution were stored at -20 °C. Took an appropriate amount of single standard storage solution and prepared a mixed standard solution containing 11 pesticides with a concentration of 10 mg/L, and stored at -20 °C in the dark. Among them, the instrument response values of the two pesticides, trinexapac and cyhalofop-butyl, were relatively low, so their concentrations in the mixed standard were increased to 50 mg/L and 100 mg/L, respectively. Took an appropriate amount of 11 mixed standard solutions of pesticides and prepared series blank matrix mixed standard solution of cabbage, pear, chives wheat flour and soybean oil with concentration of 0.5 μg/L, 1.0 μg/L, 2.0 μg/L, 5.0 μg/L, 10 μg/L, 20 μg/L and 50 μg/L, used for detection and analysis [11,12].
3.4. Sample Preparation and QuEChERS Procedure
Took 600-800 g cabbage, pear, chives, wheat flour or soybean oil samples using the quartering method and prepared them into a homogenate or powder (powder could be able to pass through 425 μm Standard mesh sieve), placed in a clean container and stored in a -18 °C refrigerator for later use.
QuEChERS procedure of fruits and vegetables: weighed 10 g (± 0.1 g) the sample into a 50 mL centrifuge tube, then added 10 mL 0.1% formic acid and acetonitrile, vortexed for 10 min, then added 4 g NaCl, and centrifuged at 5000 r/min for 5 min. Took 6 mL of the upper extraction solution and poured it into a centrifuge tube containing 150 mg MgSO4 and 150 mg Florisil purification agent (dark vegetables are then added with 120 mg GCB for color removal). Vortexed at 2500 r/min for 2 min, centrifuged at 5000 r/min for 5 min, and passed through 0.22 μm filter membrane.
QuEChERS procedure of grains: weighed 5 g sample (± 0.1 g) into a 50 mL plastic centrifuge tube, added 10 mL 0.1% formic acid water by volume fraction, vortexed and mix for 10 min. Added 15 mL 0.1% formic acid and acetonitrile solution, vortexed for 10 min, added 4 g NaCl, centrifuged at 5000 r/min for 5 min. Took 6 mL of the upper extraction solution and poured it into a centrifuge tube containing 150 mg MgSO4 and 150 mg Florisil purification agent. Vortexed for 2 min. Centrifuged at 5000 r/min for 5 min, passed through 0.22 μm filter membrane.
3.5. HPLC−MS/MS Conditions
Chromatographic column was Waters Acquity UPLC BEH C18, mobile phase A was acetonitrile, mobile phase B was 2 mmol/L ammonium formate solution with a volume fraction of 0.1% formic acid. Chromatographic column temperature was at 35 °C; Injection volume was 2 μL; Flow rate was 0.3 mL/min; Gradient elution was as follows, From 0 to 1 min, the mobile phase A remained unchanged at 40%; From 1 to 6 min, A gradually transformed into 90%; From 6 to 7 min, A gradually transformed into 40%; From 7 to 8 min, A remained unchanged at 40%.
Refered to the relevant mass spectrometry conditions in references [13-16], and made slight improvements according to the actual situation of the instrument, using ESI ion source, positive and negative ion scanning, and multi reaction monitoring mode (MRM). Ion Source Gas1(GS1) was 50 psi, ion Source Gas2(GS2) was 40 psi, the curtain gas was 35 psi, and the collision gas was 8 psi; The ionspray voltage was 5500V/-5500V, the ion source temperature was 250 °C, and the mass spectrum parameters of pesticides were shown in Table 1.
4. Conclusions
In this study, a method for simultaneous determination of six herbicides and their metabolites by using QuEChERS procedure combined with high-performance liquid chromatography-tandem mass spectrometry had been established. Acetonitrile with a volume fraction of 0.1% formic acid was used as the extraction solution. 6 mL extraction solution was purified with 150 mg Florisil and 150 mg MgSO4. For darker colored matrices, an additional 120 mg GCB was added for color removal, which was the extraction and purification step of this method. After multiple experimental verifications, this method had high sensitivity, good precision, and fast separation speed, which could meet the requirements for residual detection of six herbicides and their metabolites in fruits, vegetables, grains and edible oils had good application prospects.
Author Contributions
Conceptualization, L.C. and C.Z.; methodology, Q.J., Q.X. and Z.Z.; validation, W.S. and Z.Z.; investigation, Q.J., Q.X. and B.B.; data curation, Q.J., Q.X. and Z.Z.; writing-original draft preparation, Q.J., Q.X.; writing-review and editing, L.C. and C.Z.; project administration, L.C. and C.Z.; All authors have read and agreed to the published version of the manuscript.
Funding
This research was funded by District Municipal Commission of Agriculture and Rural Affairs of Chongming Shanghai (Shanghai Agricultural Science and Technology Promotion No. 2-3 (2022)), and Department of Supervision and Administration of Agricultural Product Quality and Safety of Agricultural and Rural Affairs Ministry of China (Contract No. 14202012).
Institutional Review Board Statement
Not applicable.
Informed Consent Statement
Not applicable.
Data Availability Statement
Not applicable.
Conflicts of Interest
The authors declare no conflicts of interest.
References
- National food safety standard—maximum residue limits for pesticides in food. 2021, GB 2763-2021.
- Pires, R.N.; Bacha, A.L.; Nepomuceno, M.P.; Alves, P.L.d.C.A. Can trinexapac-ethyl stimulate the initial growth of eucalyptus? Ciencia Florestal 2019, 29, 385–395. [Google Scholar] [CrossRef]
- Petelewicz, P.; Orlinski, P.M.; Baird, J.H. Suppression of Annual Bluegrass in Creeping Bentgrass Putting Greens Using Plant Growth Regulators. HortTechnology 2021, 31, 155–165. [Google Scholar] [CrossRef]
- China Pesticide Information Network. Available online: http://www.chinapesticide.org.cn/zwb/dataCenter?hash=reg-info (accessed on 2024-11-22).
- Hedan, H.; Yongxin, S.; Yongxin, H.; Yahui, H.; WANG, M.; WANG, M.; Wang, S.; Lufei, Z.; Zhen, C.; Hua, S. Simultaneous Determination of Pinoxaden and Clodinafop-Propargyl and Cloquintocet-Mexyl Residues in Barley by High Performance Liduid Chromatography-Tandem Mass Spectrometry. Food Science 2020, 41, 6. [Google Scholar] [CrossRef]
- Xiaolu, Y.; Li, Y.; Xin, X.; Xinming, L.; Xinzhong, X.; Ke, W. Determination of cyhalofop-butyl and its metabolite residues in fruits and vegetables by QuEChERS-UPLC. Food and Fermentation Industries 2023, 49. [Google Scholar] [CrossRef]
- Yan, L.; Yang, Z.; Lijun, L.; Xianke, M.; Guixiang, C. Determination of Quizalofop-p-tefuryl and Metabolites Residue in Soybean and Soil by HPLC-MS/MS. Pesticide Science and Administration 2019, 40, 9. [Google Scholar] [CrossRef]
- Liu, F.; pan, C.; Qian, C. Principles and Methods of Pesticide Residue Analysis (Second Edition); Chemical Industry Press: Beijing, China, 2021; Volume 2, pp. 40–42. [Google Scholar]
- Criterion on quality control of laboratories - Chemical testing of food. 2008, GB/T 27404-2008.
- EU Pesticides Database. Available online: https://ec.europa.eu/food/plant/pesticides/eu-pesticides-database/start/screen/mrls (accessed on 2024-11-22).
- Qin, J.a.; Fu, Y.; Lu, Q.; Dou, X.; Luo, J.; Yang, M. Matrix-matched monitoring ion selection strategy for improving the matrix effect and qualitative accuracy in pesticide detection based on UFLC-ESI-MS/MS: A case of Chrysanthemum. Microchemical Journal 2021, 160. [Google Scholar] [CrossRef]
- Rutkowska, E.; Łozowicka, B.; Kaczyński, P. Three approaches to minimize matrix effects in residue analysis of multiclass pesticides in dried complex matrices using gas chromatography tandem mass spectrometry. Food Chemistry 2019, 279, 20–29. [Google Scholar] [CrossRef] [PubMed]
- Li, N.; Han, D.; Ma, X.; Qiu, C.; Qin, Y.; Yao, T.; Wang, S.; She, Y.; Hacimuftuoglu, F.; El-Aty, A.M.A. Simultaneous determination of pinoxaden, cloquintocet-mexyl, clodinafop-propargyl ester and its major metabolite in barley products and soil using QuEChERS modified with multi-walled carbon nanotubes coupled with LC-MS/MS. Biomedical Chromatography 2022, 36. [Google Scholar] [CrossRef]
- Shim, J.-H.; Rahman, M.M.; Zaky, A.A.; Lee, S.-J.; Jo, A.; Yun, S.-H.; Eun, J.-B.; Kim, J.-H.; Park, J.-W.; Oz, E.; et al. Simultaneous Determination of Pyridate, Quizalofop-ethyl, and Cyhalofop-butyl Residues in Agricultural Products Using Liquid Chromatography-Tandem Mass Spectrometry. Foods (Basel, Switzerland) 2022, 11. [Google Scholar] [CrossRef] [PubMed]
- Xue-jin, W.; Chun-hua, L.; Jin-hui, L.; Chun-li, L.; Chen, M.; Yuan, L.; Nan-cun, W. Simultaneous determination of ten plant growth regulators residues in litchi by QuEChERS clean up-ultra high perfor-mance liquid chromatography-tandem mass spectrometry. Journal of Southern Agriculture 2020, 51, 2532–2539. [Google Scholar] [CrossRef]
- Yu, Y.; Zhao, S.; Yang, Y.; Chen, Y.; Qiu, D.; Ran, X.; Lu, P.; Hu, D. Simultaneous Determination of Rimsulfuron and Haloxyfop-P-Methyl and Its Metabolite Haloxyfop in Tobacco Leaf by LC-MS/MS. Journal of AOAC International 2019, 102, 1632–1640. [Google Scholar] [CrossRef]
Figure 1.
(a) Phenoxy carboxylic acid herbicides; (b) Cyclohexane carboxylic acid herbicides.
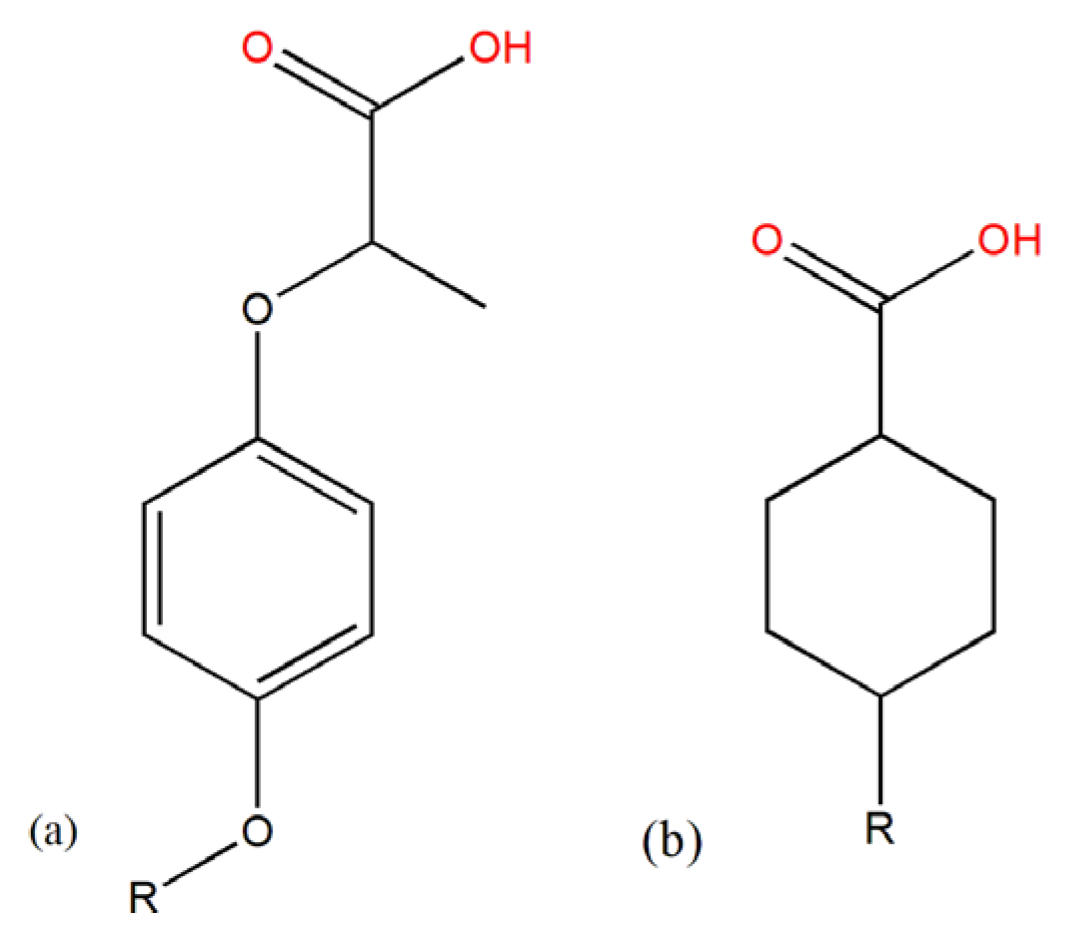

Table 1.
MS detection parameters of the 11 pesticides.
| Compound name | Parent ion (m/z) | Product ion (m/z) | Collision energy (eV) | Declustering Potential (V) |
|---|---|---|---|---|
| Clodinafop | 310 | 238*/218 | -19/-29 | -80 |
| Cyhalopfop acid | 300 | 228*/208 | -21/-28 | -82 |
| Quizalofop | 343 | 271*/243 | -19/-35 | -70 |
| Trinexapac | 223 | 135*/179 | -21/-20 | -80 |
| Haloxyfop | 360 | 288*/252 | -17/-34 | -97 |
| Cyhalofop-butyl | 375 | 256*/120 | 22/44 | 85 |
| Haloxyfop-P-methyl | 376 | 288*/91 | 35/36 | 133 |
| Trinexapac-ethyl | 253 | 69*/207 | 30/17 | 97 |
| Quizalofop-P-tefuryl | 429.2 | 299.3*/270.9 | 31/38 | 112 |
| Haloxyfop-methyl | 376 | 316.1*/288.1 | 22/35 | 162 |
| Clodinafop-propargyl | 350 | 266.2*/91 | 19/36 | 166 |
* is a qualitative ion.
Table 2.
Effect of Different Purifiers on the Recovery of Pesticides (%).
| Compound Name | GCB | Florisil | Alumina-N | MgSO4 | PSA | C18 | MWNTs |
|---|---|---|---|---|---|---|---|
| Clodinafop | 93.3 | 96.1 | 89.3 | 103 | 41.8 | 101 | 40.4 |
| Cyhalopfop acid | 93.9 | 101 | 85.4 | 98.2 | 39.7 | 104 | 66.8 |
| Quizalofop | 6.17 | 95.3 | 75.3 | 97.2 | 39.2 | 98.6 | 0.43 |
| Trinexapac | 95.9 | 101 | 21.3 | 100 | 54.5 | 102 | 91.2 |
| Haloxyfop | 92.8 | 99.6 | 87.1 | 99.1 | 43.5 | 101 | 94.6 |
| Cyhalofop-butyl | 90.5 | 93.2 | 96.3 | 89.5 | 98.8 | 85.9 | 96.3 |
| Haloxyfop-P-methyl | 96.6 | 97.9 | 106 | 101 | 93.1 | 91.0 | 81.5 |
| Trinexapac-ethyl | 95.8 | 96.8 | 65.4 | 103 | 94.4 | 87.6 | 105 |
| Quizalofop-P-tefuryl | 3.80 | 101 | 84.5 | 109 | 93.6 | 95.4 | 0.99 |
| Haloxyfop-methyl | 101 | 99.0 | 113 | 102 | 101 | 98.9 | 79.4 |
| Clodinafop-propargyl | 91.0 | 98.8 | 107 | 105 | 101 | 99.4 | 78.3 |
Table 3.
Impact of Different Purifier Schemes on Recovery (%).
| Compound Name | Optimization of Florisil | Optimization of MgSO4 | ||||||||
|---|---|---|---|---|---|---|---|---|---|---|
| ① | ② | ③ | ④ | ⑤ | ① | ② | ③ | ④ | ⑤ | |
| Clodinafop | 93.9 | 95.2 | 95.6 | 106 | 88.5 | 109 | 114 | 111 | 113 | 115 |
| Cyhalopfop acid | 99.5 | 98.5 | 99.0 | 94.9 | 95.5 | 105 | 103 | 107 | 103 | 105 |
| Quizalofop | 96.9 | 91.9 | 93.7 | 93.0 | 87.6 | 100 | 104 | 98.7 | 103 | 103 |
| Trinexapac | 97.3 | 84.6 | 66.7 | 49.3 | 30.4 | 62.6 | 69.0 | 70.3 | 60.4 | 56.9 |
| Haloxyfop | 97.7 | 88.3 | 93.0 | 88.9 | 86.0 | 104 | 106 | 104 | 106 | 109 |
| Cyhalofop-butyl | 108 | 108 | 136 | 118 | 114 | 108 | 105 | 110 | 111 | 103 |
| Haloxyfop-P-methyl | 99.8 | 99.0 | 95.1 | 94.4 | 95.0 | 102 | 101 | 106 | 107 | 111 |
| Trinexapac-ethyl | 98.2 | 99.5 | 96.9 | 97.6 | 94.7 | 95.2 | 95.6 | 93.6 | 97.8 | 93.4 |
| Quizalofop-P-tefuryl | 100 | 95.7 | 91.7 | 94.4 | 95.1 | 107 | 113 | 106 | 109 | 114 |
| Haloxyfop-methyl | 100 | 99.2 | 99.0 | 97.7 | 97.3 | 102 | 103 | 104 | 109 | 108 |
| Clodinafop-propargyl | 98.7 | 94.6 | 96.9 | 96.9 | 93.7 | 104 | 106 | 97.5 | 107 | 108 |
Table 4.
The Effect of Different Content of GCB on the Recovery Rate of Pesticides (%).
| Compound Name | ①60mg | ②90mg | ③120mg | ④150mg | ⑤180mg |
|---|---|---|---|---|---|
| Clodinafop | 100 | 107 | 98.1 | 96.2 | 96.1 |
| Cyhalopfop acid | 101 | 93.1 | 96.2 | 93.8 | 88.6 |
| Quizalofop | 113 | 95.5 | 82.1 | 63.5 | 36.2 |
| Trinexapac | 104 | 112 | 112 | 104 | 100 |
| Haloxyfop | 89.9 | 91.7 | 90.1 | 90.2 | 83.7 |
| Cyhalofop-butyl | 114 | 109 | 114 | 111 | 116 |
| Haloxyfop-P-methyl | 99.2 | 97.8 | 99.6 | 105 | 110 |
| Trinexapac-ethyl | 97.5 | 95.6 | 99.7 | 98.5 | 100 |
| Quizalofop-P-tefuryl | 97.4 | 95.8 | 92.0 | 83.2 | 67.5 |
| Haloxyfop-methyl | 101 | 105 | 102 | 112 | 114 |
| Clodinafop-propargyl | 97.9 | 97.9 | 102 | 101 | 110 |
Table 5.
Linear range and LOD of standard curve of cabbage, pear, chives, wheat flour and soybean oil.
Table 5.
Linear range and LOD of standard curve of cabbage, pear, chives, wheat flour and soybean oil.
| Compound name | Linear range (μg/L) | cabbage LOD (mg/kg) |
pear LOD (mg/kg) |
chives LOD (mg/kg) |
wheat flour LOD (mg/kg) |
soybean oil LOD (mg/kg) |
|---|---|---|---|---|---|---|
| Clodinafop | 0.5~50 | 0.0003 | 0.0002 | 0.001 | 0.001 | 0.0003 |
| Cyhalopfop acid | 0.5~50 | 0.0001 | 0.0004 | 0.0001 | 0.001 | 0.0005 |
| Quizalofop | 0.5~50 | 0.0004 | 0.0001 | 0.0005 | 0.0007 | 0.0005 |
| Trinexapac | 2.5~250 | 0.001 | 0.0006 | 0.003 | 0.008 | 0.003 |
| Haloxyfop | 0.5~50 | 0.0002 | 0.0008 | 0.0001 | 0.001 | 0.0004 |
| Cyhalofop-butyl | 5~500 | 0.008 | 0.004 | 0.005 | 0.01 | 0.005 |
| Haloxyfop-P-methyl | 0.5~50 | 0.0001 | 0.0001 | 0.0005 | 0.0008 | 0.0002 |
| Trinexapac-ethyl | 0.5~50 | 0.0001 | 0.0002 | 0.0006 | 0.01 | 0.0006 |
| Quizalofop-P-tefuryl | 0.5~50 | 0.0001 | 0.0002 | 0.0004 | 0.001 | 0.0005 |
| Haloxyfop-methyl | 0.5~50 | 0.0001 | 0.0001 | 0.0003 | 0.0005 | 0.0004 |
| Clodinafop-propargyl | 0.5~50 | 0.0001 | 0.0001 | 0.0001 | 0.0005 | 0.0003 |
Table 6.
Average recoveries , relative standard deviations(RSD) of 11 pesticides in cabbage, pear, chives wheat flour and soybean oil (n = 6).
Table 6.
Average recoveries , relative standard deviations(RSD) of 11 pesticides in cabbage, pear, chives wheat flour and soybean oil (n = 6).
| Compound name | Cabbage | Pear | chives | Wheat flour | Soybean oil | |||||||||||
|---|---|---|---|---|---|---|---|---|---|---|---|---|---|---|---|---|
| 0.01 mg/kg |
0.05 mg/kg |
0.2 mg/kg |
0.01 mg/kg |
0.02 mg/kg |
0.1 mg/kg |
0.01 mg/kg |
0.05 mg/kg |
0.1 mg/kg |
0.01 mg/kg |
0.05 mg/kg |
0.2 mg/kg |
0.01 mg/kg |
0.05 mg/kg |
0.2 mg/kg |
||
| Clodinafop | Recovery/% | 105 | 108 | 98.4 | 110 | 112 | 113 | 97.3 | 92.3 | 94.9 | 86.6 | 104 | 102 | 105 | 101 | 98.6 |
| RSD/% | 1.8 | 1.9 | 3.6 | 7.0 | 7.8 | 1.5 | 3.8 | 4.0 | 3.5 | 2.7 | 2.5 | 2.3 | 5.7 | 3.0 | 2.2 | |
| Cyhalopfop acid | Recovery/% | 110 | 113 | 105 | 107 | 107 | 120 | 99.3 | 104 | 106 | 105 | 103 | 98.9 | 105 | 103 | 101 |
| RSD/% | 3.1 | 1.5 | 3.4 | 9.4 | 3.3 | 0.8 | 6.8 | 5.0 | 4.3 | 6.1 | 2.5 | 3.5 | 3.4 | 4.8 | 2.2 | |
| Quizalofop | Recovery/% | 106 | 111 | 105 | 107 | 115 | 118 | 69.8 | 70.3 | 75.6 | 106 | 103 | 99.0 | 105 | 98.5 | 98.0 |
| RSD/% | 4.6 | 1.7 | 4.4 | 6.8 | 5.0 | 1.2 | 5.5 | 7.5 | 5.9 | 8.1 | 2.2 | 2.0 | 4.6 | 3.8 | 2.8 | |
| Trinexapac | Recovery/% | 103 | 105 | 105 | 84.3 | 97.1 | 100 | 77.4 | 76.4 | 71.2 | 93.1 | 93.2 | 90.3 | 110 | 101 | 98.2 |
| RSD/% | 3.8 | 2.6 | 2.3 | 7.8 | 4.8 | 3.2 | 7.0 | 6.8 | 8.1 | 6.2 | 3.0 | 4.3 | 3.4 | 3.8 | 2.6 | |
| Haloxyfop | Recovery/% | 110 | 111 | 110 | 109 | 118 | 119 | 98.9 | 99.6 | 102 | 116 | 110 | 107 | 107 | 101 | 100 |
| RSD/% | 4.1 | 2.9 | 2.4 | 7.5 | 5.2 | 1.8 | 6.2 | 5.0 | 3.6 | 5.4 | 1.6 | 3.0 | 3.6 | 2.5 | 3.3 | |
| Cyhalofop-butyl | Recovery/% | 99.9 | 97.9 | 101 | 89.2 | 103 | 80.0 | 108 | 109 | 114 | 73.6 | 112 | 99.2 | 107 | 117 | 103 |
| RSD/% | 2.6 | 3.7 | 3.1 | 6.3 | 9.2 | 3.9 | 8.6 | 8.5 | 4.2 | 18 | 3.7 | 8.3 | 10 | 1.8 | 7.0 | |
| Haloxyfop-P-methyl | Recovery/% | 105 | 103 | 89.4 | 107 | 117 | 119 | 111 | 114 | 114 | 105 | 108 | 98.2 | 102 | 100 | 93.6 |
| RSD/% | 5.9 | 1.9 | 2.8 | 6.7 | 9.5 | 3.9 | 2.8 | 3.5 | 3.0 | 9.3 | 1.8 | 5.6 | 6.0 | 2.0 | 2.4 | |
| Trinexapac-ethyl | Recovery/% | 110 | 112 | 102 | 109 | 114 | 120 | 98.4 | 103 | 99.7 | 104 | 105 | 106 | 83.5 | 85.6 | 85.0 |
| RSD/% | 3.8 | 1.8 | 1.7 | 6.1 | 6.7 | 0.6 | 6.9 | 3.6 | 3.2 | 4.0 | 2.3 | 1.5 | 9.6 | 3.1 | 2.5 | |
| Quizalofop-P-tefuryl | Recovery/% | 112 | 108 | 98.4 | 105 | 113 | 112 | 103 | 106 | 106 | 113 | 111 | 106 | 97.0 | 91.6 | 90.0 |
| RSD/% | 4.7 | 2.4 | 2.2 | 5.1 | 11 | 13 | 4.7 | 4.1 | 4.6 | 5.2 | 1.4 | 4.7 | 3.0 | 2.3 | 2.9 | |
| Haloxyfop-methyl | Recovery/% | 107 | 97.0 | 90.3 | 108 | 115 | 116 | 109 | 115 | 115 | 106 | 104 | 93.4 | 103 | 97.9 | 93.1 |
| RSD/% | 5.3 | 3.2 | 4.9 | 5.9 | 11 | 8.0 | 4.1 | 2.5 | 2.5 | 6.7 | 6.7 | 5.5 | 3.1 | 2.7 | 2.0 | |
| Clodinafop-propargyl | Recovery/% | 109 | 110 | 109 | 106 | 115 | 109 | 106 | 108 | 115 | 116 | 108 | 99.3 | 104 | 96.7 | 95.9 |
| RSD/% | 5.3 | 2.0 | 2.0 | 8.7 | 17 | 15 | 6.0 | 3.8 | 1.8 | 19 | 9.6 | 9.9 | 3.0 | 2.7 | 2.9 | |
Table 7.
Analysis of herbicide detection results in detected samples (mg/kg).
| Compound Name | Detected quantity | Average value | Maximum |
|---|---|---|---|
| Cyhalopfop acid | 1 | 0.049 | 0.049 |
| Quizalofop | 2 | 0.096 | 0.172 |
| Trinexapac | 17 | 0.021 | 0.048 |
| Haloxyfop | 3 | 0.027 | 0.055 |
Disclaimer/Publisher’s Note: The statements, opinions and data contained in all publications are solely those of the individual author(s) and contributor(s) and not of MDPI and/or the editor(s). MDPI and/or the editor(s) disclaim responsibility for any injury to people or property resulting from any ideas, methods, instructions or products referred to in the content. |
© 2024 by the authors. Licensee MDPI, Basel, Switzerland. This article is an open access article distributed under the terms and conditions of the Creative Commons Attribution (CC BY) license (http://creativecommons.org/licenses/by/4.0/).
Copyright: This open access article is published under a Creative Commons CC BY 4.0 license, which permit the free download, distribution, and reuse, provided that the author and preprint are cited in any reuse.


