
Submitted:
30 December 2024
Posted:
30 December 2024
You are already at the latest version
Abstract
Background/Objectives: Central sensitization (CS) is identified as a cause of pain in various musculoskeletal diseases, and breathing pattern disorders (BPDs) are reported to be correlated with chronic pain. This study aimed to analyze the correlation between CS and BPDs. Methods: A cross-sectional study was designed according to the strengthening the reporting of observational studies in epidemiology (STROBE) guidelines. Forty participants with moderate to extreme CS (central sensitization inventory for Koreans; CSI-K≥40) were enrolled, and their respiratory motion (manual assessment of respiratory motion; MARM), respiratory function (self evaluation of breathing questionnaire; SEBQ), respiratory muscle strength (maximal inspiratory pressure; MIP, maximal expiratory pressure; MEP), pain intensity (numeric pain rating scale; NPRS), pain cognition (Korean version of pain catastrophizing scale; K-PCS), muscle tone and stiffness were measured. Results: Among participants with moderate to extreme CS, 82.5% showed BPDs and 42.5% reported severe pain intensity. K-PCS demonstrated significant correlations with MARM area (r=-0.437) and SEBQ (r=0.528). In the subgroup with BPDs, strong correlations were found between MARM area and NPRS (r=-0.486) and K-PCS (r=-0.605). The regression model for muscle properties showed notably high explanatory power (97.8%). Conclusion: In individuals with moderate to extreme CS, respiratory dysfunction was prevalent and significantly associated with pain intensity and pain cognition. These quantitative relationships between breathing mechanics, pain measures, and muscle properties suggest the importance of assessing breathing patterns in CS management.
Keywords:
central sensitization
; chronic pain
; pain catastrophizing
; respiratory mechanics
1. Introduction
Central sensitization (CS) represents a state of neuronal hyperexcitability in the spinal cord that develops following tissue damage, encompassing various physiological mechanisms associated with increased pain response and sensitivity [1,2]. Notably, CS can persist independently of peripheral nociceptor sensitization and is defined as nociplastic pain resulting from neuroplastic changes due to chemical, structural, and functional alterations in the central nervous system [3]. When CS enhances pain responsiveness in the central nervous system, it leads to dysregulation of pain control mechanisms, resulting in hyperactivation of nociceptor-mediated stimuli [4,5]. This mechanism typically manifests in symptoms such as widespread pain, hyperalgesia, and allodynia [6].
CS is recognized as a primary mechanism that perpetuates chronic pain conditions even after tissue healing has occurred [7]. Common chronic pain-related disorders including fibromyalgia, rheumatoid arthritis, chronic back pain, and temporomandibular disorder are characterized by decreased pain thresholds and persistent pain states [8,9]. These chronic pain conditions not only cause physical discomfort but also significantly impact psychosocial factors [10]. Common psychosocial manifestations include anxiety, depression, and insomnia, which are closely correlated with pain intensity [11]. However, the increased pain intensity alone cannot fully explain these phenomena, and the amplification of central nervous system responsiveness due to CS is considered a key contributing factor [1,5]. Particularly significant is the increase in stress hormone secretion, such as cortisol, which induces hemodynamic and physiological changes through activation of the hypothalamic-pituitary-adrenal (HPA) axis [12]. Consequently, diaphragmatic breathing has gained attention as a strategy for improving psychosocial factors, known for its effectiveness in modulating central nervous system responses and reducing stress [13,14]. One study revealed that fibromyalgia patients demonstrated inefficient breathing patterns utilizing only accessory respiratory muscles, along with insufficient prefrontal cortex activation during diaphragmatic breathing exercises [15].
Breathing patterns influence both consciousness and physical state, and breathing pattern disorders (BPDs) can lead to physiological, mechanical, and psychological disruptions [16]. While normal breathing patterns are achieved through appropriate diaphragmatic activity, dysfunctional breathing patterns are characterized by reduced diaphragmatic function. Chronic pain patients frequently exhibit thoracic breathing patterns, primarily associated with excessive upper chest segment movement, and prolonged inappropriate breathing can cause problems even without specific symptoms [17]. This results in flattening and excessive tension of the diaphragm, reduced mobility, and increased reliance on intercostal muscles and accessory respiratory muscles for ventilation [18]. The persistent use of such unsustainable functional breathing patterns is likely to lead to chronic musculoskeletal issues and pain [19].
Based on the understanding that chronic pain and disability are influenced by psychological and social factors beyond pathological changes, multidisciplinary interventions for chronic pain have become increasingly accepted within various comprehensive approaches, with rapid growth over recent decades [20]. Numerous CS-related biological mechanisms have been identified, including disruptions in both ascending and descending pathways of the central nervous system [21]. For patients with CS-induced pain, interventions targeting the brain and descending inhibitory pathways are more appropriate than peripheral-focused strategies [5]. Common clinical bottom-up approaches to CS include therapeutic exercise, manual therapy, pharmacological treatment, and surgery [22,23]. Additionally, Martarelli, et al. [24] and Zou, Yeung, Quan, Boyden and Wang [11] reported that breathing interventions, particularly diaphragmatic breathing (also known as deep breathing or abdominal breathing), show potential in alleviating pain perception and emotional distress by promoting physiological equilibrium in fibromyalgia patients.
This aligns with reports indicating a correlation between chronic pain and inappropriate breathing patterns [25]. However, while the relationship between BPDs and chronic pain outcomes is frequently mentioned, direct correlational studies remain scarce. Therefore, this study aims to analyze the correlation between CS, a mechanistic basis for chronic pain, and BPDs, to provide additional considerations for chronic pain management.
2. Materials and Methods
2.1. Study Design
This study is a STROBE (Strengthening the Reporting of Observational Studies in Epidemiology)-compliant cross-sectional study designed to investigate the association between central sensitization and breathing pattern disorders.
2.2. Participants and Ethics
This study was approved by the Institutional Review Board (IRB) of Honam University (1041223-202405-HR-01). Study participants were church members who completed the Korean version of the Central Sensitization Inventory (CSI-K). The survey participants consisted of 190 middle-aged men and women over 40 years old, and evaluations were conducted for those who scored moderate or higher (≥40 points) on the survey. The study group was composed of volunteers who responded to recruitment notices, understood the study details and purpose, and expressed willingness to participate. The inclusion criteria were; adults in their 40s; CSI-K score of 40 or higher; those who agreed to the use and presentation of physical function assessment information and wished to participate in measurement experiments [15]. Exclusion criteria were: those with respiratory diseases; those with one or more infections or cancer; those who expressed intention to withdraw during the study period [26].
2.3. Sample Size
Based on previous research, the explanatory power (R2) of breathing pattern disorders and psychological factors was reported as 0.37, yielding an effect size (f2) of 0.58 for multiple regression analysis [27]. With a significance level (α) of .05, a statistical power (1-β) of 0.90, and an anticipated inclusion of eight independent variables (general characteristics, central sensitization, respiratory mobility, respiratory muscle strength, breathing pattern, pain intensity, pain perception, and muscle tone and stiffness), a sample size of 40 participants was calculated to be required.
2.4. Outcomes
The Materials and Methods should be described with sufficient details to allow others to replicate and build on the published results. Please note that the publication of your manuscript implicates
2.4.1. Central Sensitization
The central sensitization inventory (CSI) is a self-reported questionnaire developed and validated to assess patients with CS [28,29]. In this study, the Korean version of the CSI (CSI-K) was used to evaluate the degree of CS among participants.
The CSI-K consists of two parts, A and B, but only Part A was used for scoring in this study. Part A is composed of 25 items, covering physical symptoms, emotional distress, headaches or jaw symptoms, and urological symptoms. To aid in the clinical interpretation of the CSI-K, five severity levels have been established: asymptomatic (0–29 points), mild (30–39 points), moderate (40–49 points), severe (50–59 points), and extreme (60–100 points). A score of 40 or higher is considered the threshold for moderate or higher CS [13]. Therefore, in this study, the CSI-K was applicable to participants aged 15-69 years, and participants were selected based on having moderate or higher CS levels with a total score of 40 points or higher. The test-retest reliability (Intraclass Correlation Coefficient, ICC) of the CSI-K is 0.88, and its internal consistency (Cronbach's α) is 0.94 [30].
2.4.2. Respiratory Mobility
In this study, respiratory motion was measured using the manual assessment of respiratory motion (MARM). MARM evaluates the superior-lateral thoracic movement detected by the examiner's hands on the posterolateral aspect of the thorax [31]. It is used to assess the relative contribution of upper and lower thoracic movement during five breathing instructions and postural conditions: 1. normal breathing in natural sitting, 2. sitting upright, 3. slow deep breathing, 4. breathing, and 5. normal breathing in natural sitting. The assessment begins with the participant seated on a backless chair or table. During the assessment, the examiner sits behind the participant, placing both hands on the lateral aspects of the rib cage with the entire hand comfortably positioned to avoid restricting respiratory motion. The thumbs are positioned parallel to the spine pointing vertically upward, with the other fingers extended horizontally. The fourth and fifth fingers should contact below the lower ribs to sense abdominal expansion.
The MARM results are calculated through angles measured from lines A and B drawn by the assessor, with the upper limit at 180° and the lower limit at 0°. Two variables are derived from the MARM assessment. The first variable is the angle between lines A and B, representing the degree or area of respiratory motion. This variable increases with deeper breathing and decreases with shallow breathing. The second variable is the average value of lines A and B, indicating breathing location. This variable increases with thoracic-dominant breathing and decreases with diaphragm-dominant breathing. A MARM area of less than 30° indicates abnormally shallow breathing, while a MARM average of greater than 100° indicates abnormally thoracic-dominant breathing [31]. The MARM Diagram is used for assessment documentation [31]. To ensure reliable assessment, all MARM evaluations throughout the study period were conducted by a single researcher. The test-retest reliability (ICC) of MARM is 0.85 [31].
2.4.3. Respiratory Pattern
In this study, the Self Evaluation of Breathing Questionnaire (SEBQ) was used to assess respiratory function. The SEBQ is a self-assessment questionnaire designed to measure symptoms and severity associated with breathing dysfunction [18]. It consists of 25 items scored on a 3-point scale, with individual items scored as 0 (never), 1 (occasionally), 2 (frequently), or 3 (very frequently), for a maximum total score of 75 points. Higher scores indicate greater degrees of breathing dysfunction [32]. In this study, the SEBQ was administered using translated individual items. While there is no established cutoff score for the SEBQ, following previous research, a score of 25 points was used as the threshold for breathing dysfunction [33]. The test-retest reliability (ICC) of the SEBQ is 0.89, and its internal consistency (Cronbach's α) is 0.93 [14,34].
2.4.4. Respiratory Strength
In this study, respiratory muscle strength was evaluated by measuring Maximal Inspiratory Pressure (MIP) and Maximal Expiratory Pressure (MEP) using a respiratory muscle strength measurement device (Pony FX MIP/MEP; Cosmed Inc, Rome, Italy). MIP represents the respiratory pressure generated during maximal inspiration following expiration, reflecting the strength of inspiratory muscles such as the diaphragm. MEP represents the respiratory pressure generated during maximal expiration following inspiration, reflecting the strength of expiratory muscles including the rectus abdominis, external oblique, internal oblique, and transversus abdominis [35]. The assessment was conducted in a seated position with the hip flexed at 90° [36].
To ensure accurate measurements, an experienced researcher provided thorough explanations and demonstrations to participants, ensuring complete understanding of the procedure before testing. Participants were instructed to wear a nose clip and firmly secure the mouthpiece to prevent air leakage. For maximal expiratory measurement, participants were instructed to "exhale maximally (maintain for 6 seconds)," during which they performed maximal oral expiration. Subsequently, for maximal inspiratory measurement, participants were instructed to "inhale maximally (maintain for 6 seconds)," during which they performed maximal oral inspiration. The MIP/MEP measurement test was performed three times for each participant, with the highest value used for analysis. The inter-rater reliability ICC range for the Pony FX MIP/MEP is 0.939-0.982 [37].
2.4.5. Muscle Tone & Muscle Stiffness
The Myoton PRO (Myoton AS, Estonia and Myoton Ltd London) is a device that enables non-invasive and objective measurement of muscle mechanical properties [38]. It is also a highly valuable tool for biomechanical analysis of muscles that control body movement using various parameters including muscle contraction [39]. In this study, muscle tone and stiffness of the upper trapezius were measured in relation to CS and BPDs. Measurements were taken three times in a seated position, and the mean values were used for statistical analysis. The muscle tone meter was set to multiscan mode with 5 repetitions per measurement, mechanical impulse tap time of 15m/s, and interval of 0.8sec. The intra-rater reliability of the Myoton PRO ranges from 0.94 to 0.99 [40].
2.4.6. Pain Intensity
The numeric pain rating scale (NPRS) is a unidimensional measurement tool for assessing pain intensity in patients with chronic pain [41,42]. In this study, the NPRS was used to measure pain severity. The NPRS consists of 11 points, with 0 representing no pain and 10 representing the worst possible pain [43]. Participants were asked to indicate the number corresponding to their pain intensity. Scores are interpreted as follows: 0 indicates no pain, 1-3 indicates mild pain, 4-6 indicates moderate pain, and 7-10 indicates severe pain [44]. The test-retest reliability (ICC) of the NPRS is 0.96 [41].
2.4.6. Pain Cognition
The pain catastrophizing scale (PCS) was used to assess psychological aspects of pain. It is a 13-item self-assessment scale that measures catastrophizing in the context of actual or anticipated pain [45]. Each item is scored on a 5-point Likert-type scale ranging from 0 (not at all), 1 (rarely), 2 (sometimes), 3 (frequently), to 4 (always), with total scores ranging from 0 to 52. Higher total scores indicate more negative pain perceptions and feelings of helplessness, reflecting higher levels of catastrophic thinking about pain [46].
This study utilized the Korean version of the Pain Catastrophizing Scale (K-PCS), which was modified and translated by Cho, et al. [47]. Following Sullivan et al.'s research, a threshold score of 20 was used to identify patients at risk for developing chronic pain. The K-PCS demonstrates a test-retest reliability (ICC) of 0.77 and internal consistency (Cronbach's α) of 0.90 [47].
2.5. Data Analysis
All data in this study were analyzed using the statistical software SPSS version 25.0 (IBM, Armonk, NY, USA). The general characteristics of the participants were presented using descriptive statistics. The Kolmogorov-Smirnov test was applied to assess the normality of the variables. Pearson's correlation analysis was conducted to examine the linearity between variables. Simple linear regression analysis (multiple linear regression analysis) was used to verify the relationship of variance among variables with confirmed linearity. The level of statistical significance (α) was set at .05 for all analyses.
3. Results
Of the 190 potential participants, 135 participants were excluded by the evaluator for not meeting the study inclusion criteria, and 15 participants were excluded because they did not consent to participate in the study. Consequently, 40 participants were enrolled in the study (Figure 1).
3.1. Study Participant Characteristics
In this study, 40 participants with moderate or higher CS were enrolled, consisting of 7 males and 33 females. The general characteristics of the study participants were as follows: age 56.38±8.05 years, height 160.75±5.96 cm, weight 61.50±9.00 kg, and BMI 23.80±3.29 kg/m² (Table 1).
3.2. Correlation Analysis Between Variables
The correlation analysis among variables in the total group (n = 40) of participants with CSI-K scores of 40 or higher is presented in Table 2. Among respiratory variables, significant correlations were observed between MARM average and MARM area (p < 0.05), MIP and MEP (p < 0.05), and MEP and SEBQ (p < 0.05). Among pain variables, significant correlations were found between NPRS usual pain and NPRS worst pain (p < 0.05), K-PCS and NPRS usual pain (p < 0.05), and K-PCS and NPRS worst pain (p < 0.05).
Regarding correlations between respiratory and pain variables, significant relationships were observed between K-PCS and MARM area (p < 0.05), and K-PCS and SEBQ (p < 0.05). However, no other significant correlations were found between respiratory and pain variables (p > 0.05). Muscle Tone and Muscle Stiffness showed a significant positive correlation (p < 0.05), but did not correlate significantly with other variables. Figure 2 provides a visualization of the correlation analysis results for the total group.
3.2.1. Subanalysis: MARM; Average (≥100 Degrees)
The correlation analysis results among variables in the group with MARM average ≥100° (n = 33) are presented in Table 3. Among respiratory variables, significant correlations were observed between MIP and MEP (p < 0.05), and between MEP and SEBQ (p < 0.05). Among pain variables, significant correlations were found between NPRS usual pain and NPRS worst pain (p < 0.05), K-PCS and NPRS usual pain (p < 0.05), and K-PCS and NPRS worst pain (p < 0.05). Significant correlations between respiratory and pain variables were observed between MARM area and NPRS usual pain (p < 0.05), MARM area and NPRS worst pain (p < 0.05), MARM area and K-PCS (p < 0.05), K-PCS and MEP (p < 0.05), and K-PCS and SEBQ (p < 0.05). A significant positive correlation was found between Muscle Tone and Muscle Stiffness (p < 0.05), while a significant negative correlation was observed between MARM average and Muscle Stiffness. Figure 3 provides a visualization of the correlation analysis results for the total group.
3.2.2. Subanalysis: NPRS; Usual Pain (≥ 4 points)
The correlation analysis results among variables in the group with NPRS usual pain ≥ 4 (n = 17) are presented in Table 4. Significant correlations between CSI-K and respiratory variables, pain variables, Muscle Tone, and Muscle Stiffness were observed between CSI-K and SEBQ (p < 0.05), CSI-K and K-PCS (p < 0.05), and CSI-K and Muscle Stiffness (p < 0.05). Among respiratory variables, significant correlations were found between MARM average and MARM area (p < 0.05), MARM area and MEP (p < 0.05), MIP and MEP (p < 0.05), and MIP and SEBQ (p < 0.05). Among pain variables, a significant correlation was observed between NPRS usual pain and NPRS worst pain (p < 0.05). Significant correlations between respiratory and pain variables were found between MARM area and K-PCS (p < 0.05), and MEP and K-PCS (p < 0.05). A significant positive correlation was observed between Muscle Tone and Muscle Stiffness (p < 0.05), and a significant positive correlation was also found between K-PCS and Muscle Stiffness (p < 0.05). Figure 4 provides a visualization of the correlation analysis results for the total group.
3.3. Regression Analysis Between Variables
3.3.1. Simple Regression Analysis
Simple regression analyses were performed on variables showing linear relationships among participants with CSI-K scores of 40 or higher (n = 40), with results presented in Table 3. Among respiratory variables, the regression model between MARM; average and MARM; area yielded statistical significance (F = 23.389, p < 0.05), with an explained variance of 36.3%. MARM; average exhibited a significant positive influence on MARM; area (β = 0.603, p < 0.05). Similarly, the regression model between MIP and MEP demonstrated statistical significance (F = 25.421, p < 0.05), accounting for 63.3% of the variance, with a significant positive relationship identified (β = 0.633, p < 0.05).
Analysis of pain variables revealed a statistically significant regression model between NPRS; usual pain and worst pain (F = 55.491, p < 0.05), explaining 59.4% of the variance. These variables demonstrated a significant positive relationship (β = 0.770, p < 0.05). The relationship between SEBQ and K-PCS also yielded a significant regression model (F = 14.699, p < 0.05, R² = 0.279) with a significant positive relationship (β = 0.528, p < 0.05). The regression model between Muscle Tone and Muscle Stiffness demonstrated the highest explained variance (87.5%) (F = 14.699, p < 0.05), exhibiting a strong positive relationship (β = 0.935, p < 0.05).
Subanalysis of participants with MARM; average ≥ 100° (n = 33) revealed significant negative correlations between MARM; area and pain-related variables. MARM; area demonstrated significant negative relationships with NPRS; usual pain (F = 9.067, p < 0.05, β = -0.486), worst pain (F = 6.773, p < 0.05, β = -0.423), and K-PCS (F = 17.857, p < 0.05, β = -0.605). Within this group, the relationship between Muscle Tone and Muscle Stiffness exhibited notably high explained variance (94.1%) with a strong positive relationship (F = 493.335, p < 0.05, β = 0.970).
In the subanalysis of participants with NPRS; usual pain ≥ 4 (n=17), significant relationships between CSI-K and multiple variables were identified. CSI-K demonstrated significant positive relationships with SEBQ (F = 16.096, p < 0.05, β =0.719), K-PCS (F = 12.030, p < 0.05, β = 0.667), and Muscle Stiffness (F = 6.361, p < 0.05, β = 0.546). Within this group, Muscle Tone and Muscle Stiffness maintained a strong positive relationship (F = 215.724, p < 0.05, β = 0.967, R² = 0.935). The independence assumption of residuals was satisfied across all regression analyses, with Durbin-Watson statistics approximating 2.
3.3.2. Multiple Regression Analysis
Multiple regression analyses were performed on variables showing linear relationships among participants with CSI-K scores of 40 or higher (n = 40), with results presented in Table 4. For MARM; area, the regression model with MARM; average and K-PCS yielded statistical significance (F = 20.428, p < 0.05), with an explained variance of 52.5% (R² = 0.525, adj R² = 0.499). MARM; average showed a significant positive influence (β = 0.578, p < 0.05), while K-PCS demonstrated a significant negative influence (β = -0.415, p < 0.05).
Multiple regression analysis of K-PCS with MARM; area, SEBQ, NPRS; usual pain, and NPRS; worst pain was conducted using stepwise selection, which excluded NPRS variables. The regression model was statistically significant (F = 12.980, p < 0.05), explaining 38.1% of the variance (R² = 0.412, adj R² = 0.381). MARM; area exhibited a significant negative influence (β = -0.235, p < 0.05), while SEBQ showed a significant positive influence (β = 0.479, p < 0.05).
In the subanalysis of participants with MARM; average ≥ 100° (n = 33), multiple regression analysis for NPRS; usual pain with MARM; area, NPRS; worst pain, and K-PCS was performed. Using stepwise selection, MARM; area was excluded. The model demonstrated statistical significance (F = 29.624, p < 0.05), with 66.4% explained variance (R² = 0.664, adj R² = 0.641). Both NPRS; worst pain (β = 0.647, p < 0.05) and K-PCS (β = 0.288, p < 0.05) showed significant positive influences.
For K-PCS, multiple regression analysis with MARM; area, MEP, SEBQ, and NPRS variables was conducted, with MEP and NPRS variables excluded through stepwise selection. The model was statistically significant (F = 19.388, p < 0.05), explaining 56.4% of the variance (R² = 0.564, adj R² = 0.535). MARM; area showed a significant negative influence (β = -0.476, p < 0.05), while SEBQ demonstrated a significant positive influence (β = 0.463, p < 0.05).
In the subanalysis of participants with NPRS; usual pain ≥ 4 (n = 17), multiple regression analysis for MARM; area with MARM; average and MEP yielded statistical significance (F = 8.756, p < 0.05), explaining 55.6% of the variance (R² = 0.556, adj R² = 0.492). Both MARM; average (β = 0.513, p < 0.05) and MEP (β = 0.531, p < 0.05) showed significant positive influences.
Finally, multiple regression analysis for Muscle Stiffness with CSI-K, K-PCS, and Muscle Tone demonstrated statistical significance (F = 195.627, p < 0.05), with notably high explained variance of 97.8% (R² = 0.978, adj R² = 0.973). All three variables showed significant positive influences: CSI-K (β = 0.124, p < 0.05), K-PCS (β = 0.132, p < 0.05), and Muscle Tone (β = 0.861, p < 0.05). All regression analyses satisfied the assumptions of residual independence (Durbin-Watson statistics approximating 2) and showed no multicollinearity issues (VIF<10).
4. Discussion
This study aimed to investigate the correlation between BPDs and pain in participants with moderate or higher CS. For this purpose, correlation analysis was conducted between respiratory variables and pain variables. While the correlation analysis did not reveal a direct relationship between the degree of central sensitization and breathing pattern disorders, it was found that 82.5% (33 participants) had breathing pattern disorders, and 42.5% (17 participants) had severe pain intensity in those with moderate or higher central sensitization. Correlations were identified among respiratory variables, among pain variables, between respiratory and pain variables, and between muscle tone and muscle stiffness variables.
Regarding the correlation among respiratory variables, a linear correlation was found where as MARM average, which indicates the degree of breathing pattern disorder, increased, MARM area, which represents breathing depth, also increased (r=0.594). Through regression analysis, the equation (MARM average)=99.372+0.314(MARM area) was derived, which has an explanatory power of 36.3%. A linear correlation was discovered where as MEP, representing maximal expiratory pressure, increased, MIP, indicating maximal inspiratory pressure, also increased, and through regression analysis, the equation (MIP)=-20.838+1.209(MEP) was derived. This regression equation has an explanatory power of 63.3%.
These results indicate that breathing depth, MIP, and MEP interact with and influence each other through complex neurophysiological mechanisms in the central nervous system. When the nervous system becomes hypersensitive due to CS, abnormal breathing patterns are reinforced through altered respiratory center sensitivity in the brainstem, resulting in shallower breathing depth and unstable pressure control [48,49]. The altered neural control affects both inspiratory and expiratory muscle function by changing motor neuron recruitment patterns and muscle fiber activation thresholds. Additionally, this neurophysiological interaction helps explain why expiratory muscle weakness is closely related to respiratory function problems, as CS causes abnormal respiratory muscle control and muscle weakness, resulting in reduced efficiency of the expiration process [50]. The relationship between MEP and SEBQ provides potential clinical indicators for assessing respiratory dysfunction and monitoring treatment progress in CS patients.
Regarding correlations among pain variables, a linear correlation was found where K-PCS, representing negative perception of pain, increased with NPRS usual pain, which indicates pain level due to CS. Through regression analysis, the equation (NPRS usual pain)=4.666+3.888(K-PCS) was derived. These results are explained by higher pain levels correlating with stronger negative pain perception, which appears to be because psychological factors trigger and weaken central nervous system and autonomic nervous system sensitization [51]. Negative pain perception strengthens pain pathways through multiple levels of neuroplastic adaptation in the nervous system. This adaptation process involves enhanced synaptic efficiency in pain pathways, altered descending pain modulation, and autonomic nervous system dysregulation. The relationship between pain perception and central sensitization creates a self-perpetuating cycle where breathing pattern disorders contribute to sympathetic hyperarousal, which in turn maintains central sensitization [52]. This study provides the first quantitative demonstration of this relationship in CS patients, suggesting that interventions targeting breathing pattern modification could serve as a potential therapeutic approach.
Regarding correlations between respiratory and pain variables, linear correlations were discovered where as K-PCS increased, MARM area decreased (r=-0.437) and SEBQ increased (r=0.528). Through regression analysis, the equation (K-PCS)=15.522-0.235(MARM area)+0.479(SEBQ) was derived, with an explanatory power of 38.1%. These results demonstrate a crucial biomechanical and neurophysiological link between breathing patterns and pain perception in patients with central sensitization. The negative correlation between MARM area and K-PCS (r=-0.437) provides the first quantitative evidence of how breathing mechanics directly influence pain cognition in CS patients. This relationship appears to be mediated through several interconnected pathways, including direct effects of mechanical breathing patterns on interoceptive processing, autonomic nervous system modulation through respiratory rhythm, and psychological impacts of breathing patterns on anxiety and stress responses [53,54]. The regression equation's high explanatory power (38.1%) suggests clinical significance for therapeutic interventions targeting breathing patterns in CS patients. This finding is particularly important as it demonstrates how rapid-shallow breathing patterns cause psychological adverse effects such as depression and anxiety along with sympathetic hyperactivation, leading to negative pain cognition.
However, in this study, the relationships among CS, BPDs, and muscle stiffness were not clearly demonstrated. This is likely because the study set participant eligibility criteria at moderate or higher CS (CSI-K≥40), resulting in 82.5% of participants already having BPDs, 42.5% having severe NPRS usual pain, and MARM average of 111.15±11.31˚, which exceeds the MARM average of 103.2±20.8˚ found in chronic obstructive pulmonary disease patients [55]. Therefore, subgroup analyses were conducted to examine correlations between respiratory and pain variables in participant groups with breathing pattern problems, based on the MARM average cut-off score of 100˚ [55], severe pain threshold of NPRS usual pain score of 4 [56], and moderate or higher central sensitization.
First are the results of the subanalysis for the MARM average ≥100˚ group. Linear correlations were confirmed where as MARM area decreased, NPRS usual pain (r=-0.486) and NPRS worst pain (r=-0.423) increased. Through regression analysis, equations (MARM area)=59.948-5.056(NPRS usual pain) with 23.7% explanatory power and (MARM area)=68.348-4.618(NPRS worst pain) with 17.9% explanatory power were derived. The significant negative correlations between MARM area and pain measures (NPRS usual r=-0.486, worst r=-0.423) provide compelling evidence for a direct relationship between breathing mechanics and pain intensity in CS patients. These findings indicate that shallow breathing patterns induce and exacerbate widespread pain centered around the posterior neck, and that chronic pain can be controlled through slow-deep breathing interventions [2,57]. The derived regression equations provide clinical tools for predicting pain levels based on breathing patterns and support the integration of breathing assessment into standard CS patient evaluation protocols. This relationship suggests that breathing pattern modification could be considered a primary therapeutic target rather than just a secondary intervention, particularly given the strong correlations observed between breathing parameters and pain measures.
Building upon these findings regarding pain intensity, further analysis revealed important relationships with pain catastrophizing. As with the total group analysis. As with the total group analysis, linear correlations were confirmed between K-PCS and MARM area (r=-0.605), and between K-PCS and SEBQ (r=0.595), and through regression analysis, the equation (K-PCS)=22.527-0.357(MARM area)+0.454(SEBQ) was derived with 56.4% explanatory power. These results are explained through previous research indicating that respiratory function problems correlate with negative psychological factors [58].
Additionally, changing breathing patterns from shallow to deep breathing can positively influence autonomic nervous system imbalance, emotional disorders, and catastrophizing responses [59]. As with the total group, correlations between respiratory muscle strength (MIP, MEP) and pain intensity could not be proven. However, participants' mean MIP value of 70.08±27.10cmH2O was higher than the female MIP threshold of 62cmH2O indicating significant inspiratory muscle weakness, while their mean MEP value of 75.23±14.20cmH2O was lower than the female MEP threshold of 81cmH2O indicating significant expiratory muscle weakness [60]. This appears to be a characteristic feature of breathing pattern disorders, where patients experience more difficulty with expiration than inspiration, and inspiration begins before expiration is completed [61].
Next are the results of the subanalysis for the severe NPRS usual pain ≥4 group. Unlike the total group, linear relationships were found where as CSI-K increased, SEBQ (r=0.719), K-PCS (r=0.667), and Muscle Stiffness (r=0.546) also increased. Through regression analysis, equations (CSI-K)=42.098+0.272(SEBQ) with 51.8% explanatory power, (CSI-K)=41.780+0.300(K-PCS) with 44.5% explanatory power, and (CSI-K)=30.283+0.056(Muscle Stiffness) with 29.8% explanatory power were derived. These results suggest that CS intensification is closely related to respiratory dysfunction, negative pain perception, and muscle tension [62,63,64]. This results in a vicious cycle where neural hypersensitization, autonomic nervous system imbalance, psychological stress, and pain interact complexly, leading to stronger pain perception, irregular breathing, muscle stiffness, and reinforced negative pain perception [65,66,67].
Additionally, linear relationships were found where as Muscle Stiffness increased, CSI-K (r=0.124), K-PCS (r=0.132), and Muscle Tone (r=0.861) also increased. Through regression analysis, the equation (Muscle Stiffness)=-201.736+1.210(CSI-K)+0.583(K-PCS)+27.883(Muscle Tone) was derived, with 97.8% explanatory power. This remarkably high explanatory power represents a significant advancement in understanding the complex relationship between muscle properties and central sensitization. The derived regression equation provides a potential clinical tool for predicting CS progression based on muscle parameters and monitoring treatment effectiveness. This suggests that as Muscle Stiffness intensifies, CS levels and pain intensity increase, while BPDs and tissue metabolic stress accelerate this process, leading to pain exacerbation [68]. The strong correlation between muscle tone and stiffness (r=0.970) suggests a potential new biomarker for CS severity, though age-related factors need to be carefully considered in clinical interpretation. In this study, correlations between upper trapezius (a representative accessory respiratory muscle) tension and stiffness and respiratory variables could not be confirmed. However, participants' mean upper trapezius muscle tone value of 16.81±2.25Hz and stiffness value of 340.45±72.80N/m were similar to the average values for women in their 50s (tone: 17.76±1.19Hz, stiffness: 342.45±14.34N/m), suggesting these results are due to participants' average age rather than CS or BPDs [69].
Consequently, the strengths and limitations of this study are as follows. As a strength, while correlation between CS level and BPDs was not confirmed, correlations and relationships between respiratory and pain variables were identified in individuals with moderate or higher CS. However, this study had the following limitations. First, participant recruitment was limited to specific locations, resulting in limitations in general characteristics. Second, 80% of participants were aged 50 or above, allowing age-related changes to influence outcome variables. Lastly, the accessory respiratory muscle was limited to only the upper trapezius, and muscle tone and stiffness showed a high positive correlation (r=0.970). Since this high correlation between muscle tone and stiffness could indicate underlying muscle weakness rather than active muscle tension, relationship confirmation might be possible through pain pressure threshold measurement using an algometer. Therefore, future studies should consider these limitations by recruiting CS participants from diverse groups and age ranges for better generalization, and quantitative analysis of various accessory respiratory muscles' activation levels rather than a single muscle is deemed necessary. Future research directions should specifically focus on: (1) longitudinal studies to establish causality between breathing patterns and CS progression; (2) intervention studies targeting breathing pattern modification as a primary treatment approach; (3) development of standardized protocols for breathing assessment in CS patients; (4) exploration of the relationship between breathing patterns and other autonomic markers; and (5) investigation of age-specific breathing pattern characteristics in CS patients. Additionally, studies examining the effectiveness of breathing interventions in modifying pain perception and central sensitization would provide valuable clinical evidence. These research directions would contribute to establishing breathing pattern assessment and modification as core components of CS management protocols, potentially leading to more effective treatment strategies for patients with central sensitization.
5. Conclusions
In conclusion, this study demonstrates significant interrelationships among respiratory function, pain perception, and psychological factors in individuals with moderate to severe central sensitization. The high prevalence of breathing pattern disorders (82.5%) and severe pain intensity (42.5%) in CS patients suggests that respiratory dysfunction is an integral component of the pain experience. The strong correlations between breathing mechanics (MARM area) and pain measures, along with the remarkably high explanatory power (97.8%) of the muscle properties regression model, provide quantitative evidence for these relationships. These findings highlight the importance of incorporating breathing pattern assessment in the clinical management of CS patients, while the identified regression equations offer practical tools for patient evaluation. Furthermore, the demonstrated relationships between breathing patterns and pain catastrophizing suggest that breathing pattern modification could serve as a primary therapeutic target, potentially opening new avenues for more effective CS management strategies.
Author Contributions
Conceptualization, H.L. and H.K.; methodology, H.K.; software, Y.L., Y.C., J.H., H.H., H.J.L., J.Y., W.J., Y.J.L. and D.L.; validation, Y.L., Y.C., J.H., H.H., H.J.L., J.Y., W.J., Y.J.L. and D.L.; formal analysis, Y.L., Y.C., J.H., H.H., H.J.L., J.Y., W.J., Y.J.L. and D.L.; investigation, H.L., Y.L., Y.C., J.H., H.H., H.J.L., J.Y., W.J., Y.J.L., D.L. and H.K.; resources, Y.L., Y.C., J.H., H.H., H.J.L., J.Y., W.J., Y.J.L. and D.L.; data curation, H.L., Y.L., Y.C., J.H., H.H., H.J.L., J.Y., W.J., Y.J.L. and D.L.; writing—original draft preparation, H.L., Y.L., Y.C., J.H., H.H., H.J.L., J.Y., W.J., Y.J.L. and D.L.; writing—review and editing, H.L. and H.K.; visualization, H.L. and H.K.; supervision, H.K.; project administration. All authors have read and agreed to the published version of the manuscript.
Funding
This research received no external funding.
Institutional Review Board Statement
The study was approved by the Institutional Review Board of Honam University (No. 1041223-202405-HR-01). The protocol was registered at ClinicalTrials.gov (NCT06485414). Written informed consent was obtained from all study participants prior to randomization.
Informed Consent Statement
Informed consent was obtained from all subjects involved in the study.
Data Availability Statement
The data presented in this study are available on request from the corresponding author.
Conflicts of Interest
The authors declare no conflicts of interest.
References
- Woolf, Clifford "Central Sensitization: Implications for the Diagnosis and Treatment of Pain." Pain 152, no. 3 (2011): S2-S15.
- Jafari, H.; Gholamrezaei, A.; Franssen, M.; Van Oudenhove, L.; Aziz, Q.; Bergh, O.V.D.; Vlaeyen, J.W.; Van Diest, I. Can Slow Deep Breathing Reduce Pain? An Experimental Study Exploring Mechanisms. J. Pain 2020, 21, 1018–1030. [CrossRef]
- Aydede, Murat "Defending the Iasp Definition of Pain." The Monist 100, no. 4 (2017): 439-64.
- Staud, R.; Craggs, J.G.; Robinson, M.E.; Perlstein, W.M.; Price, D.D. Brain activity related to temporal summation of C-fiber evoked pain. Pain 2007, 129, 130–142. [CrossRef]
- Wijma, A.J.; van Wilgen, C.P.; Meeus, M.; Nijs, J. Clinical biopsychosocial physiotherapy assessment of patients with chronic pain: The first step in pain neuroscience education. Physiother. Theory Pr. 2016, 32, 368–384. [CrossRef]
- Harte, S.E.; Harris, R.E.; Clauw, D.J. The neurobiology of central sensitization. J. Appl. Biobehav. Res. 2018, 23, e12137. [CrossRef]
- Arendt-Nielsen, L.; Morlion, B.; Perrot, S.; Dahan, A.; Dickenson, A.; Kress, H.G.; Wells, C.; Bouhassira, D.; Drewes, A.M. Assessment and manifestation of central sensitisation across different chronic pain conditions. Eur. J. Pain 2018, 22, 216–241. [CrossRef]
- Kindler, L.L.; Bennett, R.M.; Jones, K.D. Central Sensitivity Syndromes: Mounting Pathophysiologic Evidence to Link Fibromyalgia with Other Common Chronic Pain Disorders. Pain Manag. Nurs. 2009, 12, 15–24. [CrossRef]
- Lluch, E.; Torres, R.; Nijs, J.; Van Oosterwijck, J. Evidence for central sensitization in patients with osteoarthritis pain: A systematic literature review. Eur. J. Pain 2014, 18, 1367–1375. [CrossRef]
- Solem, I.K.L.; Varsi, C.; Eide, H.; Kristjansdottir, O.B.; Børøsund, E.; Schreurs, K.M.G.; Waxenberg, L.B.; E Weiss, K.; Morrison, E.J.; Haaland-Øverby, M.; et al. A User-Centered Approach to an Evidence-Based Electronic Health Pain Management Intervention for People With Chronic Pain: Design and Development of EPIO. J. Med Internet Res. 2020, 22, e15889. [CrossRef]
- Zou, L.; Yeung, A.; Quan, X.; Boyden, S.D.; Wang, H. A Systematic Review and Meta-Analysis of Mindfulness-Based (Baduanjin) Exercise for Alleviating Musculoskeletal Pain and Improving Sleep Quality in People with Chronic Diseases. Int. J. Environ. Res. Public Heal. 2018, 15, 206. [CrossRef]
- Wyns, A.; Hendrix, J.; Lahousse, A.; De Bruyne, E.; Nijs, J.; Godderis, L.; Polli, A. The Biology of Stress Intolerance in Patients with Chronic Pain—State of the Art and Future Directions. J. Clin. Med. 2023, 12, 2245. [CrossRef]
- Neblett, R.; Hartzell, M.M.; Mayer, T.G.; Cohen, H.; Gatchel, R.J. Establishing Clinically Relevant Severity Levels for the Central Sensitization Inventory. Pain Pr. 2016, 17, 166–175. [CrossRef]
- Kiesel, K.; Rhodes, T.; Mueller, J.; Waninger, A.; Butler, R. DEVELOPMENT OF A SCREENING PROTOCOL TO IDENTIFY INDIVIDUALS WITH DYSFUNCTIONAL BREATHING. Int. J. Sports Phys. Ther. 2017, 12, 774–786. [CrossRef]
- Kim, H.; Jung, J.; Lee, S. Prefrontal Cortex Activation during Diaphragmatic Breathing in Women with Fibromyalgia: An fNIRS Case Report. Phys. Ther. Rehabilitation Sci. 2023, 12, 334–339. [CrossRef]
- CliftonSmith, T.; Rowley, J. Breathing pattern disorders and physiotherapy: inspiration for our profession. Phys. Ther. Rev. 2011, 16, 75–86. [CrossRef]
- Chaitow, Leon "Breathing Pattern Disorders, Motor Control, and Low Back Pain." Int J Osteopath Med 7, no. 1 (2004): 33-40.
- Courtney, Rosalba "The Functions of Breathing and Its Dysfunctions and Their Relationship to Breathing Therapy." Int J Osteopath Med 12, no. 3 (2009): 78-85.
- Crockett, H.C.; Gross, L.B.; Wilk, K.E.; Schwartz, M.L.; Reed, J.; Omara, J.; Reilly, M.T.; Dugas, J.R.; Meister, K.; Lyman, S.; et al. Osseous Adaptation and Range of Motion at the Glenohumeral Joint in Professional Baseball Pitchers. Am. J. Sports Med. 2002, 30, 20–26. [CrossRef]
- Scascighini, L, V Toma, Sprott Dober-Spielmann, and Haiko Sprott. "Multidisciplinary Treatment for Chronic Pain: A Systematic Review of Interventions and Outcomes." Rheumatol 47, no. 5 (2008): 670-78.
- Neblett, R. The central sensitization inventory: A user’s manual. J. Appl. Biobehav. Res. 2018, 23. [CrossRef]
- Silva, D.D.O.; Rathleff, M.S.; Petersen, K.; de Azevedo, F.M.; Barton, C.J. Manifestations of Pain Sensitization Across Different Painful Knee Disorders: A Systematic Review Including Meta-analysis and Metaregression. Pain Med. 2018, 20, 335–358. [CrossRef]
- Arribas-Romano, A.; Fernández-Carnero, J.; Molina-Rueda, F.; Angulo-Diaz-Parreño, S.; Navarro-Santana, M.J. Efficacy of Physical Therapy on Nociceptive Pain Processing Alterations in Patients with Chronic Musculoskeletal Pain: A Systematic Review and Meta-analysis. Pain Med. 2020, 21, 2502–2517. [CrossRef]
- Martarelli, D.; Cocchioni, M.; Scuri, S.; Pompei, P. Diaphragmatic Breathing Reduces Exercise-Induced Oxidative Stress. Evidence-Based Complement. Altern. Med. 2011, 2011, 932430. [CrossRef]
- O’sullivan, P.B.; Beales, D.J. Diagnosis and classification of pelvic girdle pain disorders—Part 1: A mechanism based approach within a biopsychosocial framework. Man. Ther. 2007, 12, 86–97. [CrossRef]
- Kim, M.S.; Koh, I.J.; Kim, C.K.; Choi, K.Y.; Kim, C.Y.; In, Y. Cross-cultural adaptation and validation of the Korean version of the Central Sensitization Inventory in patients undergoing total knee arthroplasty for knee osteoarthritis. PLOS ONE 2020, 15, e0242912. [CrossRef]
- Crockett, J.E.; Cashwell, C.S.; Tangen, J.L.; Hall, K.H.; Young, J.S. Breathing Characteristics and Symptoms of Psychological Distress: An Exploratory Study. Couns. Values 2016, 61, 10–27. [CrossRef]
- Mayer, T.G.; Neblett, R.; Cohen, H.; Howard, K.J.; Choi, Y.H.; Williams, M.J.; Perez, Y.; Gatchel, R.J. The Development and Psychometric Validation of the Central Sensitization Inventory. Pain Pr. 2011, 12, 276–285. [CrossRef]
- Kim, M.S.; Koh, I.J.; Lee, S.Y.; In, Y. Central sensitization is a risk factor for wound complications after primary total knee arthroplasty. Knee Surgery, Sports Traumatol. Arthrosc. 2018, 26, 3419–3428. [CrossRef]
- Kim, H.; Lee, S. Effects of pain neuroscience education on kinesiophobia in patients with chronic pain: a systematic review and meta-analysis. Phys. Ther. Rehabilitation Sci. 2020, 9, 309–317. [CrossRef]
- Courtney, R.; van Dixhoorn, J. "Questionnaires and Manual Methods for Assessing Breathing Dysfunction." Recog treat breath disor (2014): 137-46.
- Yach, B.; Linens, S.W. The Relationship Between Breathing Pattern Disorders and Scapular Dyskinesis. Athl. Train. Sports Heal. Care 2019, 11, 63–70. [CrossRef]
- Courtney, R.; Biland, G.; Ryan, A.; Grace, S.; Gordge, R. Improvements in multi-dimensional measures of dysfunctional breathing in asthma patients after a combined manual therapy and breathing retraining protocol: a case series report. Int. J. Osteopat. Med. 2019, 31, 36–43. [CrossRef]
- Mitchell, A.J.; Bacon, C.J.; Moran, R.W. Reliability and Determinants of Self-Evaluation of Breathing Questionnaire (SEBQ) Score: A Symptoms-Based Measure of Dysfunctional Breathing. Appl. Psychophysiol. Biofeedback 2015, 41, 111–120. [CrossRef]
- Sriboonreung, T.; Leelarungrayub, J.; Yankai, A.; Puntumetakul, R. Correlation and Predicted Equations of MIP/MEP from the Pulmonary Function, Demographics and Anthropometrics in Healthy Thai Participants aged 19 to 50 Years. Clin. Med. Insights: Circ. Respir. Pulm. Med. 2021, 15. [CrossRef]
- Jo, M.-R.; Kim, N.-S. The correlation of respiratory muscle strength and cough capacity in stroke patients. J. Phys. Ther. Sci. 2016, 28, 2803–2805. [CrossRef]
- Lee, Kyeongbong "Correlation between Respiratory Muscle Strength and Pulmonary Function with Respiratory Muscle Length Increase in Healthy Adults." Phys Ther Rehabil Sci 10, no. 4 (2021): 398-405.
- Ko, C.-Y.; Choi, H.-J.; Ryu, J.; Kim, G. Between-day reliability of MyotonPRO for the non-invasive measurement of muscle material properties in the lower extremities of patients with a chronic spinal cord injury. J. Biomech. 2018, 73, 60–65. [CrossRef]
- Kim, CS, and MK Kim. "Mechanical Properties and Physical Fitness of Trunk Muscles Using Myoton." Korean J Phys Edu 55, no. 1 (2016): 633-42.
- Kim, Kyu Ryeong, Houng Soo Shin, Sang Bin Lee, Hyun Sook Hwang, and Hee Joon %J Journal of international academy of physical therapy research Shin. "Effects of Negative Pressure Soft Tissue Therapy to Ankle Plantar Flexor on Muscle Tone, Muscle Stiffness, and Balance Ability in Patients with Stroke." 9, no. 2 (2018): 1468-74.
- Ferraz, M.; Quaresma; Aquino, L.; Atra, E.; Tugwell, P.; Goldsmith, C. RELIABILITY OF PAIN SCALES IN THE ASSESSMENT OF LITERATE AND ILLITERATE PATIENTS WITH RHEUMATOID-ARTHRITIS. 1990, 17, 1022–1024.
- Rodriguez, Carmen S "Pain Measurement in the Elderly: A Review." Pain Manag Nurs 2, no. 2 (2001): 38-46.
- Jensen, Rigmor, Birthe Krogh Rasmussen, Birthe Pedersen, and Jes Olesen. "Muscle Tenderness and Pressure Pain Thresholds in Headache. A Population Study." Pain 52, no. 2 (1993): 193-99.
- Kang, H.; Uhm, J.-Y. Validation of the PAINAD-K Scale for Nonverbal Pain Assessment in the Post Anesthesia Care Unit. J. Korean Acad. Fundam. Nurs. 2023, 30, 90–101. [CrossRef]
- Darnall, B.D.; Sturgeon, J.A.; Cook, K.F.; Taub, C.J.; Roy, A.; Burns, J.W.; Sullivan, M.; Mackey, S.C. Development and Validation of a Daily Pain Catastrophizing Scale. J. Pain 2017, 18, 1139–1149. [CrossRef]
- Franchignoni, F.; Giordano, A.; Ferriero, G.; Monticone, M. Measurement precision of the Pain Catastrophizing Scale and its short forms in chronic low back pain. Sci. Rep. 2022, 12, 1–9. [CrossRef]
- Cho, S.; Kim, H.-Y.; Lee, J.-H. Validation of the Korean version of the Pain Catastrophizing Scale in patients with chronic non-cancer pain. Qual. Life Res. 2012, 22, 1767–1772. [CrossRef]
- Courtney, R.; van Dixhoorn, J.; Cohen, M. Evaluation of Breathing Pattern: Comparison of a Manual Assessment of Respiratory Motion (MARM) and Respiratory Induction Plethysmography. Appl. Psychophysiol. Biofeedback 2008, 33, 91–100. [CrossRef]
- Garfinkel, S.N.; Critchley, H.D. Threat and the Body: How the Heart Supports Fear Processing. Trends Cogn. Sci. 2015, 20, 34–46. [CrossRef]
- Gea, J.; Casadevall, C.; Pascual, S.; Orozco-Levi, M.; Barreiro, E. Respiratory diseases and muscle dysfunction. Expert Rev. Respir. Med. 2012, 6, 75–90. [CrossRef]
- Nijs, J.; George, S.Z.; Clauw, D.J.; Fernández-De-Las-Peñas, C.; Kosek, E.; Ickmans, K.; Fernández-Carnero, J.; Polli, A.; Kapreli, E.; Huysmans, E.; et al. Central sensitisation in chronic pain conditions: latest discoveries and their potential for precision medicine. 2021, 3, e383–e392. [CrossRef]
- Gifford, L.S.; Butler, D.S. The integration of pain sciences into clinical practice. J. Hand Ther. 1997, 10, 86–95. [CrossRef]
- Giardino, N.D.; Curtis, J.L.; Abelson, J.L.; King, A.P.; Pamp, B.; Liberzon, I.; Martinez, F.J. The impact of panic disorder on interoception and dyspnea reports in chronic obstructive pulmonary disease. Biol. Psychol. 2010, 84, 142–146. [CrossRef]
- Jerath, R.; Crawford, M.W.; Barnes, V.A.; Harden, K. Self-Regulation of Breathing as a Primary Treatment for Anxiety. Appl. Psychophysiol. Biofeedback 2015, 40, 107–115. [CrossRef]
- Courtney, R.; van Dixhoorn, J.; Greenwood, K.M.; Anthonissen, E.L.M.; Do; M.D.; Ph.D. Medically Unexplained Dyspnea: Partly Moderated by Dysfunctional (Thoracic Dominant) Breathing Pattern. J. Asthma 2011, 48, 259–265. [CrossRef]
- Williamson, A.; Hoggart, B. Pain: a review of three commonly used pain rating scales. J. Clin. Nurs. 2005, 14, 798–804. [CrossRef]
- Joseph, C.N.; Porta, C.; Casucci, G.; Casiraghi, N.; Maffeis, M.; Rossi, M.; Bernardi, L. Slow Breathing Improves Arterial Baroreflex Sensitivity and Decreases Blood Pressure in Essential Hypertension. Hypertension 2005, 46, 714–718. [CrossRef]
- Zaccaro, A.; Piarulli, A.; Laurino, M.; Garbella, E.; Menicucci, D.; Neri, B.; Gemignani, A. How Breath-Control Can Change Your Life: A Systematic Review on Psycho-Physiological Correlates of Slow Breathing. Front. Hum. Neurosci. 2018, 12, 353. [CrossRef]
- Russo, M.A.; Santarelli, D.M.; O’rourke, D. The physiological effects of slow breathing in the healthy human. Breathe 2017, 13, 298–309. [CrossRef]
- Rodrigues, A.; Louvaris, Z.; Dacha, S.; Janssens, W.; Pitta, F.; Vogiatizis, I.; Gosselink, R.; Langer, D. Differences in Respiratory Muscle Responses to Hyperpnea or Loaded Breathing in COPD. Med. Sci. Sports Exerc. 2019, 52, 1126–1134. [CrossRef]
- Laghi, F.; Tobin, M.J. Disorders of the Respiratory Muscles. Am. J. Respir. Crit. Care Med. 2003, 168, 10–48. [CrossRef]
- Klein, T.; Magerl, W.; Hopf, H.-C.; Sandkühler, J.; Treede, R.-D. Perceptual Correlates of Nociceptive Long-Term Potentiation and Long-Term Depression in Humans. J. Neurosci. 2004, 24, 964–971. [CrossRef]
- Bordoni, B.; Marelli, F.; Morabito, B.; Sacconi, B. Depression, anxiety and chronic pain in patients with chronic obstructive pulmonary disease: the influence of breath. Monaldi Arch. Chest Dis. 2017, 87, 811–811. [CrossRef]
- Zhang, S.; Seymour, B. Technology for Chronic Pain. Curr. Biol. 2014, 24, R930–R935. [CrossRef]
- Latremoliere, A.; Woolf, C.J. Central Sensitization: A Generator of Pain Hypersensitivity by Central Neural Plasticity. 2009, 10, 895–926. [CrossRef]
- de Tommaso, M.; Delussi, M.; Vecchio, E.; Sciruicchio, V.; Invitto, S.; Livrea, P. Sleep features and central sensitization symptoms in primary headache patients. J. Headache Pain 2014, 15, 64–64. [CrossRef]
- Nicholas, M.; Vlaeyen, J.W.; Rief, W.; Barke, A.; Aziz, Q.; Benoliel, R.; Cohen, M.; Evers, S.; Giamberardino, M.A.; Goebel, A.; et al. The IASP classification of chronic pain for ICD-11: chronic primary pain. PAIN® 2019, 160, 28–37. [CrossRef]
- Thanapal, M. R., M. D. Tata, A. J. Tan, T. Subramaniam, J. M. Tong, K. Palayan, S. Rampal, and R. Gurunathan. "Pre-Emptive Intraperitoneal Local Anaesthesia: An Effective Method in Immediate Post-Operative Pain Management and Metabolic Stress Response in Laparoscopic Appendicectomy, a Randomized, Double-Blinded, Placebo-Controlled Study." ANZ J Surg 84, no. 1-2 (2014): 47-51.
- Kirk, E.A.; Gilmore, K.J.; Stashuk, D.W.; Doherty, T.J.; Rice, C.L. Human motor unit characteristics of the superior trapezius muscle with age-related comparisons. J. Neurophysiol. 2019, 122, 823–832. [CrossRef]
Figure 1.
STROBE flow chart for recruitment.
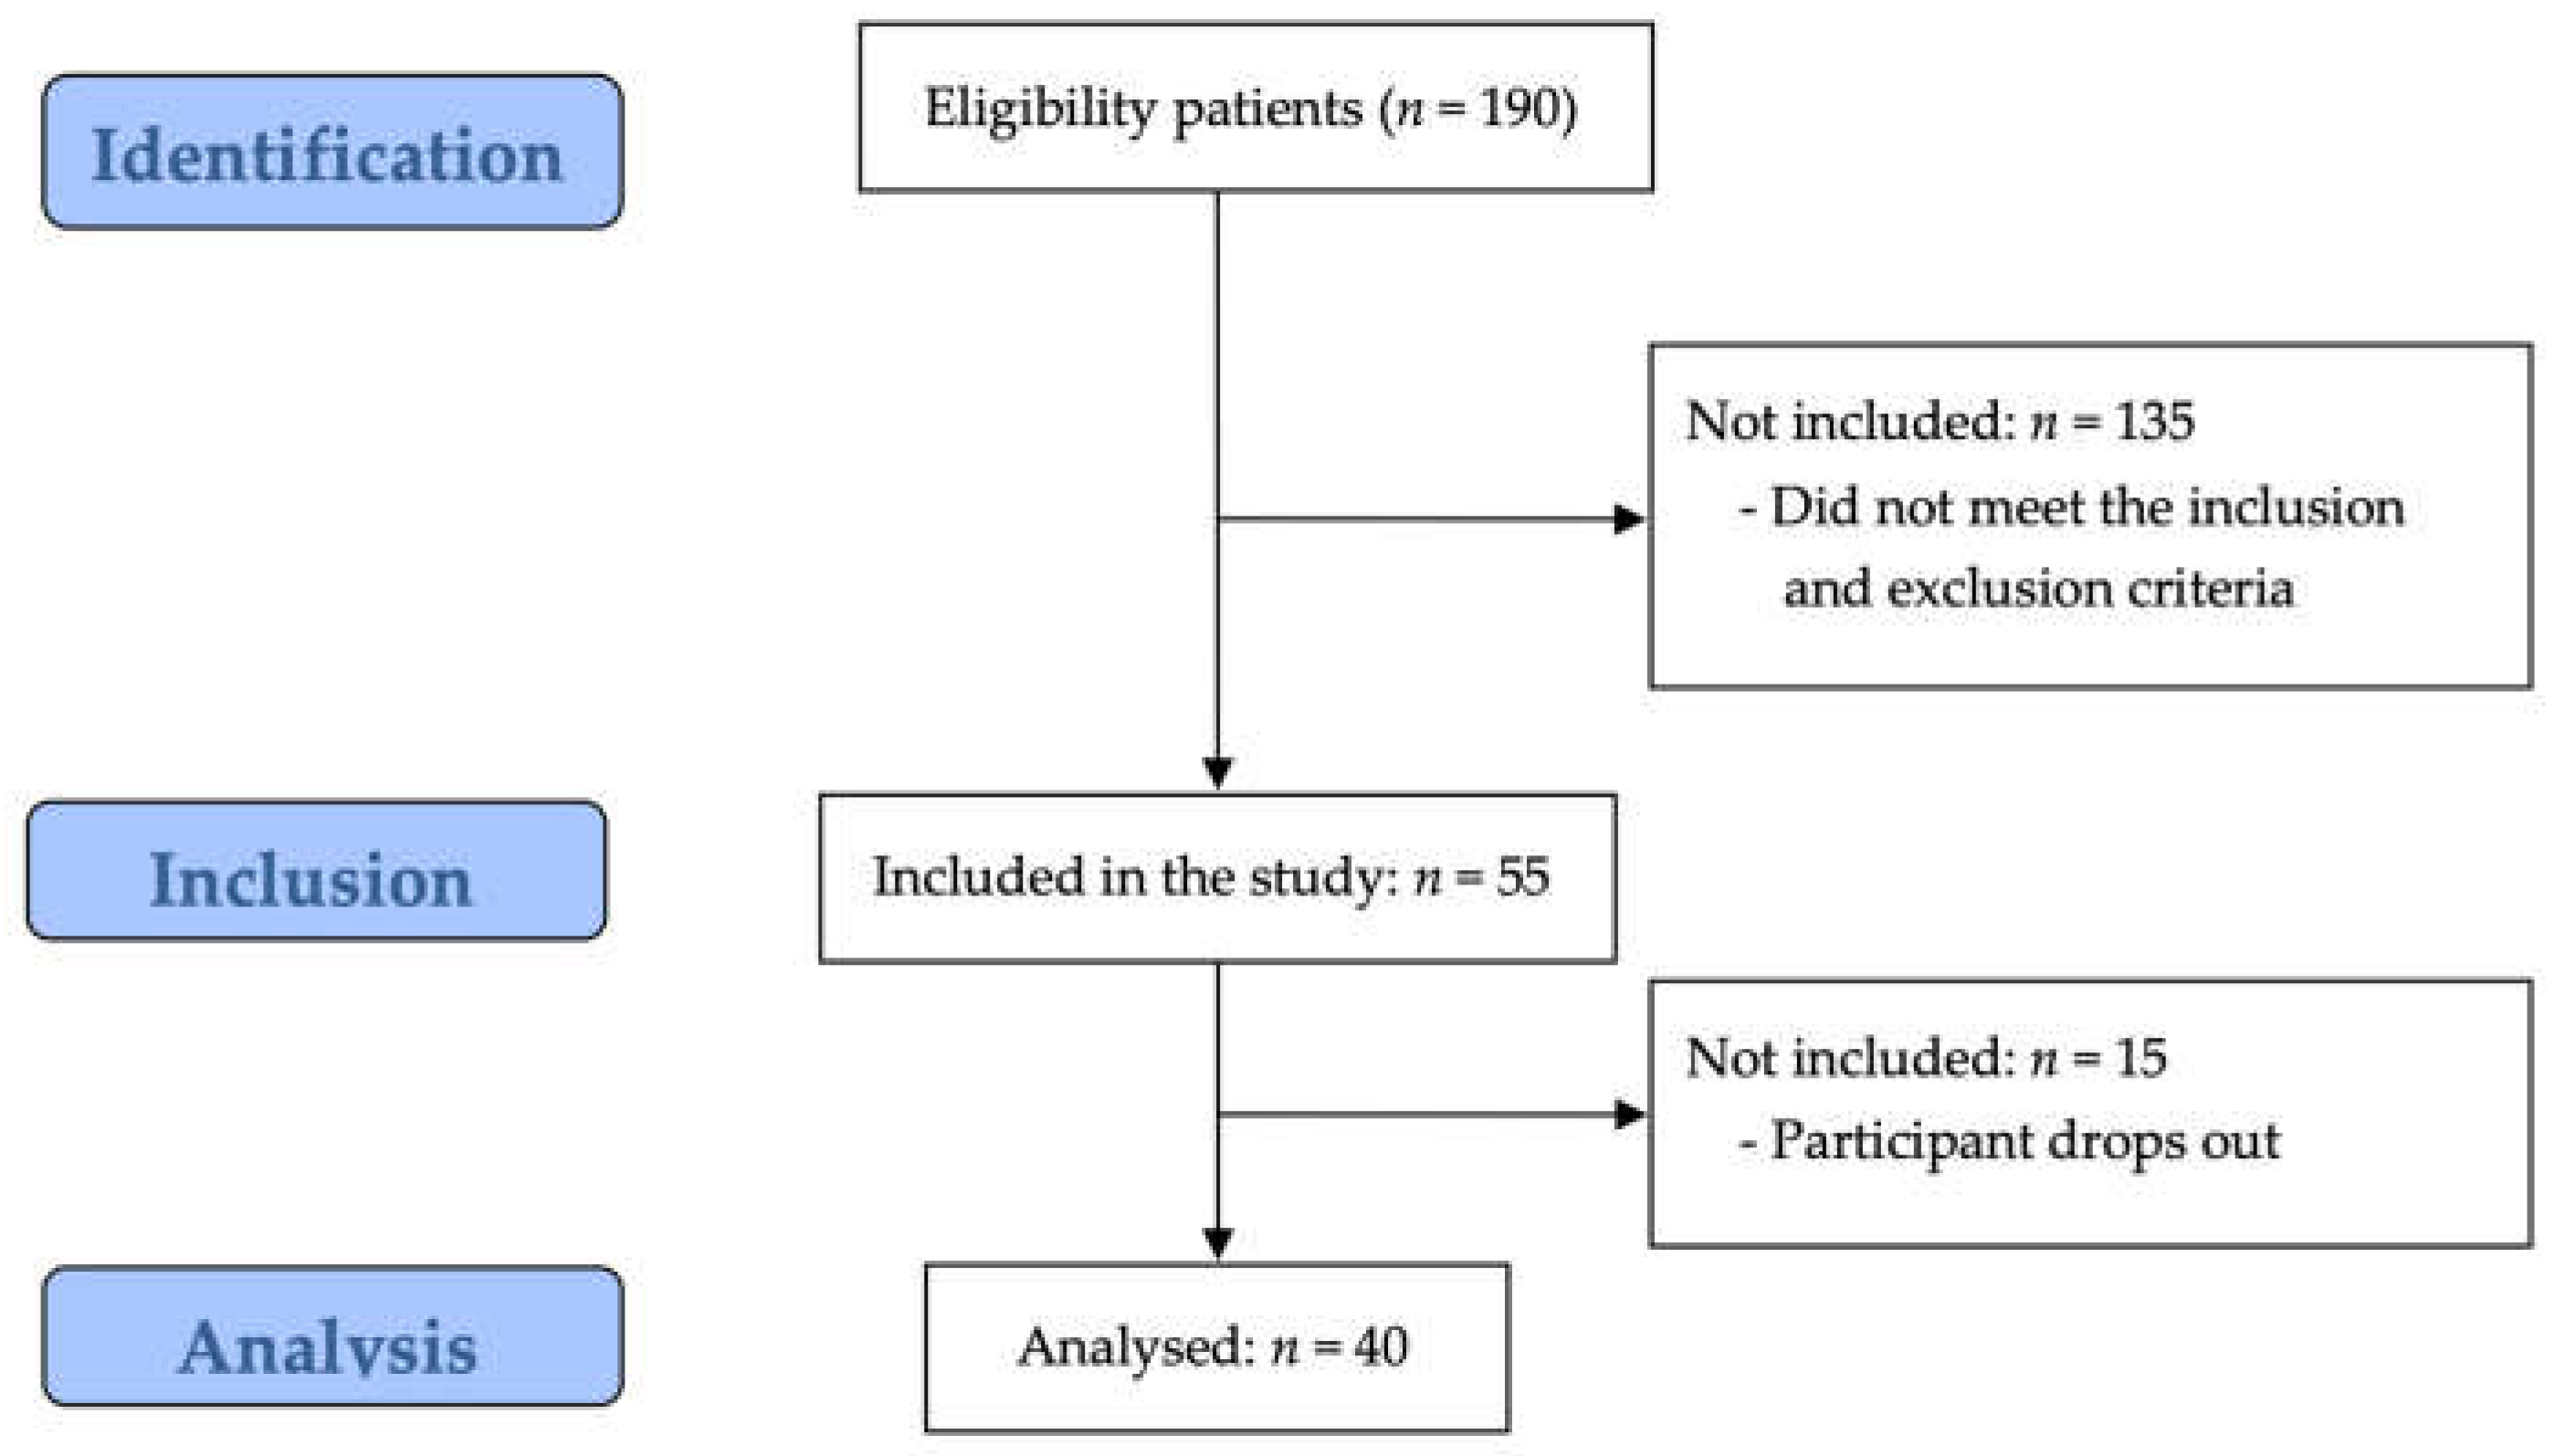
Figure 2.
Correlation analysis between variables in total group. Values are correlation coefficient r (p-value). CSI-K, central sensitization inventory-Korean version; K-PCS, Korean-pain catastrophizing scale; MARM, manual assessment of respiratory motion; MEP, maximal expiratory pressure; MIP, maximal inspiratory pressure; NPRS, numeric pain rating scale; SEBQ, self-evaluation of breathing questionnaire.
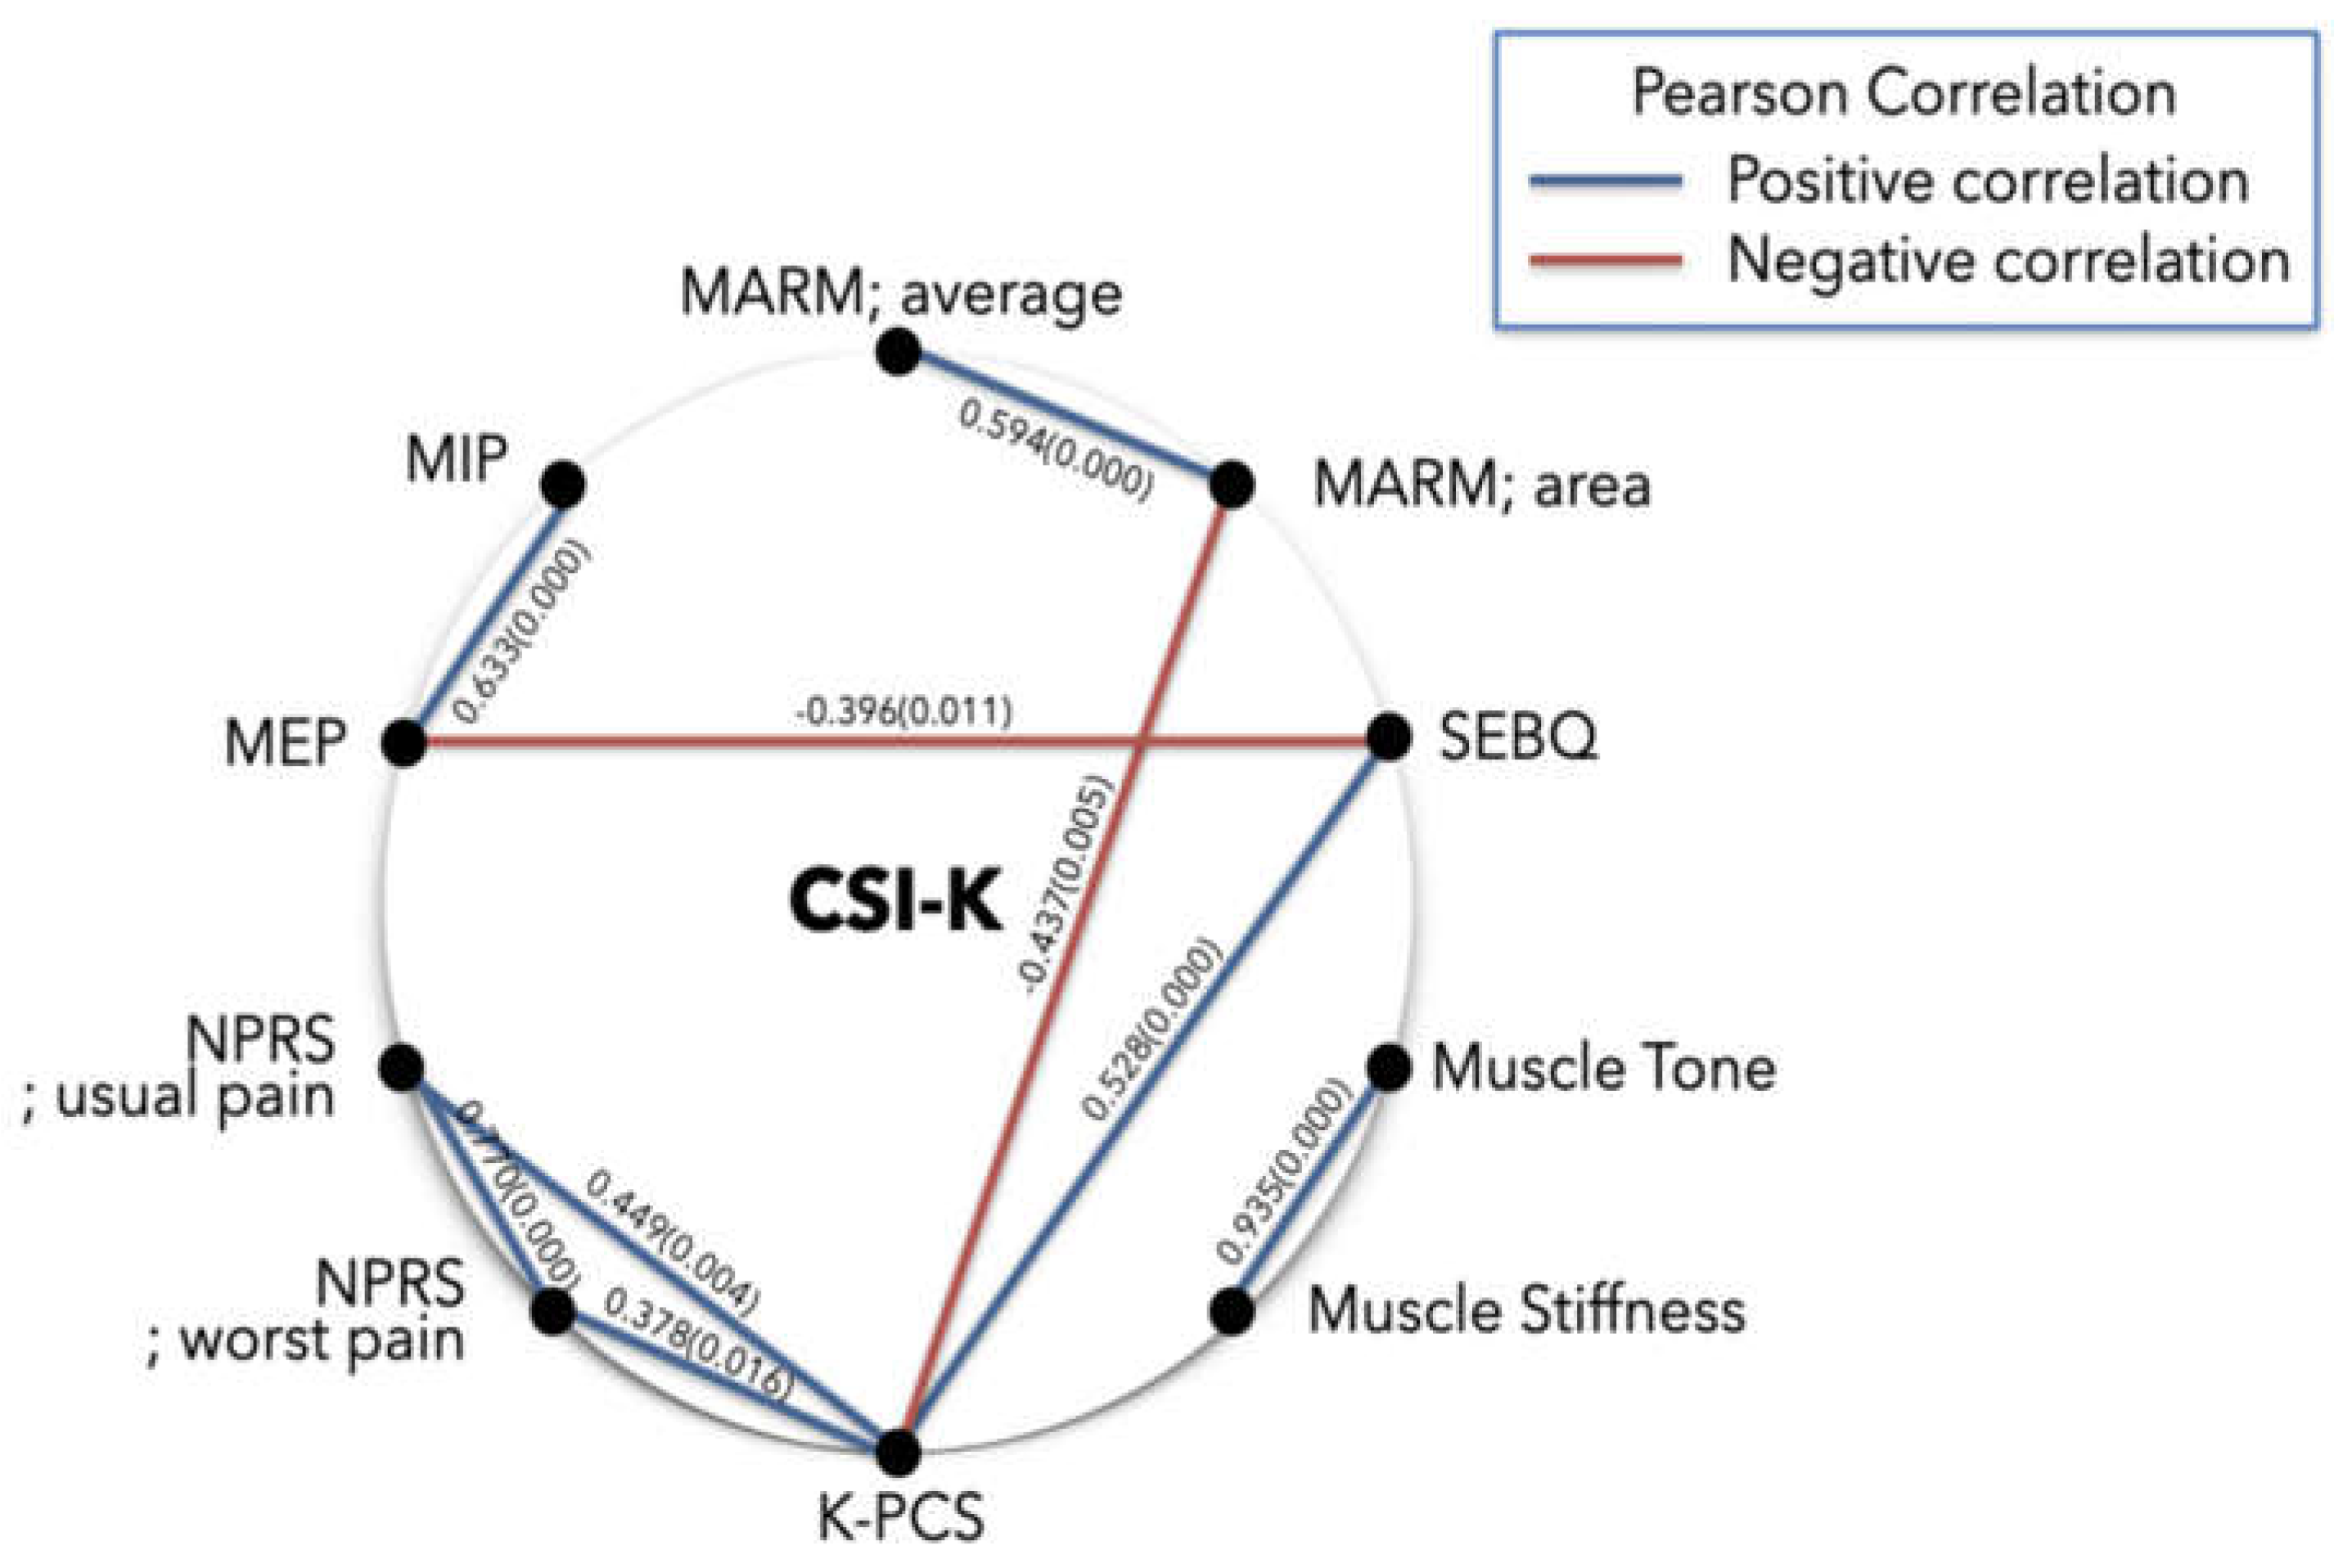
Figure 3.
Correlation analysis between variables subgroup. Values are correlation coefficient r (p-value). CSI-K, central sensitization inventory-Korean version; K-PCS, Korean-pain catastrophizing scale; MARM, manual assessment of respiratory motion; MEP, maximal expiratory pressure; MIP, maximal inspiratory pressure; NPRS, numeric pain rating scale; SEBQ, self-evaluation of breathing questionnaire.
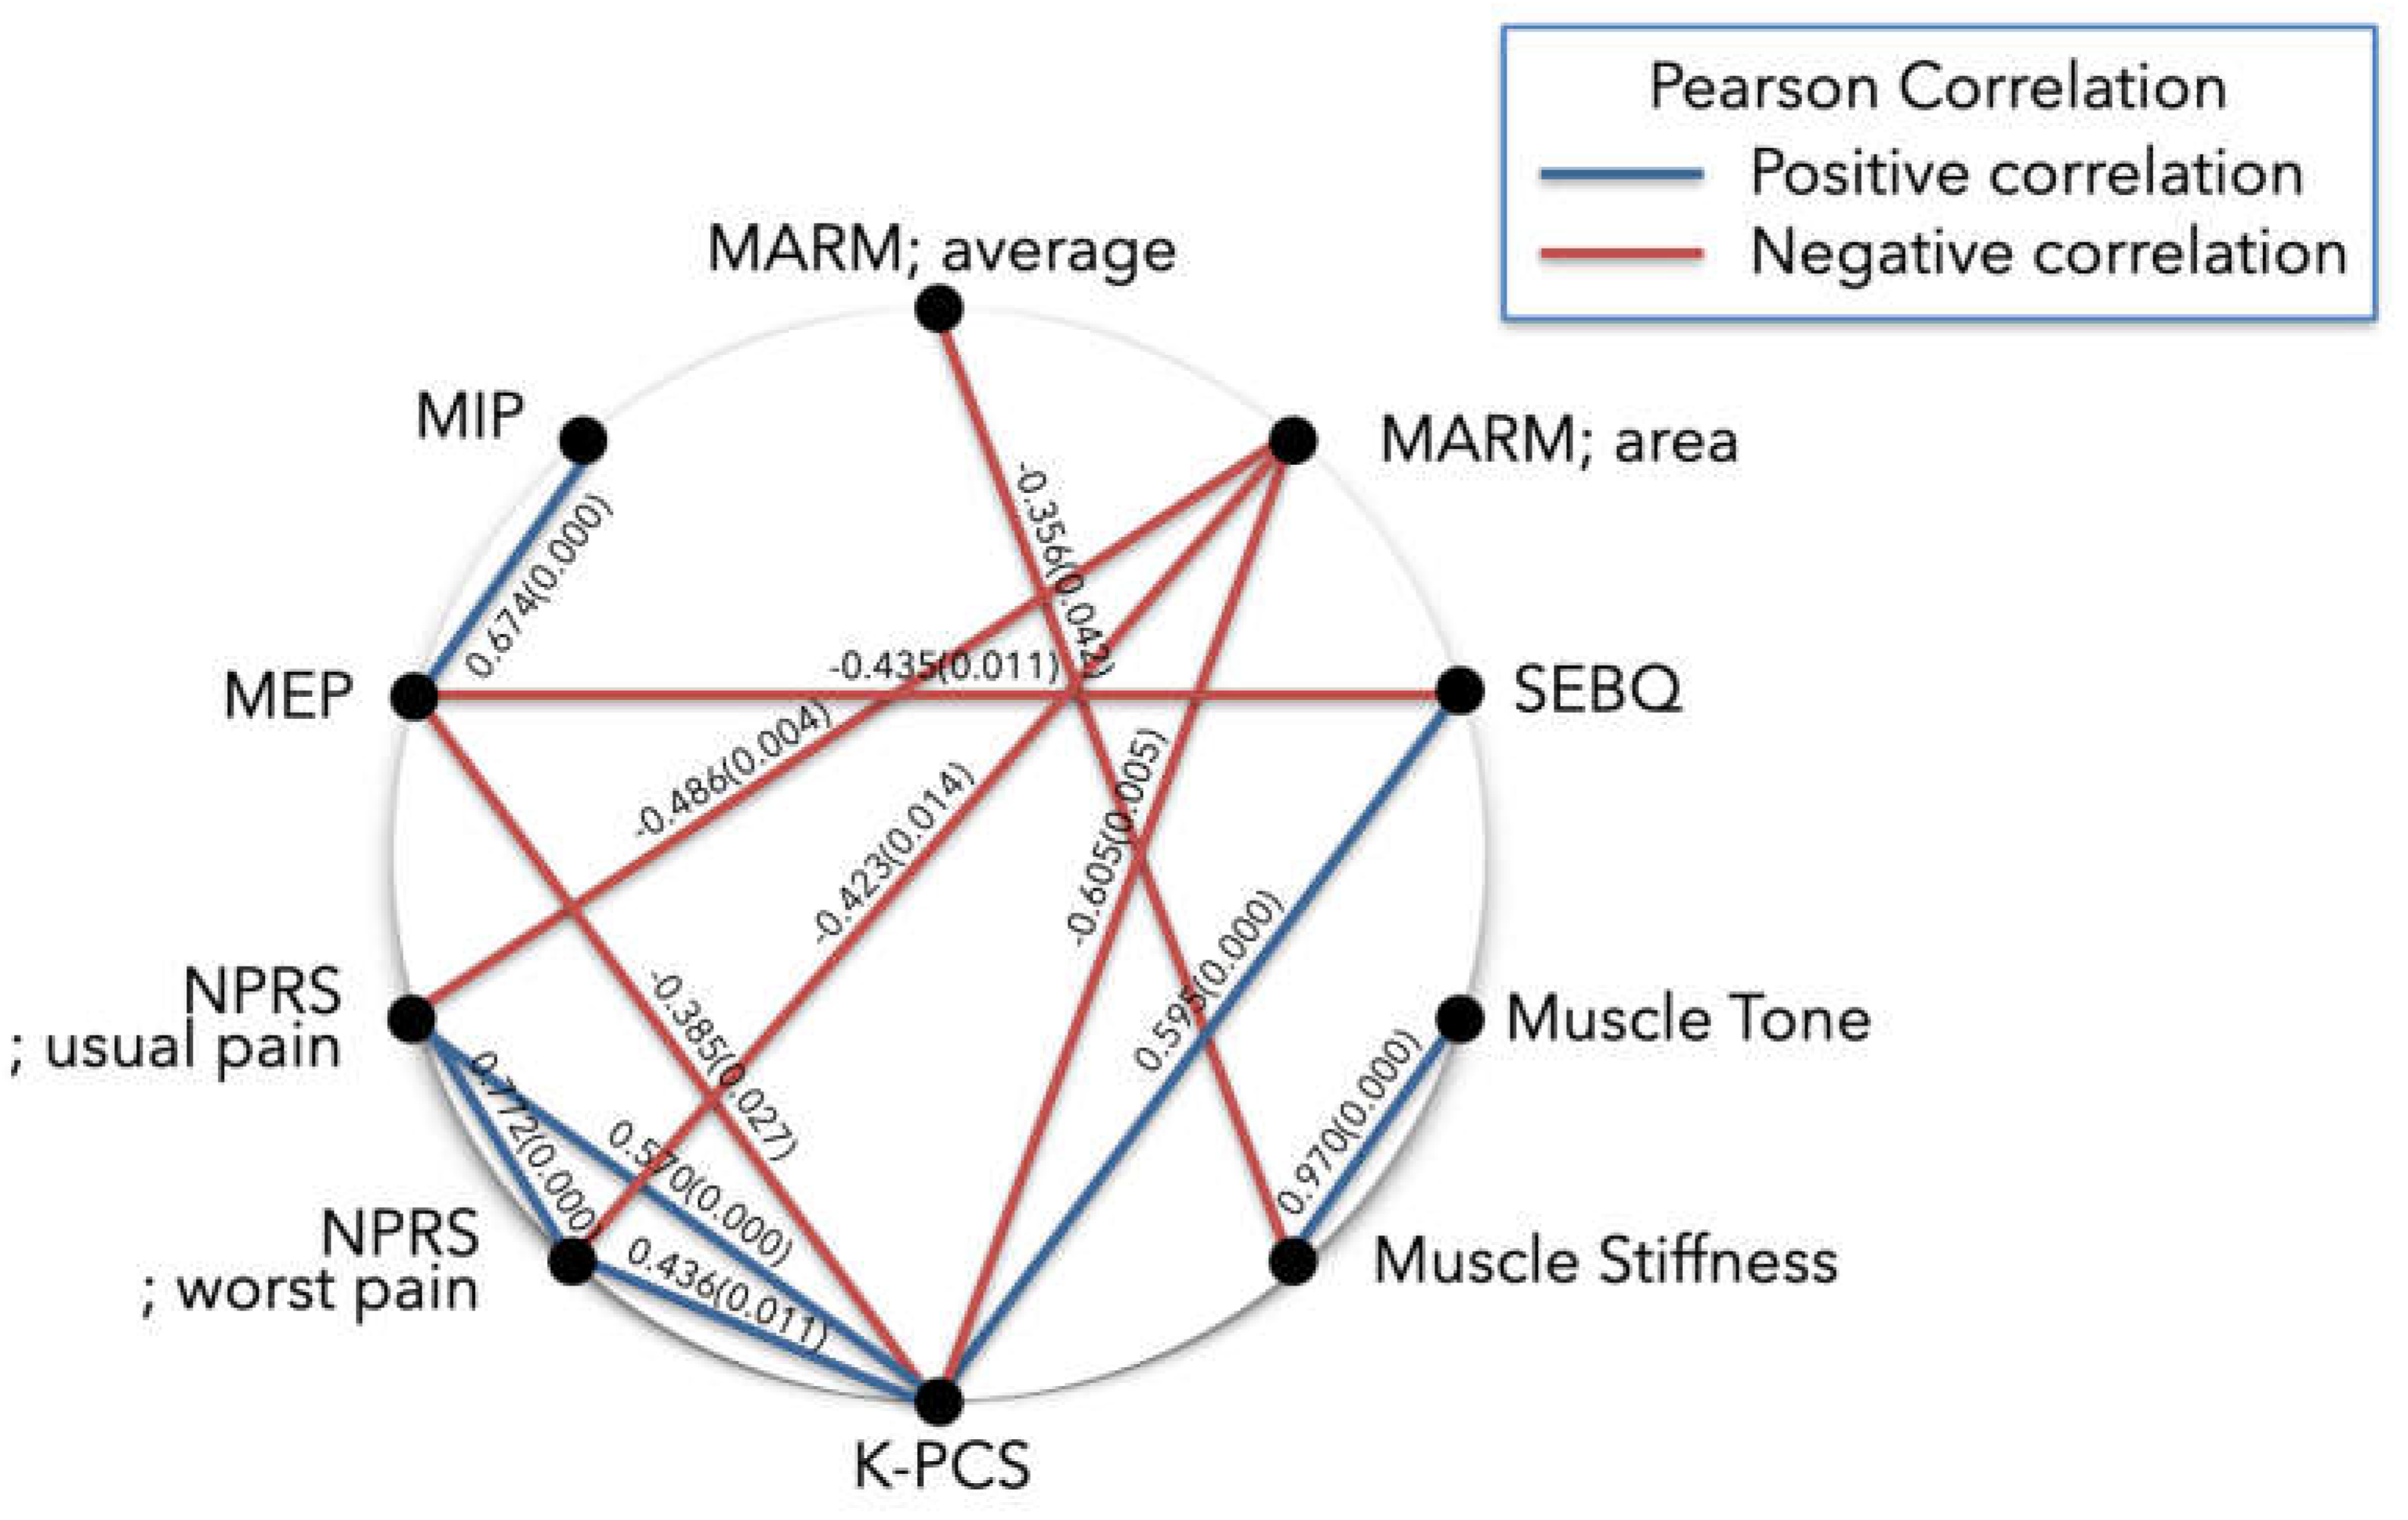
Figure 4.
Correlation analysis between variables subgroup. Values are correlation coefficient r (p-value). CSI-K, central sensitization inventory-Korean version; K-PCS, Korean-pain catastrophizing scale; MARM, manual assessment of respiratory motion; MEP, maximal expiratory pressure; MIP, maximal inspiratory pressure; NPRS, numeric pain rating scale; SEBQ, self-evaluation of breathing questionnaire.
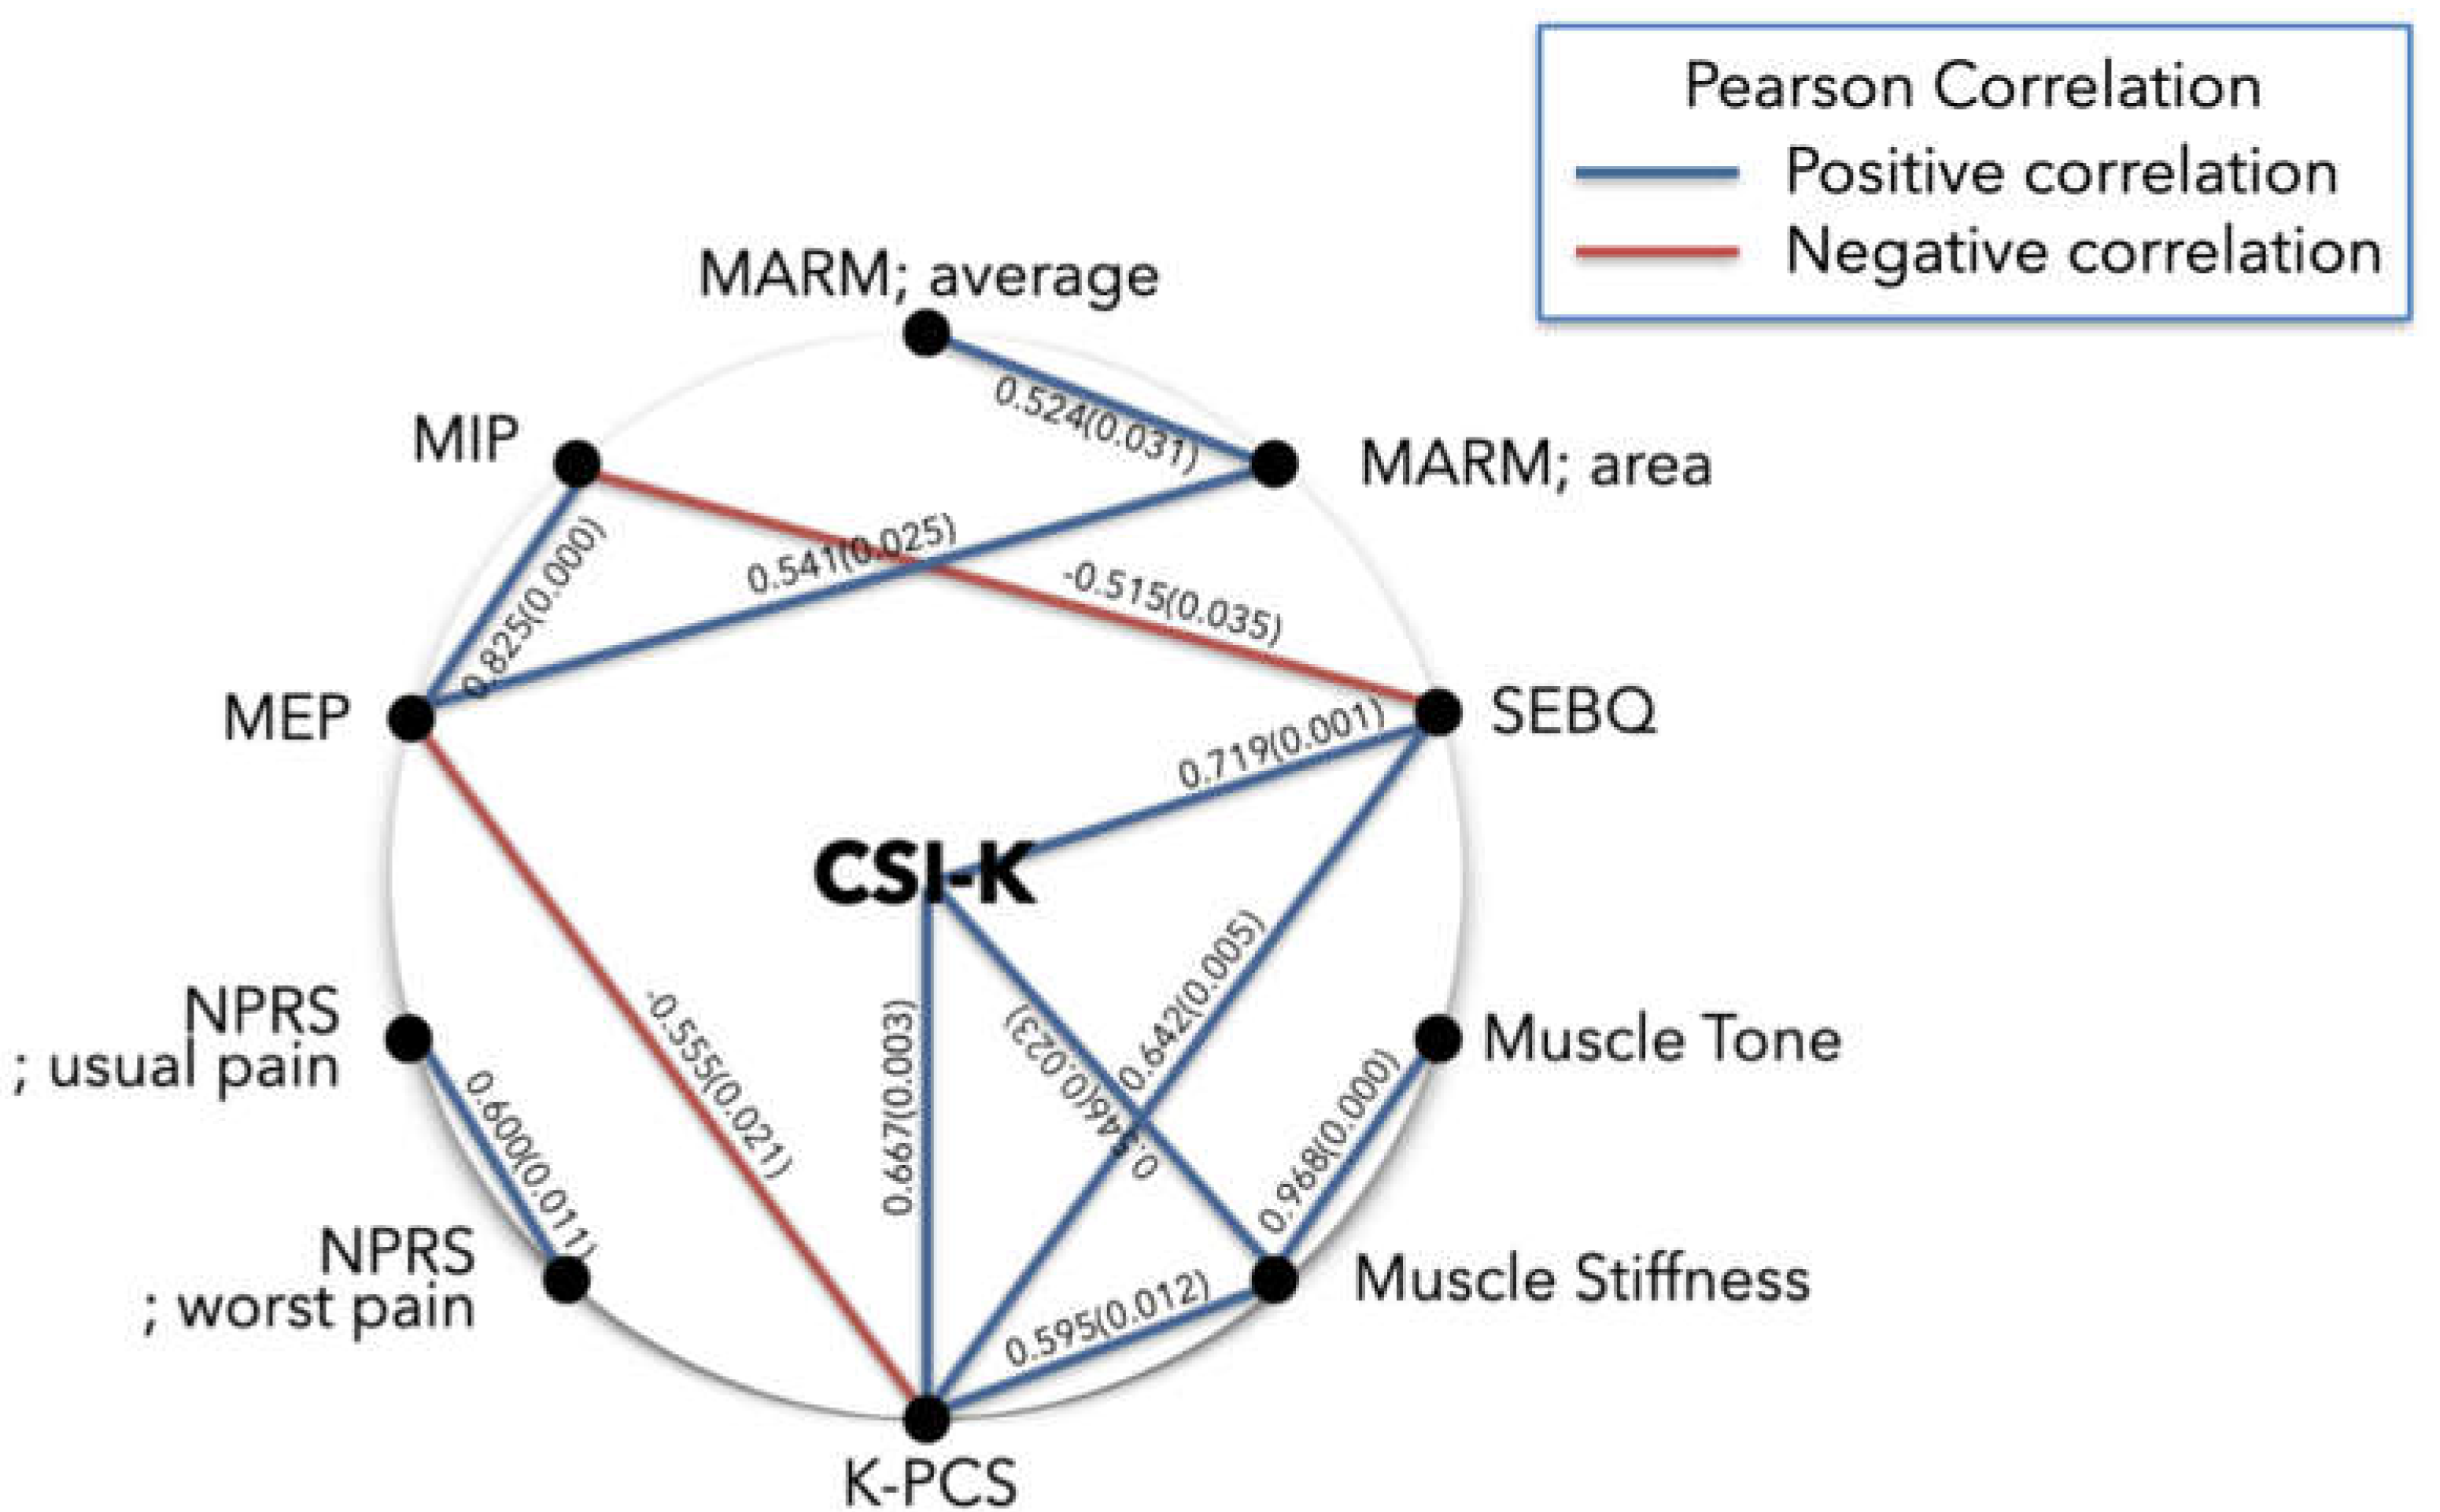

Table 1.
General characteristics of the participants.
| Variables | Mean±SD |
|---|---|
| Sex (male/female) | 7/33 |
| Age (years) | 56.38±8.05 |
| Height (cm) | 160.75±5.96 |
| Weight (kg) | 61.50±9.00 |
| BMI (kg/m2) | 23.80±3.29 |
BMI, body mass index; SD: standard deviation.
Table 2.
The Pearson correlation analysis between variables.
| Variables | CSI-K | MARM; average | MARM; area | MIP | MEP | SEBQ | NPRS; usual pain | NPRS; worst pain | K-PCS | Muscle tone |
Muscle stiffness |
|---|---|---|---|---|---|---|---|---|---|---|---|
| CSI-K | 1 | ||||||||||
| MARM; average |
0.138 | 1 | |||||||||
| MARM; area |
0.003 | 0.594** | 1 | ||||||||
| MIP | 0.141 | 0.213 | 0.184 | 1 | |||||||
| MEP | -0.121 | 0.137 | 0.131 | 0.633** | 1 | ||||||
| SEBQ | 0.209 | -0.058 | -0.142 | -0.302 | -0.396* | 1 | |||||
| NPRS; usual pain | 0.050 | 0.000 | -0.275 | 0.001 | -0.080 | 0.285 | 1 | ||||
| NPRS; worst pain | 0.221 | -0.037 | -0.217 | -0.039 | -0.155 | 0.134 | 0.770** | 1 | |||
| K-PCS | 0.144 | -0.038 | -0.437* | -0.267 | -0.278 | 0.528** | 0.449** | 0.378* | 1 | ||
| Muscle tone |
0.074 | -0.123 | -0.005 | -0.160 | -0.052 | 0.204 | -0.058 | -0.119 | 0.243 | 1 | |
| Muslce stiffness |
0.111 | -0.175 | -0.116 | -0.071 | -0.126 | 0.304 | -0.039 | -0.120 | 0.298 | 0.935** | 1 |
Values are correlation coefficient (r) unless otherwise indicated. BMI, body mass index; CSI-K, central sensitization inventory-Korean version; K-PCS, Korean-pain catastrophizing scale; MARM, manual assessment of respiratory motion; MEP, maximal expiratory pressure; MIP, maximal inspiratory pressure; NPRS, numeric pain rating scale; SEBQ, self-evaluation of breathing questionnaire. * p < 0.05, ** p < 0.01*.
Table 3.
The Pearson correlation analysis between MARM average degrees greater than 100°.
| Variables | CSI-K | MARM; average | MARM; area | MIP | MEP | SEBQ | NPRS; usual pain | NPRS; worst pain | K-PCS | Muscle tone |
Muscle stiffness |
|---|---|---|---|---|---|---|---|---|---|---|---|
| CSI-K | 1 | ||||||||||
| MARM; average |
0.202 | 1 | |||||||||
| MARM; area |
0.005 | 0.303 | 1 | ||||||||
| MIP | 0.217 | 0.215 | 0.179 | 1 | |||||||
| MEP | -0.117 | 0.125 | 0.147 | 0.674** | 1 | ||||||
| SEBQ | 0.187 | -0.259 | -0.277 | -0.342 | -0.435* | 1 | |||||
| NPRS; usual pain | 0.099 | -0.050 | -0.486** | -0.007 | -0.089 | 0.342 | 1 | ||||
| NPRS; worst pain | 0.281 | -0.180 | -0.423* | 0.001 | -0.162 | 0.168 | 0.772** | 1 | |||
| K-PCS | 0.201 | -0.155 | -0.605** | -0.299 | -0.385* | 0.595** | 0.570** | 0.436* | 1 | ||
| Muscle tone |
0.120 | -0.311 | -0.069 | -0.172 | -0.089 | 0.197 | -0.059 | -0.142 | 0.172 | 1 | |
| Muslce stiffness |
0.209 | -0.356* | -0.180 | -0.143 | -0.142 | 0.304 | -0.013 | -0.080 | 0.272 | 0.970** | 1 |
Values are correlation coefficient (r) unless otherwise indicated. BMI, body mass index; CSI-K, central sensitization inventory-Korean version; K-PCS, Korean-pain catastrophizing scale; MARM, manual assessment of respiratory motion; MEP, maximal expiratory pressure; MIP, maximal inspiratory pressure; NPRS, numeric pain rating scale; SEBQ, self-evaluation of breathing questionnaire. * p < 0.05, ** p < 0.01.
Table 4.
The Pearson correlation analysis between variables in NPRS usual pain points greater than 4 points.
Table 4.
The Pearson correlation analysis between variables in NPRS usual pain points greater than 4 points.
| Variables | CSI-K | MARM; average | MARM; area | MIP | MEP | SEBQ | NPRS; usual pain | NPRS; worst pain | K-PCS | Muscle tone |
Muscle stiffness |
|---|---|---|---|---|---|---|---|---|---|---|---|
| CSI-K | 1 | ||||||||||
| MARM; average |
-0.060 | 1 | |||||||||
| MARM; area |
-0.164 | 0.524* | 1 | ||||||||
| MIP | -0.408 | 0.032 | 0.397 | 1 | |||||||
| MEP | -0.422 | 0.021 | 0.541* | 0.825** | 1 | ||||||
| SEBQ | 0.719** | 0.181 | -0.051 | -0.515* | -0.468 | 1 | |||||
| NPRS; usual pain | 0.232 | -0.220 | -0.035 | -0.318 | -0.307 | 0.181 | 1 | ||||
| NPRS; worst pain | 0.072 | -0.267 | -0.317 | -0.278 | -0.443 | 0.013 | 0.600* | 1 | |||
| K-PCS | 0.667** | 0.247 | -0.298 | -0.419 | -0.555* | 0.642** | 0.209 | 0.236 | 1 | ||
| Muscle tone |
0.388 | 0.102 | 0.260 | -0.156 | 0.035 | 0.305 | 0.134 | -0.120 | 0.441 | 1 | |
| Muslce stiffness |
0.546* | 0.046 | 0.120 | -0.243 | -0.106 | 0.446 | 0.212 | -0.027 | 0.594* | 0.967** | 1 |
Values are correlation coefficient (r) unless otherwise indicated. BMI, body mass index; CSI-K, central sensitization inventory-Korean version; K-PCS, Korean-pain catastrophizing scale; MARM, manual assessment of respiratory motion; MEP, maximal expiratory pressure; MIP, maximal inspiratory pressure; NPRS, numeric pain rating scale; SEBQ, self-evaluation of breathing questionnaire. * p < 0.05, ** p < 0.01.
Table 3.
The simple regression analysis between variables.
| Dependent variable |
Independent variable |
Unstandardized coefficients |
Standardized coefficients |
t (p) | F | R2 | |
|---|---|---|---|---|---|---|---|
| B | SE | β | |||||
| Simple regression analysis between respiratory variables: CSI-K (≥ 40 points) (n = 40) | |||||||
| MARM; area | (constant) | 49.064 | 4.817 | 10.186 (0.000) | 8.957** | 0.191 | |
| K-PCS | -0.686 | 0.229 | -0.437 | -2.992 (0.005) | |||
| MIP | (constant) | -20.838 | 18.342 | -1.136 (0.263) | 25.421** | 0.633 | |
| MEP | 1.209 | 0.240 | 0.633 | 5.042 (0.000) | |||
| MEP | (constant) | 83.188 | 3.653 | 22.772 (0.000) | 7.058* | 0.157 | |
| SEBQ | -0.407 | 0.153 | -0.396 | -2.657 (0.011) | |||
| Simple regression analysis between pain variables: CSI-K (≥ 40 points) (n = 40) | |||||||
| NPRS; usual pain | (constant) | -1.161 | 0.604 | -1.922 (0.062) | 55.491** | 0.594 | |
| NPRS; worst pain | 0.824 | 0.111 | 0.770 | 7.449 (0.000) | |||
| NPRS; usual pain | (constant) | 2.182 | 0.380 | 5.741 (0.000) | 12.729** | 0.237 | |
| K-PCS | 0.061 | 0.017 | 0.487 | 3.568 (0.004) | |||
| NPRS; worst pain | (constant) | 4.472 | 0.382 | 11.702 (0.000) | 6.324** | 0.143 | |
| K-PCS | 0.046 | 0.018 | 0.378 | 2.515 (0.016) | |||
| Simple regression analysis between other variables: CSI-K (≥ 40 points) (n = 40) | |||||||
| MARM; area | (constant) | 49.064 | 4.817 | 10.186 (0.000) | 8.957** | 0.191 | |
| K-PCS | -0.686 | 0.229 | -0.437 | -2.992 (0.005) | |||
| SEBQ | (constant) | 11.219 | 2.878 | 3.899 (0.000) | 14.699** | 0.279 | |
| K-PCS | 0.525 | 0.137 | 0.528 | 3.834 (0.000) | |||
| Muscle Tone | (constant) | 6.967 | 0.618 | 11.271 (0.000) | 264.823** | 0.875 | |
| Muscle Stiffness | 0.029 | 0.002 | 0.935 | 16.273 (0.000) | |||
| Subanalysis; simple regression analysis between variables: MARM; average (≥ 100 degrees) (n = 33) | |||||||
| MARM; area | (constant) | 59.948 | 5.977 | 10.030 (0.000) | 9.607** | 0.237 | |
| NPRS; usual pain | -5.056 | 1.631 | -0.486 | -3.099 (0.004) | |||
| (constant) | 68.348 | 9.898 | 6.905 (0.000) | 6.773* | 0.179 | ||
| NPRS; worst pain | -4.618 | 1.774 | -0.423 | -2.603 (0.014) | |||
| (constant) | 56.852 | 4.093 | 13.891 (0.000) | 17.857** | 0.366 | ||
| K-PCS | -0.806 | 0.191 | -0.605 | -4.226 (0.000) | |||
| MEP | (constant) | 81.968 | 3.627 | 22.600 (0.000) | 5.402** | 0.148 | |
| K-PCS | -0.393 | 0.169 | -0.385 | -2.324 (0.027) | |||
| SEBQ | (constant) | 10.599 | 3.160 | 3.354 (0.002) | 17.024** | 0.354 | |
| K-PCS | 0.608 | 0.147 | 0.595 | 4.126 (0.000) | |||
| Muscle Tone | (constant) | 6.418 | 0.480 | 13.362 (0.000) | 493.335** | 0.941 | |
| Muscle Stiffness | 0.031 | 0.001 | 0.970 | 22.211 (0.000) | |||
| Muscle Stiffness | (constant) | 707.909 | 174.285 | 4.062 (0.000) | 17.024** | 0.354 | |
| MARM; average | -3.206 | 1.513 | -0.356 | -2.119 (0.042) | |||
| Subanalysis; Simple regression analysis between respiratory variables: NPRS; usual pain (≥ 4 points) (n = 17) | |||||||
| MARM; area | (constant) | -9.989 | 17.290 | -0.578 (0.572) | 6.220** | 0.246 | |
| MEP | 0.572 | 0.229 | 0.541 | 2.494 (0.025) | |||
| MIP | (constant) | 84.648 | 8.850 | 9.565 (0.000) | 5.402* | 0.265 | |
| SEBQ | -0.691 | 0.297 | -0.515 | -2.324(0.035) | |||
| Subanalysis; Simple regression analysis between other variables: NPRS; usual pain (≥ 4 points) (n = 17) | |||||||
| Muscle Tone | (constant) | 6.629 | 0.681 | 9.739 (0.000) | 215.724** | 0.935 | |
| Muscle Stiffness | 0.030 | 0.002 | 0.967 | 3.242 (0.000) | |||
| Muscle Stiffness | (constant) | 268.996 | 24.868 | 10.817 (0.000) | 8.199* | 0.353 | |
| K-PCS | 2.616 | 0.914 | 0.594 | 2.863 (0.012) | |||
| CSI-K | (constant) | 42.098 | 2.020 | 20.837 (0.000) | 16.096** | 0.518 | |
| SEBQ | 0.272 | 0.068 | 0.719 | 4.012 (0.001) | |||
| (constant) | 41.780 | 2.353 | 17.753 (0.000) | 12.030** | 0.445 | ||
| K-PCS | 0.300 | 0.086 | 0.667 | 3.468 (0.003) | |||
| (constant) | 30.283 | 7.404 | 4.090 (0.001) | 6.361* | 0.298 | ||
| Muscle Stiffness | 0.056 | 0.022 | 0.546 | 2.522 (0.023) | |||
CSI-K, central sensitization inventory-Korean version; K-PCS, Korean-pain catastrophizing scale; MARM, manual assessment of respiratory motion; MEP, maximal expiratory pressure; MIP, maximal inspiratory pressure; NPRS, numeric pain rating scale; SEBQ, self-evaluation of breathing questionnaire. * p < 0.05, ** p < 0.01.
Table 4.
The multiple regression analysis between variables.
| Dependent variable |
Independent variable |
Unstandardized coefficients |
Standardized coefficients |
t (p) | F | R2 | |
|---|---|---|---|---|---|---|---|
| B | SE | β | |||||
| Multiple regression analysis between variables: CSI-K (≥ 40 points) (n = 40) | |||||||
| MARM; area | (constant) | -75.530 | 24.717 | -3.056 (0.004) | 20.428* | 0.525 | |
| MARM; average | 1.116 | 0.219 | 0.578 | 5.100 (0.000) | |||
| K-PCS | -0.651 | 0.178 | -0.415 | -3.658 (0.001) | |||
| K-PCS | (constant) | 15.522 | 24.717 | 3.381 (0.002) | 20.428* | 0.525 | |
| MARM; area | -0.235 | 0.081 | -0.369 | -2.898 (0.006) | |||
| SEBQ | 0.479 | 0.128 | 0.476 | 3.735 (0.001) | |||
| Subanalysis; Multiple regression analysis between variables: MARM; average (≥ 100 degrees) (n = 33) | |||||||
| NPRS; usual pain | (constant) | -1.012 | 0.621 | -1.629 (0.114) | 29.624* | 0.664 | |
| NPRS; worst pain | 0.678 | 0.123 | 0.647 | 5.498 (0.000) | |||
| K-PCS | 0.037 | 0.015 | 0.288 | 2.452 (0.020) | |||
| K-PCS | (constant) | 22.527 | 5.657 | 3.982 (0.000) | 19.388* | 0.564 | |
| MARM; area | -0.357 | 0.094 | -0.476 | -3.794 (0.001) | |||
| SEBQ | 0.454 | 0.123 | 0.463 | 3.693 (0.001) | |||
| Sub-analysis; Multiple regression analysis between variables: NPRS; usual pain (≥ 4 points) (n = 17) | |||||||
| MARM; area | (constant) | -95.780 | 33.026 | -2.900 (0.012) | 8.756* | 0.556 | |
| MARM; average | 0.779 | 0.271 | 0.513 | 2.877 (0.012) | |||
| MEP | 0.560 | 0.188 | 0.531 | 2.978 (0.010) | |||
| Muscle Stiffness | (constant) | -201.736 | 29.960 | -6.734 (0.000) | 195.627* | 0.978 | |
| CSI-K | 1.210 | 0.542 | 0.124 | 2.233 (0.044) | |||
| K-PCS | 0.583 | 0.250 | 0.132 | 2.329 (0.037) | |||
| Muscle Tone | 27.883 | 1.489 | 0.861 | 18.731 (0.000) | |||
CSI-K, central sensitization inventory-Korean version; K-PCS, Korean-pain catastrophizing scale; MARM, manual assessment of respiratory motion; MEP, maximal expiratory pressure; NPRS, numeric pain rating scale; SEBQ, self-evaluation of breathing questionnaire. * p < 0.05.
Disclaimer/Publisher’s Note: The statements, opinions and data contained in all publications are solely those of the individual author(s) and contributor(s) and not of MDPI and/or the editor(s). MDPI and/or the editor(s) disclaim responsibility for any injury to people or property resulting from any ideas, methods, instructions or products referred to in the content. |
© 2024 by the authors. Licensee MDPI, Basel, Switzerland. This article is an open access article distributed under the terms and conditions of the Creative Commons Attribution (CC BY) license (http://creativecommons.org/licenses/by/4.0/).
Copyright: This open access article is published under a Creative Commons CC BY 4.0 license, which permit the free download, distribution, and reuse, provided that the author and preprint are cited in any reuse.


