Submitted:
01 January 2025
Posted:
06 January 2025
You are already at the latest version
Abstract
In order to study the effect of high-temperature and high-pressure CO2 on the physical properties of deep volcanic rock reservoirs in the southern Songliao Basin, a closed-system temperature and pressure co-controlled solution reaction simulation method was used to simulate formation temperatures (120°C, 130°C, 140°C) and formation pressures (20MPa, 40MPa, 60MPa) conditions, 12 groups of supercritical CO2-solution reaction experiments were carried out. The pore characteristics of the reservoir rock samples before and after the reaction were analyzed using QEMSCAN and scanning electron microscopy to determine the modification of reservoir properties and ionic changes in CO2-aqueous solutions due to the solution reaction after CO2 injection into deep volcanic reservoirs. The experimental results show that the solution reaction reaches equilibrium after 96 hours. Supercritical CO2 has different dissolution effects on rock samples at different temperatures and pressures, with a maximum dissolution rate of 0.2803g and a maximum increase in porosity of 5.18%. Supercritical CO2 dissolved in water forms an acidic environment that has a strong acid etching and remolding effect on rock samples, indicating that the high-temperature, high-pressure supercritical CO2-solution reaction is initially dominated by calcite dissolution, followed by dolomite and feldspar minerals dissolve slowly, and quartz minerals are not significantly altered. This experiment shows that selecting representative samples to carry out simulated solution reaction experiments under deep formation conditions is an effective and scientific reservoir modification method. In the current context of high cost, high risk, and high investment in deep oil and gas exploration, the results of the high temperature and high-pressure supercritical CO2-solution reaction experiment have essential reference value for the next step of deep reservoir exploration and development.
Keywords:
CO2
; Solution reaction
; Ion analysis
; Volcanic gas reservoirs
1. Introduction
The research area is located on the central uplift belt in the southern Songliao Basin, adjacent to the hydrocarbon-producing trough. The Yingcheng Formation volcanic rock structural gas reservoir combines generation, storage, and cover. The hydrocarbon generation timing matches well with the period of structural formation, so it has good potential for exploration and development [1,2]. The upper strata of the Yingcheng Formation are composed of large sections of tuff (locally containing gravel), while the middle and lower strata are composed of large sections of rhyolite, with local thin sections of tuff, in situ dissolved breccia and volcanic breccia. The reservoir thickness is 206~374 m, and the gas-measure porosity is generally 5~9%, with an average of 7.3%, with the characteristics of deep burial, high temperature and high pressure, dense reservoir, low porosity and permeability, and strong heterogeneity. The reservoir lithology is mainly composed of silt and fine sandstone. The rock minerals are highly mature, with quartz accounting for 28~40%, feldspar 27~31%, and debris 29~35%. The main component of the debris is volcanic rock particles with a particle size of 0.25~0.5 mm. The degree of weathering is moderate, the sorting is good, and the rounding is sub-prismatic to sub-rounded. Quartz is highly developed, calcite and iron-containing calcite are pore-type cementation, and the distribution is relatively uniform. Individual debris has been completely replaced. The reservoir stimulation and reconstruction process is complex, so research on the dissolution and reconstruction of the reservoir by supercritical CO2 is particularly important [3,4,5,6].
Supercritical CO2 generally refers to the condition where the temperature exceeds 31.6°C and the pressure exceeds 7.29 MPa (Figure 1). CO2 is in a supercritical state, with high density (approximately 0.7 g/ml) and low viscosity. CO2 injected underground dissolves in water, reducing the pH of the formation water, releasing H+ ions, and causing a variety of minerals in the rock to dissolve, thereby affecting the composition of the formation water and, to a certain extent, changing the rock’s porosity. At present, most scholars’ research focuses on the geochemical reactions between CO2, water, sandstone reservoirs, and carbonate reservoirs. Many CO2-solution reaction experiments have been carried out, such as Wigand et al. [3,7,8,9,10,11,12,13,14,15], who carried out CO2-solution reaction experiments on sandstone under different temperature and pressure conditions, and combined scanning electron microscopy, cast thin sections, whole rock diffraction, and other analytical testing methods to confirm that that dissolution is an essential factor in improving reservoir quality, and revealed the impact of CO2 flooding on the gas storage process of tight sandstone reservoirs. Egermann et al. [16,17,18,19,20,21,22] carried out experiments on the water-rock reaction of carbonate rocks, and most of the experiments reproduced the interaction process between carbonate rocks and acidic CO2 solutions dissolved in water under the temperature and pressure of natural reservoirs, enhancing the understanding of the effect of reservoir dissolution and modification. The results of many studies show that CO2-solution reactions can improve the conditions of oil and gas reservoirs. However, there have been relatively few studies on the supercritical CO2-solution interactions in volcanic rock reservoirs. Zhao Yue et al. [1,2,23]. believe that the primary pores formed after volcanic rock cooling are less affected by destructive diagenesis, and their physical properties do not change with burial depth. Compared with other types of reservoirs, the storage capacity of volcanic rock pays more attention to the formation of secondary pores. In different regions, the reservoir environment and fluid properties are different, so the results of solution simulation experiments all have certain limitations, and it is still difficult to gain a more comprehensive understanding. Based on this research status, this paper selects the core of the Yingcheng Formation from wells C1-2 and C103 in the study area as the experimental material, designs an experimental scheme for the interaction of supercritical CO2-solution under high temperature and high pressure, and reveals the modification law of the supercritical CO2 fluid on the reservoir under different temperatures and pressures, providing a theoretical basis for the next step of deep reservoir exploration and development.
2. Experimental Sample and Experimental Method
2.1. Experimental Sample
The experimental samples were collected from the volcanic rock reservoir of the Yingcheng Formation in the southern Songliao Basin. The average length was 5.27 cm, the average diameter was 2.53 cm, and the average porosity was 6.54% (Table 1). A standard small rock column was reprocessed into a rock sample with a diameter of 25 mm and a thickness of 2 mm using a core wire cutting instrument. Some of the samples were scanned using a QemScan650F instrument to determine the types of elements and mineral distribution. The primary mineral is quartz, followed by potassium feldspar and plagioclase, with a small amount of visible calcite and clay minerals (Figure 2).
2.2. Laboratory Equipment
A high-temperature, high-pressure reactor was used for a simulated solution reaction experiment (experimental temperature range 120–140°C, pressure 20–40 MPa) (Figure 3). The surface of the mineral sample was observed using a JSM-6700F scanning electron microscope, the reaction solution was analyzed using an intelligent ion chromatograph, and the pH of the solution after the reaction was measured using a PHS-3C pH meter [24].
2.3. Experimental Process
2.3.1. Subsubsection
According to the actual formation water data of the Yingcheng Formation in the study area, a simulated formation water solution was configured (Figure 2 and Figure 3). The experimental formation water salinity (DTS) average was 33418.47 mg/L.

Table 2.
Stratigraphic water analysis results of Yingcheng Formation in wells C1-2 and C103.
| Sample | Na+ | K+ | Mg2+ | Ca2+ | Cationic total | pH |
| C1-2 | 6695.44 | 2134.42 | 10.44 | 25.93 | 8866.24 | 7.29 |
| C103 | 6836.09 | 1973.89 | 7.65 | 14.54 | 8832.17 | 7.4 |
| Sample | Cl- | SO42- | HCO3- | CO32- | Anionic total | Water-based |
| C1-2 | 3594.99 | 324.03 | 17526.21 | 812.22 | 22257.45 | NaHCO3 |
| C103 | 2999.76 | 575.9 | 17579.07 | 654.36 | 21758.06 | NaHCO3 |
Table 3.
Simulated formation of aqueous solution ion mass concentration.
| Na+ | K+ | Mg2+ | Ca2+ | Cationic total | pH | |
| Simulated groundwater | 6925.25 | 2028.27 | 21.3319 | 14.9311 | 8989.783 | 7.34 |
| Cl- | SO42- | HCO3- | CO32- | Anionic total | Water-based | |
| Simulated groundwater | 2407.23 | 398.307 | 21044.78 | 735.12 | 23850.32 | NaHCO3 |
2.3.2. Design of a Solution Reaction Experiment
The quality of the rock sample, porosity, and simulated formation water solution ion mass concentration changes before and after the solution reaction were compared. Supercritical CO2-solution reaction simulation experiments were carried out at different temperatures of 120°C, 130°C, and 140°C and different experimental pressures of 20 MPa, 40 MPa, and 60 MPa, using the same solution ratio after adding simulated formation water solution and injecting CO2 into a high-temperature and high-pressure reactor (Table 4).
The specific steps are as follows:
1) Wash and dry the rock samples, and cut each natural core into 2-5 mm thick core slices with a diameter of 25 mm;
2) Crush one of the rock samples to test the reaction equilibrium time;
3) Configure the experimental reaction solution based on the actual formation water analysis test data;
4) After weighing the experimental rock sample, the same water-to-rock ratio (2:1) was used to place it in a high-temperature, high-pressure reactor. The lid was tightened, and the gas in the reactor was removed with a vacuum pump.
5) The reactor was placed in a rising oven and adjusted to the experimental temperature.
6) CO2 is injected into the reaction vessel through a gas compression pump while the heating box is swung back and forth to ensure that the three-phase substances of CO2, simulated formation water, and rock sample in the reaction vessel are in complete contact and the start time of the solution reaction is recorded;
7) the experimental temperature is changed to 120°C, 130°C, and 140°C, respectively, and step 6 is repeated;
8) the experimental pressure is changed to 20 MPa, 40 MPa, and 60 MPa, respectively, and step 6 is repeated;
9) After the reaction has reached the predetermined time, turn off the heating switch. After the temperature in the reaction vessel has returned to room temperature, open the pressure control valve to release the pressure. After the pressure has been released, open the reaction vessel, filter and collect the solution, and take out the rock sample.
10) Place the rock sample in a drying oven at 105°C for 6 hours and weigh it again.
11) Compare the chemical composition of the collected filtrate with that of the configured formation solution to analyze the change in the anion and cation concentrations of the solution.
3. Analysis of Experimental Results
3.1. Experimental Response Equilibrium Time Determination
In order to reduce experimental error, four sets of parallel experiments were set up. The temperature of the experiment was 130°C, and the pressure was 40 MPa. The mass of the rock powder was weighed every 24 hours. Multiple experiments have shown that the dissolution of volcanic rock powder reaches equilibrium after 96 hours. As shown in Figure 4, as the reaction time between water and rock increases, the amount of volcanic rock powder dissolved also increases, but the rate slows down and tends to stabilize. Before 72 hours, the dissolution rate was relatively fast, after which it slowed down. The amount of dissolution at the 96th and 120th hour was the same, and the reaction reached equilibrium.
From the analysis of the ionic mass concentration of the solution after the reaction (Figure 5), it can be seen that the content of Mg2+ and Ca2+ in the solution increases with time. At about 48 hours, Mg2+ reaches equilibrium; at about 96 hours, Ca2+ reaches equilibrium. K+ is still increasing and shows no signs of slowing down. Combined with the mineral composition of the rock sample, quartz (SiO2) does not participate in the reaction. Among the feldspar minerals, potassium feldspar (KAlSi3O8) has the highest content, followed by sodium feldspar (NaAlSi3O8). The carbonate mineral is mainly calcite (CaCO3). According to the QuemScan results, the dolomite (CaMg(CO3)2) content in the rock sample is low, followed by calcite, and potassium feldspar has the highest content.
During the water rock reaction process, dolomite dissolution is basically balanced after 48 hours, and calcite dissolution is basically balanced after 96 hours. It is worth noting that Mg2+ and Ca2+ show a decreasing trend after reaching their peaks, which may be due to the combined effects of the gradual shift of the reaction environment to weakly acidic conditions during the dissolution of feldspar minerals and the control of ionic effects. According to previous research, the reaction process of feldspar minerals is slow, and it takes several months or years for a complete reaction [25]. Therefore, the reaction time for this solution reaction experiment was set to 96 h.
3.2. Variations in the Mass Concentration of Ions and pH Value of Groundwater
3.2.1. The Influence of Different Experimental Pressures on the Solution Reaction
When the temperature is constant at 130°C and the reaction time is 96 hours, the amount of rock dissolution and the change in porosity are generally positively correlated with the pressure in the reaction kettle (Table 5). The greater the pressure in the reaction kettle, the more CO2 is dissolved in the formation water, and the CO2 aqueous solution is strongly acidic, with a pH of 3.07–3.26, and can dissolve unstable minerals in volcanic rock. The average dissolution of the rock sample after the reaction was 0.2349 g, and the average increase in porosity was 4.49%.
The concentration of each ion shows some differences and, in general, is positively correlated with pressure. Mg2+, Ca2+, and K+ come from dolomite, calcite, and potassium feldspar. As shown in Figure 6, the dissolution intensity increases with increasing reaction pressure. For every 20 MPa increase in reaction pressure, the growth rate of K+ does not change significantly. For Mg2+, at P=20 MPa, the average mass concentration is 26.76 mg/L; at P=40MPa, the average mass concentration is 33.06 mg/L; and at P=60MPa, the average mass concentration is 51.53 mg/L. The main growth range is from 40MPa to 60MPa, which is 2.93 times that from 20MPa to 40MPa. Similarly, the average mass concentration of Ca2+ is 46.95 mg/L at P = 20 MPa, 93.11 mg/L at P = 40 MPa, and 122.28 mg/L at P = 60 MPa. The main growth interval is from 20 MPa to 40 MPa, and the growth rate is 1.58 times that from 40MPa to 60MPa, indicating that in the same acidic environment, calcite is more likely to react with acid than dolomite. As the reaction progresses, calcite and dolomite reach an equilibrium state in a weak acid environment. Feldspar minerals remain unsaturated throughout the entire reaction process, and the reaction continues, so the growth of K+ does not stop.
3.2.2. The Influence of Different Experimental Temperatures on the Water Rock Reaction
When the pressure in the reaction vessel is kept constant at 40 MPa and the reaction time is 96 h, the amount of rock dissolution and the change in porosity is generally negatively correlated with the reaction temperature. On the one hand, an increase in reaction temperature will reduce the solubility of CO2 in the solution and, on the other hand, increase the exchange rate of ions in the reaction solution, thereby reducing the effect of ions. As can be seen from Table 6, the amount of rock dissolution gradually decreases with increasing reaction temperature. When T = 120 °C, the average amount of rock dissolution is 0.2692 g; when T = 140 °C, the average amount of rock dissolution is 0.2257 g, a decrease of 16.12%.
The composition of different rock samples also varies. The mass concentrations of Mg2+, Ca2+, and K+ increase with the reaction temperature, but the change in ion concentration is negatively correlated with the reaction temperature. As can be seen from Figure 7, an increase in reaction temperature does not affect the reaction process of the solution reaction. When the temperature increases from 130°C to 140°C, the growth rate of the K+ mass concentration decreases from 2.71% to 1.78%, the growth rate of the Mg2+ mass concentration decreases from 10.71% to 9.18%, and the growth rate of Ca2+ mass concentration decreased from 25.92% to 5.45%, indicating that the inhibition effect of calcite dissolution is apparent when the reaction temperature increases and the inhibition effect on the dissolution of dolomite and feldspar minerals is relatively weak.
3.3. Variations in the Microscopic Surface Features of Rock Samples
Combined with scanning electron microscope (SEM) observations, it was found that under the high temperature and high-pressure experimental conditions, the rock surface experienced different degrees of dissolution, with a significant increase in dissolution and the generation of secondary pores. The main rock components that reacted were unstable minerals (potassium feldspar, sodium feldspar, calcite, dolomite, and clay minerals). The main manifestations of the solution reaction are the dissolution of calcite, dolomite, and feldspar mineral particles, the formation of dissolution pores (pits) on the surface or concentrated dissolution along the joint direction, and selective dissolution of clay minerals depending on their mineral composition. As shown in Figure 8, before the experiment, the calcite crystals in the rock sample had smooth surfaces and distinct edges and corners (Figure 8a,c). After the reaction, the calcite crystals had dissolution holes (pits) on the surface and apparent dissolution at the edges (Figure 8b,d). The potassium feldspar rock reacted and dissolved, forming a large number of dissolution pits, and the edges of the particles were concave-convex or harbour-like (Figure 8e,f).
4. Discussion
4.1. Analysis of Dissolution Mechanism
Under high temperature and high pressure, CO2 gas is injected into simulated formation water to form a CO2 solution with strong solubilization and transformation capabilities. This experiment compares the results with previous experiments and fills the gap in the supercritical CO2-water-volcanic rock sample water reaction at high temperature and pressure. The dissolved minerals in the solution reaction are unstable mineral components (calcite, dolomite, potassium feldspar, and clay minerals) in the rock sample. Under the high-temperature and high-pressure experimental conditions, CO2 gas is mixed with the simulated stratum water solution in a supercritical state, dissociating H+ (Table 7), which changes the original acid-base equilibrium environment and causes the pH of the reaction system to decrease.
The change in the dry weight of the rock sample before and after the reaction in the research area indicates that mineral components such as potassium feldspar, calcite, and dolomite in the rock sample were consumed during the solution reaction, which improved the porosity of the rock sample. The high-pressure environment during the reaction, on the one hand, increased the solubility of CO2 in the simulated formation water solution and, on the other hand, inhibited the transformation of clay minerals, increasing the contact time and dissolution intensity of easily soluble minerals; the high temperature and high mineralized formation water environment during the reaction was not conducive to the dissolution of CO2, and the solubility of CO2 decreased with the increase of temperature and simulated formation water mineralization [26] (Figure 9). The temperature of this experiment was 120~140℃, and the pressure was 20~60MPa, representing the temperature and pressure range of the reservoir buried depth of 3200~4000m in the study area. It can be seen from Figure 6 and Figure 7 that when the pressure is constant, increasing the temperature is not conducive to the dissolution of the volcanic rock sample. When the temperature is constant, the effect of pressure on the reaction between water and rock increases significantly. Among the volcanic rock samples, calcite is the most strongly dissolved among all unstable minerals, followed by dolomite.
4.2. Experimental Geological Significance
The essence of the high-temperature, high-pressure supercritical CO2-solution reaction process is a balance between the physicochemical interactions of minerals and fluids in the system. Simulation experiments have shown that injecting CO2 into deep volcanic rock reservoirs and forming a CO2 solution with formation fluids can dissolve silicate and carbonate minerals in the reservoir rocks, and the deep reservoirs have the ability to develop secondary pores.
The deep volcanic gas reservoir in the southern Songliao Basin has a unique genesis and geological background. The high-temperature and high-pressure environment and the medium-to-high salinity of the formation water in the reservoir are significant features that distinguish it from other oil- and gas-bearing basins. Therefore, in the current high investment, high cost, and high risk in deep oil and gas exploration, conducting solution simulation experiments to remediate deep volcanic rock reservoirs is of great practical significance.
5. Conclusion
High-temperature and high-pressure supercritical CO2-solution sample reaction equilibrium experiments show that the dissolution rate of the unstable minerals in the rock sample is fast for the first 72 hours and then slows down. The solution reaction reaches equilibrium at the 96th hour, and the difference between the rock sample’s dissolution amount and the dissolution amount at the 120th hour is 2.33%;
Quantitative analysis shows that, with the reaction temperature remaining unchanged, the amount of dissolution increases by 20.83% in the range of 20-60 MPa, and the average increase in porosity is 4.49%; with the reaction pressure remaining unchanged, the amount of dissolution decreases by 16.12% in the range of 120-140°C, and the average increase in porosity is 4.27%;
The simulation of the formation water shows that the increase in the mass concentration of Ca2+ comes from the dissolution of calcite minerals, the increase in the mass concentration of Mg2+ comes from the dissolution of dolomite minerals, and the increase in the mass concentration of K+ comes from the dissolution of feldspar minerals. A comparison of the solution reaction before and after shows that the dissolution causes a large number of dissolution pores (pits) on the surface of the mineral crystals, and the edges of the feldspar minerals appear concave-convex or harbor-like;
Selecting representative rock samples to carry out high-temperature and high-pressure supercritical CO2-solution reaction simulation experiments can scientifically and effectively provide evidence of the occurrence of dissolution, which is of great practical significance for reservoir modification of deep volcanic rock reservoirs.
Author Contributions
Methodology, formal analysis, manuscript preparation, S,Z, R.W, W.B; experiment, S.Z, Q.S, J.Z. All authors have read and agreed to the published version of the manuscript.
Funding
Shaanxi Province Key Research and Development Program (Key Industrial Innovation Chain (Group)) “Research and Development and Industrialization Promotion of Small Molecule Recyclable Self-Cleaning Fracturing Fluid (Project No.: 2022ZDLSF07-04)”. Project implementation time: 2022.01~2024.12.
Institutional Review Board Statement
Not applicable.
Informed Consent Statement
Not applicable.
Data Availability Statement
Not applicable.
Conflicts of Interest
The authors declare no conflict of interest.
References
- TAKAYA Y, NAKAMURA K, KATO Y. Dissolution of altered tuffaceous rocks under conditions relevant for CO2 storage. Applied Geochemistry 2015, 58, 78–87. [Google Scholar] [CrossRef]
- ZHAO Y, WU S, CHEN Y, et al. CO2-Water-Rock Interaction and Pore Structure Evolution of the Tight Sandstones of the Quantou Formation, Songliao Basin. Energies, 2022; 15.
- BERTIER P, SWENNEN R, LAENEN B, et al. Experimental identification of CO2-water-rock interactions caused by sequestration of CO2 in Westphalian and Buntsandstein sandstones of the Campine Basin (NE-Belgium). Journal of Geochemical Exploration 2006, 89, 10–14. [Google Scholar] [CrossRef]
- HELLEVANG H, PHAM V T H, AAGAARD P. Kinetic modelling of CO2-water-rock interactions. International Journal of Greenhouse Gas Control 2013, 15, 3–15. [Google Scholar] [CrossRef]
- ZHANG L, ZHANG T, ZHAO Y, et al. A review of interaction mechanisms and microscopic simulation methods for CO2-water-rock system. Petroleum Exploration and Development 2024, 51, 223–238. [Google Scholar] [CrossRef]
- JENSEN G K, S. Weyburn oilfield core assessment investigating cores from pre and post CO2 injection: Determining the impact of CO2 on the reservoir. International Journal of Greenhouse Gas Control 2016, 54, 490–498. [Google Scholar] [CrossRef]
- FARQUHAR S M, PEARCE J K, DAWSON G K W, et al. A fresh approach to investigating CO2 storage: Experimental CO2-water-rock interactions in a low-salinity reservoir system. Chemical Geology 2015, 399, 98–122. [Google Scholar] [CrossRef]
- DOU W, LIN M, JIANG W, et al. Importance of diagenetic heterogeneity in Chang 7 sandstones for modeling CO2-water-rock interactions. International Journal of Greenhouse Gas Control, 2024; 132.
- LI H, XIE L, REN L, et al. Influence of CO2-water-rock interactions on the fracture properties of sandstone from the Triassic Xujiahe Formation, Sichuan Basin. Acta Geophysica 2021, 69, 135–147. [Google Scholar] [CrossRef]
- WANG W, YAN Z, CHEN D, et al. The mechanism of mineral dissolution and its impact on pore evolution of CO2 flooding in tight sandstone: A case study from the Chang 7 member of the Triassic Yanchang formation in the Ordos Basin, China. Geoenergy Science and Engineering, 2024; 235.
- ZUO Q, ZHANG Y, ZHANG M, et al. Numerical Simulation of CO2 Dissolution and Mineralization Storage Considering CO2-Water-Rock Reaction in Aquifers. Acs Omega, 2023.
- LIU D, LI Y, AGARWAL R K. Numerical simulation of long-term storage of CO2 in Yanchang shale reservoir of the Ordos basin in China. Chemical Geology 2016, 440, 288–305. [Google Scholar] [CrossRef]
- WIGAND M, CAREY J W, SCHUTTA H, et al. Geochemical effects of CO2 sequestration in sandstones under simulated in situ conditions of deep saline aquifers. Applied Geochemistry 2008, 23, 2735–2745. [Google Scholar] [CrossRef]
- WANDREY M, FISCHER S, ZEMKE K, et al. Monitoring petrophysical, mineralogical, geochemical and microbiological effects of CO2 exposure - Results of long-term experiments under in situ conditions[C]. 10th International Conference on Greenhouse Gas Control Technologies 2011, 3644-3650.
- KETZER J M, IGLESIAS R, EINLOFT S, et al. Water-rock- CO2 interactions in saline aquifers aimed for carbon dioxide storage: Experimental and numerical modeling studies of the Rio Bonito Formation (Permian), southern Brazil. Applied Geochemistry 2009, 24, 760–767. [Google Scholar] [CrossRef]
- SIQUEIRA T A, IGLESIAS R S, KETZER J M. Carbon dioxide injection in carbonate reservoirs - a review of CO2-water-rock interaction studies. Greenhouse Gases-Science and Technology 2017, 7, 802–816. [Google Scholar] [CrossRef]
- HEINEMANN N, WILKINSON M, HASZELDINE R S, et al. CO2 sequestration in a UK North Sea analogue for geological carbon storage. Geology 2013, 41, 411–414. [Google Scholar]
- AHMAT K, CHENG J, YU Y, et al. CO2-Water-Rock Interactions in Carbonate Formations at the Tazhong Uplift, Tarim Basin, China. Minerals 2022, 12. [Google Scholar] [CrossRef]
- CHEN B, LI Q, TAN Y, ALVI I H. Dissolution and Deformation Characteristics of Limestones Containing Different Calcite and Dolomite Content Induced by CO2-Water-Rock Interaction. Acta Geologica Sinica-English Edition 2023, 97, 956–971. [Google Scholar] [CrossRef]
- CUI G, ZHANG L, TAN C, et al. Injection of supercritical CO2 for geothermal exploitation from sandstone and carbonate reservoirs: CO2-water-rock interactions and their effects. Journal of CO2 Utilization 2017, 20, 113–128. [Google Scholar] [CrossRef]
- WANG T, WANG H, ZHANG F, XU T. Simulation of CO2-water-rock interactions on geologic CO2 sequestration under geological conditions of China. Marine Pollution Bulletin 2013, 76, 307–314. [Google Scholar] [CrossRef] [PubMed]
- EGERMANN P, LENORMAND R. A new methodology to evaluate the impact of localized heterogeneity on petrophysical parameters (kri, Pci) applied to carbonate rocks. Petrophysics 2005, 46, 335–345. [Google Scholar]
- PARK J, CHOI B-Y, LEE M, YANG M. Porosity changes due to analcime in a basaltic tuff from the Janggi Basin, Korea: experimental and geochemical modeling study of CO2-water-rock interactions. Environmental Earth Sciences 2021, 80. [Google Scholar]
- RENDEL P M, WOLFF-BOENISCH D, GAVRIELI I, GANOR J. A novel experimental system for the exploration of CO2-water-rock interactions under conditions relevant to CO2 geological storage. Chemical Engineering Journal 2018, 334, 1206–1213. [Google Scholar] [CrossRef]
- MA B, CAO Y, ZHANG Y, ERIKSSON K A. Role of CO2-water-rock interactions and implications for CO2 sequestration in Eocene deeply buried sandstones in the Bonan Sag, eastern Bohai Bay Basin, China. Chemical Geology, 2020; 541.
- LIN H, FUJII T, TAKISAWA R, et al. Experimental evaluation of interactions in supercritical CO2/water/rock minerals system under geologic CO2 sequestration conditions. Journal of Materials Science 2008, 43, 2307–2315. [Google Scholar] [CrossRef]
- J B C, M S, D C. Magmatic CO2 in natural gases in the Permian Basin,West Texas: identifying the regional source and filling history. Geochem Explor, 2020; 69~70, 59–63.
Figure 1.
CO2 phase diagram.
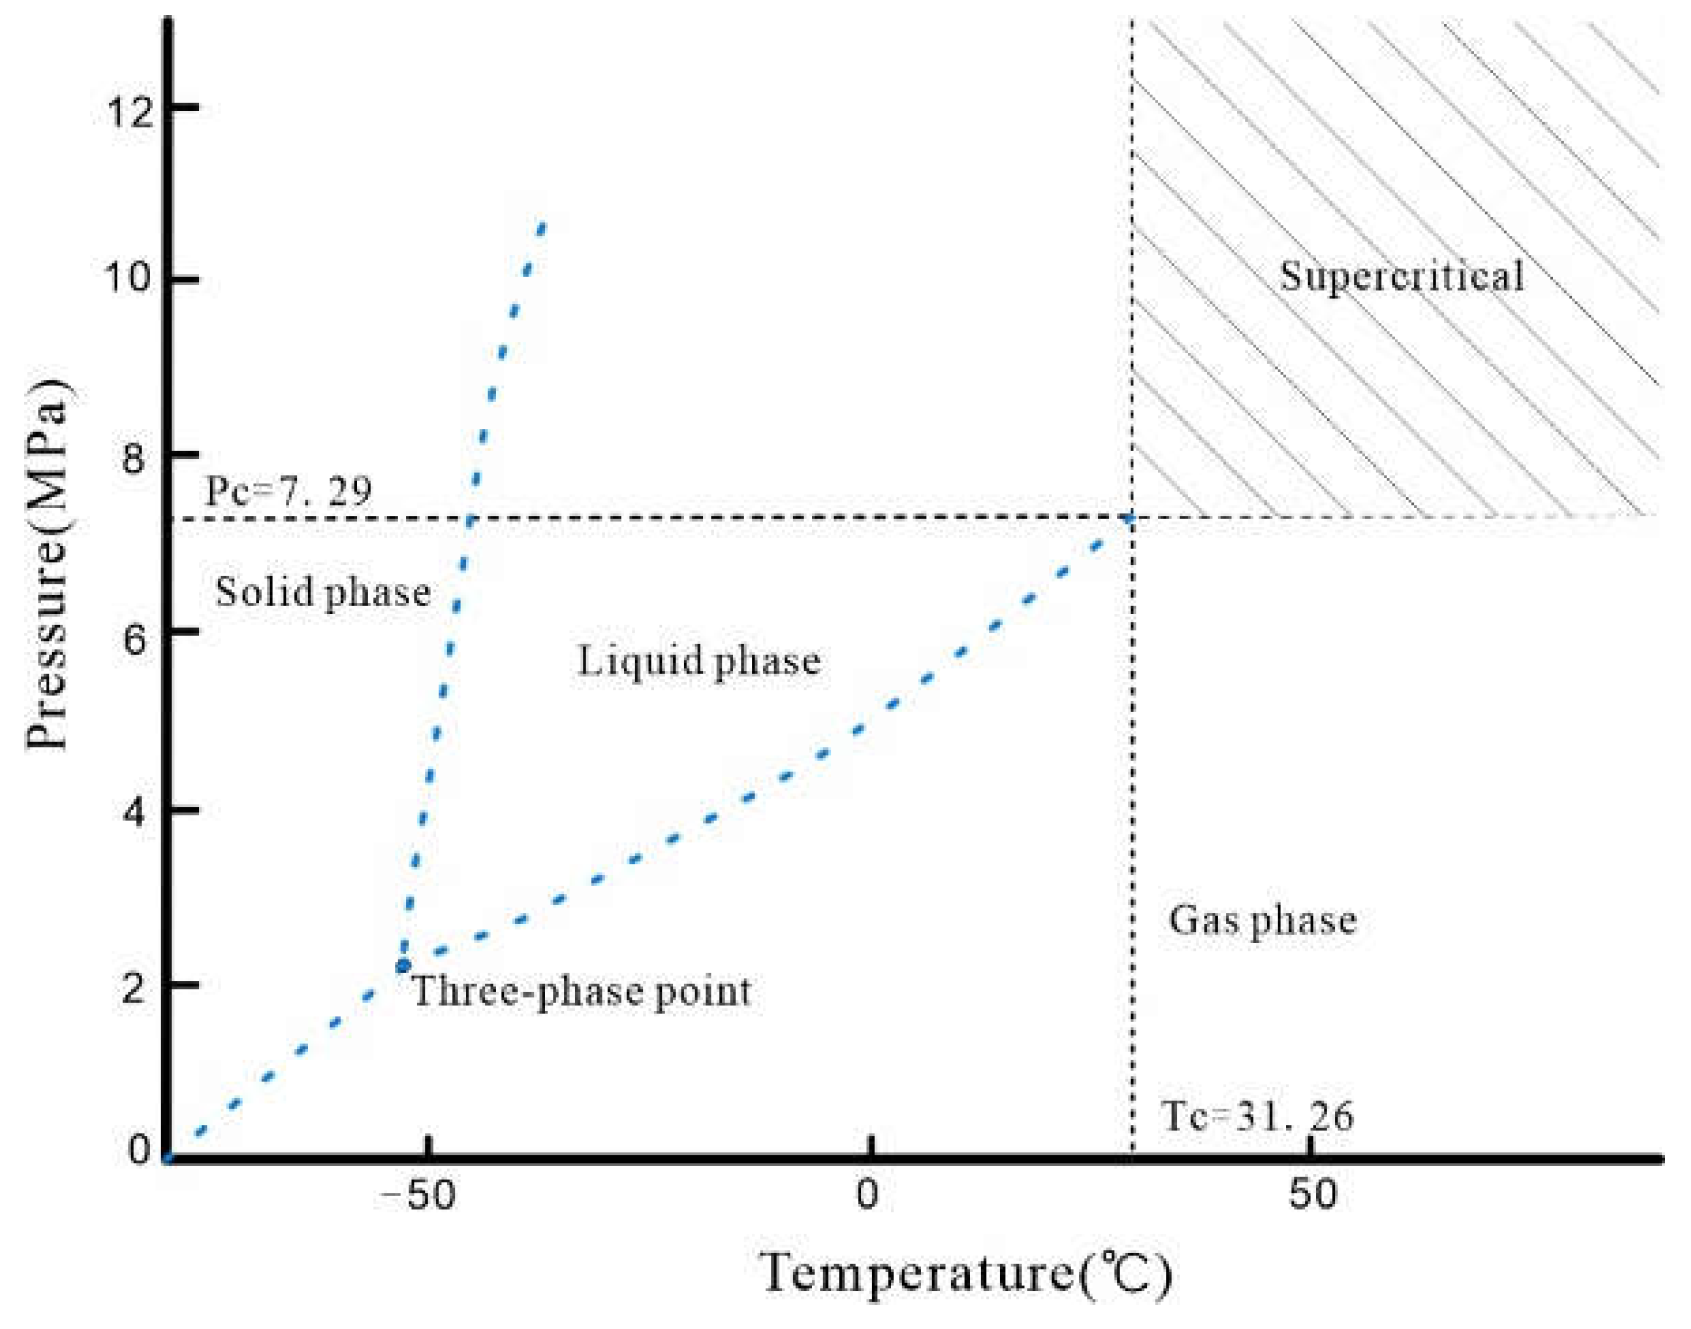
Figure 2.
Mineral scanning imaging result map.
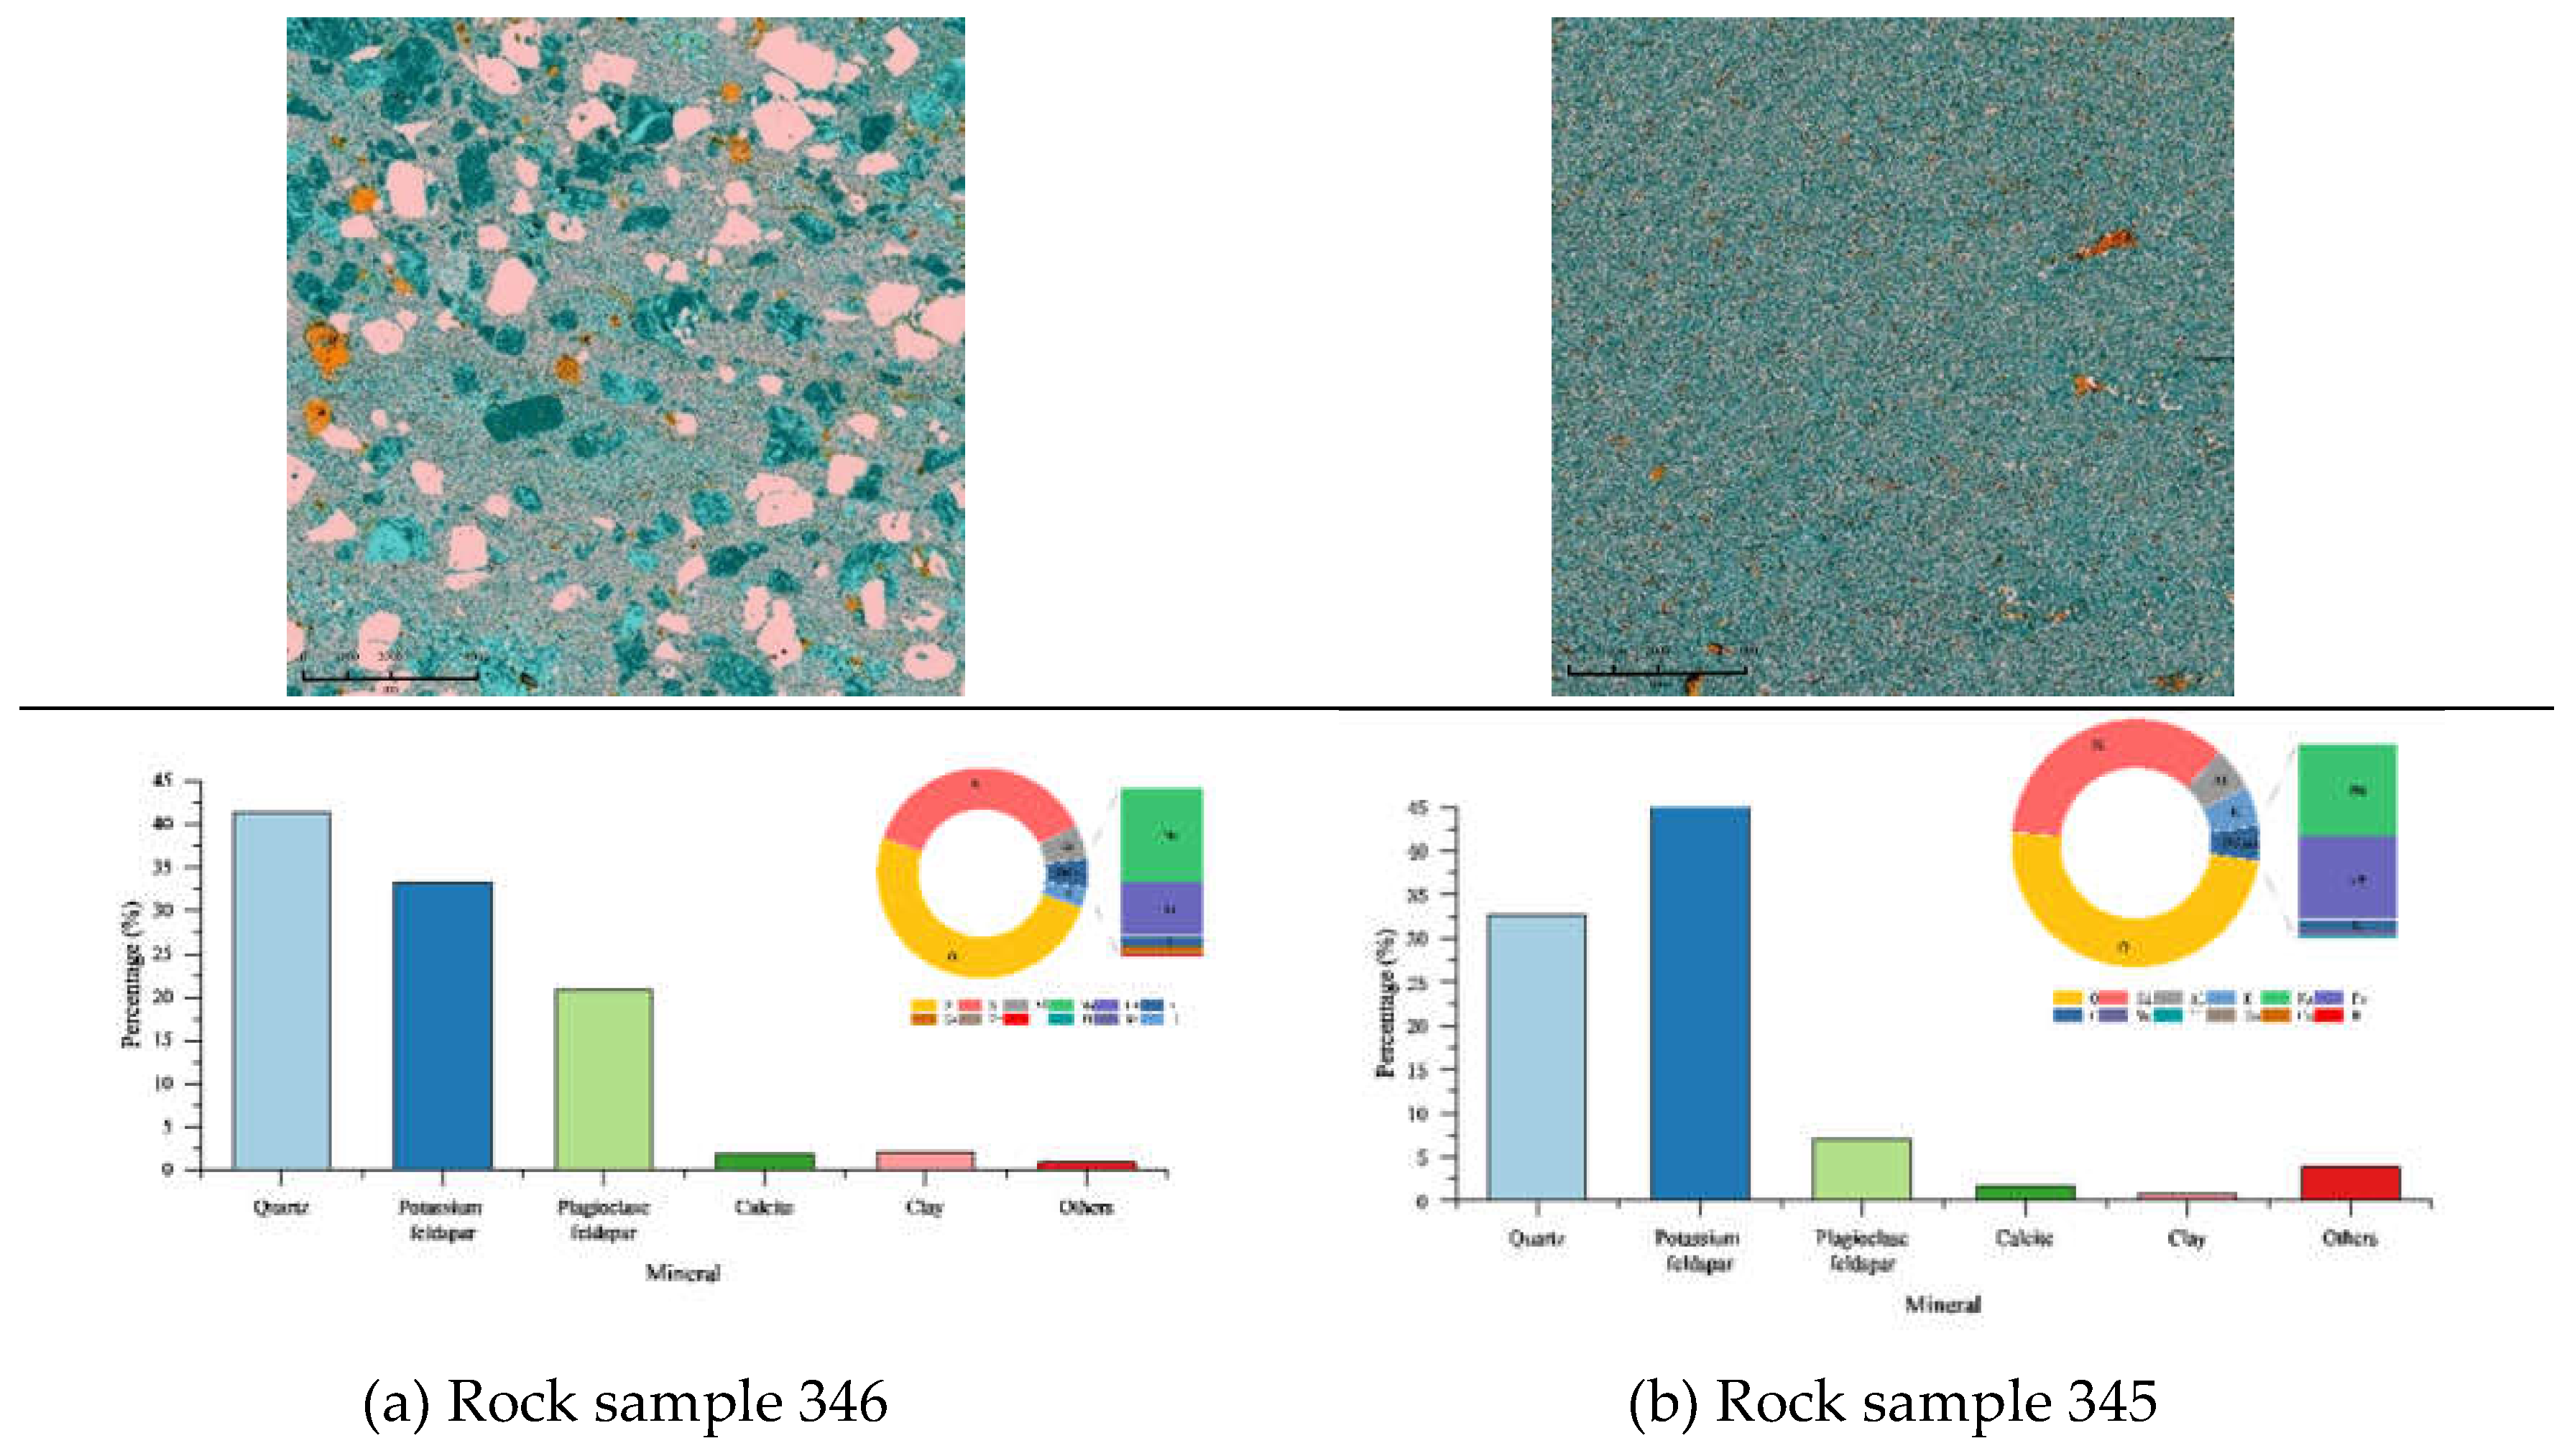
Figure 3.
Schematic diagram of experimental setup of high temperature and high pressure reactor.
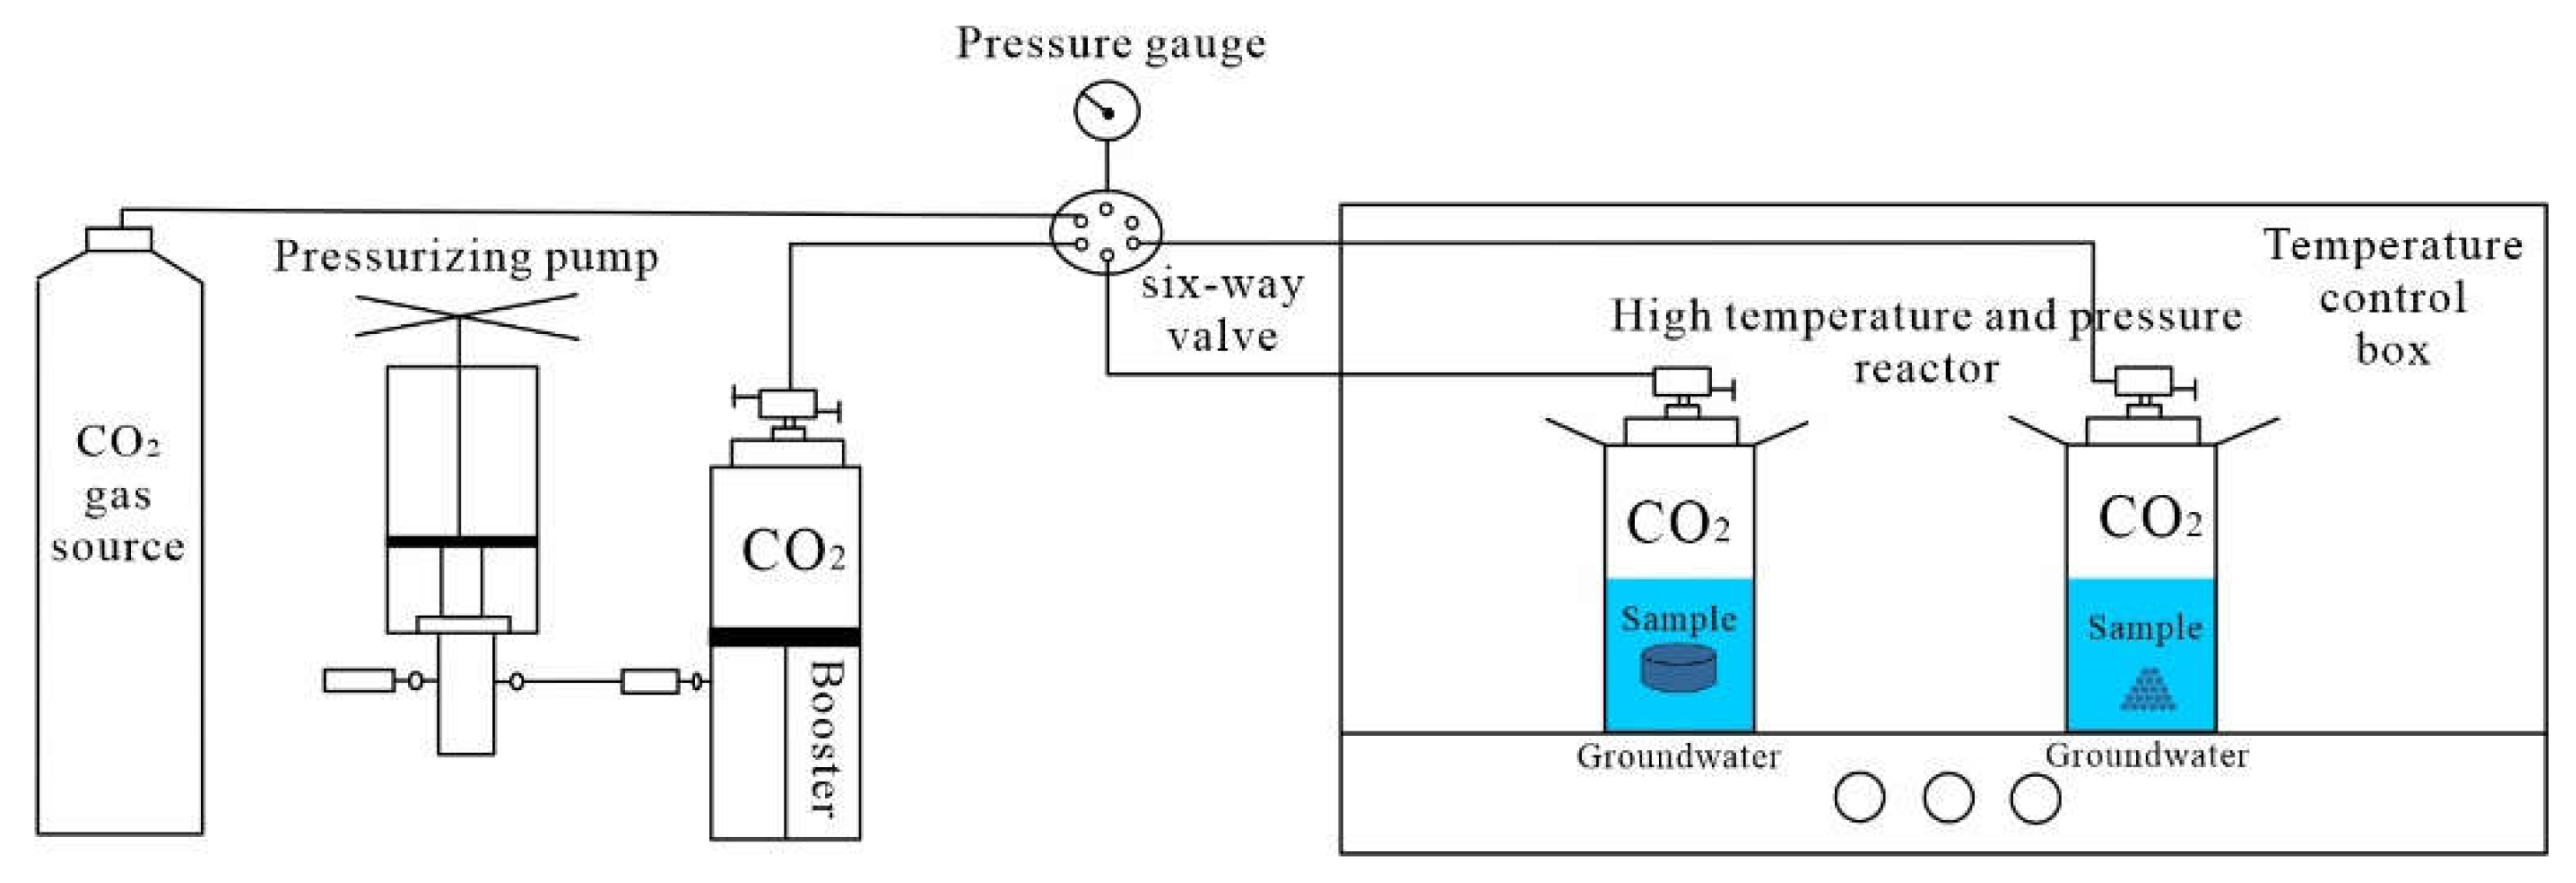
Figure 4.
Volume-temporal relationship of volcanic powder dissolution.
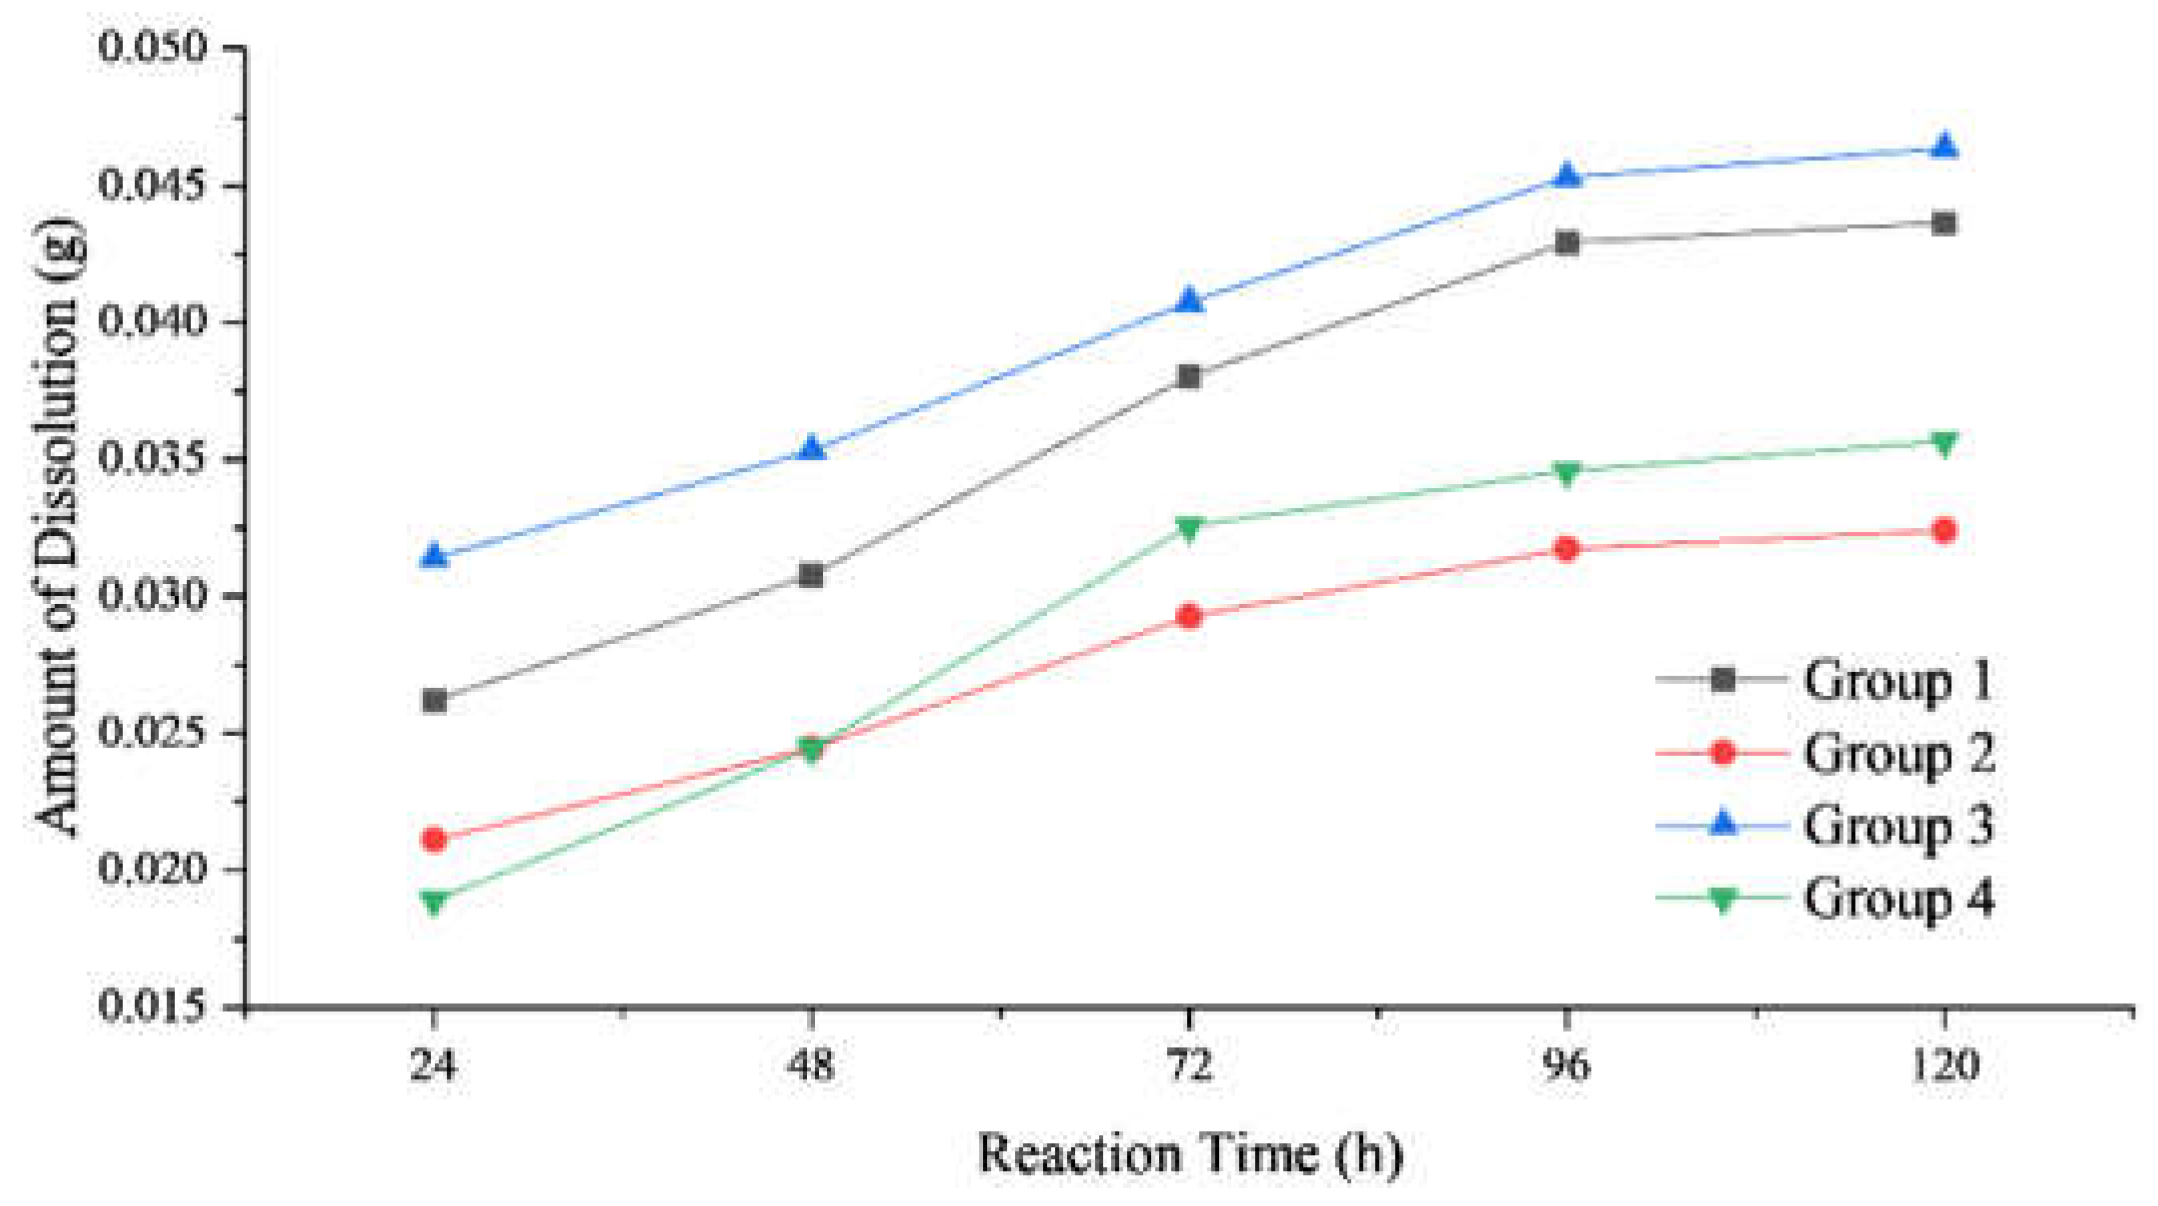
Figure 5.
Ion mass concentration-time relationship in 130°C, 40 MPa system.
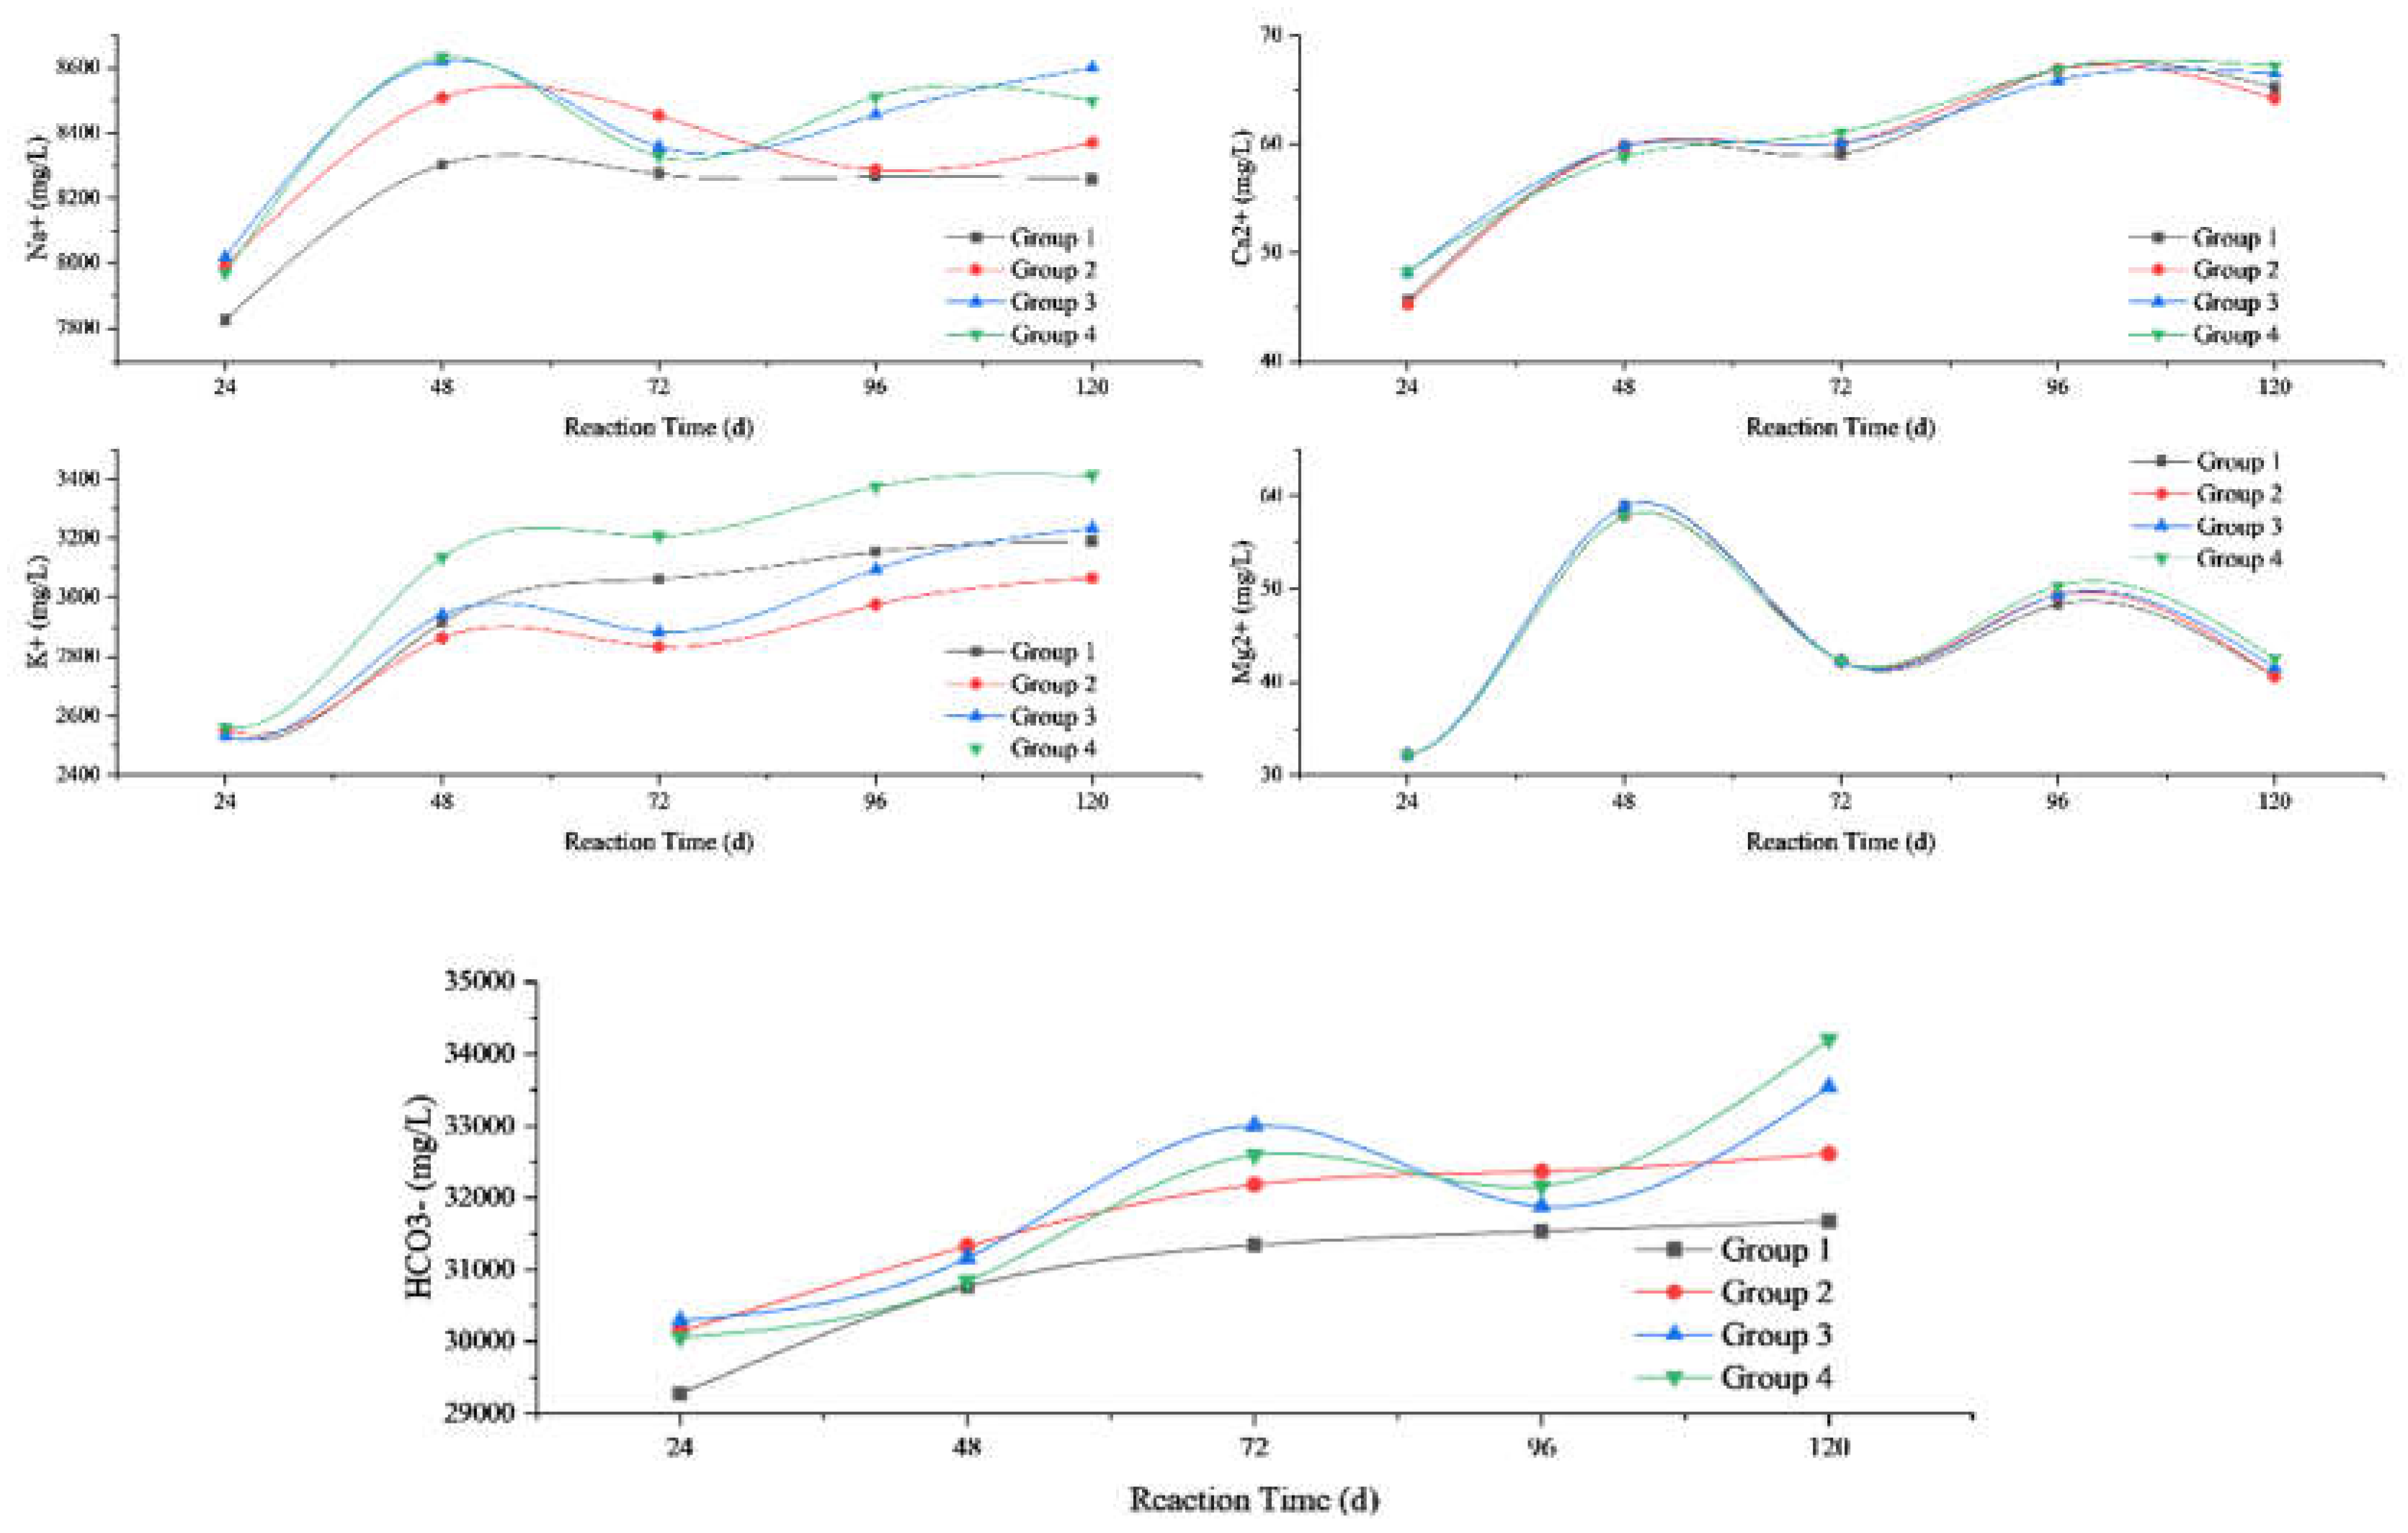
Figure 6.
Relationship between mass concentration of ions in solution after reaction and change in reactor pressure.
Figure 6.
Relationship between mass concentration of ions in solution after reaction and change in reactor pressure.
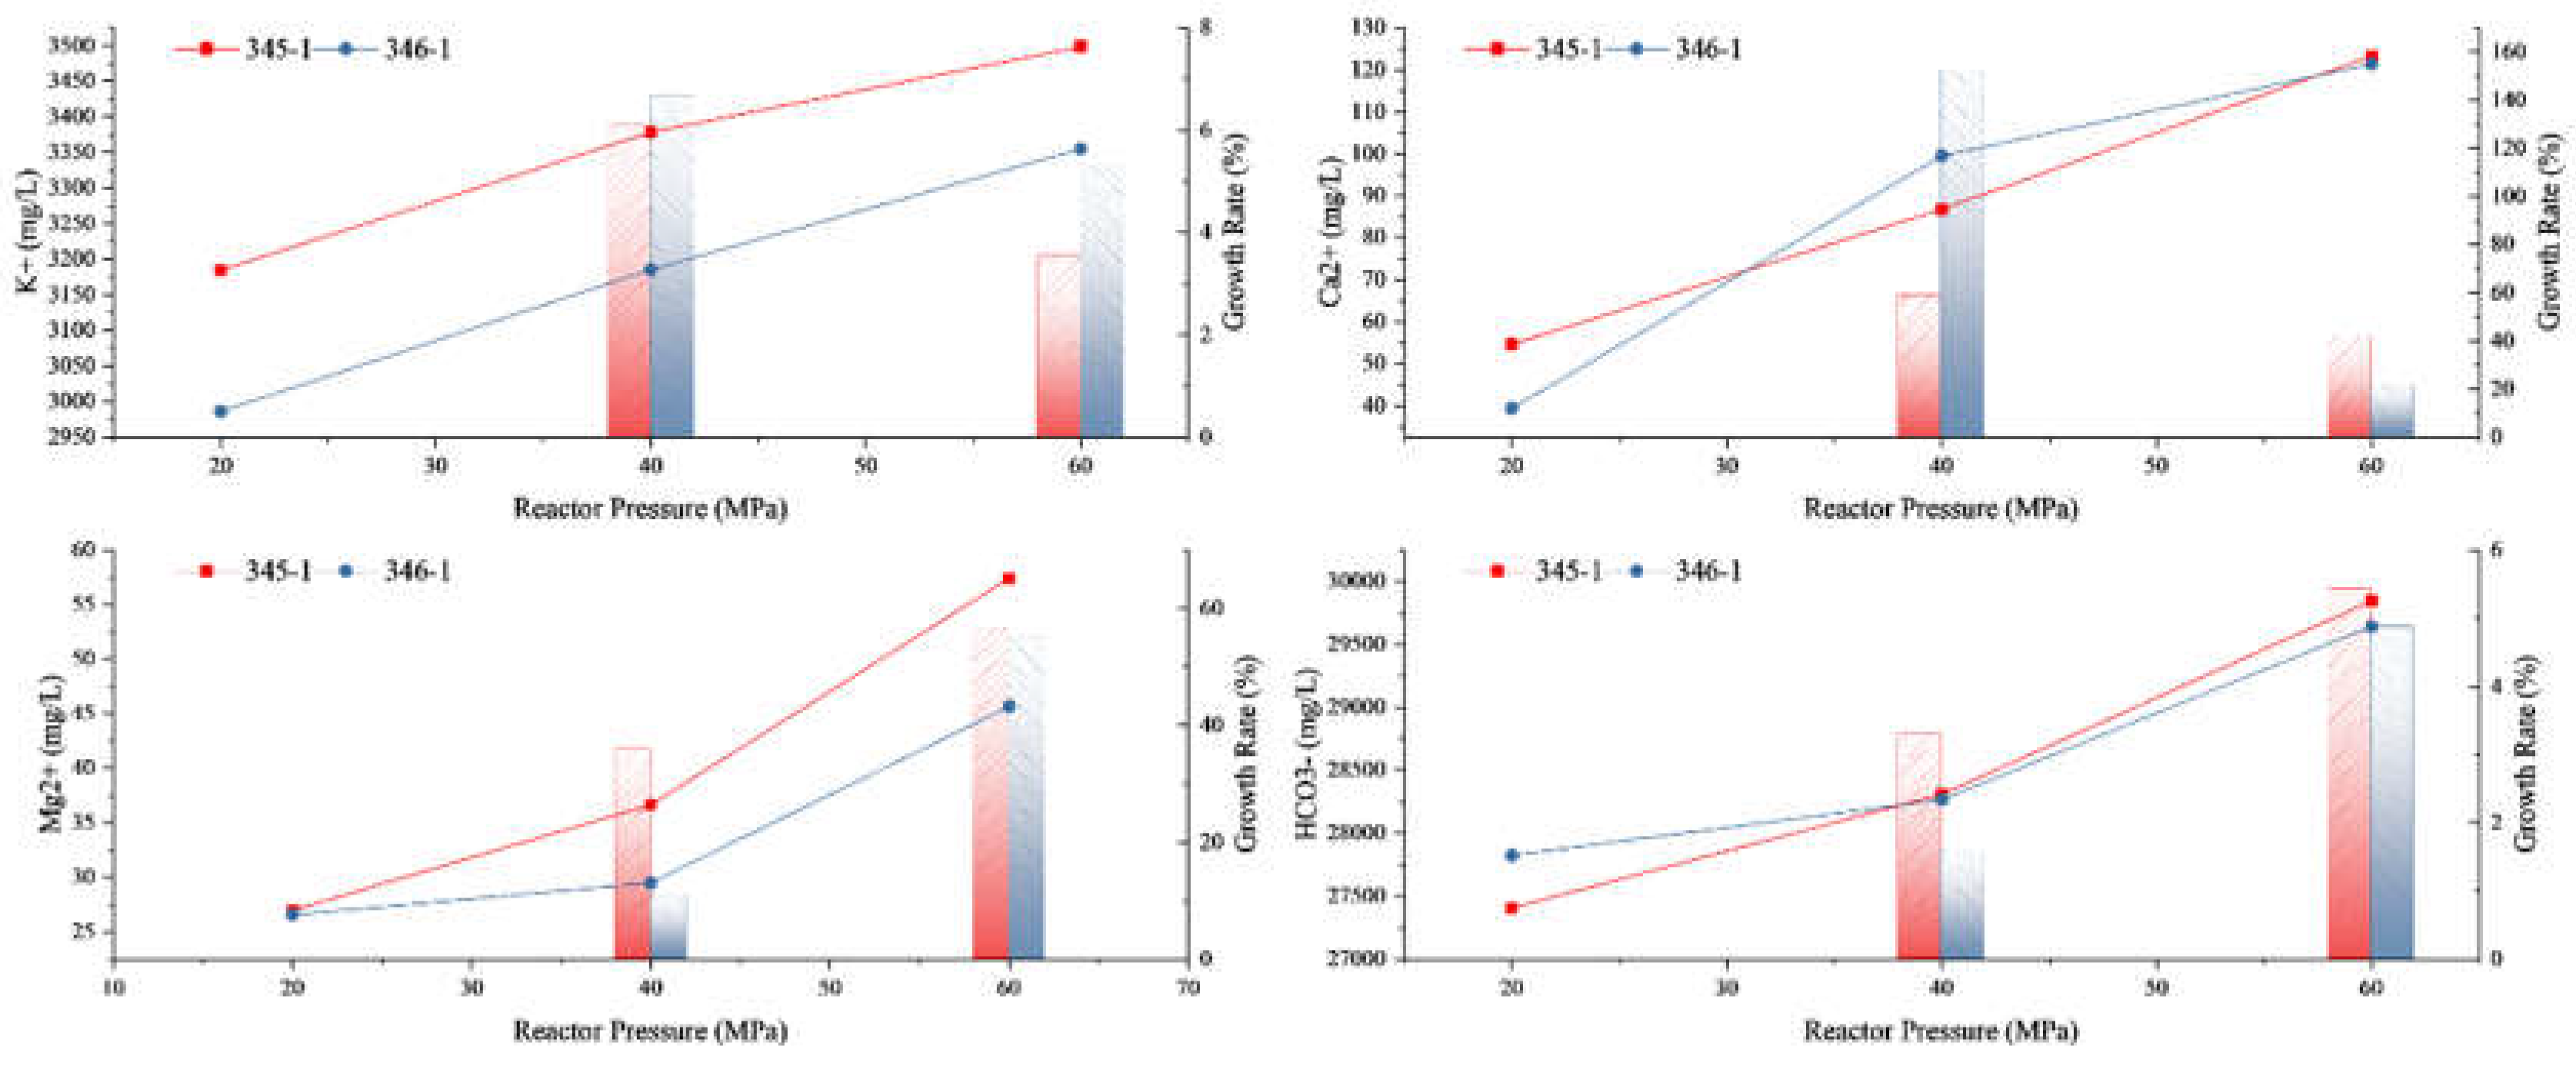
Figure 7.
Plot of ion mass concentration in solution after reaction - reaction temperature variation.
Figure 7.
Plot of ion mass concentration in solution after reaction - reaction temperature variation.
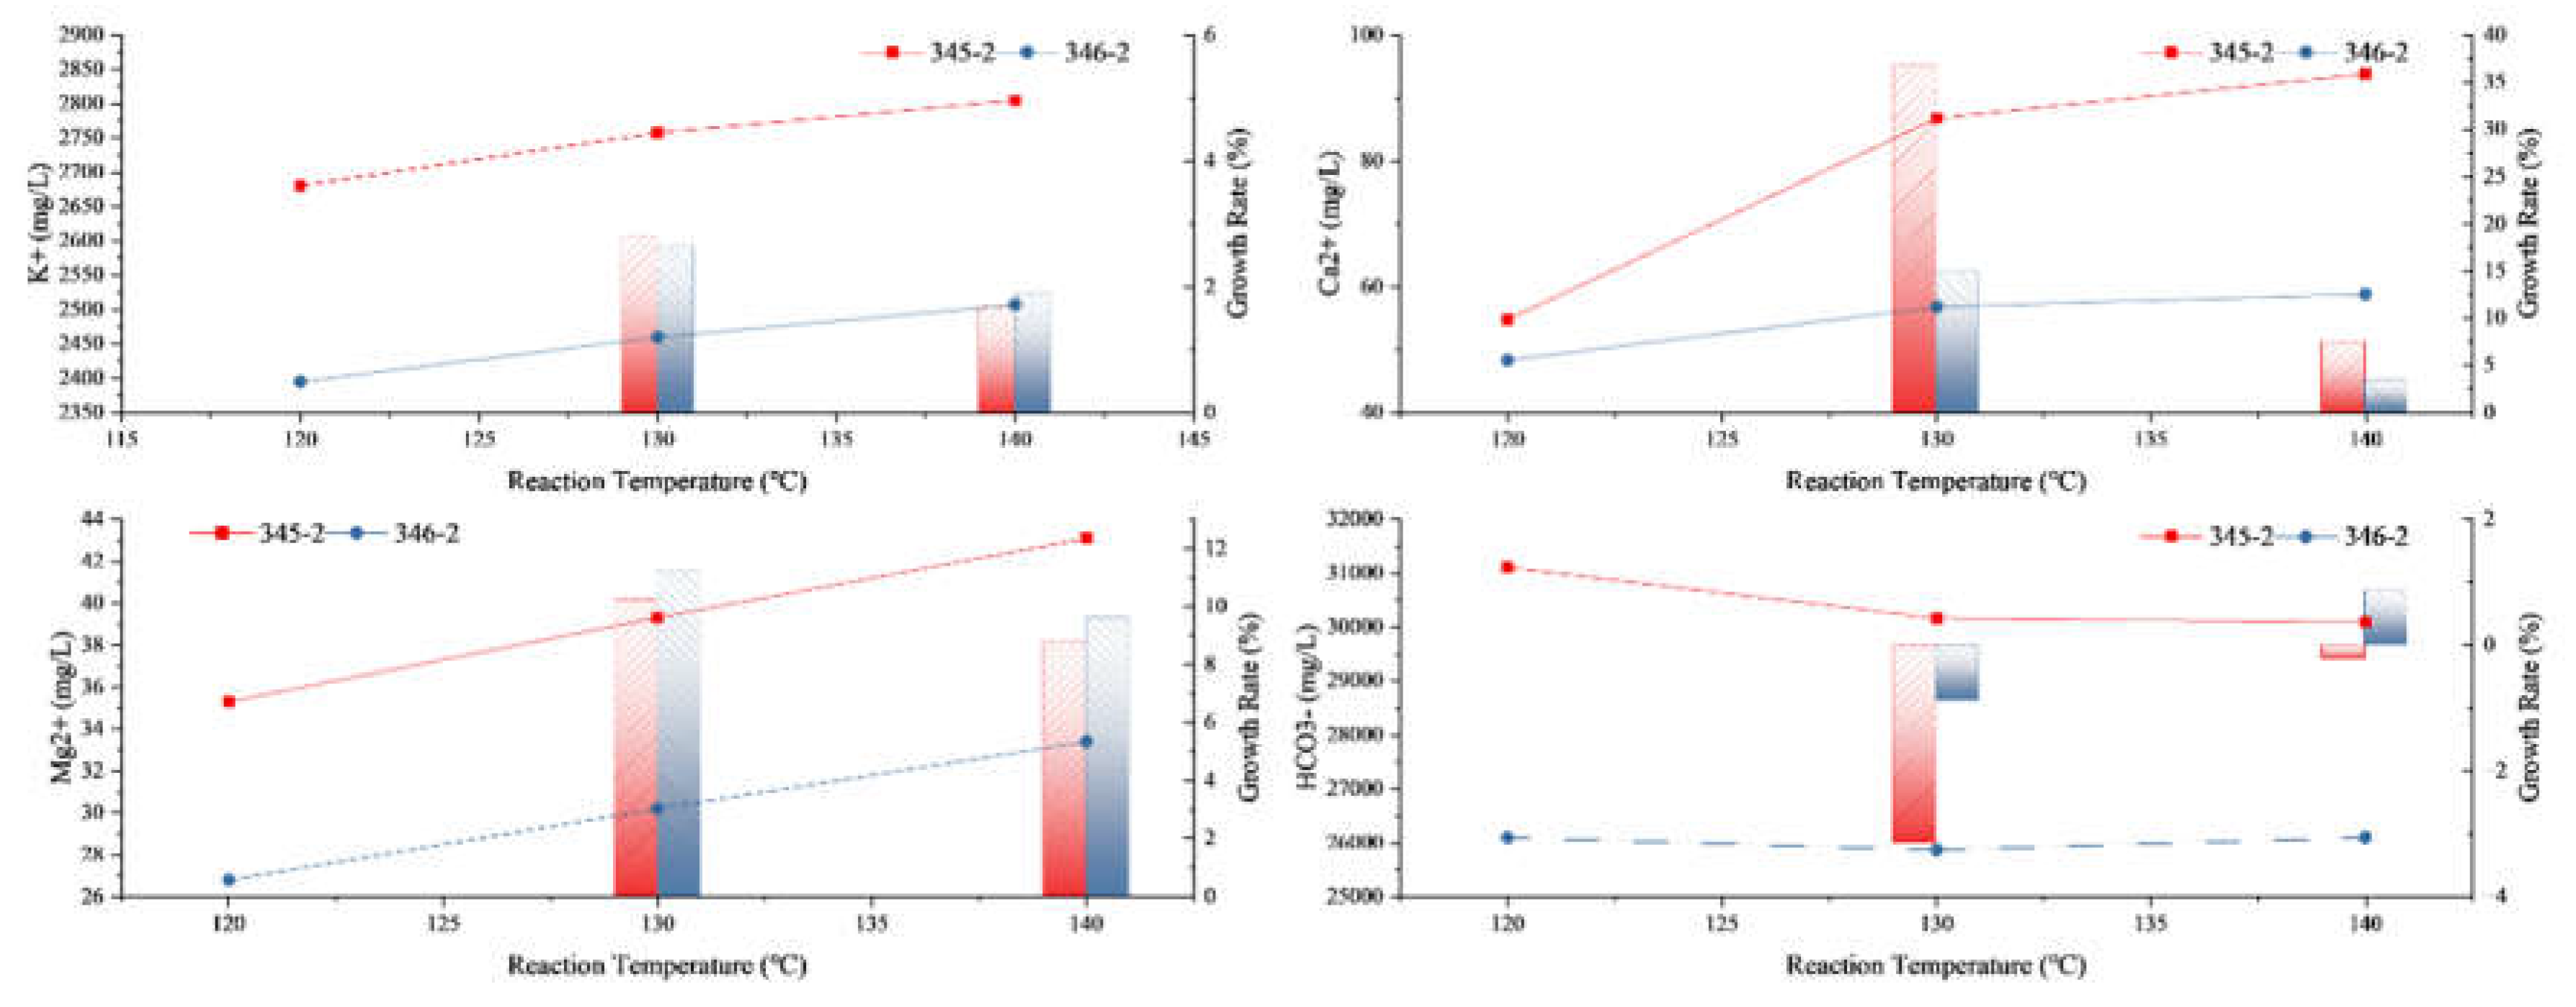
Figure 8.
Scanning electron microscope photographs before and after solution reaction of rock samples in the southern part of Songliao Basin. (a) The surface of the calcite in front of the reaction of rock sample 346 is smooth; (b) a large number of dissolution pores appear on the surface of the calcite in the rear of the reaction of rock sample 346; (c) the calcite crystals in front of the reaction of rock sample 345 have clear edges and corners; (d) the edges of the calcite crystals in the rear of the reaction of rock sample 345 have been dissolved; (e) the surface of the feldspar in front of the reaction of rock sample 346 is smooth and flat; (f) the feldspar in the rear of the reaction of rock sample 346 has been dissolved, and dissolution pits have appeared on the surface.
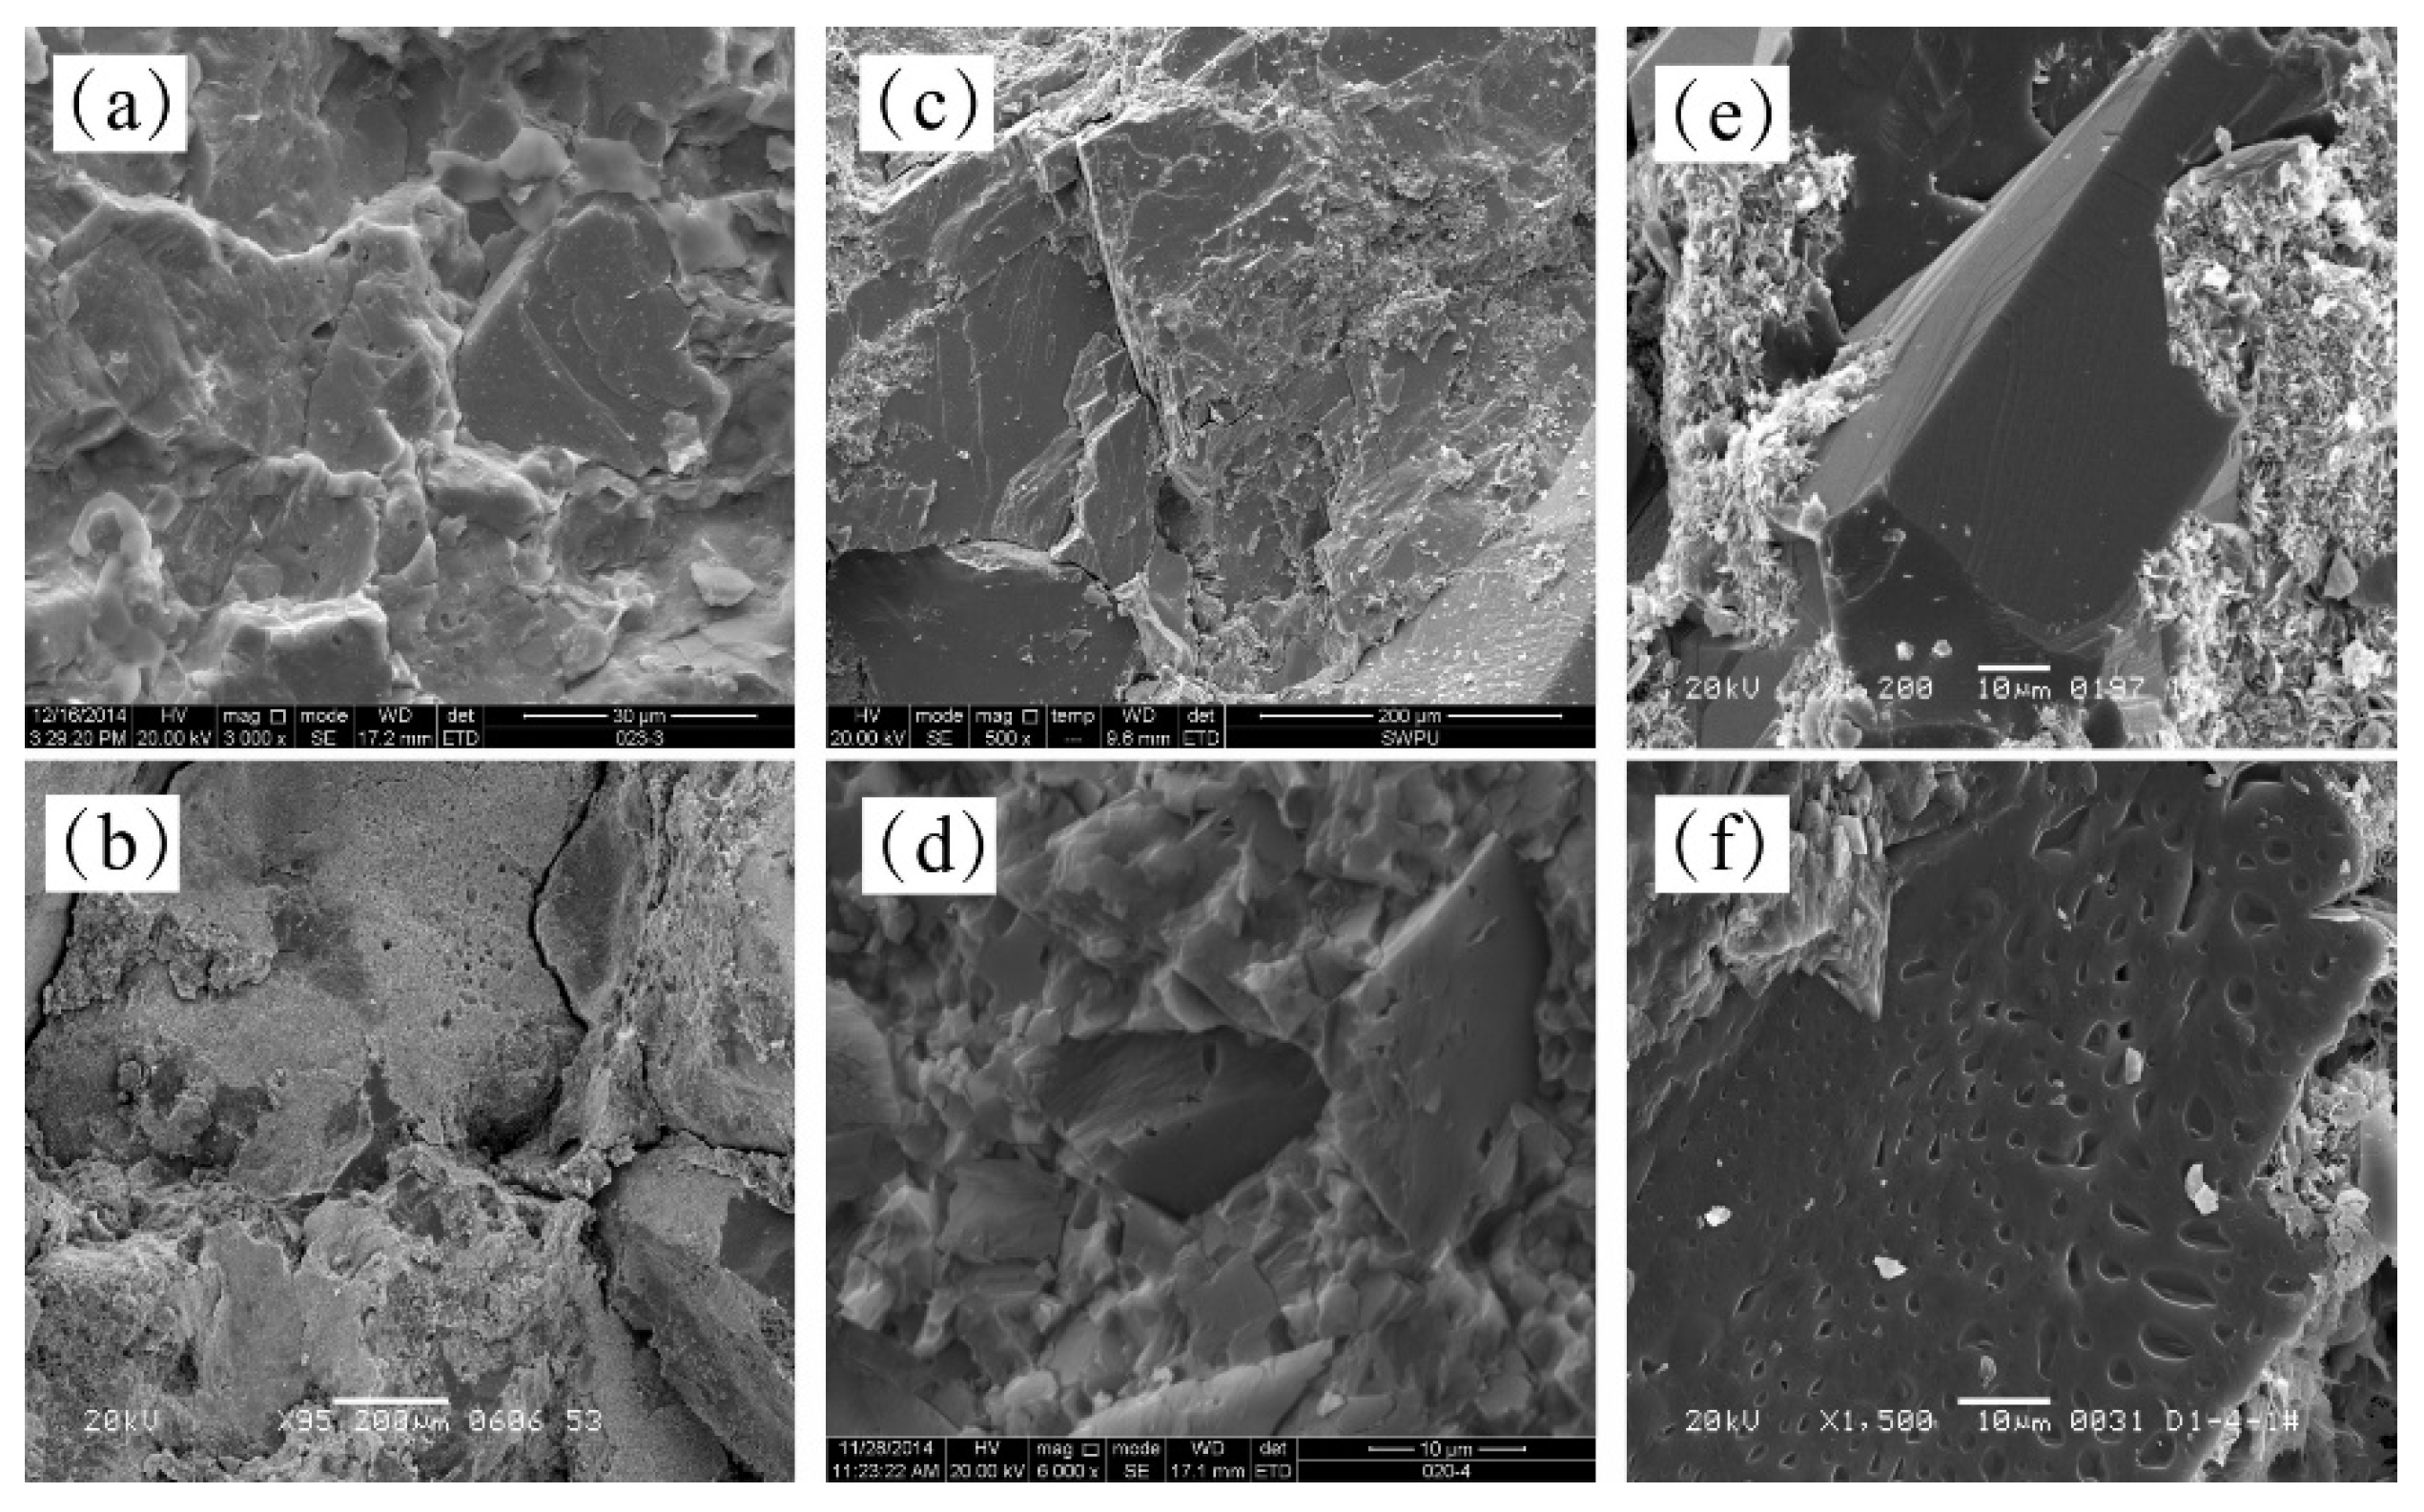
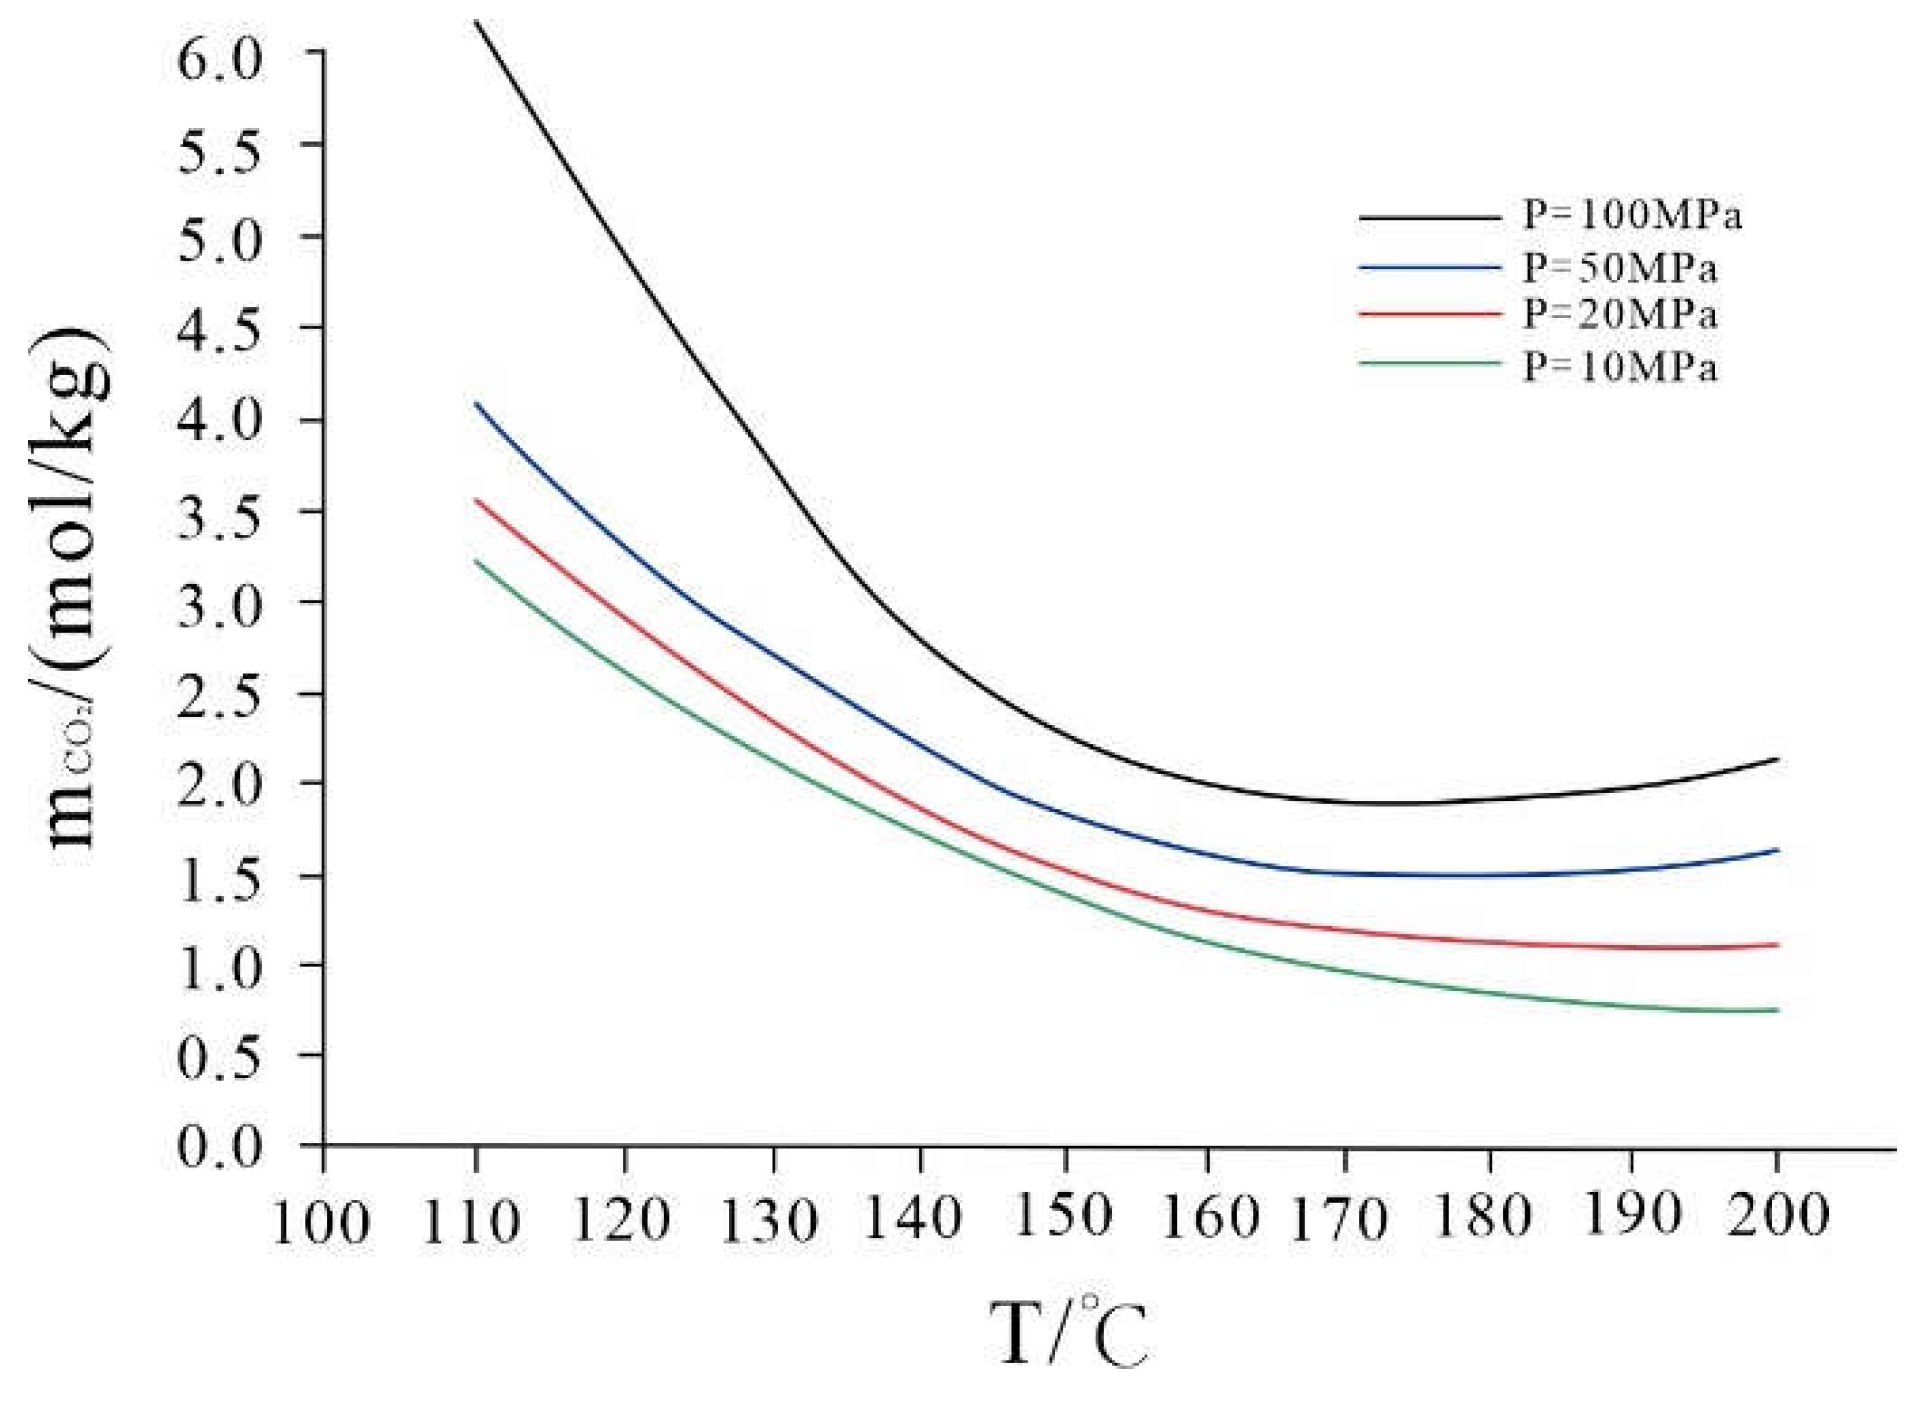
Table 1.
Physical parameters of solution response cores.
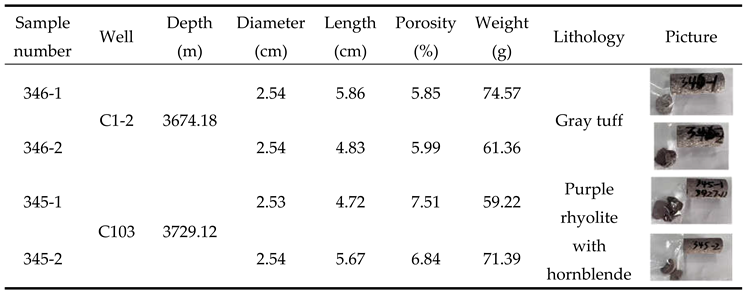
Table 4.
Porosity of rock samples before reaction and experimental arrangement.
| Rock Samples | Reaction Temperature (℃) |
Reactive Pressure (MPa) |
Weight of Rock Sample (Before) (g) |
Porosity (Anhydrous ethanol) (%) |
Reaction Time (h) |
| 345-1-1 | 130 | 20 | 12.23 | 7.20 | 96 |
| 345-1-2 | 130 | 40 | 13.11 | 7.09 | 96 |
| 345-1-3 | 130 | 60 | 12.30 | 6.56 | 96 |
| 345-2-1 | 120 | 40 | 12.38 | 6.65 | 96 |
| 345-2-2 | 130 | 40 | 12.50 | 6.42 | 96 |
| 345-2-3 | 140 | 40 | 12.46 | 6.49 | 96 |
| 346-1-1 | 130 | 20 | 12.57 | 6.03 | 96 |
| 346-1-2 | 130 | 40 | 12.65 | 6.22 | 96 |
| 346-1-3 | 130 | 60 | 12.54 | 6.13 | 96 |
| 346-2-1 | 120 | 40 | 12.60 | 5.95 | 96 |
| 346-2-2 | 130 | 40 | 12.55 | 6.20 | 96 |
| 346-2-3 | 140 | 40 | 12.42 | 5.84 | 96 |
Table 5.
Dissolution volume-pressure relationship for 96h reaction volcanic rock samples.
| Rock Samples | Reactive Pressure (MPa) | Rock Sample Quality (Before) (g) |
Rock Sample Quality (After) (g) |
Amount of Dissolution (g) |
Improved Porosity (%) | Pre-Reaction (pH) | After Reaction (pH) |
| 345-1 | 20 | 12.23 | 12.01 | 0.2254 | 4.43 | 3.26 | 7.33 |
| 40 | 13.11 | 12.86 | 0.2489 | 4.57 | 3.14 | 7.35 | |
| 60 | 12.30 | 12.04 | 0.2638 | 5.18 | 3.07 | 7.53 | |
| 346-1 | 20 | 12.57 | 12.37 | 0.1965 | 3.72 | 3.26 | 7.28 |
| 40 | 12.65 | 12.42 | 0.2297 | 4.39 | 3.14 | 7.32 | |
| 60 | 12.54 | 12.30 | 0.2449 | 4.66 | 3.07 | 7.51 |
Table 6.
Dissolution volume-temperature relationship for 96h reaction volcanic rock samples.
| Rock Samples | Reaction Temperature ℃ |
Rock Sample Quality (Before) (g) |
Rock Sample Quality (After) (g) |
Amount of Dissolution (g) |
Improved Porosity (%) | Pre-Reaction (pH) | After Reaction (pH) |
| 345-2 | 120 | 12.38 | 12.09 | 0.2803 | 4.37% | 3.11 | 7.79 |
| 130 | 12.50 | 12.24 | 0.2645 | 4.21% | 3.14 | 7.69 | |
| 140 | 12.46 | 12.23 | 0.2242 | 3.04% | 3.18 | 7.62 | |
| 346-2 | 120 | 12.60 | 12.34 | 0.2581 | 5.01% | 3.11 | 7.33 |
| 130 | 12.55 | 12.31 | 0.2345 | 4.55% | 3.14 | 7.33 | |
| 140 | 12.42 | 12.19 | 0.2274 | 4.42% | 3.18 | 7.36 |
Table 7.
CO2 - formation water chemical reaction equation.
| Reaction Equation | ||
| (1) | ||
| (2) | ||
| (3) |
Disclaimer/Publisher’s Note: The statements, opinions and data contained in all publications are solely those of the individual author(s) and contributor(s) and not of MDPI and/or the editor(s). MDPI and/or the editor(s) disclaim responsibility for any injury to people or property resulting from any ideas, methods, instructions or products referred to in the content. |
© 2025 by the authors. Licensee MDPI, Basel, Switzerland. This article is an open access article distributed under the terms and conditions of the Creative Commons Attribution (CC BY) license (http://creativecommons.org/licenses/by/4.0/).
Copyright: This open access article is published under a Creative Commons CC BY 4.0 license, which permit the free download, distribution, and reuse, provided that the author and preprint are cited in any reuse.


