* Correspondence to: Fenling Fan, MD, PhD, happyling@mail.xjtu.edu.cn; orcid: 0000-0002-7732-7701; Word Count: 5908
Introduction
Pulmonary arterial hypertension (PAH) is a life-threatening disease that eventually leads to heart failure and subsequent fatality if left untreated.[
1,
2,
3] with a five years survival rate of 55%.[
4] PAH is characterized by elevated pulmonary artery pressure and vascular resistance,[
5,
6,
7] leading to right ventricular failure and ultimately, death. The etiology of PAH is multifactorial and includes idiopathic, heritable, and associated conditions such as connective tissue diseases, portal pulmonary hypertension, and congenital heart diseases (CHDs).[
8] Right heart catheterization (RHC) is known to be a gold standard modality for the diagnosis and clue for treatment strategies of PAH.[
9,
10] The hemodynamic profile of PAH is typically assessed using RHC[
11]. According to the revised guidelines issued by the European Society of Cardiology and European Respiratory Society in 2022, hemodynamic diagnosis via RHC, with a mean pulmonary artery pressure (mPAP) above 20mmHg indicating PAH, updated from the previous 25mmHg and delineates PAH into five distinct groups (1) pulmonary arterial hypertension, often idiopathic or associated with conditions like connective tissue disease, (2) pulmonary hypertension due to left heart disease, (3) pulmonary hypertension associated with lung diseases or hypoxia, (4) pulmonary hypertension due to pulmonary artery obstructions, and (5) pulmonary hypertension with unclear or multifactorial mechanisms. This classification aids in targeted diagnosis and management tailored to each PAH group’s underlying causes.[
12,
13] Pulmonary artery pressure (PAP), pulmonary vascular resistance (PVR), pulmonary-to-systemic flow ratio (Qp/Qs ≥ 1.5), and pulmonary-to-systemic vascular resistance (< 1/3) are crucial parameters used to screen out the eligibility for surgery or percutaneous intervention in compliance with the current guidelines.[
14,
15] The relationship between the volume of blood moving through the pulmonary and systemic circuits is crucial in the patient selection process for this operation.[
16] The gold standard for measuring Qp/Qs, pulmonary-to-systemic vascular resistance, and other hemodynamic parameters in CHD patients is RHC, however, being invasive at every follow-up can be impractical and even harmful due to radiation exposure. Even though with significant shunt i.e. Qp/Qs ≥ 1.5, it is crucial to evaluate the severity of PAH based on hemodynamic parameters assessed with RHC. To overcome this, pre-screening with non-invasive or minimally invasive measurements is needed.
Recent research highlights the crucial role of O
2 saturation that plays in managing CHD-related PAH, specifically in optimizing pulmonary hemodynamics and RV afterload.[
17,
18,
19] This implies that maintaining a proper balance in oxygen exchange is necessary to prevent harmful increases in Qp/Qs, particularly in patients who are not candidates for surgical repair[
20]. No prior studies have explored the relationship between blood gas parameters and hemodynamics in CHD-related PAH. This study aims to (1) evaluate the relationship between arteriovenous oxygen parameters and RHC findings, and (2) identify non-invasive or minimally invasive gas parameters that can aid in pre-selecting CHD-related PAH patients for follow-up RHC and potential surgical or percutaneous shunt closure.
Subjects and Methods
Patient Selection
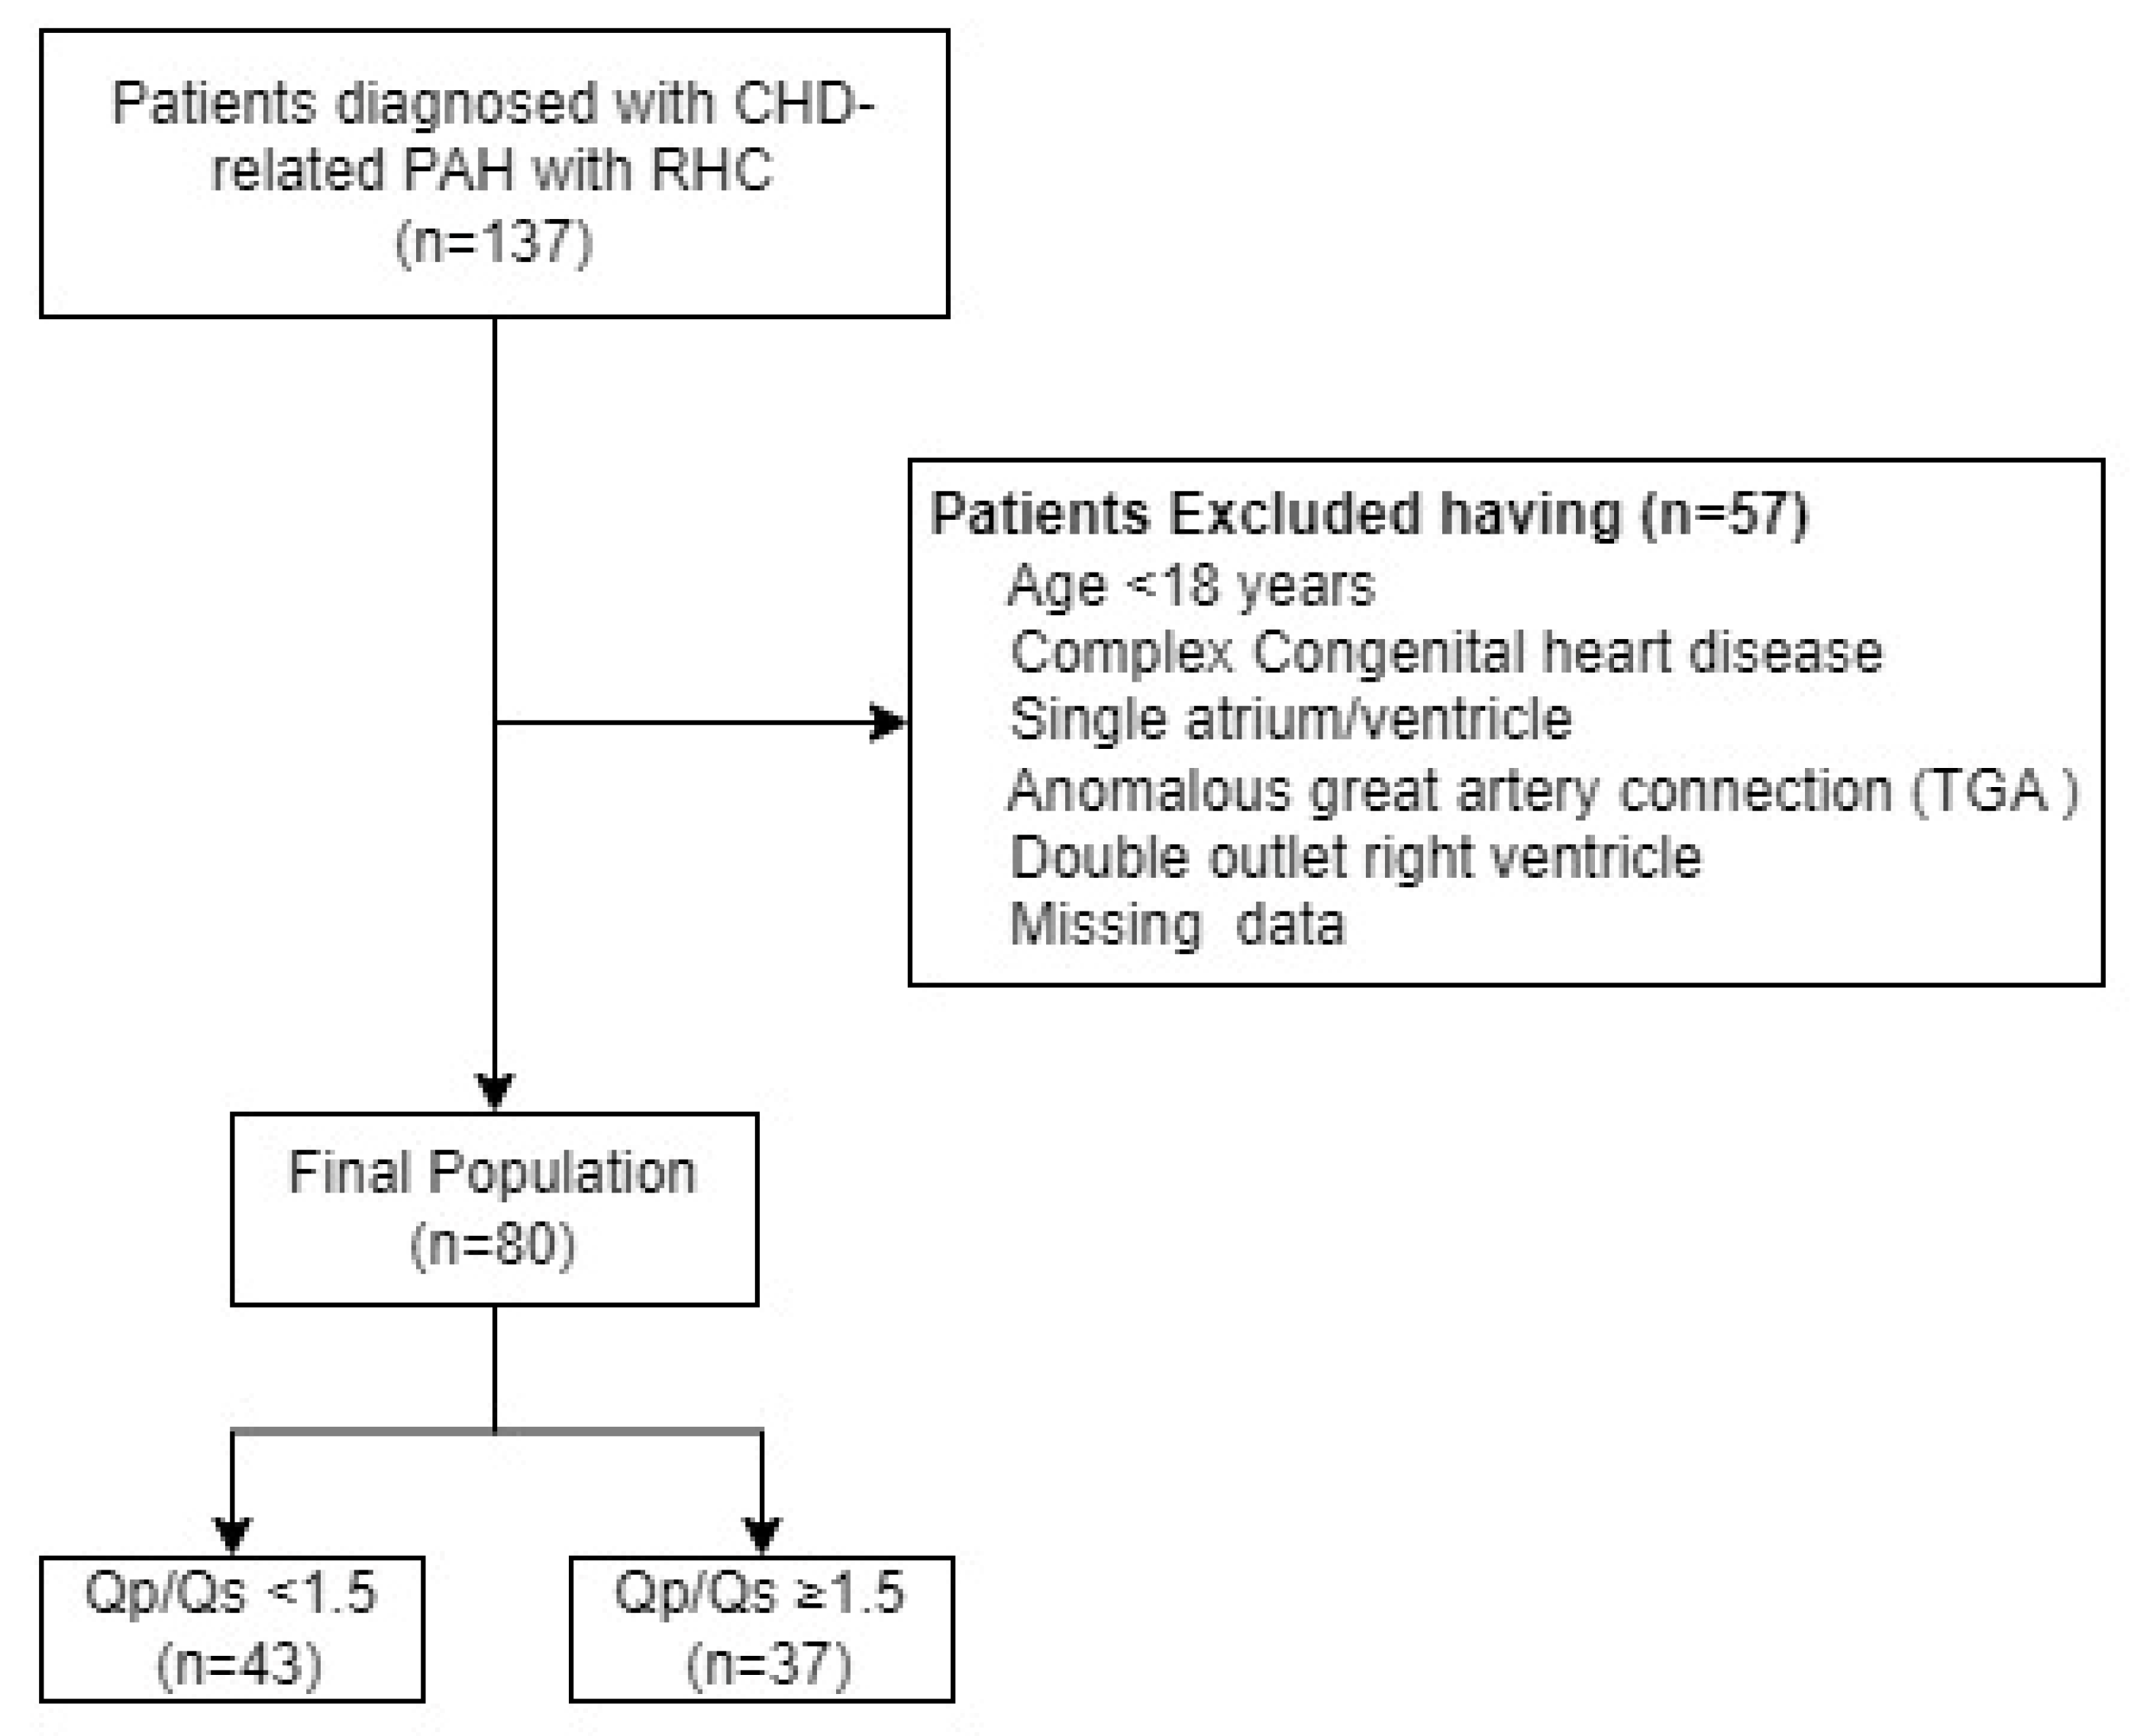
In this retrospective single-center study from the Department of Cardiovascular Medicine, the first affiliated hospital of Xi’an Jiaotong University, we enrolled adult patients diagnosed with CHD-related PAH who underwent RHC between September 2019 and May 2024 (
Figure 1). Patients with a single ventricle, single atrium, complete atrioventricular septal defects, or anomalous great artery connections such as transposition of the great arteries and double outlet right ventricle were excluded. Additionally, patients under 18 years of age were also excluded. The study population was divided into two groups based on the RHC-derived Qp/Qs ratio: those with a Qp/Qs ratio < 1.5 and those with a Qp/Qs ratio ≥ 1.5.[
14] This division allowed us to explore the relationship between shunt severity and blood gas parameters, including arteriovenous oxygen difference (Ca−vO
2). Furthermore, this grouping helps us to evaluate the significance of non-invasive parameters, such as Ca−vO
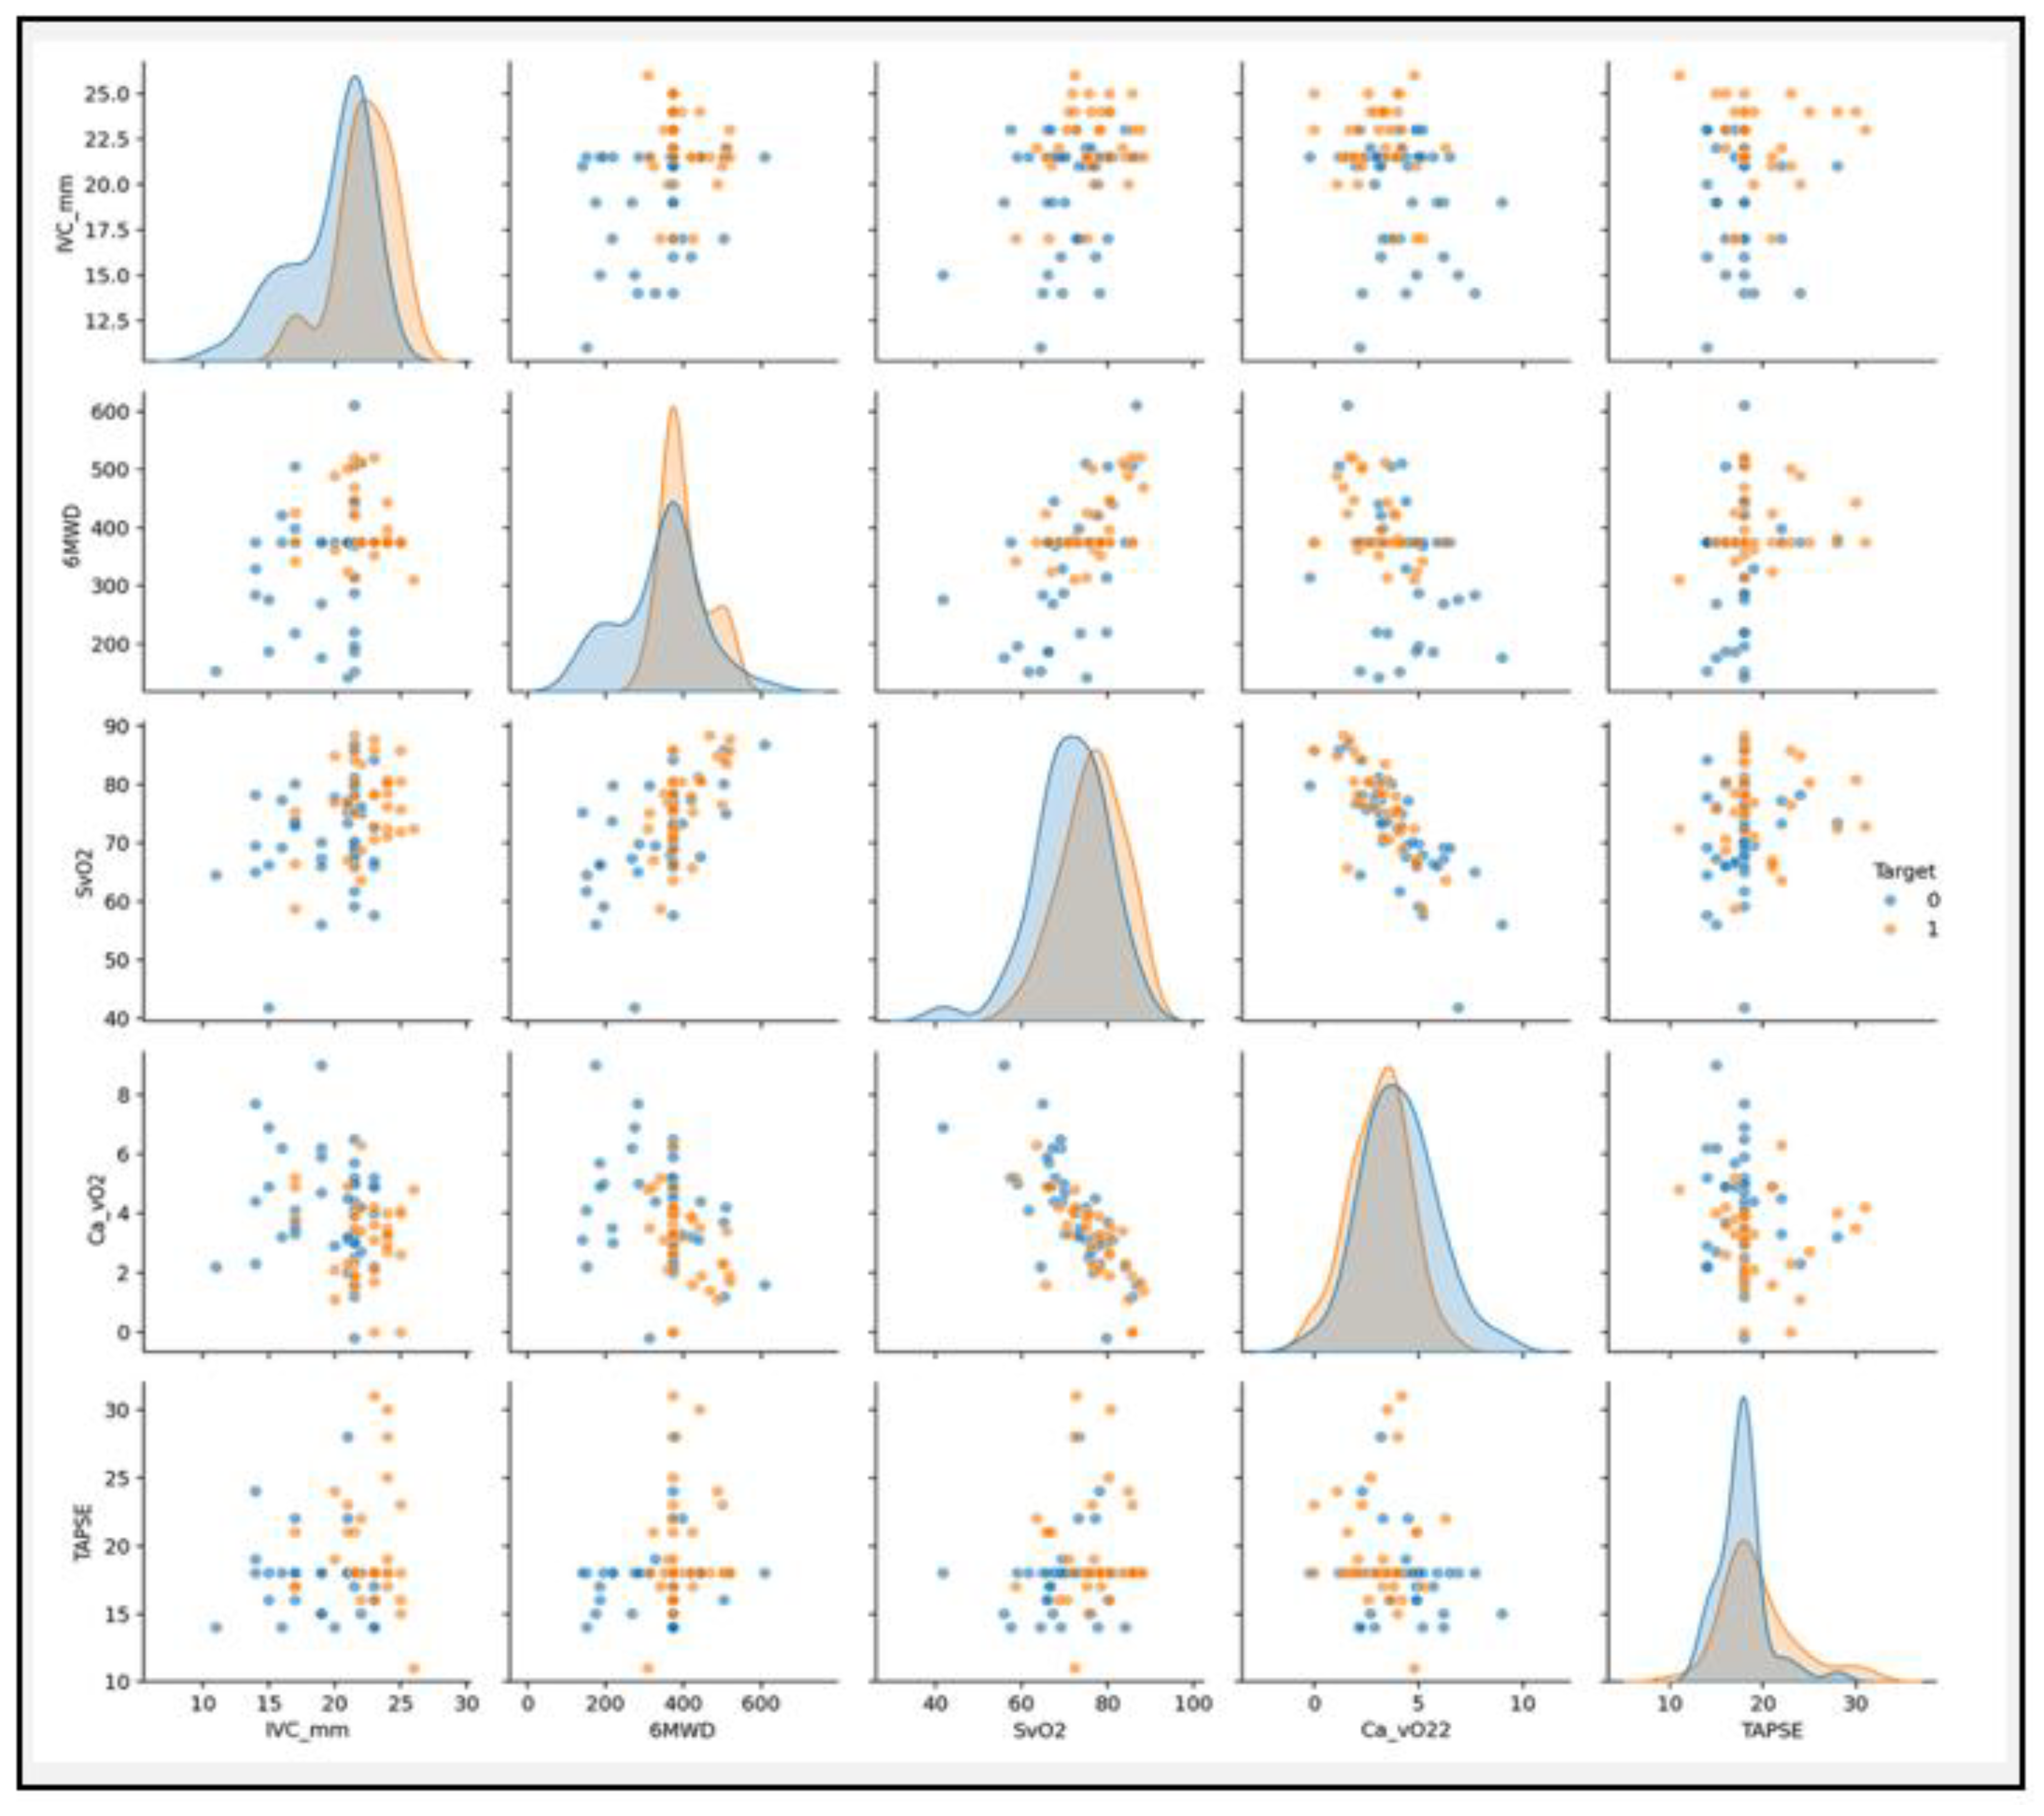
2, 6-minute walk distance (6MWD), tricuspid annular plan systolic excursion (TAPSE), and inferior vena cava (IVC) diameter in predicting the need for surgical or percutaneous closure of shunts. These findings may guide the pre-selection of patients for further invasive assessment and intervention.The study protocol was approved by the institutional ethical committee of the First affiliated hospital of Xi’an Jiaotong University,. All patients provided informed consents.
Hemodynamic Assessment
Each subsequent RHC measurement was performed in our institution’s cardiac catheterization laboratory.[
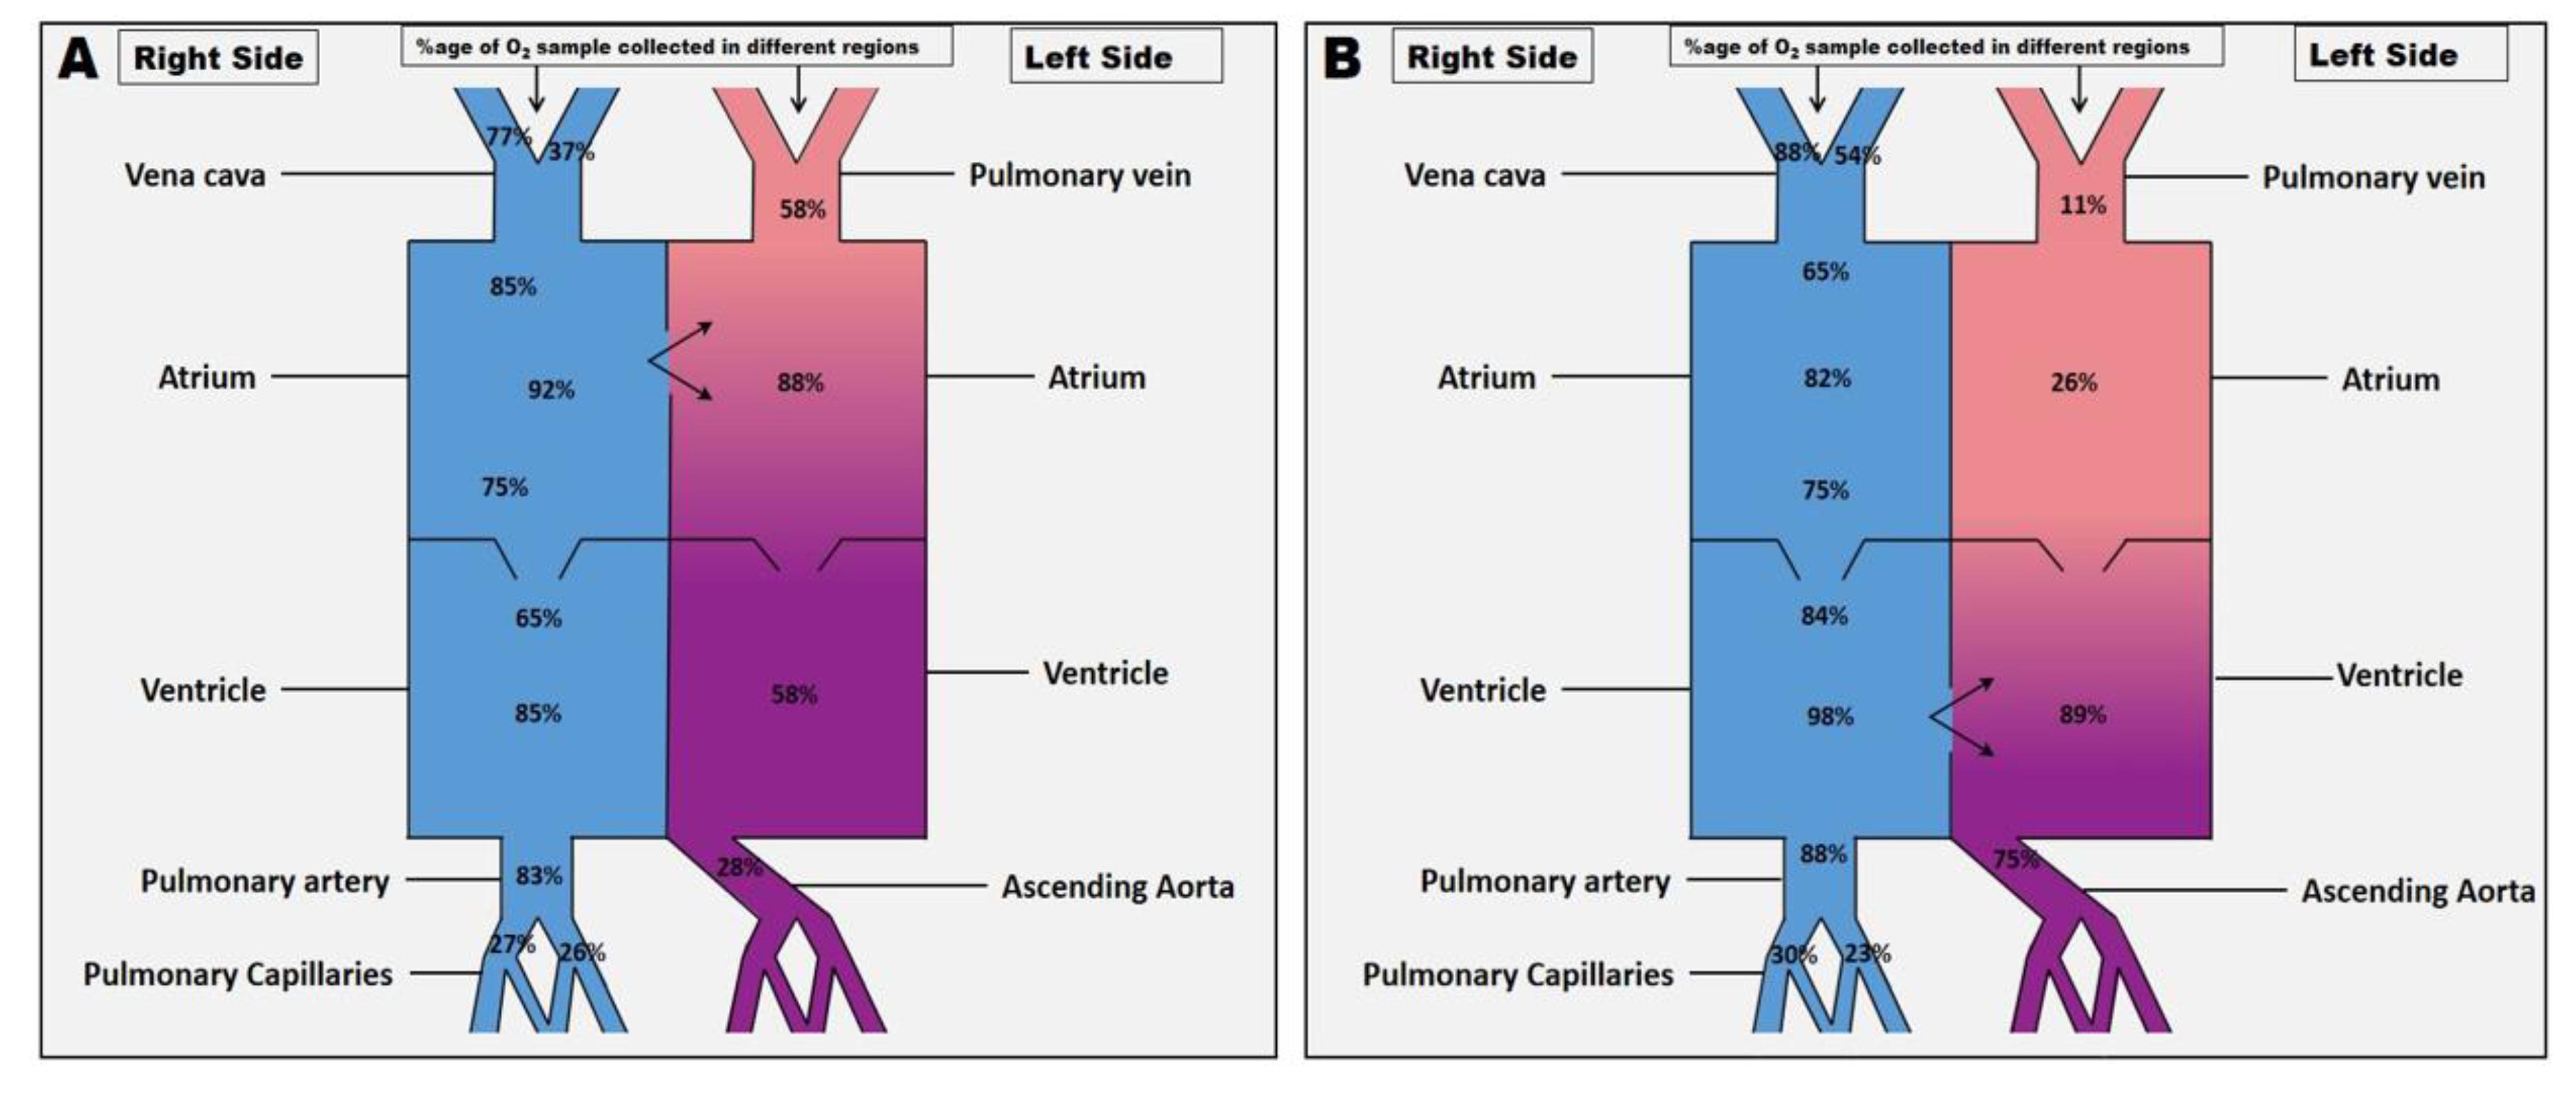
21] Introducer sheaths of appropriate size were inserted into both the femoral vein and femoral artery under local anesthesia. A catheter was then advanced through the femoral vein to the IVC, superior vena cava, right atrium and ventricle, main pulmonary artery, right and left pulmonary artery, and then left atrium and ventricle, left and right pulmonary veins and aorta. This placement enabled the simultaneous measurement of pressures such as right ventricular systolic pressure (RVSP) and sample collection for blood gas measurements, thereby minimizing the time-consuming and potentially confounding effects of repeated catheter manipulations. Intravascular pressures were monitored using fluid-filled transducers, and oxygen saturations and hemoglobin concentrations were determined. Assumed oxygen consumption was used to calculate the cardiac output, cardiac index, and pulmonary and systemic blood flow (Qp and Qs, respectively) using the Fick principle.[
22,
23] PVR was computed using common formulas [PVR=(mPAP-PAWP)/CO][
8] and indexed to the body’s surface area.
After baseline values were obtained, arterial and mixed venous blood samples were withdrawn simultaneously from different locations (
Figure 2A and B) to determine the following blood gas measurements. Arterial oxygen tension (PaO
2), mixed venous oxygen tension (PvO
2), arterial oxygen saturation (SaO
2), and mixed venous oxygen saturation (SvO
2). Hemoglobin concentration (Hb) was also measured. The arterial oxygen content (CaO
2), mixed venous oxygen content (CvO
2), and Ca−vO
2 were calculated using the following formula.[
24]
Statistical Analysis
All statistical analyses were performed using SPSS (version 26, IBM Corp., Armonk, NY, USA), GraphPad Prism version 8.0.2 (263) for Windows, GraphPad Software, Boston, Massachusetts USA), and Python version 3.11, Microsoft. Continuous variables are expressed as mean ± standard deviation (SD) or median with interquartile range (IQR), while categorical variables were expressed as frequencies and percentages. Before conducting comparative analyses, the normality of the data was assessed using the Shapiro-Wilk test. The homogeneity of variance across groups was evaluated using Levene’s test.
Pearson correlation was used to analyze the correlation on blood gas parameters with hemodynamics while the relationship between the parameters was evaluated using univariate binary logistic regression analysis. For the comparative analysis of blood gas parameters with Qp/Qs ratios, an unpaired
t-test was used to determine the significance of differences between groups with Qp/Qs ratios (Qp/Qs < 1.5 or ≥ 1.5). The value of PaO
2, SaO
2, SvO
2, Ca−vO
2, 6MWD, TAPSE, and IVC size to predict the shunt (Qp/Qs < 1.5 or ≥ 1.5), was analyzed using receiver operating characteristic (ROC) curve. The area under the ROC curve ± standered error (SE) for each parameter was calculated and compared.[
25,
26] Youden’s index (
J) was used to calculate the optimal cut-off value for each parameter. A two-tailed
P-value of less than 0.05 was taken to indicate statistical significance.
Results
Study Population
Table 1 comprises the demographic characteristics of the included study population. Eighty patients with CHD-related PAH were included in the final evaluation; their mean age was 41 ± 15 years, and their male-to-female ratio was 37/43. The average body surface area was 1.57 ± 0.3 m², and the average body mass index was 21.6 ± 3.7 kg/m². The mean diastolic and systolic blood pressures were 76 ± 13 mmHg and 116 ± 16 mmHg, respectively, while the mean heart rate was 86 ± 13.6 beats/min. The average N-terminal pro-B-type Natriuretic Peptide level was 1274 ± 1596 pg/mL. Most patients fell into either World Health Organization functional class II (38.7%) or III (40.0%). Atrial septal defect (57.4%) and ventricular septal defect (26.2%) were the most common types of CHDs. The majority of cases of PAH severity (67.5%) had the following characteristics: mPAP of 54.12 ± 23.5 mmHg, RVSP of 36.5 ± 16.0 mmHg, and PVR of 10.68 ± 7.9 Wood units. The cardiac index was 2.6 ± 1.6 L/min/m², while the mean cardiac output was 4.8 ± 2.5 L/min. The typical values of the CaO
2 and CvO
2 were 18.09 ± 4.44, and 14.78 ± 3.57, respectively and the Ca−vO
2 was measured 3.53 ± 1.8.
Comparative Analysis of Diagnostic Markers and Blood Gas Parameters Associated with Qp/Qs < 1.5 or ≥ 1.5
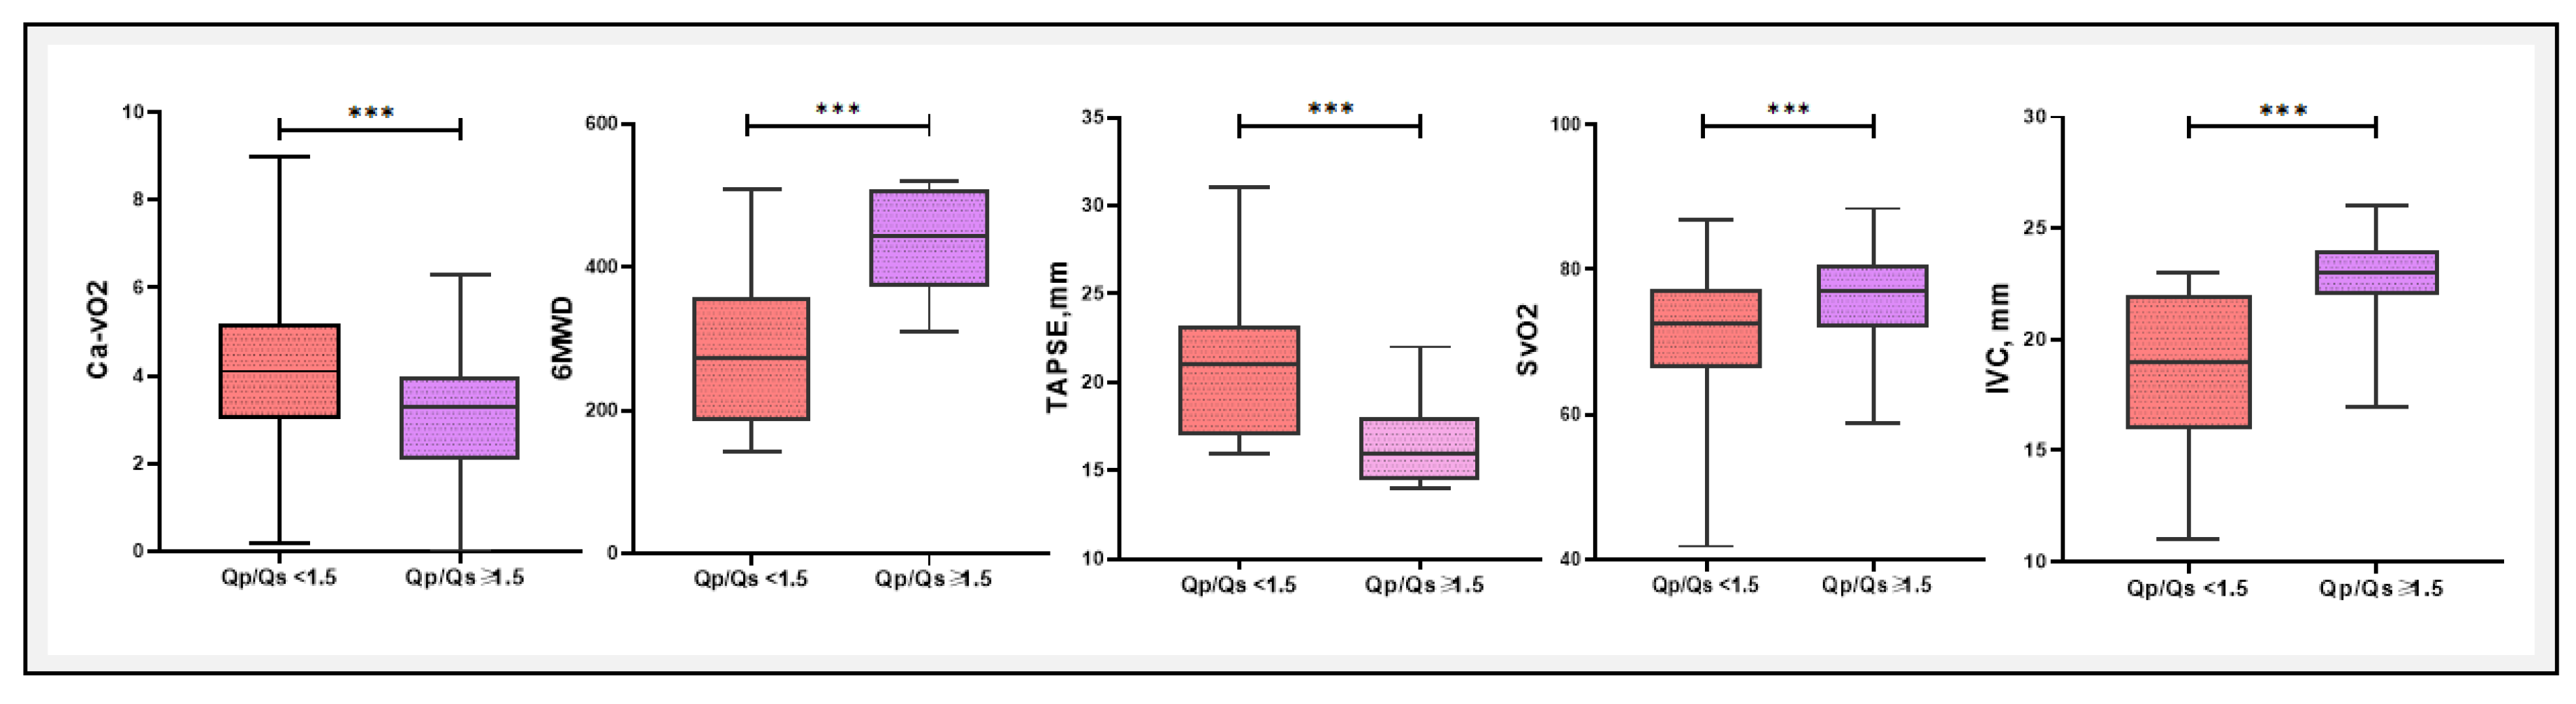
A comparative analysis of blood gas parameters between patients with Qp/Qs < 1.5 and Qp/Qs > 1.5 of several key metrics are presented in
Table 3 and
Figure 7. In this study, a comparative analysis of various clinical and blood gas parameters revealed substantial differences between patients with Qp/Qs < 1.5 and ≥ 1.5. Notably, Ca−vO₂ was significantly higher in the Qp/Qs < 1.5 group (4.22 ± 1.73 mM) compared to the Qp/Qs ≥ 1.5 group (3.07 ± 1.38 mM, P = 0.003), indicating a greater oxygen extraction in the lower Qp/Qs group. The 6MWD was also significantly different, with patients in the Qp/Qs ≥ 1.5 group walking further (434.8 ± 73.5 m vs. 276.3 ± 107.1 m, P < 0.0001). In contrast, parameters like PaO
2 and PvO
2 did not show significant differences between the groups (P = 0.457 and P = 0.338, respectively), while SaO
2 (P = 0.03) and SvO
2 (P = 0.009) were significantly higher in the Qp/Qs ≥ 1.5 group. Additionally, TAPSE and IVC diameters were significantly different between the two groups, reflecting the hemodynamic and functional differences associated with Qp/Qs ratios.
Univariate logistic regression analysis identified several significant diagnostic predictors for Qp/Qs (
Table 4). SvO
2 was found to be a positive predictor, with higher levels associated with greater odds of a higher Qp/Qs [odd ratio (OR) = 1.139, 95% CI: 1.049–1.236, P = 0.009]. Additionally, Ca−vO
2 was a significant negative predictor (OR = 0.675, 95% CI: 0.494–0.924, P = 0.014), suggesting that patients with lower Ca−vO
2 values were likelier to have elevated Qp/Qs. 6MWD also emerged as a significant positive predictor (OR = 1.009, 95% CI: 1.002–1.015, P = 0.007), indicating that patients with greater walking distances had a higher likelihood of elevated Qp/Qs.
Other significant predictors included TAPSE (OR = 1.176, 95% CI: 1.005–1.376, P = 0.043), which was positively associated with higher Qp/Qs, and IVC diameter, which had the strongest association (OR = 1.55, 95% CI: 1.218–1.980, P = 0.001), with larger diameters correlating with greater odds of a higher Qp/Qs. Variables such as age, weight, and body mass index did not show significant associations in this analysis, suggesting that these factors may not be as predictive for Qp/Qs in this patient population.
Area Under the ROC Curve of Variables Predictive Values for Differentiating Between the Groups Qp/Qs (< 1.5 or ≥ 1.5)
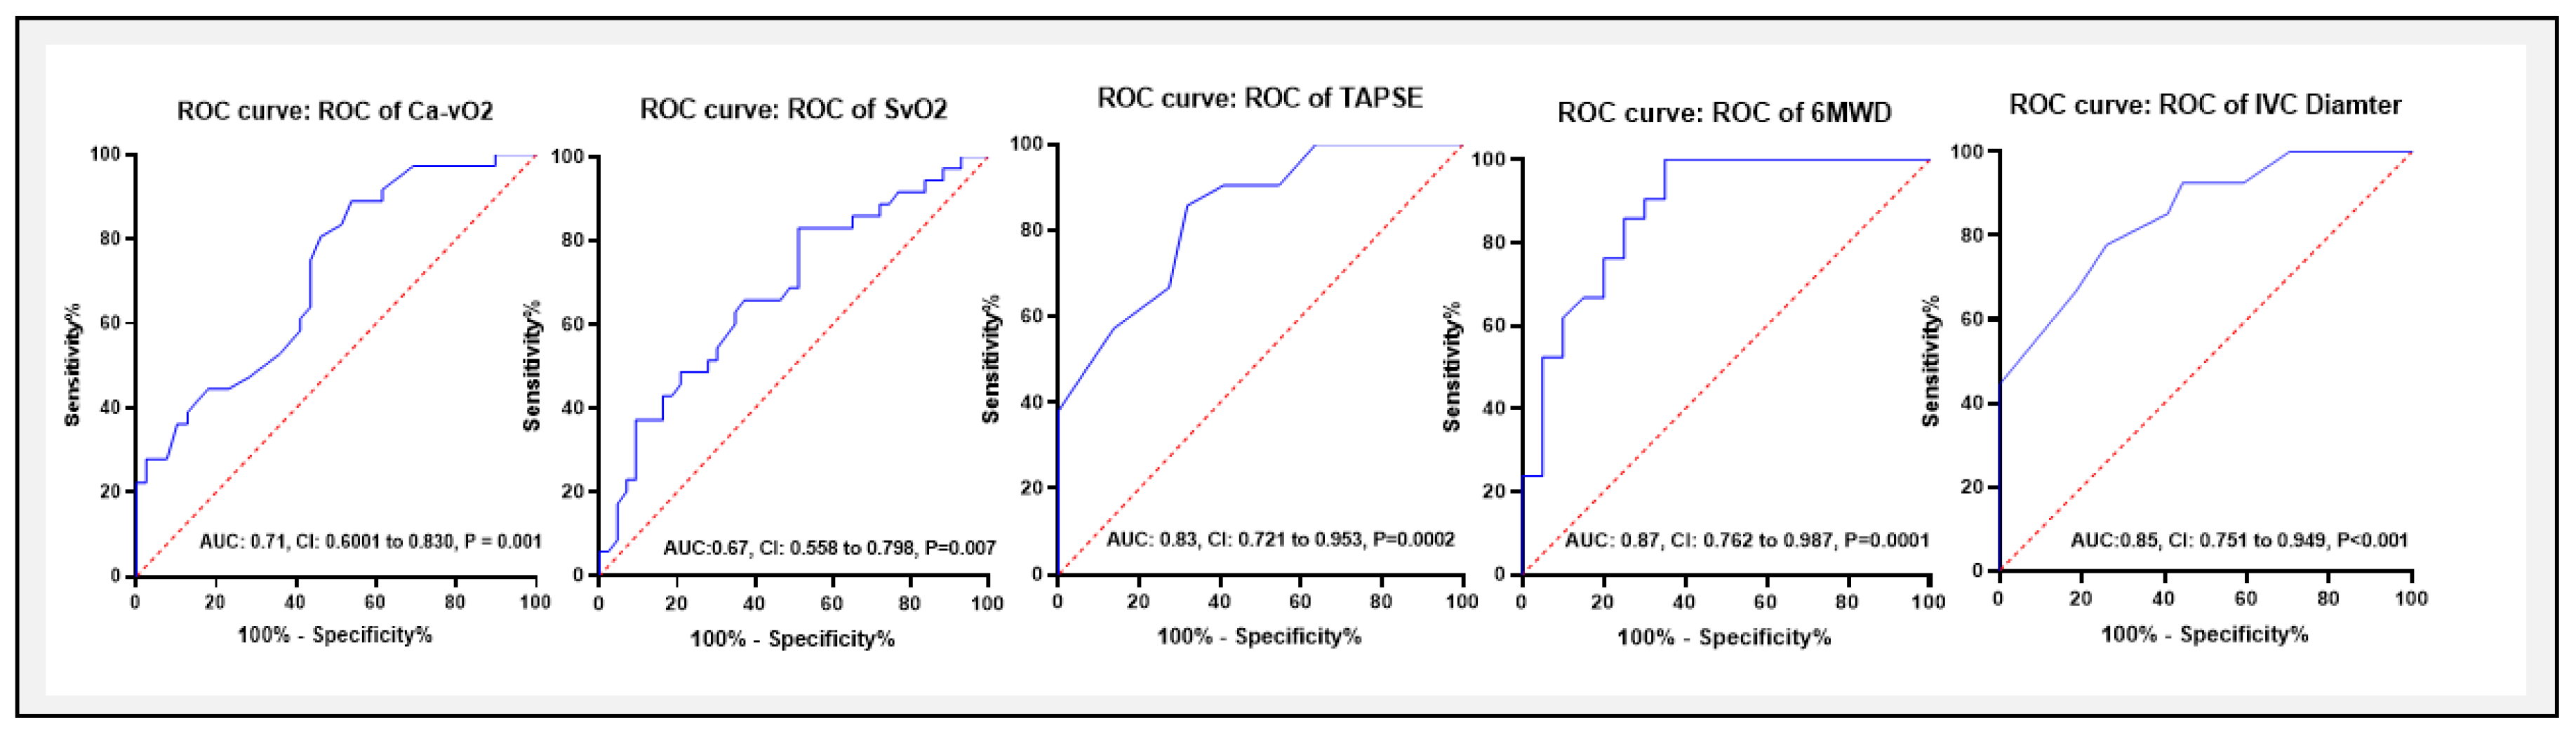
ROC curve analysis was performed to assess the diagnostic accuracy of Ca−vO₂, 6MWD, TAPSE, and IVC diameter in distinguishing between groups (Qp/Qs < 1.5 or ≥ 1.5) (
Table 5, and
Figure 8). The area under the curve (AUC) for Ca−vO
2 was 0.71 (95% CI: 0.569–0.812, P = 0.005), indicating a moderate diagnostic value. The optimal cut-off for Ca−vO
2 was < 4.3 mM, with a sensitivity of 88.8% and specificity of 53.4%. However, SvO
2 yielded an AUC of 67 with 82.8% and 48.8% sensitivity and specificity respectively, with a cut-off value of > 70.4%. Among non-invasive parameters, for 6MWD, the AUC was 0.87 (95% CI: 0.762–0.987, P = 0.0001), with an optimal cut-off of 319 meters, yielding a sensitivity of 90.4% and specificity of 48.1%. Similarly, the AUC for TAPSE was 0.83 (95% CI: 0.721–0.953, P = 0.0002), with a cut-off of <18.5 mm (sensitivity 85.7%, specificity 68.1%), while for IVC diameter, the AUC was 0.85 (95% CI: 0.751–0.949, P < 0.001), with a cut-off of >21.5 mm (sensitivity 77%, specificity 74%).
Discussion
Recent insights have underscored the critical role of O₂ saturation in managing CHD-related PAH, particularly in optimizing pulmonary hemodynamics and RV afterload. Ensuring an appropriate balance in oxygen exchange is essential to avoid detrimental increases in Qp/Qs, especially in patients not eligible for surgical repair.[
17,
27,
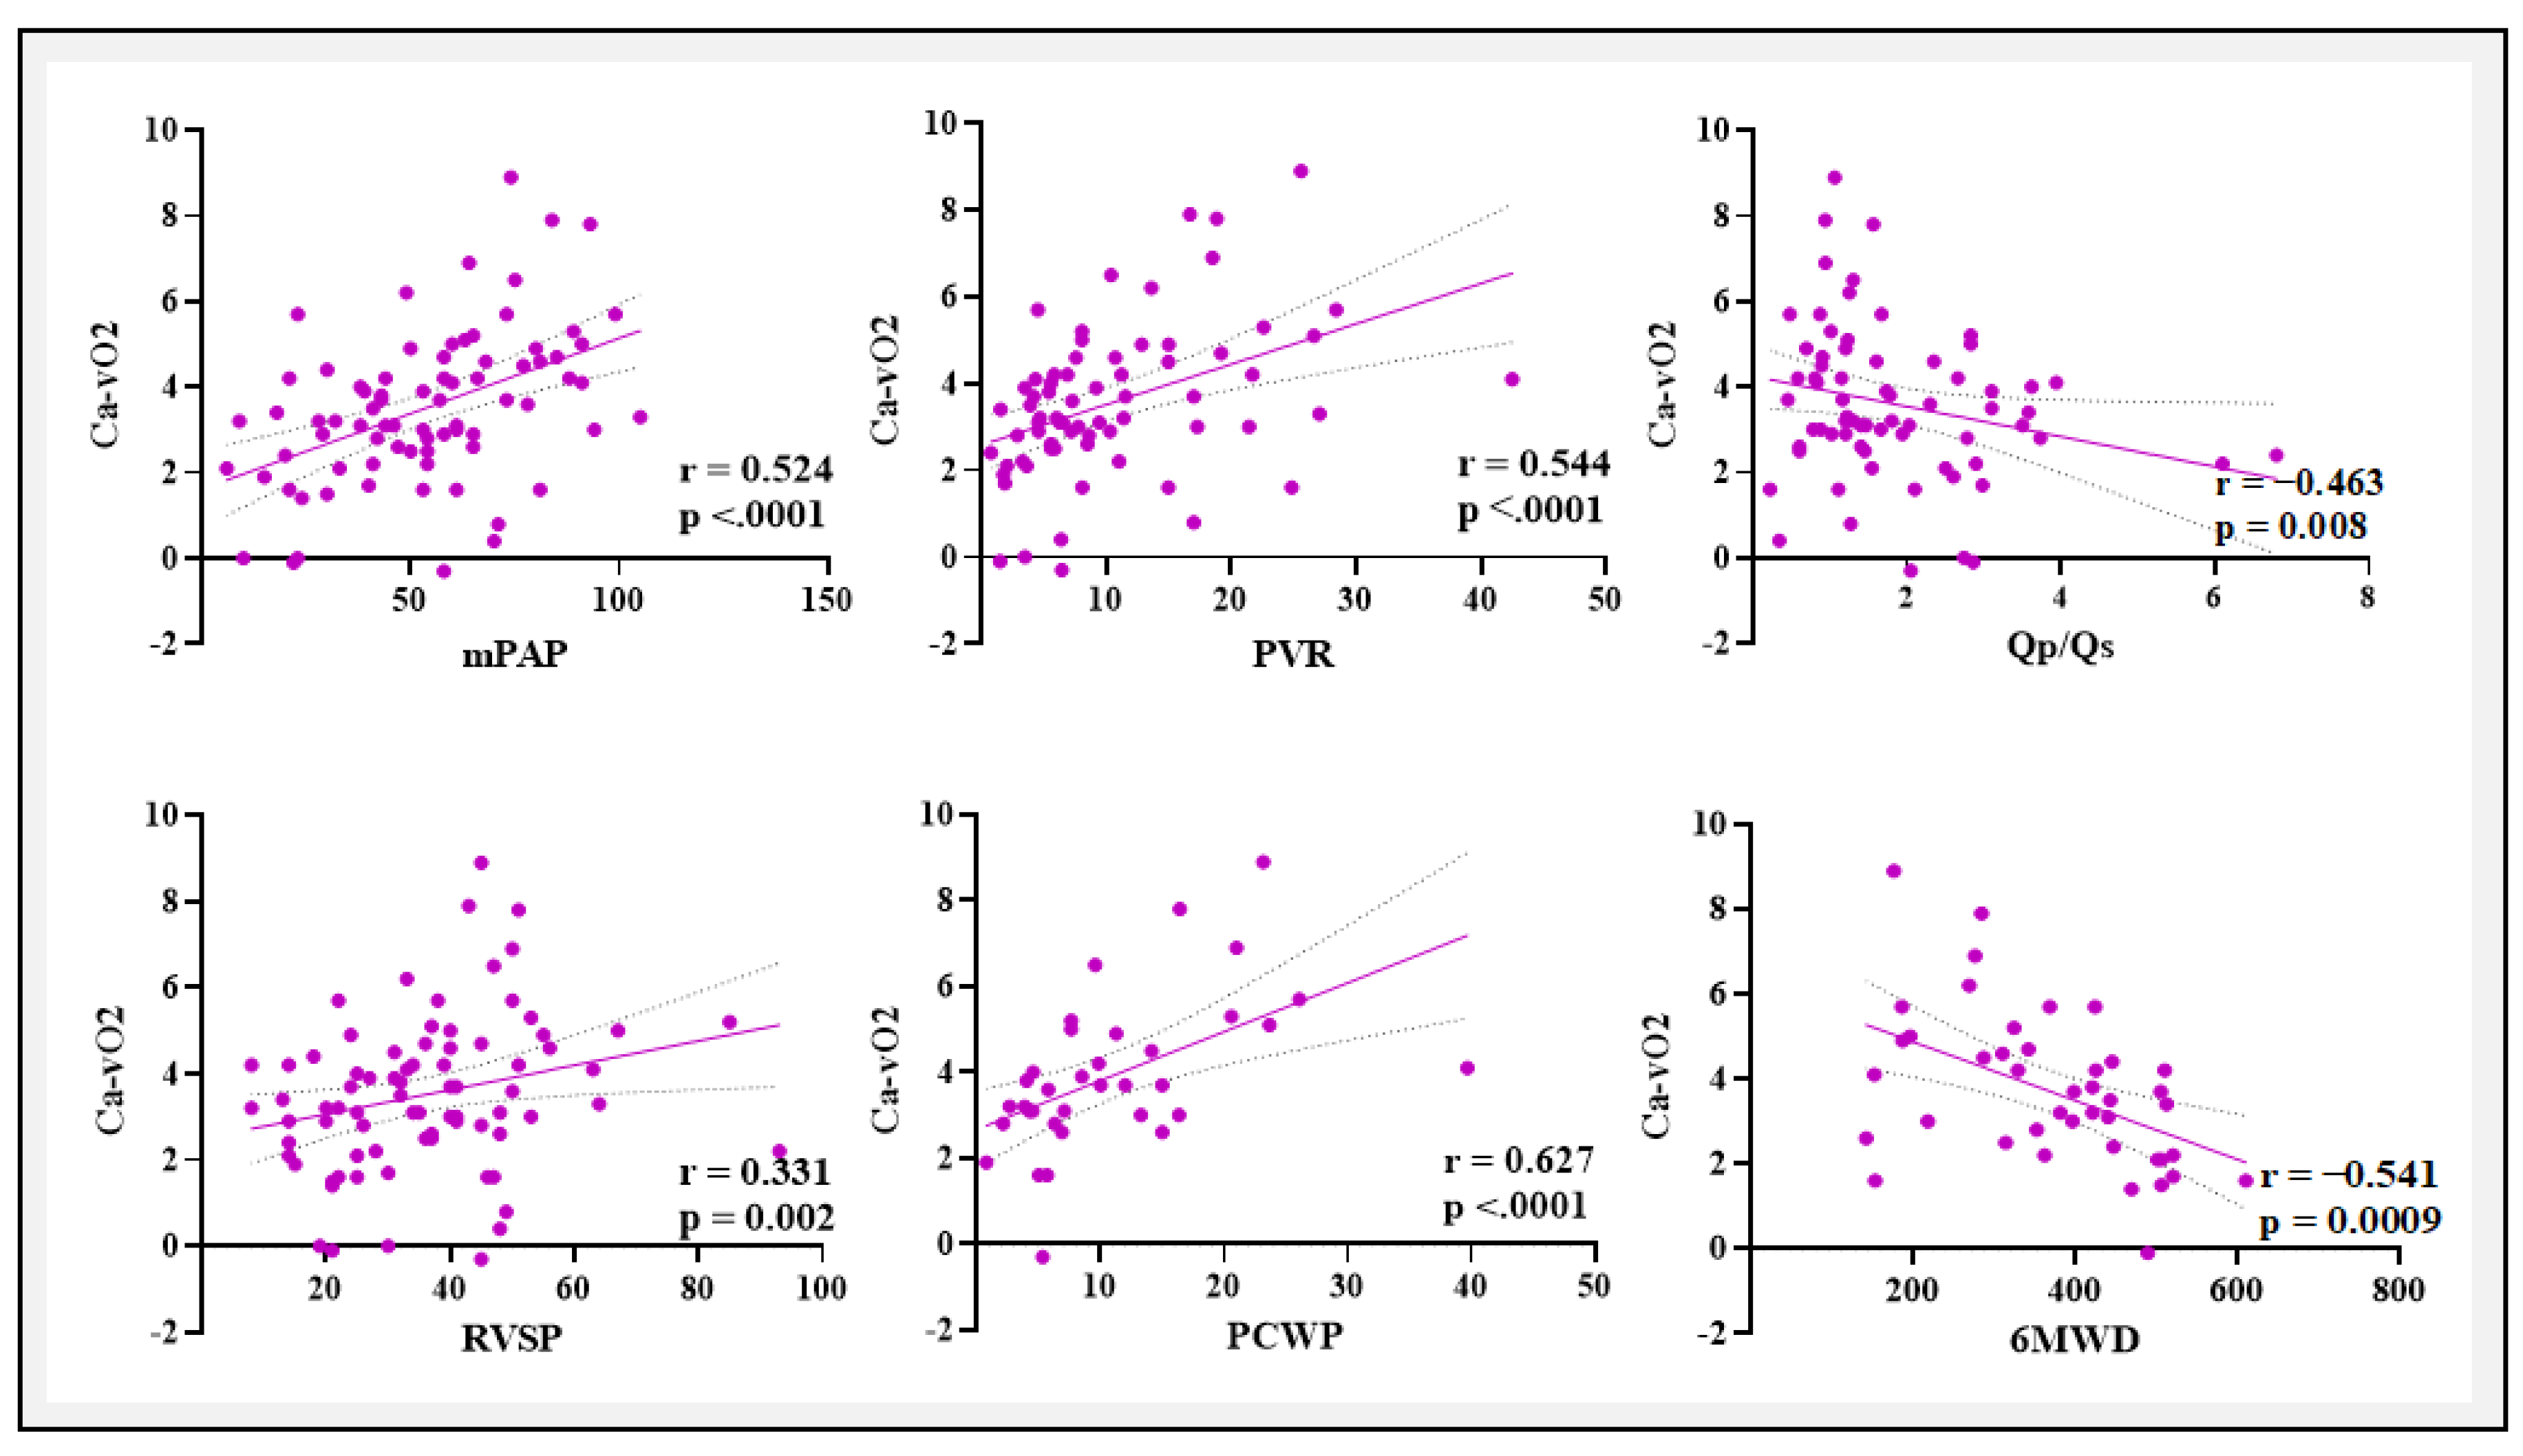
28] To our knowledge, this is the first study that evaluates the association of blood gases in CHD-related PAH patients. The main findings of our study are summarized as follows: (a) The Ca−vO2 exhibited a moderate correlation with RHC parameters (mPAP, PVR, RVSP, and PCWP), highlighting its association with PAH severity. (b) Ca−vO2 also served as a significant negative diagnostic predictor for distinguishing between Qp/Qs < 1.5 and ≥ 1.5, with an optimal cut-off value of <4.3mmol/L, yielding an AUC of 0.71, sensitivity of 88.8%, and specificity of 53.4%. (c) Additionally, non-invasive parameters such as 6MWD, TAPSE, and IVC diameter demonstrated strong predictive value for differentiating between Qp/Qs < 1.5 and ≥ 1.5.
What is the Relationship Between Blood Gases and Hemodynamic Parameters?
A positive correlation exists between Ca−vO2 and mPAP, PVR, RVSP, and PCWP, but a negative correlation with Qp/Qs and 6MWD. The negative correlation with Qp/Qs and 6MWD was to be expected as the shunt increases more arterial and venous blood going to mix eventually leading to lesser O2 content difference. These results imply that elevated Ca−vO2 correlates with more severe PAH, indicating compromised oxygen transport and consumption in advanced illness. These associations provide clinical support for the potential significance of blood gas parameters, particularly Ca-vO2, as indicators of PAH severity and functional impairment in CHD-related PAH.
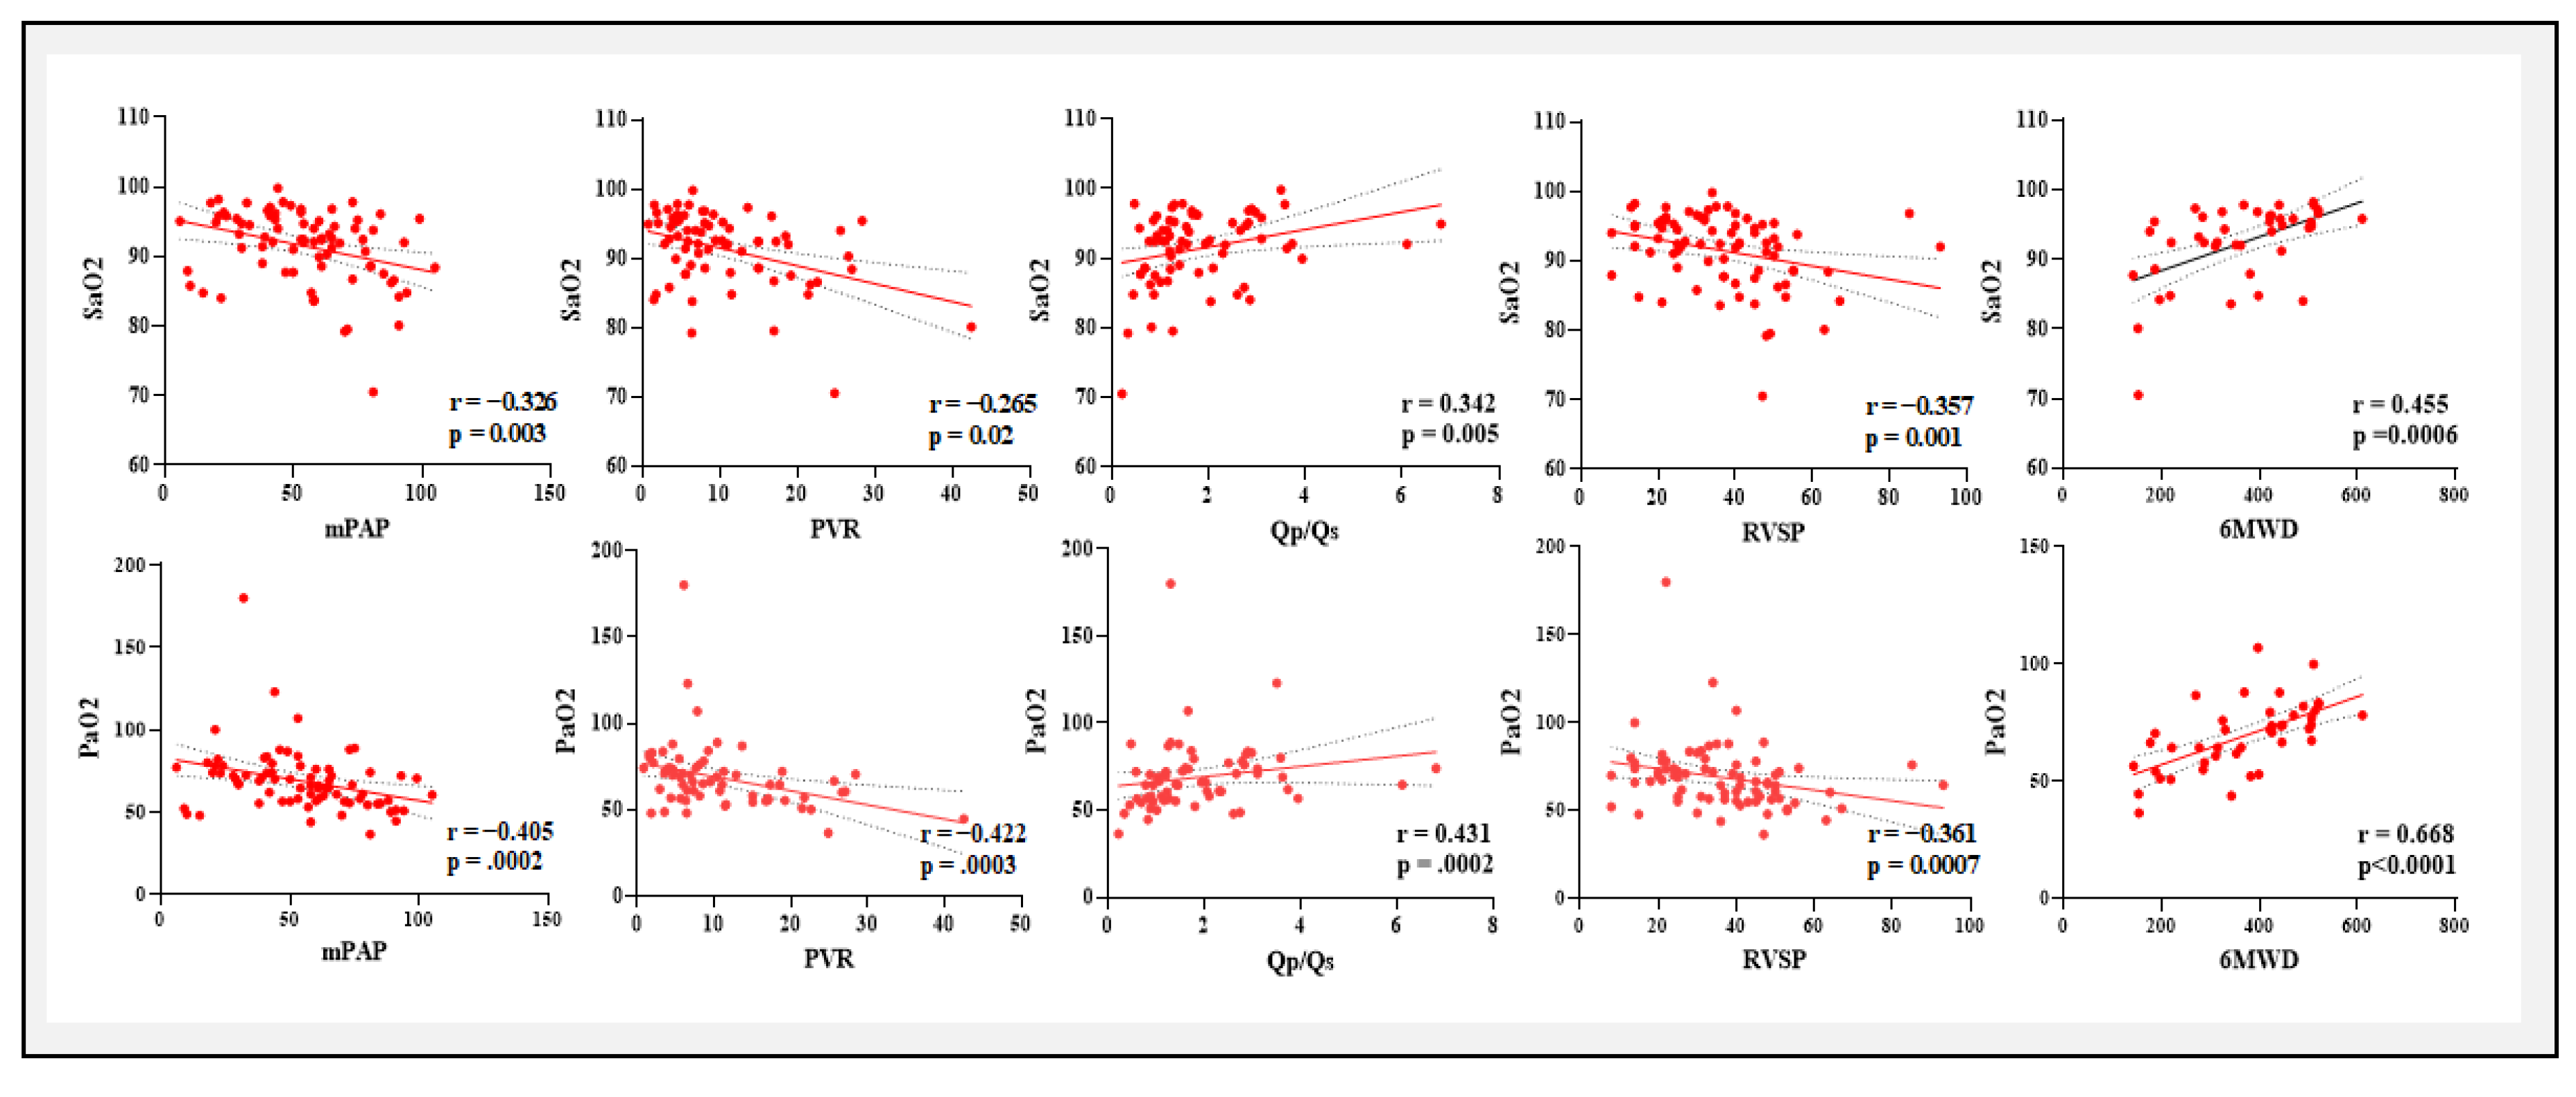
PaO
2 and SaO
2 demonstrated substantial negative relationships with critical indications of PAH severity, such as mPAP, PVR, and PCWP while they were positively correlated with Qp/Qs and 6MWD. These results were found in concordance with previous studies of blood gases in idiopathic PAH and chronic heart failure.[
29,
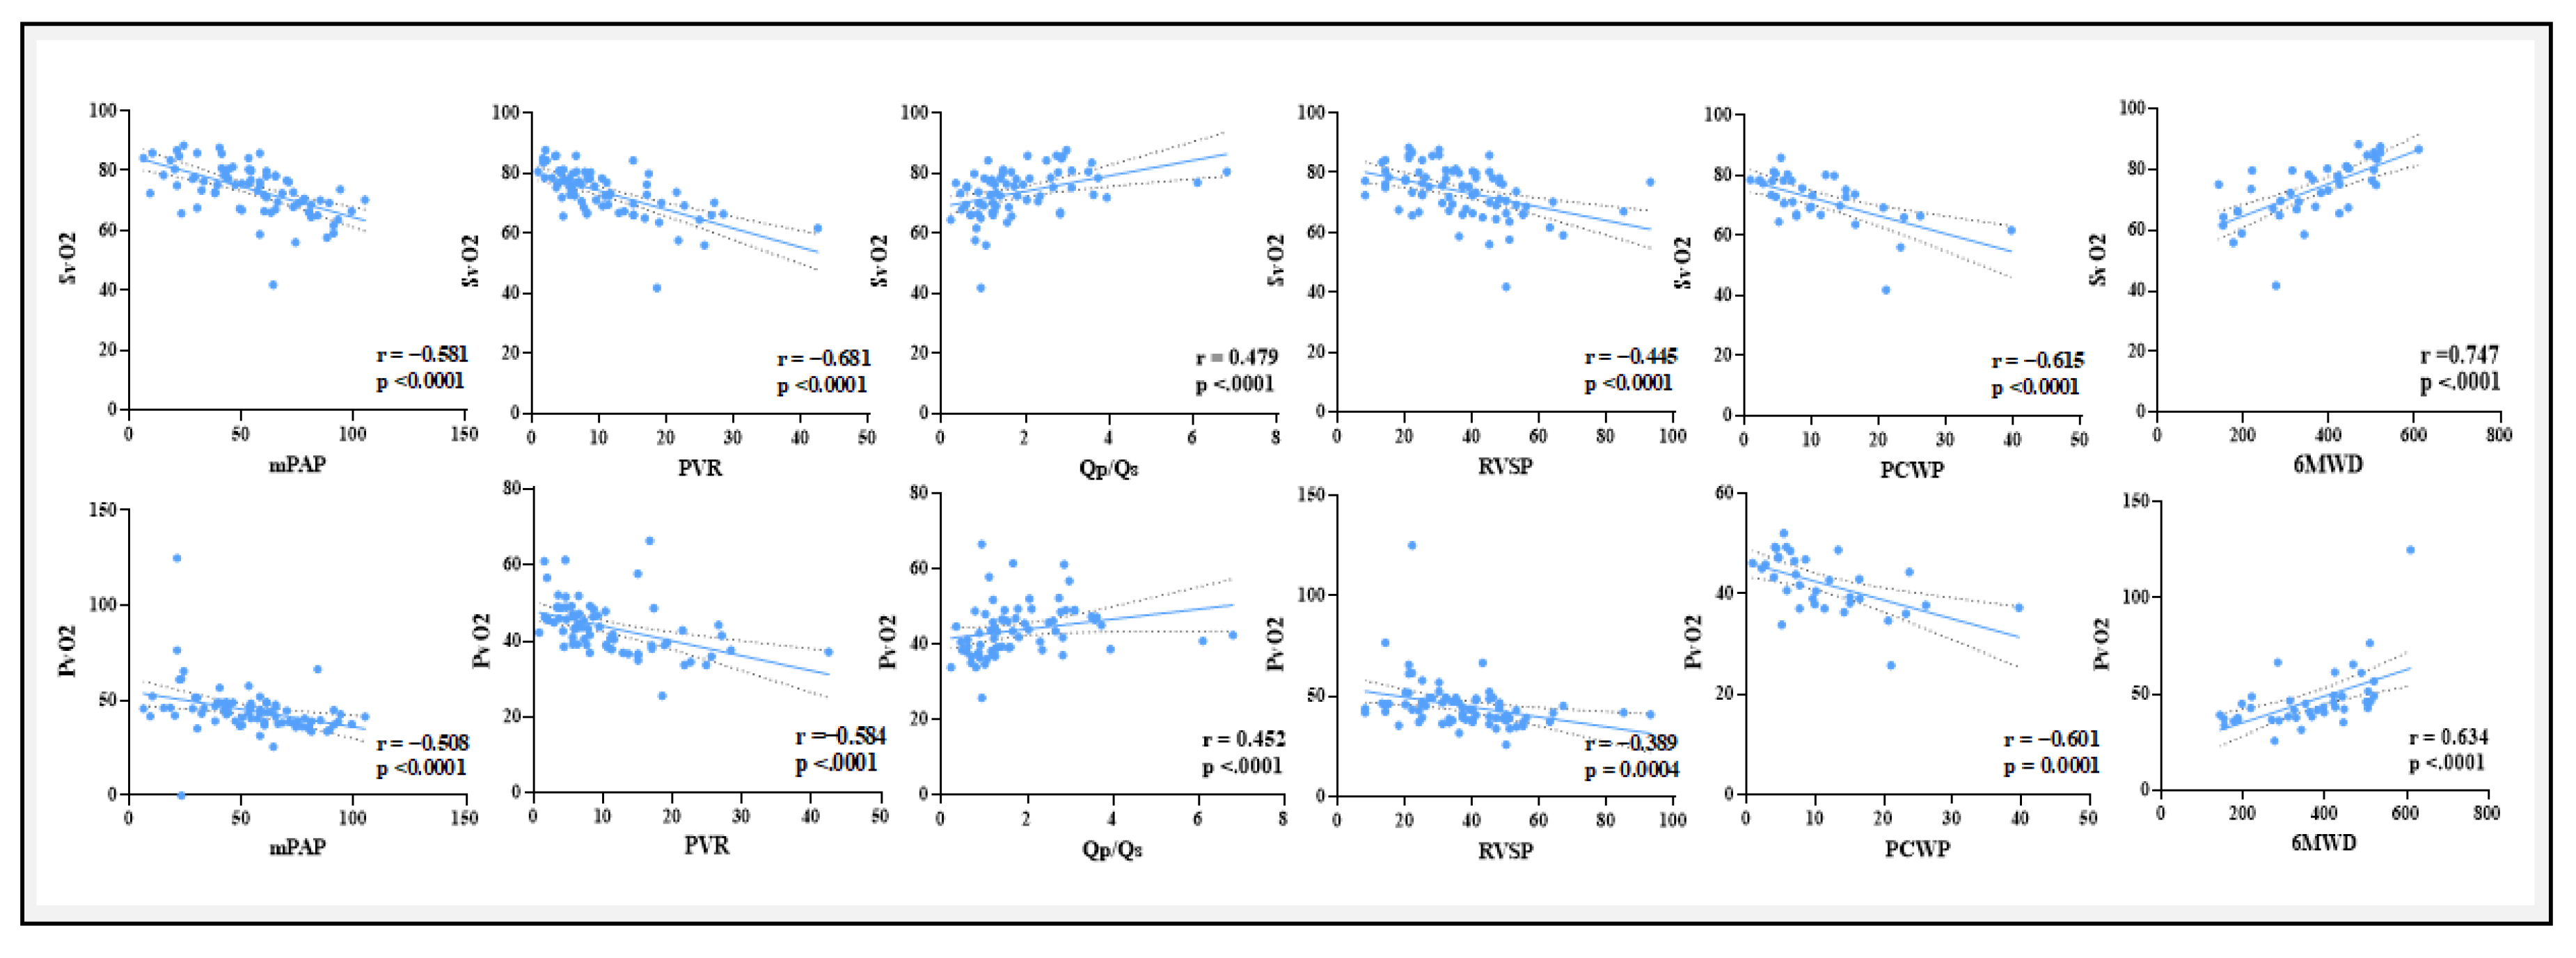
30] These findings suggest a connection between worse functional ability more severe pulmonary hypertension and decreased arterial oxygenation. Moreover, lower venous oxygen levels are linked to deteriorating hemodynamic status, as seen by the substantial negative correlations found between (PvO
2 and SvO
2) and PVR, mPAP, RVSP, and PCWP. Enhanced cardiac output and exercise tolerance may be correlated with enhanced venous oxygenation, as suggested by the positive associations with Qp/Qs and 6MWD.
In this study, we observed significant hemodynamic and functional differences between patients with Qp/Qs < 1.5 and ≥ 1.5, particularly in oxygenation and right heart function. The significantly higher Ca−vO2 in the Qp/Qs < 1.5 group (P = 0.003) suggests increased oxygen extraction in patients with lower shunt fractions, likely reflecting a compensatory mechanism in response to reduced pulmonary blood flow. In contrast, patients with Qp/Qs ≥ 1.5 demonstrated improved functional capacity, as indicated by a significantly greater 6MWD (P < 0.0001). These findings align with the clinical understanding that significant left-to-right shunts can increase pulmonary blood flow, enhancing oxygen delivery and functional performance. Interestingly, SaO2 (P = 0.03) and SvO2 (P = 0.009) were significantly higher in the Qp/Qs ≥ 1.5 group, likely reflecting the greater oxygenation and systemic circulation associated with higher shunt ratios. The significant differences in TAPSE and IVC diameter further highlight the impact of Qp/Qs on right ventricular function and preload. These findings suggest that, beyond oxygen parameters, right ventricular function plays a critical role in the clinical manifestations of patients with differing shunt magnitudes.
Univariate logistic regression analysis identified SvO2, Ca−vO2, 6MWD, TAPSE, and IVC diameter as significant predictors to distinguish between two groups (Qp/Qs < 1.5 and ≥ 1.5). However, these variables lost significance in multivariate analysis, indicating potential confounding effects or overlapping contributions. Among these, IVC diameter emerged as the strongest predictor, highlighting the importance of structural cardiac parameters in assessing Qp/Qs. These findings underscore the complex interplay between gas exchange parameters and right heart function in determining Qp/Qs ratios.
Our ROC curve analysis demonstrated that Ca−vO2, 6MWD, TAPSE, and IVC diameter have varying degrees of diagnostic accuracy for predicting Qp/Qs ratios. Ca−vO2 showed moderate diagnostic accuracy with an AUC of 0.71 and an optimal < 4.3 mM cut-off. In comparison, 6MWD had a higher diagnostic value with an AUC of 0.87, while TAPSE and IVC diameter also provided useful diagnostic information with AUCs of 0.71 and 0.85, respectively. These findings highlight the potential of these parameters as non-invasive markers to distinguish between two groups in clinical settings.
Potential for Readily Available Sources of Blood Sampling in Clinical Practice
Even though blood samples from the venous and arterial systems were taken for the current study during RHC, these results show the potential value of evaluating blood gas parameters from more easily accessible sources, like the superficial radial artery and vein. This method might provide a more useful and less intrusive substitute for continuous monitoring in clinical settings, all the while offering insightful information on the condition of the patient.
Study Limitations
Our study has several limitations including a single-center study along with a retrospective study design. Treatment strategies varied over a long study period hence was difficult to assess the effect of medication on blood gases. Moreover, since only patients with CHD-related were included, the present findings may not be generalized to other patient populations with confounding factors, such as restrictive or obstructive lung disease or anemia. Despite these limitations, while the literature on this specific association is limited, our results align with broader trends observed in related studies on PAH severity markers, diagnostic tools, or predictors like mPAP, PVR, or 6MWD. Also, the fact that blood gases were routinely obtained from all patients allows the current authors to draw some meaningful and clinically important conclusions.
Conclusion
This study highlights the potential of, which closely correlates with important hemodynamic parameters determined via RHC, as a useful diagnostic marker for CHD-related PAH. Although venous and arterial systems were used to obtain blood samples during RHC, the findings suggest the potential for using more accessible sites i.e. superficial radial artery and vein for blood gas assessment. In addition to Ca−vO2, non-invasive measurements like IVC diameter, TAPSE, and 6MWD, exhibit a strong correlation with Qp/Qs, offering enhanced diagnostic accuracy. These findings can aid in the clinical decision-making process, particularly in determining whether surgical procedures are necessary.
Funding
This study was supported by the National Natural Science Foundation of China (82270057), the Clinical Research Award of the First Affiliated Hospital of Xi’an Jiaotong University, China (XJTU1AF-CRF-2019-010), and the Fundamental Project Plan in Shaanxi Province, China (2020JM-364). The funders had no role in the study design, data collection, data analysis, publication decision, or manuscript preparation.
Author contributions
A.A, contributed to the study design, data analysis, original draft writing, figures and tables. S.Z was involved in study design, RHC procedures and data collection. L.L was a major contributor for echocardiography and image collection. X.W was involved in images collection and help in draft writing. T.L was involved in clinical data collection and echocardiography. F.F contributed to conception, study design, analysis and reviewing of the manuscript. All authors read and approved the final manuscript.
Conflicts of interest
The authors declare no conflict of interest.
References
- S. J. Cassady, G. V. Ramani. Right heart failure in pulmonary hypertension. Cardiol Clin, 2020, 38(2): 243-255.
- M. M. Hoeper, M. Humbert, R. Souza, et al. A global view of pulmonary hypertension. Lancet Respir Med, 2016, 4(4): 306-22.
- R. Tonelli, V. Arelli, O. A. Minai, et al. Causes and circumstances of death in pulmonary arterial hypertension. Am J Respir Crit Care Med, 2013, 188(3): 365-9.
- M. M. Hoeper, C. Pausch, K. M. Olsson, et al. Compera 2.0: A refined four-stratum risk assessment model for pulmonary arterial hypertension. Eur Respir J, 2022, 60(1).
- E. Frost, D. B. Badesch, R. J. Barst, et al. The changing picture of patients with pulmonary arterial hypertension in the united states: How reveal differs from historic and non-us contemporary registries. Chest, 2011, 139(1): 128-37.
- M. Humbert, G. Kovacs, M. M. Hoeper, et al. 2022 esc/ers guidelines for the diagnosis and treatment of pulmonary hypertension. Eur Heart J, 2022, 43(38): 3618-3731.
- G. E. D’Alonzo, R. J. Barst, S. M. Ayres, et al. Survival in patients with primary pulmonary hypertension. Results from a national prospective registry. Ann Intern Med, 1991, 115(5): 343-9.
- G. Simonneau, D. Montani, D. S. Celermajer, et al. Haemodynamic definitions and updated clinical classification of pulmonary hypertension. Eur Respir J, 2019, 53(1).
- N. Galiè, M. Humbert, J. L. Vachiery, et al. 2015 esc/ers guidelines for the diagnosis and treatment of pulmonary hypertension: The joint task force for the diagnosis and treatment of pulmonary hypertension of the european society of cardiology (esc) and the european respiratory society (ers): Endorsed by: Association for european paediatric and congenital cardiology (aepc), international society for heart and lung transplantation (ishlt). Eur Respir J, 2015, 46(4): 903-75.
- M. M. Hoeper, H. J. Bogaard, R. Condliffe, et al. Definitions and diagnosis of pulmonary hypertension. J Am Coll Cardiol, 2013, 62(25 Suppl): D42-50.
- E. Grünig, A. J. Peacock. Imaging the heart in pulmonary hypertension: An update. Eur Respir Rev, 2015, 24(138): 653-64.
- M. Humbert, G. Kovacs, M. M. Hoeper, et al. 2022 esc/ers guidelines for the diagnosis and treatment of pulmonary hypertension. Eur Respir J, 2023, 61(1).
- G. Simonneau, M. A. Gatzoulis, I. Adatia, et al. Updated clinical classification of pulmonary hypertension. J Am Coll Cardiol, 2013, 62(25 Suppl): D34-41.
- K. K. Stout, C. J. Daniels, J. A. Aboulhosn, et al. 2018 aha/acc guideline for the management of adults with congenital heart disease: A report of the american college of cardiology/american heart association task force on clinical practice guidelines. J Am Coll Cardiol, 2019, 73(12): e81-e192.
- H. Baumgartner, J. De Backer, S. V. Babu-Narayan, et al. 2020 esc guidelines for the management of adult congenital heart disease. Eur Heart J, 2021, 42(6): 563-645.
- J. W. Dushane, W. H. Weidman, R. O. Brandenburg, et al. The electrocardiogram in children with ventricular septal defect and severe pulmonary hypertension. Correlation with response of pulmonary arterial pressure to surgical repair. Circulation, 1960, 22: 49-54.
- P. Ferrero, A. Constantine, M. Chessa, et al. Pulmonary arterial hypertension related to congenital heart disease with a left-to-right shunt: Phenotypic spectrum and approach to management. Front Cardiovasc Med, 2024, 11: 1360555.
- R. L. Benza, M. Gomberg-Maitland, R. Naeije, et al. Prognostic factors associated with increased survival in patients with pulmonary arterial hypertension treated with subcutaneous treprostinil in randomized, placebo-controlled trials. J Heart Lung Transplant, 2011, 30(9): 982-9.
- J. A. Feinstein. Evaluation, risk stratification, and management of pulmonary hypertension in patients with congenital heart disease. Semin Thorac Cardiovasc Surg Pediatr Card Surg Annu, 2009: 106-11.
- M. Beghetti, N. Galiè. Eisenmenger syndrome a clinical perspective in a new therapeutic era of pulmonary arterial hypertension. J Am Coll Cardiol, 2009, 53(9): 733-40.
- R. J. Oudiz, D. J. A. i. P. H. Langleben. Cardiac catheterization in pulmonary arterial hypertension: An updated guide to proper use, 2005, 4(3): 15-25.
- Selzer, R. B. Sudrann. Reliability of the determination of cardiac output in man by means of the fick principle. Circ Res, 1958, 6(4): 485-90.
- M. M. Hoeper, R. Maier, J. Tongers, et al. Determination of cardiac output by the fick method, thermodilution, and acetylene rebreathing in pulmonary hypertension. Am J Respir Crit Care Med, 1999, 160(2): 535-41.
- K. Sindhu, D. Malviya, S. Parashar, et al. Correlation of central venous-to-arterial carbon dioxide difference to arterial-central venous oxygen difference ratio to lactate clearance and prognosis in patients with septic shock: A prospective observational cohort study. Int J Crit Illn Inj Sci, 2022, 12(3): 146-154.
- J. A. Hanley, B. J. McNeil. The meaning and use of the area under a receiver operating characteristic (roc) curve. Radiology, 1982, 143(1): 29-36.
- J. A. Hanley, B. J. McNeil. A method of comparing the areas under receiver operating characteristic curves derived from the same cases. Radiology, 1983, 148(3): 839-43.
- H. Nawaytou, R. Lakkaraju, L. Stevens, et al. Management of pulmonary vascular disease associated with congenital left-to-right shunts: A single-center experience. J Thorac Cardiovasc Surg, 2024.
- N. Galie, A. Manes, M. Palazzini, et al. Management of pulmonary arterial hypertension associated with congenital systemic-to-pulmonary shunts and eisenmenger’s syndrome. Drugs, 2008, 68(8): 1049-66. [CrossRef]
- M. M. Hoeper, M. W. Pletz, H. Golpon, et al. Prognostic value of blood gas analyses in patients with idiopathic pulmonary arterial hypertension. Eur Respir J, 2007, 29(5): 944-50.
- R. Wensel, P. Georgiadou, D. P. Francis, et al. Differential contribution of dead space ventilation and low arterial pco2 to exercise hyperpnea in patients with chronic heart failure secondary to ischemic or idiopathic dilated cardiomyopathy. Am J Cardiol, 2004, 93(3): 318-23. [CrossRef]
|
Disclaimer/Publisher’s Note: The statements, opinions and data contained in all publications are solely those of the individual author(s) and contributor(s) and not of MDPI and/or the editor(s). MDPI and/or the editor(s) disclaim responsibility for any injury to people or property resulting from any ideas, methods, instructions or products referred to in the content. |
© 2025 by the authors. Licensee MDPI, Basel, Switzerland. This article is an open access article distributed under the terms and conditions of the Creative Commons Attribution (CC BY) license (http://creativecommons.org/licenses/by/4.0/).