
Submitted:
03 January 2025
Posted:
08 January 2025
You are already at the latest version
Abstract
Background/Objectives: Chlorhexidine digluconate (CHX) is widely regarded as the gold standard for oral mucosa antiseptic treatments but has been associated with delayed healing, scar formation, microbiome alterations, and fibroblast toxicity. Tocopherol, with its ability to accelerate tissue healing and minimal side effects, has emerged as a potential alternative. This randomized clinical trial aimed to compare the efficacy of topical tocopherol acetate and 0.2% chlorhexidine in managing postoperative pain and wound healing following oral cavity biopsies. Methods: Seventy-seven patients undergoing oral biopsies were divided into two groups: the test group (tocopherol acetate) and the control group (0.2% chlorhexidine). Pain was assessed using VAS scores on days 1 and 6 postoperatively, and wound healing was evaluated through measurements of the biopsy site's height and width from standardized photographs analyzed with ImageJ. Painkiller use was also documented. The study followed CONSORT guidelines, with ethical approval from the Padua Ethics Committee and registration on ISRCTN. Results: No significant differences were found between the groups in VAS scores, wound dimensions, or painkiller use (p>0.05). However, significant pain reduction within each group was observed (p<0.0001). Conclusions: Tocopherol acetate showed comparable efficacy to chlorhexidine, suggesting it could be a viable alternative for postoperative care in oral surgery
Keywords:
biopsy
; oral cavity
; chlorhexidine
; tocopherol
; pain
; healing
; ImageJ
1. Introduction
Biopsy is "the observation of organ or tissue fragments taken from a living being" [1]. It is a term that encompasses different techniques, all of which allow microscopic visualization of tissue pieces. About 5-15% of the general population presents oral mucosal abnormalities. Most of these lesions are clinically and biologically benign, but some may be precancerous. The clinical signs of oral malignancies are well known, but the challenge is to distinguish them from benign lesions. The lack of clinical experience in differential diagnosis can lead to delays in oral cancer diagnosis. Moreover, some precancerous lesions may be present in mucosae that appear clinically normal during a clinical examination [2].
For this reason, biopsy is considered an indispensable examination for the correct etiopathogenetic framework, differential diagnosis, and prognosis, and the subsequent planning of adequate therapeutic treatment [3,4,5]. There are two types of biopsy that can be performed, the choice of which is based on the diagnostic hypothesis. When this is doubtful or confirmation of the presumptive diagnosis is needed, an incisional biopsy will be chosen to obtain a definitive diagnosis, which is only possible through histopathological investigation, and which will guide the most appropriate therapeutic choice. When the diagnostic hypothesis is oriented towards an undoubtedly benign lesion, an excisional biopsy will be chosen [3].
Regarding the management of the biopsy site, it is usual to prescribe chlorhexidine digluconate, an antiseptic effective against a wide variety of bacteria, including gram-positive and gram-negative. It is considered a gold standard drug in the antiseptic treatment of oral mucosae, and among oral antiseptics, 0.2% or 0.12% chlorhexidine is the most widely used [3,6]. It has been incorporated into various oral products at various concentrations and formulations. It was the search for greater product stability or the minimization of side effects that led manufacturers to create more and different formulations [7].
Chlorhexidine can cause irritation as it is a very effective antibacterial substance against plaque, but with cytotoxic effects. It has been shown that after rinsing, chlorhexidine remains in the oral cavity for 11 hours and is still detectable after 24 hours [8,9]. Long-term daily use of chlorhexidine is not recommended due to its numerous undesirable side effects [10,11,12] which may prevent its prolonged use.
From a cytogenetic point of view, an in vitro study [8] has shown that CHX significantly reduces the cell adhesion capacity of fibroblasts and keratinocytes. In particular, gene expression of various matrix components and cell adhesion receptors was found to be downregulated in cells washed with CHX. However, an in vivo cytogenetic investigation [7] did not observe statistically significant differences regarding cell proliferation and cell death (chromatin condensation, karyorrhexis, pyknosis, and karyolysis) or alterations of the oral mucosa.
Various studies have investigated the scar healing produced by CHX. A recent in vitro study [9] has shown that the use of chlorhexidine in the oral cavity applied during the 24 hours following oral surgery induces a reduction in cell proliferation, increases collagen deposition, expression of pro-apoptotic molecules and markers for fibroblasts, thus promoting tissue healing with scar formation.
Similarly, from the results of their in vitro study, Mariotti and Rumpf [13] hypothesized that chlorhexidine used in surgical sites before wound closure could presumably have severe toxic effects on fibroblasts and negatively affect wound healing.
On the contrary, the rat study by Hammad et al. [14] found that the use of 0.2% chlorhexidine-containing gel on excisions including epithelium and connective tissue did not have a negative effect on wound healing compared to other agents. However, in a study on rats [15], it was shown that chlorhexidine rinsing influences wound healing on standardized open muco-osseous lesions; increasing the concentration of chlorhexidine (0.1%, 0.2%, 0.5%) caused a delay in wound healing. In particular, on hamster oral mucosa [16], application to exposed connective tissue leads to vascular alterations (not present if applied to tissue without solution of continuity).
The study by Arduino et al. [17] evaluated wound healing by comparing treatment with 0.2% CHX, 0.12% CHX, and no treatment. Wound healing seemed better in patients treated with 0.2% CHX, especially compared to those treated with 0.12% CHX.
The difference in results could be due to the different study model (in vitro, in vivo on animals, in vivo on humans) or because chlorhexidine behaves differently based on the chosen model (for example, in the oral cavity, a portion binds to bacteria and a portion precipitates [18]).
The use of chlorhexidine in the post-operative period is based on the concept that it can reduce the bacterial load of the area subjected to surgery [19]. Analyzing the effects of CHX from a microbiological point of view, it seems to cause an alteration of the microbiome (increase in firmicutes and proteobacteria) leading to a decrease in salivary pH and buffering capacity, accompanied by an increase in lactate and glucose levels in saliva, according to an in vivo study [20]. After the use of CHX, lower concentrations of nitrites were found in saliva and plasma, followed by a tendency to increase systolic pressure.
It prevents the oxidation of polyunsaturated fatty acid membranes by acting as a stabilizer and reduces free radicals. Its power has been thoroughly investigated; in particular, Traber and Atkinson [21] state that tocopherols are likely to influence the properties of cell membranes by modulating receptors and signaling pathways that depend on the presence of lipids in specific regions of the membrane. The specific vitamin function of α-tocopherol would therefore be to protect long-chain polyunsaturated fatty acids, thus maintaining adequate levels for cell signaling processes.
The formation of free radicals can occur within our body following events such as intense radiation or ischemia and subsequent reperfusion [22,23].
Furthermore, tocopherol has complex interactions through the eicosanoid system leading to an inhibition of prostaglandin synthesis, a decrease in PGE2 synthesis probably because it inhibits the release of arachidonic acid through the inhibition of phospholipase A2, an inhibition of lipoxygenase function in platelets with interruption of production of thromboxanes A2 and B2 with anti-inflammatory effect. On the other hand, it increases the production of prostacyclin and the function of lipoxygenases in granulocytes [24,25,26].
From an in vitro study, tocopherol seems to accelerate cell proliferation in tissue healing processes, increasing the synthesis of bFGF (basic fibroblast growth factor) and type I collagen, produced by gingival fibroblasts and periodontal ligament fibroblasts, in the 24 hours following surgery [27].
Tocopherol acetate-based products are already used in many anatomical districts, especially on the skin, but also on nasal, genital-perianal, ocular mucosa, and in the external auditory canal [28,29,30]. A peculiar characteristic of using α-tocopherol acetate oil as the main phase is the absence of a vehicle in which the active ingredient is dissolved. This results in greater chemical and microbiological stability of the compound and a reduction in the risk of adverse reactions due to excipients [31].
Ruiz-Tovar and Llavero [30] compared treatment with tocopherol acetate and glyceryl trinitrate in chronic perianal ulcers, observing that tocopherol led to better healing, with significantly less recurrence than in the group treated with glyceryl trinitrate; pain measured by visual analog scale was also perceived in significantly lower amounts in the group treated with tocopherol acetate.
Vitamin E also seems to be effective in the treatment of digital ulcers in systemic sclerosis, leading to better healing with less perceived pain compared to the standard of care used in the treatment of this type of lesion [32].
It is also already used in the oral cavity. An in vivo study has shown that when applied topically in the oral cavity on chemotherapy-induced mucositis, it made wound healing faster [22].
Cohen et al. [33] in 1991 compared a 5% tocopherol gel, 0.2% chlorhexidine, and placebo gel for the treatment of periodontal disease and plaque onset. As this is a pathology mainly induced by the accumulation of bacteria and consequent biofilm creation, the use of chlorhexidine proved more effective.
Bacci et al. [34] tested tocopherol acetate comparing it with a placebo in patients with lichen planus. No statistically significant differences emerged in terms of VAS and length of lesions in the oral cavity, but it was effective in decreasing the overall affected area of the lesions and in the Thongprasom scale score.
2. Materials and Methods
The purpose of this randomized clinical trial is to evaluate the efficacy of topical tocopherol acetate compared to 0.2% chlorhexidine in managing postoperative pain and the quality of surgical wound healing in patients undergoing oral cavity biopsy.
The null hypothesis is that there are no differences between the two groups in terms of pain variation and wound healing quality.
2.1. Trial Design
This single-center, simple randomized, non-blinded, controlled, parallel-group study was designed according to the updated CONSORT guidelines for reporting parallel group randomized trials [38]. The study was conducted at the Dental Clinic of the Padua University Hospital. 90 patients scheduled for oral mucosal biopsy were enrolled between January 2022 and July 2024.
Initially, a control group with no treatment was chosen. Since chlorhexidine treatment is the gold standard and the most commonly prescribed treatment, it was decided to assign chlorhexidine treatment to the control group.
The methodological variation was registered on ISCTRN.
2.2. Participants
All surgical procedures were performed by the same examiner (A.B.). To induce local anesthesia, articaine hydrochloride 40mg/ml with adrenaline 5μg/ml was used. A 15 blade mounted on handle 3 or 5mm punch was used. The suture was performed with interrupted stitches using 3.0 or 4.0 polyglycolic acid suture (Polysorb™, Covidien, Dublin, Ireland). Where suturing was not possible for anatomical reasons, regenerated oxidized cellulose was used (Tabotamp®, Ethicon, NJ, USA). Photographs were taken before and at the end of the procedure with the aid of a millimeter periodontal probe to standardize and analyze the images with ImageJ (Wayne Rasband, US National Institute of Health, Bethesda).
For participant assignment, simple randomization was used with a coin toss by an examiner (C.B.) different from the examiner performing the surgical procedure (A.B.). The randomization list was kept in another building in a locked cabinet that could only be opened by the examiner who performed the randomization (C.B.). Another examiner (C.N.) enrolled the participants by performing the implementation. The examiner who performed the randomization (C.B.) communicated the assignment group to a fourth examiner (C.M.) at the end of the surgical procedure. Recruitment ended because the predetermined time limit was reached.
Inclusion criteria were:
- Patients scheduled for oral cavity biopsy at the University of Padua Dental Clinic
- Patients able to read and understand the information sheet and express informed consent
- Patients who, after being informed in detail about the treatment usage methods, adhered to the administration scheme
- Exclusion criteria were:
- Underage patients
- Patients on antiangiogenic therapy
- Patients on immunomodulator therapy
- Patients with known hypersensitivity to the device
Patients were given post-operative instructions as per the normal clinical practice of the clinic (no vigorous rinsing, no hot or hard foods, no ice application) and to take standard analgesic therapy (paracetamol 1000mg every 8 hours or ibuprofen 600mg every 6 hours) if necessary. They were also instructed to complete, on the first and sixth post-operative days, two sheets with an identification code with the representation of VAS-D.
Patients assigned to the test group TG (tocopherol acetate) were instructed to perform three topical applications per day of tocopherol acetate (Vea Filme OsHulka S.r.l., Rovigo) for 7 days after oral biopsy, spreading the gel on the lesion until it was covered. It was specified that it was not necessary to massage and it was advisable to avoid touching the area even with the tongue for at least 1-2 minutes to promote the formation of the protective film. Patients assigned to the control group CG (chlorhexidine digluconate) were instructed to perform three topical applications per day of spray containing 0.2% chlorhexidine for 7 days after oral biopsy.
Patients were re-evaluated by examiner C.N. on the sixth post-operative day, performing suture removal, photography with millimeter probe, collecting VAS-D recording, and noting adverse effects. The areas subjected to surgical intervention were divided into two subgroups:
- Attached gingiva: attached gingiva, retromolar trigone, edentulous ridge
- Loose mucosa: buccal mucosa, tongue, floor of mouth, lips, retrocommissure
2.3. Outcomes
The primary outcome was pain reduction from the first to the sixth post-operative day, measured on a visual analog scale, VAS-D, which corresponds to the visual representation of the amplitude of pain perceived by the patient and consists of a predetermined line 10 cm long, where the left end corresponds to no pain, and the right end to the worst possible pain. The patient is asked to mark on the line a sign that represents the level of pain experienced. At the 6-day check, VAS-D recordings (completed by the patient on the first and sixth day) were collected, and the numerical score was realized using a graduated scale placed on the back of the millimeter ruler (rounding down to .49 and up from .50).
The secondary outcome was to evaluate the quality of wound healing by measuring the height and width of the post-operative site photographed immediately after surgery and on the sixth post-operative day (photos analyzed and standardized with ImageJ).
The tertiary outcome was the variation of VAS-D in patients who took painkillers compared to patients who did not take them.
The outcomes were not changed during the trial.
Other factors were also considered: sex, age, smoking habit.
2.4. Sample Size
As there was no a priori information on the degree of difference expected to be found, a minimum number of 30 patients per group was taken with a two-year enrollment window. At the end of the enrollment period, the study was terminated with a number of 77 patients randomized at the end of implementation. The minimum number of participants had been reached, but the patients were not sufficient for a 1:1 randomization.
2.5. Blinding
It was not possible to conduct the trial blind for patients due to the obvious difference in formulation and consistency (gel vs liquid) and taste of the product. The professional (A.B.) who provided the care, the subject who collected the data (C.N.), the outcome evaluator (A.B.), and the statistician (M.C.) who analyzed the data were kept blinded.
2.6. Statistical Methods
Numerical variables were summarized as median and interquartile range (IQR), while categorical variables as absolute and relative frequency (percentage). Changes from day 1 to day 6 in VAS and wound dimensions were compared between the two groups (tocopherol acetate vs. chlorhexidine digluconate) with the Mann-Whitney test, and the effect was calculated as the difference of medians with 95% bootstrap confidence interval. The occurrence of complications was compared between the two groups with Fisher's test, and the effect was calculated as risk ratio with 95% confidence interval. The analysis was performed according to the "intention-to-treat" approach. Since 7 patients (9%) did not follow the prescribed therapy, a "per protocol" analysis of outcomes was also performed to provide more information to the reader. As exploratory analyses, the variation of VAS stratified between those who took and those who did not take painkillers, and the variation of wound dimensions between smokers and non-smokers were investigated. Furthermore, the association between sex and painkiller intake was investigated with the Chi-Square test. A p<0.05 was considered statistically significant. The limited sample size suggests caution in interpreting the results. Statistical analysis was performed with R 4.3 (R Foundation for Statistical Computing, Vienna, Austria).
3. Results
Of the total of 90 patients evaluated for eligibility by two examiners (C.N. and C.M.), 7 patients did not meet the inclusion criteria (4 underage patients, 2 patients taking immunomodulators, 1 patient taking antiangiogenics), 6 did not agree to participate in the trial. 77 patients were randomized, of which 51 women and 26 men.
The median age was 62 years (IQR 55-73); 40 patients were assigned to the test group (tocopherol acetate) and 37 to the control group (chlorhexidine digluconate). Table 1 shows the characteristics of patients in individual groups.
Of these, 5 patients in the test group and 2 patients in the control group did not take the treatment, reporting at the 6-day check that they did not consider it necessary due to absence of pain or because they had forgotten to apply the treatment; of the 5 patients in the test group, 1 patient also missed the check-up, so only pain was recorded via the VAS-D scale which led to a subsequent check; for the other 6 patients, pain was still recorded via VAS-D at 1 and 6 days and wound dimensions were measured.
Painkiller intake was similar between women (15/51, 29%) and men (7/26, 27%) (p=0.99).
Regarding the primary outcome, the analysis of VAS variation from day 1 to day 6 is reported in Table 2, Table 3 and Table 4. VAS decreased from day 1 to day 6 both in those treated with topical tocopherol (p<0.0001) and in those subjected to usual treatment (p<0.0001). In general, however, the variation in VAS was not statistically different in the two treatment groups (Table 2). The same results were confirmed using the "per protocol" approach (Table 2bis).

Table 2.
Change in VAS from day 1 to day 6.
| Test group (n=40) |
Control group (n=37) | Median difference (95% bootstrap confidence interval) | P value | |
|---|---|---|---|---|
| VAS day 1: median (IQR) | 2 (1; 4) | 2 (0; 4) | ||
| VAS day 6: median (IQR) | 0 (0; 1) | 0 (0; 0) | ||
| Variation in VAS: median (IQR) | 2 (1; 3) | 2 (0; 4) | 0 (from -1 to 1) | 0.99 |
Table 2.
bis. Change in VAS from day 1 to day 6 (“per protocol approach”).
| Test group (n=35) |
Control group (n=35) | Median difference (95% bootstrap confidence interval) | P value | |
|---|---|---|---|---|
| VAS day 1: median (IQR) | 2 (1; 4) | 2 (0; 4) | ||
| VAS day 6: median (IQR) | 0 (0; 1) | 0 (0; 1) | ||
| Variation in VAS: median (IQR) | 2 (1; 3) | 2 (0; 4) | 0 (from -1 to 1) | 0.99 |
Table 3.
Change in VAS from day 1 to day 6 in those who have not taken painkillers.
| Test group (n=26) |
Control group (n=29) | Median difference (95% bootstrap confidence interval) | P value | |
|---|---|---|---|---|
| VAS day 1: median (IQR) | 2 (0; 4) | 2 (0; 4) | ||
| VAS day 6: median (IQR) | 0 (0; 0) | 0 (0; 0) | ||
| Variation in VAS: median (IQR) | 2 (0; 3) | 2 (0; 3) | 0 (from -1 to 2) | 0.83 |
Table 4.
Change in VAS from day 1 to day 6 in those who have taken painkillers.
| Test group (n=14) |
Control group (n=8) | Median difference (95% bootstrap confidence interval) | P value | |
|---|---|---|---|---|
| VAS day 1: median (IQR) | 5 (2; 8) | 4 (2; 5) | ||
| VAS day 6: median (IQR) | 0 (0; 3) | 0 (0; 1) | ||
| Variation in VAS: median (IQR) | 2 (1; 6) | 2 (2; 4) | 0 (from -4 to 3) | 0.92 |
Figure 2 shows the graphical representation of VAS variation from day 1 to day 6 in the two groups.
3.1. VAS Stratified Between Those Who Have and Those Who Have not Taken Painkillers
3.2. Quality of Wound Healing
Regarding the secondary outcome, the analysis of wound healing quality in terms of dimensions (height H and width W) is reported in Table 5 and Table 6. In general, the variation in dimensions (height and width) was not statistically different in the two treatment groups (Table 5 and Table 6). The analysis was not performed on patients who did not show up for follow-up as it was not possible to collect the data. The same results were confirmed using the "per protocol" approach (Tables 5bis and 6bis).
Figure 3 shows a graphical representation via Tukey box plot of the variation of H and W in the two groups, and Figure 4 compares the initial and final values of H and W in the two groups.
Table 5.
Change in height from day 1 to day 6 (information not available in 10 patients).
| Test group (n=37) |
Control group (n=30) | Median difference (95% bootstrap confidence interval) | P value | |
|---|---|---|---|---|
| Height at day 1: median (IQR) | 6.7 (5.1; 8.0) | 6.4 (5.4; 7.3) | ||
| Height at day 6: median (IQR) | 4.0 (2.3; 5.6) | 3.5 (2.4; 4.8) | ||
| Variation in height: median (IQR) | 2.2 (0.8; 4.9) | 2.7 (1.2; 4.1) | -0.5 (from -1.6 to 1.7) | 0.91 |
Table 5.
bis. Change in height from day 1 to day 6 (“per protocol” approach).
| Test group (n=33) |
Control group (n=28) | Median difference (95% bootstrap confidence interval) | P value | |
|---|---|---|---|---|
| Height at day 1: median (IQR) | 6.7 (5.1; 8.1) | 6.4 (5.4; 7.3) | ||
| Height at day 6: median (IQR) | 4.2 (2.3; 6.0) | 3.5 (2.4; 4.8) | ||
| Variation in height: median (IQR) | 2.0 (0.8; 4.9) | 2.5 (1.0; 4.2) | -0.5 (from -2.4 to 1.0) | 0.85 |
Table 6.
Change in width from day 1 to day 6 (information not available in 10 patients).
| Test group (n=37) |
Control group (n=30) | Median difference (95% bootstrap confidence interval) | P value | |
|---|---|---|---|---|
| Width at day 1: median (IQR) | 2.5 (1.5; 6.6) | 2.2 (1.4; 3.5) | ||
| Width at day 6: median (IQR) | 1.7 (1.1; 3.9) | 1.4 (1.1; 2.0) | ||
| Variation in width: median (IQR) | 0.4 (-0.1; 2.7) | 0.7 (0.2; 1.5) | -0.2 (from -0.9 to 0.6) | 0.71 |
Table 6.
bis. Change in width from day 1 to day 6 (“per protocol” approach).
| Test group (n=33) |
Control group (n=28) | Median difference (95% bootstrap confidence interval) | P value | |
|---|---|---|---|---|
| Width at day 1: median (IQR) | 2.5 (1.5; 6.5) | 2.4 (1.4; 3.9) | ||
| Width at day 6: median (IQR) | 1.7 (1.1; 3.9) | 1.5 (1.1; 2.2) | ||
| Variation in width: median (IQR) | 0.5 (-0.2; 1.6) | 0.7 (0.2; 1.5) | -0.2 (from -1.1 to 0.5) | 0.56 |
3.3. Quality of Wound Healing Stratified Between Smokers and Non-Smokers
Even when stratifying between smokers and non-smokers, the variation in dimensions was not statistically different in the two treatment groups (Table 7, Table 8, Table 9 and Table 10). The analysis was not performed on patients who did not show up for follow-up and were simultaneously smokers or non-smokers.
3.4. Quality of Wound Healing: Comparison Between “Attached” and “Loose”
Comparing the wound healing quality between "attached" and "loose" sites, the variation in dimensions was statistically different in the two sites (Table 11 and Table 12). In particular, a greater reduction in height was observed for the "loose" site and a greater reduction in width for the "attached" site.
3.5. Adverse Effects
No complications occurred in the test group (0%), whereas three complications were identified in the control group (8%). These complications were recorded as burning sensation (n=2), and in one patient (n=1), a submucosal effusion on the external skin at the cheek level was observed, which at the 6-day follow-up was already in the healing phase. The difference was not statistically significant (Table 13). The same results were confirmed using the "per protocol" approach (Table 13bis).
Table 13.
Adverse effects.
| Test group (n=40) |
Control group (n=37) | Risk ratio (95% bootstrap confidence interval) | P value | |
|---|---|---|---|---|
| Adverse effects, n (%) | 0 (0%) | 3 (8%) | 0.15 (from 0.01 to 2.94) | 0.11 |
Table 13.
bis. Adverse effects (”per protocol” approach).
| Test group (n=35) |
Control group (n=35) | Risk ratio (95% bootstrap confidence interval) | P value | |
|---|---|---|---|---|
| Adverse effects, n (%) | 0 (0%) | 3 (9%) | 0.16 (from 0.01 to 3.16) | 0.24 |
4. Discussion
The results of this trial have demonstrated a non-significant difference between the two treatments compared, tocopherol acetate and chlorhexidine digluconate 0.2%, in alleviating pain at the oral biopsy surgical site in the post-operative period (p-value 0.99). Thus, the null hypothesis was confirmed. The maximum pain recorded at day 1 post-operative was a value of 10 in two patients (n=1 patient in the test group who had the lip as the surgical site and n=1 patient in the control group who had the palate as the surgical site); the maximum pain recorded on the sixth day was 8 (n=1 patient in the test group who had the attached gingiva as the surgical site). Unexpectedly, the use of painkillers did not improve post-operative pain, resulting statistically not different between those who took them and those who did not. It could also be hypothesized that some patients take analgesic therapy to prevent post-operative pain and not effectively as treatment. It is interesting to note how pain was perceived equally by women and men. It should be emphasized that in both groups, pain decreased significantly.
To analyze the photos taken immediately after the procedure and at 6 days, the ImageJ software was used. This program standardizes images based on a known length measurement and has been used by several authors to analyze digital images [34,39,40,41]. The photos were all taken with a millimeter periodontal probe before the intervention, after the intervention, and at 6 days. The photos used were those taken after the intervention and at 6 days. To try to minimize error in the evaluation of wound healing, it was decided to compare the sites also based on the anatomy of the region where the biopsy was performed, namely in loose mucosa (buccal mucosa, tongue, floor of mouth, lips, retrocommissure) (Figure 5) or attached (vestibular attached gingiva, retromolar trigone, edentulous ridge) (Figure 6) for their different extensibility.
Figure 7, Figure 8, Figure 9, Figure 10, Figure 11 and Figure 12 show the process of analyzing photos through ImageJ.
In the present study, however, no significant differences were recorded in the variation of wound size in terms of height and width between the two treatments. Statistically significant differences emerged in the measurement of the variables ΔH and ΔW referring to sites differentiated into loose mucosa and attached mucosa. This result finds explanation in the fact that lesions in loose mucosa were all sutured with one or more interrupted stitches, so they appeared in the post-operative period wide in height (5.6; 8.0), but with edges approximated in width (1.1; 2.2), thus at 6 days the decrease in height was statistically significant (2.3; 5.2), while a small solution of continuity remained at the suture level (1.1; 1.8). Therefore, the width does not vary. This does not happen for the attached mucosa where the height does not vary significantly as the lesion still remains wide looking at the before (5.1; 6.8) and after (2.4; 5.2), with the edges not being approximated. The variation is only 1.4. The width decreases significantly compared to the "loose mucosa" site, but overall it is still wider: 5.5 mm (2.8; 7.1) in the post-operative period and 2.6 mm (1.3; 4.8) at 6 days for attached mucosa compared to 1.5 mm (1.1; 2.2) and 1.3 (1.1; 1.8) respectively for loose mucosa.
So overall, loose mucosa seems to heal better than attached mucosa.
This allows us to observe, however, that tocopherol treatment is not worse than chlorhexidine treatment, which represents the gold standard.
For this study, it was chosen to treat the test group with tocopherol and the control group with chlorhexidine. After choosing "no treatment" as the control group, it was decided to change the treatment using chlorhexidine, which represents the gold standard [3,42] as it is usually used after oral surgery.
There is no consensus in the literature regarding the effects of chlorhexidine in the oral cavity. While some studies claim that it causes irritation, pigmentation, taste alteration, and oral microbiome alteration in addition to reduced cell proliferation having toxic effects on fibroblasts [8,9,10,11,13,20], others state that it does not lead to cellular alteration or cytogenetic damage, nor does it cause a negative effect on wound healing [7,14,17]. However, it is considered a gold standard drug in the antiseptic treatment of oral mucosae [3].
Tocopherol acetate has long been widely used on the skin [29,32] and more recently also on mucosae [28,30,34]. In this study, it was decided to use tocopherol due to the absence of side effects described in the literature [23,35,36,37], also due to the formulation of the product used which has acetate oil as the main phase, having no excipients and thus fewer triggers for the appearance of side effects [31], and for the benefits described both in vitro [27] and in vivo [25].
The biopsy procedure was chosen as the surgical procedure to compare tocopherol acetate and chlorhexidine because it is a standard procedure with comparable results, usually performable in a short time and which does not cause severe pain in most cases, as might be the case with third molar surgery.
Unexpectedly, there are few studies in the literature, insufficiently in-depth, about the use of vasoconstrictor in the biopsy procedure. The study by Margarone et al. [43] in 1985 histologically investigated various artifacts created during the biopsy sampling. Here, the use of 2% lidocaine with 1:100,000 epinephrine is mentioned, reporting that if hemostasis is necessary, infiltration can be used deeply relative to the lesion or infiltration after biopsy sampling. The study by Avon and Klieb [44] from 2012 reports the use of exactly the same anesthetic. Our clinical experience has not shown contraindications or artifact formation in the use of vasoconstrictor, particularly adrenaline, in low concentrations (5 micrograms/ml), associated with local anesthetic to obtain an anesthetic effect in view of performing biopsies of oral soft tissues. It could be clinically advantageous as it reduces intraoperative bleeding, improving visibility.
Contrary to what one might think, there are no indications and contraindications in the literature about the possibility of performing suturing at the biopsy site and the problems associated with it (for example, territorial or hematic dissemination in case of suturing in a tissue with an unexcised lesion). In the study by Jeng et al. [45] and Avon and Klieb [44], the possibility of performing suturing after the biopsy procedure is reported without further elaboration.
Regarding tobacco consumption, in this trial, 64 patients (83%) were non-smokers and 13 smokers (17%). It is widely documented in the literature that cigarette smoking represents a significant obstacle to wound healing. Tobacco, particularly nicotine, acts as a vasoconstrictor, causing a reduction in blood flow to the tissues involved in surgery, also due to its catecholamine release power and platelet aggregation, determining a risk of microvascular occlusion. The combination of vasoconstriction and microthrombosis leads to a condition of tissue ischemia [46]. Despite this, in this study, no significant difference in healing was evidenced between the group of smokers and the group of non-smokers; this result could be due to the limited sample size.
Having emerged that there is no difference between the two treatments, the use of tocopherol acetate could be considered as an alternative to chlorhexidine in the treatment of the post-surgical site in the oral cavity, given the absence of side effects, which instead occur in chlorhexidine treatment (pigmentation and microbiome alteration in particular). It remains, however, fundamental for surgical wounds that require antiseptic treatment.
Limitations were the inability to perform the study in a double-blind manner and the relatively limited sample size.
Further studies with a larger sample size, with a longer follow-up, and considering other types of surgical interventions such as post-extraction sites are deemed necessary. Future studies with a larger sample could focus on the effectiveness of the two treatments on wound healing quality by identifying four different study groups based on treatment and biopsy site (loose, attached). Another study arm with no treatment and one with placebo could have been used to increase the validity of the study, but this would imply a larger sample.
5. Conclusions
The results that emerged from this study indicate that there are no statistically significant differences between the application of tocopherol acetate or chlorhexidine digluconate 0.2% at the oral biopsy site in terms of decrease in perceived pain and wound healing quality; given the absence of side effects, which instead occur in chlorhexidine treatment, the use of tocopherol acetate could be considered as an alternative to chlorhexidine in the treatment of the post-surgical site in the oral cavity. Further studies are deemed necessary to confirm the results obtained. Future studies could provide a larger sample that allows comparing the quality of healing in attached and loose mucosa between the two treatments, different oral surgical sites, and comparison with a placebo group.
Author Contributions
For research articles with several authors, a short paragraph specifying their individual contributions must be provided. The following statements should be used “Conceptualization, CB, AB; methodology, CB, AB; software, CM, CN; validation, CB.; formal analysis, AB, CN; investigation,AB, CN, CM.; resources, CB.; data curation, AB, CN, CM.; writing—original draft preparation, AB.; writing—review and editing, AB, CB.; visualization, CB.; supervision,CB.; project administration, CB; funding acquisition, NA. All authors have read and agreed to the published version of the manuscript.” Please turn to the CRediT taxonomy for the term explanation. Authorship must be limited to those who have contributed substantially to the work reported.
Funding
This research received no external funding.
Institutional Review Board Statement
The study was conducted in accordance with the Declaration of Helsinki, and approved by Ethics Committee for Clinical Trials (CESC) of the province of Padua (protocol code CESC 330n/AO/23 approved 02/02/2023). It was registered on the ISRCTN Registry (n. 11647292).
Informed Consent Statement
Informed consent was obtained from all subjects involved in the study.
Acknowledgments
We thank the staff of the Dental Clinic for their support and the patients who wanted to participate in the study. We thank Hulka srl for providing the samples free of charge.
Conflicts of Interest
The authors declare no conflicts of interest.
References
- Treccani [Internet]. [cited 2024 Jun 29]. Biopsia - Enciclopedia. Available from: https://www.treccani.
- Patel, K.J.; De Silva, H.L.; Tong, D.C.; Love, R.M. Concordance Between Clinical and Histopathologic Diagnoses of Oral Mucosal Lesions. J. Oral Maxillofac. Surg. 2011, 69, 125–133. [Google Scholar] [CrossRef] [PubMed]
- Chiapasco M, Casentini P, Coggiola A, Fusari P, Garattini G, Gatti F, et al. Manuale illustrato di chirurgia orale. Quarta edizione. Milano: Edra S.p.A.; 2020. 625 p.
- Kearns HP, McCartan BE, Lamey PJ. Patients’ pain experience following oral mucosal biopsy under local anaesthesia. Br Dent J. 2001 Jan 13;190(1):33–5.
- López-Jornet, P.; Camacho-Alonso, F.; Martinez-Canovas, A. Clinical Evaluation of Polyvinylpyrrolidone Sodium Hyalonurate Gel and 0.2% Chlorhexidine Gel for Pain After Oral Mucosa Biopsy: A Preliminary Study. J. Oral Maxillofac. Surg. 2010, 68, 2159–2163. [Google Scholar] [CrossRef]
- Pilloni, A.; Ceccarelli, S.; Bosco, D.; Gerini, G.; Marchese, C.; Marini, L.; Rojas, M.A. Effect of Chlorhexidine Digluconate in Early Wound Healing of Human Gingival Tissues. A Histological, Immunohistochemical and Biomolecular Analysis. Antibiotics 2021, 10, 1192. [Google Scholar] [CrossRef] [PubMed]
- Ros-Llor, I.; Lopez-Jornet, P. Cytogenetic analysis of oral mucosa cells, induced by chlorhexidine, essential oils in ethanolic solution and triclosan mouthwashes. Environ. Res. 2014, 132, 140–145. [Google Scholar] [CrossRef] [PubMed]
- Balloni, S.; Locci, P.; Lumare, A.; Marinucci, L. Cytotoxicity of three commercial mouthrinses on extracellular matrix metabolism and human gingival cell behaviour. Toxicol. Vitr. 2016, 34, 88–96. [Google Scholar] [CrossRef] [PubMed]
- Reda, B.; Hollemeyer, K.; Trautmann, S.; Hannig, M.; Volmer, D.A. Determination of chlorhexidine retention in different oral sites using matrix-assisted laser desorption/ionization-time of flight mass spectrometry. 110, 1046; 23. [Google Scholar] [CrossRef]
- Leard A, Addy M. The propensity of different brands of tea and coffee to cause staining associated with chlorhexidine. J Clin Periodontol. 1997;24(2):115–8.
- Lang, N.P.; Catalanotto, F.A.; Knöpfli, R.U.; Antczak, A.A.A. Quality-specific taste impairment following the application of chlorhexidine digluconate mouthrinses. J. Clin. Periodontol. 1988, 15, 43–48. [Google Scholar] [CrossRef]
- Lockhart AS, Harle CC. Anaphylactic reactions due to chlorohexidine (multiple letters) [2]. Br J Anaesth. 2001;87(6):940–1.
- Mariotti, A.J.; Rumpf, D.A. Chlorhexidine-Induced Changes to Human Gingival Fibroblast Collagen and Non-Collagen Protein Production. J. Periodontol. 1999, 70, 1443–1448. [Google Scholar] [CrossRef] [PubMed]
- Hammad, H.; Hammad, M.; Abdelhadi, I.; Khalifeh, M.S. Effects of topically applied agents on intra-oral wound healing in a rat model: a clinical and histomorphometric study*. Int. J. Dent. Hyg. 2011, 9, 9–16. [Google Scholar] [CrossRef] [PubMed]
- Bassetti, C.; Kallenberger, A. Influence of chlorhexidine rinsing on the healing of oral mucosa and osseous lesions. J. Clin. Periodontol. 1980, 7, 443–456. [Google Scholar] [CrossRef]
- Lindhe, J.; Heyden, G.; Svanberg, G.; Löe, H.; Schiøtt, C.R. Effect of local applications of chlorhexidine on the oral mucosa of the hamster. J. Periodontal Res. 1970, 5, 177–182. [Google Scholar] [CrossRef] [PubMed]
- Arduino, P.G.; Gambino, A.; Cabras, M.; Sciannameo, V.; Nimot, Y.; Karimi, D.; Ricceri, F.; Broccoletti, R. Effect of two different alcohol-free chlorhexidine formulations in mouthrinses on the immediate postoperative period for oral mucosal biopsies. J. Oral Sci. 2020, 62, 202–205. [Google Scholar] [CrossRef] [PubMed]
- Schiøtt, C.R.; Löe, H.; Jensen, S.B.; Kilian, M.; Davies, R.; Glavind, K. The effect of chlorhexidine mouthrinses on the human oral flora. J. Periodontal Res. 1970, 5, 84–89. [Google Scholar] [CrossRef] [PubMed]
- Palaia, G.; Tenore, G.; Tribolati, L.; Russo, C.; Gaimari, G.; Del Vecchio, A.; Romeo, U. Evaluation of wound healing and postoperative pain after oral mucosa laser biopsy with the aid of compound with chlorhexidine and sodium hyaluronate: a randomized double blind clinical trial. Clin. Oral Investig. 2018, 23, 3141–3151. [Google Scholar] [CrossRef] [PubMed]
- Brookes ZLS, Belfield LA, Ashworth A, Casas-Agustench P, Raja M, Pollard AJ, et al. Effects of chlorhexidine mouthwash on the oral microbiome. J Dent. 2021 Oct;113:103768.
- Traber, M.G.; Atkinson, J. Vitamin E, antioxidant and nothing more. Free. Radic. Biol. Med. 2007, 43, 4–15. [Google Scholar] [CrossRef] [PubMed]
- Wadleigh, R.G.; Redman, R.S.; Graham, M.L.; Krasnow, S.H.; Anderson, A.; Cohen, M.H. Vitamin E in the treatment of chemotherapy-induced mucositis. Am. J. Med. 1992, 92, 481–484. [Google Scholar] [CrossRef] [PubMed]
- Kim, S.K.; Im, G.J.; An, Y.S.; Lee, S.H.; Jung, H.H.; Park, S.Y. The effects of the antioxidant α-tocopherol succinate on cisplatin-induced ototoxicity in HEI-OC1 auditory cells. Int. J. Pediatr. Otorhinolaryngol. 2016, 86, 9–14. [Google Scholar] [CrossRef] [PubMed]
- Diplock, A.T.; Xu, G.; Yeow, C.; Okikiola, M. Relationship of Tocopherol Structure to Biological Activity, Tissue Uptake, and Prostaglandin Biosynthesisa. Ann. New York Acad. Sci. 1989, 570, 72–84. [Google Scholar] [CrossRef]
- Trevithick JR, Xiong H, Lee S, Shum DT, Sanford SE, Karlik SJ, et al. Topical tocopherol acetate reduces post-UVB, sunburn-associated erythema, edema, and skin sensitivity in hairless mice. Arch Biochem Biophys. 1992 Aug 1;296(2):575–82.
- Panganamala, R.V.; Cornwell, D.G. THE EFFECTS OF VITAMIN E ON ARACHIDONIC ACID METABOLISM*. Ann. New York Acad. Sci. 1982, 393, 376–391. [Google Scholar] [CrossRef] [PubMed]
- Nizam, N.; Discioglu, F.; Saygun, I.; Bal, V.; Avcu, F.; Ozkan, C.K.; Serdar, M.A. The Effect of α-Tocopherol and Selenium on Human Gingival Fibroblasts and Periodontal Ligament Fibroblasts In Vitro. J. Periodontol. 2014, 85, 636–644. [Google Scholar] [CrossRef]
- Testa, D.; Marcuccio, G.; Panin, G.; Bianco, A.; Tafuri, D.; Thyrion, F.Z.; Nunziata, M.; Piombino, P.; Guerra, G.; Motta, G. Nasal mucosa healing after endoscopic sinus surgery in chronic rhinosinusitis of elderly patients: role of topic alpha-tocopherol acetate. Aging Clin. Exp. Res. 2016, 29, 191–195. [Google Scholar] [CrossRef] [PubMed]
- Alberts, D.S.; Goldman, R.; Xu, M.; Dorr, R.T.; Quinn, J.; Welch, K.; Guillen-Rodriguez, J.; Aickin, M.; Peng, Y.; Loescher, L.; et al. Disposition and metabolism of topically administered α-tocopherol acetate: A common ingredient of commercially available sunscreens and cosmetics. Nutr. Cancer 1996, 26, 193–201. [Google Scholar] [CrossRef] [PubMed]
- Ruiz-Tovar, J.M.; Llavero, C. Perianal Application of Glyceryl Trinitrate Ointment Versus Tocopherol Acetate Ointment in the Treatment of Chronic Anal Fissure: A Randomized Clinical Trial. Dis. Colon Rectum 2021, 65, 406–412. [Google Scholar] [CrossRef]
- Panin, G.; Strumia, R.; Ursini, F. Topical α-Tocopherol Acetate in the Bulk Phase: Eight Years of Experience in Skin Treatment. Ann. New York Acad. Sci. 2004, 1031, 443–447. [Google Scholar] [CrossRef]
- Fiori, G.; Galluccio, F.; Braschi, F.; Amanzi, L.; Miniati, I.; Conforti, M.L.; Del Rosso, A.; Generini, S.; Candelieri, A.; Magonio, A.; et al. Vitamin E gel reduces time of healing of digital ulcers in systemic sclerosis. . 2009, 27, 51–4. [Google Scholar]
- E Cohen, R.; Ciancio, S.G.; Mather, M.L.; A Curro, F. Effect of vitamin E gel, placebo gel and chlorhexidine on periodontal disease. . 1991, 13, 20–4. [Google Scholar]
- Bacci, C.; Vanzo, V.; Frigo, A.; Stellini, E.; Sbricoli, L.; Valente, M. Topical tocopherol for treatment of reticular oral lichen planus: a randomized, double-blind, crossover study. Oral Dis. 2016, 23, 62–68. [Google Scholar] [CrossRef] [PubMed]
- Curtis, A.J.; Bullen, M.; Piccenna, L.; McNeil, J.J. Vitamin E Supplementation and Mortality in Healthy People: A Meta-Analysis of Randomised Controlled Trials. Cardiovasc. Drugs Ther. 2014, 28, 563–573. [Google Scholar] [CrossRef] [PubMed]
- Jiang, S.; Pan, Z.; Li, H.; Li, F.; Song, Y.; Qiu, Y. Meta-Analysis: Low-Dose Intake of Vitamin E Combined with Other Vitamins or Minerals May Decrease All-Cause Mortality. J. Nutr. Sci. Vitaminol. 2014, 60, 194–205. [Google Scholar] [CrossRef] [PubMed]
- Abner, E.L.; Schmitt, F.A.; Mendiondo, M.S.; Marcum, J.L.; Kryscio, R.J. Vitamin E and All-Cause Mortality: A Meta-Analysis. Curr. Aging Sci. 2011, 4, 158–170. [Google Scholar] [CrossRef] [PubMed]
- Moher D, Hopewell S, Schulz KF, Montori V, Gøtzsche PC, Devereaux PJ, et al. CONSORT 2010 Spiegazione ed Elaborazione: linee guida aggiornate per il reporting di trial randomizzati a gruppi paralleli. OPEN ACCESS. 2012;4(7).
- Kerner, S.; Etienne, D.; Malet, J.; Mora, F.; Monnet-Corti, V.; Bouchard, P. Root coverage assessment: validity and reproducibility of an image analysis system. J. Clin. Periodontol. 2007, 34, 969–976. [Google Scholar] [CrossRef] [PubMed]
- Alman, A.C.; Johnson, L.R.; Calverley, D.C.; Grunwald, G.K.; Lezotte, D.C.; Hokanson, J.E. Validation of a method for quantifying carotid artery calcification from panoramic radiographs. Oral Surgery, Oral Med. Oral Pathol. Oral Radiol. 2013, 116, 518–524. [Google Scholar] [CrossRef] [PubMed]
- Grbatinić, I.; Milošević, N.T. Incipient UV-Induced Structural Changes in Neutrophil Granulocytes: Morphometric and Texture Analysis of Two-Dimensional Digital Images. Microsc. Microanal. 2016, 22, 387–393. [Google Scholar] [CrossRef] [PubMed]
- Moshrefi, A. Chlorhexidine. J West Soc Periodontol Abstr. 2002;50(1):5–9.
- Margarone JE, Natiella JR, Vaughan CD. Artifacts in oral biopsy specimens. J Oral Maxillofac Surg Off J Am Assoc Oral Maxillofac Surg. 1985 Mar;43(3):163–72.
- Avon, S.-L.; E Klieb, H.B. Oral soft-tissue biopsy: an overview. . 2012, 78, c75. [Google Scholar] [PubMed]
- Jeng, P.-Y.; Chang, M.-C.; Chiang, C.-P.; Lee, C.-F.; Chen, C.-F.; Jeng, J.-H. Oral soft tissue biopsy surgery: Current principles and key tissue stabilization techniques. J. Dent. Sci. 2023, 19, 11–20. [Google Scholar] [CrossRef] [PubMed]
- Balaji, S. Tobacco smoking and surgical healing of oral tissues: A review. Indian J. Dent. Res. 2008, 19, 344–8. [Google Scholar] [CrossRef] [PubMed]
Figure 1.
Participant flowchart according to CONSORT diagram [38]. ΔH and ΔW: Changes from day 1 to day 6 in wound dimensions were compared between the two groups (tocopherol acetate vs. chlorhexidine digluconate) with the Mann-Whitney test, and the effect was calculated as the difference of medians with 95% bootstrap confidence interval.
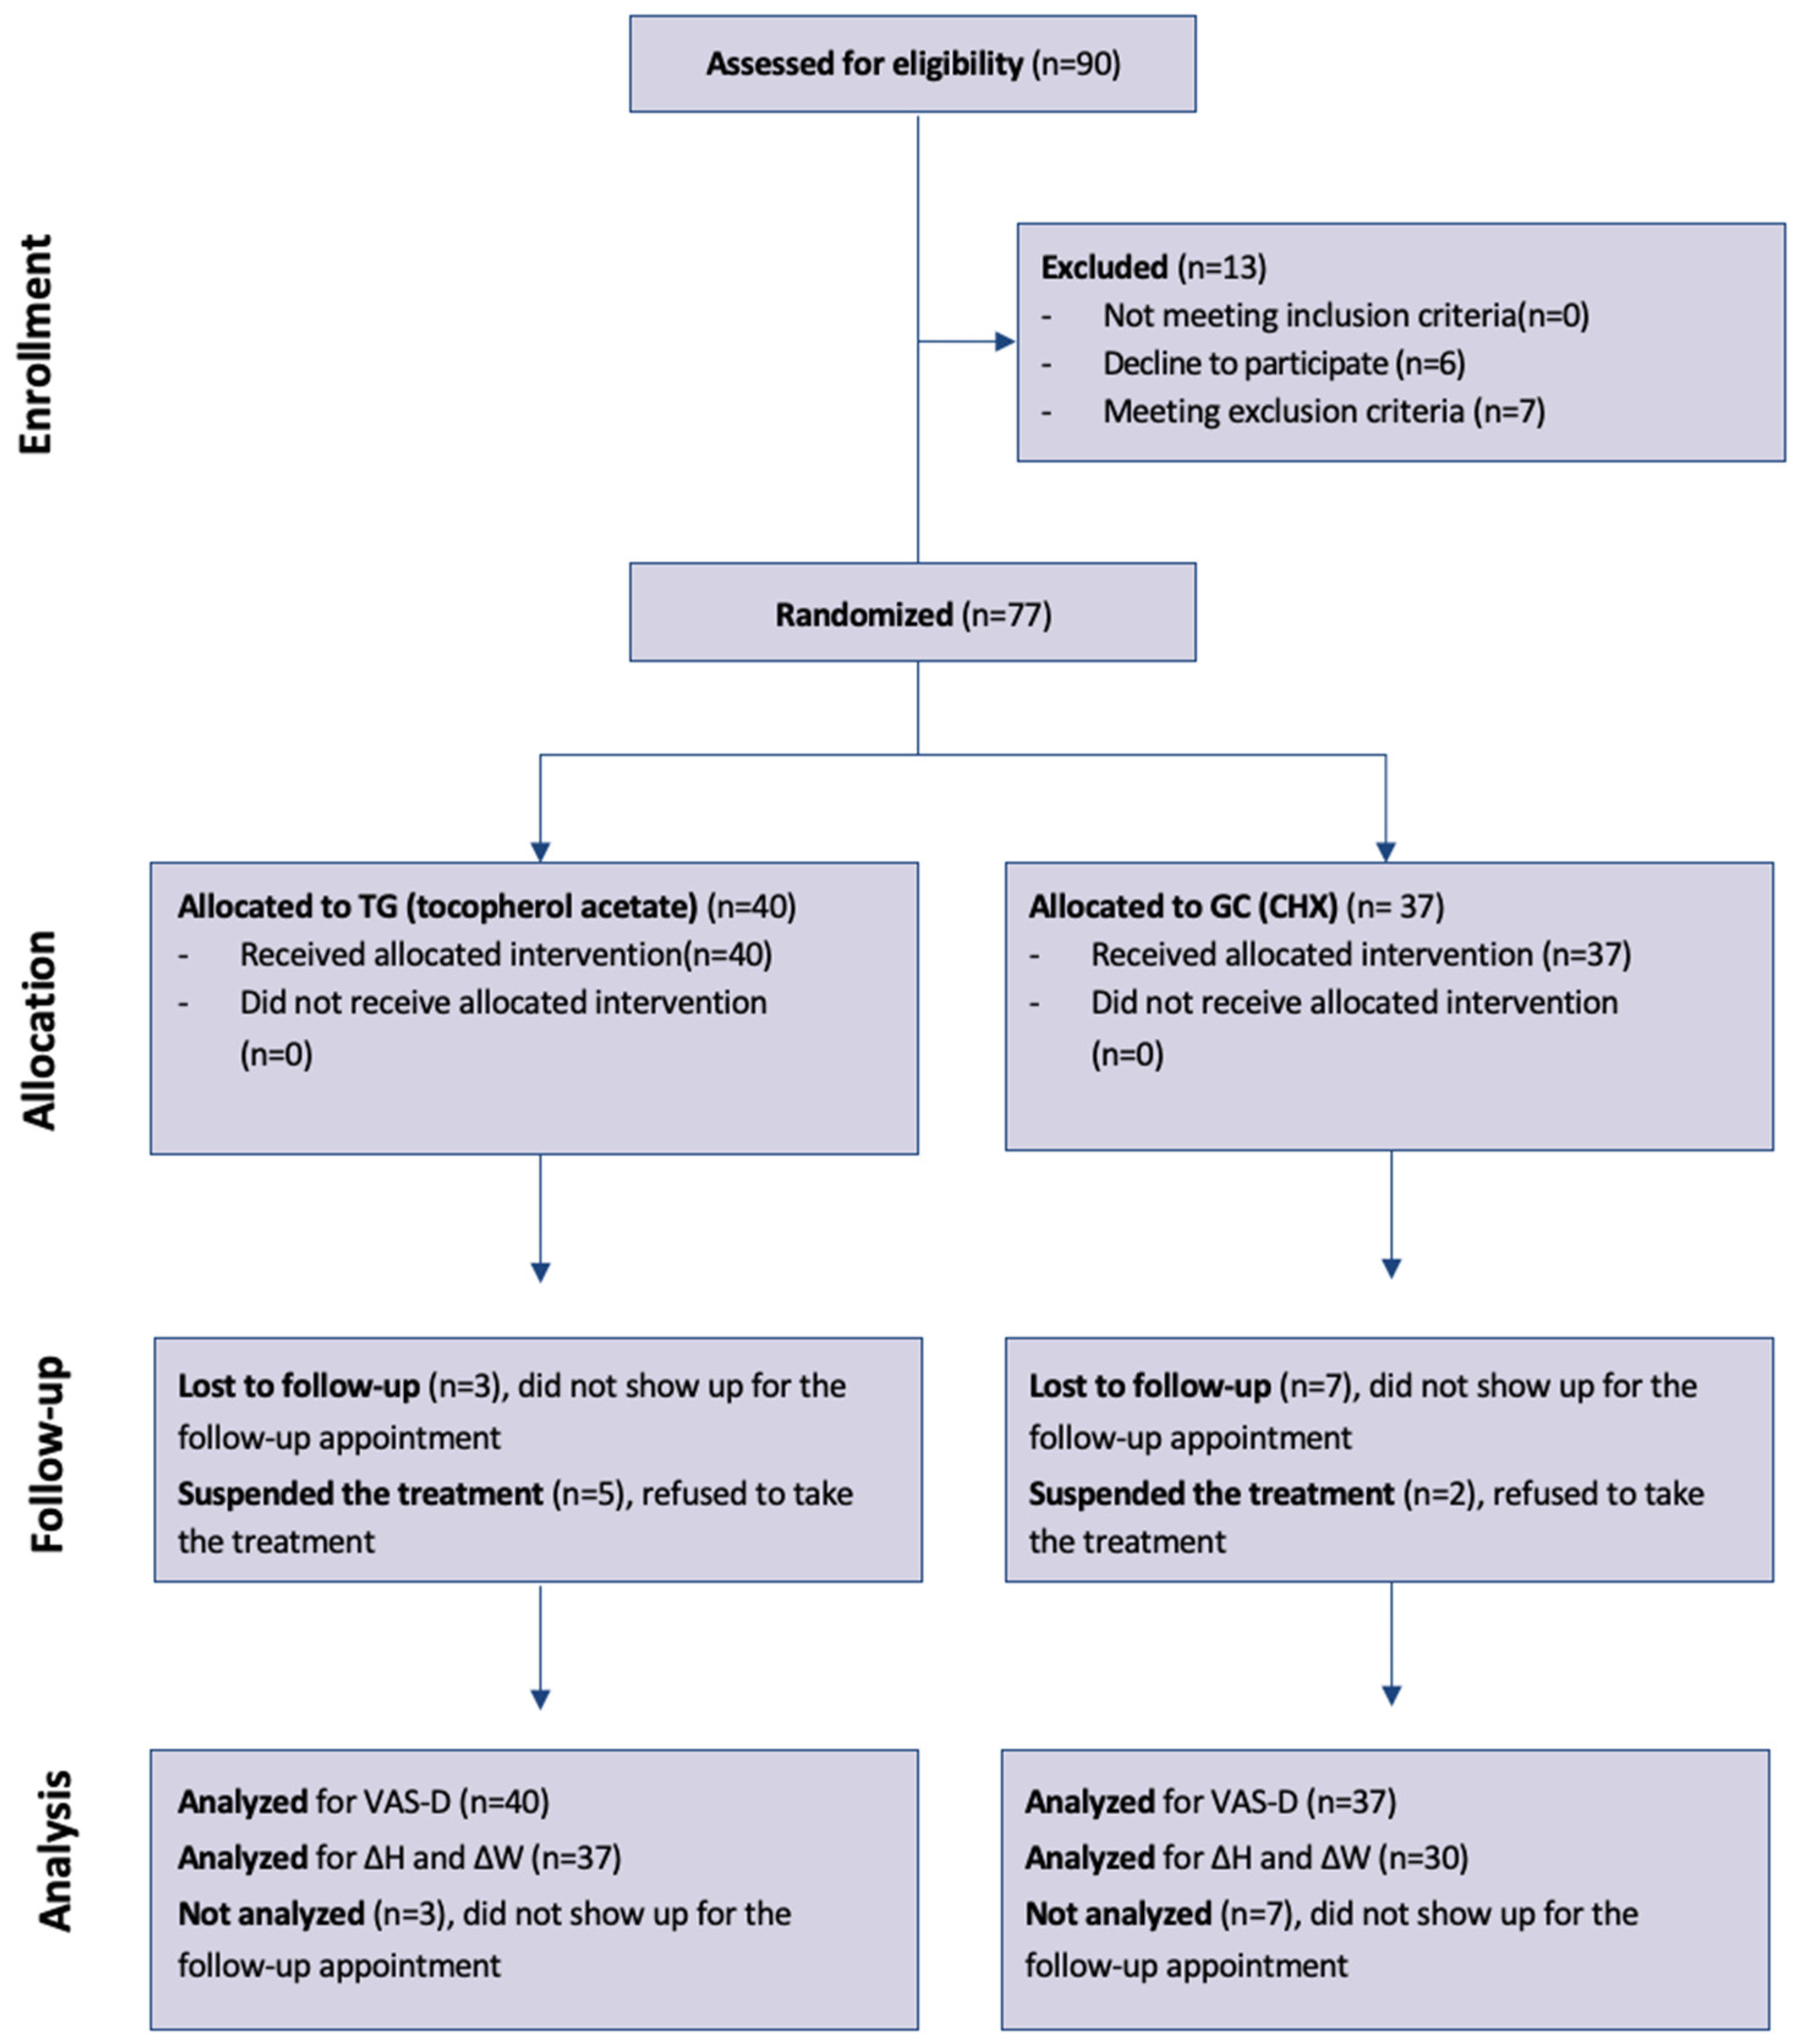
Figure 2.
Box plot of the change in VAS from day 1 to day 6 in the two groups.
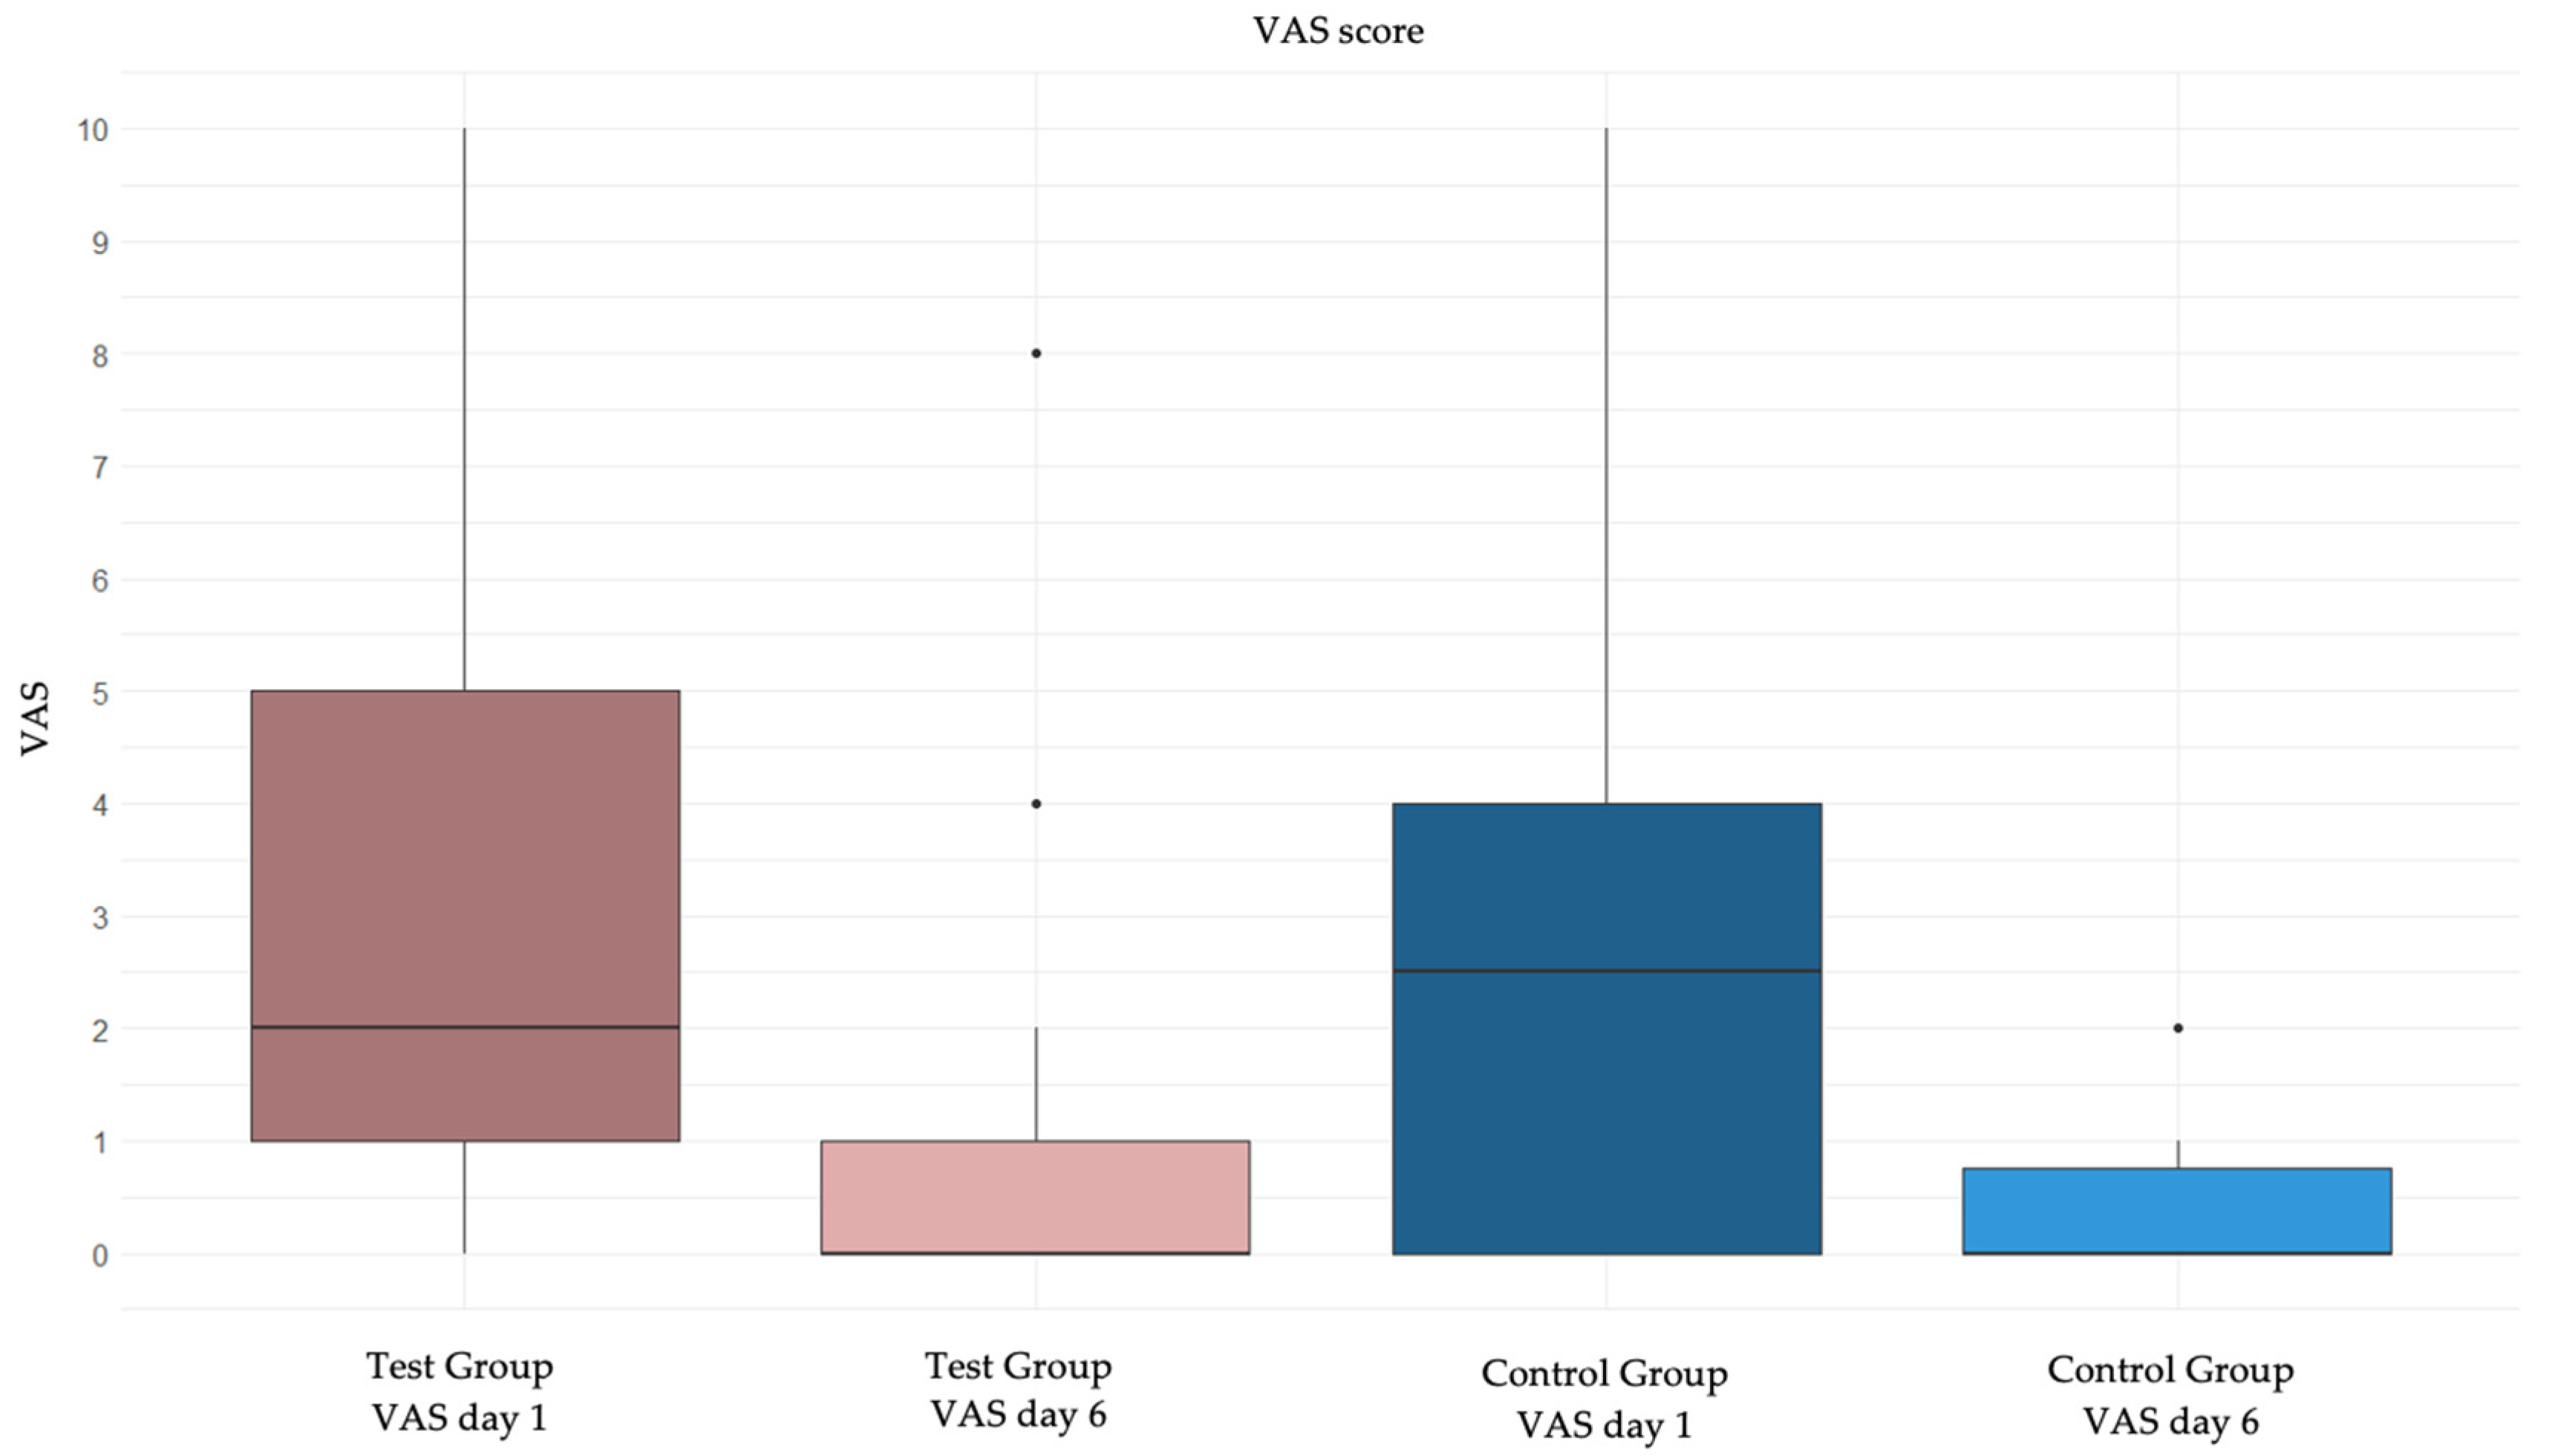
Figure 3.
Box plot showing the change in H and W in the test group and in the control group.
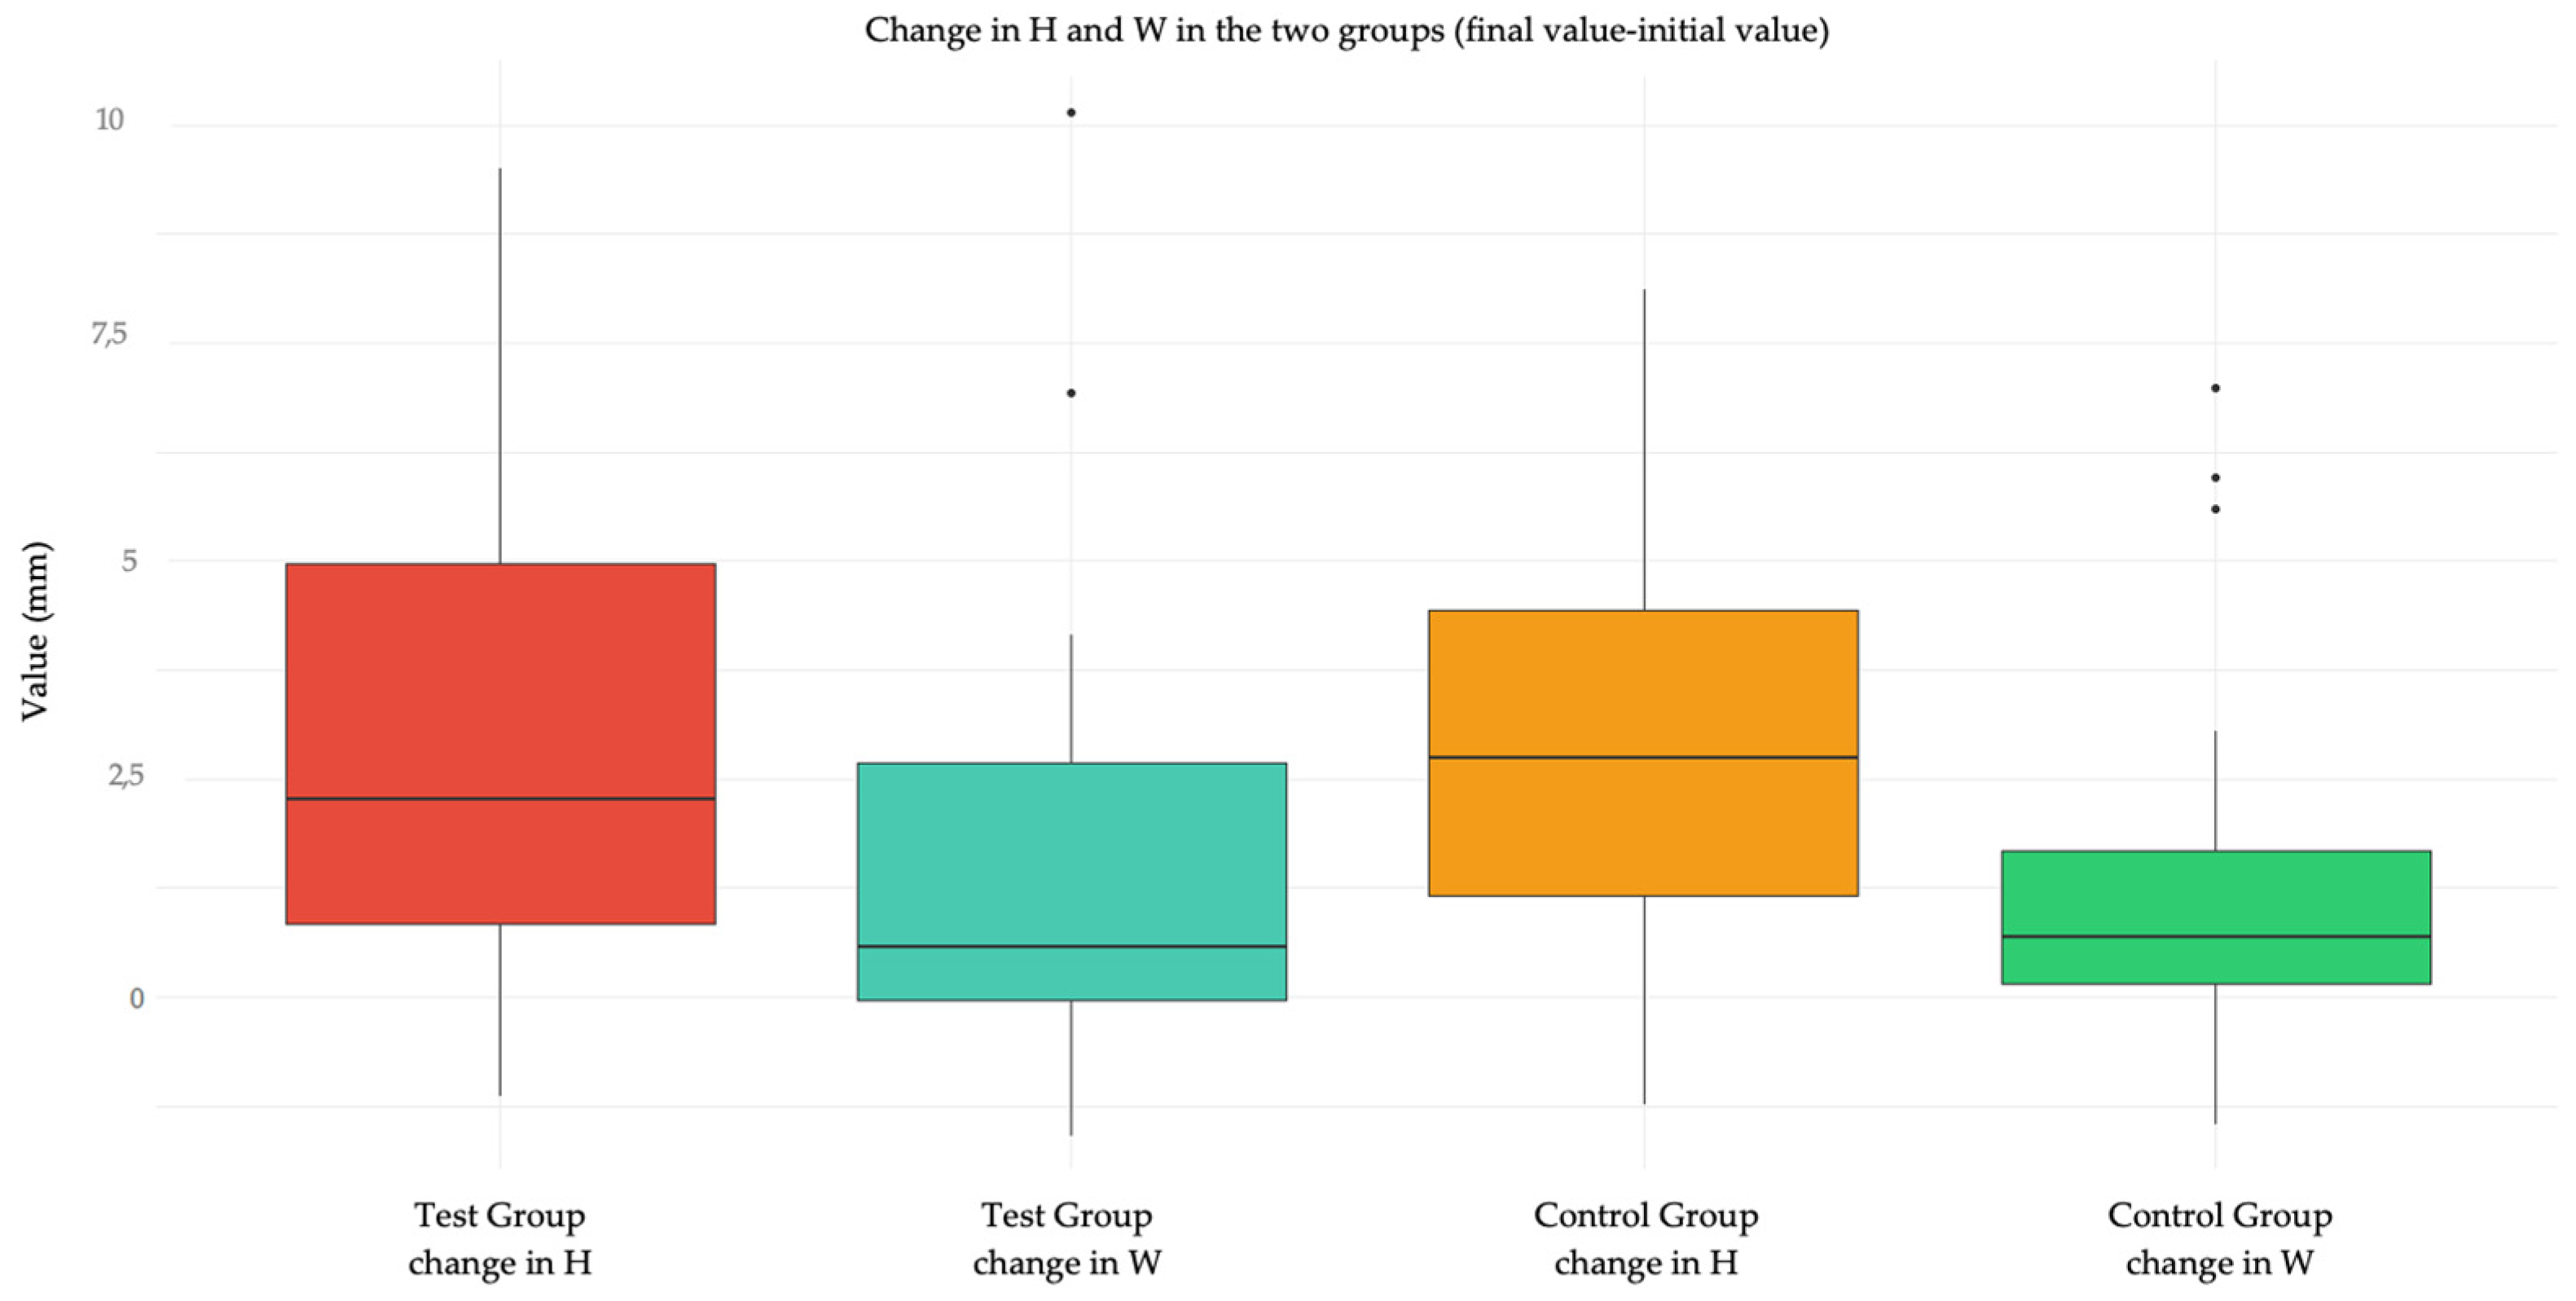
Figure 4.
Box plot showing the initial and final values of H and W in test group and control group.
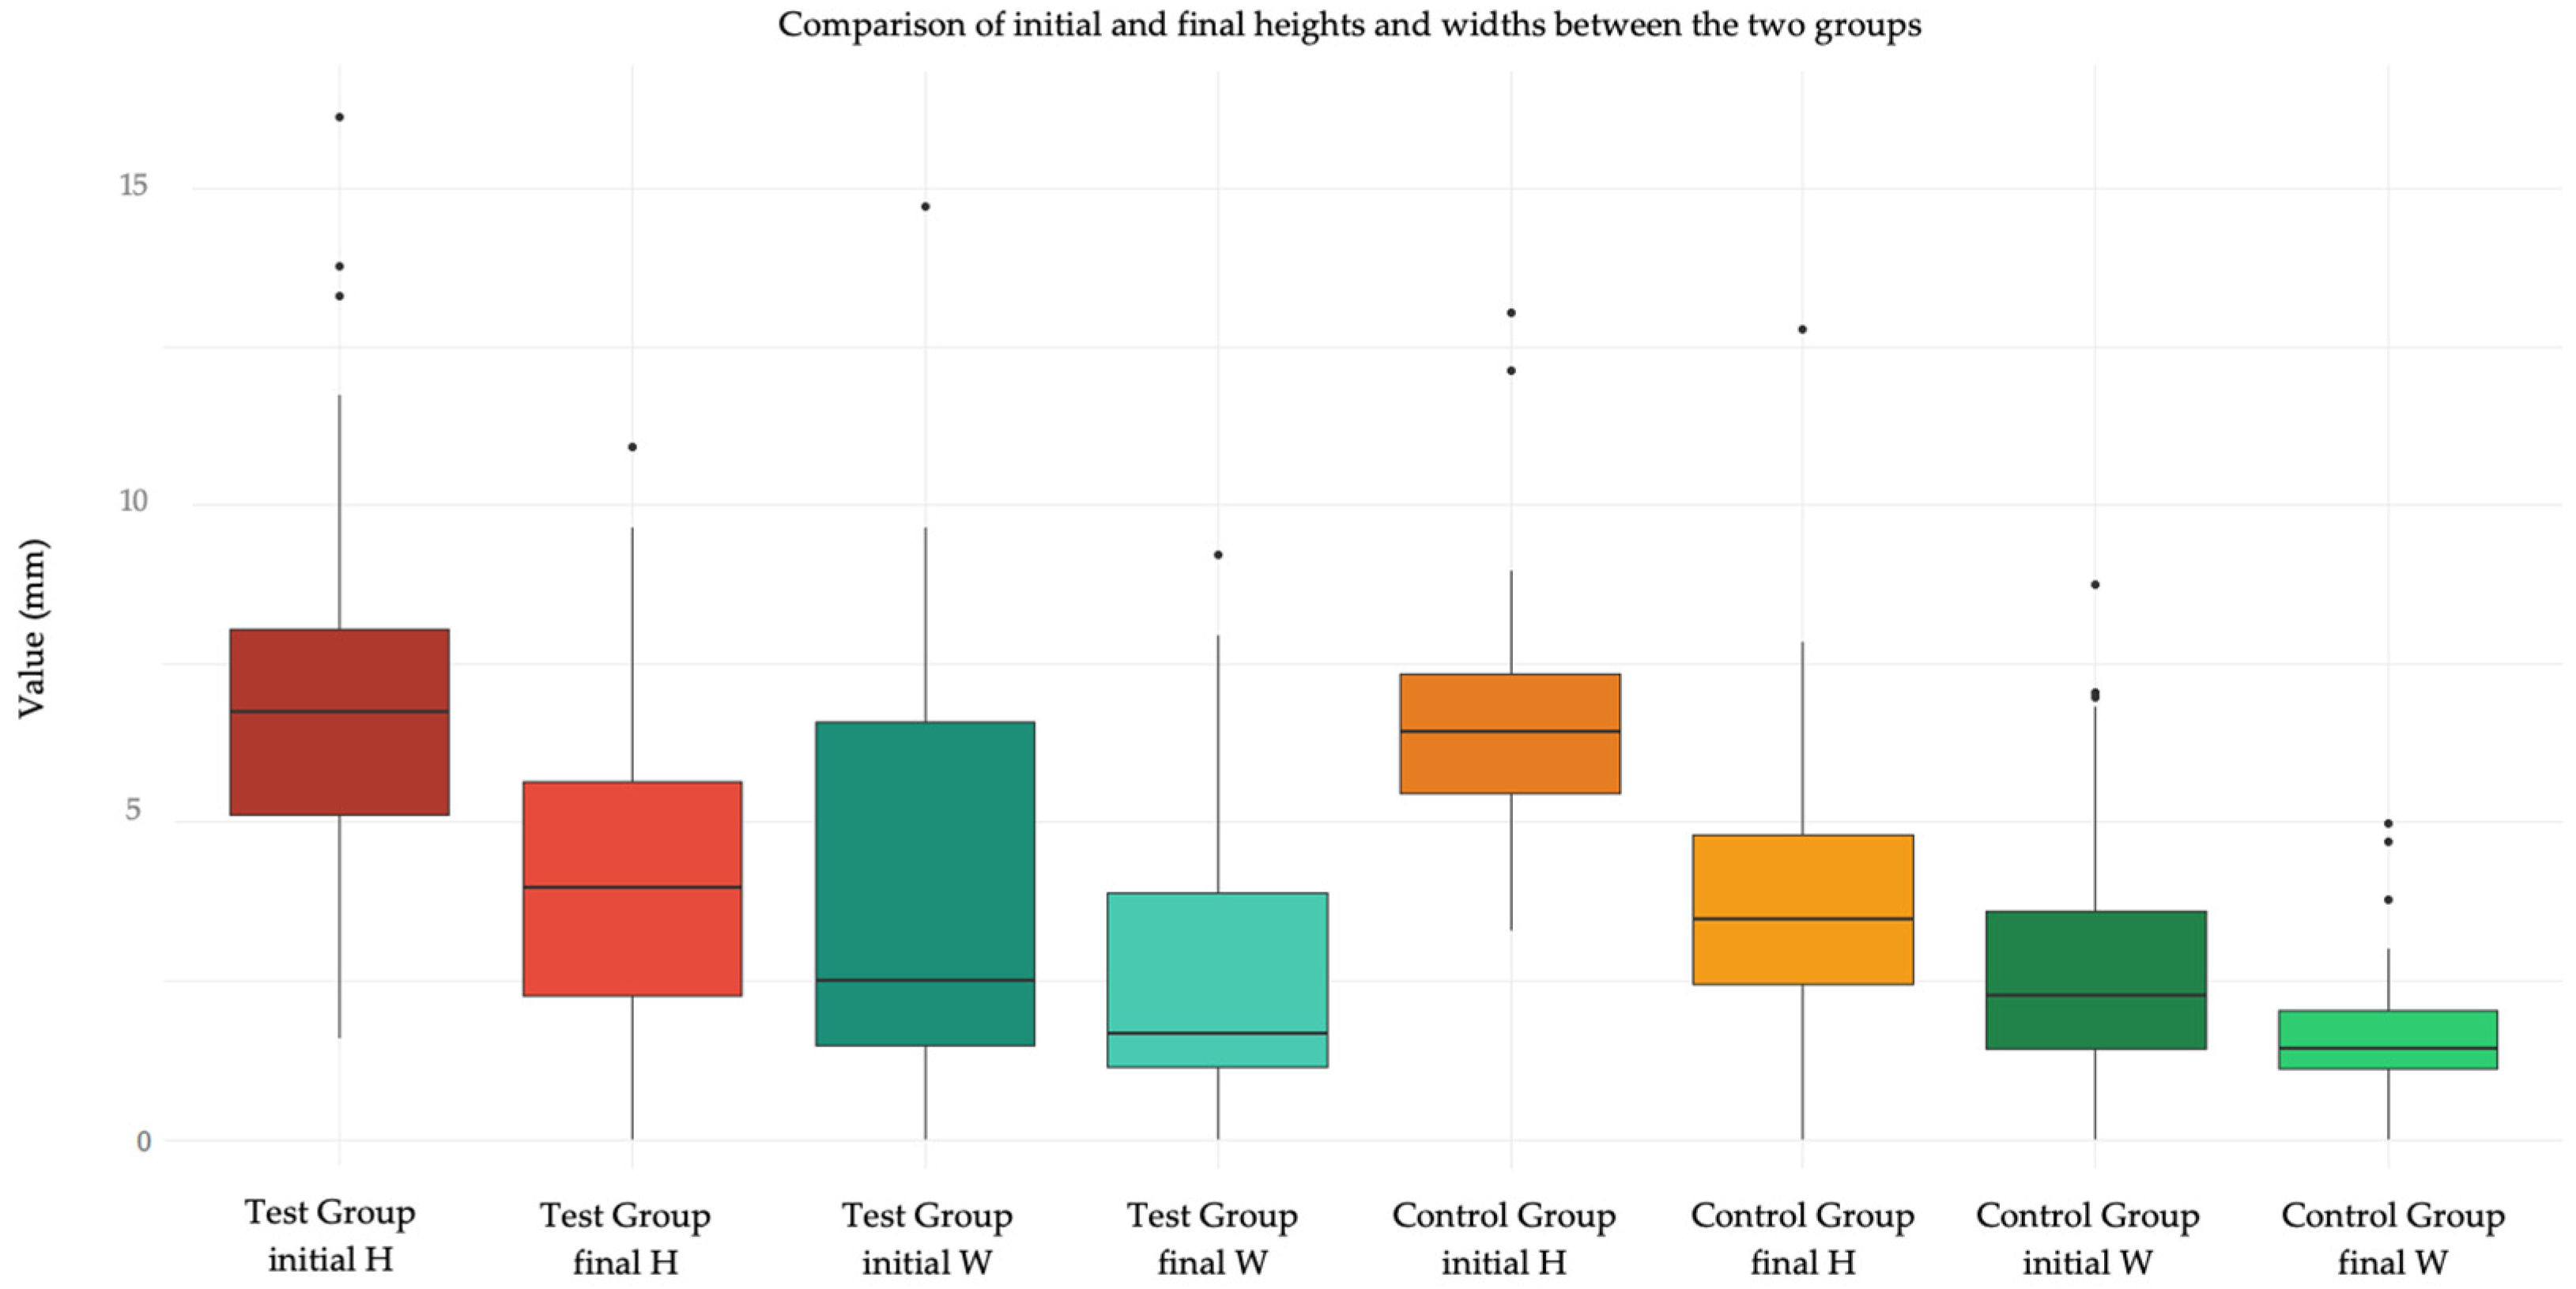
Figure 5.
A biopsy in the loose mucosa (buccal mucosa) in the immediately post-op and at day 6.
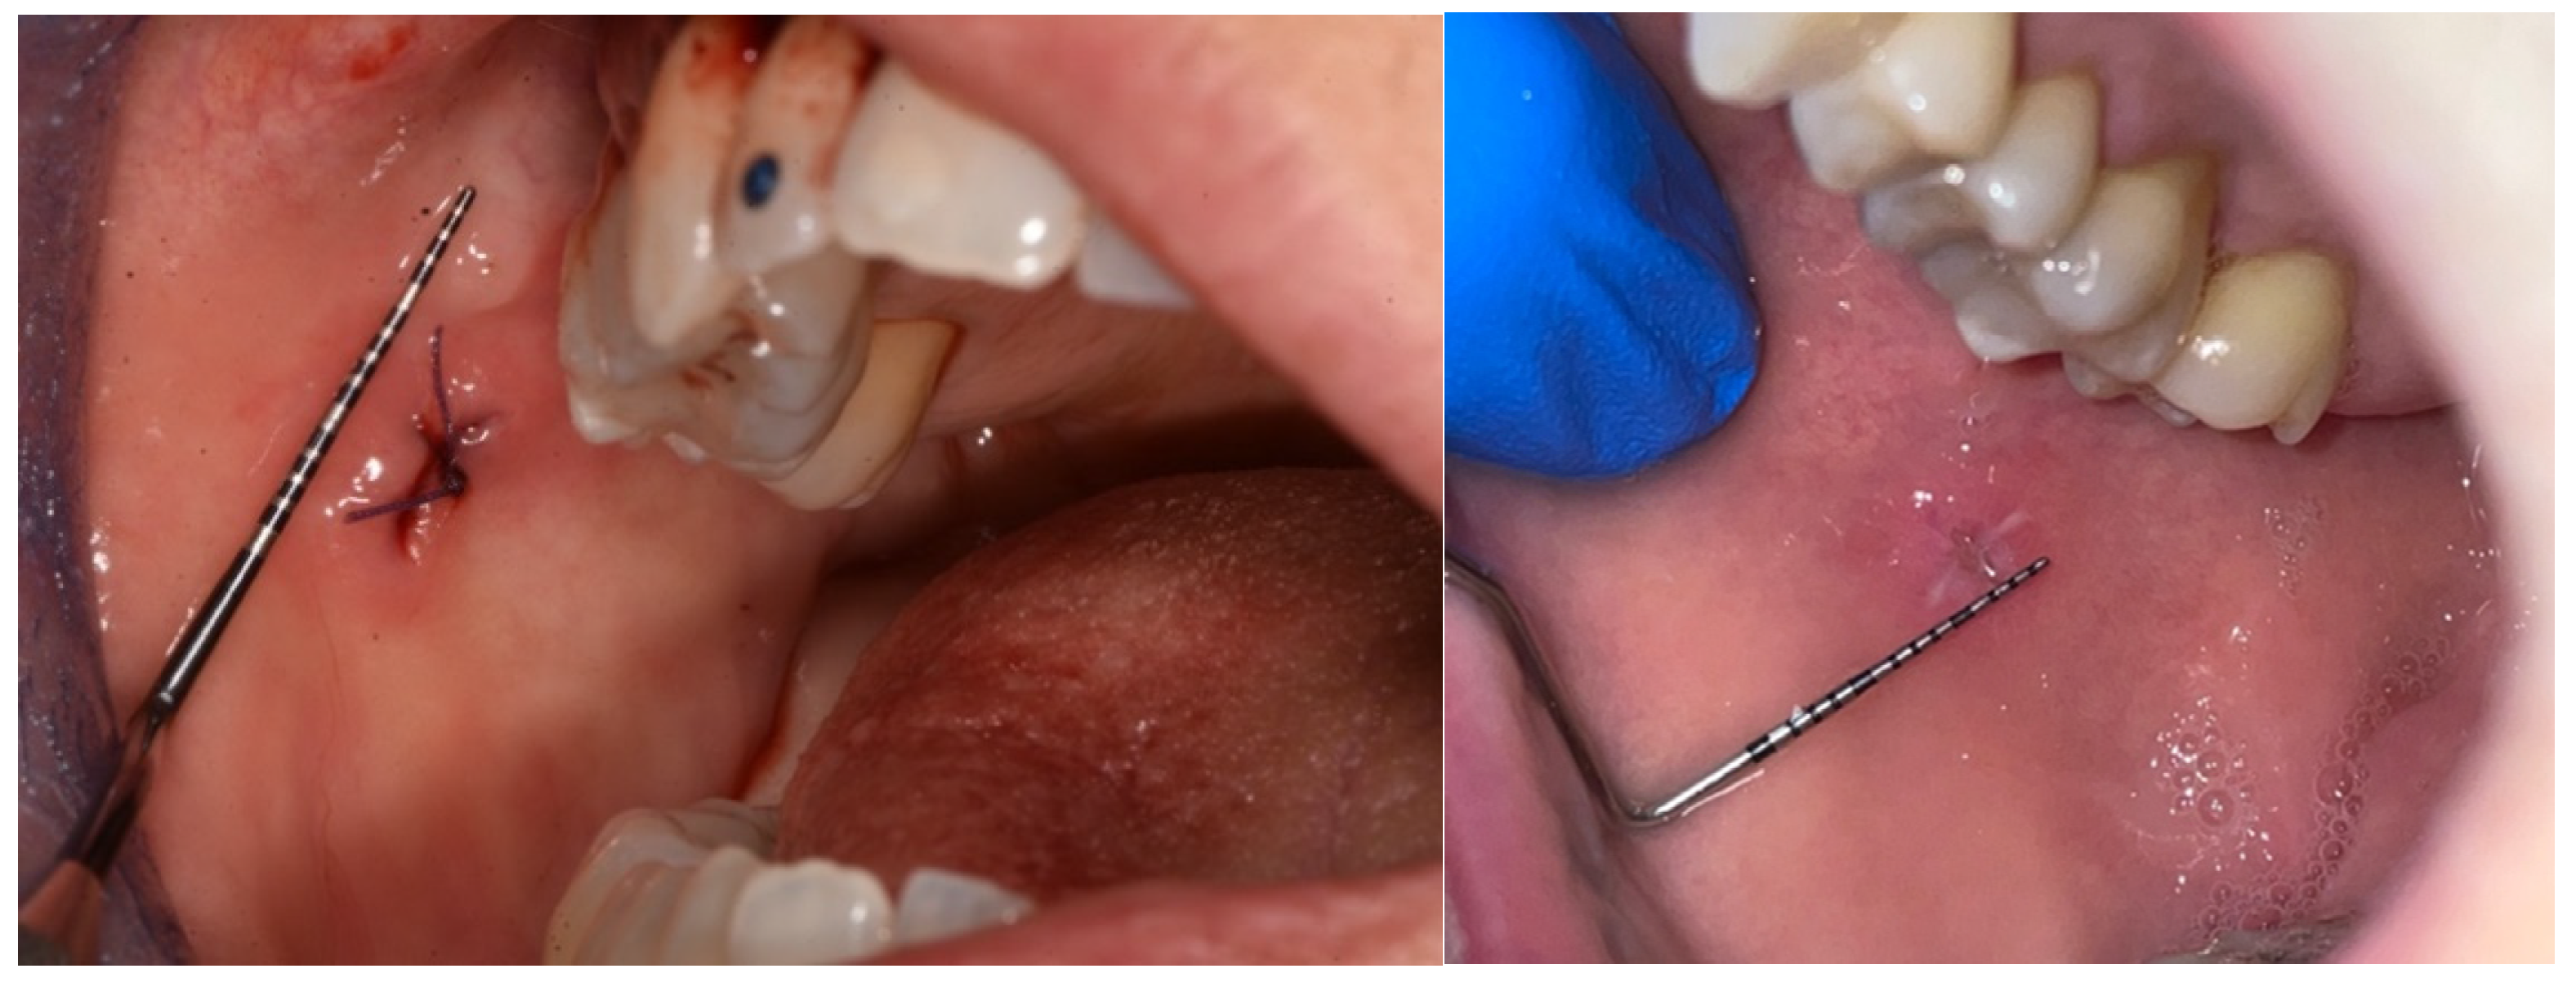
Figure 6.
A biopsy in the attached mucosa (palate) in the immediately post-op and at day 6.
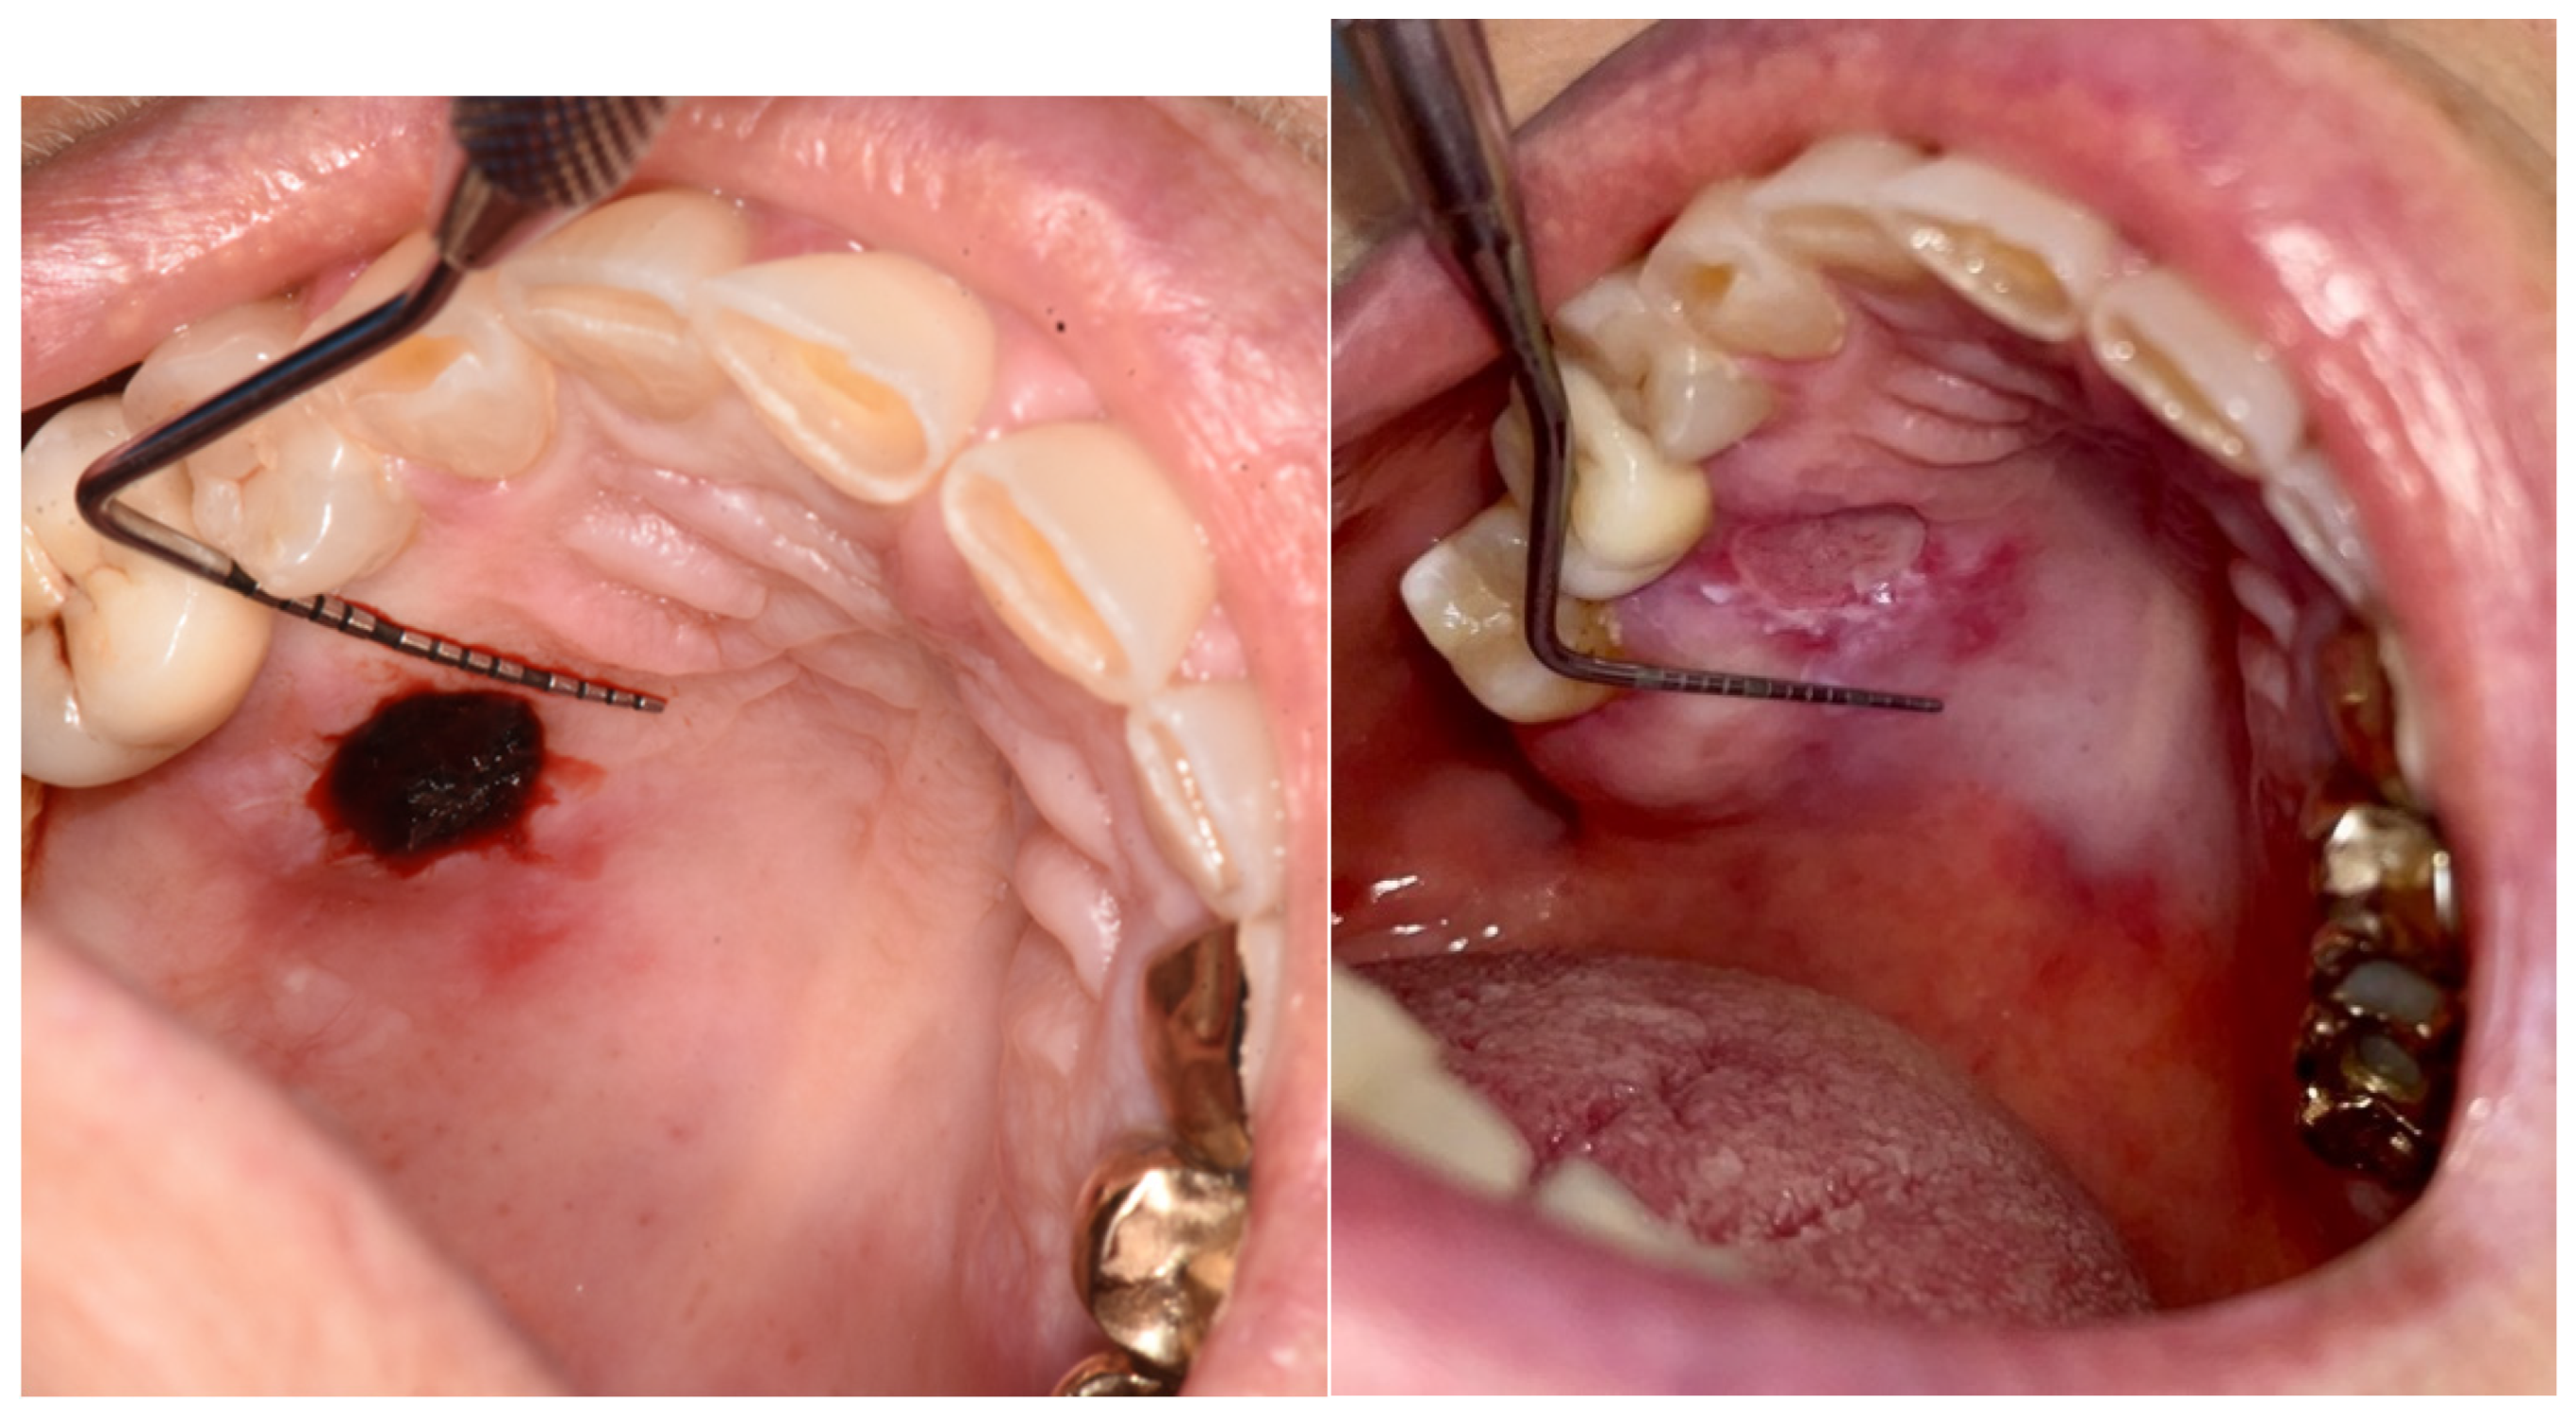
Figure 7.
ImageJ splash screen when opening the program.

Figure 8.
With the "straight" instrument, the fifth starting from the right, the measurement of 1mm is drawn on the periodontal probe.
Figure 8.
With the "straight" instrument, the fifth starting from the right, the measurement of 1mm is drawn on the periodontal probe.
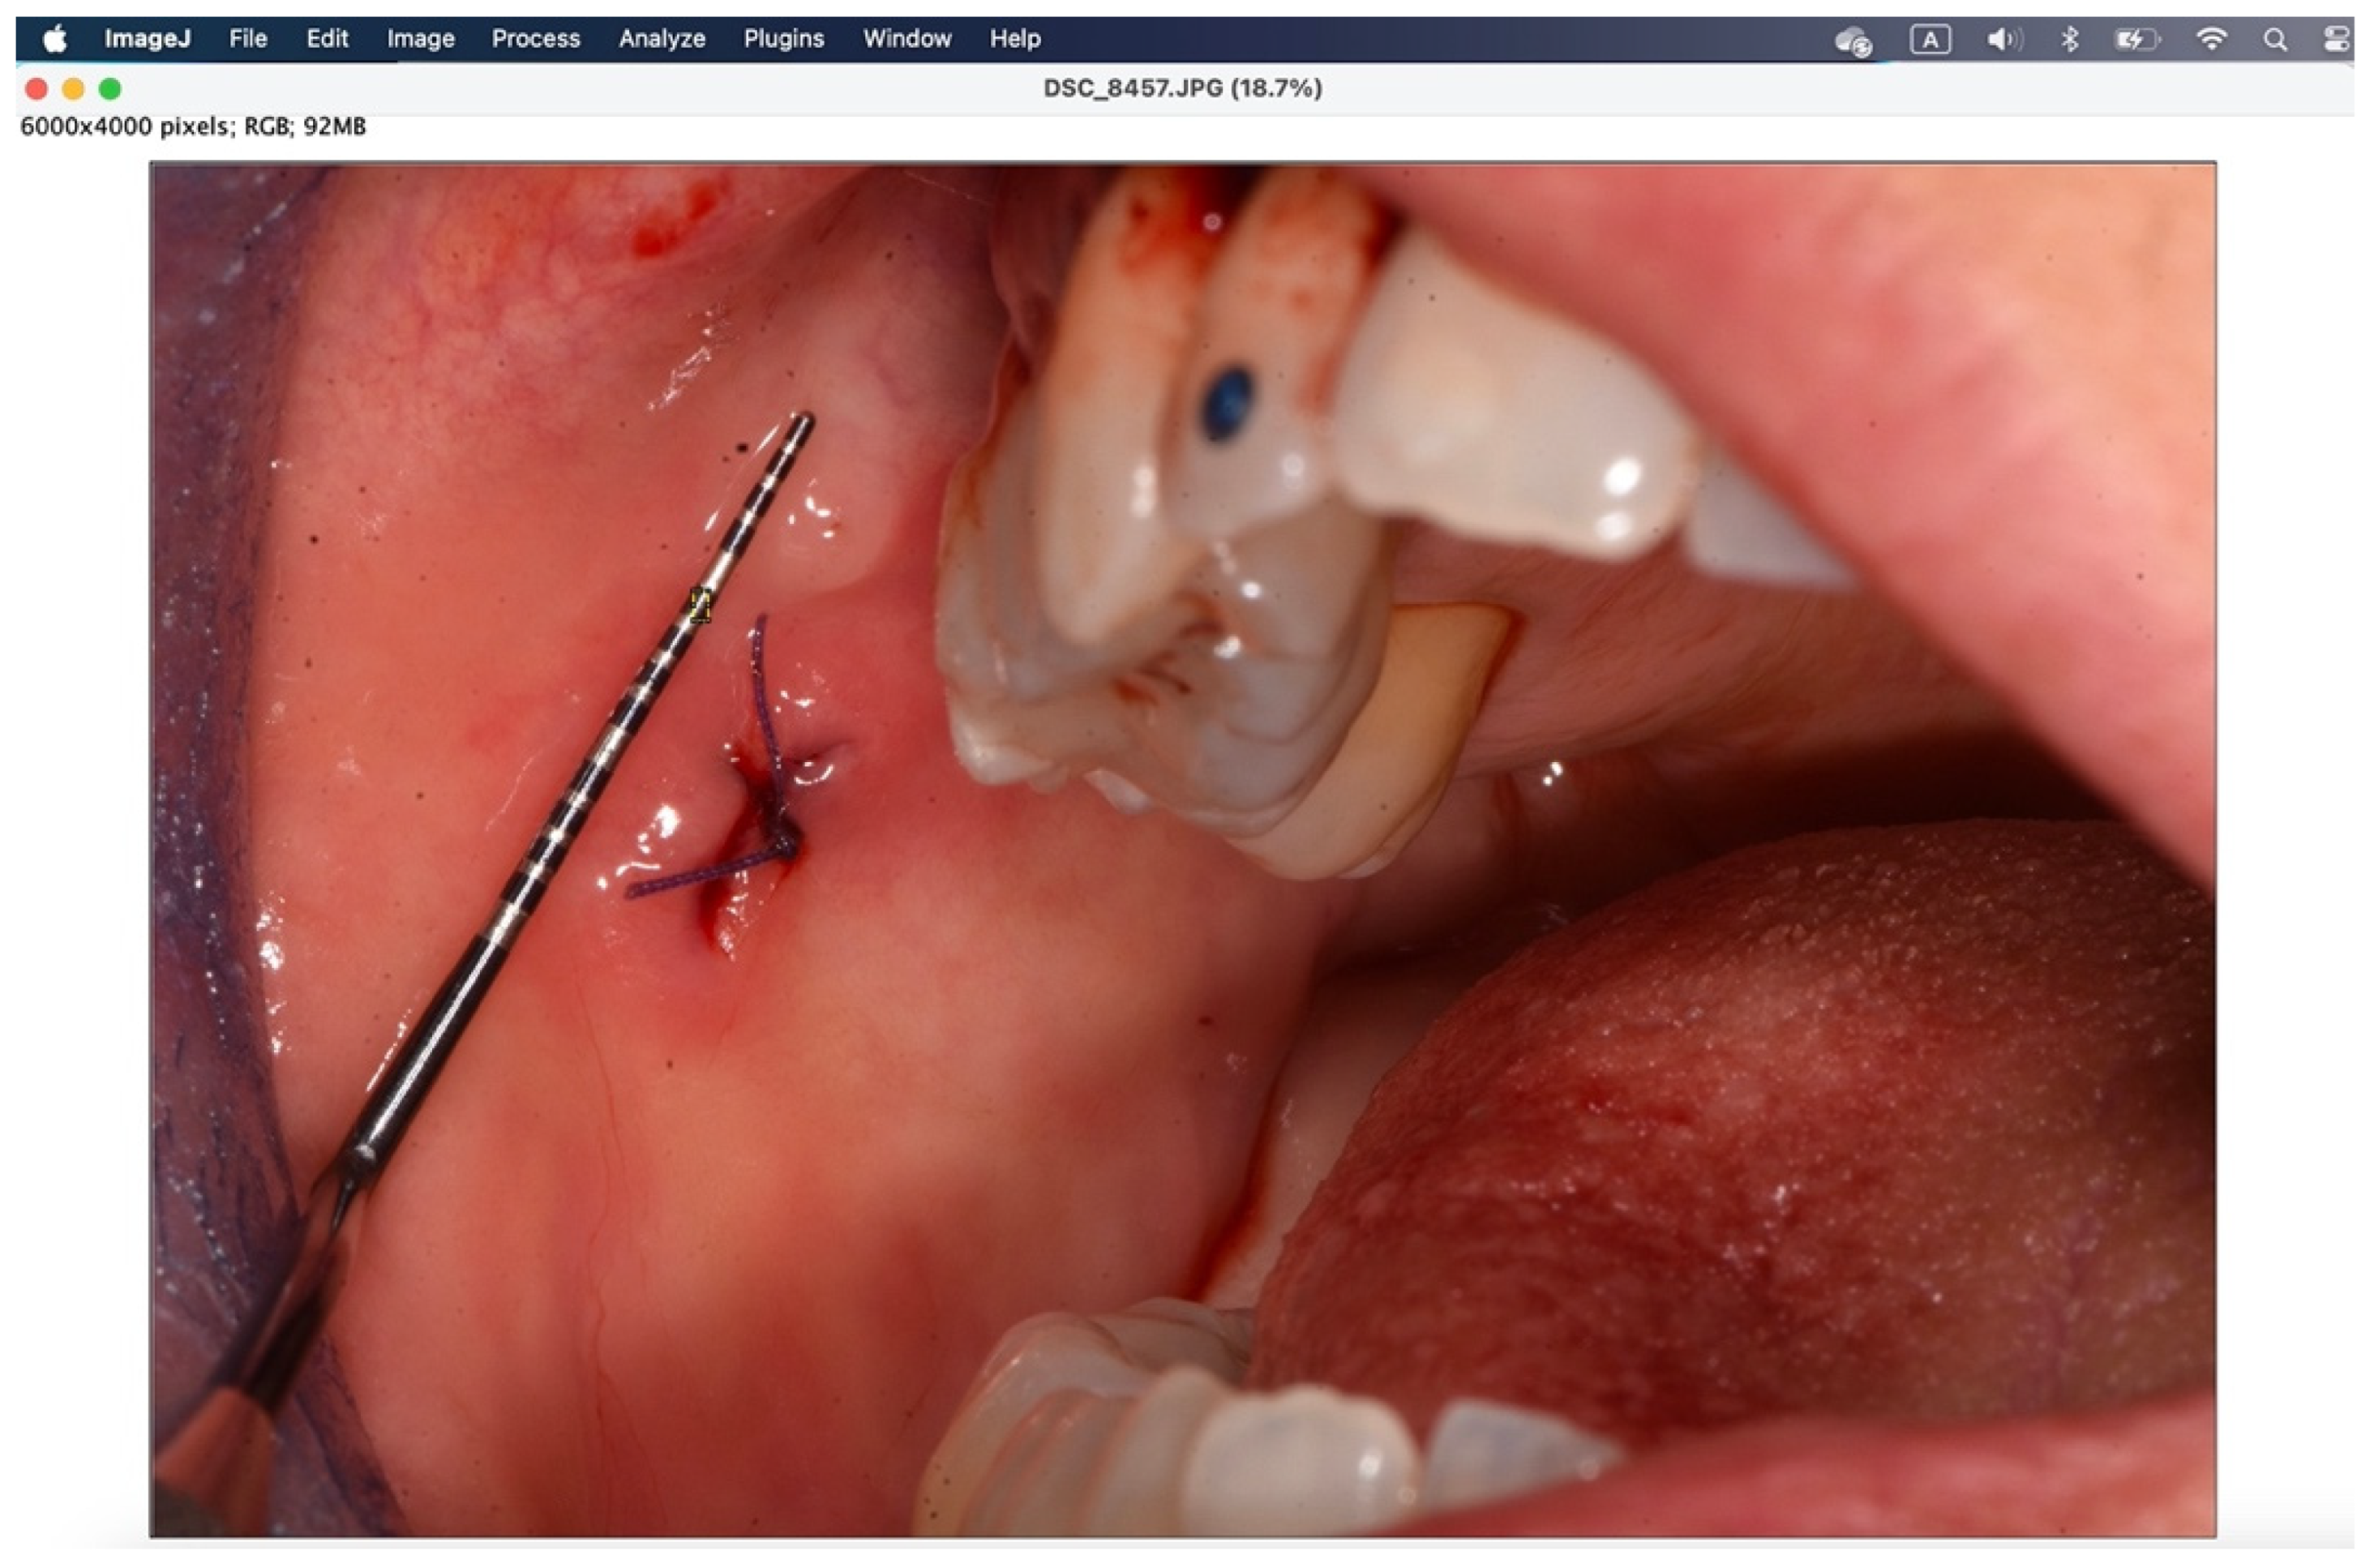
Figure 9.
Using "analyze">"set scale" you configure the known length.
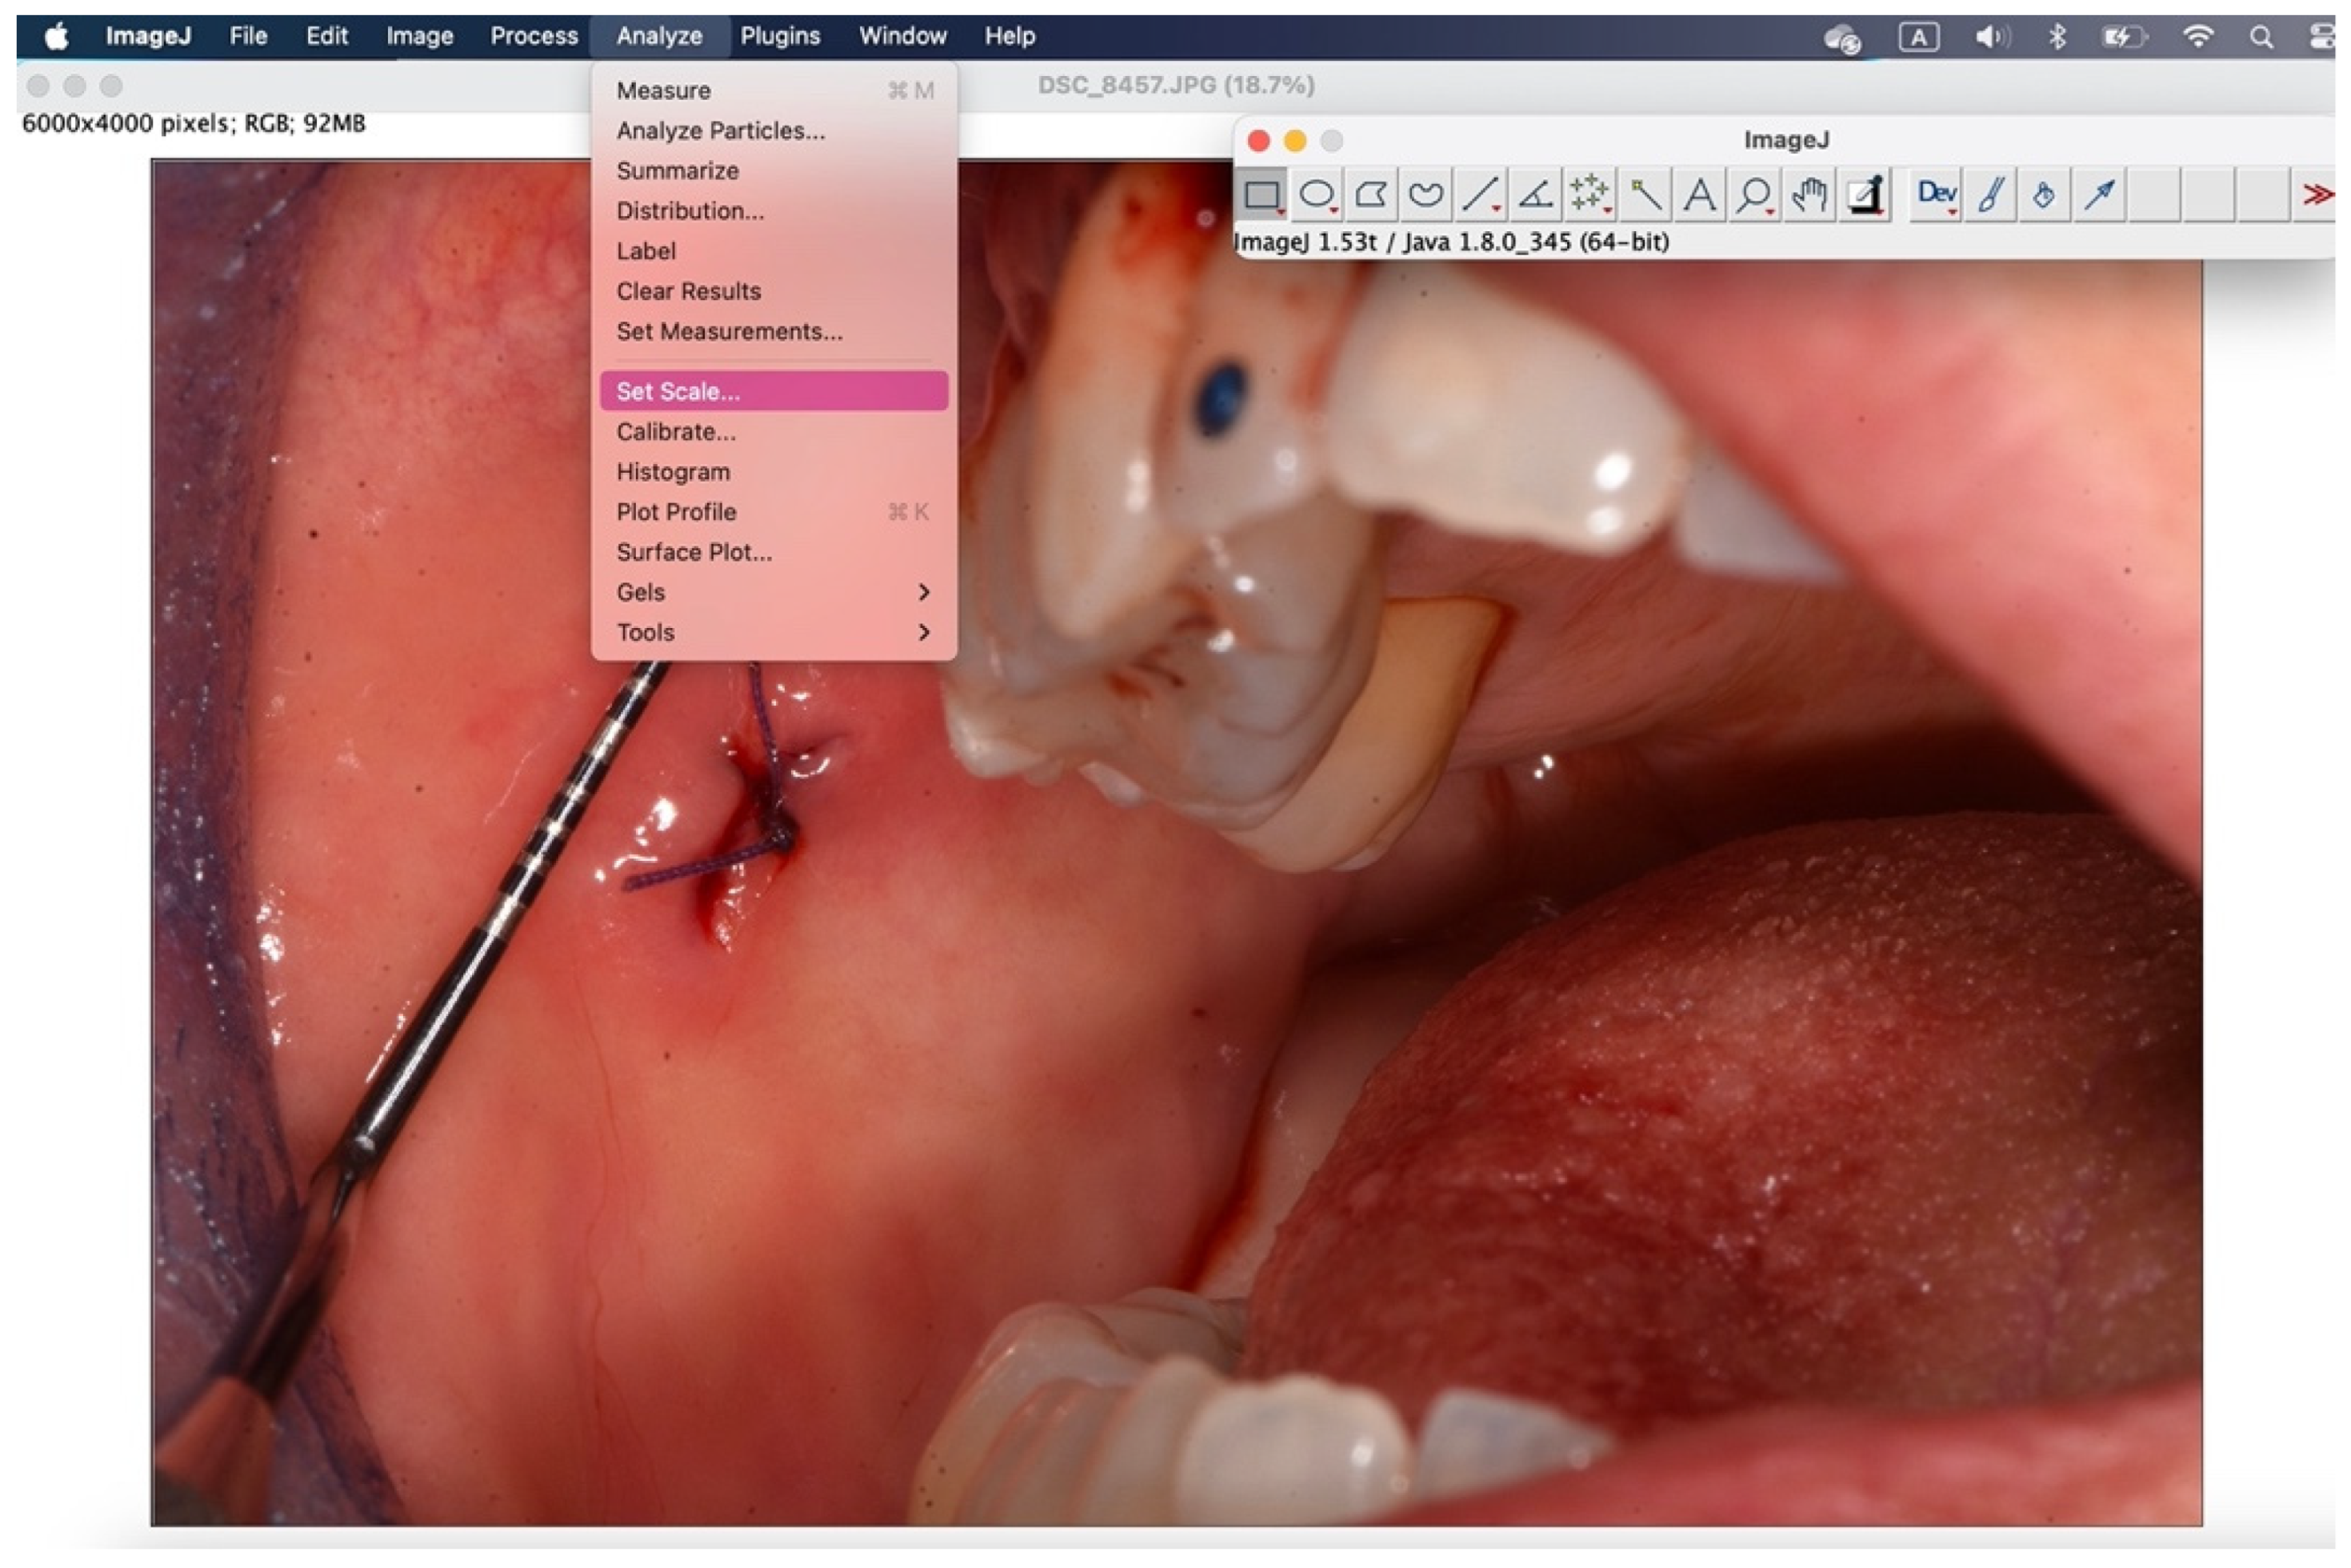
Figure 10.
In the window that appears, enter the “known distance” and the “unit of length”, then 1 mm.
Figure 10.
In the window that appears, enter the “known distance” and the “unit of length”, then 1 mm.
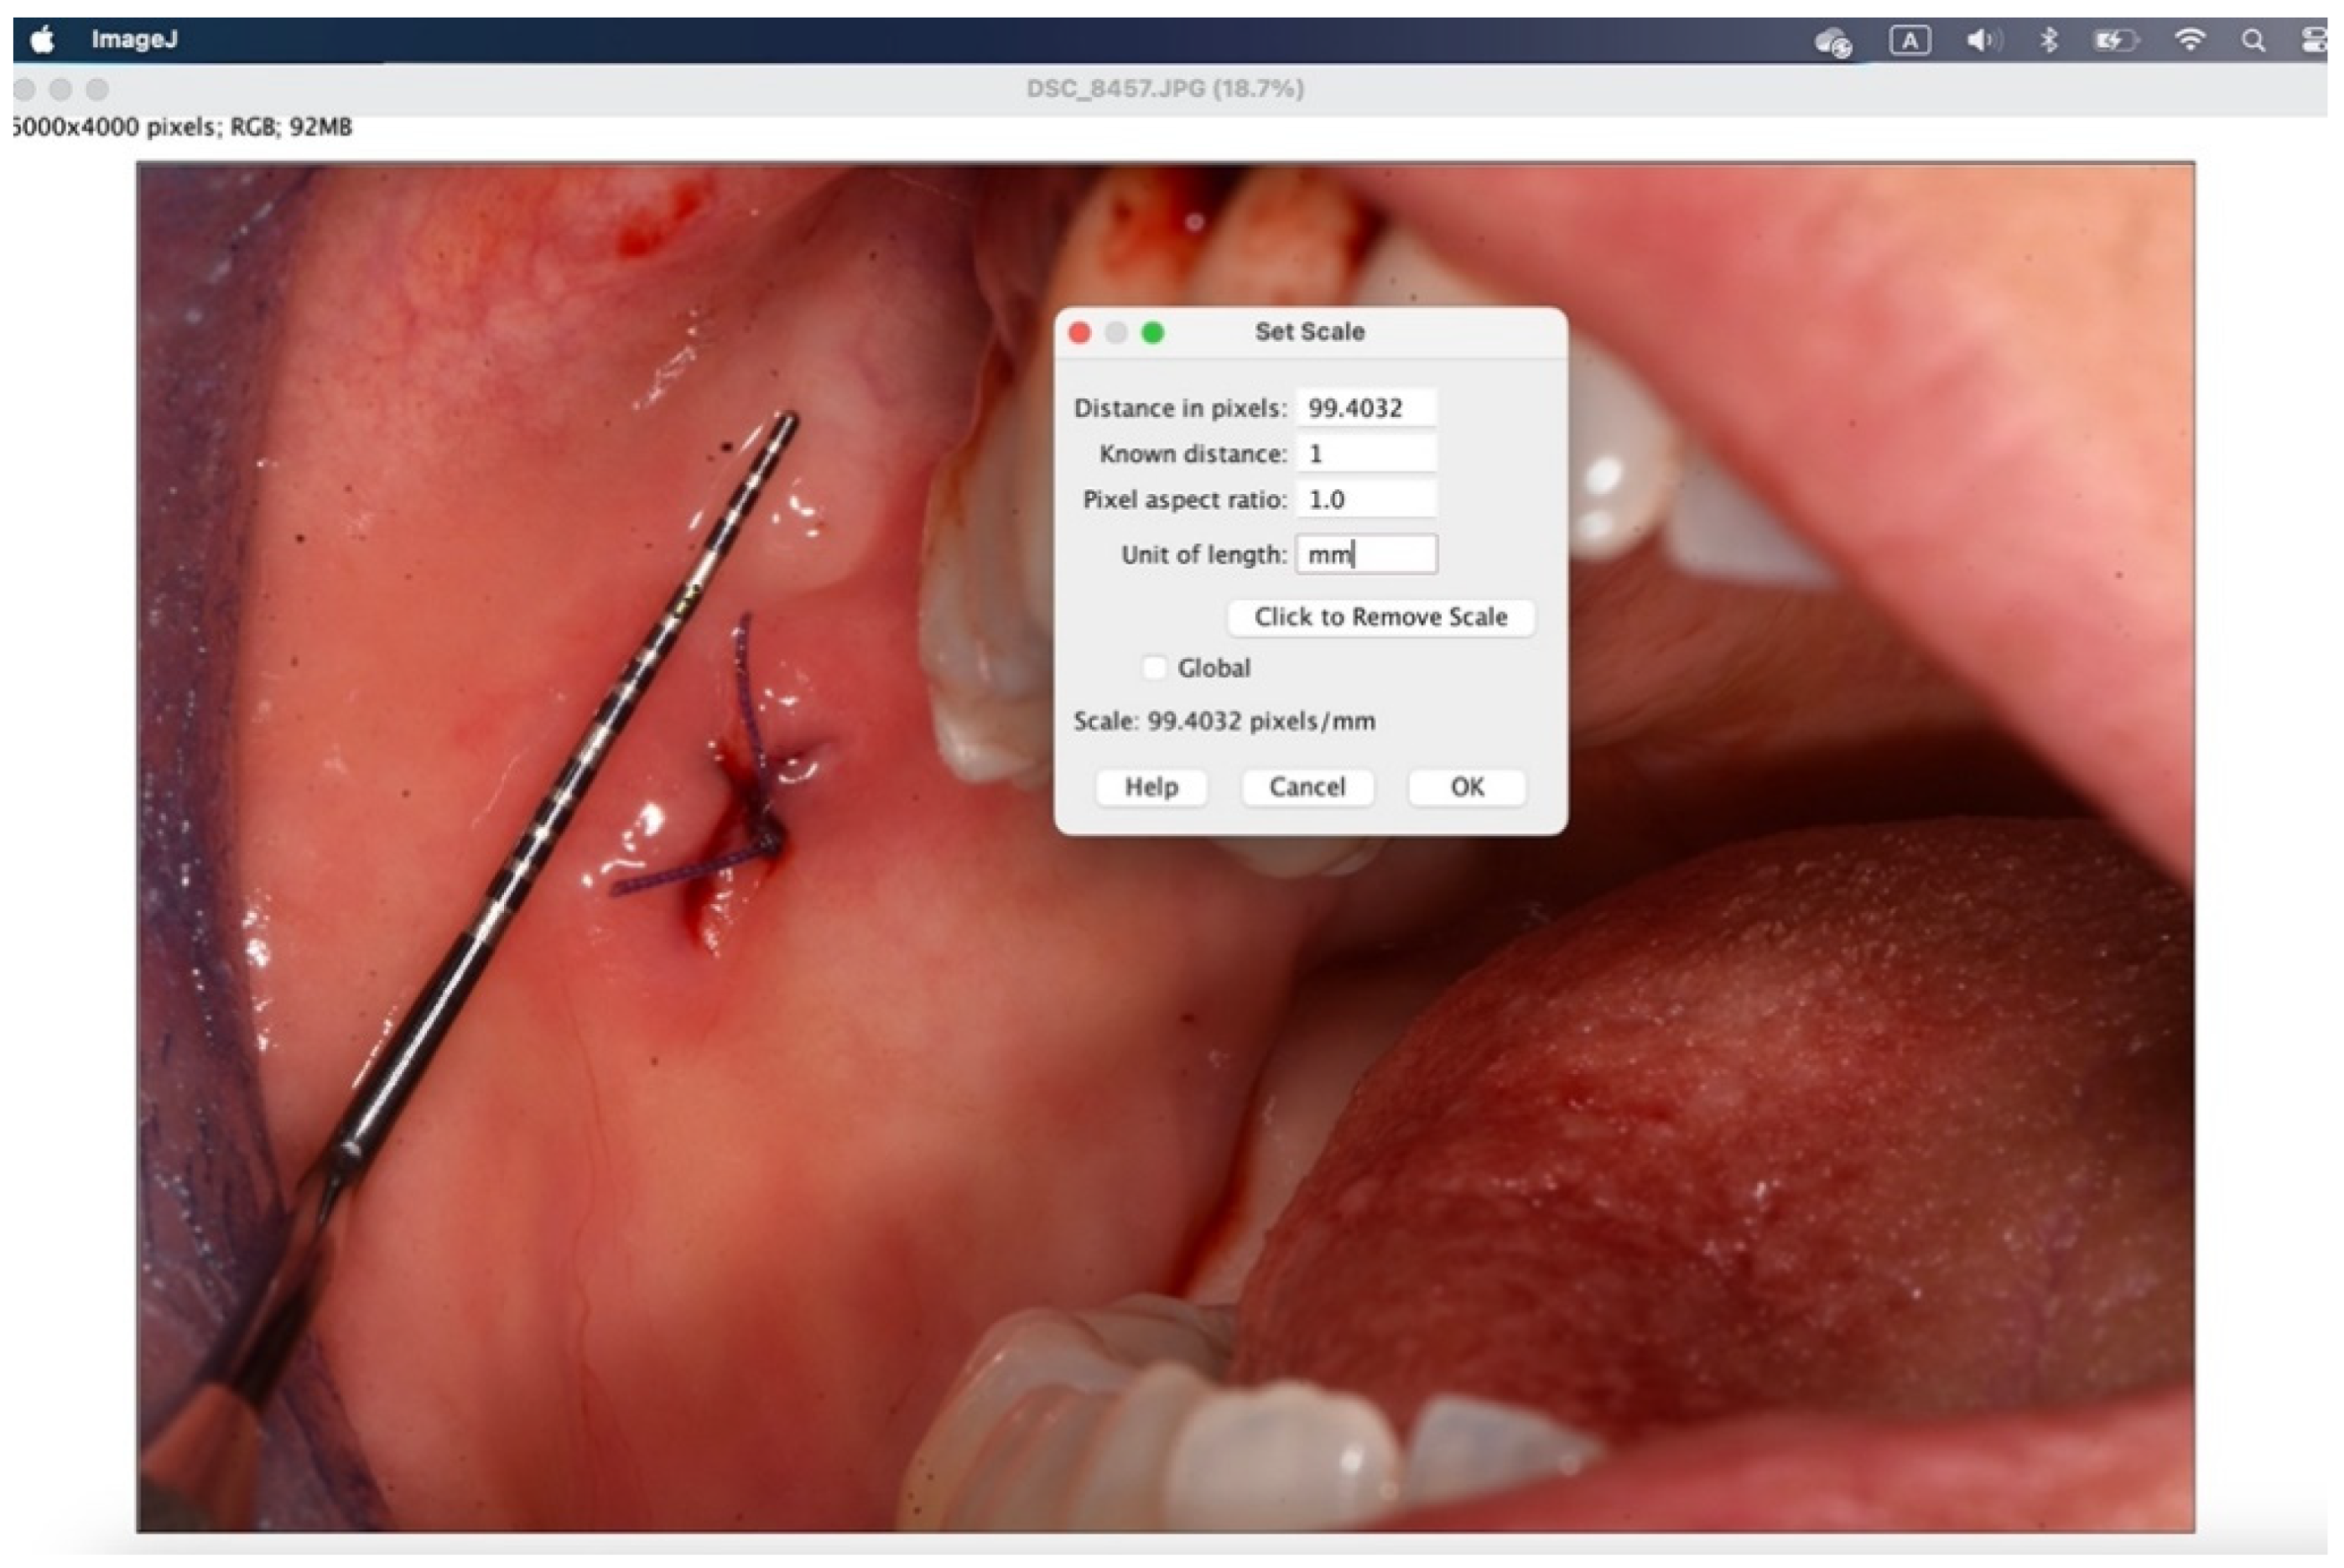
Figure 11.
With the "straight" instrument you go to trace the measurement on the lesion and through "analyze">"measure" you get the desired measurement in millimeters.
Figure 11.
With the "straight" instrument you go to trace the measurement on the lesion and through "analyze">"measure" you get the desired measurement in millimeters.
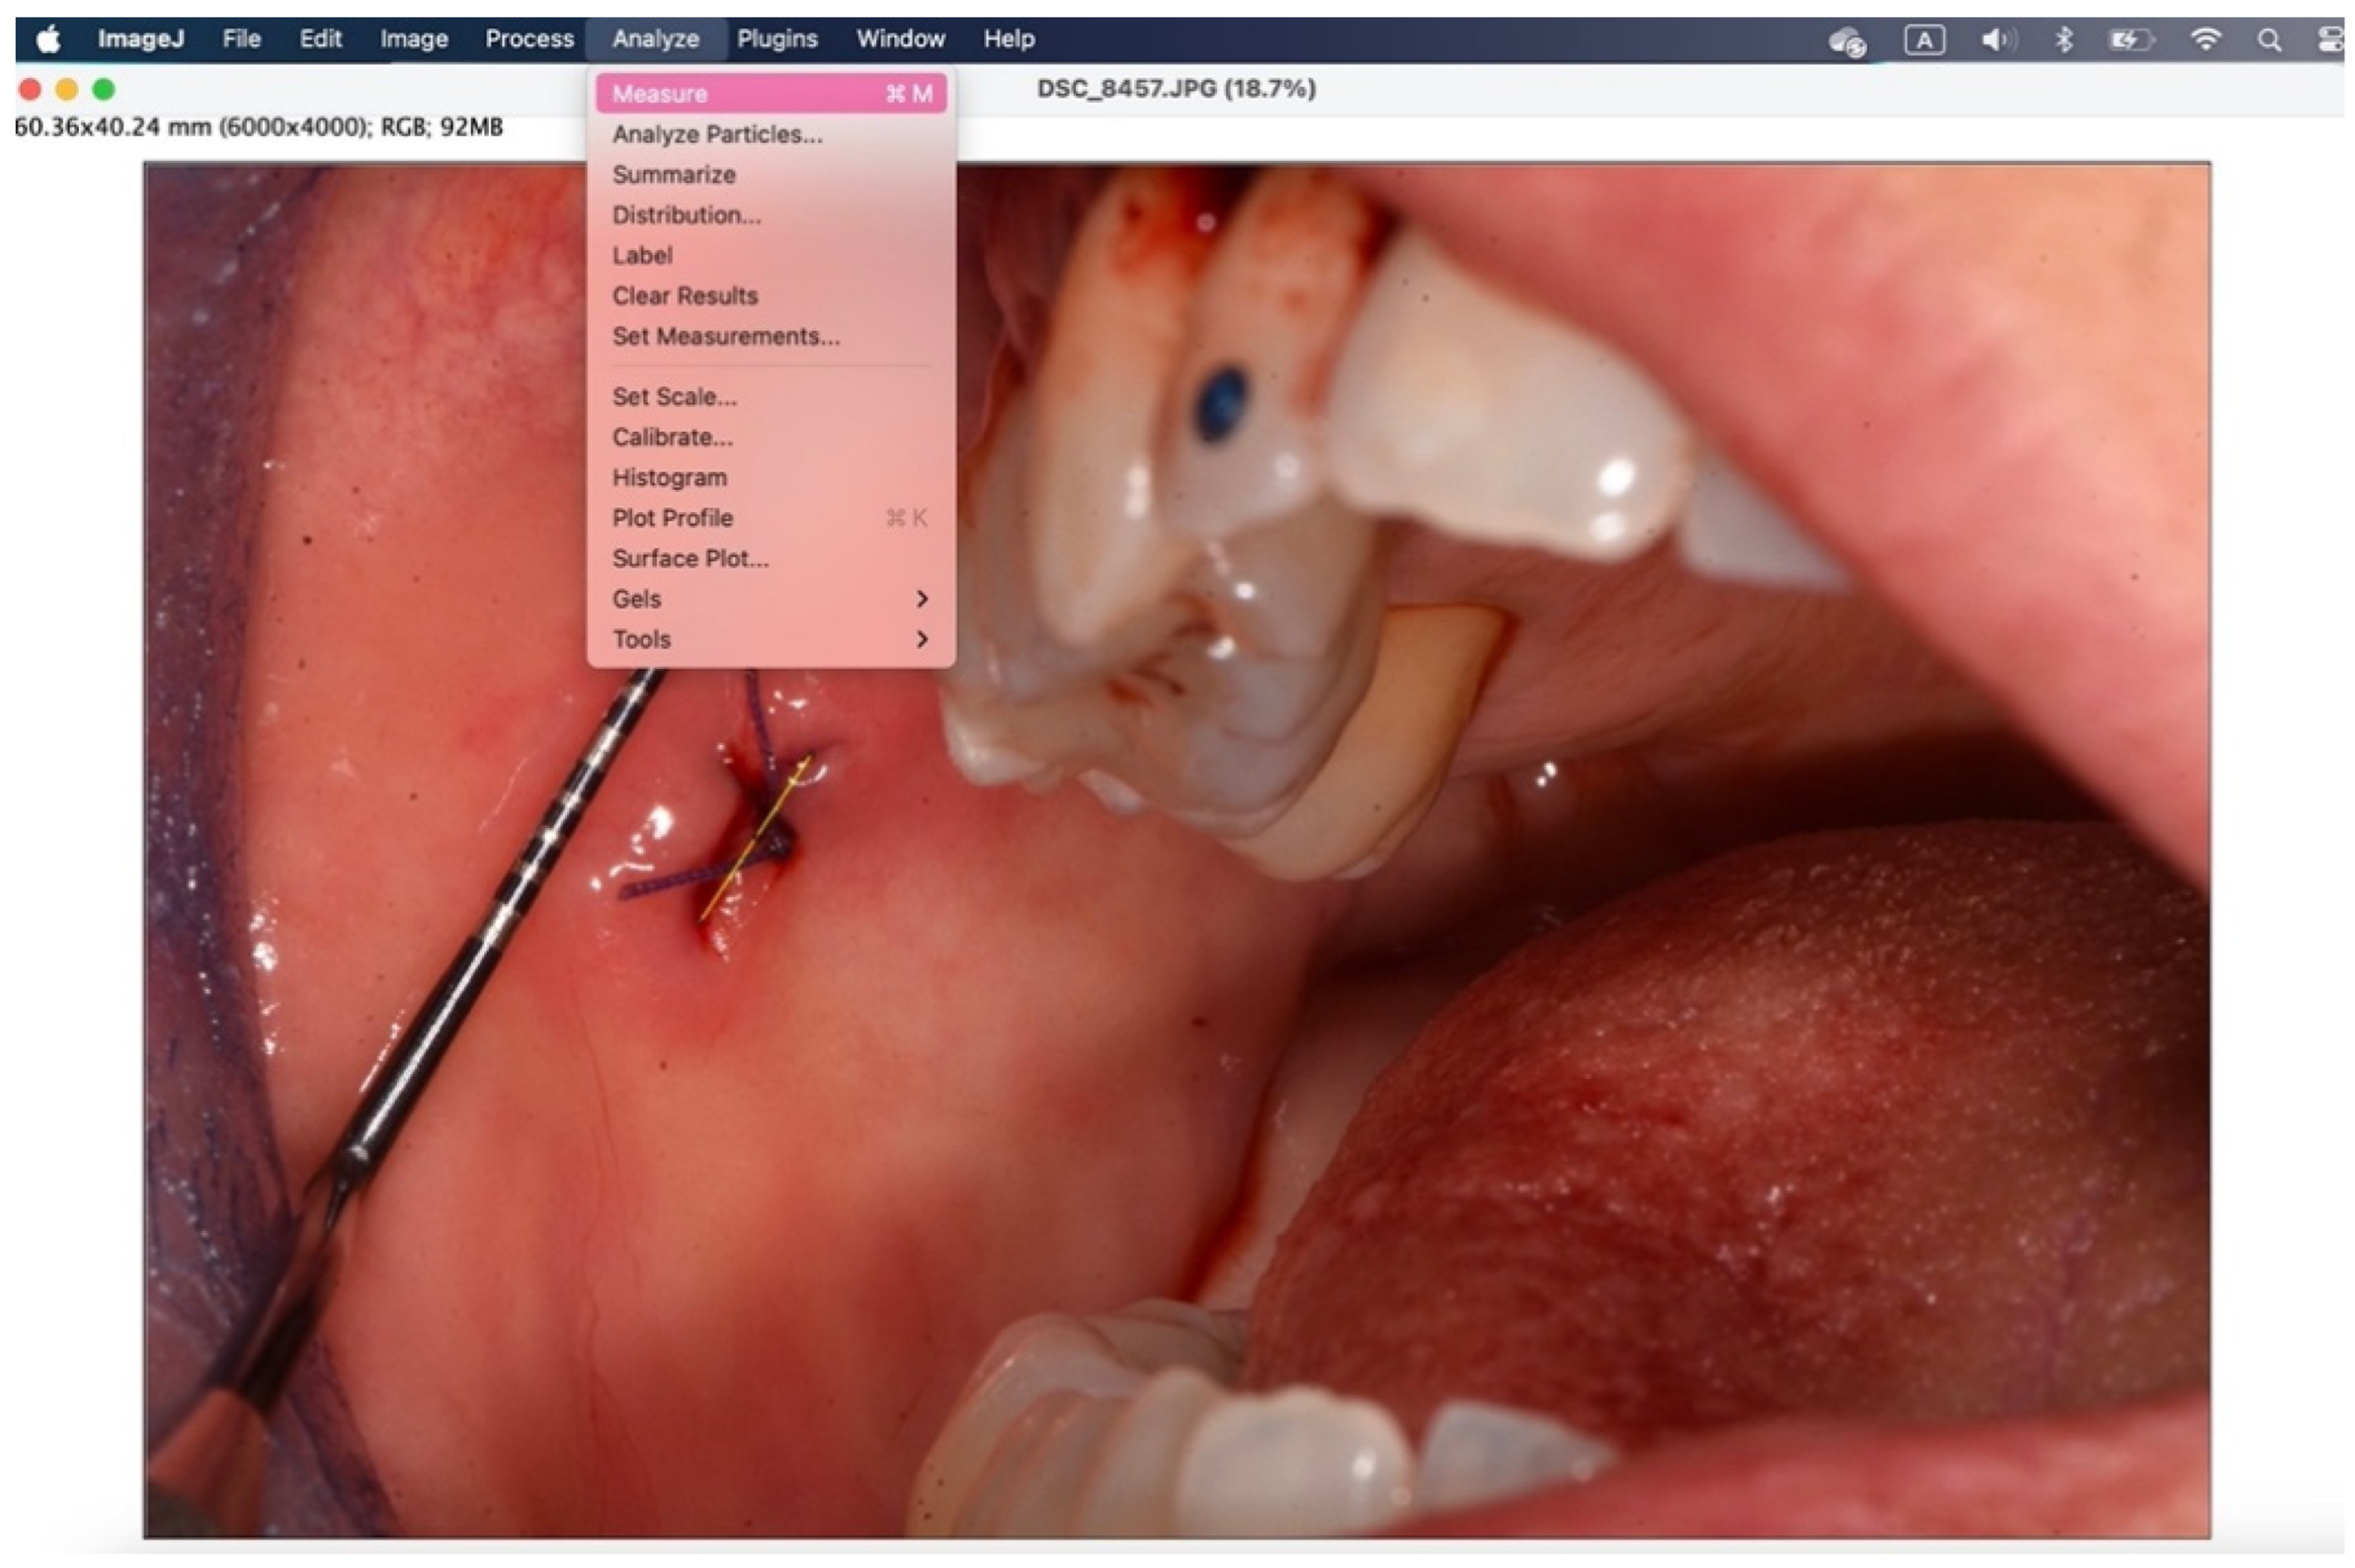
Figure 12.
Through the window that appears, the measurement taken in the set unit of measurement is displayed in "length".
Figure 12.
Through the window that appears, the measurement taken in the set unit of measurement is displayed in "length".
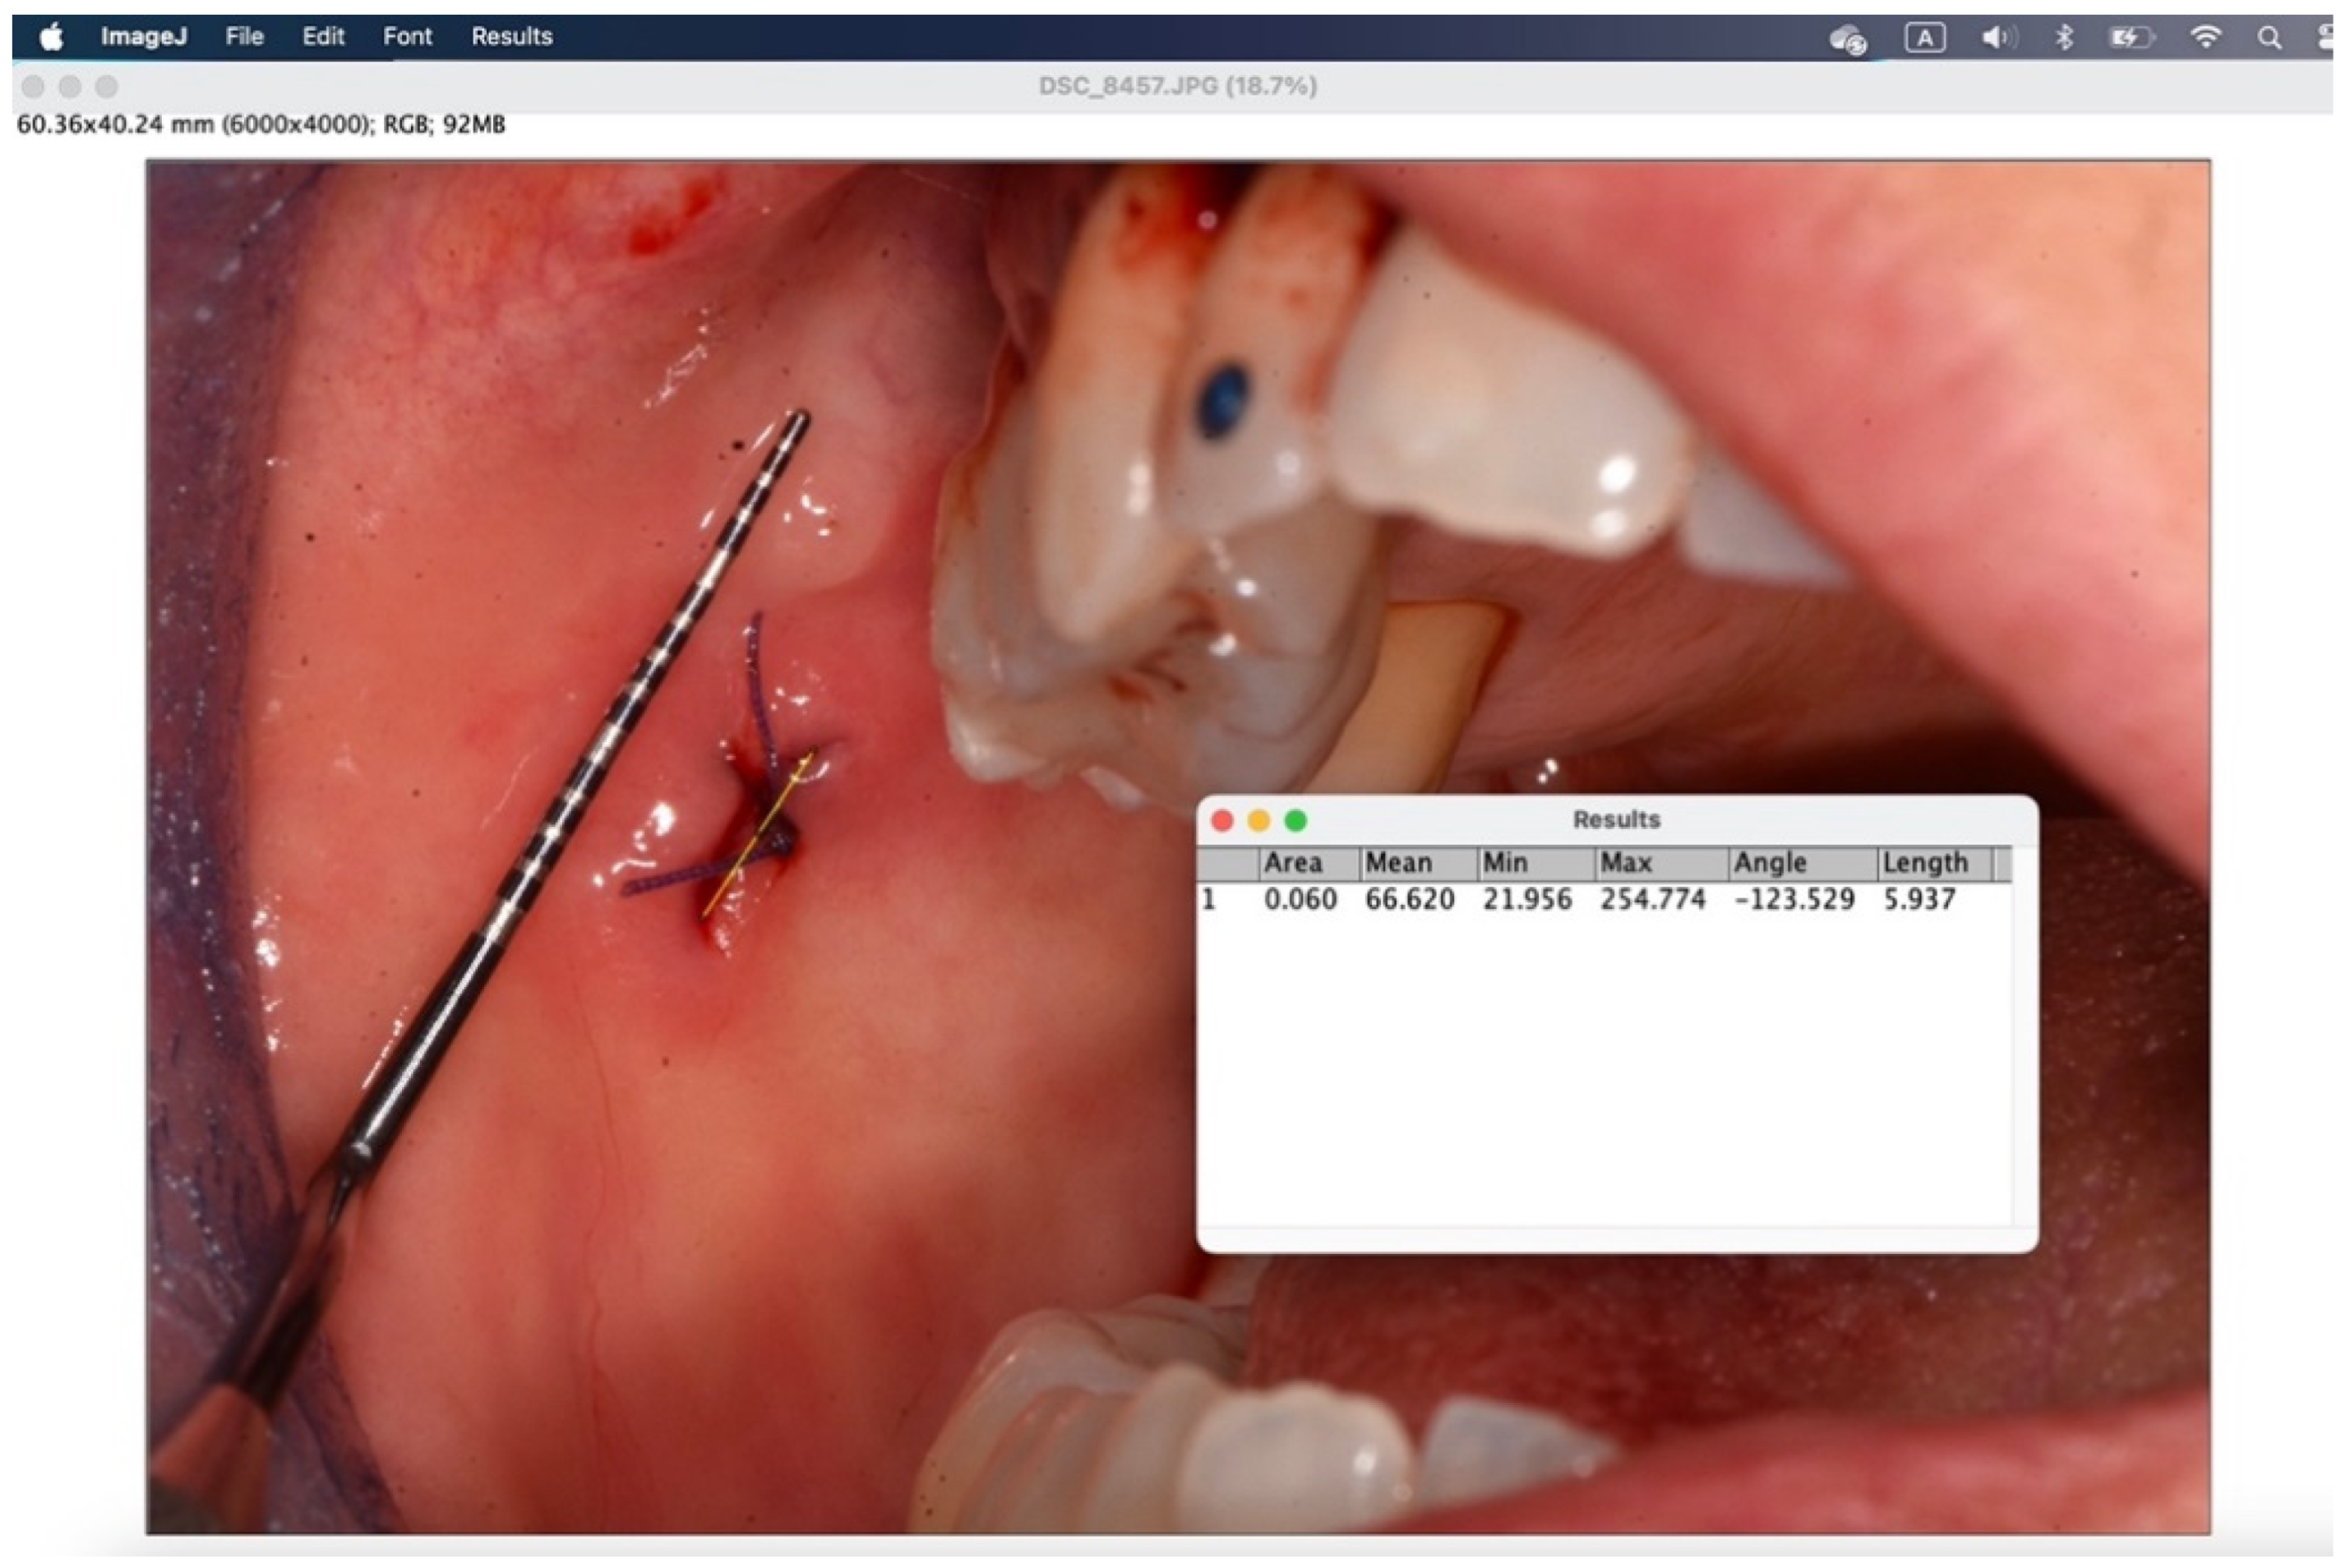
Table 1.
Characteristics of the patients.
| Test group (n=40) |
Control group (n=37) | ||
|---|---|---|---|
| sex, n (%): women men |
27 (68%) | 24 (65%) | |
| 13 (32%) | 13 (35%) | ||
| 27 (68%) | 24 (65%) | ||
| age, years: median (IQR) | 64 (54-74) | 61 (56-70) | |
| mucosal site, n (%): attached loose |
18 (45%) | 18 (49%) | |
| 22 (55%) | 19 (51%) | ||
| painkillers, n (%) | 14 (35%) | 8 (22%) | |
| smoker, n (%): no yes ex |
26 (65%) | 26 (70%) | |
| 9 (23%) | 4 (11%) | ||
| 5 (12%) | 7 (19%) |
Table 7.
Change in height from day 1 to day 6: non-smokers (information not available in 8 patients).
Table 7.
Change in height from day 1 to day 6: non-smokers (information not available in 8 patients).
| Test group (n=24) |
Control group (n=20) | Median difference (95% bootstrap confidence interval) | P value | |
|---|---|---|---|---|
| Height at day 1: median (IQR) | 6.6 (5.1; 7.3) | 6.4 (5.4; 7.3) | ||
| Height at day 6: median (IQR) | 3.1 (2.0; 5.4) | 2.8 (2.4; 3.9) | ||
| Variation in height: median (IQR) | 2.4 (1.1; 4.4) | 2.9 (1.3; 4.7) | -0.5 (from -2.1 to 1.6) | 0.63 |
Table 8.
Change in width from day 1 to day 6: non-smokers (information not available in 8 patients).
Table 8.
Change in width from day 1 to day 6: non-smokers (information not available in 8 patients).
| Test group (n=24) |
Control group (n=20) | Median difference (95% bootstrap confidence interval) | P value | |
|---|---|---|---|---|
| Width at day 1: median (IQR) | 2.9 (1.2; 5.8) | 2.2 (1.2; 3.0) | ||
| Width at day 6: median (IQR) | 1.6 (0.9; 3.3) | 1.4 (1.1; 1.7) | ||
| Variation in width: median (IQR) | 0.6 (-0.2; 2.8) | 0.6 (0.1; 1.4) | 0.0 (from -1.1 to 1.8) | 0.86 |
Table 9.
Change in height from day 1 to day 6: smokers (information not available in 2 patients).
| Test group (n=14) |
Control group (n=11) | Median difference (95% bootstrap confidence interval) | P value | |
|---|---|---|---|---|
| Height at day 1: median (IQR) | 6.9 (5.6; 9.8) | 6.3 (5.7; 7.1) | ||
| Height at day 6: median (IQR) | 5.2 (4.0; 6.7) | 4.9 (2.5; 5.2) | ||
| Variation in height: median (IQR) | 1.7 (0.7; 5.2) | 2.6 (0.9; 3.3) | -0.9 (from -2.4 to 3.8) | 0.65 |
Table 10.
Change in width from day 1 to day 6: smokers (information not available in 2 patients).
| Test group (n=14) |
Control group (n=11) | Median difference (95% bootstrap confidence interval) | P value | |
|---|---|---|---|---|
| Width at day 1: median (IQR) | 2.5 (1.9; 6.6) | 2.1 (1.6; 5.4) | ||
| Width at day 6: median (IQR) | 2.7 (1.3; 5.6) | 2.0 (1.1; 3.0) | ||
| Variation in width: median (IQR) | 0.4 (0.1; 1.0) | 0.9 (0.5; 1.8) | -0.5 (from -1.8 to 0.5) | 0.38 |
Table 11.
Change in height from day 1 to day 6.
| Attached gingiva (n=32) |
Loose mucosa (n=35) | Median difference (95% bootstrap confidence interval) | P value | |
|---|---|---|---|---|
| Height at day 1: median (IQR) | 6.2 (5.1; 6.8) | 6.9 (5.6; 8.0) | ||
| Height at day 6: median (IQR) | 4.1 (2.4; 5.2) | 3.1 (2.3; 5.2) | ||
| Variation in height: median (IQR) | 1.4 (0.5; 3.6) | 3.2 (.9; 5.1) | -1.8 (from -3.4 to -0.2) | 0.008 |
Table 12.
Change in width from day 1 to day 6.
|
Attached gingiva (n=32) |
Loose mucosa (n=35) | Median difference (95% bootstrap confidence interval) | P value | |
|---|---|---|---|---|
| Width at day 1: median (IQR) | 5.5 (2.8; 7.1) | 1.5 (1.1; 2.2) | ||
| Width at day 6: median (IQR) | 2.6 (1.3; 4.8) | 1.3 (1.1; 1.8) | ||
| Variation in width: median (IQR) | 1.3 (0.6; 3.2) | 0.1 (-0.5; 0.7) | 1.1 (da 0.6 a 2.7) | <0.0001 |
Disclaimer/Publisher’s Note: The statements, opinions and data contained in all publications are solely those of the individual author(s) and contributor(s) and not of MDPI and/or the editor(s). MDPI and/or the editor(s) disclaim responsibility for any injury to people or property resulting from any ideas, methods, instructions or products referred to in the content. |
© 2025 by the authors. Licensee MDPI, Basel, Switzerland. This article is an open access article distributed under the terms and conditions of the Creative Commons Attribution (CC BY) license (http://creativecommons.org/licenses/by/4.0/).
Copyright: This open access article is published under a Creative Commons CC BY 4.0 license, which permit the free download, distribution, and reuse, provided that the author and preprint are cited in any reuse.


