Preprint
Article

This version is not peer-reviewed.

High Protein Intake Increases Sirtuin 1 mRNA Expression in Rat Liver

Submitted:

05 January 2025

Posted:

06 January 2025

You are already at the latest version

Abstract

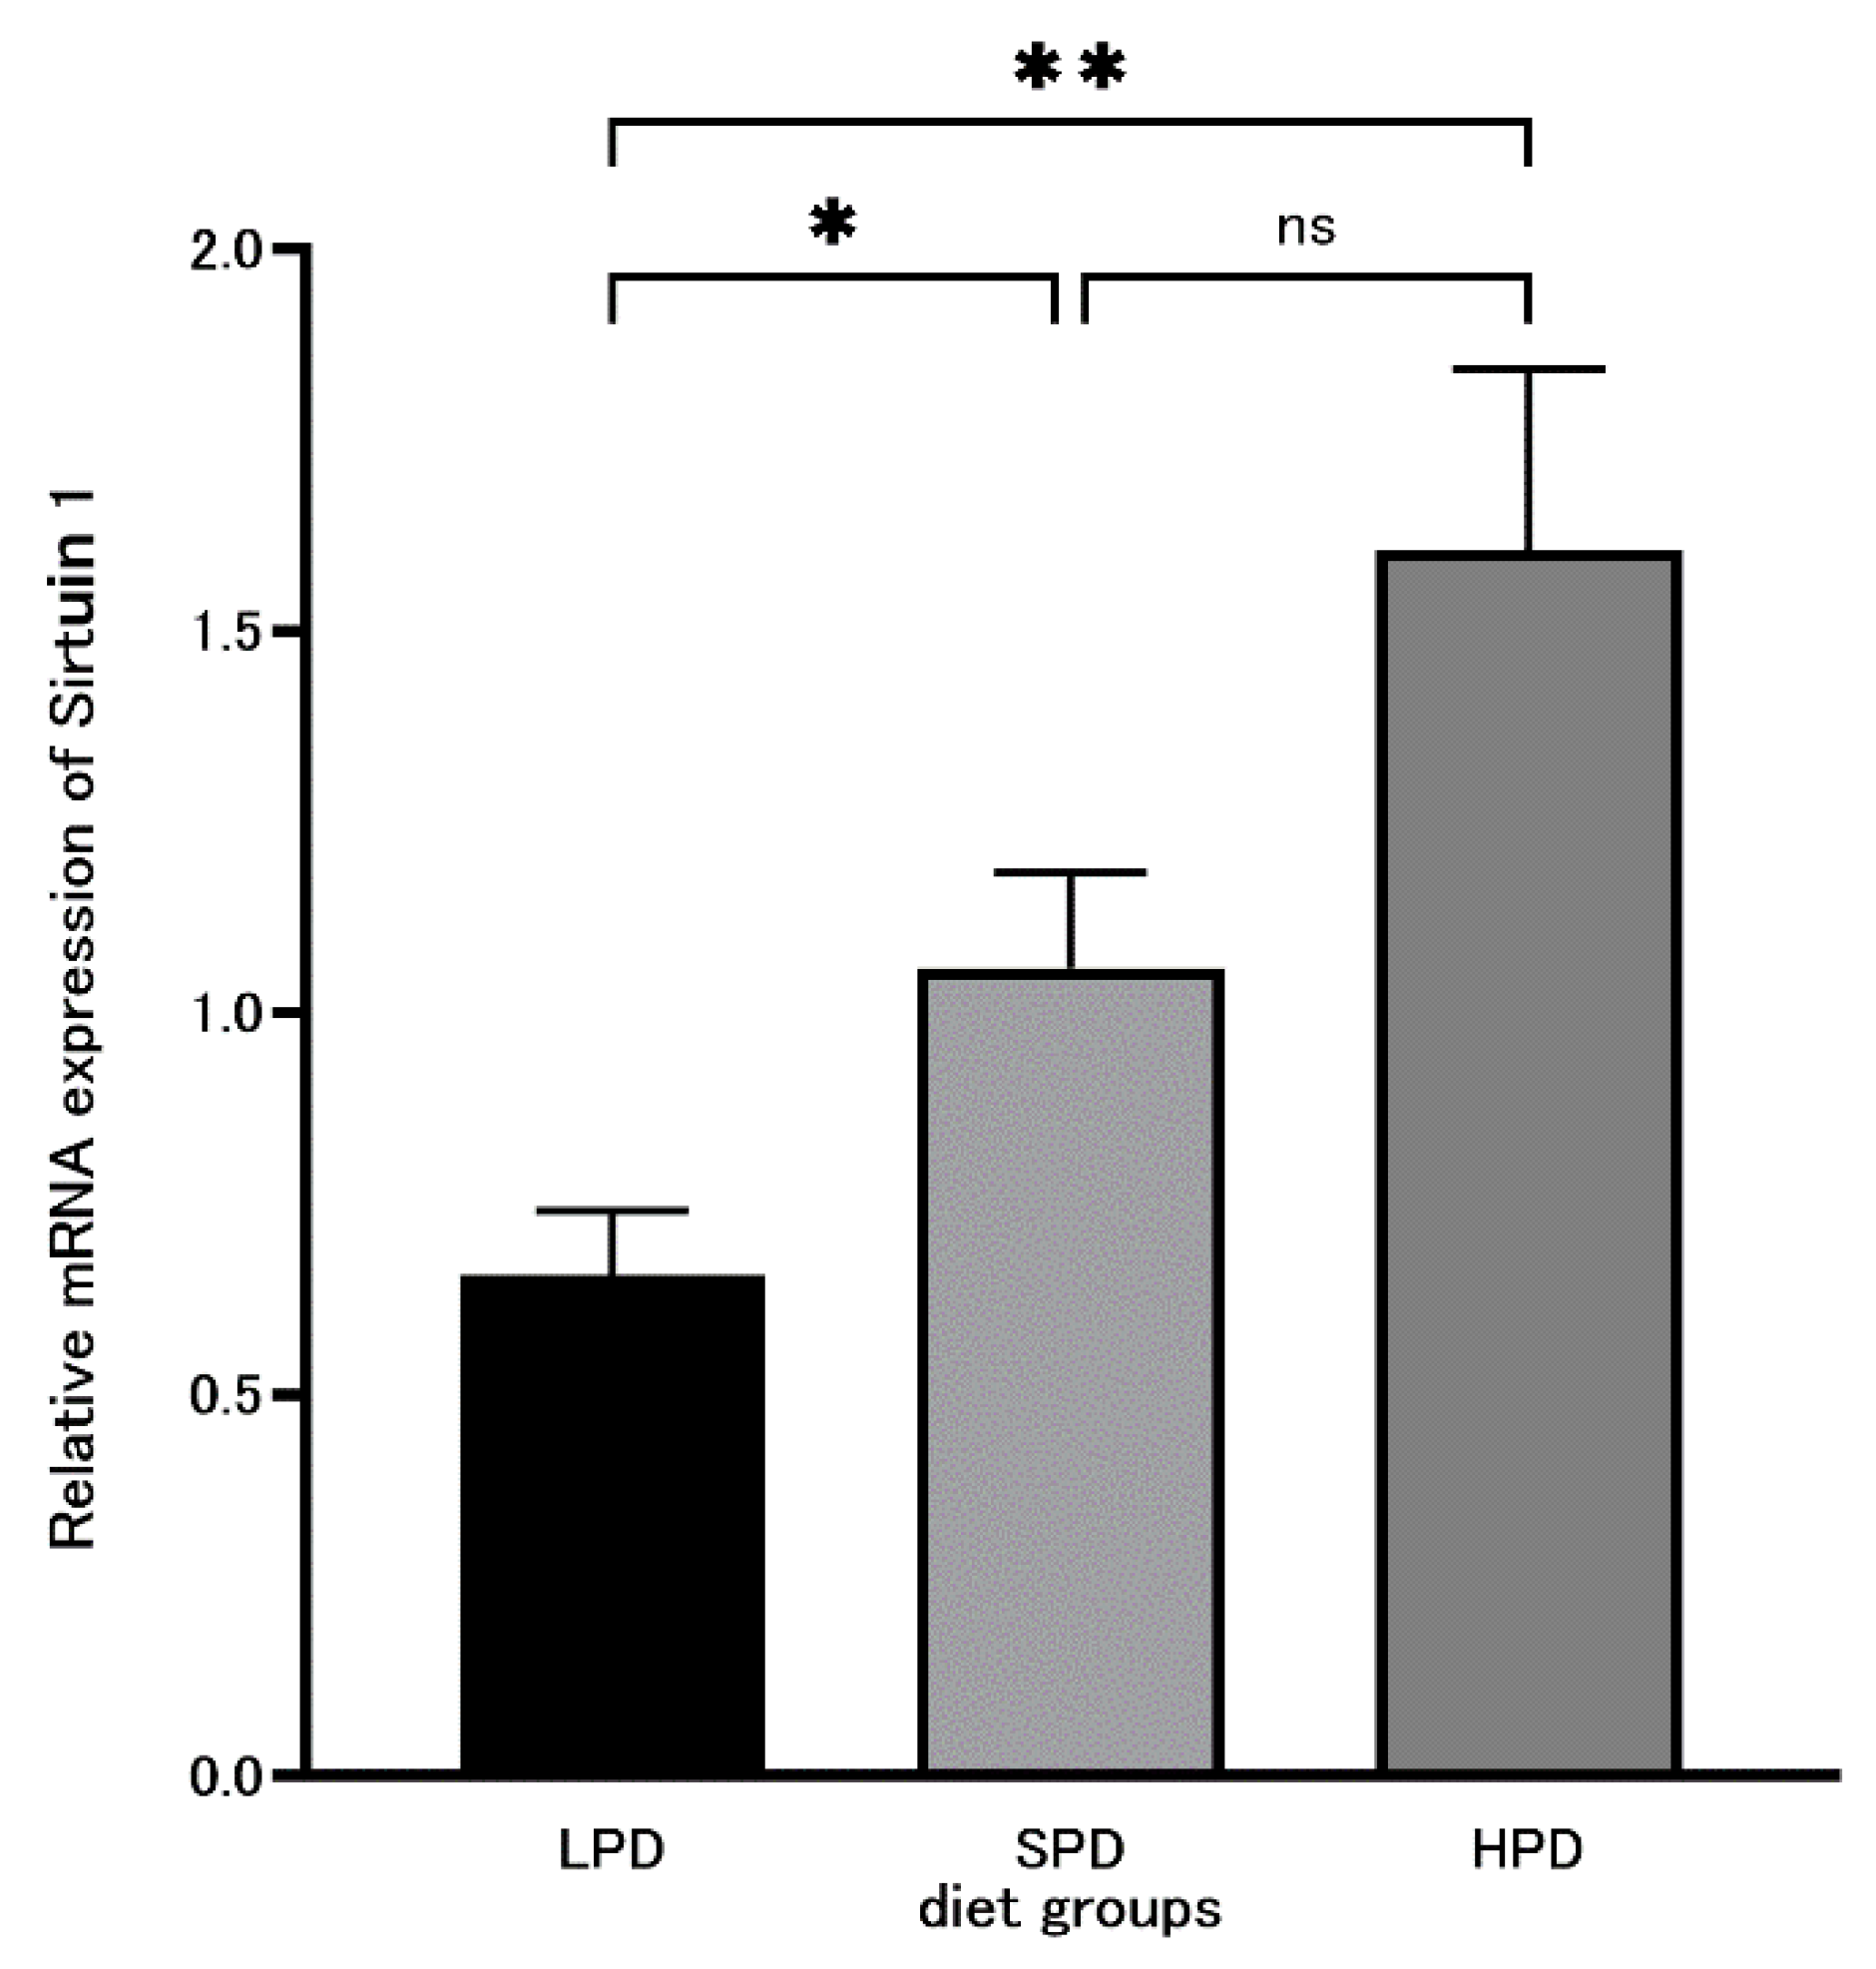
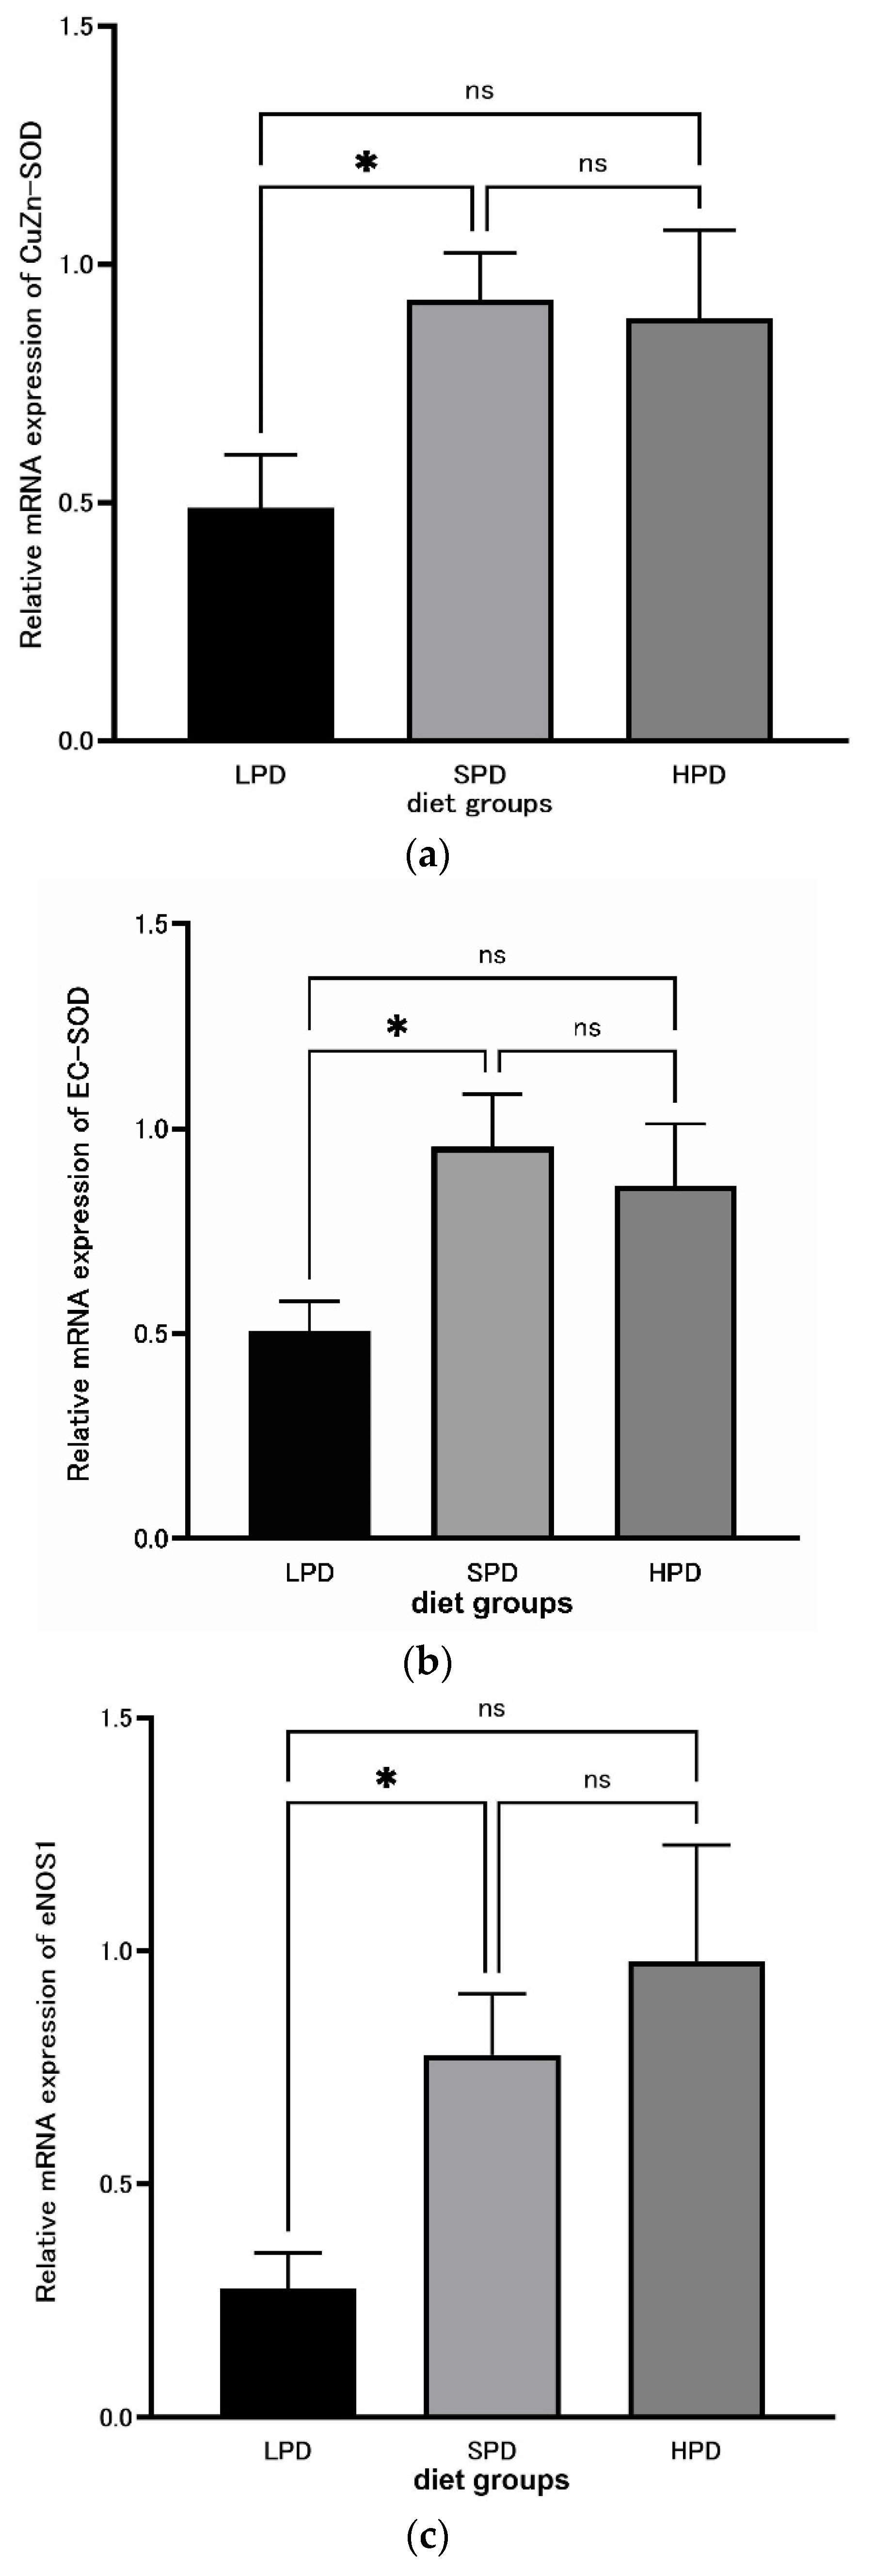
Background: The relationship between aging or disease and diets, as in the relationship between the intake of calories and disease, has been studied. Appropriate protein intake is im-portant for disease, frailty, and the life span. However, little is knew regarding to protein diet on any disease and lifespan. So we analyze the effects of high protein diets on rat liver oxidative stress and tumor marker. Methodology: Rats were separated into three groups: LPD with 5% protein, SPD with 20% protein, and HPD with 40% protein, administered over 4 weeks. The qRT-PCR method was used for measuring mRNA expression levels. as the expression of the an-ti-aging-related enzyme Sirtuin 1, superoxide dismutase (SOD), CuZn-SOD, EC-SOD, endothelial nitric oxide synthase (eNOS), tumor suppressor protein p53, and nuclear respiratory factor 1 (NRF-1). Results: A significant difference (p = 0.03853) was observed between the LPD and SPD groups for Sirtuin 1 and also between the LPD and HPD groups (p = 0.004914). There were signif-icant differences in CuZn-SOD and EC-SOD between the LPD and SPD groups (CuZn-SOD: p = 0.02062, EC-SOD: p = 0.01906). A significant difference (p = 0.01359) between the LPD and SPD groups was also observed for eNOS. Conclusions: A significant difference in Sirtuin 1 expression was observed between the LPD and SPD, and between the LPD and HPD groups, indicates that high protein intake promotes Sirtuin 1 and prevents aging. As for CuZn-SOD, EC-SOD, and eNOS, the significant difference between the SPD and LPD groups indicates that low protein intake lowers the production of SOD and increases reactive oxygen species (ROS). An appropriate amount of protein is necessary for the prevention of aging, lifestyle-related diseases, and arteriosclerotic diseases caused by oxidative stress and to extend the life span.

Keywords: 
;  ;  ;  ;  ;  ;  ;  

Introduction

Proteins, carbohydrates, and lipids are three major nutrients critical for mammals. The relationship between food and the prevention of aging and disease, examined as the relationship between calorie intake and disease occurrence, has been discussed over many years [1]. However, studies on the relationship between protein intake and aging, oncogenesis, and the development of other diseases are not available.
It is well known that the generation of reactive oxygen species (ROS) is involved in aging and lifestyle-related disease. Both of CuZn-SOD and extracellular SOD (EC-SOD), are the main antioxidant enzymes observed in the aerobic cell metabolism mechanism. SOD contributes towards physiological protection against oxidative stress. Several studies have demonstrated that an adequate balance of antioxidant enzymes, including SOD, is required to minimize the toxic effects of ROS. The generation of ROS has a causal relationship with the aging process and lifestyle-related diseases. When the generation of ROS cannot be suppressed by SOD, oxidative stress increases, ROS accumulate in the tissue, and there is an increase in aging, lifestyle-related disease, and the possibility of carcinogenesis [2].
The antiaging-related enzyme NAD+-dependent deacetylase silent information regulator 1 (Sirtuin 1) and cancer suppressor protein p53 are known to play important roles in the prevention of aging and cancer. In addition, nitrogen monoxide (NO) is an in vivo free radical that attacks bacteria and viruses, has a vasodilating action, and functions as a neurotransmitter.
A recent report shows that Sirtuin 1 and p53 are closely related in the mechanism of carcinogenesis, and their anticancer effects under dietary restrictions and their ability to improve type 2 diabetic nephropathy have been reported [3,4]. For our results, Sirtuin 1 and p53 are important for prevention of the lifestyle-related disease and carcinogenesis.
Adequate protein intake improves skeletal muscle composition and metabolism and has many beneficial effects in terms of obesity, metabolic syndrome, osteoporosis, and cardiovascular diseases [5]. However, it is not clear how differences in protein intake under equal energy intake influence aging and carcinogenesis.
Accordingly, as one of the few studies, an experiment using rat liver was carried out to verify that the differences in protein intake under diets containing identical calorie intakes has an effect on aging, lifestyle-related diseases, and carcinogenesis. The mRNA expression levels of the antiaging-related enzyme Sirtuin 1, CuZn-SOD, EC-SOD, endothelial nitric oxide synthase (eNOS), tumor suppressor protein p53, and nuclear respiratory factor 1 (NRF-1) were measured using the quantitative reverse-transcription polymerase chain reaction (qRT-PCR) method in liver tissues extracted after 4 weeks of rearing.

2. Materials and Methods

2.1. Rat

Approval (Approval No. 2950) was granted by the Rector of Saitama Medical University (38 Moro Hongo, Moroyama Town, Iruma County, Saitama, 350-0045, Japan) following a review conducted by the Animal Experiment Committee under the Saitama Medical University Regulations on Animal Experiments. This study was conducted at the Department of Social Medicine, Faculty of Medicine, Saitama Medical University. Five-week-old male Sprague Dawley (SD) rats were obtained from CLEA Japan Inc., Tokyo, Japan. After delivery, they were housed in individual cages for 1 week and adapted to the environment. The rats were then divided into three groups according to the protein level of the diet administered: a 5% low-protein diet (LPD) (n = 10), a 20% standard protein diet (SPD) (n = 9), and a 40% high-protein diet (HPD) (n = 10). The rats were housed in individual cages for 4 weeks. A summary of the composition of the LPD, SPD, and HPD is presented in Table 1. Approximately 16 g of food was administered per day, and water was always available.

2.2. Sample Collection

After 4 weeks of the experiment, the rats’ organs were extracted under anesthesia (2% isoflurane) and blood was collected from the abdominal aorta. All organs and blood were immediately frozen in liquid nitrogen and stored in a refrigerator at −80 °C. Approximately 50 mg of the internal left lobe tissue of the extracted organ was used for analysis.

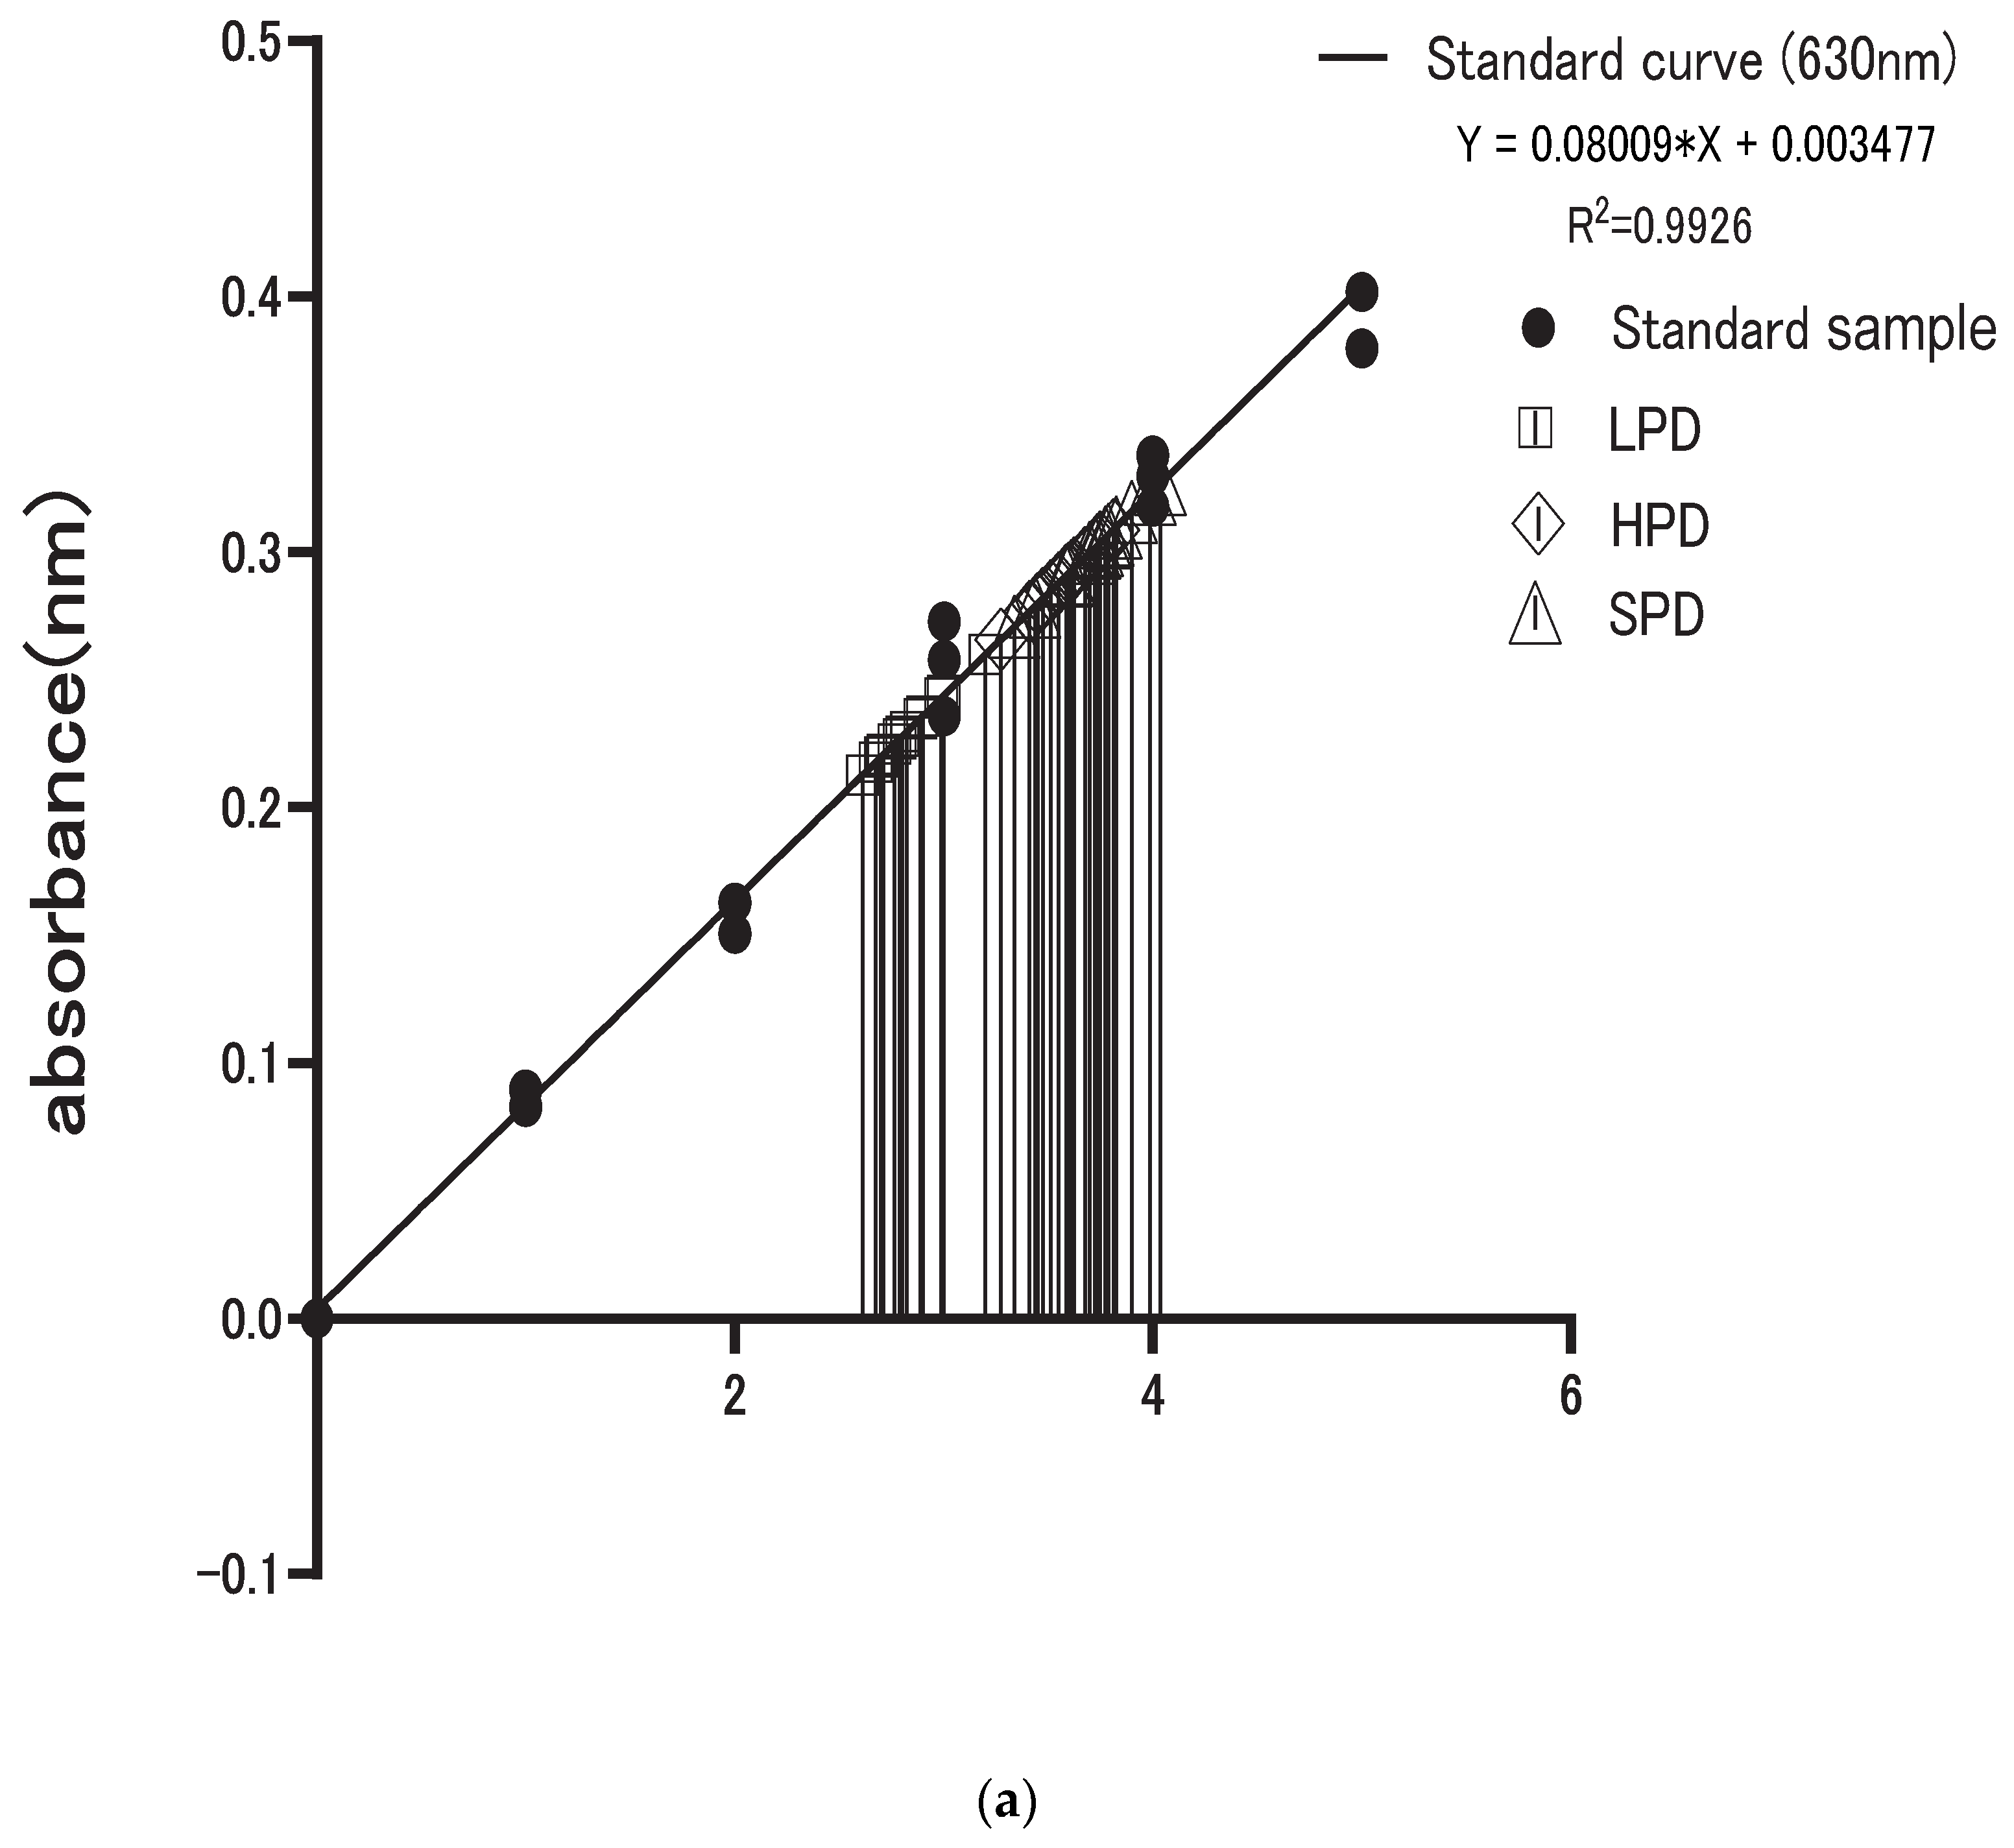
2.3. Determination of Serum Total Protein and Serum Albumin Levels

After thawing the frozen blood, a spectrophotometer was used to measure the serum total protein and albumin levels. The spectrophotometer used was an Ultramark microplate reader made by BIO-RAD, and the analysis software was Microplate Manager PC version 5.1. In terms of the parameters of the spectrophotometer, the serum total protein was measured at a wavelength of 540 nm and serum albumin was measured at a wavelength of 630 nm. The A/G B-Test Wako (Fujifilm Wako Pure Chemical Industries, Ltd. Japan), a commercially available kit whose measurement principle includes the Biuret and BCG methods, was used as a chromogenic reagent. An accompanying standard serum was used for calibration.

2.4. Quantitative Reverse-Transcription Polymerase Chain Reaction (qRT-PCR)

2.4.1. Extraction of Total RNA and cDNA Production

As a pre-treatment of the qRT-PCR method, 50 ng of total RNA was extracted from the frozen hepatic tissue. ISOGEN (Nippon Gene Co., Ltd.) was used as a RNA extraction agent. Then, 1 μg of liver tissue was homogenized with 500 μL of ISOGEN reagent, followed by the addition of 20% chloroform (50:10). After centrifugation at 4 °C for 15 min, only the aqueous layer separated into three layers was extracted, followed by the addition of isopropanol and further centrifugation. The total RNA was isolated by the addition of 70% ethanol. A 20 μL volume of complementary deoxyribose nucleic acid (cDNA) synthesis reagent (iScriptTM cDNA Synthesis Kit) was added to 1 μg of RNA sample, reacted at 25 °C for 5 min, and then at 42 °C for 30 min to obtain reverse-transcribed cDNA.

2.4.2. mRNA Measurement

A PCR reaction reagent (iQTM SYBR Green Supermix), F-primer of the target gene, and R-primer were added to 5 μL (50ng) of the obtained cDNA samples to prepare 25 μL, and the mRNA level was measured. Then, 45 cycles of denaturation were conducted at 94 °C for 30 s, annealing at 60 °C for 30 s, and elongation at 72 °C for 30 s. As a control, glycer-aldehyde-3-phosphate dehydrogenase (GAPDH) was used to calculate the relative expression of cDNA. The relative expression of genes was calculated using the 2−ΔΔCt method. A base sequence of the primer used in this study is shown in Table 2.

2.5. Statistical Analysis

A one-way analysis of variance was used for the obtained results to test whether there was a significant difference between the concentrations and expression levels. It was found that the variance of each concentration group was not equal, and a Brown-Forsythe test and Welch’s ANOVA were carried out. Dunnett’s T3 multiple comparison test was subsequently performed as a post hoc test to confirm significant differences between each concentration group. The statistical graph preparation software GraphPad Prism 9.3.1.471 was used for these statistical processes.

3. Results

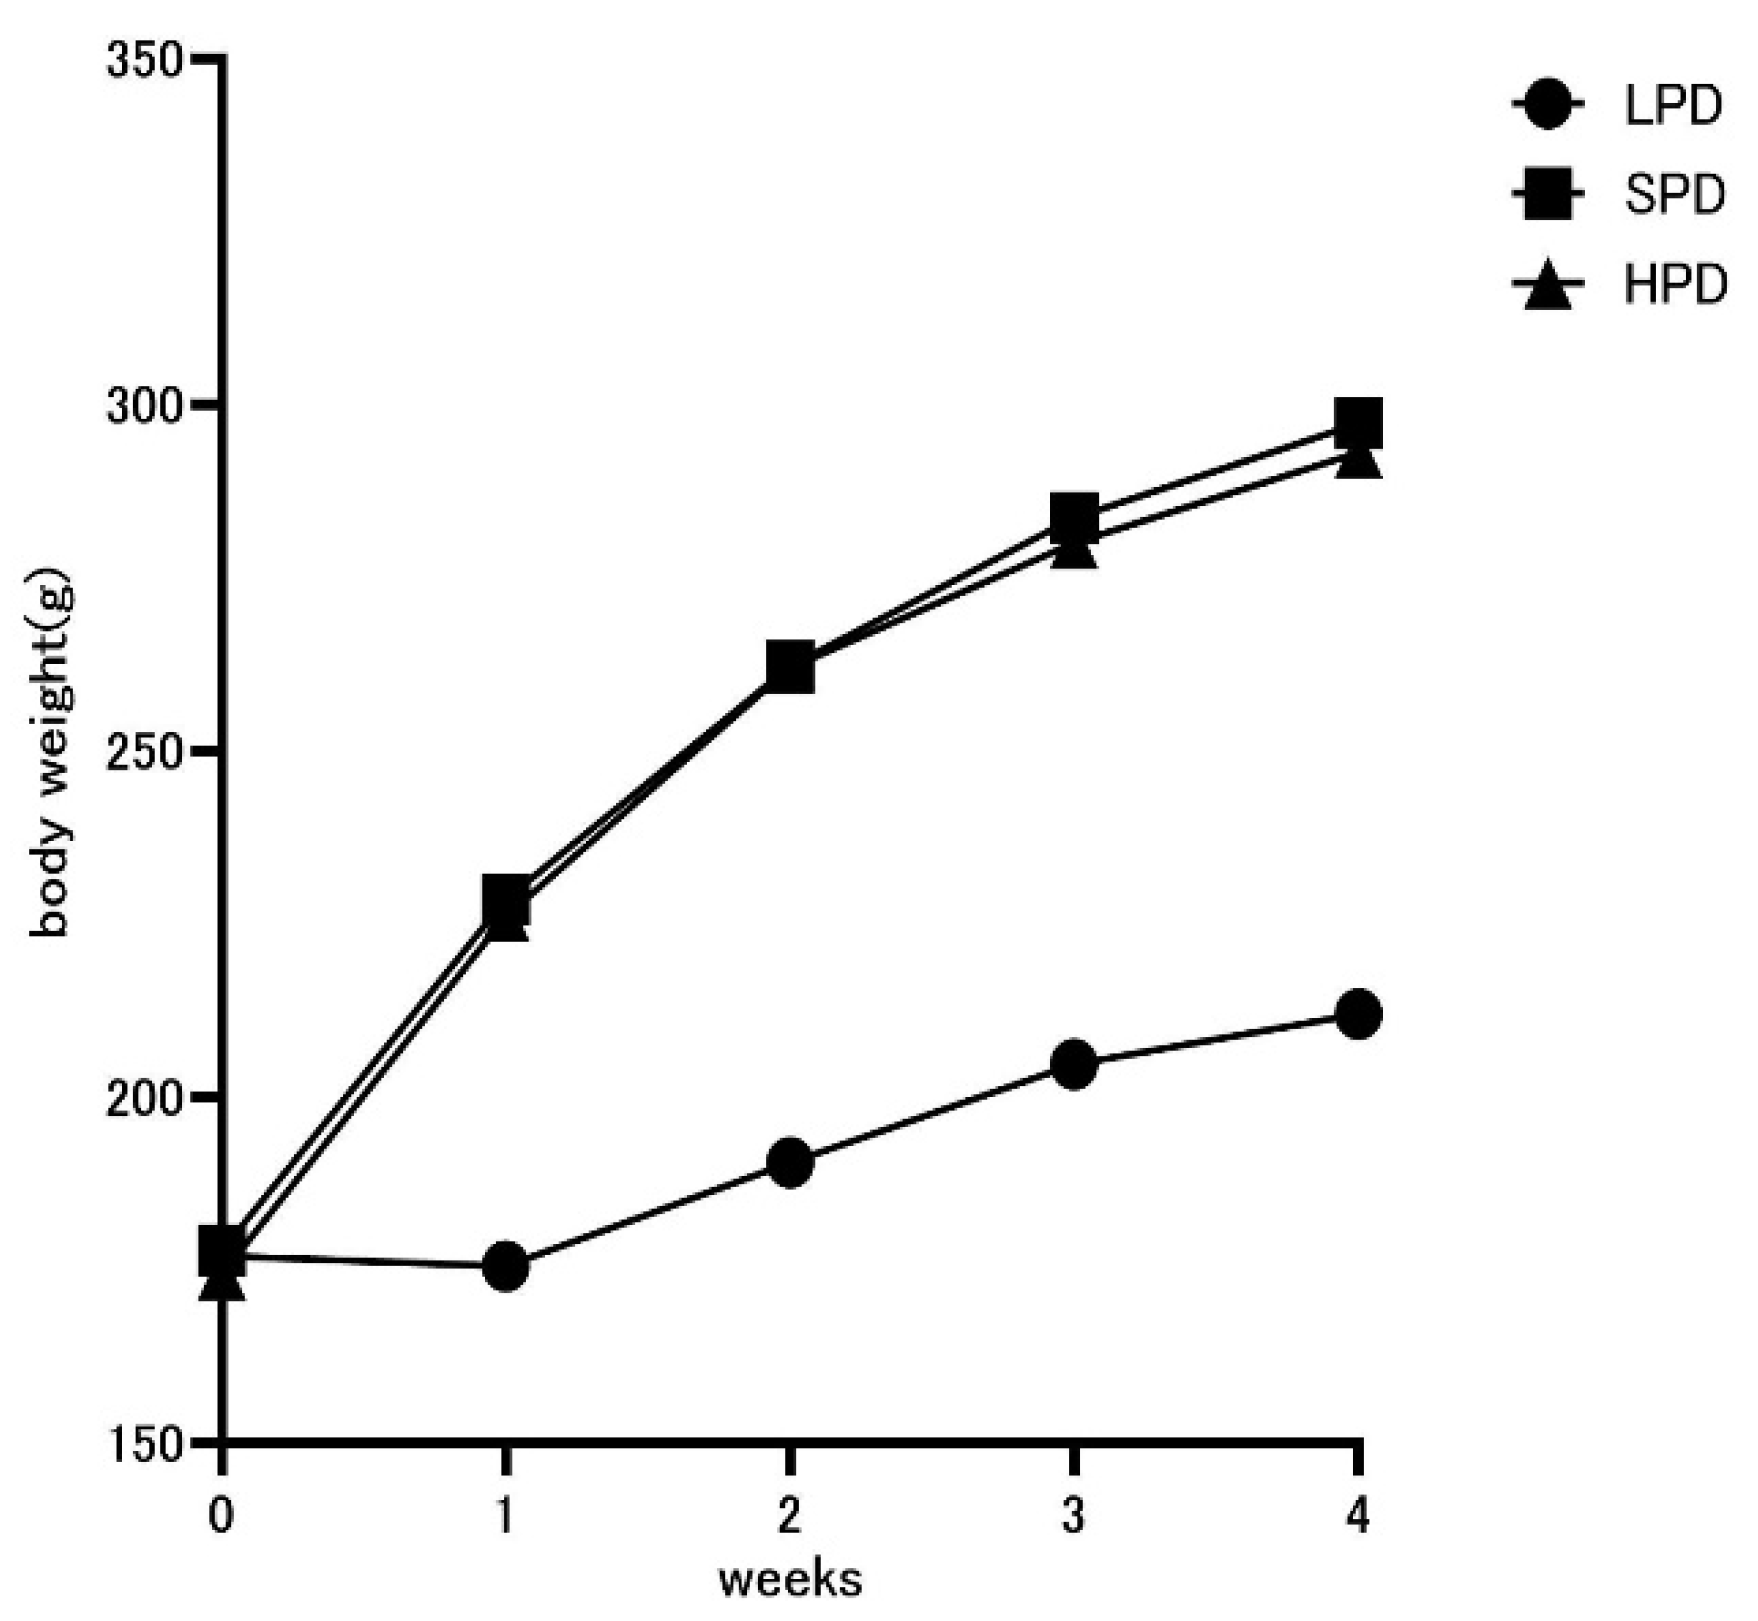
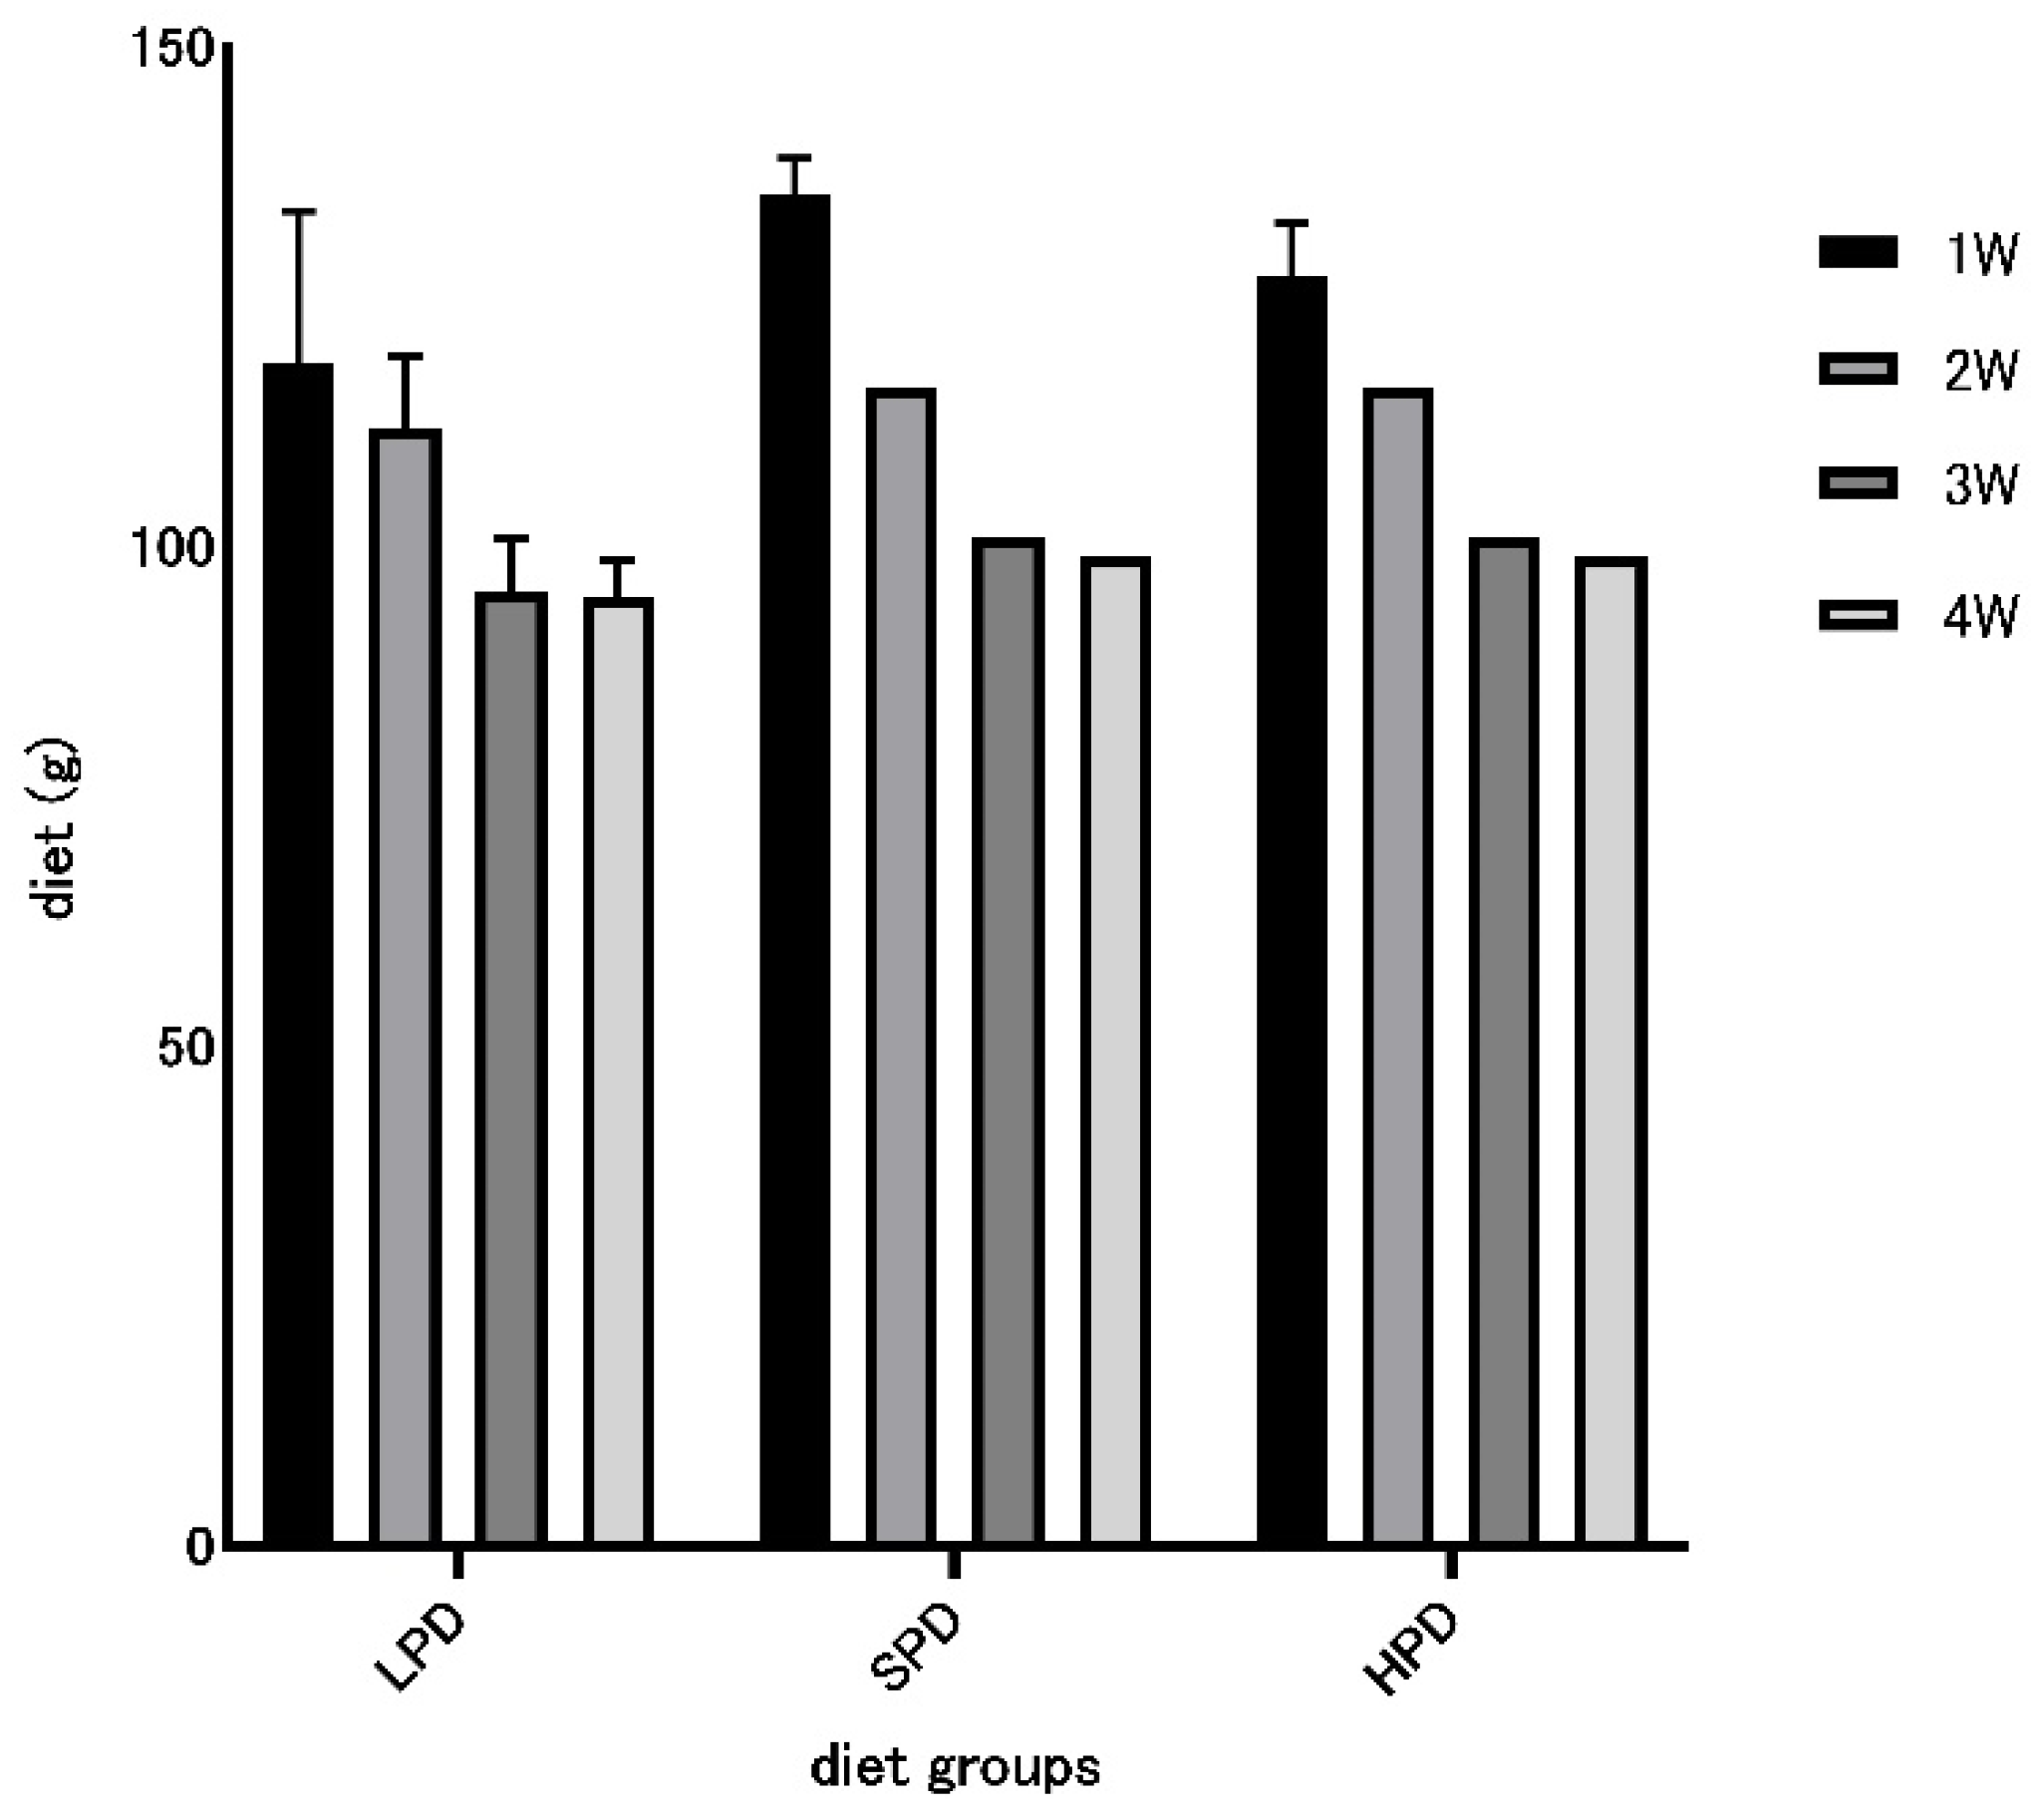
3.1. Effects of High Protein Intake on Body Weight

As a whole, body weight tended to increase with advancing age, and difference in body weight between the LPD, SPD, and HPD groups was remarkable. A significant difference in body weight was not observed between the SPD and HPD groups (Figure 1, Table 3). The diet consumption decreased with each week in both protein-fed groups. A lower diet intake was observed in the LPD group compared to the other groups for all 4 weeks (Figure 2).

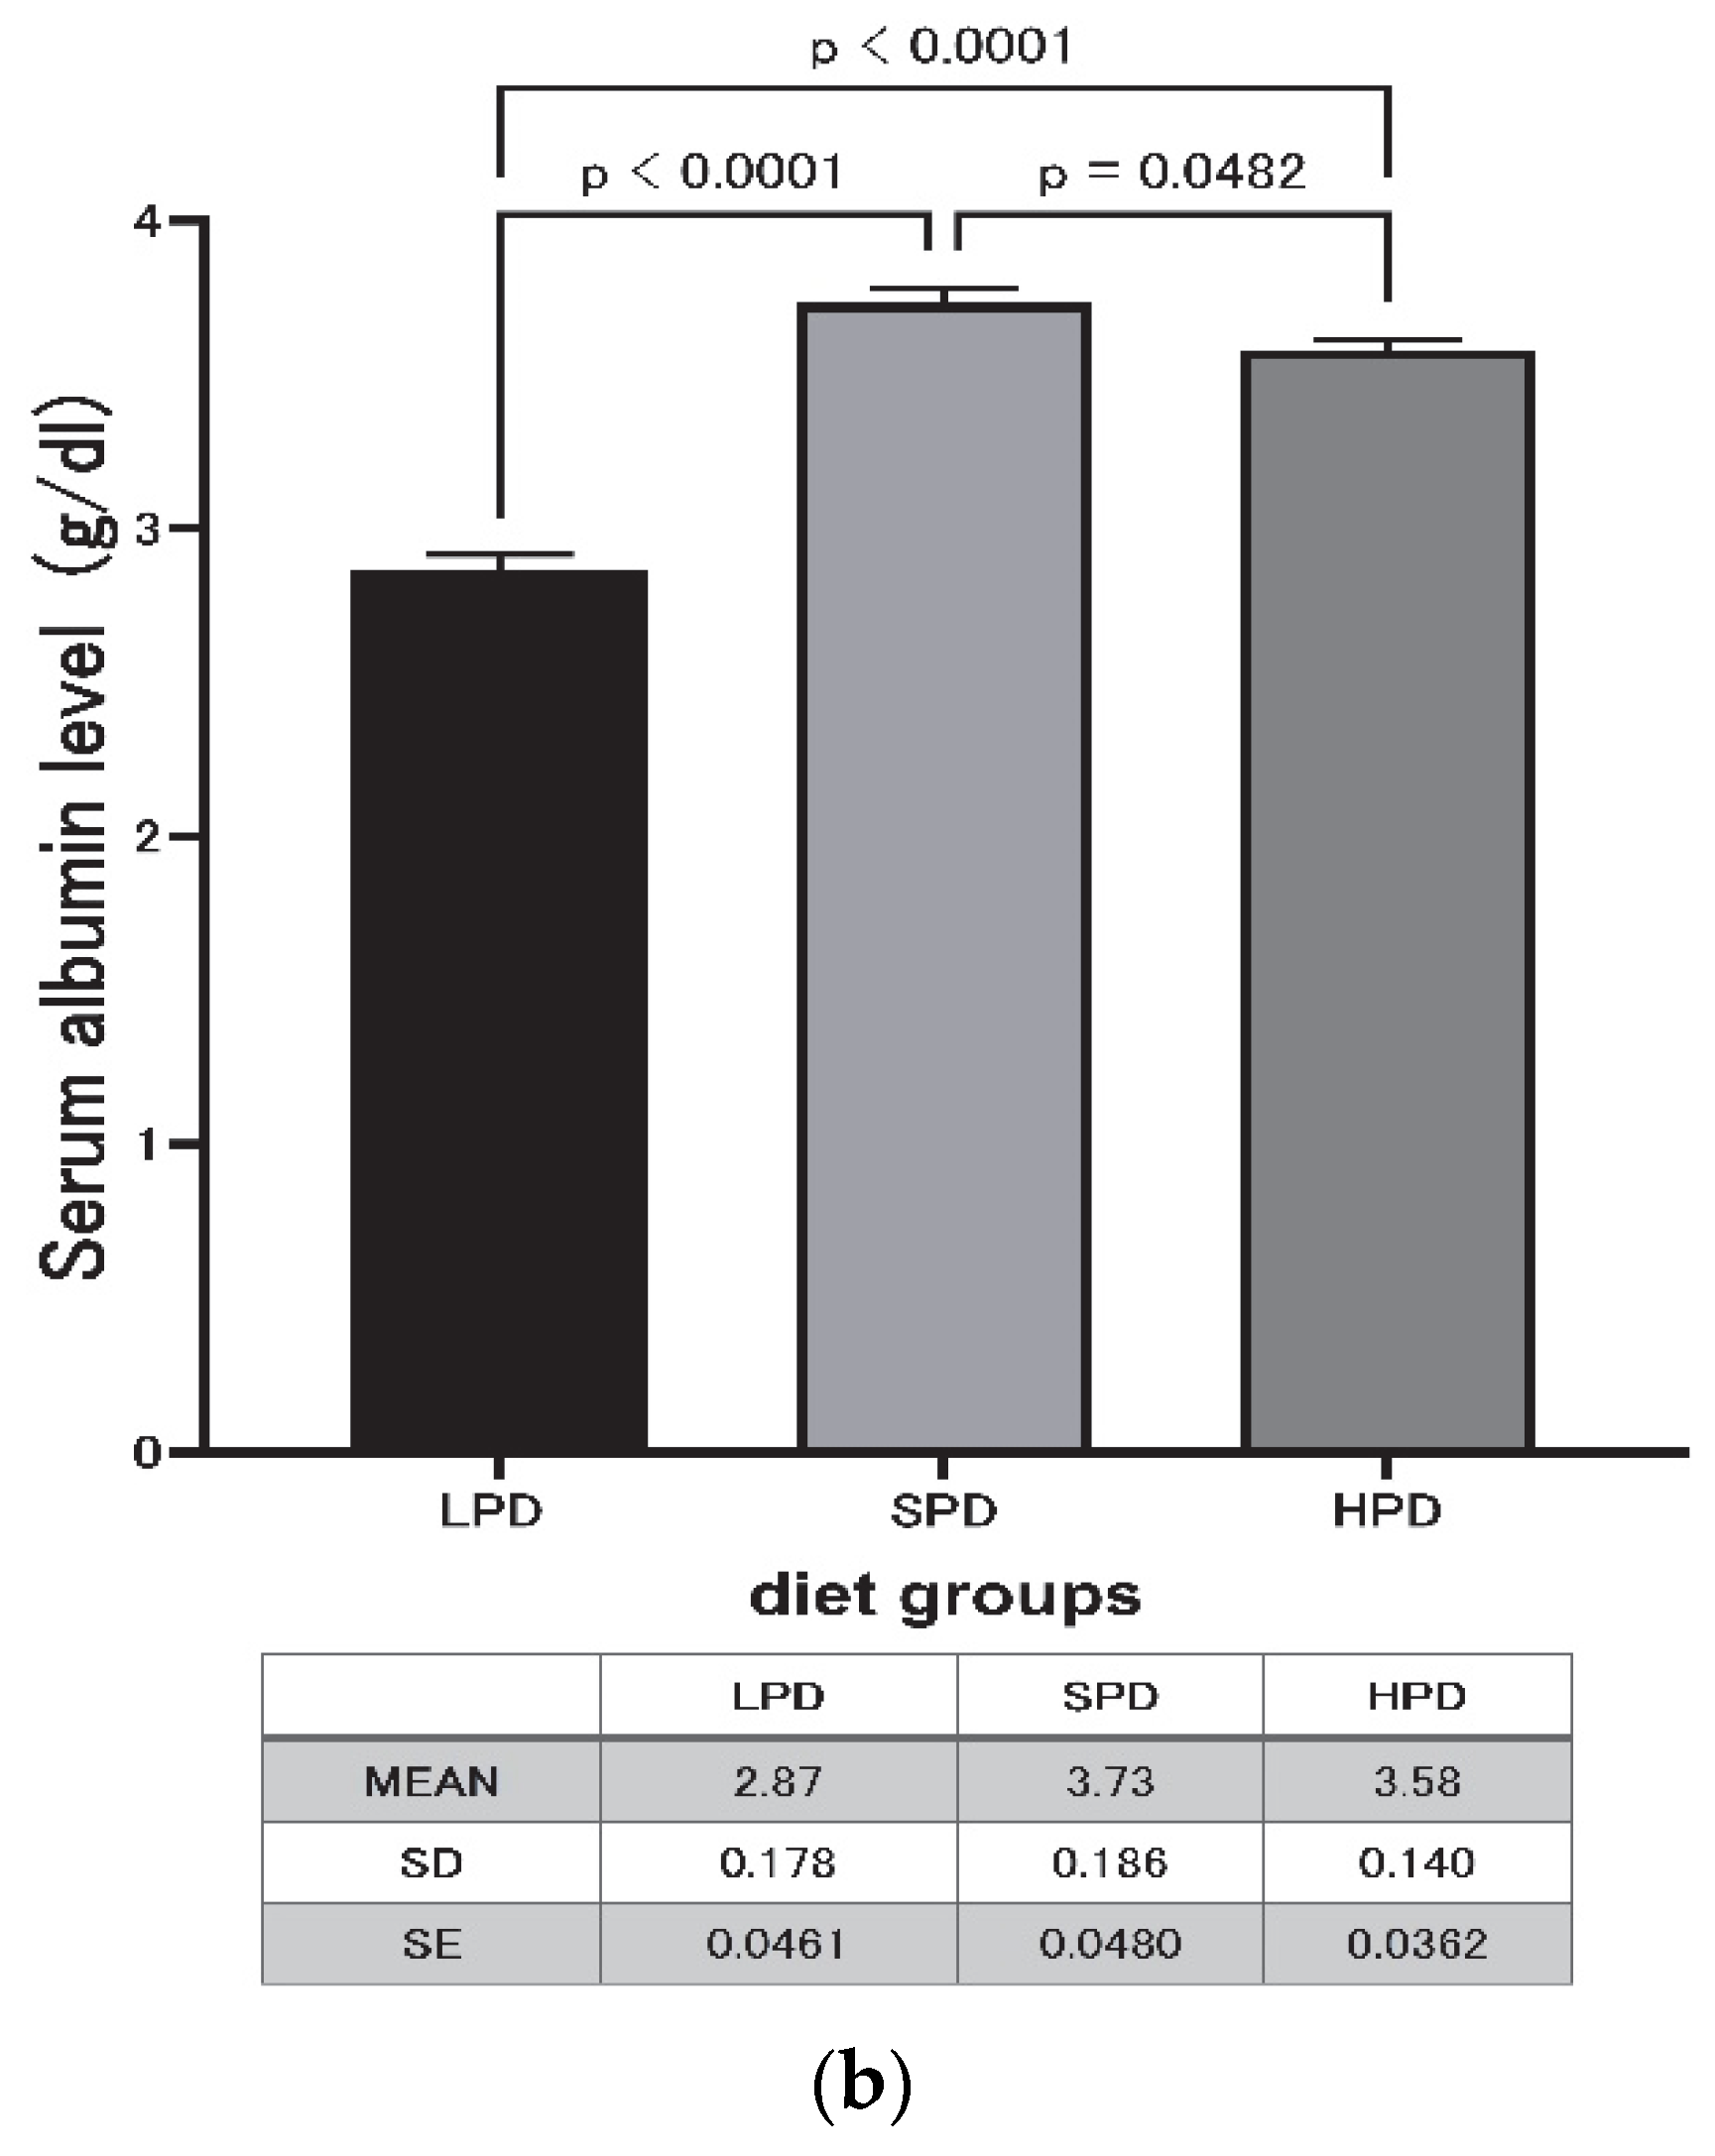
3.2. Effect of High Protein Intake on Serum Protein Levels

The distribution of serum total protein in each group is shown in Table 4. No significant difference was observed between the groups. As shown in Figure 3a, b, the serum albumin levels were significantly different between the LPD and SPD groups and between the LPD and HPD groups (p < 0001), and between the SPD and HPD groups (p < 0.0435).

3.3. Sirtuin 1

A significant difference between the LPD and SPD groups (p = 0.03853) was observed, with an additional significant difference between the LPD and HPD groups (p = 0.004914) (Figure 4).

3.4. SOD

In terms of CuZn-SOD, a significant difference (p = 0.02062) between the LPD and SPD groups was observed (Figure 5a). In terms of EC-SOD, a significant difference (p = 0.01906) between the LPD and SPD groups was also observed (Figure 5b). A similar significant difference was observed between the LPD and SPD groups for eNOS (p = 0.01359) (Figure 5c).

3.5. P53 and NRF-1

No significant difference was observed for p53 and NRF-1 at any concentration.

4. Discussion

As far as we know, this study is one of the few to show the relationship between protein intake and Sirtuin 1 expression. The result of the present study in rats revealed a significant difference (p = 0.03853) between the LPD and the SPD groups in terms of Sirtuin 1, and a significant difference (p = 0.004914) was also observed between the LPD and HPD groups. The results showed that there was a significant increase in the Sirtuin 1 expression level according to the protein intake (Figure 4). Based on these results, it is considered that sustained high protein intake decreases oxidative stress and increases Sirtuin 1 activity. Petzke et al. also reported that oxidative stress was reduced by continuous high protein intake [6]. The results of this study also indicate the possibility that an appropriate level of protein contributes to the prevention of aging. A large amount of Sirtuin 1 research has involved calorie restriction [7,8]. Under calorie restriction, the aging rate was found to be reduced by decreasing the metabolism rate, and as a result, the Sirtuin 1 activity increased. Additionally, Sirtuin 1 is known to have a hepatoprotective effect in high-fat diets [9].
A significant difference (p = 0.02062) was observed in the SPD group compared with the LPD group in terms of CuZn-SOD. CuZn-SOD significantly lowered the expression level in the LPD group (Figure 5a). This means that the expression level of CuZn-SOD is reduced under low protein concentrations. Moreover, a significant difference (p = 0.01906) was observed between the LPD and the SPD groups for EC-SOD as well as for CuZn-SOD (Figure 5b). This means that, similarly, the expression level of EC-SOD is reduced under low protein intake conditions. A significant difference (p = 0.01359) between the LPD and the SPD groups was also observed for eNOS (Figure 5c). This indicates that the SOD activity reduces when the protein intake is insufficient, thus supporting the findings reported by Huang et al. [10,11].
In the LPD group, the expression of CuZn-SOD, EC-SOD, and eNOS appeared to be reduced, and in the low protein intake group, the expression of these SOD groups was suppressed. The antioxidant reaction in the SOD group did not function sufficiently, causing an increase in ROS; an increase in oxidative stress leads to failures within the organism. Accordingly, it is suggested that the intake of an appropriate amount of protein in human beings promotes the production of SOD groups, reduces oxidative stress, and leads to the prevention of diseases caused by various oxidative stresses [2].
Diet intake and body weight gain were also characterized in this study. At weekly intervals, the rate of body weight gains slowed and showed a nearly equal weight gain trend in the SPD and the HPD groups, but tended to be especially low in the LPD group compared with the other two groups (Figure 1, Table 3). In addition, the diet intake reduced along with weight gain in all groups (Figure 2). As a result, hunger decreased, and diet intake decreased with weight gain. The lower body weight gain in the LPD group may be due to preference; one report noted that high protein intake in rats leads to a reduction in food intake for getting tired of the intake high protein. [12].
In this study, no significant differences in serum total protein levels were observed between each concentration group (Table 4). However, a significant difference in serum albumin levels was observed, being higher in the SPD group (Figure 3a,b). This result is also consistent with previous study suggesting that serum total protein is not affected by protein intake [13]. According to an epidemiological study in Japan, there was no significant difference in serum albumin between males and females, a significant inverse correlation with age was observed, and it was reported that the intake of animal protein showed a weak positive correlation with serum albumin [14].
A variety of views exist on how the difference in protein intake under equal energy intake influences the life span and the occurrence of disease. A previous study examined the relationship between protein intake and survival [15]. In this study, we conducted molecular biological research using rats to verify the relationship between protein intake and aging, the onset of diseases such as lifestyle-related diseases, and carcinogenesis.
The previous study in rats conducted by McCay in 1935 revealed a relationship between calorie restriction and survival [1]. Dietary calorie restriction increases survival in various organisms and has been shown to protect humans and other mammals against age-related conditions, including atherosclerosis, cancer, and renal disease [16,17]. Further, aging and lifestyle-related disease are strongly related to arteriosclerosis. An appropriate protein intake level seems to contribute to the prevention of aging, lifestyle-related diseases, and carcinogenesis.
A total of seven sirtuins (Sirtuin 1-7) are known in mammals [18]. Sirtuin 1, which gave significant results in this study, is known as an aging-related enzyme. A recent study showed that aging and aging-related diseases are associated with decreased levels of nicotinamide adenine dinucleotide (NAD+) and the decreased activity of Sirtuin 1 [19,20]. Although NAD+ is a coenzyme present in all species, Sirtuin 1 is known to be affected as the NAD+-dependent deacetylase Sirtuin, and NAD+ is used as a substrate for Sirtuin 1 enzyme reactions [19,20].
SOD is an antioxidant enzyme expressed in whole-body tissues and is thought to protect the body from oxidative stress through the efficient disproportionation of superoxide to H2O2 and O2, SOD is very important for reduction of oxidant stress, and primary products of many ROS production reactions [21]. As other enzymes that erase ROS, the existence of catalase and glutathione peroxidase (GPx) is also known, and both functions involve the reduction of free hydrogen peroxide to water, also important. It was not mentioned about GPx in this article, but GPx is known plays a key role in the maintenance of redox homeostasis within the SOD group.
Typically, there are three forms of SOD in mammals [22]. As SOD isozymes, CuZn-SOD (SOD1), Mn-SOD (SOD2), and EC-SOD (SOD3) are reported to exist. CuZn-SOD is known to be primarily localized in cytoplasmic mitochondria, whereas EC-SOD is known to be the only extracellularly secreted protein among the SOD isozymes [23,24].
EC-SOD is known to inhibit the acceleration of the arteriosclerosis reaction. EC-SOD’s reactions to the progress of arteriosclerosis include the inhibition of the differentiation of monocytes into macrophages, the suppression of the disappearance of macrophages by the adsorption of modified LDL such as oxidized low-density lipoprotein (oxLDL), and the suppression of the abnormal proliferation of vascular smooth-muscle cells [25]. Although large amounts of ROS are produced during the course of these conditions, it has been reported that EC-SOD suppresses the production of ROS [26].
NRF-1 (nuclear respiratory factor-1) is known as a nuclear gene involved in ATP production in mitochondria. ATP is produced from acetyl-CoA produced by the phosphorylation of glucose in the cytoplasm during the TCA cycle and oxidative phosphorylation in mitochondria. Oxidative phosphorylation occurs at four protein complexes in the electron transport chain, and NFR-1 is known as an activator of one of these protein complexes, cytochrome C. In this study, there was no significant difference in the expression level of NRF-1 between the different protein concentrations administered. This may mean that protein intake does not affect the mitochondrial TCA cycle or other nuclear respiratory processes [27,28].
To our knowledge, this is one of the few studies to show a relationship between protein intake and gene expression, and we attempted to analyze the expression levels of six anti-aging, antioxidant, and cancer-suppressing enzyme genes. The qRT-PCR method was used, which is a technique for amplifying and detecting a specific cDNA by combining the functions of reverse transcription and quantitative PCR or real-time PCR. The PCR amplification reaction is monitored in real time, and the amount of cDNA in the sample is measured quantitatively. Compared with the real-time PCR method, which measures the amount of PCR products according to the presence or absence (shading) of bands at a predetermined number of cycles, this method is reported to have higher sensitivity, a higher quantitative and dynamic range, and high reproducibility [29]. So this is considered to be an appropriate PCR method for this study.
In addition, there are several methods for comparing gene expression levels using qPCR. These include the absolute quantification method, which creates a standard curve using a standard sample containing a known copy number, the relative quantification method, which creates a standard curve using a standard sample, and the comparative Ct method (ΔΔCt method). In this study, the analysis was performed using the comparative Ct method (ΔΔCt method). The ΔΔCt method is used in many gene expression studies because it allows for easy comparison of relative gene expression levels without creating a standard curve [30], [31].
Recently, maintaining ADL in the elderly has become important from the perspective of preventing frailty and sarcopenia [32], and diagnostic methods have been established [33]. Among these studies, adequate protein intake has been shown to maintain skeletal muscle mass and prevent frailty [34,35]. A study of elderly Japanese women indicated that a low protein intake was one of the causes of frailty [36]. Lower serum albumin levels have also been reported to increase the risk of death in older adults [37,38].
Although high protein intake increases SOD activity in the rat brain, it has been reported that reduced glutathione (GSH) levels result in increased oxidative stress [39,40]. As a result, protein metabolism in the brain cannot be discussed in the same manner as in other organs. Although a low-protein diet is recommended in patients with renal impairment, some reports state that malnutrition occurs and survival is shortened, while others state that normal protein intake does not affect renal function [41]. A cautious discussion is needed about the relationship between protein intake and renal function [42].
A recent study also reported a relationship between the anti-aging-related enzyme Sirtuin 1 and the tumor suppressor protein p53 [43]. In the results of the current study, no p53 activity was observed in either group. An increase in Sirtuin 1 activity might account for the suppression of p53 activity. There are also reports that Sirtuin 1 activity has an impact on cancer treatment [44]. Although the kidneys are organs that are likely to be affected by aging, a study using a mouse model of diabetic nephropathy reported that the Sirtuin 1 expression level in glomeruli was decreased, and that Sirtuin 1 suppressed the progression of CKD [45]. As such, it is known that Sirtuin 1 is involved in the prevention of aging- and lifestyle-related diseases and cancer; thus, future research in this field is greatly anticipated.

5. Conclusions

A significant difference in Sirtuin 1 expression was observed between the LPD and SPD groups, and between the LPD and HPD groups. Moreover, a significant difference in CuZn-SOD, EC-SOD, and eNOS expression was observed between the LPD and SPD groups. This means that an appropriate amount of protein intake in humans contributes to the prevention of aging, aging-related diseases, and lifestyle-related and arteriosclerotic diseases caused by oxidative stress, and may help to extend the life span.

Funding

This research received no external funding

Conflicts of Interest

The authors declare no conflicts of interest.

References

  1. McCay, C.M.; Crowell, M.F.; Maynard, L.A. The effect of retarded growth upon the length of life span and upon the ultimate body size. 1935. Nutrition 1989, 5, 155–171, discussion 172. [Google Scholar] [PubMed]
  2. Zelko, I.N.; Mariani, T.J.; Folz, R.J. Superoxide dismutase multigene family: A comparison of the CuZn-SOD (SOD1), Mn-SOD (SOD2), and EC-SOD (SOD3) gene structures, evolution, and expression. Free Radic. Biol. Med. 2002, 33, 337–349. [Google Scholar] [CrossRef]
  3. Herranz, D.; Serrano, M. SIRTUIN 1: Recent lessons from mouse models. Nat. Rev. Cancer 2010, 10, 819–823. [Google Scholar] [CrossRef] [PubMed]
  4. Tikoo, K.; Tripathi, D.N.; Kabra, D.G.; Sharma, V.; Gaikwad, A.B. Intermittent fasting prevents the progression of type I diabetic nephropathy in rats and changes the expression of Sir2 and p53. FEBS Lett. 2007, 581, 1071–1078. [Google Scholar] [CrossRef]
  5. Astrup, A.; Raben, A.; Geiker, N. The role of higher protein diets in weight control and obesity-related comorbidities. Int. J. Obes. 2015, 39, 721–726. [Google Scholar] [CrossRef]
  6. Petzke, K.J.; Elsner, A.; Proll, J.; Thielecke, F.; Metges, C.C. Long-term high protein intake does not increase oxidative stress in rats. J. Nutr. 2000, 130, 2889–2896. [Google Scholar] [CrossRef]
  7. Boily, G.; Seifert, E.L.; Bevilacqua, L.; He, X.H.; Sabourin, G.; Estey, C.; Moffat, C.; Crawford, S.; Saliba, S.; Jardine, K.; et al. Sirtuin 1 regulates energy metabolism and response to caloric restriction in mice. PLoS ONE 2008, 3, e1759. [Google Scholar] [CrossRef]
  8. Mercken, E.M.; Hu, J.; Krzysik-Walker, S.; Wei, M.; Li, Y.; McBurney, M.W.; de Cabo, R.; Longo, V.D. SIRTUIN 1 but not its increased expression is essential for lifespan extension in caloric-restricted mice. Aging Cell 2014, 13, 193–196. [Google Scholar] [CrossRef] [PubMed]
  9. Pfluger, P.T.; Herranz, D.; Velasco-Miguel, S.; Serrano, M.; Tschop, M.H. Sirtuin 1 protects against high-fat diet-induced metabolic damage. Proc. Natl. Acad. Sci. USA 2008, 105, 9793–9798. [Google Scholar] [CrossRef]
  10. Huang, C.J.; Fwu, M.L. Protein insufficiency aggravates the enhanced lipid peroxidation and reduced activities of antioxidative enzymes in rats fed diets high in polyunsaturated fat. J. Nutr. 1992, 122, 1182–1189. [Google Scholar] [CrossRef]
  11. Huang, C.J.; Fwu, M.L. Degree of protein deficiency affects the extent of the depression of the antioxidative enzyme activities and the enhancement of tissue lipid peroxidation in rats. J. Nutr. 1993, 123, 803–810. [Google Scholar] [CrossRef]
  12. French, W.W.; Dridi, S.; Shouse, S.A.; Wu, H.; Hawley, A.; Lee, S.O.; Gu, X.; Baum, J.I. A High-Protein Diet Reduces Weight Gain, Decreases Food Intake, Decreases Liver Fat Deposition, and Improves Markers of Muscle Metabolism in Obese Zucker Rats. Nutrients 2017, 9, 587. [Google Scholar] [CrossRef]
  13. MacLennan, W.J.; Martin, P.; Mason, B.J. Protein intake and serum albumin levels in the elderly. Gerontology 1977, 23, 360–367. [Google Scholar] [CrossRef] [PubMed]
  14. Watanabe, M.; Higashiyama, A.; Kokubo, Y.; Ono, Y.; Okayama, A.; Okamura, T. Protein intakes and serum albumin levels in a Japanese general population: NIPPON DATA90. J. Epidemiol. 2010, 20 (Suppl. 3), S531–S536. [Google Scholar] [CrossRef] [PubMed]
  15. Slonaker, J.R. The Effect of Different Per Cents of Protein in the Diet. Am. J. Physiol.-Leg. Content 1931, 98, 266–275. [Google Scholar] [CrossRef]
  16. Colman, R.J.; Anderson, R.M.; Johnson, S.C.; Kastman, E.K.; Kosmatka, K.J.; Beasley, T.M.; Allison, D.B.; Cruzen, C.; Simmons, H.A.; Kemnitz, J.W.; et al. Caloric restriction delays disease onset and mortality in rhesus monkeys. Science 2009, 325, 201–204. [Google Scholar] [CrossRef] [PubMed]
  17. Meyer, T.E.; Kovács, S.J.; Ehsani, A.A.; Klein, S.; Holloszy, J.O.; Fontana, L. Long-term caloric restriction ameliorates the decline in diastolic function in humans. J. Am. Coll. Cardiol. 2006, 47, 398–402. [Google Scholar] [CrossRef] [PubMed]
  18. Nakagawa, T.; Guarente, L. SnapShot: Sirtuins, NAD, and aging. Cell Metab. 2014, 20(1), 192–192. e1. [Google Scholar] [CrossRef] [PubMed]
  19. Imai, S.-I.; Guarente, L. NAD+ and sirtuins in aging and disease. Trends Cell Biol. 2014, 24, 464–471. [Google Scholar] [CrossRef]
  20. Imai, S.; Yoshino, J. The importance of NAMPT/NAD/SIRTUIN 1 in the systemic regulation of metabolism and ageing. Diabetes Obes. Metab. 2013, 15 (Suppl. 3), 26–33. [Google Scholar] [CrossRef]
  21. Roberts, C.K.; Barnard, R.J.; Sindhu, R.K.; Jurczak, M.; Ehdaie, A.; Vaziri, N.D. Oxidative stress and dysregulation of NAD (P) H oxidase and antioxidant enzymes in diet-induced metabolic syndrome. Metabolism 2006, 55, 928–934. [Google Scholar] [CrossRef]
  22. Joe, M.; McCord, I.F. Superoxide Dismutase: The first twenty years (1968–1988). J. Free Radic. Biol. Med. 1988, 5, 363–369. [Google Scholar]
  23. Marklund, S.L. Human copper-containing superoxide dismutase of high molecular weight. Proc. Natl. Acad. Sci. USA 1982, 79, 7634–7638. [Google Scholar] [CrossRef]
  24. Faraci, F.M.; Didion, S.P. Vascular protection: Superoxide dismutase isoforms in the vessel wall. Arterioscler. Thromb. Vasc. Biol. 2004, 24, 1367–1373. [Google Scholar] [CrossRef] [PubMed]
  25. Mukai, E.; Kume, N.; Hayashida, K.; Minami, M.; Yamada, Y.; Seino, Y.; Kita, T. Heparin-binding EGF-like growth factor induces expression of lectin-like oxidized LDL receptor-1 in vascular smooth muscle cells. Atherosclerosis 2004, 176, 289–296. [Google Scholar] [CrossRef] [PubMed]
  26. Mügge, A.; Brandes, R.; Böger, R.; Dwenger, A.; Bode-Böger, S.; Kienke, S.; Frölich, J.; Lichtlen, P. Vascular release of superoxide radicals is enhanced in hypercholesterolemic rabbits. J. Cardiovasc. Pharmacol. 1994, 24, 994–998. [Google Scholar] [CrossRef]
  27. Evans, M.J.; Scarpulla, R.C. NRF-1: A trans-activator of nuclear-encoded respiratory genes in animal cells. Genes Dev 1990, 4, 1023–1034. [Google Scholar] [CrossRef] [PubMed]
  28. Virbasius, C.A.; Virbasius, J.V.; Scarpulla, R.C. NRF-1, an activator involved in nuclear-mitochondrial interactions, utilizes a new DNA-binding domain conserved in a family of developmental regulators. Genes Dev. 1993, 7, 2431–2445. [Google Scholar] [CrossRef]
  29. Freeman, W.M.; Walker, S.J.; Vrana, K.E. Quantitative RT-PCR: Pitfalls and Potential. BioTechniques 1999, 26, 112–125. [Google Scholar] [CrossRef]
  30. Livak, K.J.; Schmittgen, T.D. Analysis of relative gene expression data using real-time quantitative PCR and the 2(-Delta Delta C(T)) Method. Methods 2001, 25, 402–408. [Google Scholar] [CrossRef] [PubMed]
  31. Rao, X.; Huang, X.; Zhou, Z.; Lin, X. An improvement of the 2ˆ(−delta delta CT) method for quantitative real-time polymerase chain reaction data analysis. Biostat. Bioinform. Biomath. 2013, 3, 71–85. [Google Scholar]
  32. Rosenberg, I.H. Summary comments: Epidemiological and methodological problems in determining nutritional status of older persons. Am. J. Clin. Nutr. 1989, 50, 1231–1233. [Google Scholar] [CrossRef]
  33. Santilli, V.; Bernetti, A.; Mangone, M.; Paoloni, M. Clinical definition of sarcopenia. Clin. Cases Miner. Bone Metab. 2014, 11(3), 177–80. [Google Scholar] [CrossRef] [PubMed]
  34. Houston, D.K.; Nicklas, B.J.; Ding, J.; Harris, T.B.; Tylavsky, F.A.; Newman, A.B.; Lee, J.S.; Sahyoun, N.R.; Visser, M.; Kritchevsky, S.B. Dietary protein intake is associated with lean mass change in older, community-dwelling adults: The Health, Aging, and Body Composition (Health ABC) Study. Am. J. Clin. Nutr. 2008, 87, 150–155. [Google Scholar] [CrossRef] [PubMed]
  35. Bauer, J.; Biolo, G.; Cederholm, T.; Cesari, M.; Cruz-Jentoft, A.J.; Morley, J.E.; Phillips, S.; Sieber, C.; Stehle, P.; Teta, D. Evidence-based recommendations for optimal dietary protein intake in older people: A position paper from the PROT-AGE Study Group. J. Am. Med. Dir. Assoc. 2013, 14, 542–559. [Google Scholar] [CrossRef]
  36. Kobayashi, S.; Asakura, K.; Suga, H.; Sasaki, S. High protein intake is associated with low prevalence of frailty among old Japanese women: A multicenter cross-sectional study. Nutr. J. 2013, 12, 164. [Google Scholar] [CrossRef] [PubMed]
  37. Okamura, T.; Hayakawa, T.; Hozawa, A.; Kadowaki, T.; Murakami, Y.; Kita, Y.; Abbott, R.D.; Okayama, A.; Ueshima, H.; Group, N.D.R. Lower levels of serum albumin and total cholesterol associated with decline in activities of daily living and excess mortality in a 12-year cohort study of elderly Japanese. J. Am. Geriatr. Soc. 2008, 56, 529–535. [Google Scholar] [CrossRef] [PubMed]
  38. Liu, Z.; Zhong, G.; Li, S.; Deng, W.; Zhang, Y.; Qian, D.; Jin, L.; Wang, X. Use of serum albumin and activities of daily living to predict mortality in long-lived individuals over 95 years of age: A population-based study. Age 2015, 37, 9809. [Google Scholar] [CrossRef] [PubMed]
  39. Camiletti-Moiron, D.; Aparicio, V.A.; Nebot, E.; Medina, G.; Martinez, R.; Kapravelou, G.; Andrade, A.; Porres, J.M.; Lopez-Jurado, M.; Aranda, P. High-protein diet induces oxidative stress in rat brain: Protective action of high-intensity exercise against lipid peroxidation. Nutr. Hosp. 2014, 31, 866–874. [Google Scholar] [CrossRef] [PubMed]
  40. Żebrowska, E.; Maciejczyk, M.; Żendzian-Piotrowska, M.; Zalewska, A.; Chabowski, A. High Protein Diet Induces Oxidative Stress in Rat Cerebral Cortex and Hypothalamus. Int. J. Mol. Sci. 2019, 20, 1547. [Google Scholar] [CrossRef]
  41. Møller, G.; Rikardt Andersen, J.; Ritz, C.; Silvestre, M.P.; Navas-Carretero, S.; Jalo, E.; Christensen, P.; Simpson, E.; Taylor, M.; Martinez, J.A.; et al. Higher Protein Intake Is Not Associated with Decreased Kidney Function in Pre-Diabetic Older Adults Following a One-Year Intervention-A Preview Sub-Study. Nutrients 2018, 10(1), 54. [Google Scholar] [CrossRef] [PubMed]
  42. Ko, G.J.; Rhee, C.M.; Kalantar-Zadeh, K.; Joshi, S. The Effects of High-Protein Diets on Kidney Health and Longevity. J. Am. Soc. Nephrol. 2020, 31, 1667–1679. [Google Scholar] [CrossRef] [PubMed]
  43. Nemoto, S.; Fergusson, M.M.; Finkel, T. Nutrient availability regulates SIRTUIN 1 through a forkhead-dependent pathway. Science 2004, 306, 2105–2108. [Google Scholar] [CrossRef]
  44. Cao, B.; Shi, Q.; Wang, W. Higher expression of SIRTUIN 1 induced resistance of esophageal squamous cell carcinoma cells to cisplatin. J. Thorac. Dis. 2015, 7, 711–719. [Google Scholar] [CrossRef] [PubMed]
  45. Wakino, S.; Hasegawa, K.; Itoh, H. Sirtuin and metabolic kidney disease. Kidney Int. 2015, 88, 691–698. [Google Scholar] [CrossRef] [PubMed]
Figure 1. Change in rats’ body weight over experimental period. No significant weight difference was observed between HPD and SPD groups, while LPD group exhibited less weight gain than HPD and SPD groups.
Preprints 145240 g001
Figure 2. Changes in diet intake for experimental period. In each protein concentration group, the diet intake decreased over the weeks of the experiment. Each groups are same pattern, no significant difference was observed in the total intake amount between the HPD and SPD groups, but the total intake for the LPD group was lower than for the HPD group and SPD group. Bars represent the standard deviation (SD) of the mean.
Preprints 145240 g002
Figure 3. (a) Correlation between absorbance and serum albumin concentration. (b) Comparison of serum albumin concentration. Data was analyzed using Brown-Forsythe test, Welch’s ANOVA, and Dunnett’s T3 multiple comparison test. Values without a common letter differ, p < 0.05. HPD vs. LPD: p < 0.0001, SPD vs. LPD: p < 0.0001, HPD vs. SPD: p = 0.0482. Bars represent the standard error (SE) of the mean.
Preprints 145240 g003aPreprints 145240 g003b
Figure 4. Comparison of mRNA Sirtuin 1 expression in the three rat groups. qRT-PCR of Sirtuin 1 expressed as a comparison of GAPDH. Data was analyzed using Brown–Forsythe test, Welch’s ANOVA, and Dunnet’s T3 multiple comparison test. Values without a common letter differ, p < 0.05. LPD vs. SPD * p = 0.03853, LPD vs. HPD ** p = 0.004914, SPD vs. HPD n.s. (p = 0.1502). Bars represent the standard error (SE) of the mean.
Preprints 145240 g004
Figure 5. (a) Comparison of mRNA CuZn-SOD expression in the three rat groups. qRT-PCR of CuZn-SOD expressed as a ratio of GAPDH. Data was analyzed using Brown–Forsythe test, Welch’s ANOVA, and Dunnett’s T3 multiple comparison test. Values without a common letter differ, p < 0.05. LPD vs. SPD * p = 0.02062, LPD vs. HPD n.s. (p = 0.2113), SPD vs. HPD n.s. (p = 0.9991). Bars represent the standard error (SE) of the mean. (b) Comparison of mRNA EC-SOD expression in the three rat groups. qRT-PCR results of EC-SOD expressed as a ratio of GAPDH. Data was analyzed using Brown–Forsythe test, Welch’s ANOVA, and Dunnett’s T3 multiple comparison test. Values without a common letter differ, p < 0.05. LPD vs. SPD * p = 0.01906, LPD vs. HPD n.s. (p = 0.1432), SPD vs. HPD n.s. (p = 0.9480). Bars represent the standard error (SE) of the mean. (c) Comparison of mRNA eNOS expression in the three rat groups. qRT-PCR results of EC-SOD expressed as a ratio of GAPDH. Data was analyzed using Brown–Forsythe test, Welch’s ANOVA, and Dunnett’s T3 multiple comparison test. Values without a common letter differ, p < 0.05. LPD vs. SPD * p = 0.01359, LPD vs. HPD n.s. (p = 0.06006), SPD vs. HPD n.s. (p = 0.8579). Bars represent the standard error (SE) of the mean.
Preprints 145240 g005
Table 1. Composition of diets.
material LPD SPD HPD
protein (casein) 5 20 40
hydrocarbon 76.2 62.9 41.4
lipid (soybean oil) 7 7 7
Cellulose 5 5 5
Minerals 3.5 3.5 3.5
Others 3.3 1.6 3.1
total (%) 100 100 100
Table 2. Oligonucleotide sequences of primers used for qRT-PCR analysis.
Gene name Accession number Sequence (5'-3') position and length (bp) total bp
Sirtuin-1 NM_001372090 F 5'- GGAAC CTCTG CCTCA TCTAC AT 3' 734-755 (20) 97
R 5'- GCATACTCGCCACCTAACC 3' 811-830 (20)
CuZnSOD NM_017050 F 5'- GGTCCAGCGGATGAAGAG 3' 313-330 (18) 77
R 5'- GGACA CATTG GCCAC ACC 3' 373-390 (18)
ECSOD NM_012880 F 5'- CTTGG GAGAG CTTGT CAGGT 3' 99-118 (20) 70
R 5'- CACCA GTAGC AGGTT GCAGA 3' 149-168 (20)
eNOS NM_021838 F 5'- TGACC CTCAC CGATAC AACA 3' 1136-1155 (20) 452
R 5'- CGGGT GTCTA GATCC ATGC 3' 1148-1167 (20)
p53 HM_030989 F 5'- AGAGAGCACTGCCCACCA 3' 1038-1055 (18) 110
R 5'- AACATCTCGAAGCGCTCA 3' 1130-1147 (18)
NRF-1 NM_001100708 F 5'- TTATT CTGCT GTGGC TGATG G 3' 1286-1306 91
R 5'- CCTCT GATGC TTGCG TCGTCT 3' 1357-1376
GAPDH NM_017008 F 5'- ACCAC AGTCC ATGCC ATCAC 3' 595-614 (20) 61
R 5'- TCCAC CACCC TGTTG CTGTA 3' 1027-1046 (20)
Table 3. Body weight (g) of rats over experimental period1.
LP STD HP
start 177.1±2.47 177.9±1.56 174.5±2.46
7 days 175.6±2.18 228.6±2.12 226.1±2.82
14 days 190.6±2.21 262.3±2.03 262.0±2.15
21 days 204.8±2.54 283.7±2.38 280.1±2.17
28 days 212.0±2.59 297.3±2.83 293.1±2.16
1 Values are means ± SEM.
Table 4. Comparison of serum total protein concentration (g/dL). Data were analyzed using Brown–Forsythe test, Welch’s ANOVA, and Dunnett’s T3 multiple comparison test, revealing no significant differences.
LPD SPD HPD
Mean(g/dL) 4.86 5.26 5.00
SD 0.856 0.331 0.334
SE 0.2210 0.0855 0.0863
Disclaimer/Publisher’s Note: The statements, opinions and data contained in all publications are solely those of the individual author(s) and contributor(s) and not of MDPI and/or the editor(s). MDPI and/or the editor(s) disclaim responsibility for any injury to people or property resulting from any ideas, methods, instructions or products referred to in the content.
Copyright: This open access article is published under a Creative Commons CC BY 4.0 license, which permit the free download, distribution, and reuse, provided that the author and preprint are cited in any reuse.
Prerpints.org logo

Preprints.org is a free preprint server supported by MDPI in Basel, Switzerland.

Subscribe

Disclaimer

Terms of Use

Privacy Policy

Privacy Settings

© 2025 MDPI (Basel, Switzerland) unless otherwise stated