
Submitted:
06 January 2025
Posted:
07 January 2025
You are already at the latest version
Abstract
The coastal zone of The Gambia, which contributes 36% to the country’s GDP, has experienced considerable transformation due to increased socioeconomic development and urbanization. This growth has significantly altered the coastal landscape, intensifying pressure on the environment and increasing vulnerability to climate hazards. A study assessing land cover changes and population growth used cloud-free Landsat imagery from 1990, 2000, 2010, and 2020. The analysis classified land cover into five categories: barren land, built-up areas, vegetation cover, water bodies, and wetlands. The findings highlighted dramatic changes in land cover over the past three decades. Barren land increased by 46%, and built-up areas surged by 680%. In contrast, vegetation cover decreased by 35%, water bodies by 31%, and wetlands by 14%. These transformations correlate with rising population densities along the coastline, particularly within 10-25 km of the shore. The substantial growth in built-up areas and reduction in vegetation are directly linked to urbanization and population pressure. This rapid change exacerbates the vulnerability of coastal communities to climate-related hazards such as flooding and tropical windstorms. To address these challenges, it is crucial for the government and stakeholders to implement policies that manage coastal congestion and encourage development in inland regions. Such measures should consider the impacts of population growth on coastal environments and aim to ensure the long-term sustainability of The Gambia’s coastal ecosystems by mitigating risks associated with climate change.
Keywords:
coastal zone
; vulnerability
; population
; land use land cover
; transformation
1. Introduction
Climate change has a different magnitude of negative impacts on the health and socioeconomic wellbeing of populations (IPCC, 2021). The coastal regions, especially in developing countries, are most vulnerable to coastal erosion, deforestation and tropical windstorms. Climate change hazards cause environmental changes through multiple stressors at different periods (Ostrowski et al., 2021). For instance, Manda et al. (2021) explained that the destruction of forest areas predisposed the coastal ecosystem to natural threats impacting land cover change and several other climate and non-climate stressors manifesting at global and local scales and threatening marine ecosystems, making it difficult for aquatic organisms to adapt to changes in their natural environments (Dermawan, 2022).
The Gambia’s coastal environment is a region of socioeconomic importance where various activities including tourism, artisanal fishing, and cultural, aesthetic and religious activities are prevalent. It also provides important ecosystem services, including habitats and breeding grounds for aquatic animals, plants and migratory birds. Diverse socioeconomic activities including fisheries and hotel industries increasing within the coastal environment contribute 36% of the country’s GDP (Bojang et al., 2023). However, these activities are negatively impacted due to accretion and erosion of the coastline threatening the livelihood of communities within this environment. As the demand for marine and freshwater resources and their habitats continue to grow in The Gambia, opportunities to conserve much of the coastal land and water environment are dwindling. This has resulted in an increased coastal population with an associated high infrastructural development, mining, and exploitation of coastal resources, ultimately, posing significant challenges to coastal inhabitants (2018a, b). This observed degradation of the coastal environment in The Gambia is expected to continue to exert increasing adverse effects into the future irrespective of actions towards land transformation.
Consequently, coastlines, which is an interface between the land and the ocean has suffered significant conversion due to intense human activities in the last two decades leading to the vulnerability of these areas to climate change (2018). There is a lack of awareness and understanding of the causes of land degradation which affects the development of environmental policies, population and poverty and societies’ response to economic opportunities (Ellis, 2021). Therefore, there is an urgent need to prioritise the increased awareness and understanding of decision-makers and coastal inhabitants whose livelihoods depend on the coastal resources on how to deal with natural and human-induced hazards (Ridha et al., 2022). In the same vein, there is a need for improved socioeconomic, technical skills, awareness and understanding and living conditions of individuals at community levels especially around low-lying coastal areas to address the impact of climate change (2016; Zhou et. al., 2021). This will address the lack of understanding of land cover transformation which affects the development of environmental policies, population and poverty and society’s response to economic opportunities (Ellis, 2021). This will help to address the conflicting interest between human socioeconomic activities that negatively affect the coastal environment and human well-being (Hermann et al., 2020). Since successful environmental management will help to address the conflict between human socioeconomic activities such as urbanisation, tourism, industrialisation, energy activities, port activities and agriculture and the need to preserve natural coastal ecosystems and their ecological processes (Hale, 2018; Hsu et al., 2020; Hale et al., 2021). As the widespread land transformation instigated by human activities continues to increase over time, effective and efficient evaluations of land use land cover change in coastal areas are necessary to inform relevant stakeholders in developing more vibrant coastal management policies by incorporating substantial vulnerabilities, adaptation, and mitigation issues (Tiando et al., 2021).
As the African settlements increase around the coast and urban areas, they will be confronted with the adverse effect of changing climate resulting to extreme temperature effects, coastal erosion, increased health hazards and food insecurity thereby, increasing their vulnerability and risk levels (Williams et al., 2019; Komugabe-Dixson et al., 2019). Land cover change driven by individuals’ responses to economic opportunity, as mediated by institutional factors is an important subject significant to the study of global forest change and holds major implications for sustainable development (Wei et al., 2018). Land is always subject to increased transformation which makes it scarce around coastal and urban areas with a high rate of industrialisation and urbanisation, where it is considered a crucial asset for growth and advancement (Banzaf et al., 2017; Tiando et al., 2021). For Ofori et al. (2021), increased socioeconomic development and urbanisation are expected to negatively impact Sub-Saharan Africa as it continues to expose more of its population to climate hazards due to its inadequate capacity to address climate change challenges. Most of the climate-induced pressures experienced by coastal communities were facilitated by the exploitation of coastal resources by humans for food, fuel for household functions and other essential services available along the coasts (Hossain et al., 2020). Therefore, Most of these threats facing coastal ecosystems and inhabitants are enhanced by humans as they continue to be attracted to coastal zones for socioeconomic development, urbanisation, food and other essential services (Creel, 2003; Reside et al., 2018).
Overall, several studies have confirm that the coastal environment is vulnerable to change effects and the changes in land cover transformation and population growth are major triggers for the increased impacts on the coastal environment and inhabitants (Amuzu et al., 2018a, b; Belford et al., 2020; Gomez et al., 2020). These studies also do not only highlight the importance of enhancing awareness of the population about the dangers of living in coastal lowlands, but also stressed the to assess the effect of land use land cover change on the coastal ecosystems and biodiversity. This is necessary to guide the government and relevant stakeholders in providing more reliable and effective programs that would protect the environment and the coastal communities from climate change hazards and help in allocating priorities for funding and development projects within the coastal zones. Therefore, this research assesses the magnitude of land cover conversion along the coastal zone of The Gambia, specifically to uncover the level of land cover change and its effect on the coastal ecosystems and communities living around the coast. This is important for the development of adaptation and mitigation strategies in reducing future damage to the coastal ecosystems, communities and the biodiversity they support.
2. Materials and Methods
2.1. Study Area
The total land area of The Gambia is 11,000 km2. About one-fifth of its surface is area water with the river Gambia running 680km from the Futa Jallon in the Republic of Guinea to the Atlantic Ocean dividing the country into North and South Banks. The country’s coastline is 80km Gambia which extends from Buniadou Point and Kerenti Bolong in the north to the point of entry of Allanhein in the south (Figure 1). The country located within the tropical sub-humid eco-climatic zone (Jaiteh & Sarr, 2011) characterised by the Sudano Sahelian Climate and is dominated by an irregular dry Harmattan Northern Winds from the Sahara Desert and South-Westerly Monsoon winds from the Atlantic Ocean (NEA, 2010).
The climate of The Gambia’s coastline is characterized by sea level rise and associated inundation levels of 2m and 10m by 2100, coastal erosion, flood, reduced or erratic rainfall pattern of about 35% and salt intrusion into wells and other environments (Dia Ibrahima, 2012). There is an increase in the annual maximum temperature which is higher than the decreases in the annual minimum temperature indicating that the coastal zone of The Gambia had experienced more warming than cooling from 1986 to 2016 (Amuzu et al., 2018b).
Apart from the terrestrial habitats, the coastline also has different other habitats such as mangrove forests and wetlands, sandy beaches, brackish water and mudflats, that provide important ecosystem services including breeding and nursery grounds to organisms. The Gambia’s population is estimated in 2020 at 2.5 million with an annual growth rate of 2.6% (CIESIN, 2021) with 37% of its estimated population residing within 10-25km of the coastline. The main occupations of most of The Gambians around the coastline include agriculture, trade, service industry, fishing and horticulture. There has also been growing private sector involvement in tourism and hospitality industries, sand mining, and the establishment of factories along the coast. Fishing activities such as the exploitation of coastal vegetation for fish processing and clearing of land for agriculture continue to transform the coastal ecosystems thereby exerting extensive pressure on the coastal environment.
2.2. Data
Using land use land cover change classification, three Cloud free Landsat imageries for the years 1990, 2000, 2010 and 2020 were downloaded from the United States Geological Survey website. Landsat was considered for this study because of its temporal resolution and the attributes of the satellite images used (Table 1). The population data for the coastal zone of The Gambia was downloaded from the Center for International Earth Science Information Network-CIESIN in their Low Elevation Coastal Zone (LECZ) Urban-Rural Population and Land Area Estimates, 2021 (Table 2) and The Gambia Bureau of Statistics (GBOS), 2020. In addition, community focus group discussions were held in 10 coastal communities (Barra, Essau, Bakau Old Cape, Fajara, Kotu, Kololi, Kerr-seringe, Brufut, Sanyang and Gunjur) where community members including male and female gathered to discuss their perception, and opinions on the situation of environmental degradations within their environment in October 2021. Key informant interviews were also conducted where individuals with good knowledge of the environment including community leaders, professionals and residents were interviewed during the period.
2.3. Land Use Land Cover
2.3.1. Image Preprocessing and Classification
Before the land use land cover classification, the downloaded images were preprocessed using the Earth resource data analysis system. As part of the preprocessing, a spatial sub-setting was done to reduce the image to the study area after which atmospheric corrections were done to enhance the image quality. High-resolution images from Google Earth, topographic maps, aerial photographs and ground-based knowledge after a detailed field survey were used to select training samples for the supervised classification. All the preprocessed images were categorised into five (5) major land use land cover classes using the supervised classification method and Support Vector Machine (SVM) classification as the decision rule for the supervised classification algorithms. The classes used were Water bodies, Vegetation, Built-up, Barren land, and Wetlands. The decision to use these classes was informed by the Food and Agriculture Organisation (FAO) (2000) land use land cover classification scheme which uses a consistent and systematically applied classification system to fully describe the land use land cover classes. This system also responds to the need for consistent and reliable assessment and monitoring of land use land cover resources within a region for sustainable management of resources, environmental protection and food security.
2.4. Statistical Analysis
The percentage change of the land use land cover variables (barren land, built-up, vegetation cover, water and wetlands) and the population for the different periods (1990, 2000, 2010, and 2020) was calculated to determine the degree to which population increase is related to changes LULC change classes from 1990 to 2020. Furthermore, to estimate the linear relationship between land use land cover change classes with population growth, a correlation analysis was conducted to measure the degree to which the different classes of land use land cover changes relate to each other. This is given as;
where;
n=number of values or elements
∑x=sum of the x values
∑y=sum of the y values
∑xy=sum of the products of x and y values
∑x2= Sum of squares of x values
∑y2=sum of squares of y values
3. Results
3.1. Land Use Land Cover Changes
Maps of the coastal region was produced for each study year to show the land use land cover changes in the coastal environment using 1990 as the base year. The total land area and the percentage of land use land cover changes from 1990-2020 are presented in Table 3.
The land use land cover map in 1990 (Figure 2) measures a total land area of 939.2ha of the coastal The Gambia’s coastal area (Table 3). This total area included barren land (269.4ha), built-up (12.8ha), vegetation cover (543.9ha), waterbodies (13.3ha) and wetlands (99.8ha). The proportion of land use land cover change classes in 1990 presented in Table 3 shows that the total area comprises 28.7% of barren land, 1.4% of built-up, 57.9% of vegetation cover, 1.4% of water bodies and 10.6% of wetlands.
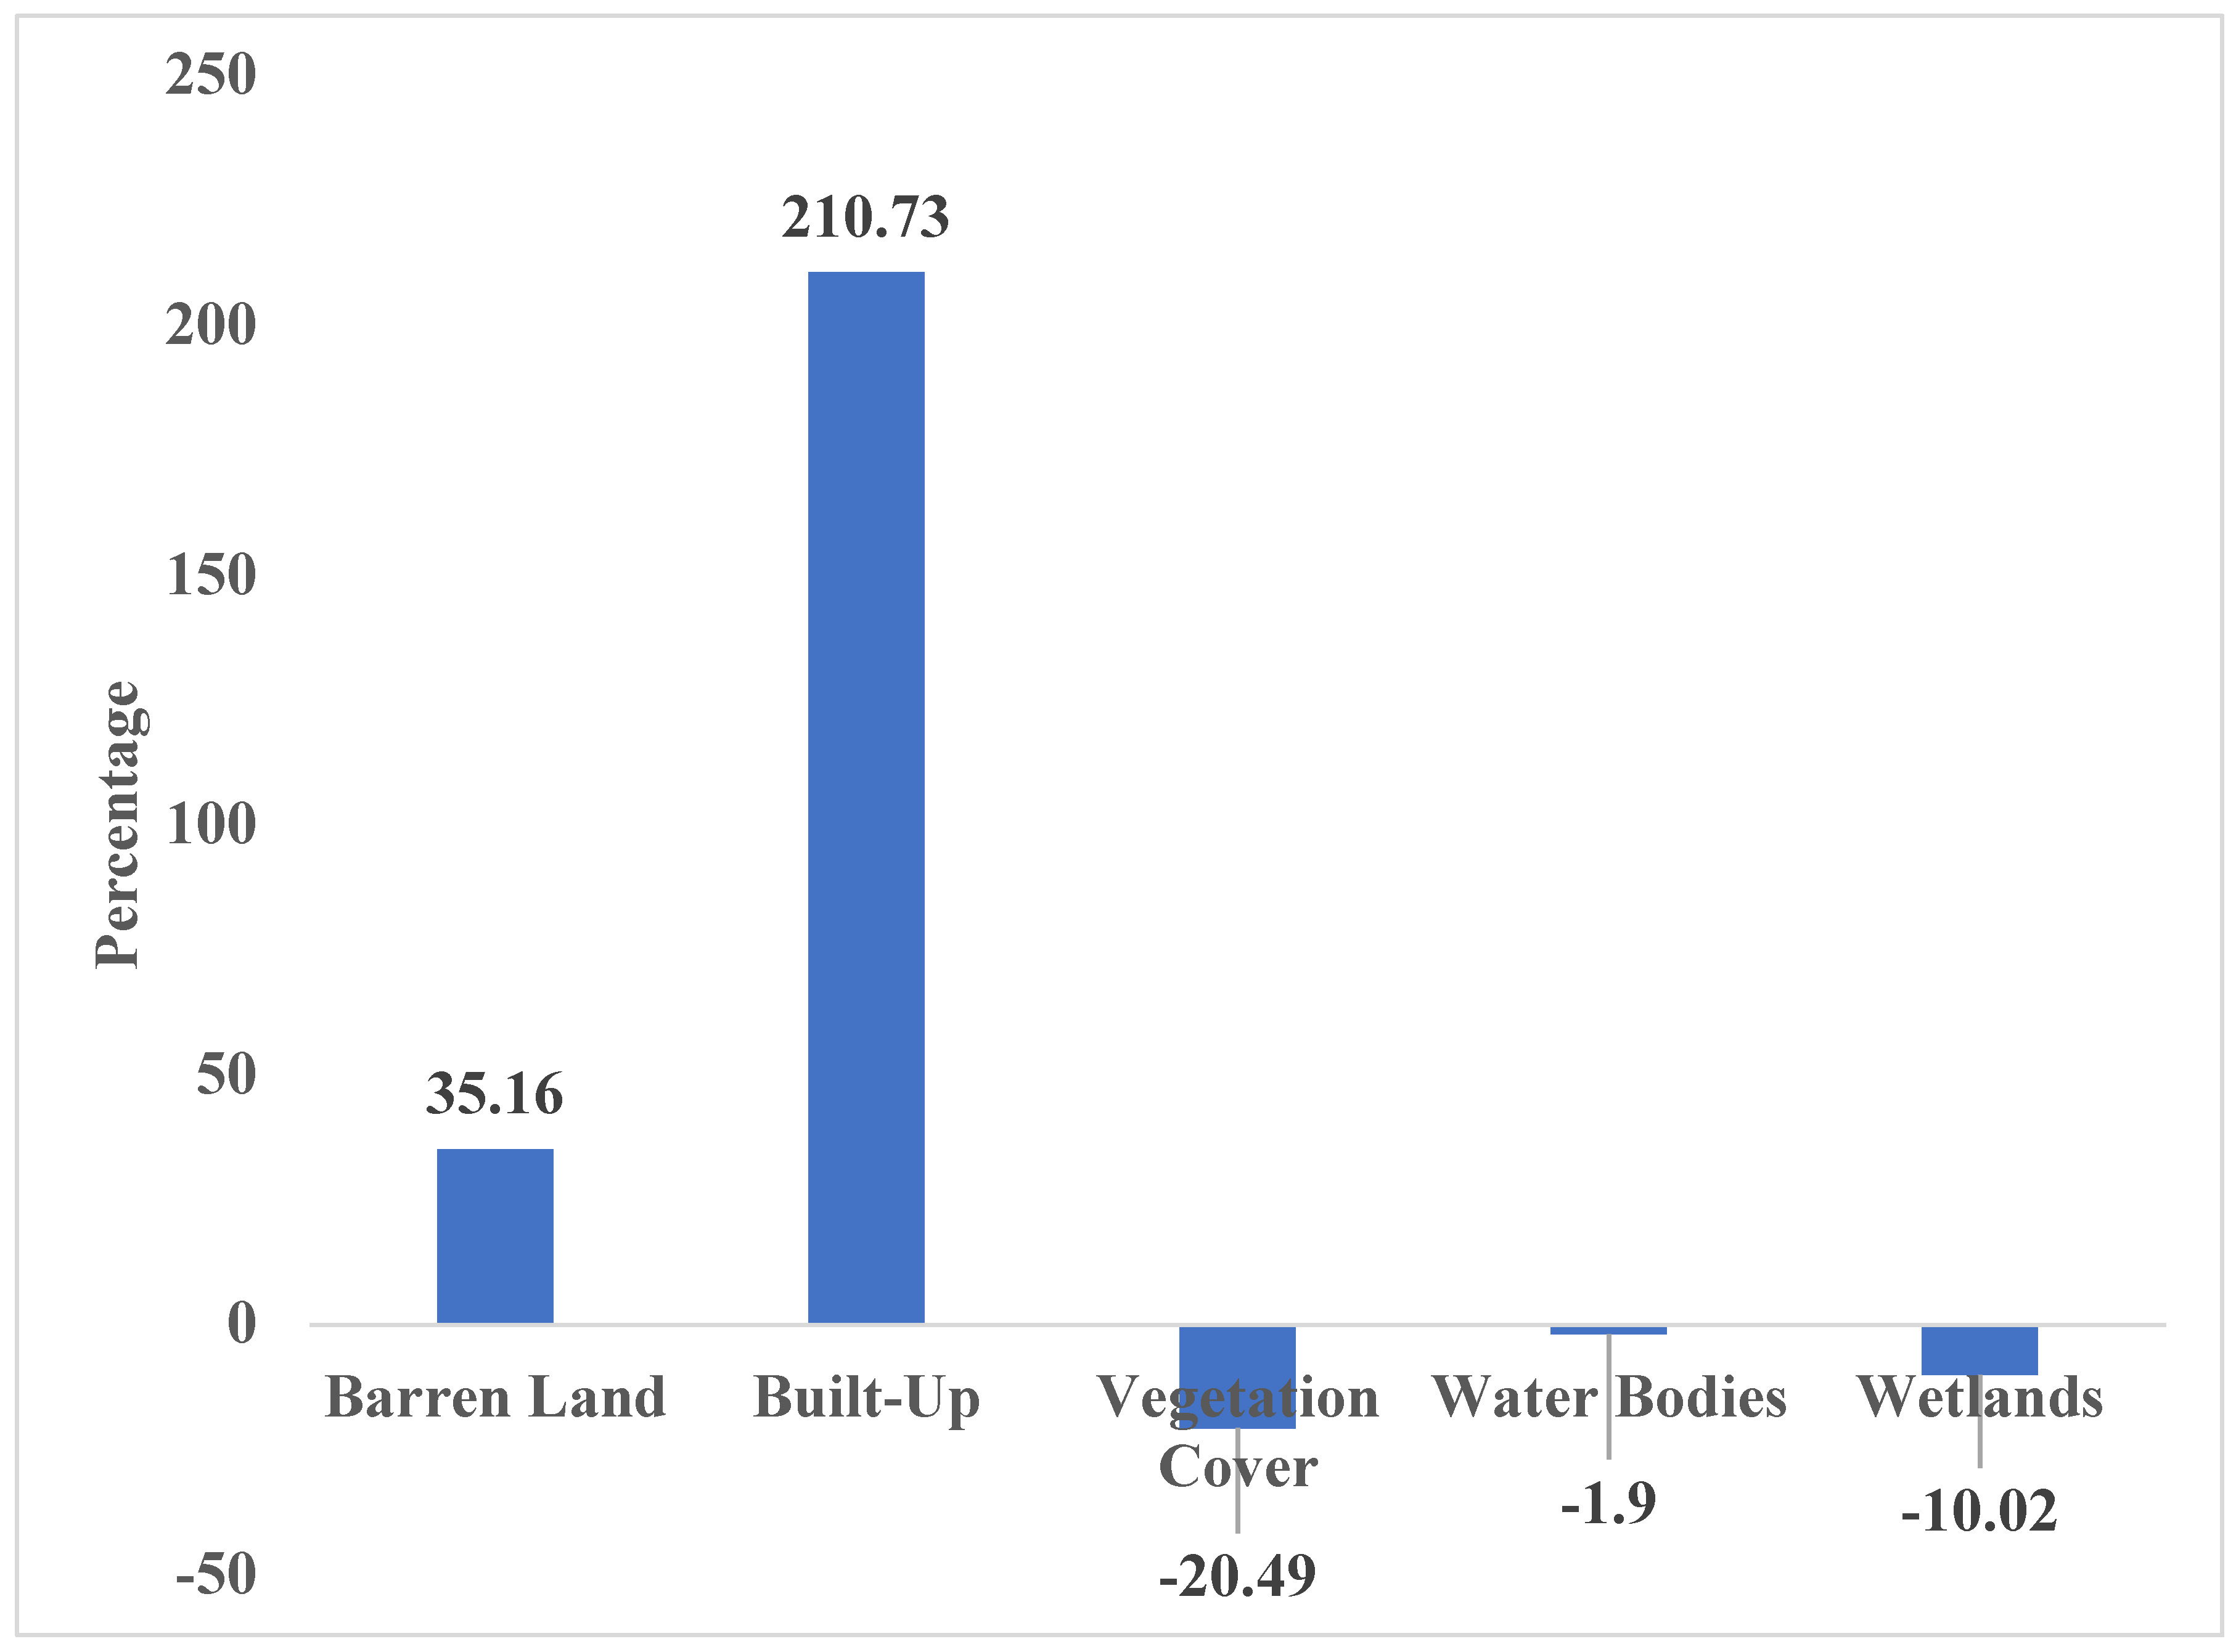
The land use land cover map for 2000 (Figure 3) shows the land use land cover areas were estimated as barren land (364.2ha), built-up (39.8ha), vegetation cover (432.5ha), waterbodies (13.0ha), and wetlands (89.89ha) (Table 3). This represents 38.8%, 4.2%, 46.0%, 1.4% and 9.6% of barren land, built-up, vegetation cover, waterbodies, and wetlands, respectively. The percentage of land use land cover change from 1990 to 2000 (Figure 6) indicates that barren and built-up increased by 35.2% and 210.7%, respectively, while vegetation cover, water bodies and wetlands decreased by 20.5%, 1.9% and 10.0%, respectively.
Figure 3.
Land use land cover change map of the coastal zone of The Gambia for 2000.
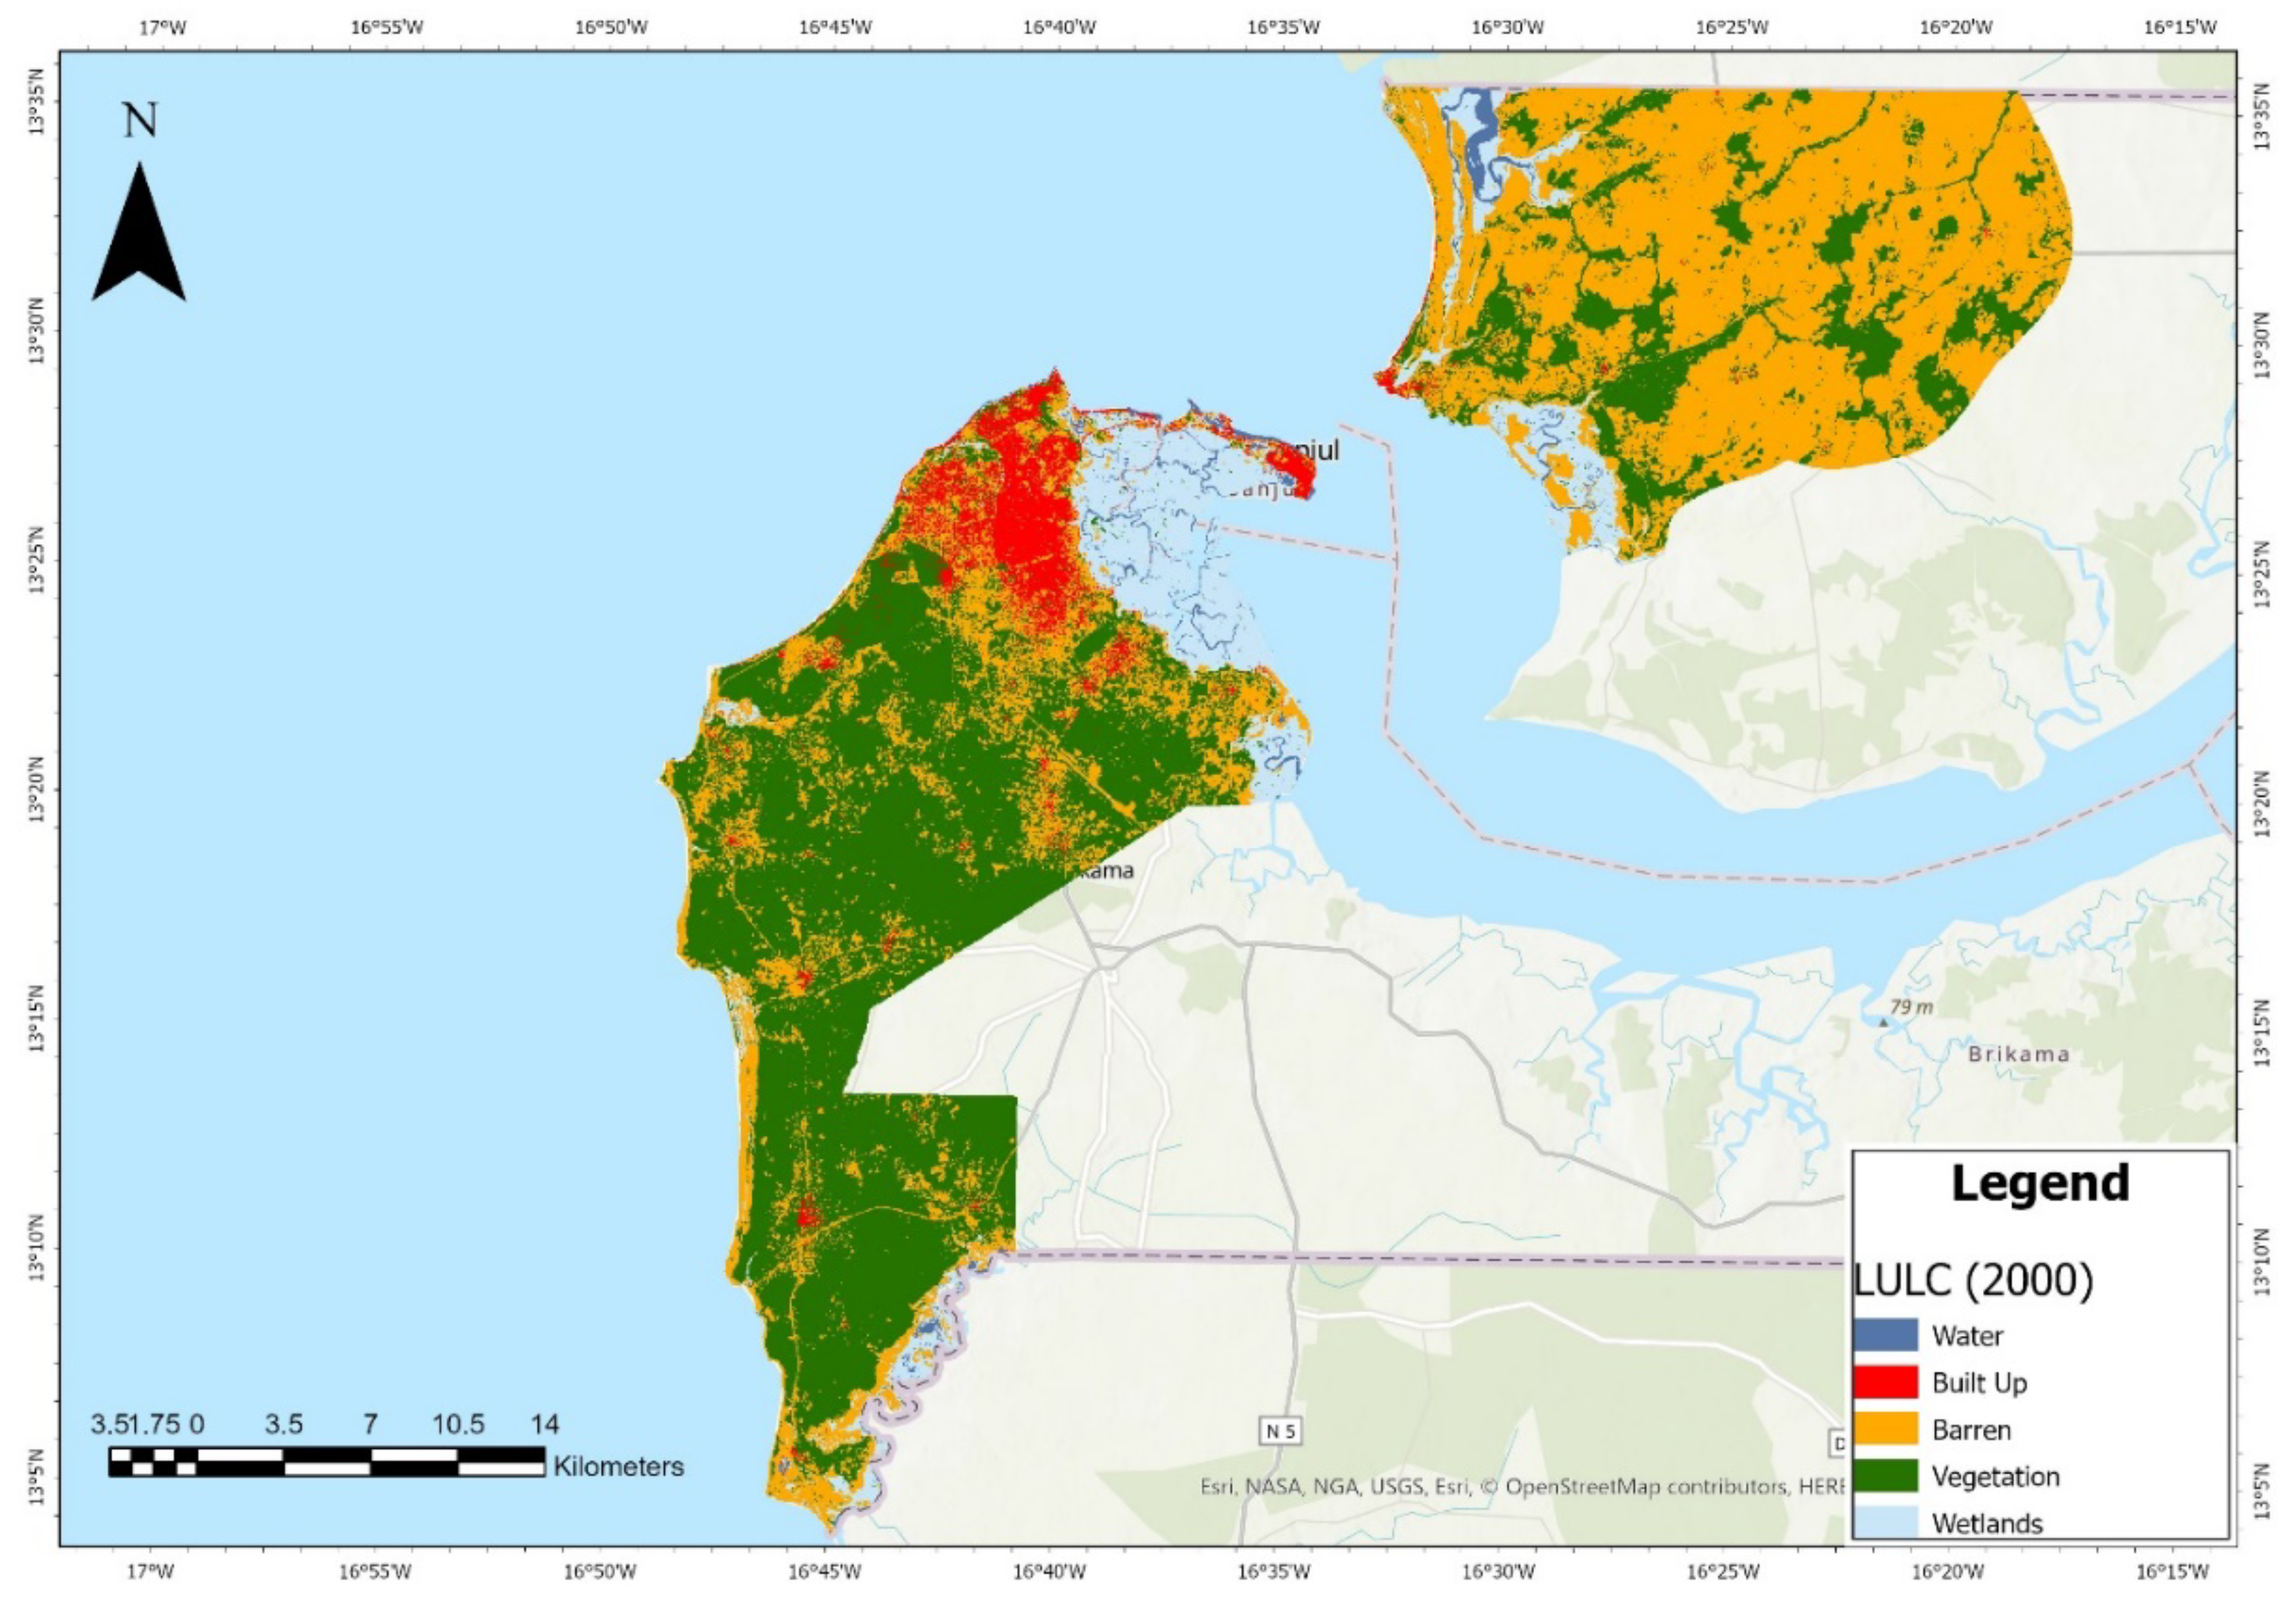
Figure 4.
Land use land cover change map of the coastal zone of The Gambia from for 2010.
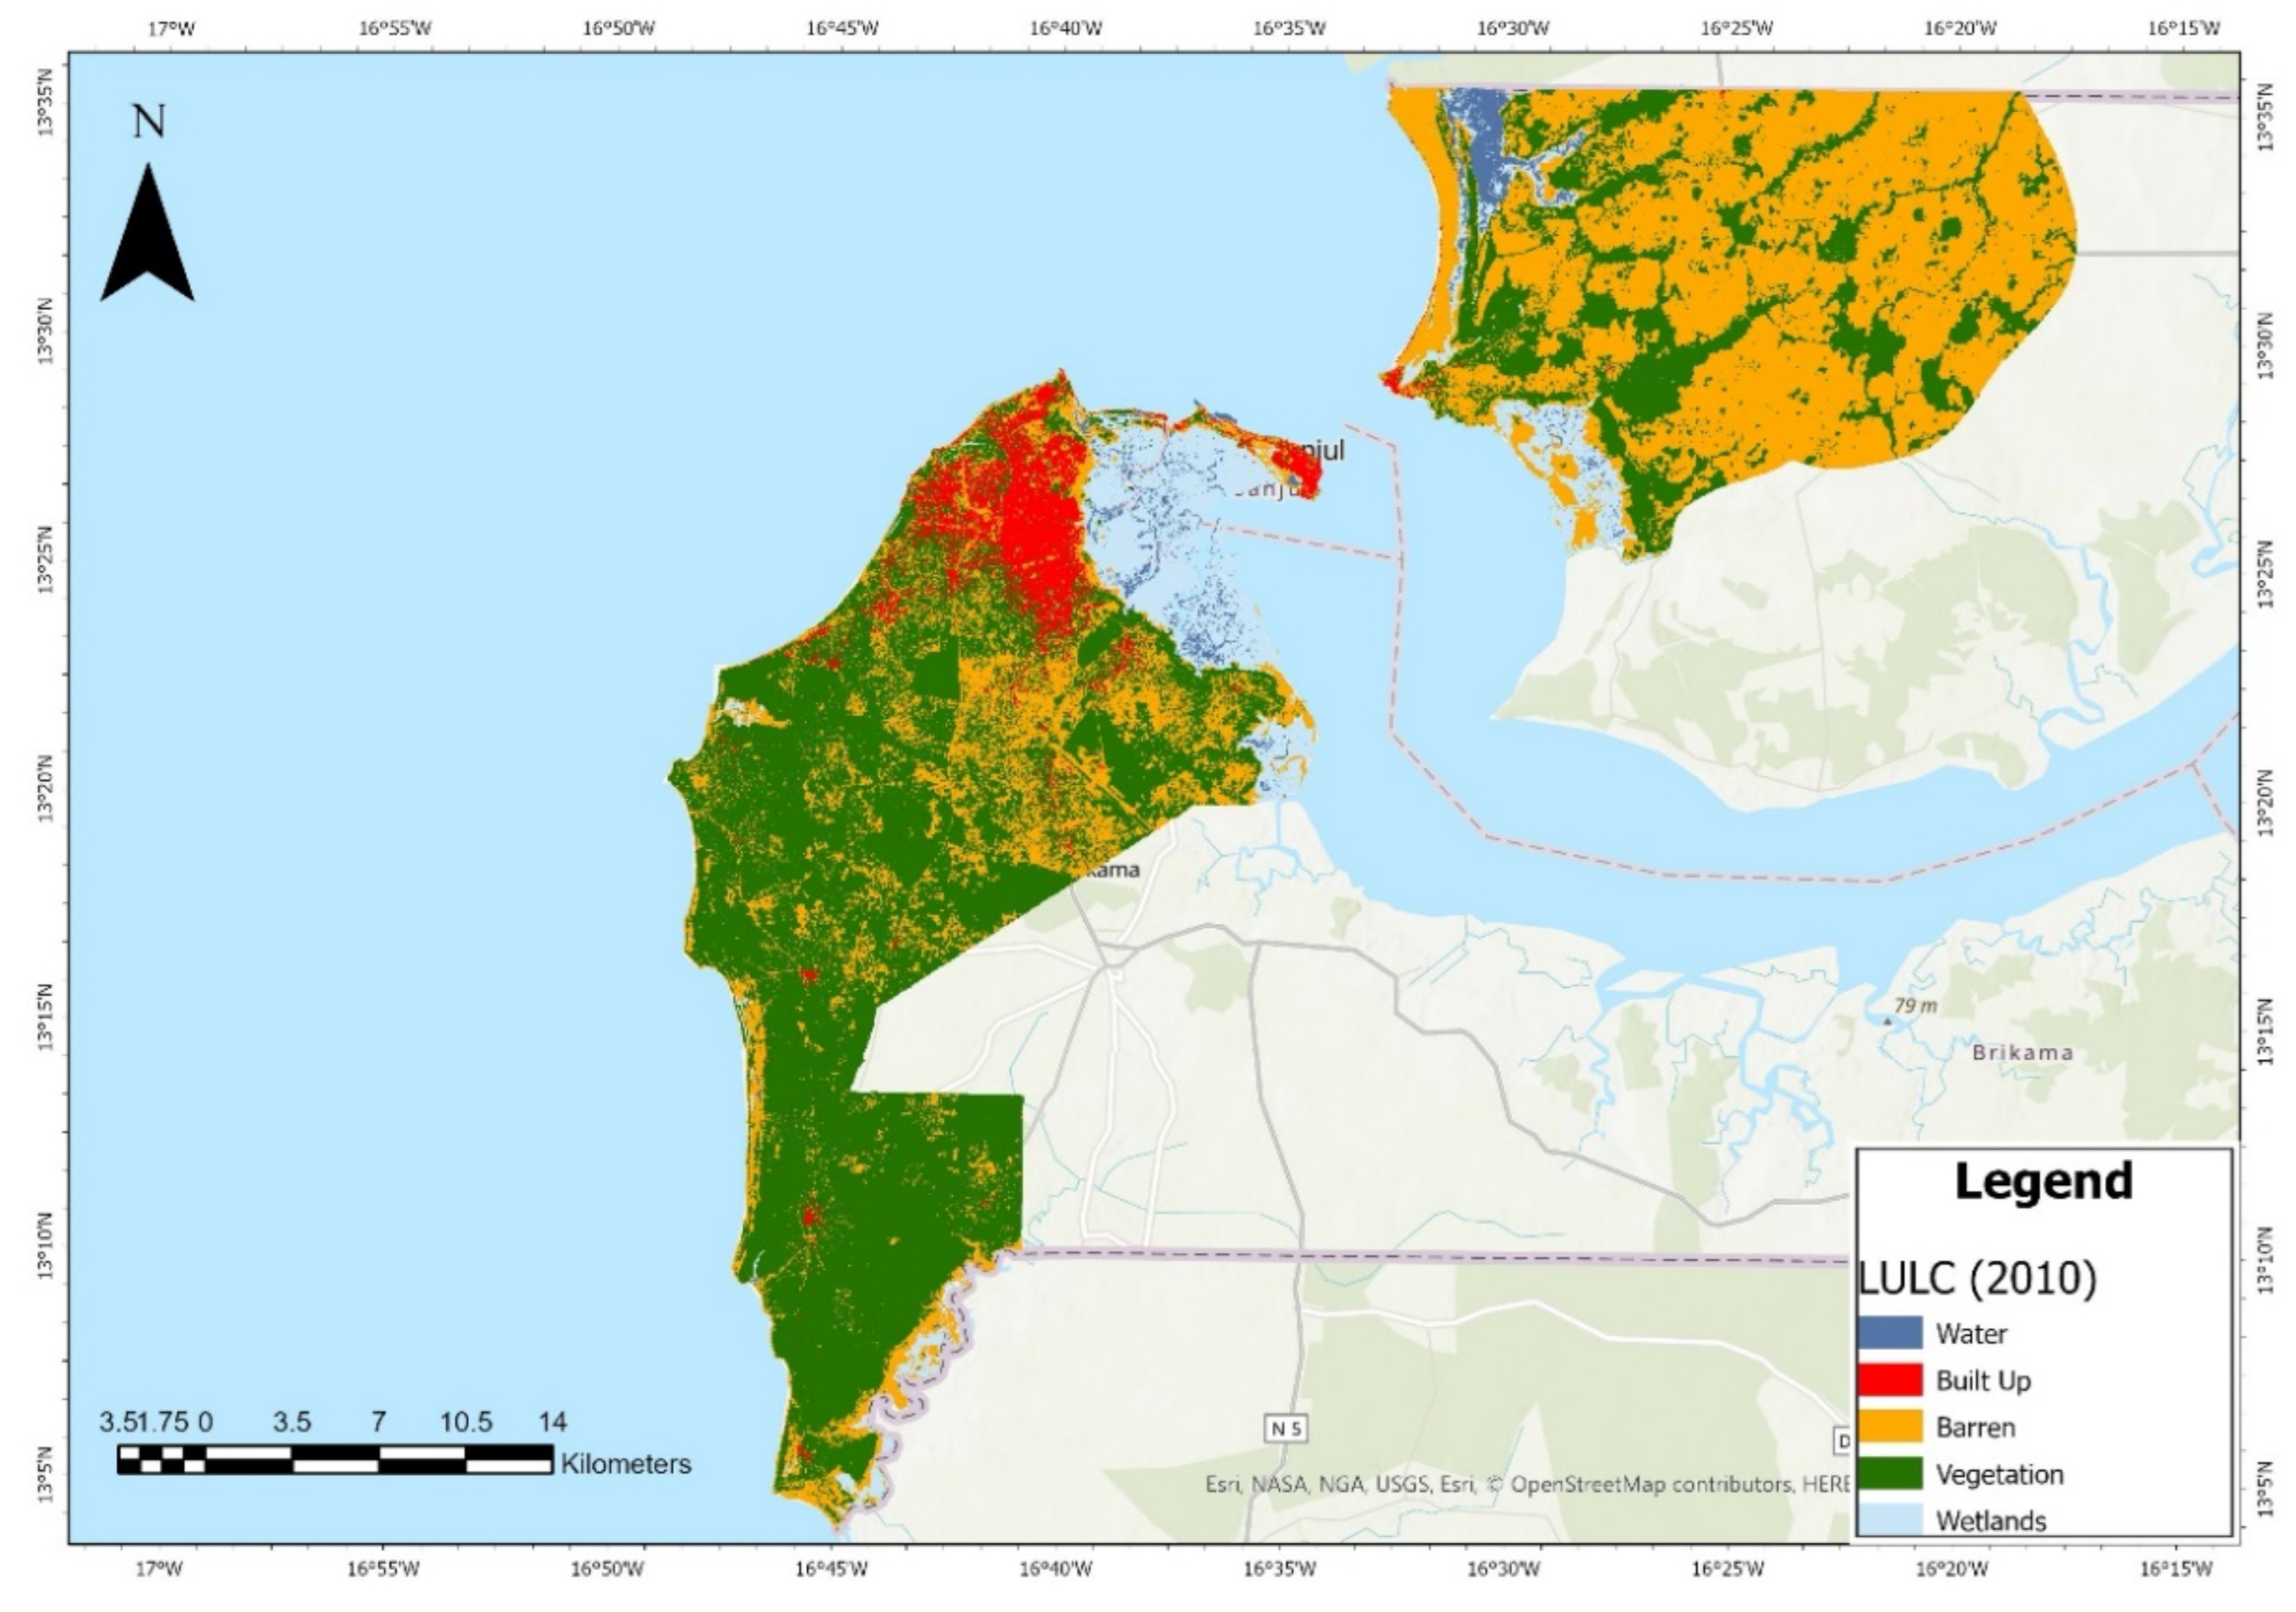
Figure 5.
Land use land cover change map of the coastal zone of The Gambia from for 2020.
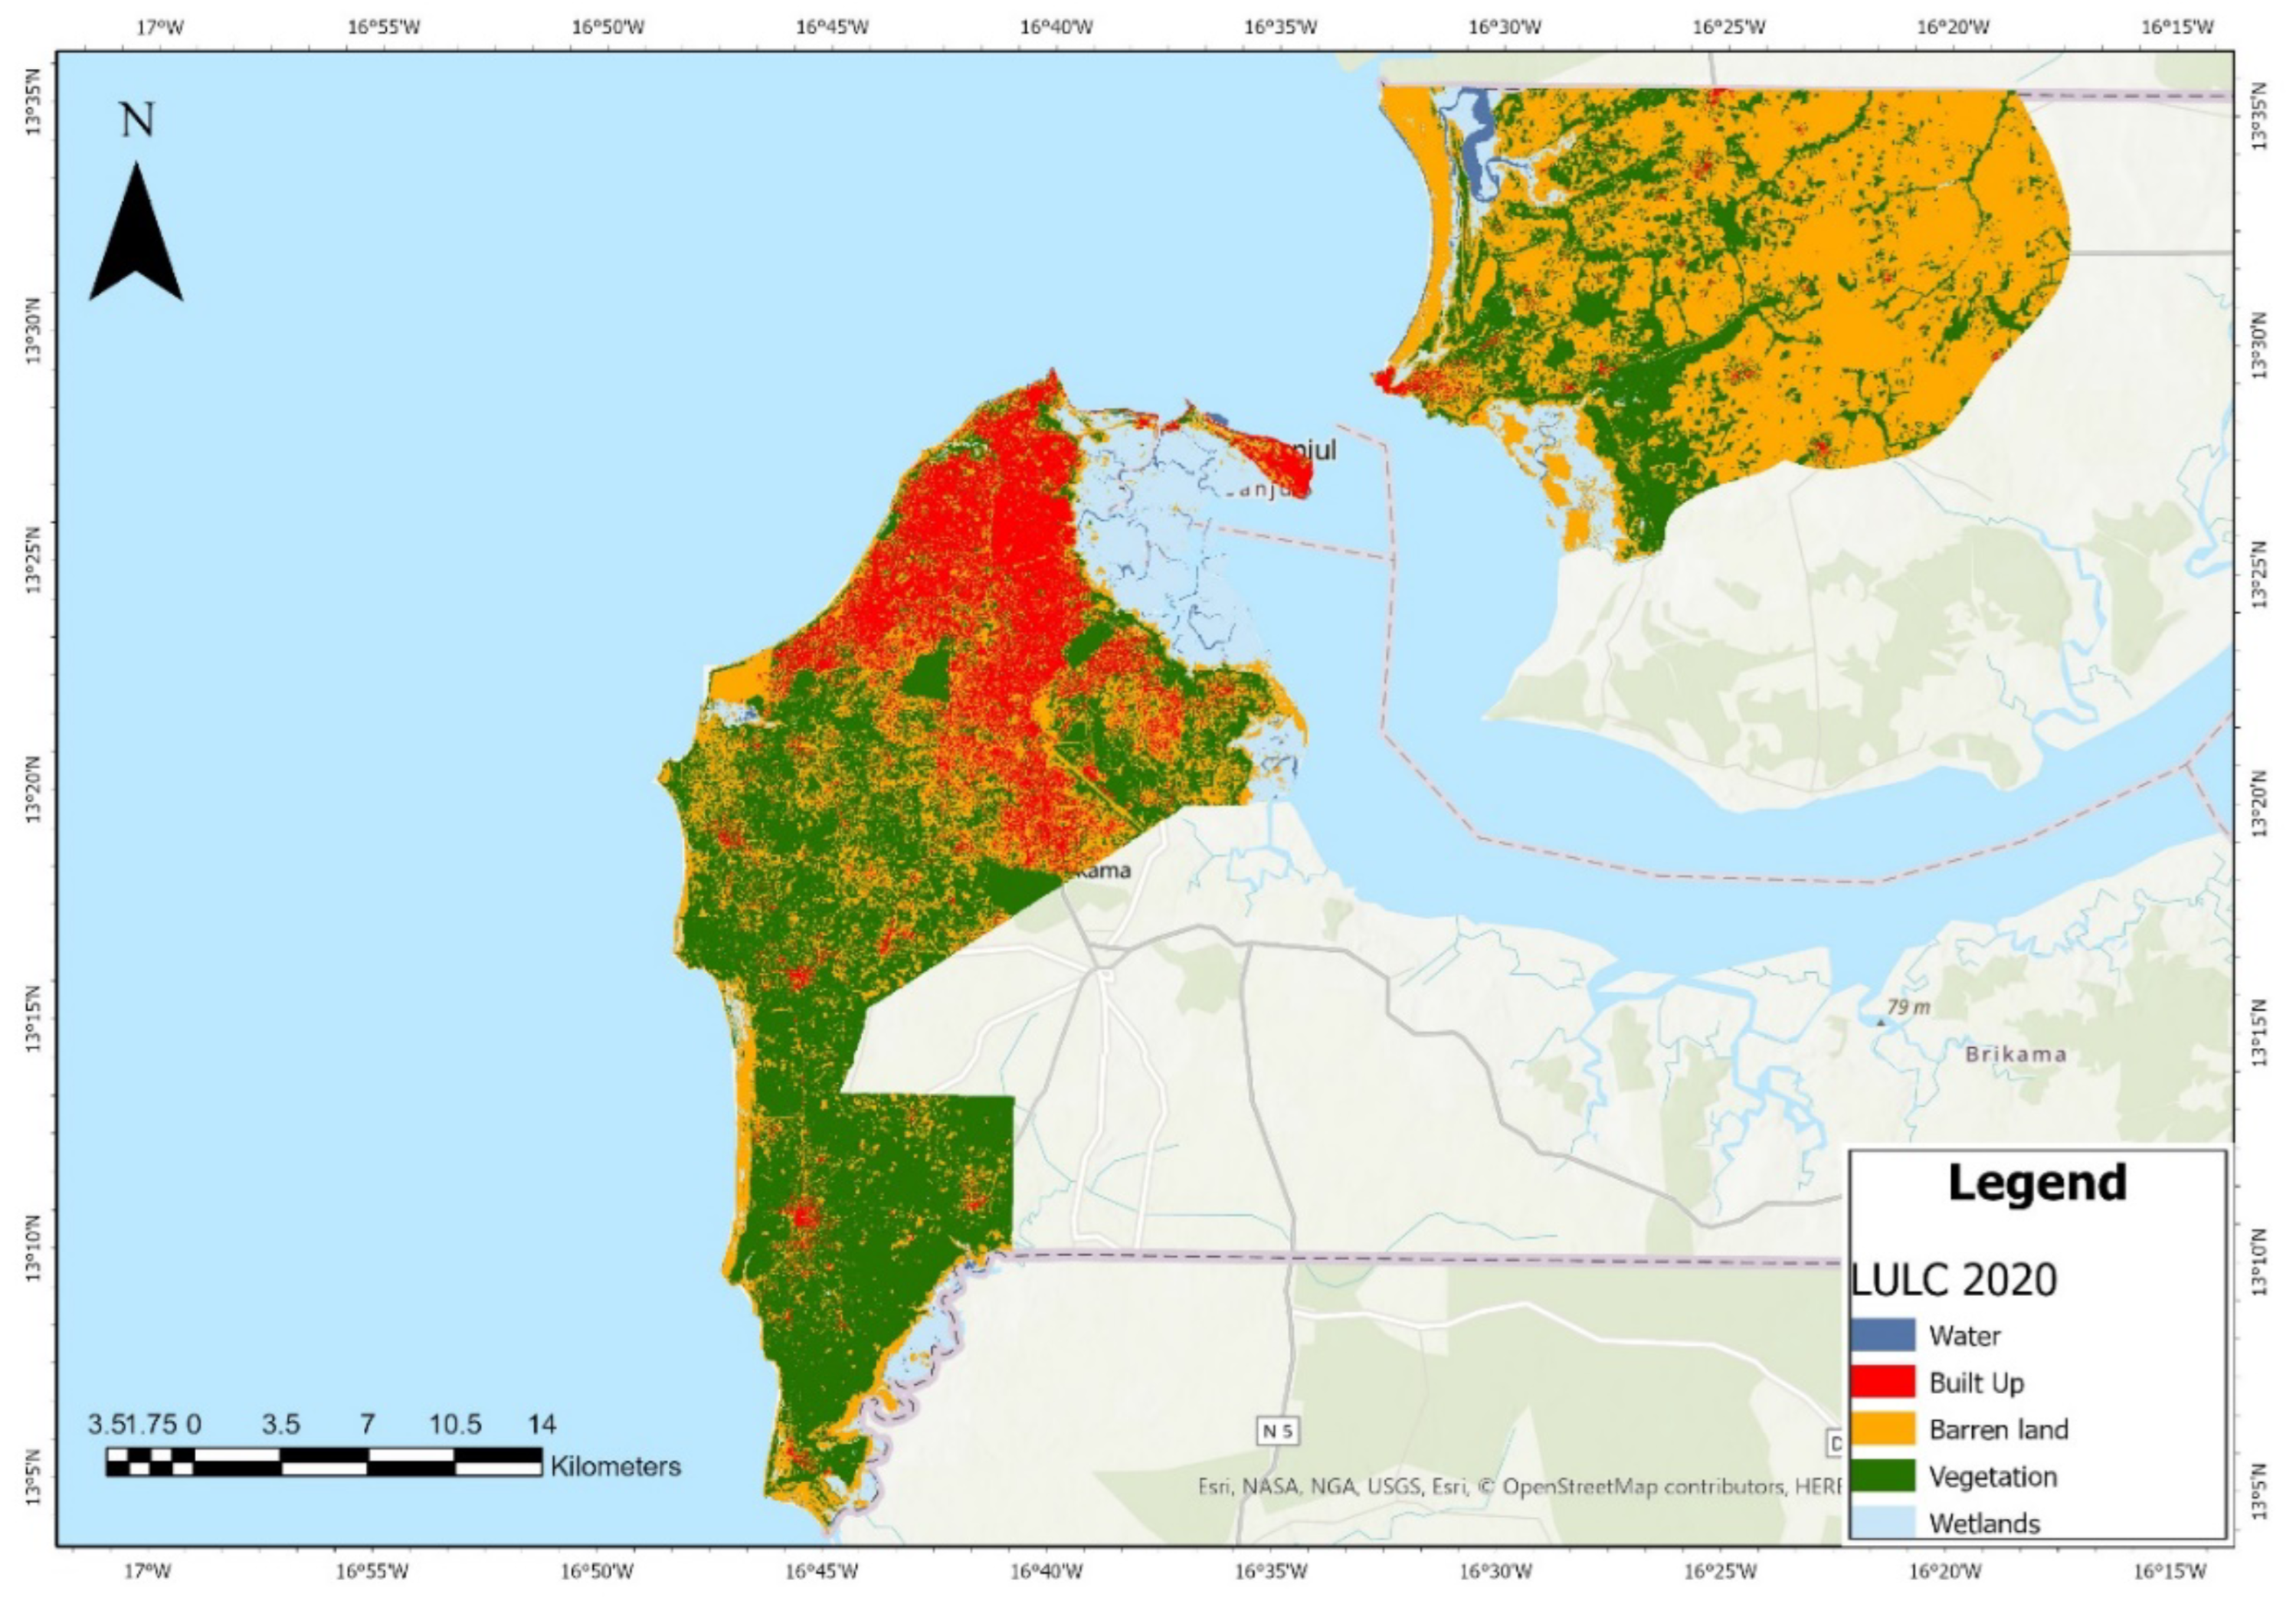
Figure 6.
Land use land cover Change of the Coastal Zone of The Gambia from 1990 to 2000 in Percentage.
Figure 6.
Land use land cover Change of the Coastal Zone of The Gambia from 1990 to 2000 in Percentage.
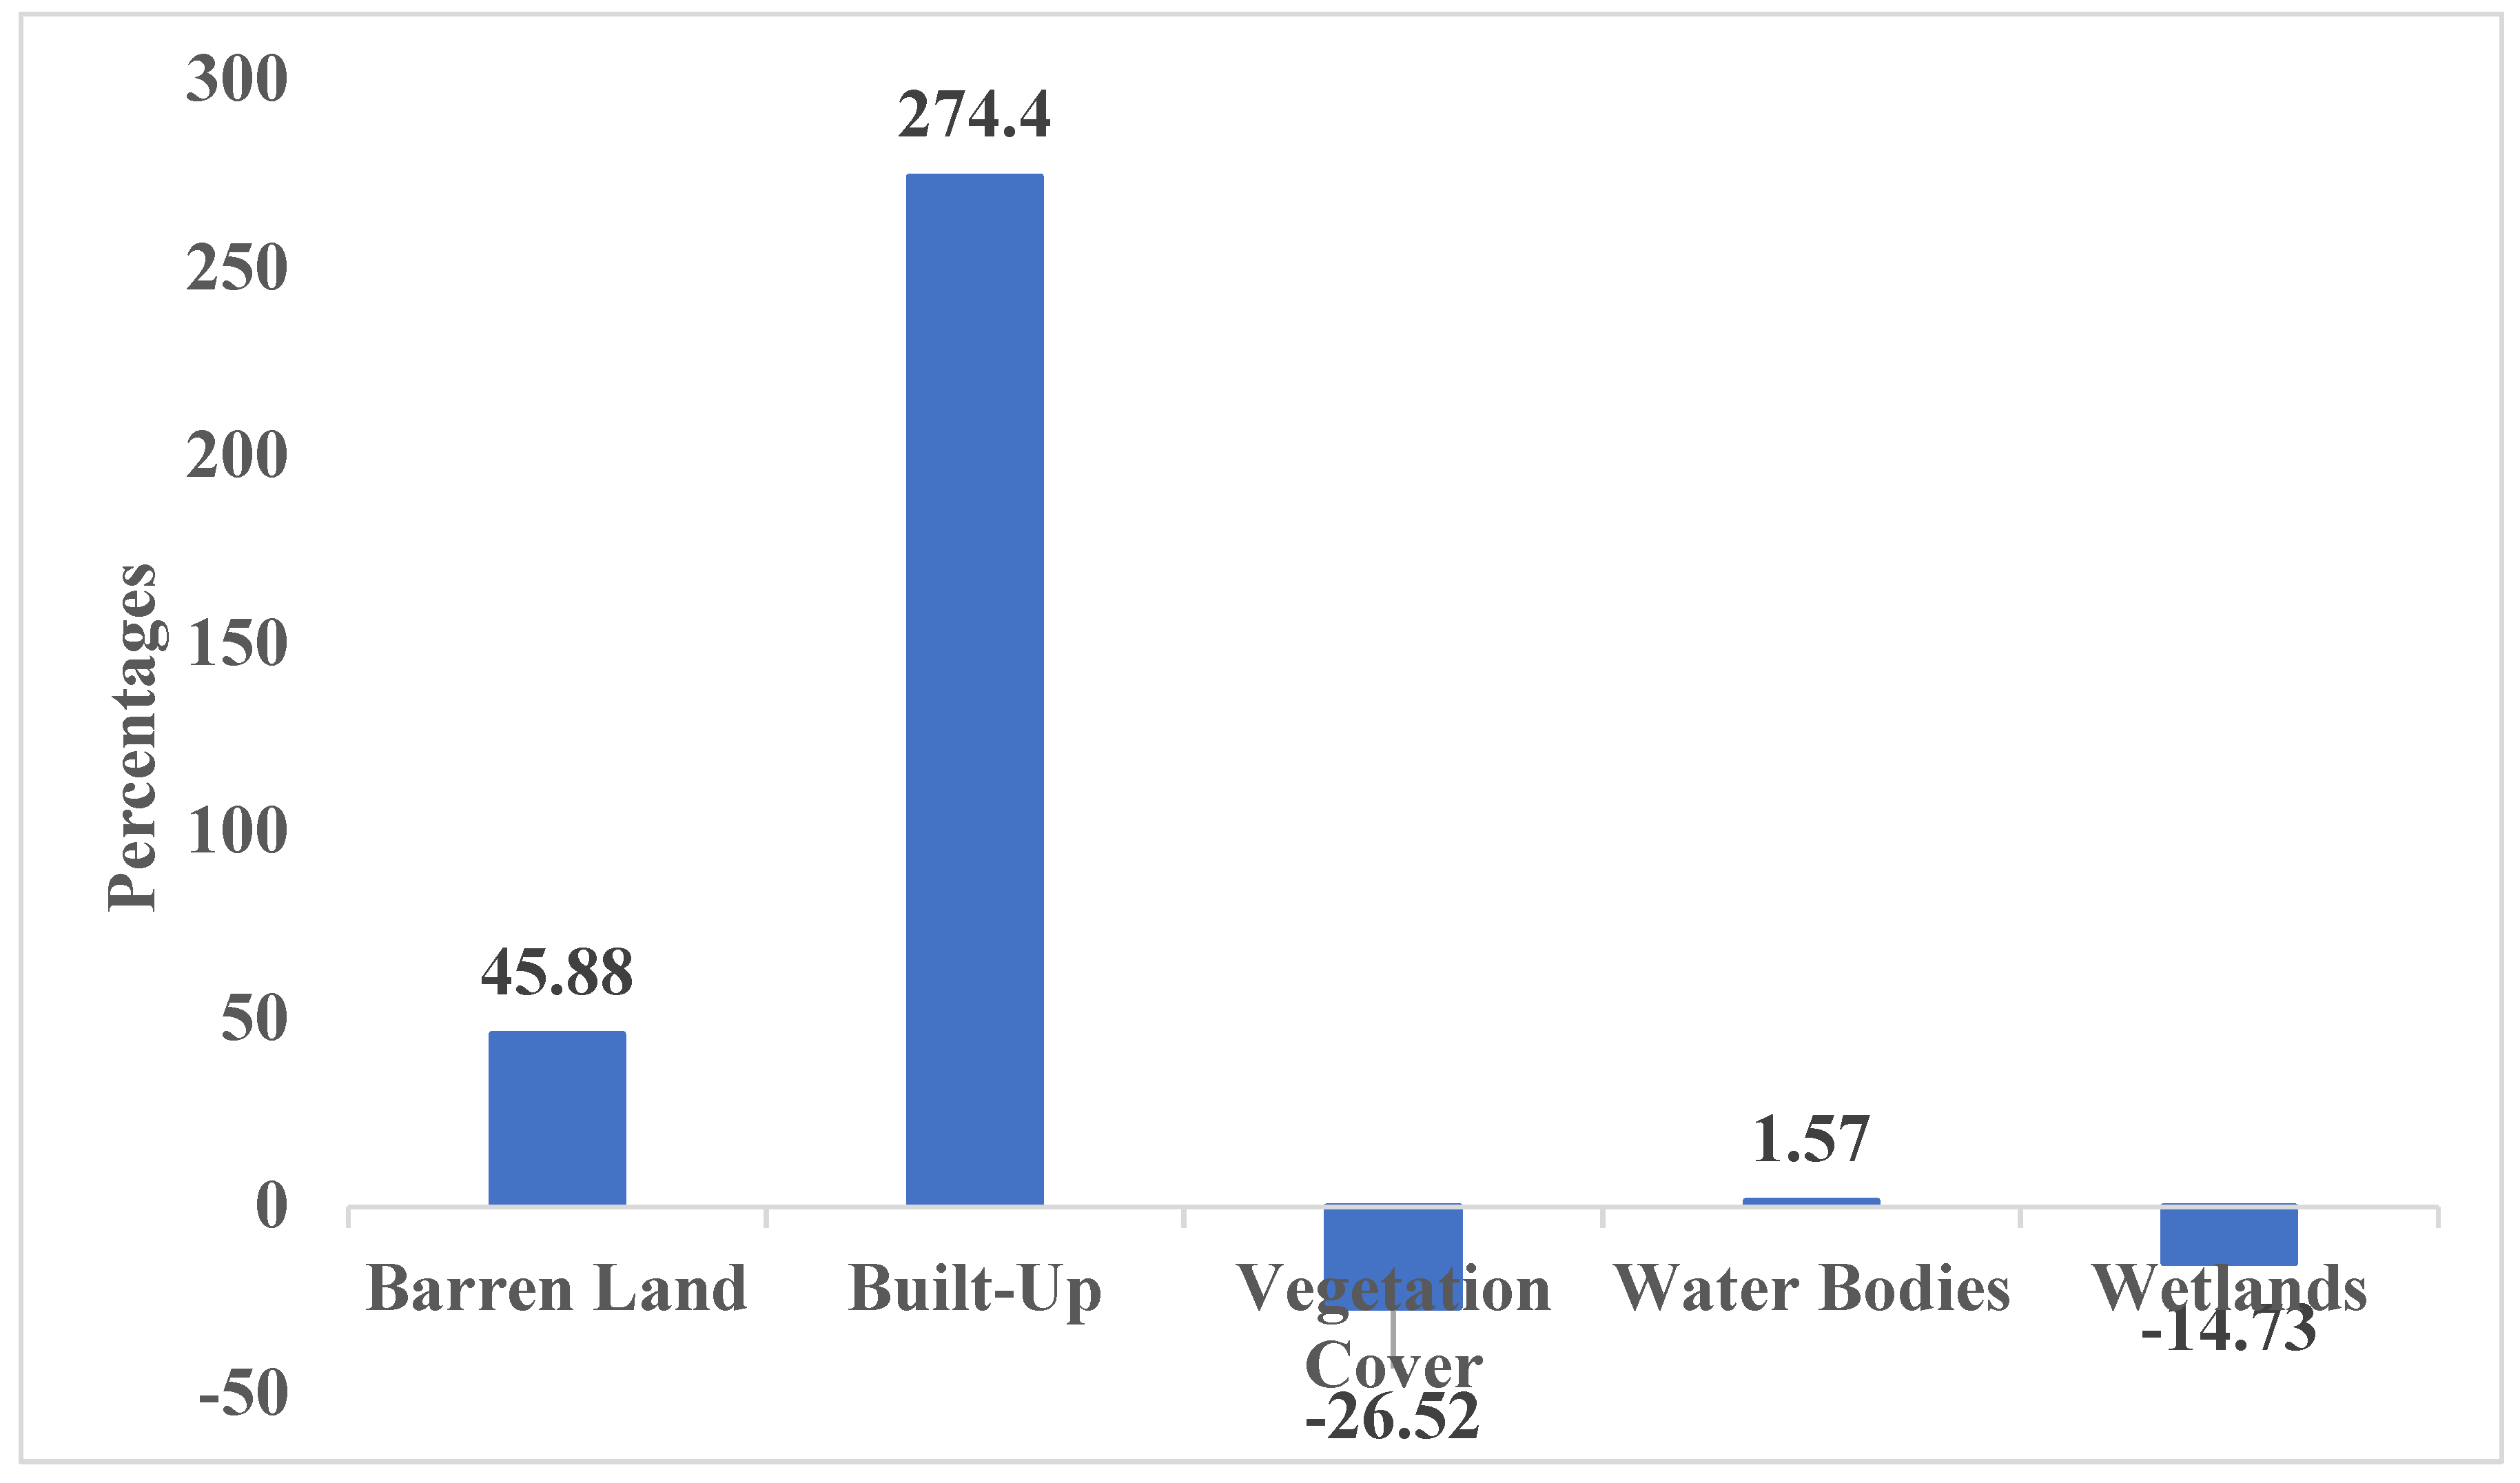
The land use land cover map for 2010 (Figure 4) measured a total land area of 939.32ha (Table 3). This includes 393.1ha of barren land, 47.9ha of built-up, 399.7ha of vegetation cover, 13.5ha of water bodies and 85.2ha of wetlands. These represent 41.9%, 5.10%, 42.6%, 1.4%, and 9.1% of barren land, built-up, vegetation cover, water bodies and wetlands of the total land area, respectively. The land use land cover change from 1990 to 2010 shows an increase in barren land, built up and water bodies by 45.9%, 274.4% and 1.6%, respectively, and a decrease in vegetation cover and wetlands by 26.5%, and 14.7%, respectively (Figure 7).
Figure 7.
Land use land cover Change of the Coastal Zone of The Gambia from 1990 to 2010 in Percentage.
Figure 7.
Land use land cover Change of the Coastal Zone of The Gambia from 1990 to 2010 in Percentage.
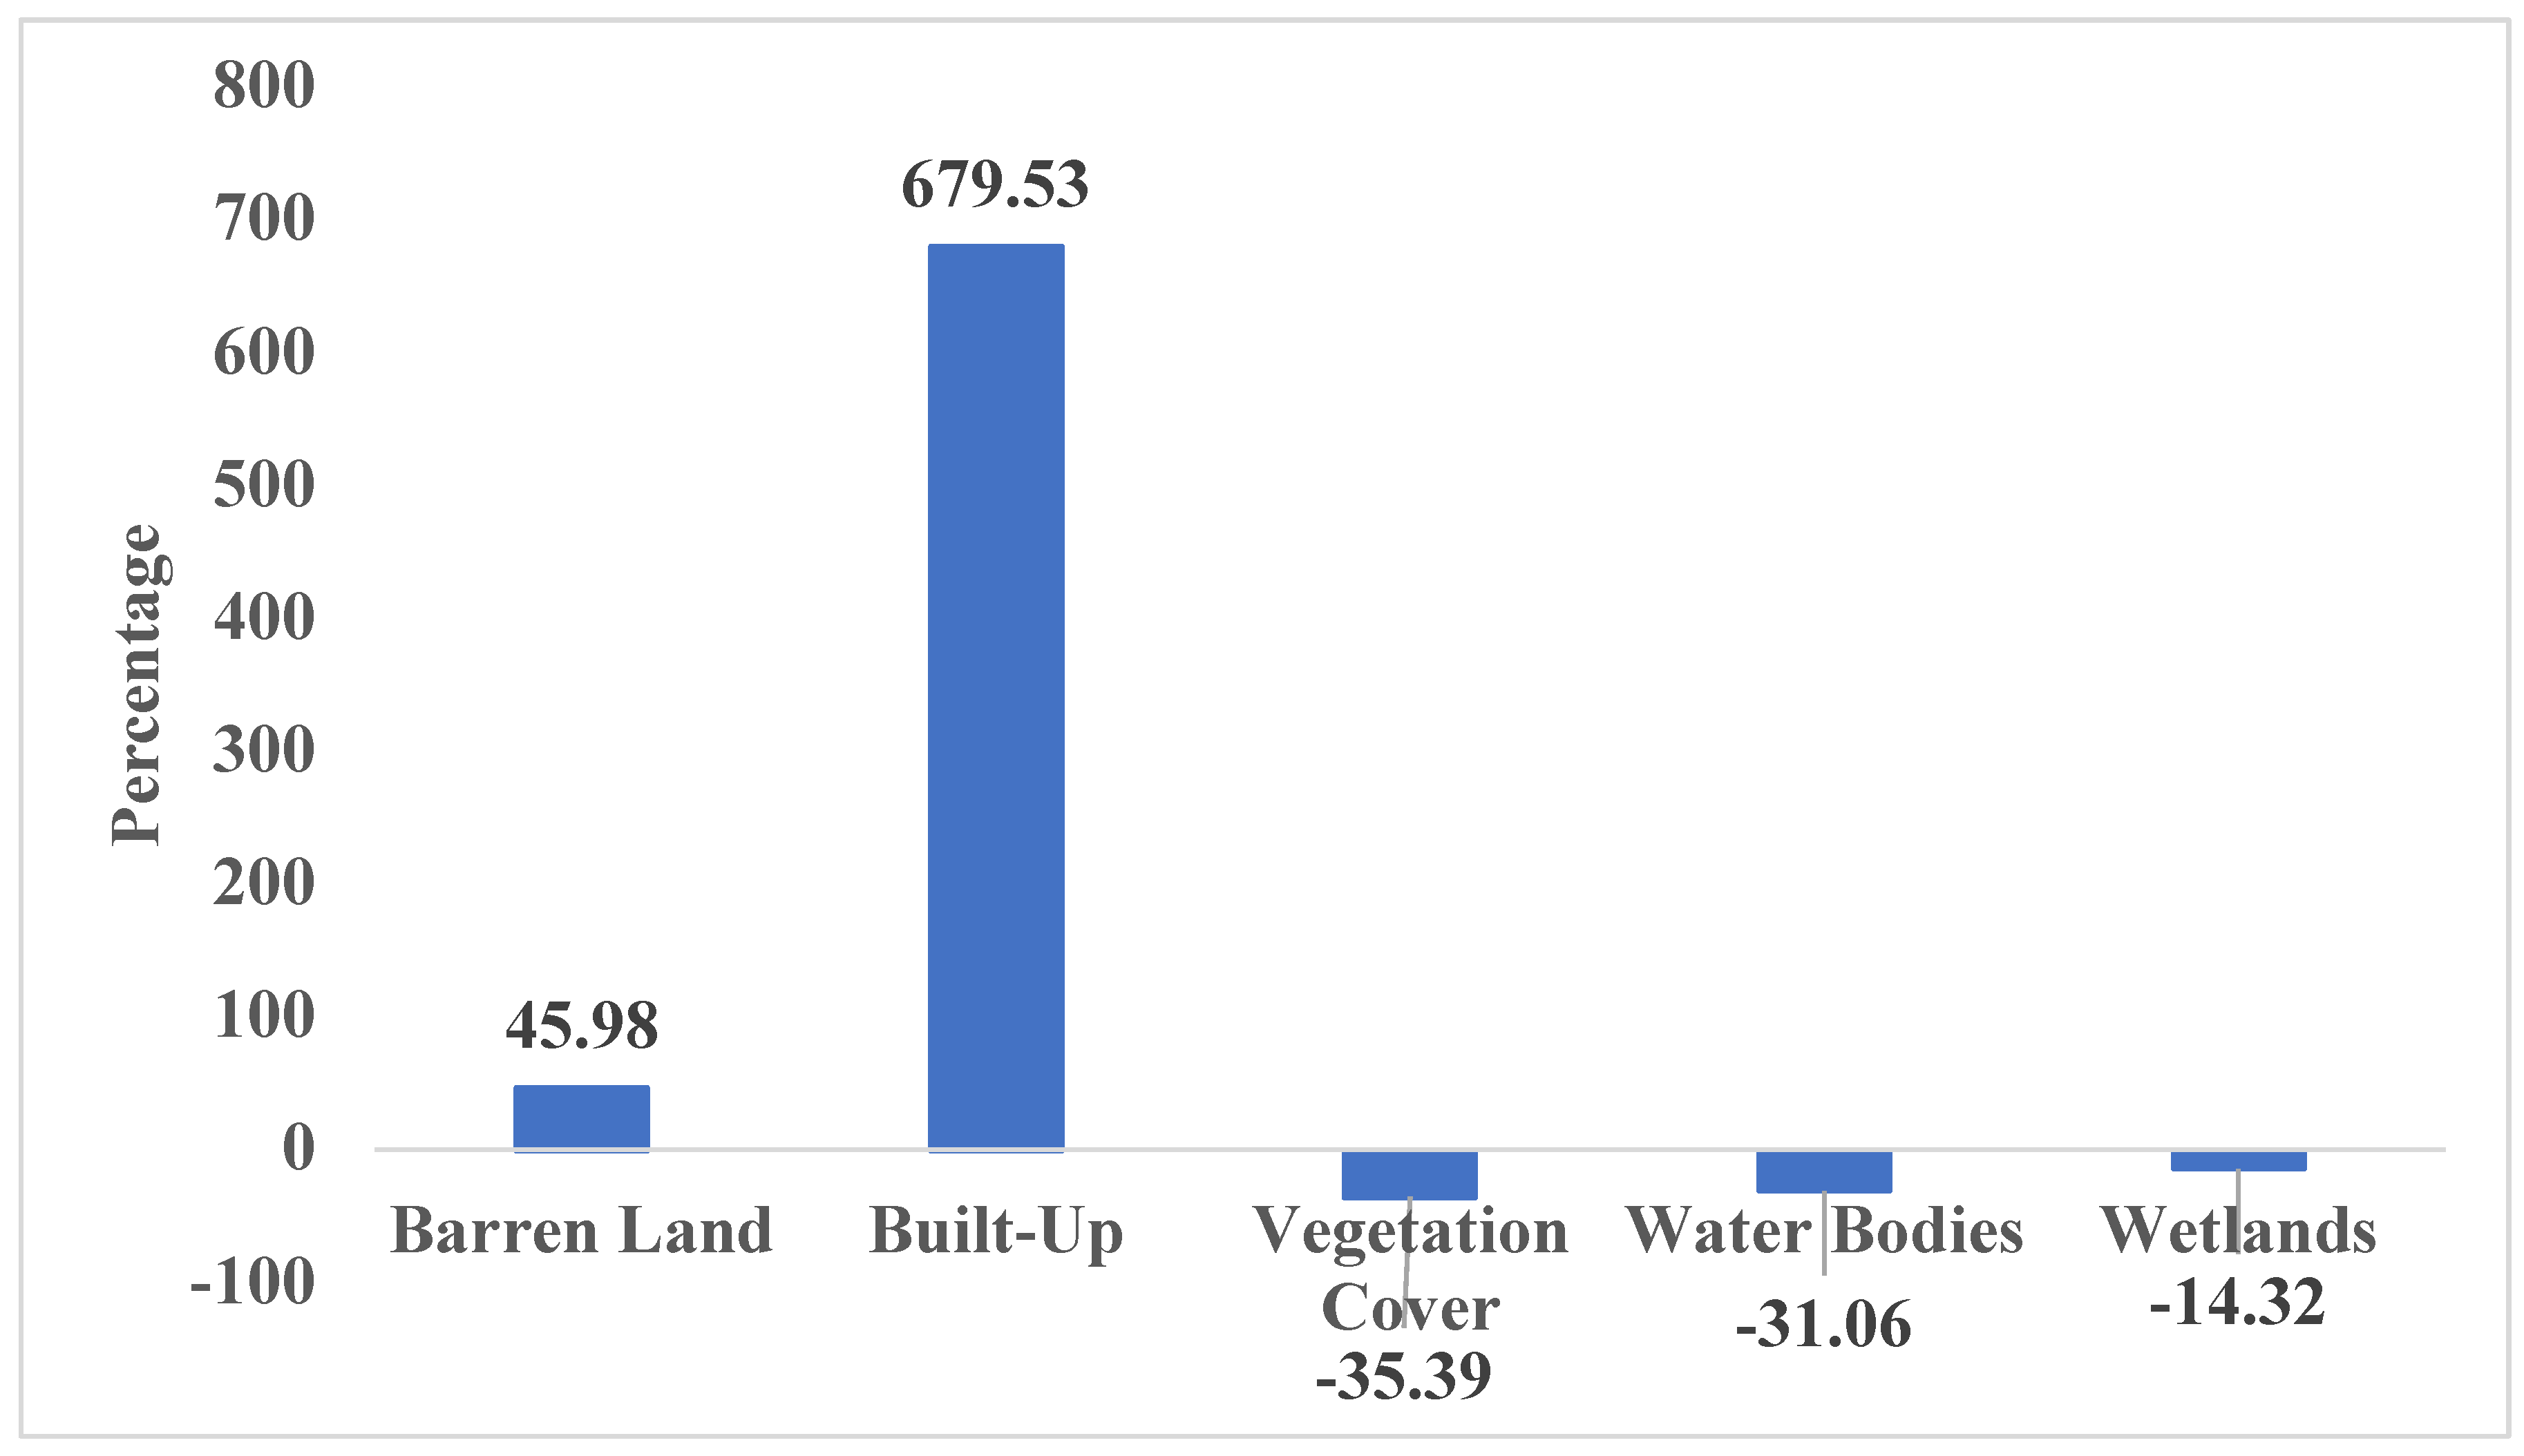
For 2020, the total measured land area of 939.38ha (Table 3 & Figure 5). This includes 393.4ha of barren land, 99.8ha of built-up, 351.4ha of vegetation cover, 9.2ha of water bodies and 85.6ha of wetlands, representing ()41.9%, 10.6%, 37.4%, 1.0% and 9.1% of barren land, built-up, vegetation cover, water bodies and wetlands, respectively (Table 3). In terms of percentage change in the land use land cover classes, there is an increase in barren land (46.0%) and built-up (679.5%) and a decrease in vegetation cover (-35.4%), water bodies (-31.1%) and wetlands (-14.3%) from 1990 to 2020 (Figure 8).
Figure 8.
Land use land cover Change of the Coastal Zone of The Gambia from 1990 to 2020 in Percentage.
Figure 8.
Land use land cover Change of the Coastal Zone of The Gambia from 1990 to 2020 in Percentage.
3.2. Relationship Between Land Use Land Cover Change and Population
Table 4 displays the Pearson correlation matrix for land use land cover change variables and the population living within 10-25km of coastline from 1990 to 2020. The results highlighted a significant association between some of the variables. Specifically, there is a significant correlation between barren land and vegetation cover at 5% significant level. There is a negative significant relationship between barren land and wetlands, built-up and vegetation cover and between built-up and water bodies at 5%, 10% and 10% significant levels respectively. While population had a positive correlation with built-up significant at a 5% significant level, it had a negative correlation with vegetation at 10% significant level. These relationships between the variables indicate that the increase in population along the coast is an essential factor that can describe the increases in built-up and the decrease in vegetation cover.
4. Discussion
The findings of this research have demonstrated that the coastal environment has undergone significant transformation because of multiple stressors within the last 30 years. The land use land cover map and the area under each land use land cover class calculated indicate the extent of modification for each of the land use land cover characteristics along the coastal zone of The Gambia from 1990 to 2020. Using the characteristics of land use land cover in 1990 as the base year, it was discovered that there are changes in all land use land cover classes. While barren land and built-up land use land covers have increased, there is a substantial reduction in vegetation cover, water bodies and wetlands. The increase in human population along the coastline is associated with increased built-up such as housing, health and education amenities and transport infrastructure to serve the needs of the growing population from 1990-2020. Herrmann, et al. (2020) explained that an increase in the coastal population of The Gambia will result in increased infrastructure development which will affect the coastal land use land cover patterns. The interviewed community members also expressed the impacts of population increases along the coastal areas which include loss of ecological services, beach erosion, saltwater intrusion into wells and farmlands, and loss of lives and properties.
Barren land has increased for the past 30 years along the coast and is observed to be significantly associated with a reduction of vegetation cover and wetlands. This is mainly due to deforestation and the activities of mining companies operating along the coast. Various researchers have established that as human continues to derive essential goods and services from the use of land and environments, the state of the degradation of the environments over time will be determined by the socioeconomic processes which alter their landscape (De Serio et al., 2018; Mahajan and Martinez, 2021). Abd El-Kawy et al. (2011) explained that mining and land alteration by anthropogenic activities for agricultural purposes and socioeconomic developments are key drivers of land modification in the Western Nile Delta of Egypt. The community members confirmed that the vegetation cover of the coastal areas has reduced over the years. For instance, in a focus group discussion, a member noted:
The forest cover and landscape have drastically changed due to human activities such as unregulated logging for fuel wood or charcoal, human settlement, urbanisation and industrial activities of real estate developers. This has impacted negatively not only on our environment but also our households’ discomfort including hot weather due to rising temperatures on land and in the sea (Focus Group Discussion, 2021).
The 680% increase in the built-up from 1990 to 2020 in The Gambia is a result of increased population along the coast. This study confirms that while population increase is associated with an increase in built-up to meet the demand of the growing population, it has also significantly caused the disappearance of most of the vegetation cover. Built-up has been identified as the utmost irreversible human impacts on the environment and ecosystems due to urbanisation and population growth, thereby, calling for more research and increased understanding of land use land cover transformation patterns occurring at local and international scales (Williams et al., 2019). The association between urbanisation and built-up also contributed to the land transformation patterns and loss of vegetation cover in The Gambia, thereby exposing coastal communities to climate change hazards and thus increasing their vulnerability to climate change. Similar results were found by Amuzu et al. (2018a, b) who argued that infrastructure development, population dynamics and land use land cover changes are among the elements that impact negatively on the coastal inhabitants and the environment. A community member during a focus group discussion also indicated that:
The reduction in vegetation cover has resulted in hotter temperatures on land and the sea, intrusion of salt water in our wells and farmlands and windstorms destroying our buildings (Focus Group Discussion, 2021).
The coastal zone of The Gambia which was dominated by vegetation cover of about 57% of total land use land cover in 1990 had experienced a significant reduction by 35% in 2020 mainly due to increased population thereby increasing the built-up and barren land. In other West African countries, mangroves and other vegetation cover along the coast are cleared to establish structures such as fish and shrimp ponds, human settlements, agriculture and industrial development (Creel, 2003). It was also stated during the survey that:
The mangrove vegetation along the coast is declining rapidly, which is believed to be associated with a high amount of salt intrusion and domestic uses such as firewood. The vegetation cover within the community is disappearing as increased residential infrastructure claimed most of the environment. The rice fields that were cultivated by women have all been converted to building infrastructure as the population continues to increase (Focus Group Discussion, 2021).
Since most of the coastal communities are located within the vicinity of water bodies such as estuaries, rivers and streams, the increase in built-up has resulted in shrinking the water bodies and wetlands over the last 30 years. This is believed to be a consequence of land and water use systems that are not only limited to settlement but for agriculture, mining, aquaculture, manufacturing industries, trade, tourism and transport infrastructure purposes. These occurrence put pressure on water bodies and wetlands along coastal areas (Lu et al., 2018; Tiando et al., 2021; Zerebecki et al., 2022). For Tiando et al. (2021), communities are grappling with the challenges of rapid unplanned urbanisation and resulting to the shrinking of water bodies and wetlands, pollution from waste disposal, encroachments, illegal mining activities and unplanned tourism activities. Also, the reduction of wetlands along the coast which was negatively associated with an increase in barren land and built-up from 1990 to 2020 indicates that environmental degradation exposes the coastal environment of The Gambia to the impact of erosion and eutrophication. As a result, sediments from the eroded areas when deposited in water bodies may also contribute to the shrinking of the aquatic ecosystems. For the community members, sand mining and other infrastructural development activities occurring along the shores are causing their water bodies to shrink and also causing erosion of the coast leading to loss of the essential benefits they used to obtain from these ecosystems in the past. For instance, some community members stated that:
The sand mining activities and uncontrolled dumping occurring in other parts of the coast are causing their water bodies to shrink leading to the loss of essential benefits such as the availability of shellfish, crabs and other seafood they obtained from these ecosystems over the past 30 years (Key informant interview, 2021).
The transformation of the beach has impacted us negatively by limiting our livelihood options and the economic activities that people engaged in along the beach. These include weaving fishing nets, fish smoking, and many different businesses because of the erosion and sea level rise we observed. Even some residential houses along the beach are affected. All this destruction started with the various projects from the building of the bridge to sand mining activities around other parts of the coastal zone (Focus Group Discussion, 2021).
5. Conclusions and Recommendations
The Gambia’s coastal landscape provides various socioeconomic activities including tourism, artisanal fishing, and cultural, aesthetic and religious for the coastal residents. These activities contribute 36% of the country’s GDP (Bojang et al., 2023). In addition, this environment also provides important ecosystem services, including habitats and breeding grounds for aquatic animals, plants and migratory birds. However, the region experiences various climate change hazards with negative consequences on the inhabitants and the environment. These are due to substantial modification of land use land cover which corresponds more with population growth along the 10-25km coastline. The extent of transformation for each of the land use land cover characteristics indicated an increase in the barren land by 46% and built-up by 680%, and a decrease in vegetation cover by 35%, water bodies by 31% and wetlands by 14% from 1990 to 2020. As the population increases along the coast, it exerts strong pressure on the coastal land by increasing the need for urbanisation which in turn increases the demand for infrastructure such as housing, health and education amenities, transport and utility infrastructure to serve the needs of the growing population. This along with land and water use systems along the coast have all put considerable pressure on the coastal landscape thereby increasing the vulnerability of coastal zone to climate change. This study indicated that several human-oriented activities in the coastal habitats require further understanding of their socioeconomic and ecological processes. Specifically, research into coastal vulnerability to climate change, building capacities of coastal inhabitants, and their adaptation and mitigation approaches. Therefore, the government of The Gambia and relevant stakeholders must consider population issues in formulating well-defined management goals for the long-term sustainability of the coastal ecosystems.
References
- Abd El-Kawy, O. R.; Rød, J. K.; Ismail, H. A.; Suliman, A. S. Land use and land use land cover change detection in the western Nile Delta of Egypt using remote sensing data. Applied geography 2011, 31(2), 483–494. [Google Scholar] [CrossRef]
- Amuzu, J.; Jallow, B. P.; Kabo-Bah, A. T.; Yaffa, S. The climate change vulnerability and risk management matrix for the coastal zone of the Gambia. Hydrology 2018a, 5(1), 14. [Google Scholar] [CrossRef]
- Amuzu, J.; Jallow, B. P.; Kabo-Bah, A. T.; Yaffa, S. The socio-economic impact of climate change on the coastal zone of the Gambia. Natural Resources and Conservation 2018b, 6(1), 13–26. [Google Scholar] [CrossRef]
- Amuzu, J.; Kabo-Bah, A. T.; Jallow, B. P.; Yaffa, S. Households’ livelihood vulnerability to climate change and climate variability: A case study of the Coastal zone, the Gambia. Journal of Environment and Earth Science 2018c, 8(1), 35–46. [Google Scholar]
- Banzaf, E.; Kabisch, S.; Knapp, S.; Rink, D.; Wolff, M.; Kindler, A. Integrated research on land-use changes in the face of urban transformation-an analytic framework for further studies. Land use policy 2017, 60, 403–407. [Google Scholar] [CrossRef]
- Belford, C.; Delin, H.; Ceesay, E.; Ahmed, Y. N.; Sanyang, L.; Jonga, R. H. The impact of climate change on economic growth based on time series evidence. Int. J. Hum. Capital Urban Manage 2020, 5(4), 305–318. [Google Scholar]
- Center for International Earth Science Information Network—CIESIN—Columbia University, and CUNY Institute for Demographic Research—CIDR—City University of New York. 2021. Low Elevation Coastal Zone (LECZ) Urban-Rural Population and Land Area Estimates, Version 3. Palisades, New York: NASA Socioeconomic Data and Applications Center (SEDAC). Accessed 6 November, 2022. [CrossRef]
- Creel, L. Ripple effects: population and coastal regions; Population pressure is a key driving force for land cover changes.; Population Reference Bureau, 2003; pp. 1–7. [Google Scholar]
- De Serio, F.; Armenio, E.; Mossa, M.; Petrillo, A. F. How to define priorities in coastal vulnerability assessment. Geosciences 2018, 8(11), 415. [Google Scholar] [CrossRef]
- Dermawan, D.; Wang, Y. F.; You, S. J.; Jiang, J. J.; Hsieh, Y. K. Impact of climatic and non-climatic stressors on ocean life and human health: A review. Science of The Total Environment 2022, 153387. [Google Scholar] [CrossRef] [PubMed]
- Dia Ibrahima, M. Vulnerability assessment of Central Coast Senegal Salou and The Gambia Marine Coast and estuary to climate change induced effects. In Coastal Resources Center and WWWF-WAMPO, University of Rhode Island; 40, 2012. [Google Scholar]
- Di Gregorio, A.; Jansen, L. J. Land cover Classification System (LCCS): Classification Concepts and User Manual; FAO, 2000. [Google Scholar]
- Ellis, E. Land use and ecological change: a 12,000-year history. Annual Review of Environment and Resources 2021, 46(1), 1–33. [Google Scholar] [CrossRef]
- GBOS. (2020). The Gambia Bureau of Statistics population data; Kanifing institutional layout.
- Gomez, M. L. A.; Adelegan, O. J.; Ntajal, J.; Trawally, D. Vulnerability to coastal erosion in The Gambia: Empirical experience from Gunjur. International Journal of Disaster Risk Reduction 2020, 45, 101439. [Google Scholar] [CrossRef]
- Hale, T. The role of sub-state and non-state actors in international climate processes. In Chatham House; Londres, 2018. [Google Scholar]
- Hale, T. N.; Chan, S.; Hsu, A.; Clapper, A.; Elliott, C.; Faria, P.; Widerberg, O. Sub-and non-state climate action: a framework to assess progress, implementation and impact. Climate Policy 2021, 21(3), 406–420. [Google Scholar] [CrossRef]
- Herrmann, S. M.; Brandt, M.; Rasmussen, K.; Fensholt, R. Accelerating land cover change in West Africa over four decades as population pressure increased. Communications Earth & Environment 2020, 1(1), 1–10. [Google Scholar]
- Hossain, M. S.; Gain, A. K.; Rogers, K. G. Sustainable coastal social-ecological systems: how do we define “coastal”? International journal of sustainable development & world ecology 2020, 27(7), 577–582. [Google Scholar]
- Hsu, A.; Höhne, N.; Kuramochi, T.; Vilariño, V.; Sovacool, B. K. Beyond states: Harnessing sub-national actors for the deep decarbonisation of cities, regions, and businesses. Energy Research & Social Science 2020, 70, 101738. [Google Scholar]
- IPCC. (2021). Climate Change 2021: The Physical Science Basis. Contribution of Working Group I to the Sixth Assessment Report of the Intergovernmental Panel on Climate Change [Masson-Delmotte, V., P. Zhai, A. Pirani, S.L. Connors, C. Péan, S. Berger, N. Caud, Y. Chen, L. Goldfarb, M.I. Gomis, M. Huang, K. Leitzell, E. Lonnoy, J.B.R. Matthews, T.K. Maycock, T. Waterfield, O. Yelekçi, R. Yu, and B. Zhou (eds.)]. Cambridge University Press, Cambridge, United Kingdom and New York, NY, USA, 2391 pp.
- Jaiteh, M. S., & Sarr, B. (2011). Climate change and development in The Gambia: challenges to ecosystem goods and services. Center for International Earth Science Information Network (CIESIN), The Earth Institute, Columbia University & International College of Business and Human Resource Development (ICOBAHRD): Kanifing, The Gambia.
- Komugabe-Dixson, A. F.; de Ville, N. S.; Trundle, A.; McEvoy, D. Environmental change, urbanisation, and socio-ecological resilience in the Pacific: Community narratives from Port Vila, Vanuatu. Ecosystem Services 2019, 39, 100973. [Google Scholar] [CrossRef]
- Mahajan, S.; Martinez, J. Water, water, but not everywhere: Analysis of shrinking water bodies using open access satellite data. International Journal of Sustainable Development and World Ecology 2021, 28(4), 326–338. [Google Scholar] [CrossRef]
- Manda, S.; Islam, Md. S.; Biswas, Md. H. A. Modeling the potential impact of climate change on living beings near coastal areas. Modeling Earth Systems and Environment 2021. [Google Scholar] [CrossRef]
- NEA (2010). State of the Environment Report The Gambia, Second. Ed. National Environment Agency, Kanifing, The Gambia.
- Ofori, S. A.; Cobbina, S. J.; Obiri, S. Climate change, land, water, and food security: Perspectives From Sub-Saharan Africa. Frontiers in Sustainable Food Systems 2021, 5, 680924. [Google Scholar] [CrossRef]
- Ostrowski, A.; Connolly, R.M.; Sievers, M. Evaluating multiple stressors research in coastal wetlands: a systematic review. Marine Environmental Research 2021, 164, 105239. [Google Scholar] [CrossRef] [PubMed]
- Reside, A. E.; Butt, N.; Adams, V. M. Adapting systematic conservation planning for climate change. Biodiversity and Conservation 2018, 27(1), 1–29. [Google Scholar] [CrossRef]
- Ridha, T.; Ross, A. D.; Mostafavi, A. Climate change impacts on infrastructure: Flood risk perceptions and evaluations of water systems in coastal urban areas. International Journal of Disaster Risk Reduction 2022, 73, 102883. [Google Scholar] [CrossRef]
- Riede, J. O.; Posada, R.; Fink, A. H.; Kaspar, F. What’s on the 5th IPCC Report for West Africa? In Adaptation to climate change and variability in rural West Africa; Springer, Cham, 2016; pp. 7–23. [Google Scholar]
- Tiando, D. S.; Hu, S.; Fan, X.; Ali, M. R. Tropical coastal land-use and land use land cover changes impact on ecosystem service value during rapid urbanisation of Benin, West Africa. International Journal of Environmental Research and Public Health 2021, 18(14), 7416. [Google Scholar] [CrossRef]
- Wei, X.; Li, Q.; Zhang, M.; Giles-Hansen, K.; Liu, W.; Fan, H.; Liu, S. Vegetation cover-another dominant factor in determining global water resources in forested regions. Global change biology 2018, 24(2), 786–795. [Google Scholar] [CrossRef]
- Williams, D. S.; Máñez Costa, M.; Sutherland, C.; Celliers, L.; Scheffran, J. Vulnerability of informal settlements in the context of rapid urbanisation and climate change. Environment and Urbanisation 2019, 31(1), 157–176. [Google Scholar] [CrossRef]
- Zerebecki, R. A.; Heck, K. L., Jr.; Valentine, J. F. Biodiversity influences the effects of oil disturbance on coastal ecosystems. Ecology and evolution 2022, 12(1), e8532. [Google Scholar] [CrossRef] [PubMed]
- Zhou, Y.; Chen, M.; Tang, Z.; Mei, Z. Urbanisation, land use change, and carbon emissions: Quantitative assessments for city-level carbon emissions in Beijing-Tianjin-Hebei region. Sustainable Cities and Society 2021, 66, 102701. [Google Scholar] [CrossRef]
Figure 1.
Map of The Coastal Zone of The Gambia.
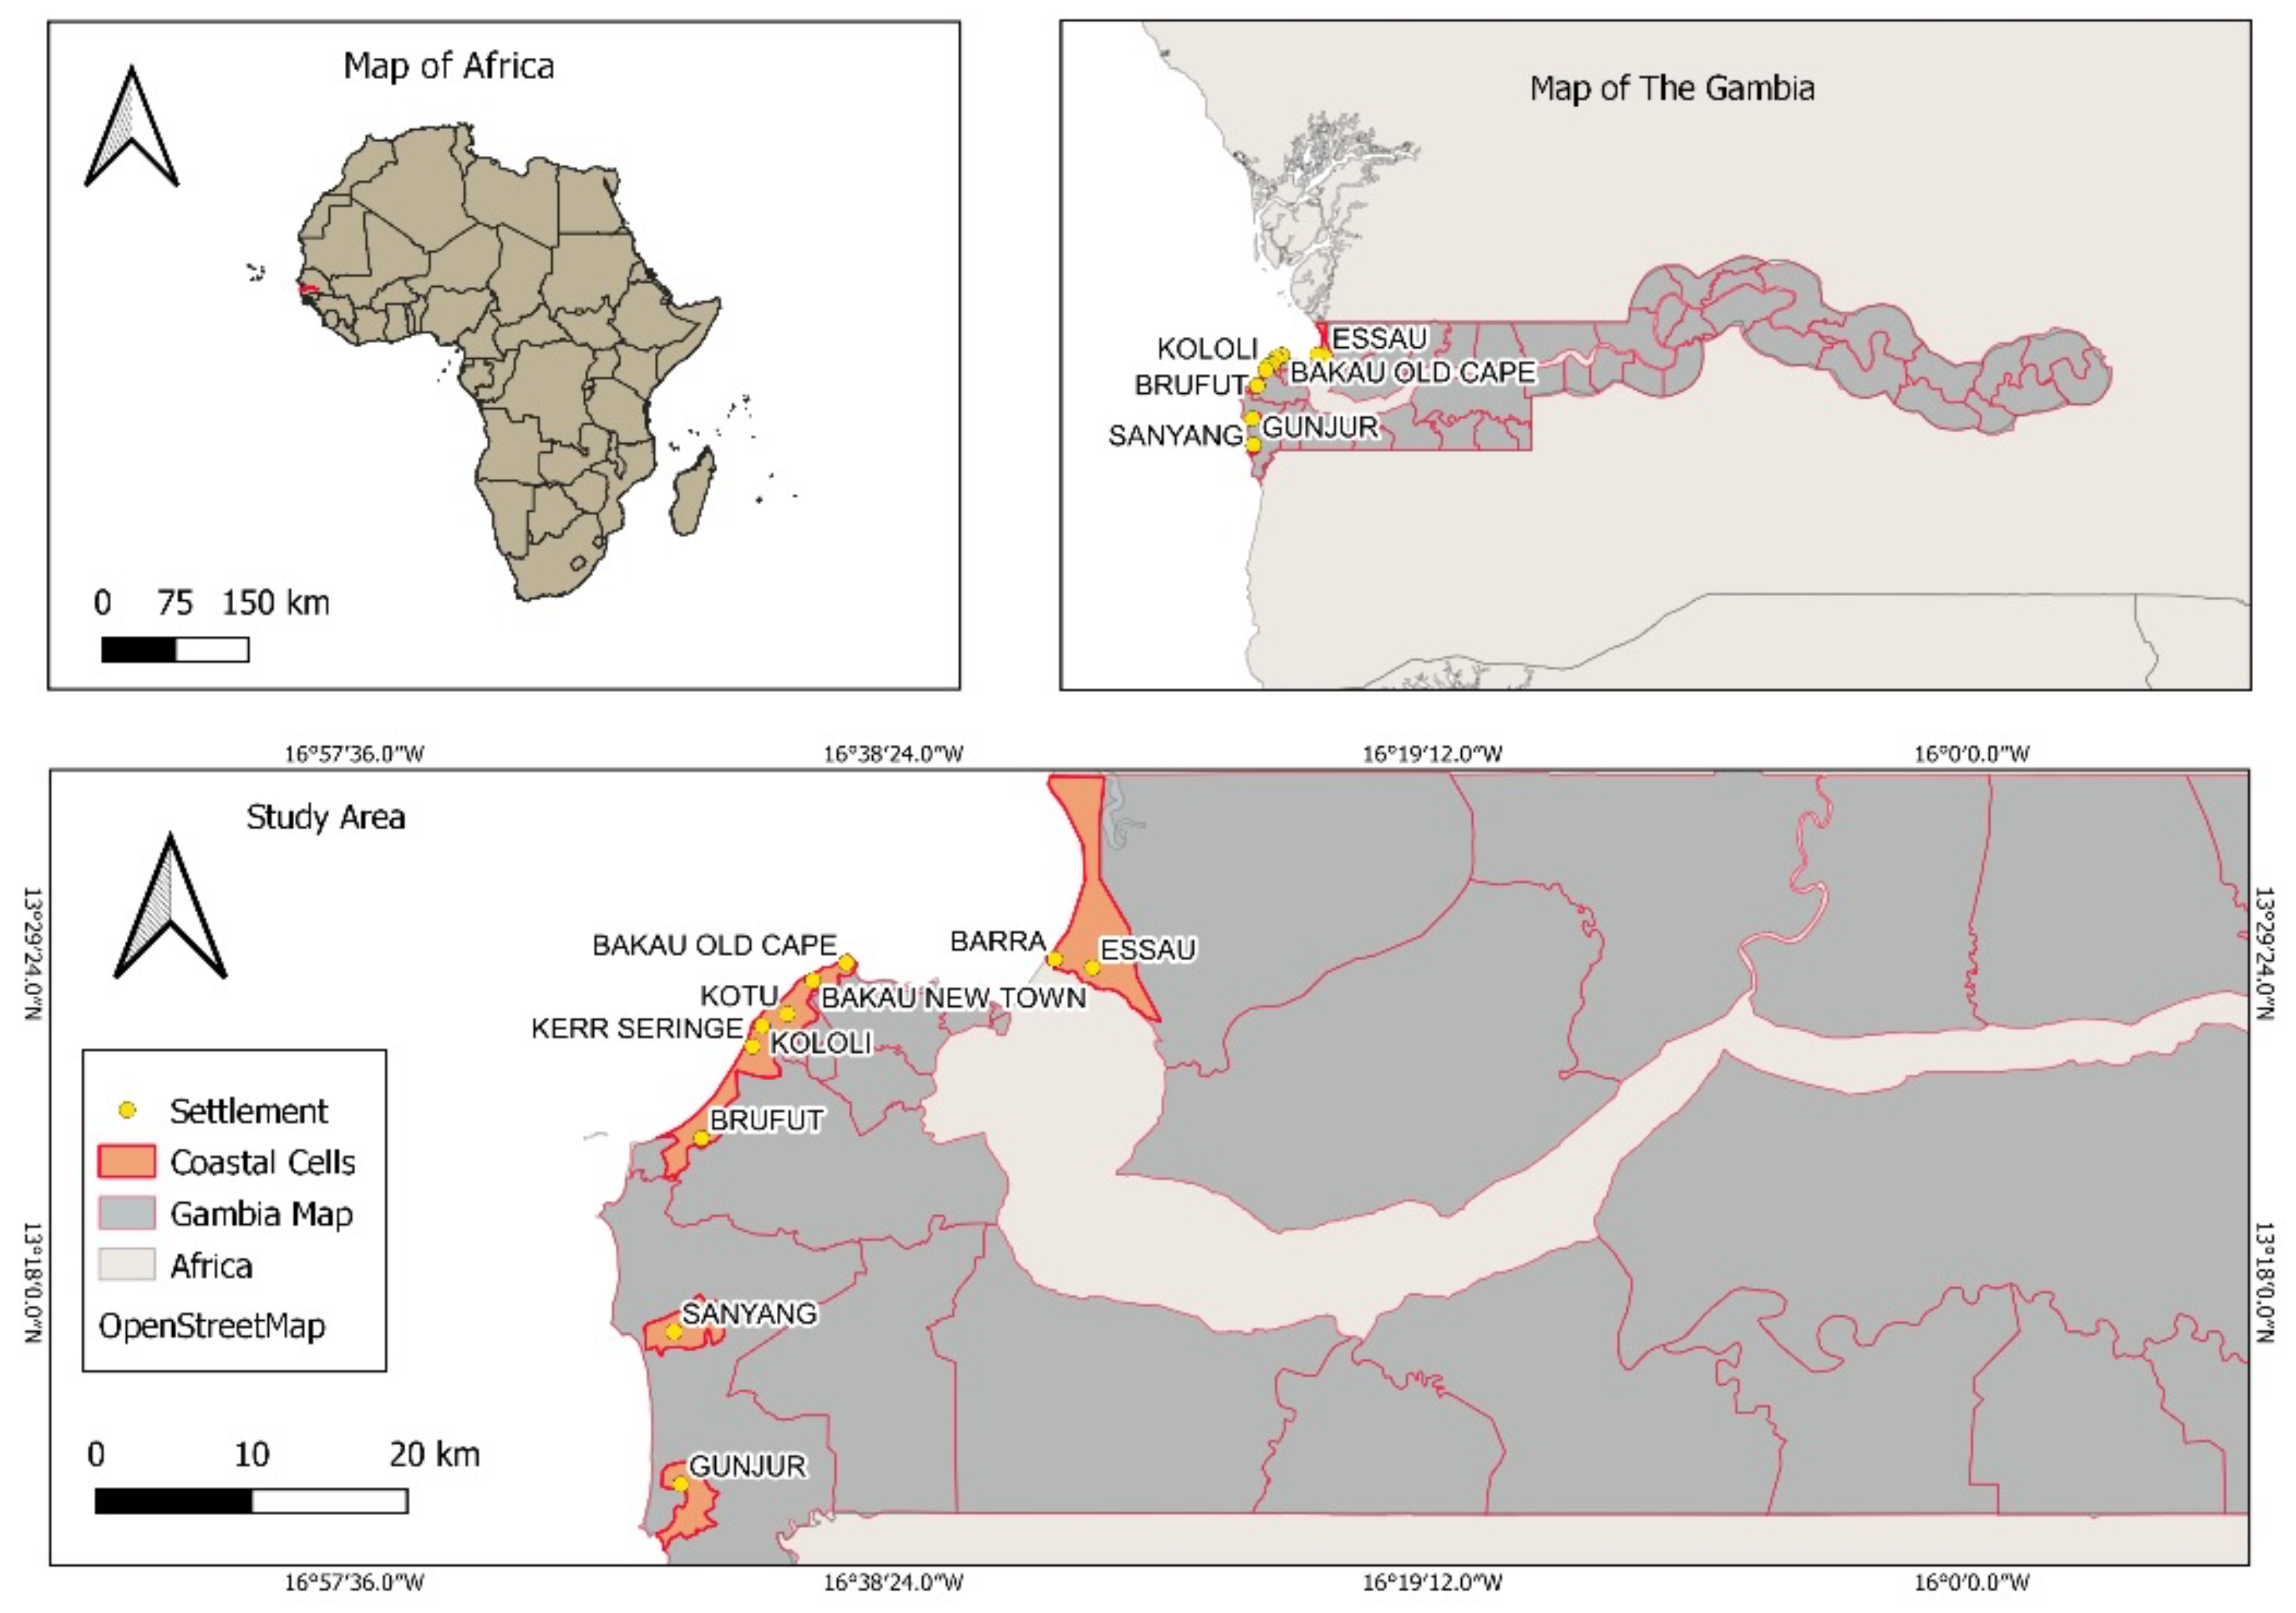
Figure 2.
Land use land cover change map of the coastal zone of The Gambia for 1990.
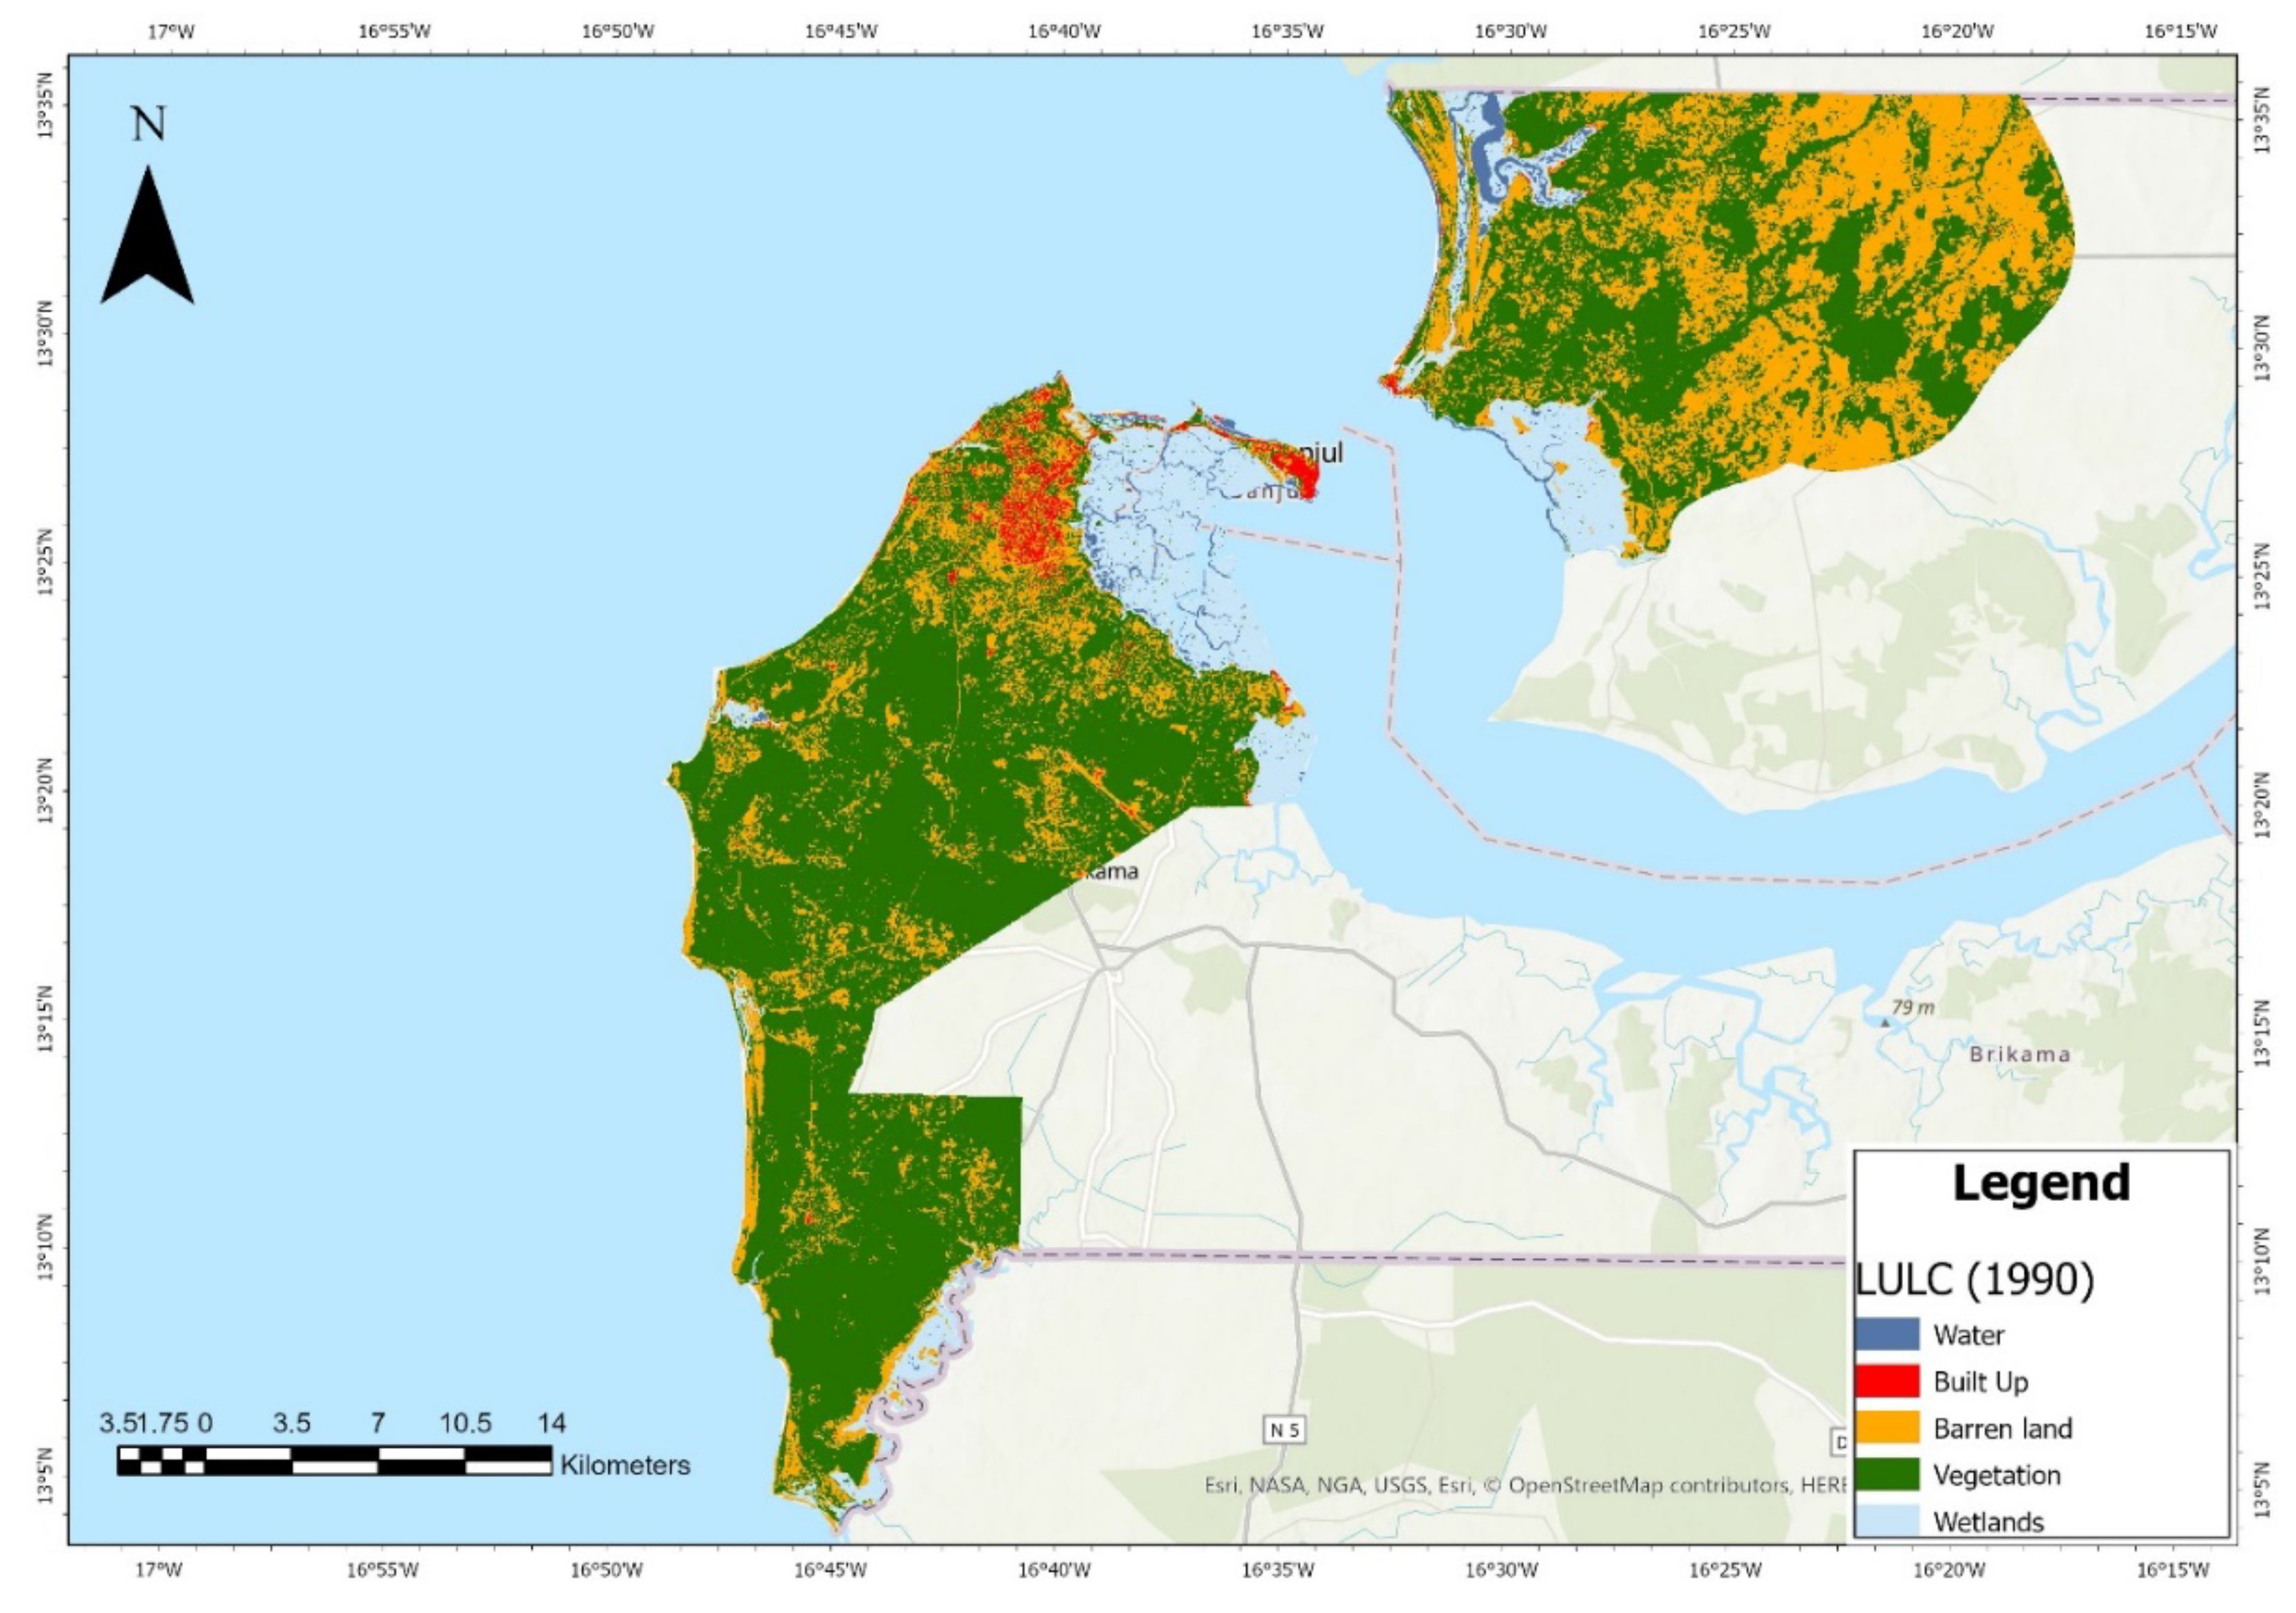

Table 1.
Satellite data type and their characteristics .
| Satellite | Sensor | Year | Spatial Resolution | Acquisition Date | Path/Row |
|---|---|---|---|---|---|
| Landsat 5 | TM | 1990 | 30 | 11/03/1990 | 205/051 |
| Landsat 7 | ETM+ | 2000 | 30 | 11/06/2000 | 205/051 |
| Landsat 7 | ETM+ | 2010 | 30 | 12/20/2010 | 205/051 |
| Landsat 8 | OLI/TIRS | 2020 | 30 | 11/21/2020 | 205/051 |
Table 2.
population of coastal zone 1990 to 2020.
| Date | Population of the Gambia | Pop | % of the population living within 10-25km of the coast | % increase of population living within 10-25km of the coast from 1990 to 2020 |
|---|---|---|---|---|
| 1990 | 1040616 | 303662 | 29.18% | 213% |
| 2000 | 1437539 | 454531 | 31.62% | |
| 2010 | 1937275 | 606345 | 31.30% | |
| 2020 | 2573995 | 950010 | 36.91% |
Source: Center for International Earth Science Information Network (CIESIN), Columbia University (2012); The Gambia Bureau of Statistics (2020).
Table 3.
Land use land cover change statistics from 1990 to 2020.
| Land use land cover Classes | LC_1990 (ha) |
LC_1990 (%) |
LC_2000 (ha) |
LC_2000 (%) |
LC_2010 (ha) |
LC_2010 (%) |
LC_2020 (ha) |
LC_2020 (%) |
|---|---|---|---|---|---|---|---|---|
| Barren land | 269.44 | 28.69 | 364.23 | 38.77 | 393.11 | 41.85 | 393.42 | 41.88 |
| Built-up | 12.8 | 1.36 | 39.78 | 4.23 | 47.93 | 5.10% | 99.8 | 10.62 |
| Vegetation cover | 543.85 | 57.91 | 432.48 | 46.04 | 399.66 | 42.55 | 351.44 | 37.41 |
| Waterbodies | 13.27 | 1.41 | 13.02 | 1.39% | 13.48 | 1.44 | 9.15 | 0.97 |
| Wetlands | 99.84 | 10.63 | 89.85 | 9.57% | 85.15 | 9.07% | 85.56 | 9.11 |
| Total | 939.19 | 100% | 939.36 | 100% | 939.32 | 100% | 939.38 | 100% |
Table 4.
Correlation between land use land cover change class and population of the coastal zone of The Gambia from 1990 to 2020.
Table 4.
Correlation between land use land cover change class and population of the coastal zone of The Gambia from 1990 to 2020.
| Variables | Barren | Built-up | Vegetation | Waterbodies | Wetlands | Population |
|---|---|---|---|---|---|---|
| Barren | 1 | |||||
| Built-up | 0.7683 | 1 | ||||
| Vegetation | -0.9653** | -0.9089* | 1 | |||
| Water | -0.4197 | -0.9006* | 0.6416 | 1 | ||
| Wetlands | -0.9964** | -0.7717 | 0.9640** | 0.4195 | 1 | |
| Population | 0.7739 | 0.9910** | -0.9082* | -0.8724 | -0.7882 | 1 |
** Correlation is significant at the 0.05 level (2-tailed test). * Correlation is significant at the 0.10 level (2-tailed test).
Disclaimer/Publisher’s Note: The statements, opinions and data contained in all publications are solely those of the individual author(s) and contributor(s) and not of MDPI and/or the editor(s). MDPI and/or the editor(s) disclaim responsibility for any injury to people or property resulting from any ideas, methods, instructions or products referred to in the content. |
© 2025 by the authors. Licensee MDPI, Basel, Switzerland. This article is an open access article distributed under the terms and conditions of the Creative Commons Attribution (CC BY) license (http://creativecommons.org/licenses/by/4.0/).
Copyright: This open access article is published under a Creative Commons CC BY 4.0 license, which permit the free download, distribution, and reuse, provided that the author and preprint are cited in any reuse.


