
Submitted:
07 January 2025
Posted:
07 January 2025
You are already at the latest version
Abstract
Evapotranspiration (ET) refers to the total water vapor flux transported by vegetation and surface soil to the atmosphere. It is not only an important component of water and heat regulation, but also has an impact on plant productivity, water cycle, and other processes. Understanding the spatiotemporal distribution characteristics of ET in the Mongolian Plateau is of great significance for water resource regulation, as it is characterized by drought and uneven distribution of rainwater resources. This study calculated the spatiotemporal distribution characteristics of actual ET in the Mongolian Plateau based on the SFE-NP model, and generated a surface ET dataset with a spatial resolution of 1km and a temporal resolution of monthly from 2001 to 2020 in the Mongolian Plateau region. The correlation coefficient R, determination coefficient R2, and root mean square error RMSE between this dataset and the ERA5_Land ET dataset were 0.78, 0.62, and 0.97, respectively, indicating that this dataset has high accuracy and reliable estimation results. This dataset can provide data support for research and applications such as surface water resource allocation and livestock regulation in the Mongolian Plateau, which helps to finely grasp the distribution pattern of water resource consumption in the Mongolian Plateau.
Keywords:
Mongolian Plateau
; evapotranspiration
; SFE-NP model
; water resources
; data products
1. Introduction
Evapotranspiration (ET) refers to the total water vapor flux transported from surface soil and vegetation to the atmosphere[1], mainly including the evaporation of soil moisture and the transpiration of vegetation towards water[2]. ET not only affects the interaction between the "geosphere biosphere atmosphere" [3], but is also a key element for energy and water vapor transmission and exchange [12], and is one of the important indicators for evaluating the hydrothermal regulation function [4]. Surface ET consumes 50% of solar radiation [17], and over 60% of atmospheric precipitation is returned to the atmosphere through ET [18], making it an important component of the terrestrial water cycle. Therefore, accurate estimation of ET plays an important role in climate change simulation and water resource management, and other application areas.
Due to the inability of flux observation points to meet the needs of large-scale observations, satellite remote sensing data is commonly used to invert surface parameters for ET evaluation. The commonly used models include Penman Monteith model [13], SEBS model [14], Priestley Taylor model [15], empirical statistical model [16], etc. The Penman Monteith model is a combination of reference ET and crop coefficients to estimate actual ET, but impedance parameters are difficult to obtain or calculate [5]. Although the Priestley Taylor model is widely used in calculating potential ET, it has more limitations when calculating actual ET and requires certain adjustments to the coefficients [21]; The SEBS model, including other single source models, is suitable for areas with simple and single underlying surfaces, but its accuracy is poor in areas with low vegetation coverage [20], and the acquisition and processing of surface parameters are complex. Empirical determination of dry and wet edges varies from person to person [6]. Although non parametric calculation of ET can avoid the uncertainty caused by changes in impedance parameters on the calculation results, there are still significant errors in arid areas [7]. The non parametric ET estimation method based on surface flux balance theory (SFE-NP model) will effectively improve its applicability in arid regions.
The Mongolian Plateau has a temperate continental climate and is located in an arid and semi-arid region with uneven distribution of water and heat, low rainfall and fragile ecological environment [8]. It is particularly sensitive to changes in climate and environment [9]. Water resources also restrict the development of animal husbandry and social economy in arid areas [10]. Therefore, accurate estimation of evapotranspiration over the Mongolian Plateau is of great significance for rational allocation of regional water resources, drought monitoring and agricultural precision irrigation [19]. Based on the data of surface temperature, mean relative humidity and net solar radiation, this study calculated the actual evapotranspiration data set of the Mongolian plateau from 2001 to 2020 based on the SFE-NP model.
2. Data Description
2.1. Distribution of Data Space and Composition of Results
This dataset includes the Mongolian Plateau surface evapotranspiration dataset with a spatial resolution of 1km from 2001 to 2020. Including monthly and annual products, there are a total of 272 data files in TIF format. The geographical area is 87 ° 40 ′ E-122 ° 15 ′ E, 37 ° 46 ′ N-53 ° 08 ′ N, including the entire territory of Mongolia and Inner Mongolia Autonomous Region of China.
The naming convention for the surface ET dataset based on the SFE-NP model in the Mongolian Plateau from 2001 to 2020 is as follows: ETYYYYMM.TIF, ET_sum_YYYY.TIF, Such as ET200101.TIF, ET_sum_2001.TIF, ET01.TIF. ET represents the 1km spatial resolution ET data of the Mongolian Plateau, YYYY represents the year, MM represents the month, sum_YYYY represents the annual ET data, and TIF represents the data visualization format. The geographic coordinate system of the ET dataset is , and the projection coordinate system is . The spatial distribution of annual average ET on the Mongolian Plateau from 2001 to 2020, calculated based on the SFE-NP model, is shown in Figure 1, and the monthly average spatial distribution pattern is shown in Figure 2.
2.2. Data Result Verification
In order to ensure the accuracy of the surface ET dataset, this study selected 8 sites in the Mongolian Plateau and used the ERA5-Land total evaporation dataset to test the dataset using correlation coefficient R, determination coefficient R2, and root mean square error RMSE. The test results are shown in Table 1, which are relatively accurate.
Methods
3.1. Data Sources
The relative humidity and average temperature dataset are sourced from the National Earth System Science Data Center, the dataset on surface net solar radiation and ET validation dataset are sourced from ERA5-Land, with a spatial resolution of 1km and a temporal resolution of monthly, from 2001 to 2020;
The data on surface temperature and surface emissivity are sourced from LAADS DAAC from 2001 to 2020, using the MOD11A2 dataset with a spatial resolution of 1km and a temporal resolution of 8 days.
3.2. Data Processing Methods
MOD11A2 band data of surface temperature and surface emissivity, as well as ERA5-Land surface net radiation and ET verification data, were used to preprocess the above dataset; The raster data was clipped to the Mongolian Plateau, outliers were removed and empty values were filled, and the required units were converted by corresponding scaling factors, and the time scale was converted to the monthly scale.
The specific process mentioned above is shown in Figure 3.
3.3. SFE-NP model calculation
This dataset uses data on average temperature, average relative humidity, net solar radiation, etc. from 2001 to 2022 to calculate the actual ET of the Mongolian Plateau based on the SFE-NP model:
In the formula, is the actual ET, is the average relative humidity(), is the saturated vapor pressure gradient, is the dry wet bulb constant, is the net surface radiation, is the soil heat flux, is the surface emissivity, is the Boltzmann constant, is the surface temperature, and is the average temperature.
The calculation formula for geothermal flux G is:
is the average geothermal flux for the current month(); is the average temperature of the current month, and is the average temperature of the previous month.
The formula for calculating the slope of the saturated vapor pressure curve is:
T is the average temperature; is the saturated vapor pressure (kPa) at temperature T.
The calculation formula for saturated vapor pressure is:
The formula for calculating the dry wet bulb constant is:
is the specific heat of moist air(); P is atmospheric pressure (kPa); is a constant with a value of 0.622; is the latent heat of evaporation, and the calculation formula is: 。
The specific calculation process of model and factors in the formula is shown in Figure 4.
4. Discussion
ET is a key variable in the water cycle process, which not only reflects the feedback effect of ecosystems on the climate system, but also provides important reference value for the utilization of water resources [11]. This study calculated a 1km resolution ET dataset of the Mongolian Plateau from 2001 to 2020 based on the SFE-NP model and data such as surface temperature, average relative humidity, and net solar radiation. The dataset includes monthly and annual products, which can be used to analyze the spatial pattern and trend of ET in the Mongolian Plateau, as well as to calculate the sensitivity contribution of meteorological data to ET. This dataset has significant value for water resource management, livestock development, and grassland resource regulation in the Mongolian Plateau.
The SFE-NP model not only improves the applicability of traditional energy balance models in arid areas [7], but also significantly enhances the calculation accuracy in arid areas. It can also meet the calculation of long-term and large-scale ET, avoiding calculation errors caused by impedance parameters and other issues. However, the SFE-NP model also has the disadvantage of not being able to perform more detailed calculations on specific underlying surfaces, such as areas without vegetation cover and areas with dense vegetation cover. Small scale evaporation can be calculated using a targeted model for the underlying surface.
5. Data Usage Methods and Suggestions
The surface ET dataset for the Mongolian Plateau from 2001 to 2020, derived from the SFE-NP model, has a spatial resolution of 1 km. This dataset includes GeoTiff format raster files generated by UTM projection, which can be read and used in ArcGIS environment or programming software such as Matlab.
Author Contributions
All authors have read and agreed to the published version of the manuscript.
Funding
Acknowledgement for the support of the Science &Technology Fundamental Resources Investigation Program (Grant NO2023FY100700), the CAS-ANSO Sustainable Development Research Program in Mongolia (CAS-ANSO-SDRP-2024-08), and Construction Project of China Knowledge Centre for Engineering Sciences and Technology (CKCEST-2023-1-5).
Data Availability Statement
The dataset is available in Zenodo (https://zenodo.org/records/14601116).
Conflicts of Interest
The authors declare no conflicts of interest.
References
- Yao Y , Liang S , Li X ,et al.Improving global terrestrial evapotranspiration estimation using support vector machine by integrating three process-based algorithms[J].Agricultural & Forest Meteorology, 2017. [CrossRef]
- Ersi C, Bayaer T, Bao Y, et al. Temporal and spatial changes in evapotranspiration and its potential driving factors in mongolia over the past 20 years[J]. Remote Sensing, 2022, 14(8): 1856.
- Li T S, Xia J, She D X, et al. Quantifying the Impacts of Climate Change and Vegetation Variation on Actual Evapotranspiration Based on the Budyko Hypothesis in North and South Panjiang Basin, China[J]. Water, 2020, 12(2): 508.
- Xuanlan Z , Junbang W , Hui Y ,et al.The Bowen Ratio of an Alpine Grassland in Three-River Headwaters, Qinghai-Tibet Plateau, from 2001 to 2018[J].Journal of Resources and Ecology, 2021, 12(3). [CrossRef]
- Mu Q , Zhao M , Running S W .Improvements to a MODIS global terrestrial evapotranspiration algorithm[J].Remote Sensing of Environment: An Interdisciplinary Journal, 2011(8):115.
- Liu Y , Qiu G , Zhang H ,et al.Shifting from homogeneous to heterogeneous surfaces in estimating terrestrial evapotranspiration: Review and perspectives[J].SCIENCE CHINA Earth Sciences, 2022, 65(2):197-214.
- Pan X, Yang Z, Liu YB, et al.A non-parametric method combined with surface flux equilibrium for estimating terrestrial evapotranspiration: Validation at eddy covariance sites[J].JOURNAL OF HYDROLOGY, 2024. [CrossRef]
- Zhang Yan-Zhen, WANG Zhao-Qi, Yang Yue, et al. Quantitative study on spatial and temporal distribution of grassland degradation in Mongolia Plateau [J]. Pratacultural Science, 2018, 35(2): 233-243.
- Chen Z, Zhang X, Cui M, et al. Tree-ring based precipitation reconstruction for the forest–steppe ecotone in northern Inner Mongolia, China and its linkages to the Pacific Ocean variability[J]. Global and Planetary Change, 2012, 86: 45-56.
- Li Wanming, Huang Chengqi. Research on the Matching of Water Resource Utilization and Economic Factors in the Arid Northwest Region [J]. Water saving Irrigation, 2018 (7): 88-93.
- Yayong X,Haibin L,Haozhe Z, et al. Quantifying the policy-driven large scale vegetation restoration effects on evapotranspiration over drylands in China[J]. Journal of Environmental Management,2023,345.
- WANG Z, ZHANG R R, ZHANG Y. Temporal and spatial variation characteristics and impact analysis of evapotranspiration and its components in Poyang Lake Basin based on SWH dual-source model[J]. China Rural Water and Hydropower, 2023(11): 52-63.
- WANG Y P, A L, ZHOU L, et al. Ecological water conveyance effect in the lower reaches of Tarim River[J]. Journal of Desert Research, 2023, 43(4): 231-240.
- WANG L X, XIA P Y, YANG X, et al. Spatial-temporal inversion of evapotranspiration in the Weihe River Basin and its response to human activities[J]. Water Resources and Hydropower Engineering, 2023, 54(12): 120-132.
- YANG F, LIU X F, LIU Z D, et al. Research on the changes in water and heat flux summer corn season in northern Henan Province based on Priestley Taylor model[J]. Water Saving Irrigation, 2023(11): 115-120+129.
- SEGUIN B, ITIER B. Using midday surface temperature to estimate daily evaporation from satellite thermal IR data[J]. International Journal of Remote Sensing, 1983, 4(2): 371-383.
- TRENBERTH K E, FASULLO J T, KIEHL J. Earth’s global energy budget[J]. Bulletin of the American Meteorological Society, 2009, 90(3): 311–324. [CrossRef]
- Shi Guihua, Yun Wenli, Cui Shilin. Analysis of actual evapotranspiration and its meteorological factors in typical grasslands of Inner Mongolia [J]. Inner Mongolia Meteorology,2022,(06):18-23.
- Liu Yuanbo, Qiu Guoyu, Zhang Hongsheng, etc. Theoretical Methods for Measuring Land Evapotranspiration: Review and Prospect [J]. Chinese Science: Earth Science, 2022, 52 (3): 381-399.
- TIMMERMANS W J, KUSTAS W P, ANDERSON M C, et al. An intercomparison of the Surface Energy Balance Algorithm for Land (SEBAL) and the Two-Source Energy Balance (TSEB) modeling schemes[J]. Remote Sensing of Environment, 2007, 108(4): 369-384.
- FISHER J B, TU K P, BALDOCCHI D D. Global estimates of the land–atmosphere water flux based on monthly AVHRR and ISLSCP-II data, validated at 16 FLUXNET sites[J]. Remote Sensing of Environment, 2008, 112(3): 901–919. [CrossRef]
Figure 1.
Spatial distribution of average annual ET in the Mongolian Plateau from 2001 to 2020.
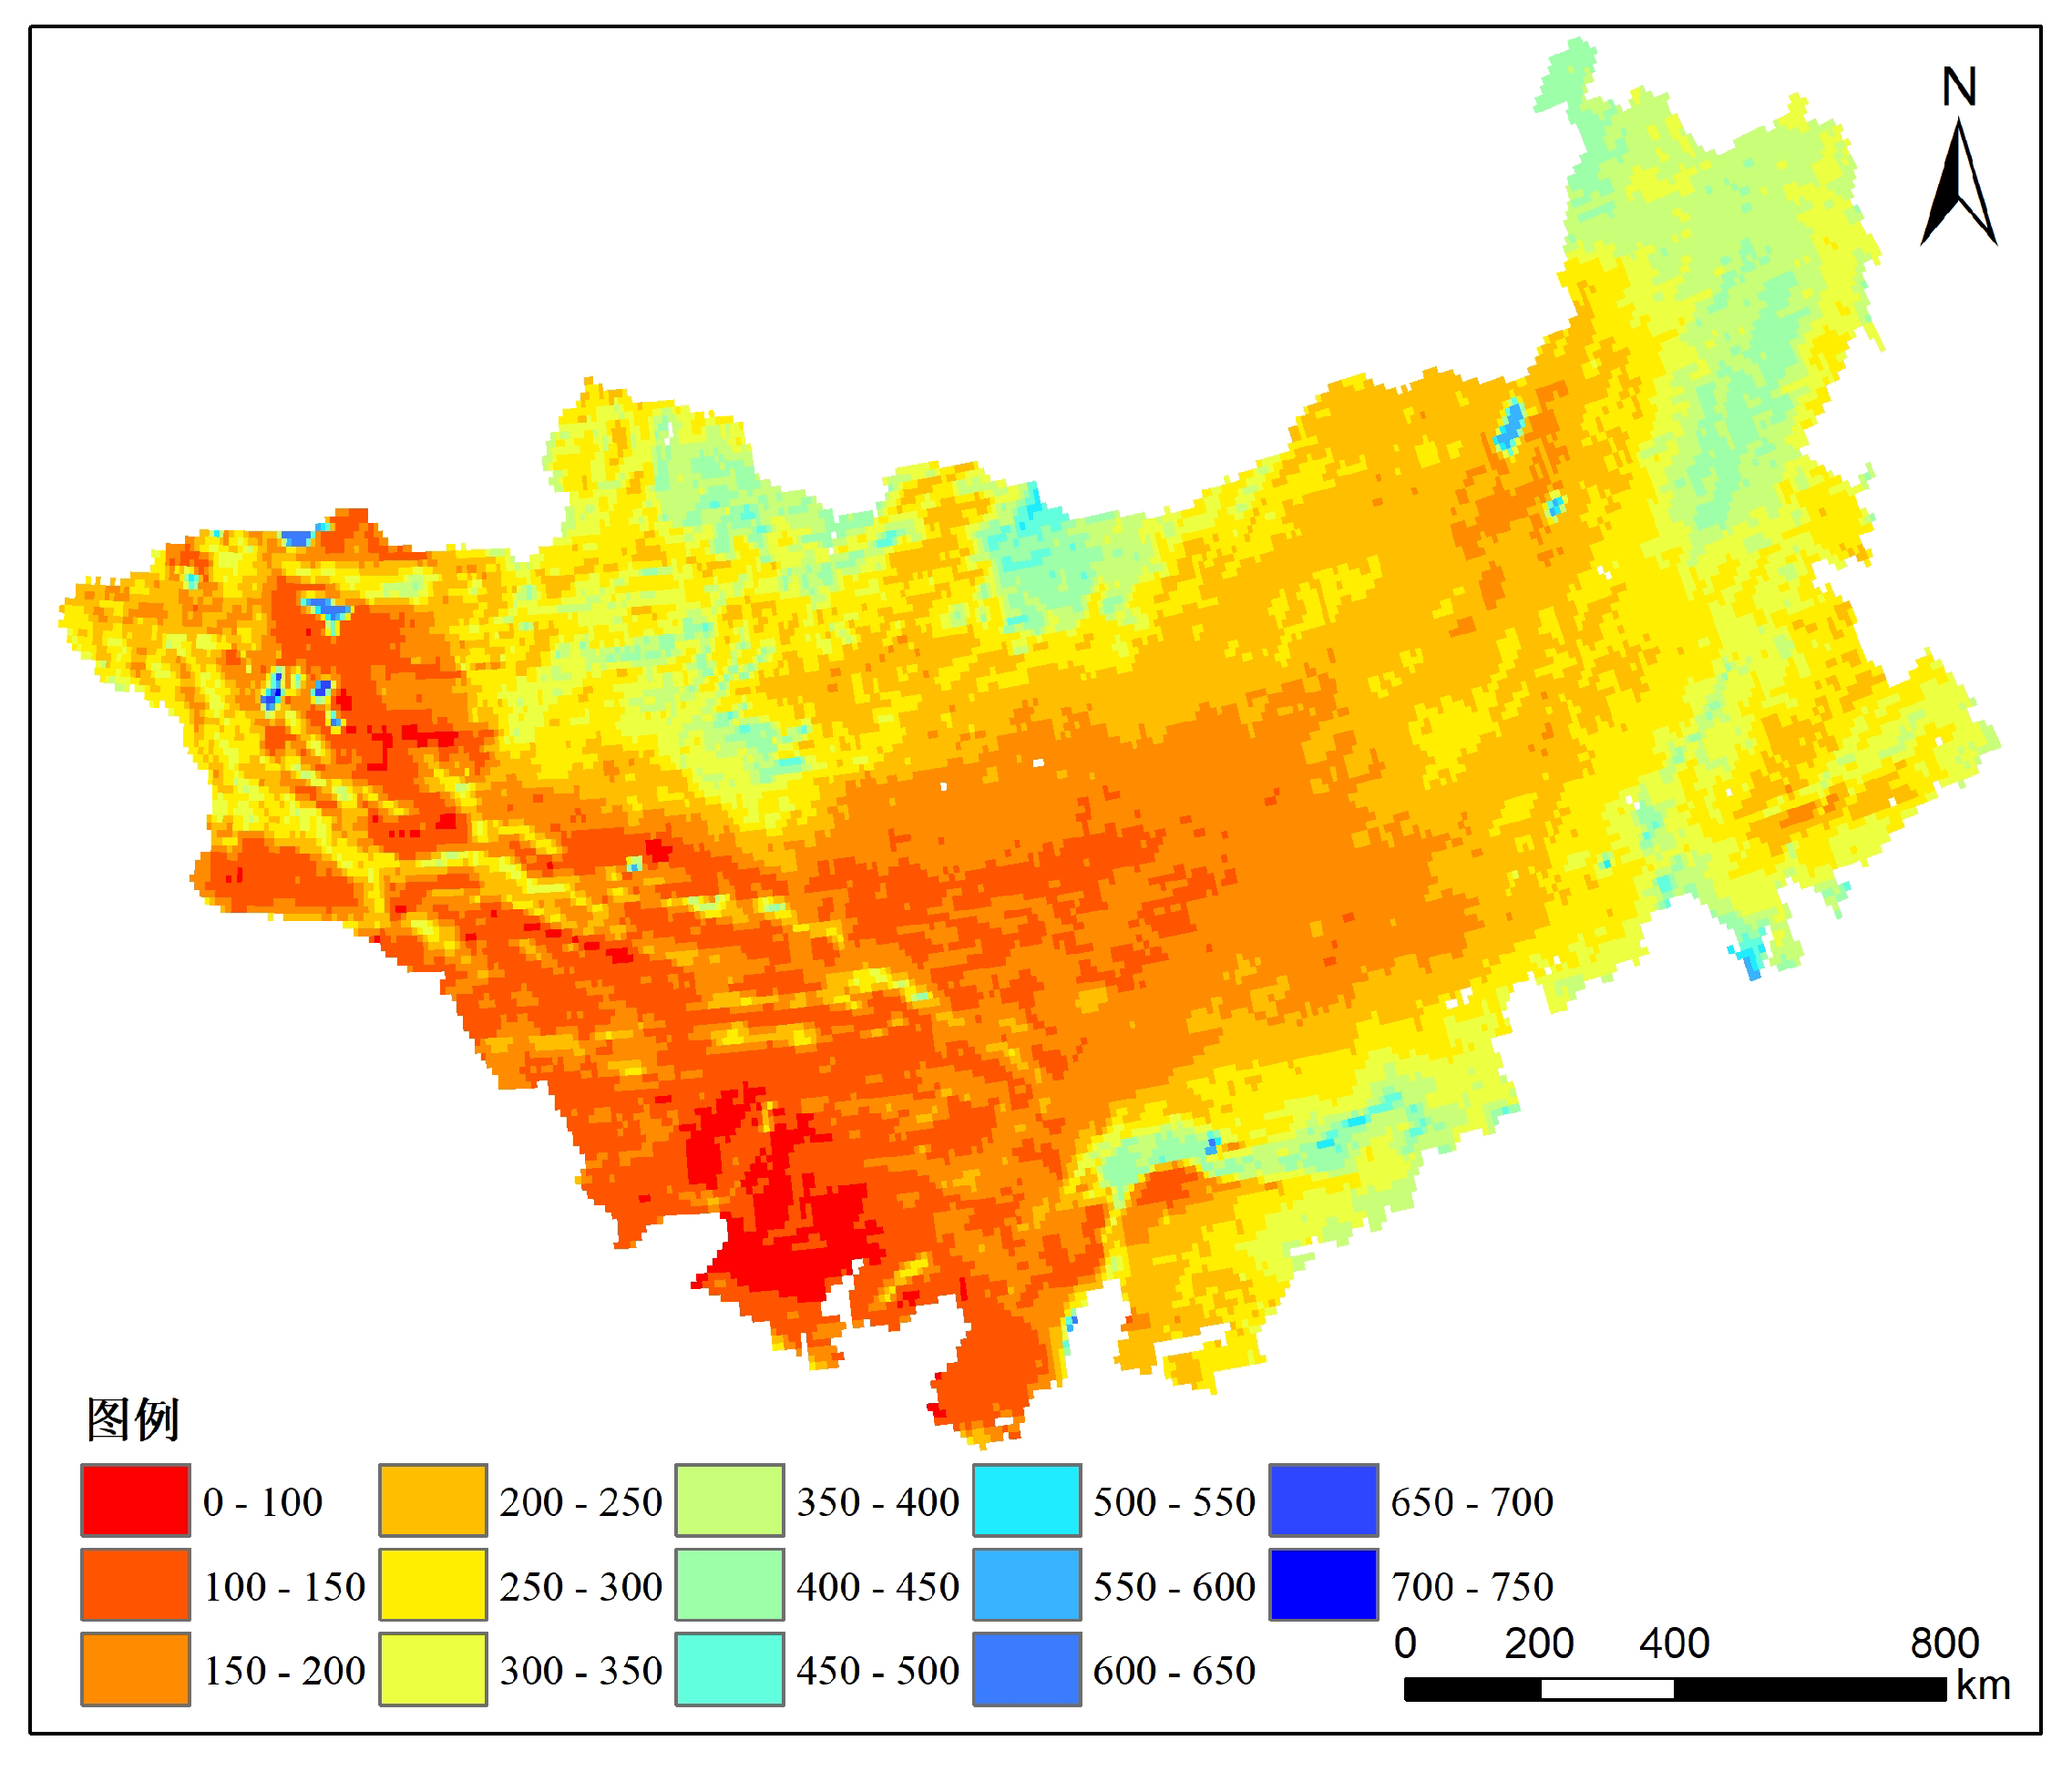
Figure 2.
Figure 2. Spatial distribution map of monthly average ET in the Mongolian Plateau from 2001 to 2020.
Figure 2.
Figure 2. Spatial distribution map of monthly average ET in the Mongolian Plateau from 2001 to 2020.
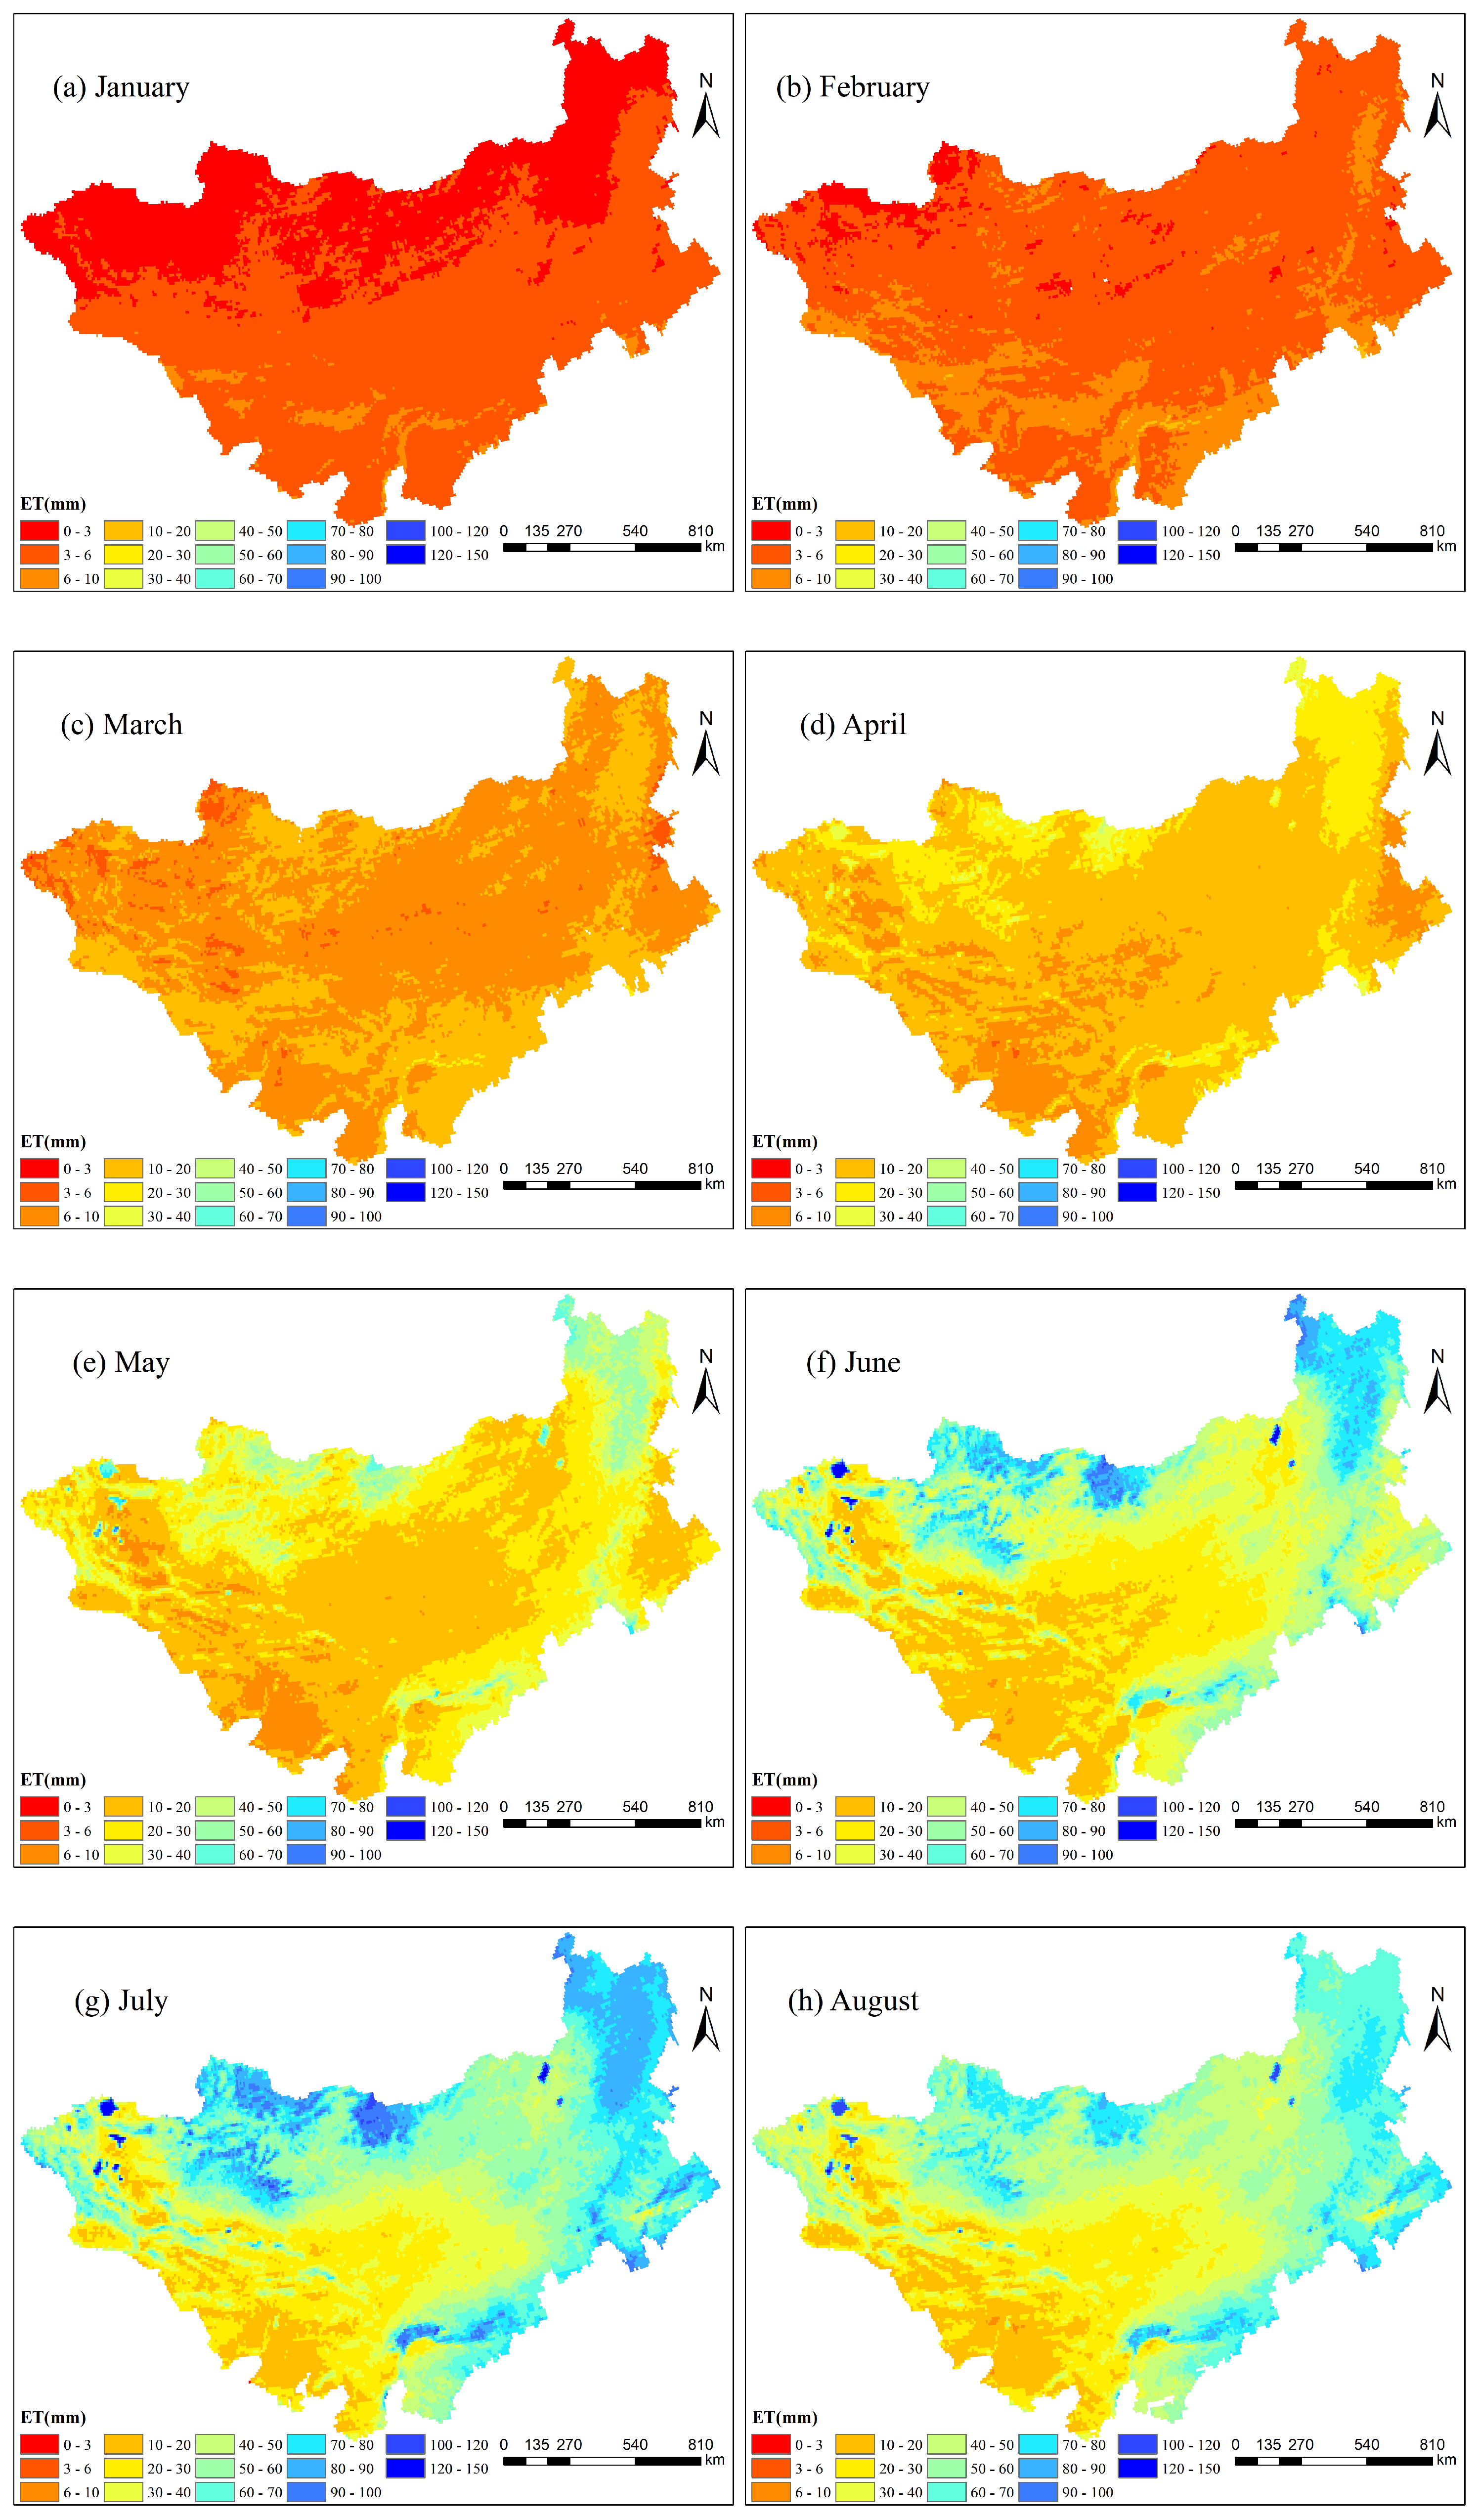
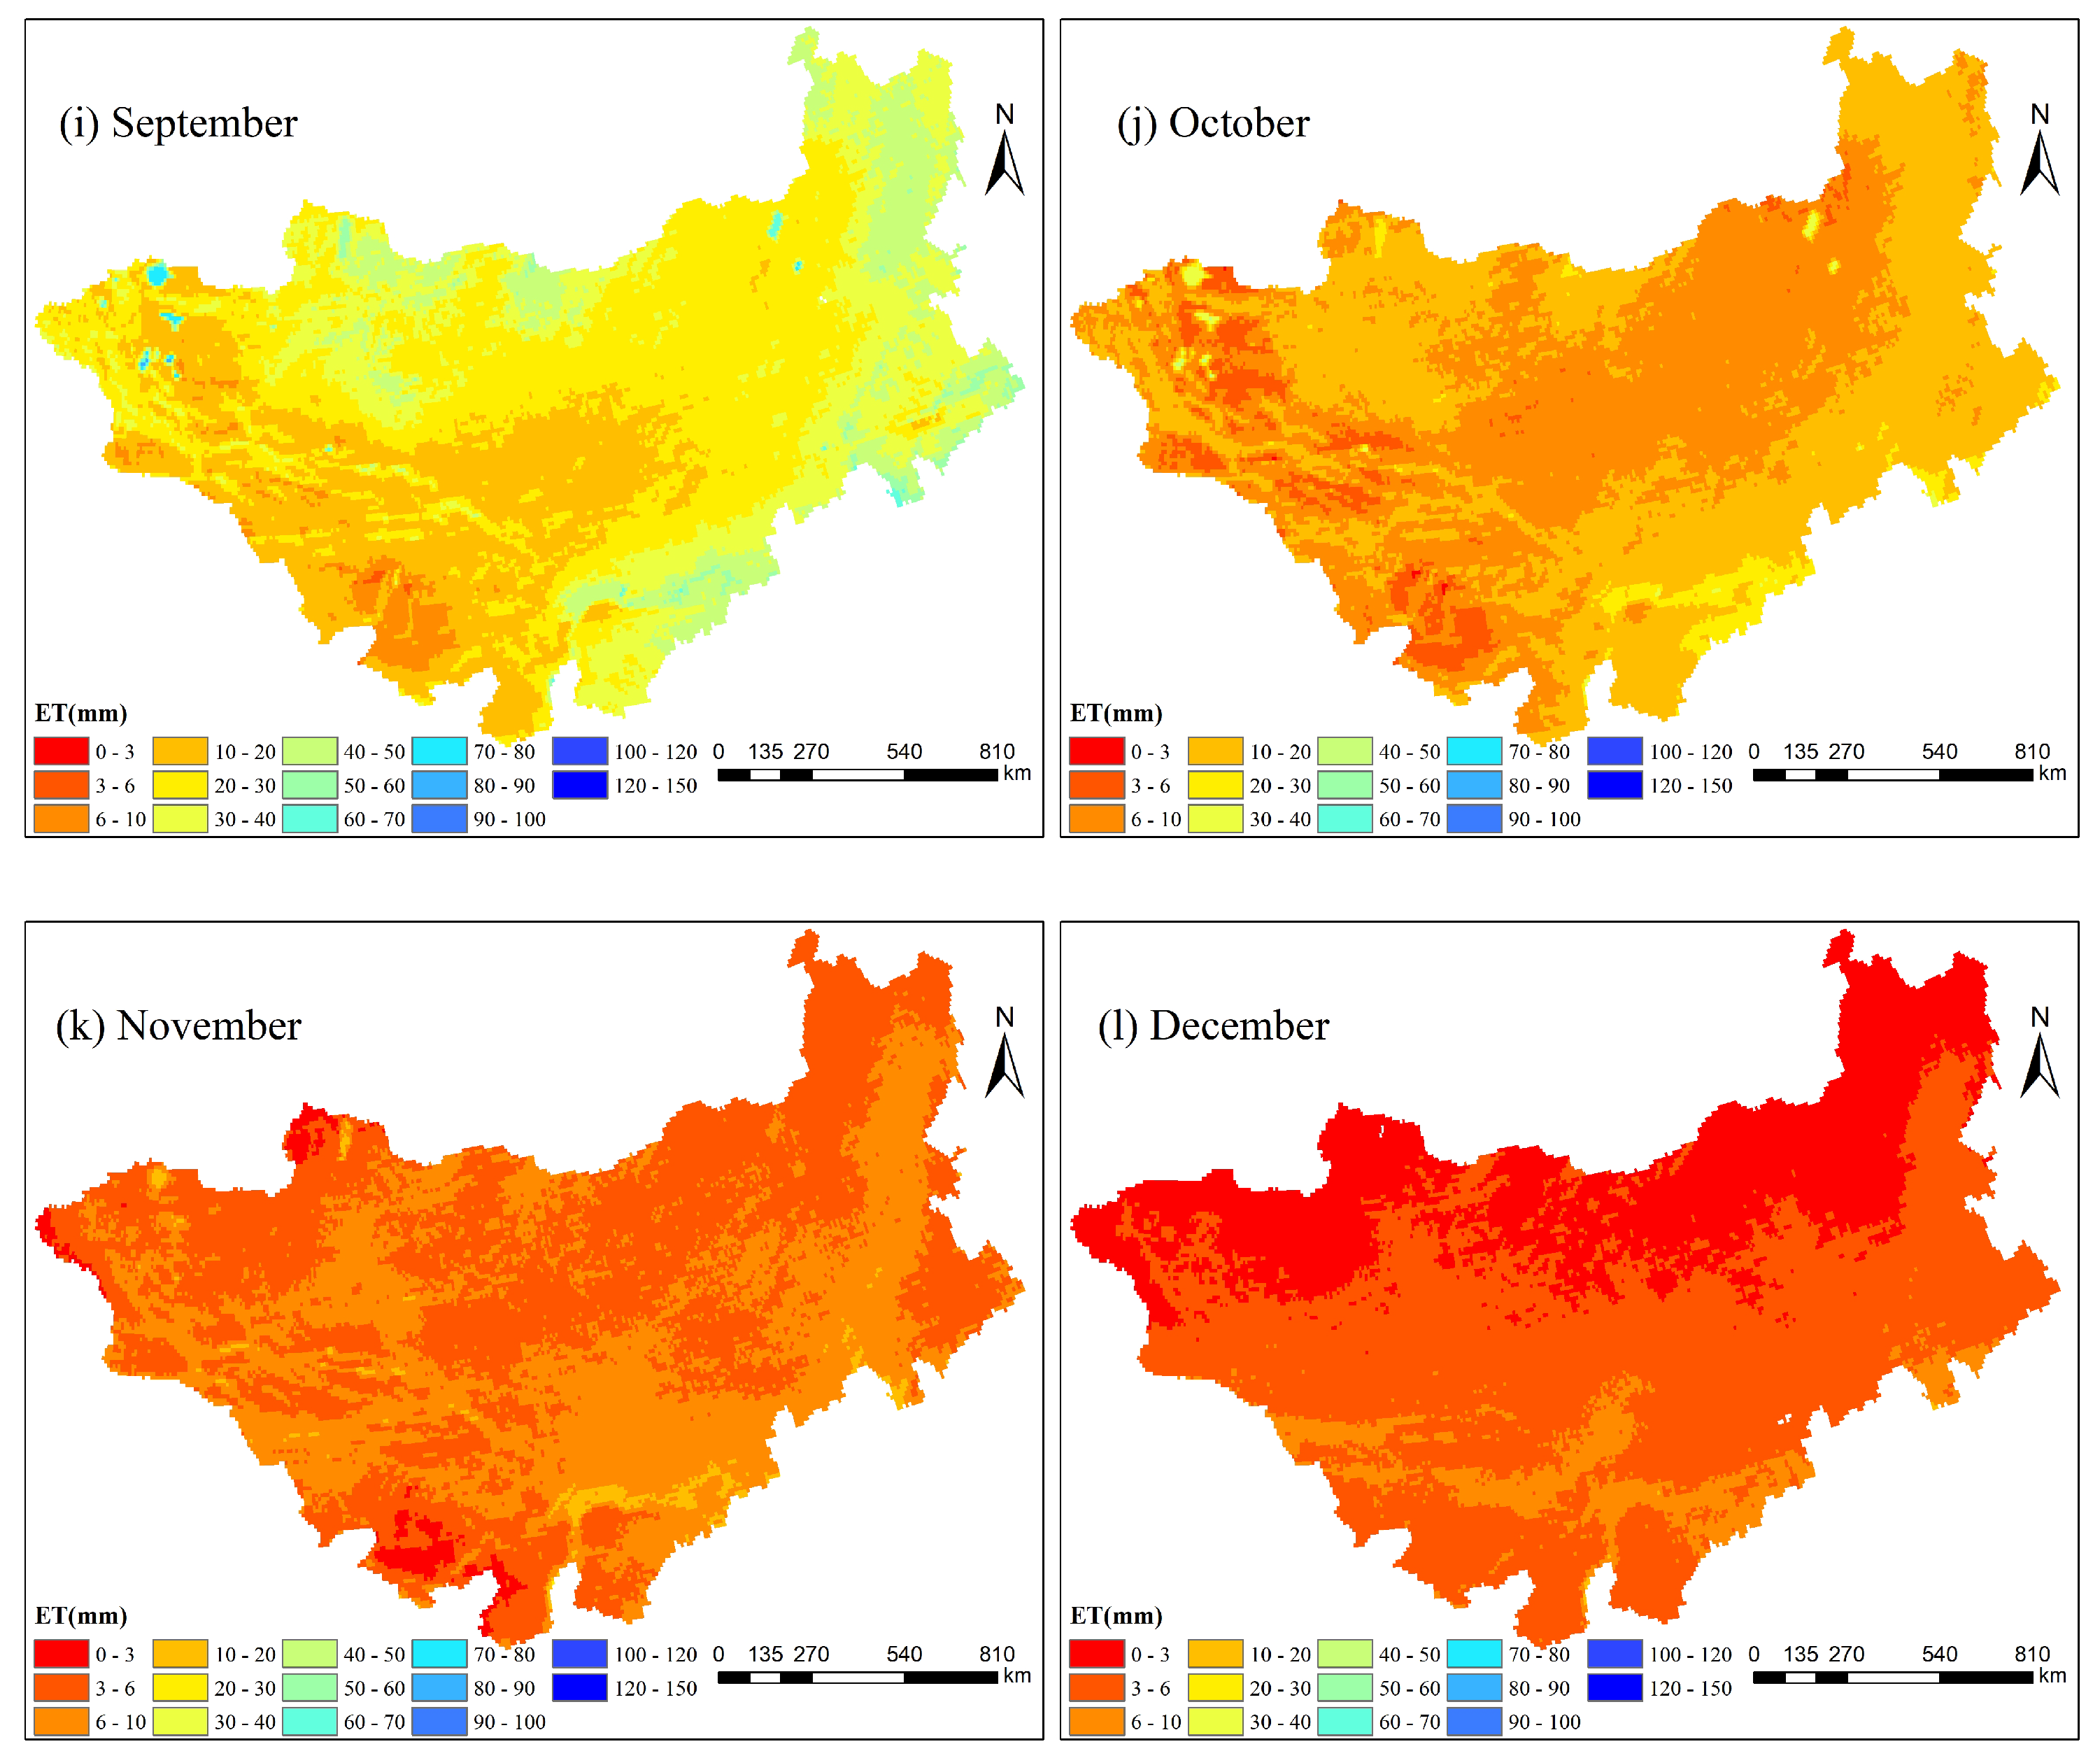
Figure 3.
Data processing flowchart.
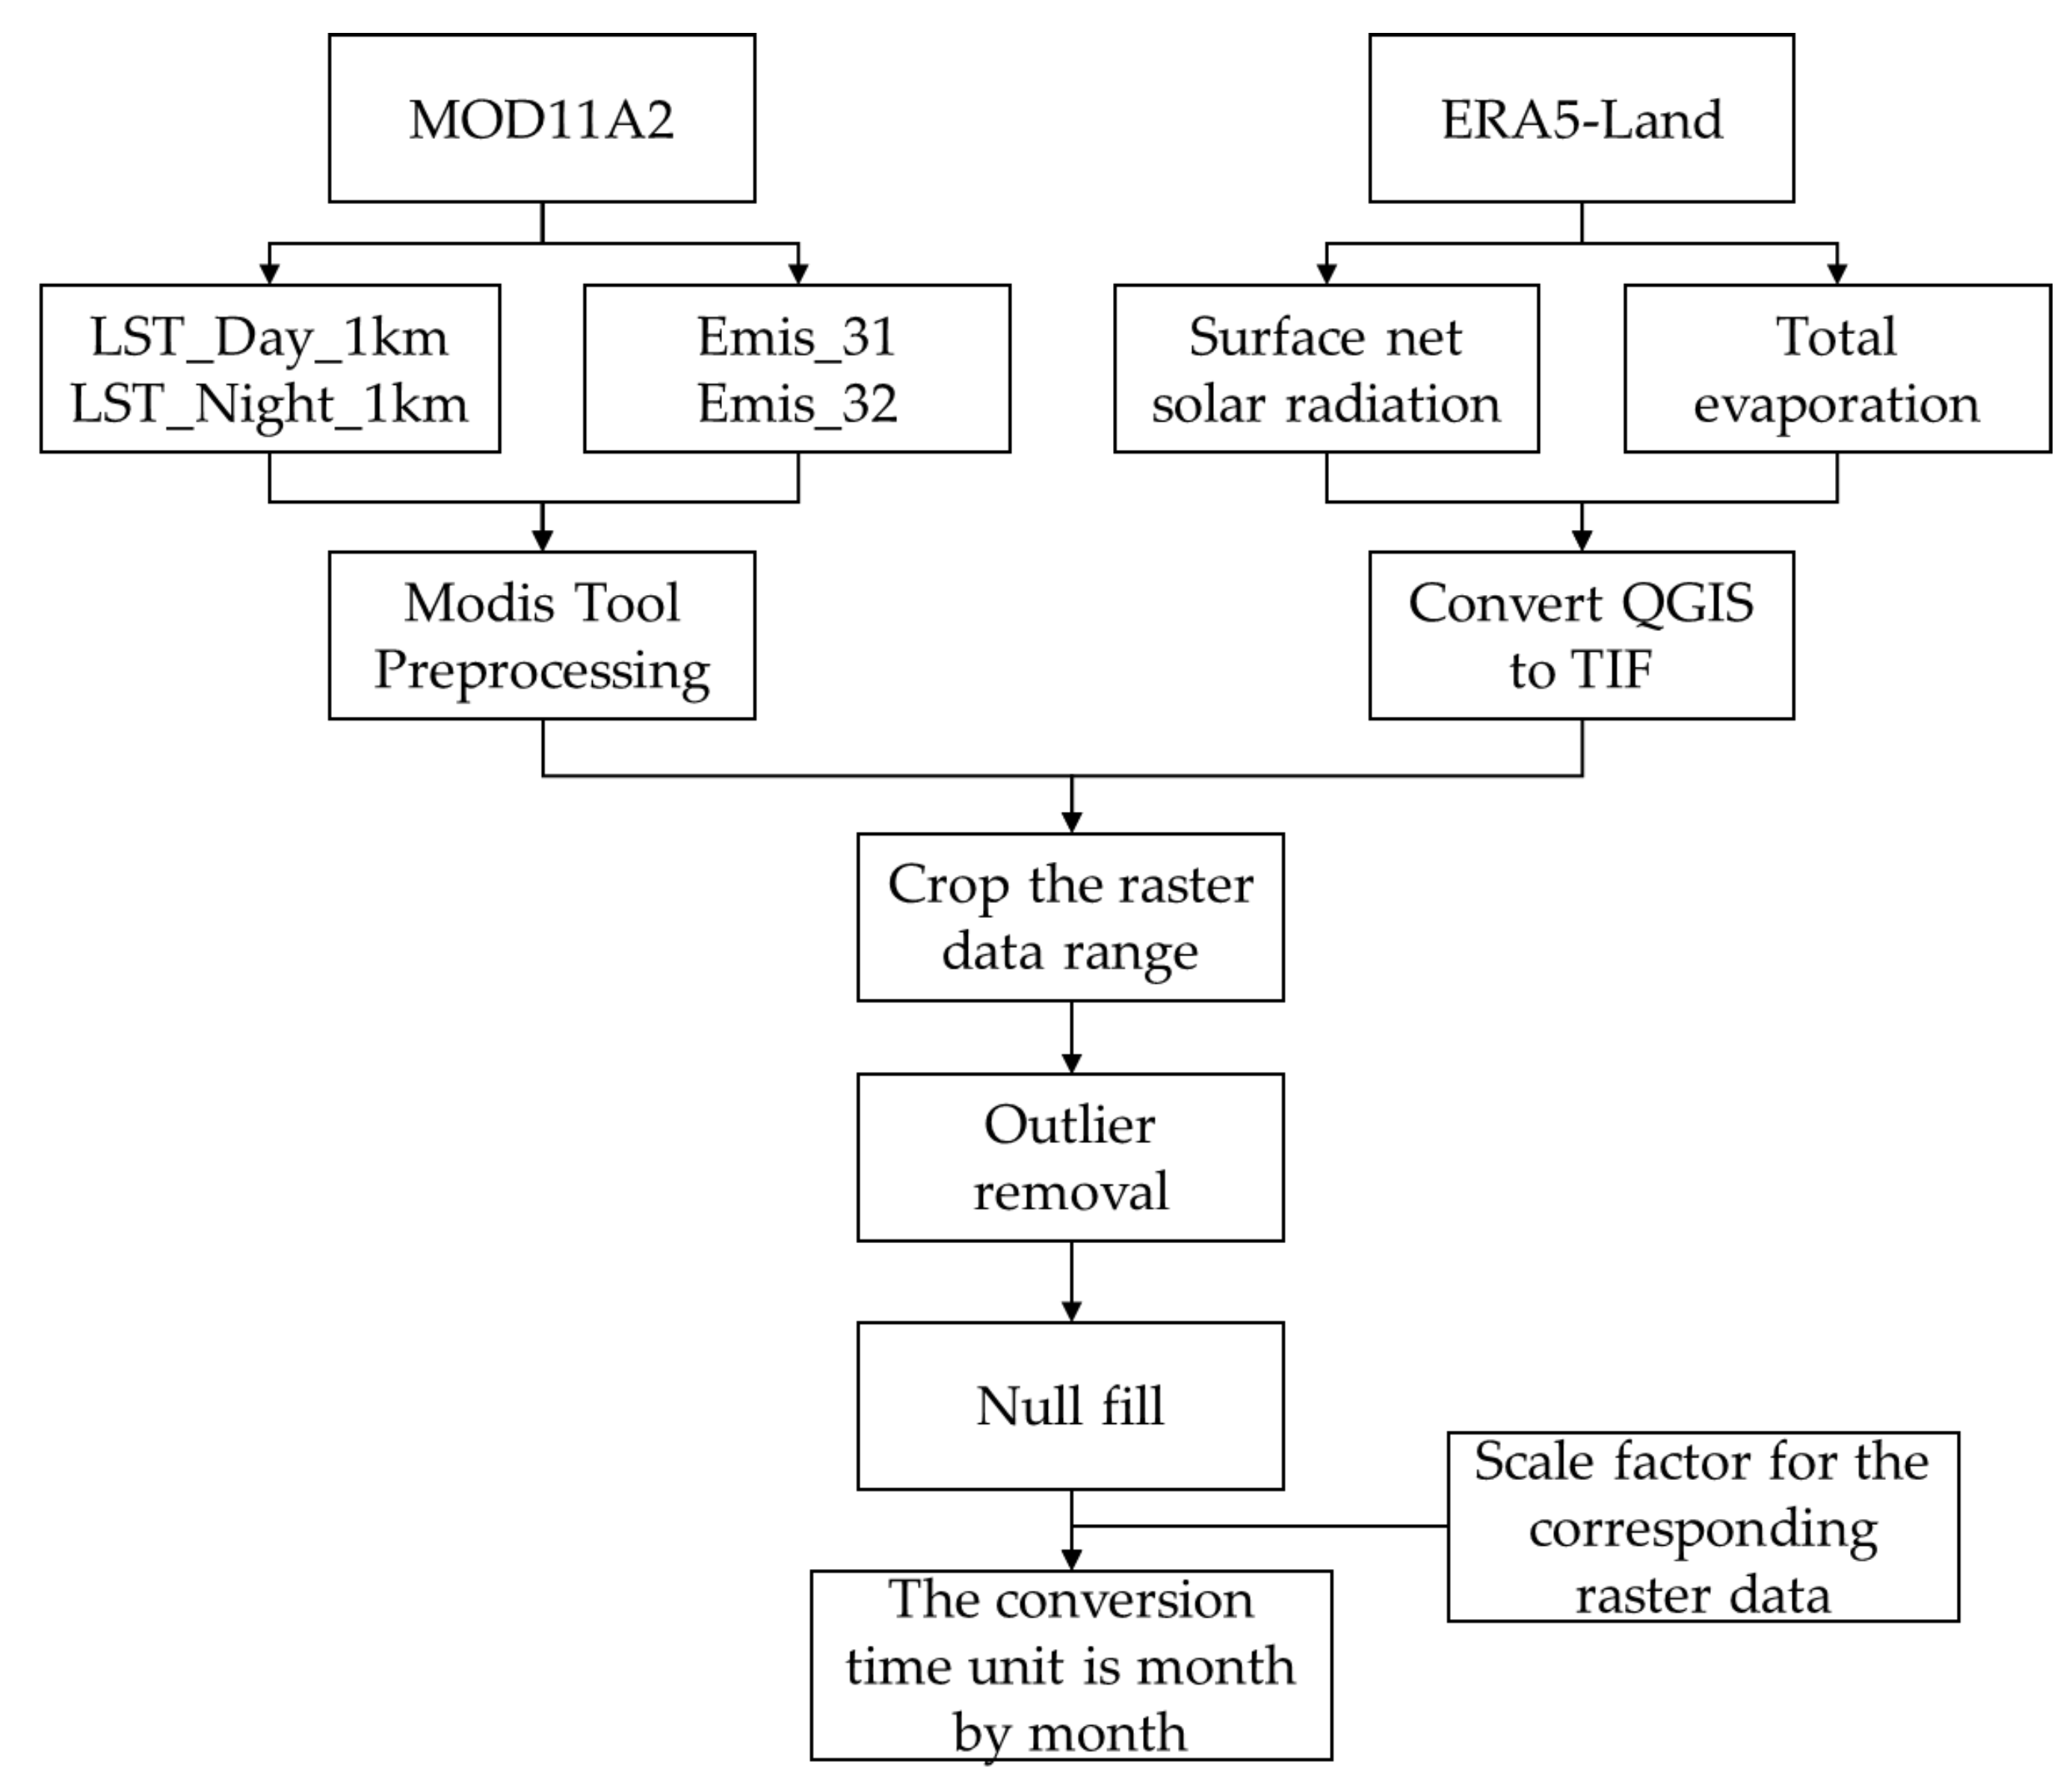
Figure 4.
SFE-NP model calculation flowchart.
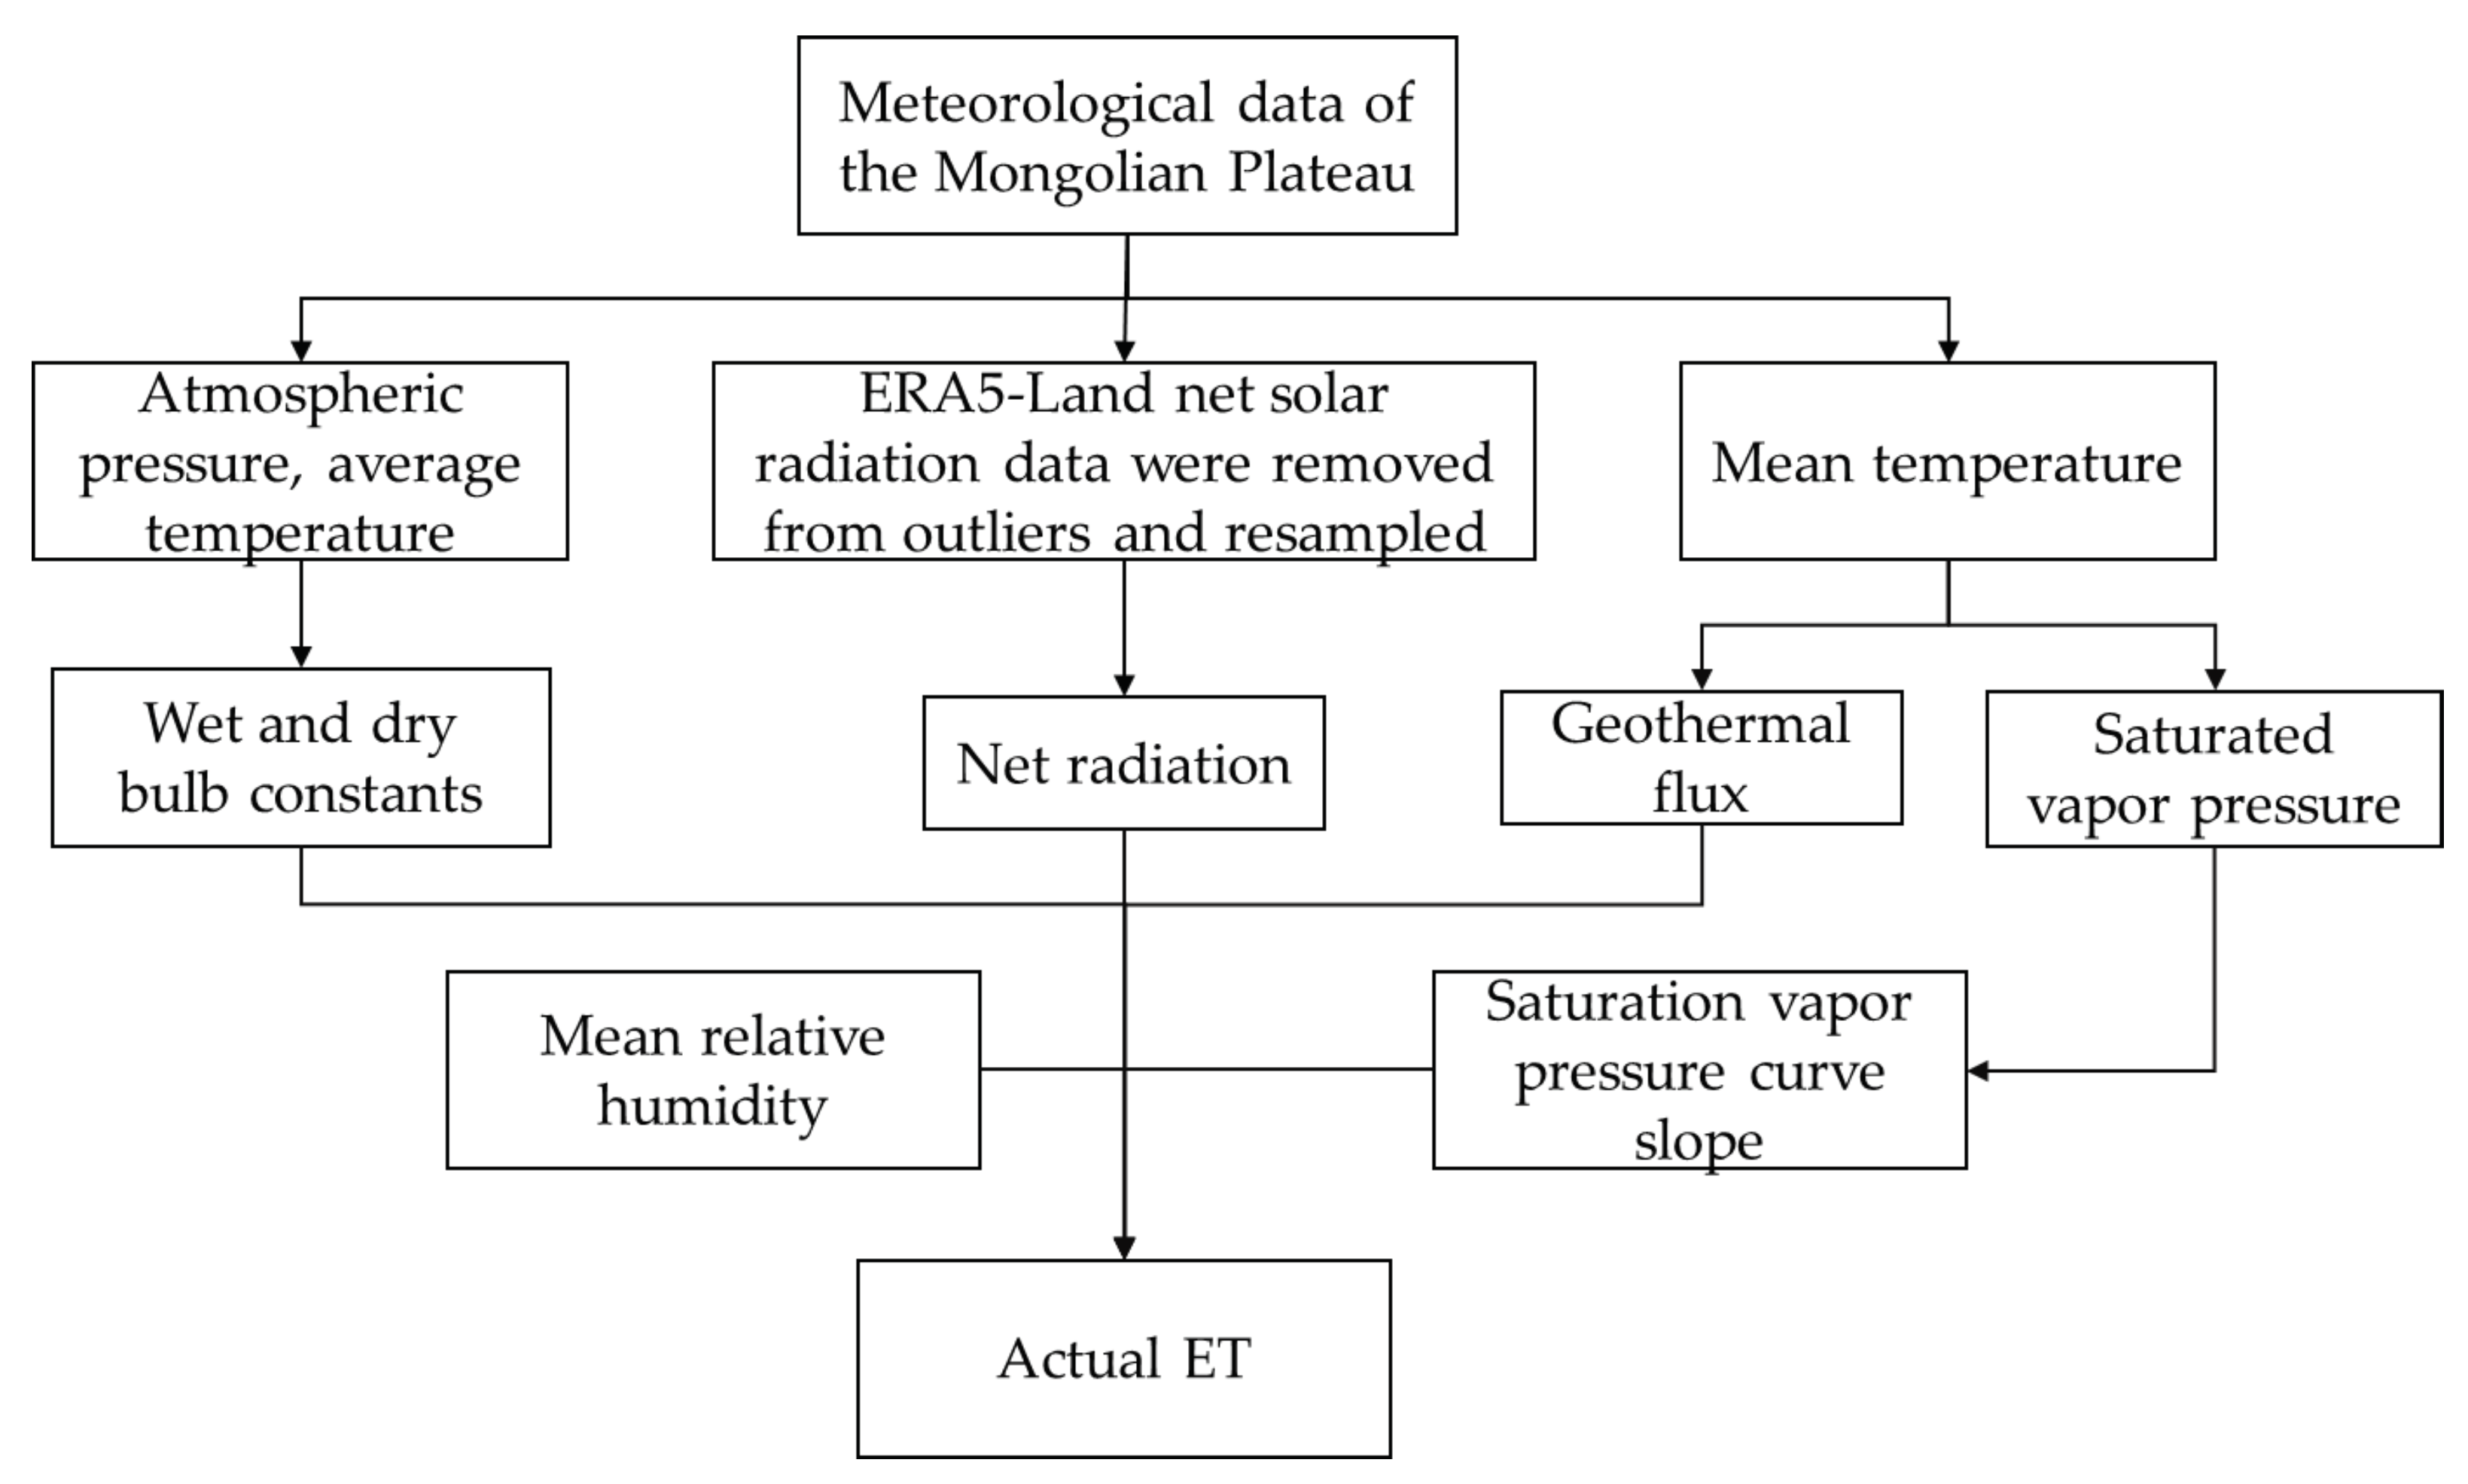

Table 1.
Verification of ET Accuracy in the Mongolian Plateau from 2001 to 2020.
| Serial Number | R | R2 | RMSE |
| 1 | 0.77 | 0.60 | 1.25 |
| 2 | 0.75 | 0.56 | 1.21 |
| 3 | 0.79 | 0.63 | 0.85 |
| 4 | 0.82 | 0.67 | 0.67 |
| 5 | 0.83 | 0.69 | 0.70 |
| 6 | 0.81 | 0.66 | 0.90 |
| 7 | 0.63 | 0.40 | 1.66 |
| 8 | 0.87 | 0.75 | 0.56 |
Disclaimer/Publisher’s Note: The statements, opinions and data contained in all publications are solely those of the individual author(s) and contributor(s) and not of MDPI and/or the editor(s). MDPI and/or the editor(s) disclaim responsibility for any injury to people or property resulting from any ideas, methods, instructions or products referred to in the content. |
© 2025 by the authors. Licensee MDPI, Basel, Switzerland. This article is an open access article distributed under the terms and conditions of the Creative Commons Attribution (CC BY) license (http://creativecommons.org/licenses/by/4.0/).
Copyright: This open access article is published under a Creative Commons CC BY 4.0 license, which permit the free download, distribution, and reuse, provided that the author and preprint are cited in any reuse.


