Preprint
Article

This version is not peer-reviewed.

Retention of Copper and Zinc from Traffic Area Runoff by Topsoil of Vegetated Infiltration Swales Amended with Recycled Demolition Waste

A peer-reviewed article of this preprint also exists.

Submitted:

06 January 2025

Posted:

08 January 2025

You are already at the latest version

Abstract

Infiltration swales are a prospective key component of water-sensitive urban planning. The utilization of appropriate soil amendments is intended to facilitate their retention of pollutants from stormwater runoff of traffic areas. Little is known about the possibility of utilizing processed construction and demolition waste (CDW) as an amendment to improve pollutant retention. We conducted batch and field tests to investigate i) the leaching of metals from soil substrates containing CDW and ii) their retention potential for copper (Cu) and zinc (Zn) when charged with real traffic area runoff. To gain a comprehensive understanding of the chemical interactions, we iii) employed sequential extractions using an optimized protocol from treated and untreated soil substrates. In batch tests, the potential of vanadium leaching from technosols amended with brick-dominated CDW was apparent. When charged with traffic area runoff, the retentions of Cu and Zn in the technosols were comparable to those of the control soil without CDW. However, the simulation of high rainfall intensities reduced Cu and Zn retention in the technosols and the control. The results from the subsequent sequential extraction of Cu and Zn imply shifts in the chemical binding in the technosols compared to the control.

Keywords: 
;  ;  ;  ;  ;  ;  

1. Introduction

Traffic area runoff (TAR) constitutes a substantial source of pollution, transporting a diverse array of metals to the environment [1,2]. The metals copper (Cu), and zinc (Zn) from brake dust and tire wear, respectively, are expected to have the highest concentration in TAR [3,4]. An effective solution to manage metal contamination is the implementation of roadside infiltration swales, which can be integrated into stormwater management strategies and is the state of the technology in Germany [5].
Recently, there has been growing interest in using construction and demolition waste (CDW), which consists mainly of concrete and bricks, as an innovative, cost-effective material for runoff treatment [6,7]. CDW is one of the most significant waste streams in Europe, and its utilization could reduce CO2 emissions and save landfill space [8,9].
In this context, the concept of technosols, or human-made soils created from the recycling of materials such as CDW, has gained attention as a key approach to promoting sustainability within the framework of the circular economy [10]. In landscaping, the development of local material flows is key to a sustainable construction sector, and local processing and use of CDW can contribute to this [11]. Repurposing CDW as a topsoil amendment in infiltration swales offers benefits: reducing the environmental burden of waste disposal and providing an efficient means of mitigating road runoff pollutants. However, the use of CDW is often hindered by issues related to acceptance and concerns about the release of potentially hazardous substances [12,13].
This three-year study investigates the potential of six CDW-derived technosols to remove Cu and Zn from genuine traffic runoff on a pilot scale for the first time compared to typical soil used in infiltration swales as a control. By examining the material composition-dependent leaching of substances based on batch tests and retention efficiency for Cu and Zn from real traffic area runoff under semi-real conditions, this research aims to evaluate their viability as an alternative to traditional filtration systems.
We hypothesize that topsoil from infiltration swales can be enriched with CDW without harming groundwater quality. In addition, we hypothesize that pollutant retention from traffic area runoff can be improved if the topsoil is enriched with CDW. We also hypothesize differences in the chemical binding of Cu and Zn in the technosols compared to typical soils used for infiltration swales.
To test the hypotheses, we investigated three-step phases:
Phase 1: Batch tests of different technosols (soil mixtures based on CDW) and the evaluation of the potential groundwater hazard
Phase 2: A field test of the technosols on the retention potential and efficiency of Cu and Zn when charged with real traffic area runoff
Phase 3: Sequential extraction using reference material BCR 701 (BCR-SEP) of Cu and Zn from the technosols with the highest CDW ratios after treatment with TAR to understand binding mechanisms.
The findings could contribute to developing sustainable solutions for urban pollution control while simultaneously addressing waste management challenges and advancing the circular economy.

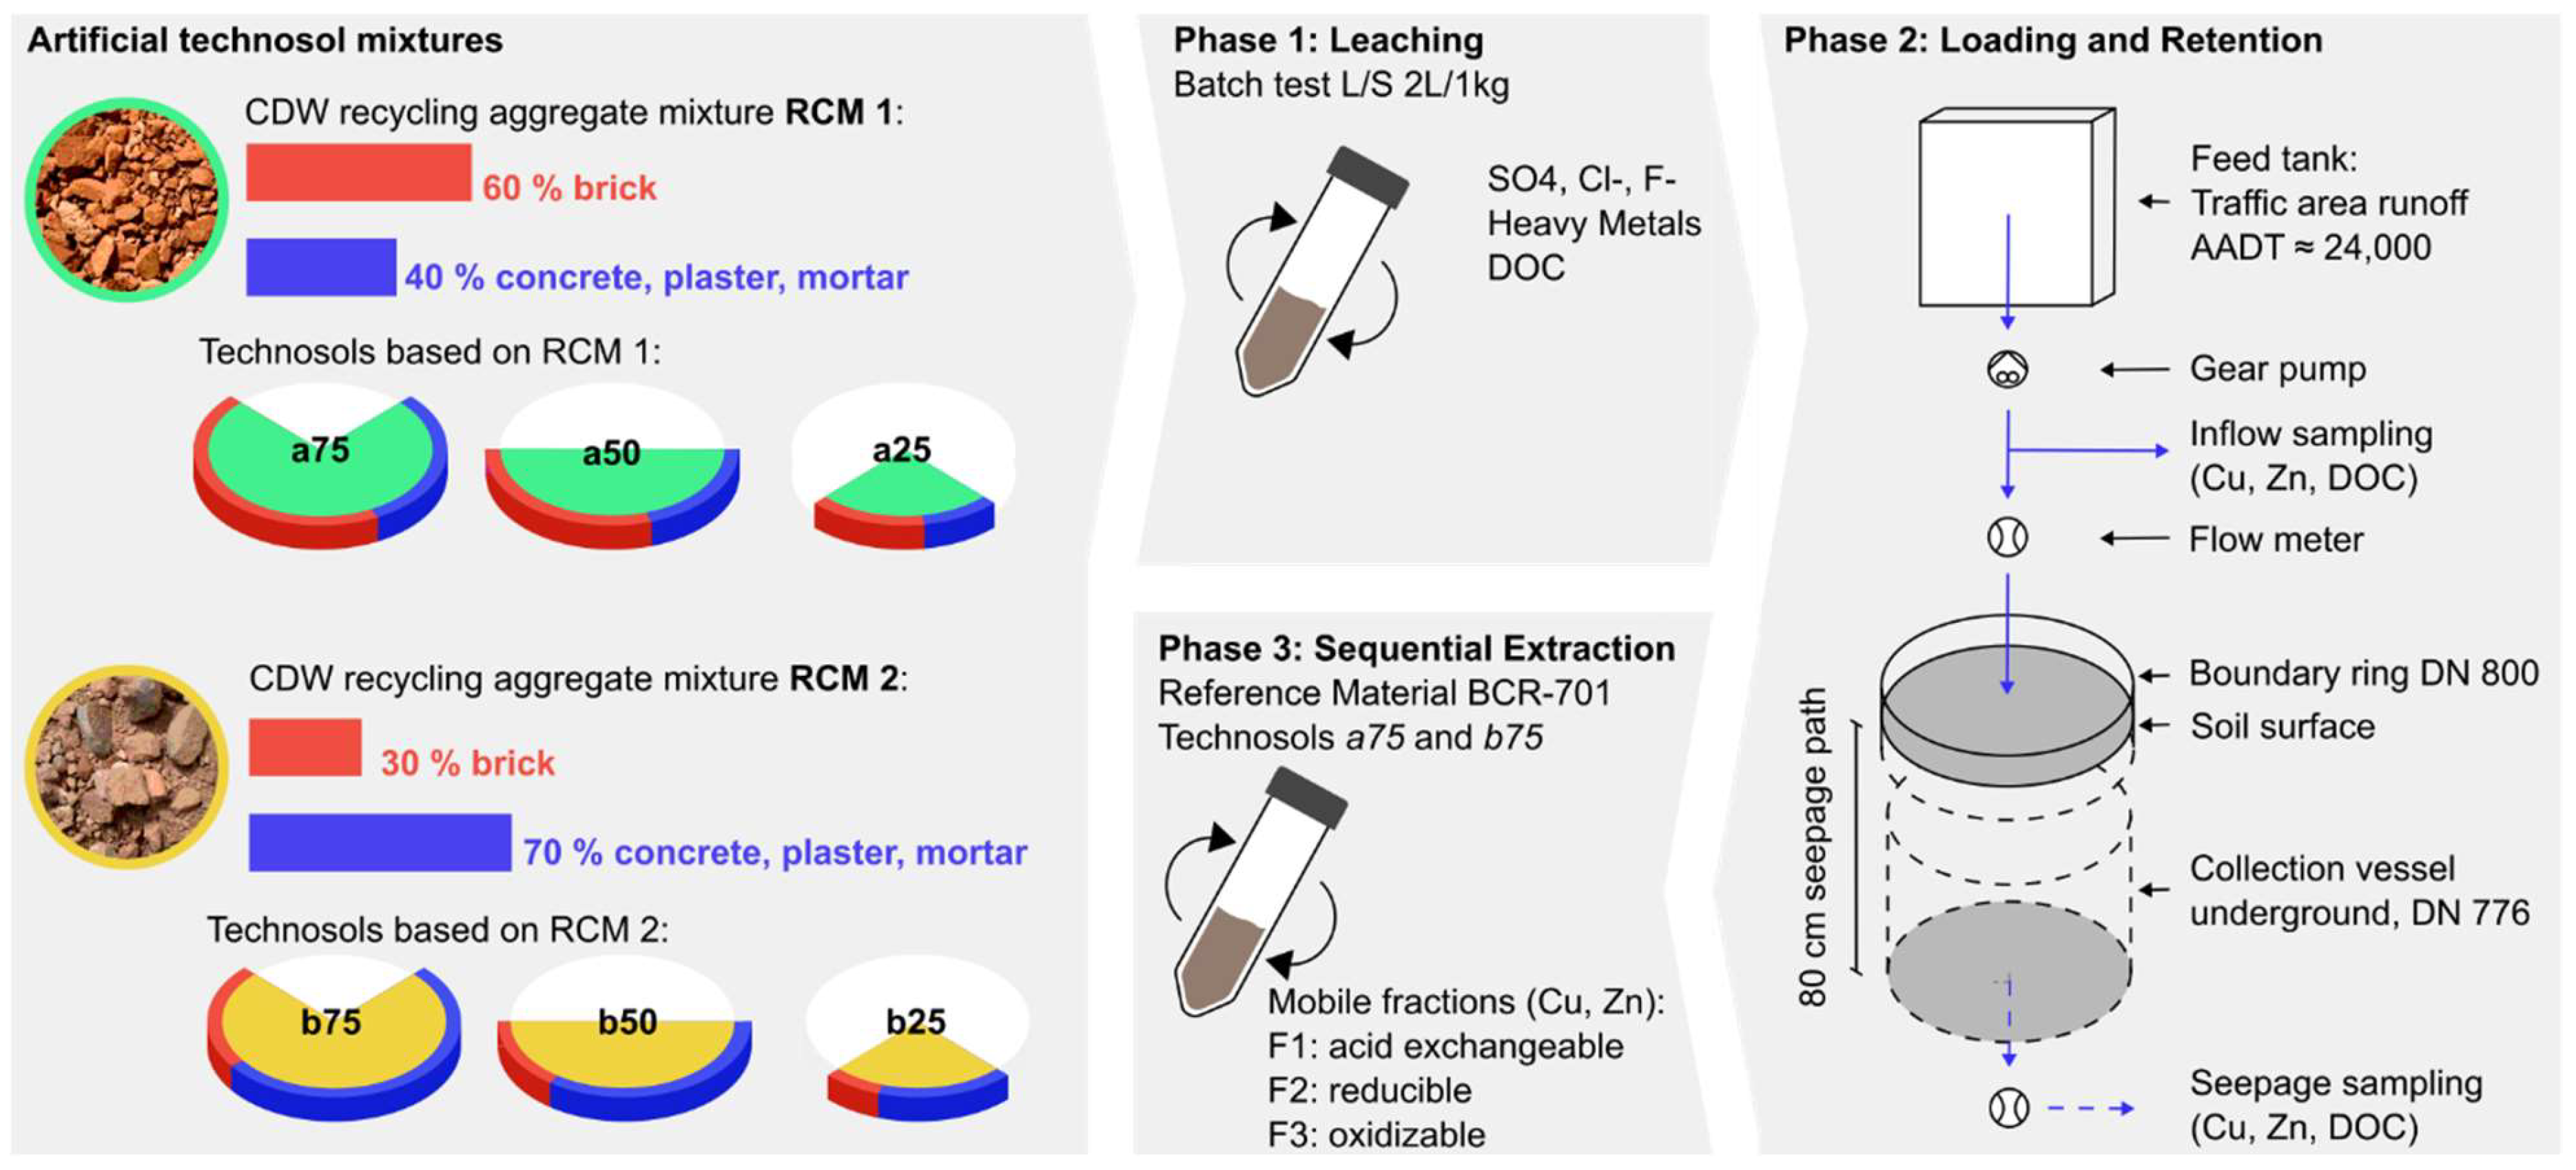
2. Materials and Methods

2.1. Technosols from CDW

For the investigations, different technosols were produced based on two recycling mixtures (RCM; RCM1 and RCM2) that derive from building demolition and processing its CDW. The RCMs are crushed aggregates with grain sizes of 0 to 16 mm. RCM1 is enriched with brick material. It contains 60 % bricks and 40 % concrete, plaster and mortar. RCM2 is enriched with concrete, plaster, and mortar (70 %) and contains 30 % bricks (Figure 1). These RCMs have been blended with natural topsoil, subsoil, and compost to achieve comparable particle size distributions and organic matter contents (Table 1). The resulting six technosols ((a75, a50, a25, b75, b50, b25) containing different CDW ratios and compositions and one control soil (ctl) that did not contain CDW were produced.

2.2. Study Design

For lysimeter tests, seven vessels (Polyethylene, DN 776 mm, height = 500 mm) were buried 80 cm below ground in 2021 and filled with the six different technosols and ctl (see ). An extensive grass mix was then sown over the surface areas of all lysimeters to establish the vegetation. Boundary rings were placed over the surfaces of the vessels (High-Density Polyethylene, DN 800). A plastic hose connected the outlets (1/2”) at the bottom of the vessels to manholes where the seepage was quantified and collected using tipping counters (100 mL, polycarbonate, REED-Sensor, max. flow rate = 5 L/min).
The assessment considered two thresholds: German threshold values for seepage water (TV_1) and for soil solution (TV_2) according to the German Federal Soil Protection and Contaminated Sites Ordinance (Bundesbodenschutz- und Altlastenverordnung; BBodSchV) [15].
Phase 1 – Leaching behaviour
To assess the leaching of substances for the pathway soil-groundwater in advance, laboratory batch tests according to DIN 19529 with a liquid-to-solid ratio of 2 L/kg batch aqua test were conducted with RCM1, RCM2, the six technosols, and the ctl in triplicate [16]. Obtained eluates were analyzed for selected parameters according to the threshold values TV_2 for soil solutions.
Besides total Cu and Zn concentrations in the eluate, the investigated parameter spectrum included the total concentrations of the metals Sb, As, Pb, B, Cd, Cr, Cr(VI), Co, Mo, Ni, Hg, Se, Tl, V, and Sn. Additionally, sulfate, chloride, fluoride, and dissolved organic carbon (DOC) were analyzed to evaluate potential risk for groundwater contamination (List of methods, limits of quantification (LOQ) and threshold values see Table A1).
Phase 2 – Retention of Cu and Zn from traffic area runoff
After backfilling the lysimeters, the six technosols and the ctl were exposed to natural weather conditions to ensure stabilization until the Cu and Zn discharges had normalized to avoid biasing seepage concentrations when charging with TAR and measuring background concentrations. The quantities of seepage water up to the start of the TAR charging were recorded using tipping counters and reported as L/S in the results section. Mean background concentrations of Cu, Zn, V, and DOC are based on the values of 4 random samples per technosol between June 2023 and February 2024.
From April 2024 to August 2024, the lysimeter vessels were charged 12 times (6 per rainfall intensity) with TAR, collected at a highly trafficked road (approx. 24,000 vehicles/day; [17]). The TAR was transported to the study site, stored in containers, and pumped to the test plots using gear pumps. The flow rate was measured using flow meters. Two rainfall intensities were applied according to measured data from the German Weather Service (KOSTRA data): RI_1: 121 L/(s·ha), volume per charging = 139 L, and RI_2: 221 L/(s·ha), volume per charging = 127 L. Charging volume and flow rate of TAR were calculated according to the German guideline DWA-A 138-1, assuming a ratio of 15 m² of asphalt surface (mean runoff coefficient = 0.9) to 1 m² of active infiltration area in a swale. Influent and total seepage of the lysimeters were sampled and analyzed for Cu and Zn concentrations after aqua regia (AR) digestion and compared to the threshold values TV_1 for seepage water
Phase 3 – Sequential extraction of Cu and Zn from soil
Soil samples from a75, b75, and ctl were taken in triplicate from the infiltration areas and, as a control, from the non-infiltration areas at depths of 0 - 25 mm. From these soil samples, Cu and Zn concentrations were further analyzed following the three-step optimized sequential extraction protocol (BCR-SEP) using BCR 701 (Community Bureau of Reference, European Commission) reference material according to Rauret, et al. [18]. All used utensils were made of borosilicate glass, polypropylene, or polytetrafluoroethylene (PTFE). The extractions were carried out in 80 mL centrifuge tubes (Herolab, Wiesloch, Germany), which were cleaned with 4 mol/L HNO₃ before use and then rinsed with ultrapure water [19]. From each sample, 1 ± 0.01 g was weighed into the centrifuge tubes three times. Additionally, as a reference BCR-701 sediment (European Commission, Joint Research Center, Belgium) was added to each batch for quality control. The individual steps of the procedure, including the different fractions and chemical solutions, are briefly described in Table 2. Calculated total Cu and Zn contents are the sum of fractions S1 to S4.
Due to difficulties with separation during centrifugation, the speed was increased from 3000 g to 4000 g. To compare the total concentrations from S1 to S4, an AR digestion was performed directly in each batch with 3 ± 0.1 g per technosol plus a BCR-701 reference. The Zn and Cu concentrations in the extracts were determined using inductively coupled plasma optical-emission spectrometry (ICP-OES).
In addition, all technosols’ dry weight and loss on ignition (LOI) were determined. For this purpose, 1 ± 0.01 g of each technosol in triplicate and one BCR-701 reference per batch was weighed and dried overnight at 105 ± 2 °C in an oven until a constant weight was achieved. These values were used as correction factors, and all analytical results in this work refer to the dry mass of the samples. To determine the LOI, the samples were heated in a muffle furnace at 550 °C for 2.5 h.

2.3. Data Processing
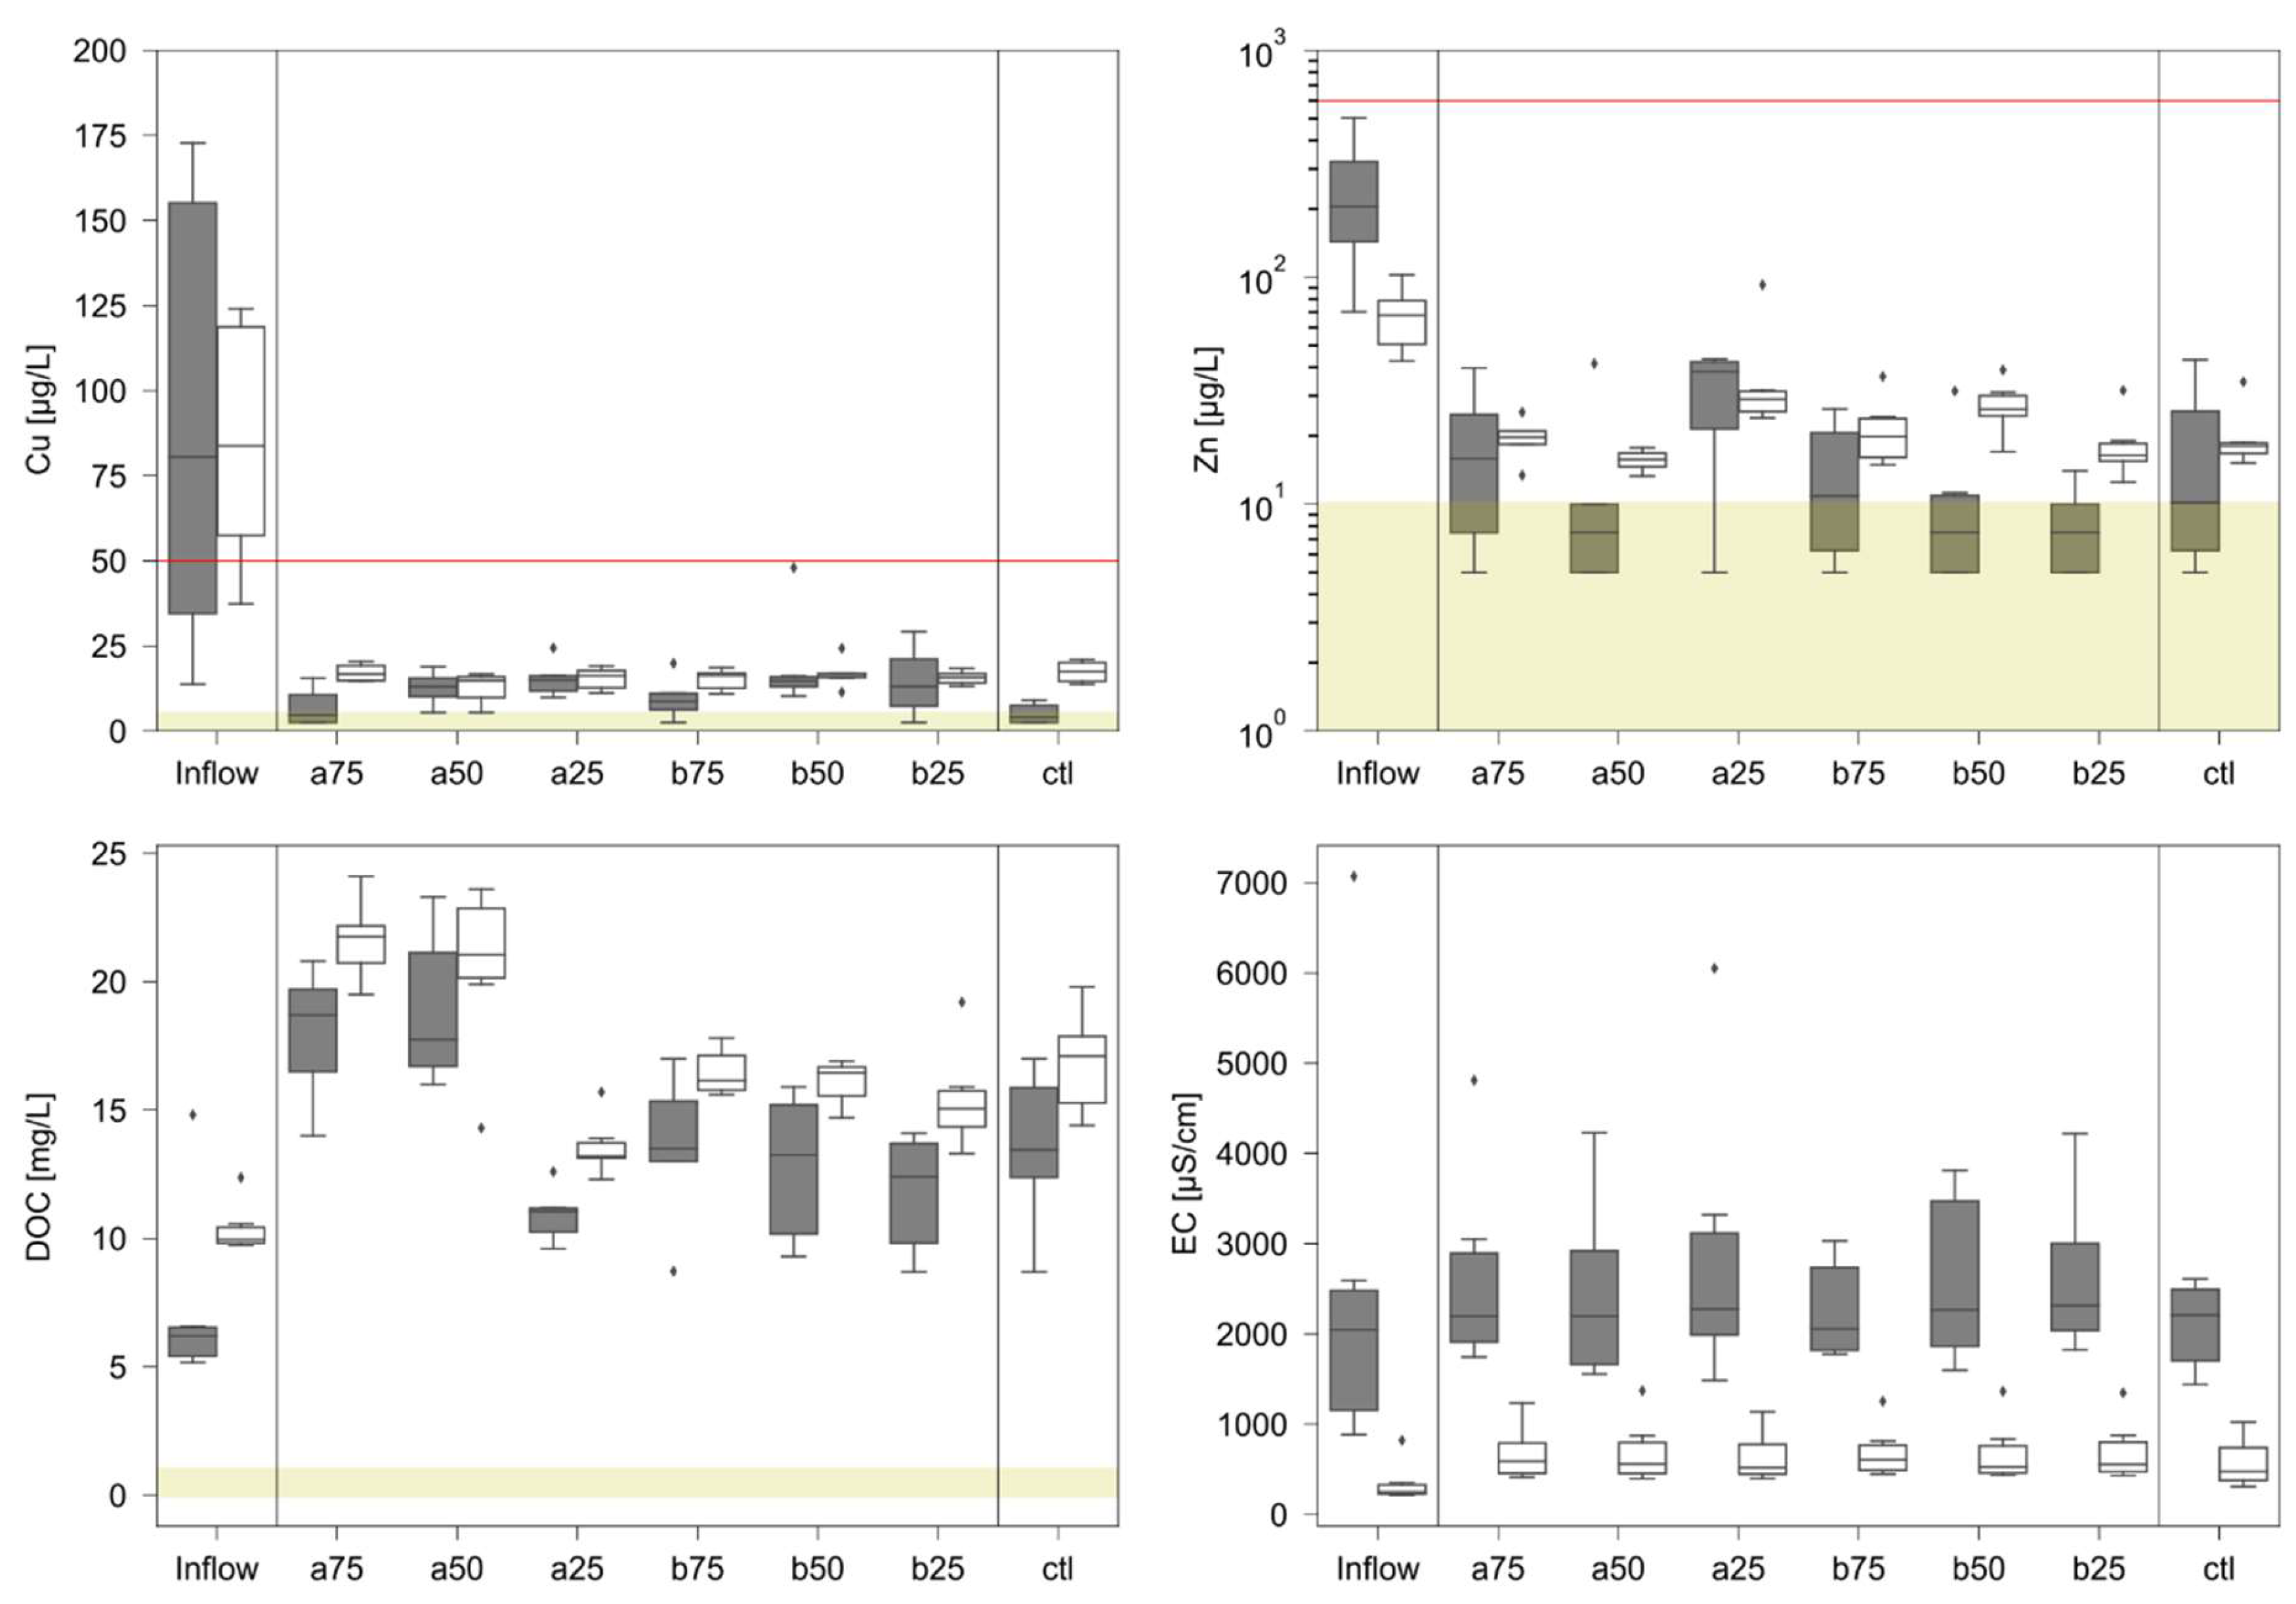
For comparisons of means, p-values were calculated using the Mann-Whitney U test with Python’s scipy package [20]. The data was processed with Python’s pandas [21], and the plots were created with Python’s matplotlib [22] and seaborn [23].

3. Results

3.1. Leaching Potential

The concentrations, pH values, and EC of the leached substance in the batch tests are summarized in Table 3.
Most metal concentrations, also those for Cu and Zn, in the eluate of all CDW mixtures, the six technosols, and the control were low and under the threshold values of TV_2.
Exceptions were V, and Cr(VI). Here, the threshold values for TV_2 were exceeded. The highest V concentrations in the eluate were found for the CDW mixtures between 66.7 µg/L (RCM2) and 167 µg/L (RCM1), slightly lower concentrations for the six technosols (up to 43.3 µg/L for a75). Also, the V concentrations of 5 µg/L in ctl were higher than the threshold values of 4 µg/L in TV_2. The Cr(VI) concentrations were highest in the CDW mixtures with 25.0 µg/L (RCM 1) and 38.7 µg/L (RCM 2). In comparison, the threshold value TV_2 is 8 µg/L. The technosols and the ctl did not exceed the threshold value for Cr(VI).
Sulfate concentrations in the eluate of the two CDW mixtures RCM1 and RCM2 were the highest. However, in all technosols, sulfate concentrations were lower, ranging from 9.6 mg/L (b25) to 52.3 mg/L (a75). Fluoride concentrations in the eluate of all tested technosols, RCM1 and RCM2, and ctl were low and did not exceed the threshold values of TV_2 which is 1.5 mg/L. Additionally, chloride concentrations were also low. DOC concentrations in the technosols and ctl were low and ranged from 5.7 to 7.3 mg/L.

3.2. Retention and Water Quality

Figure 2 shows the retention performance for Cu and Zn from the traffic area runoff by the different technosols compared to ctl (cf. Table A3).
Mean influent concentrations of Cu were 73.4 µg/L at RI_1 and 84.7 µg/L at RI_2. While the Cu concentrations in the influent of the lysimeters were still above the threshold values of TV_1 (50 µg/L), in the leachate of all experiments (RI_1 and RI_2), the values are consistently below 20 µg/L. However, we also analyzed the seepage water between June 2023 and February 2024 for mean background concentrations, the background values (5 to 6.5 µg/L) were lower compared to the leachate concentrations (up to 19.4 µg/L for a50) after treatment with traffic area runoff. Based on Mann-Whitney U tests with a significance level of α=0.05, the effluents of a50, a25, and b50 at RI_1 showed significantly higher Cu concentrations than the control (p=0.019, 0.005, and 0.005, respectively). At RI_2, the effluents of the technosols showed no significant differences in Cu concentrations compared to the control.
Similar observations can be made for zinc, but differences between RI_1 and RI_2 (Figure 2). Mean influent concentrations of Zn were 247 µg/L at RI_1 and 68.1µg/L at RI_2, both below the threshold value TV_1 of 600 µg/L. Mean effluent concentrations of Zn of all technosols and the control were much lower, ranging from 9.4 µg/L (a25) to 16.2 µg/L (a50) at RI_1 and 15.7 µg/L (a50) to 38.5 µg/L (a25) at RI_2. RI_2 concentrations were higher compared to RI_1 and higher than the background values. Based on Mann-Whitney U tests with a significance level of α=0.05, effluent concentrations of Zn of all technosols including the control were significantly lower than in the influent (cf. Table A2) both at RI_1 and RI_2. The Zn discharges showed no significant differences compared to the control at RI_1. At RI_2, a25 showed marginally higher Zn concentrations in the effluent compared to the control (p = 0.041).
Mean influent concentrations of DOC were 7.4 mg/L at RI_1 and 10.4 mg/L at RI_2. Mean effluent concentrations of DOC were in the range of 9.4 (a25) to 15.4 mg/L (a75) at RI_1 and 13.6 (a25) to 21.6 mg/L (a75) at RI_2. DOC was significantly higher in the effluents of all technosols and the control compared to influent concentrations at RI_1 and RI_2. Compared to the control, effluent DOC was significantly higher in a75 and a50 at RI_1. At RI_2, effluent DOC was significantly higher in a75 and significantly lower in a25 compared to the control.
The pH values were comparable stable and were between 7.5 and 7.9 for all tests and technosols and the ctl.
The mean influent EC was 2,588 µS/cm at RI_1 and 352 µS/cm at RI_2. Mean effluent EC ranged from 2,270 µS/cm (b75) to 2896 µS/cm (a25) at RI_1 and from 643 µS/cm (a25) to 703 µS/cm (b25) (ctl 576.5 ± 257.4) at RI_2. At RI_1, the EC of effluents of all technosols, including the control, were not significantly different from influent EC. At RI_2, the EC of effluents of all technosols, including the control, was, on the other hand, significantly higher than the influent EC. Compared to the control, no technosol effluent showed significant differences in EC at RI_1 and RI_2.
We evaluated the retention performance of the technosols for Cu and Zn for the tests depending on the rainfall intensities (Figure 3) based on the total loads (cf. Table A4). At RI_1, mean retention efficiencies for Cu ranged from 78.3 % (a25) to 94.8 % (a75) (ctl: 90.2 %) and from 50.3 % (a75) to 80.6 % (ctl 78.7 %) at RI_2. At RI_1, mean retention efficiencies for Zn ranged from 93.7 % (a25) to 98.0 % (b25) (ctl: 93.2 %) and from 48.2 % (a25) to 83.3 % (b50) (ctl 75.5 %) at RI_2. Overall mean retention efficiencies of Cu were highest in b25 (85.6 %) and lowest in a75 with 72.5 % (ctl 73.9 %). Overall mean retention efficiencies of Zn were highest in b50 with 90.3 %) and lowest in a25 with 71.0 % (ctl 84.3 %).
RI_1 and RI_2, showed no significant differences in Cu retention of technosols compared to the control soil. At RI_1, there were no significant differences in Zn retention of technosols compared to the control. At RI_2, only a25 showed significantly lower Zn retention efficiency than the control (p= 0.03). Total retention efficiencies of technosols showed no significant differences compared to the control. However, across all soils, retention efficiencies for Cu and Zn were significantly reduced at higher rainfall intensity (p = 0.003 and p < 0.001, respectively).

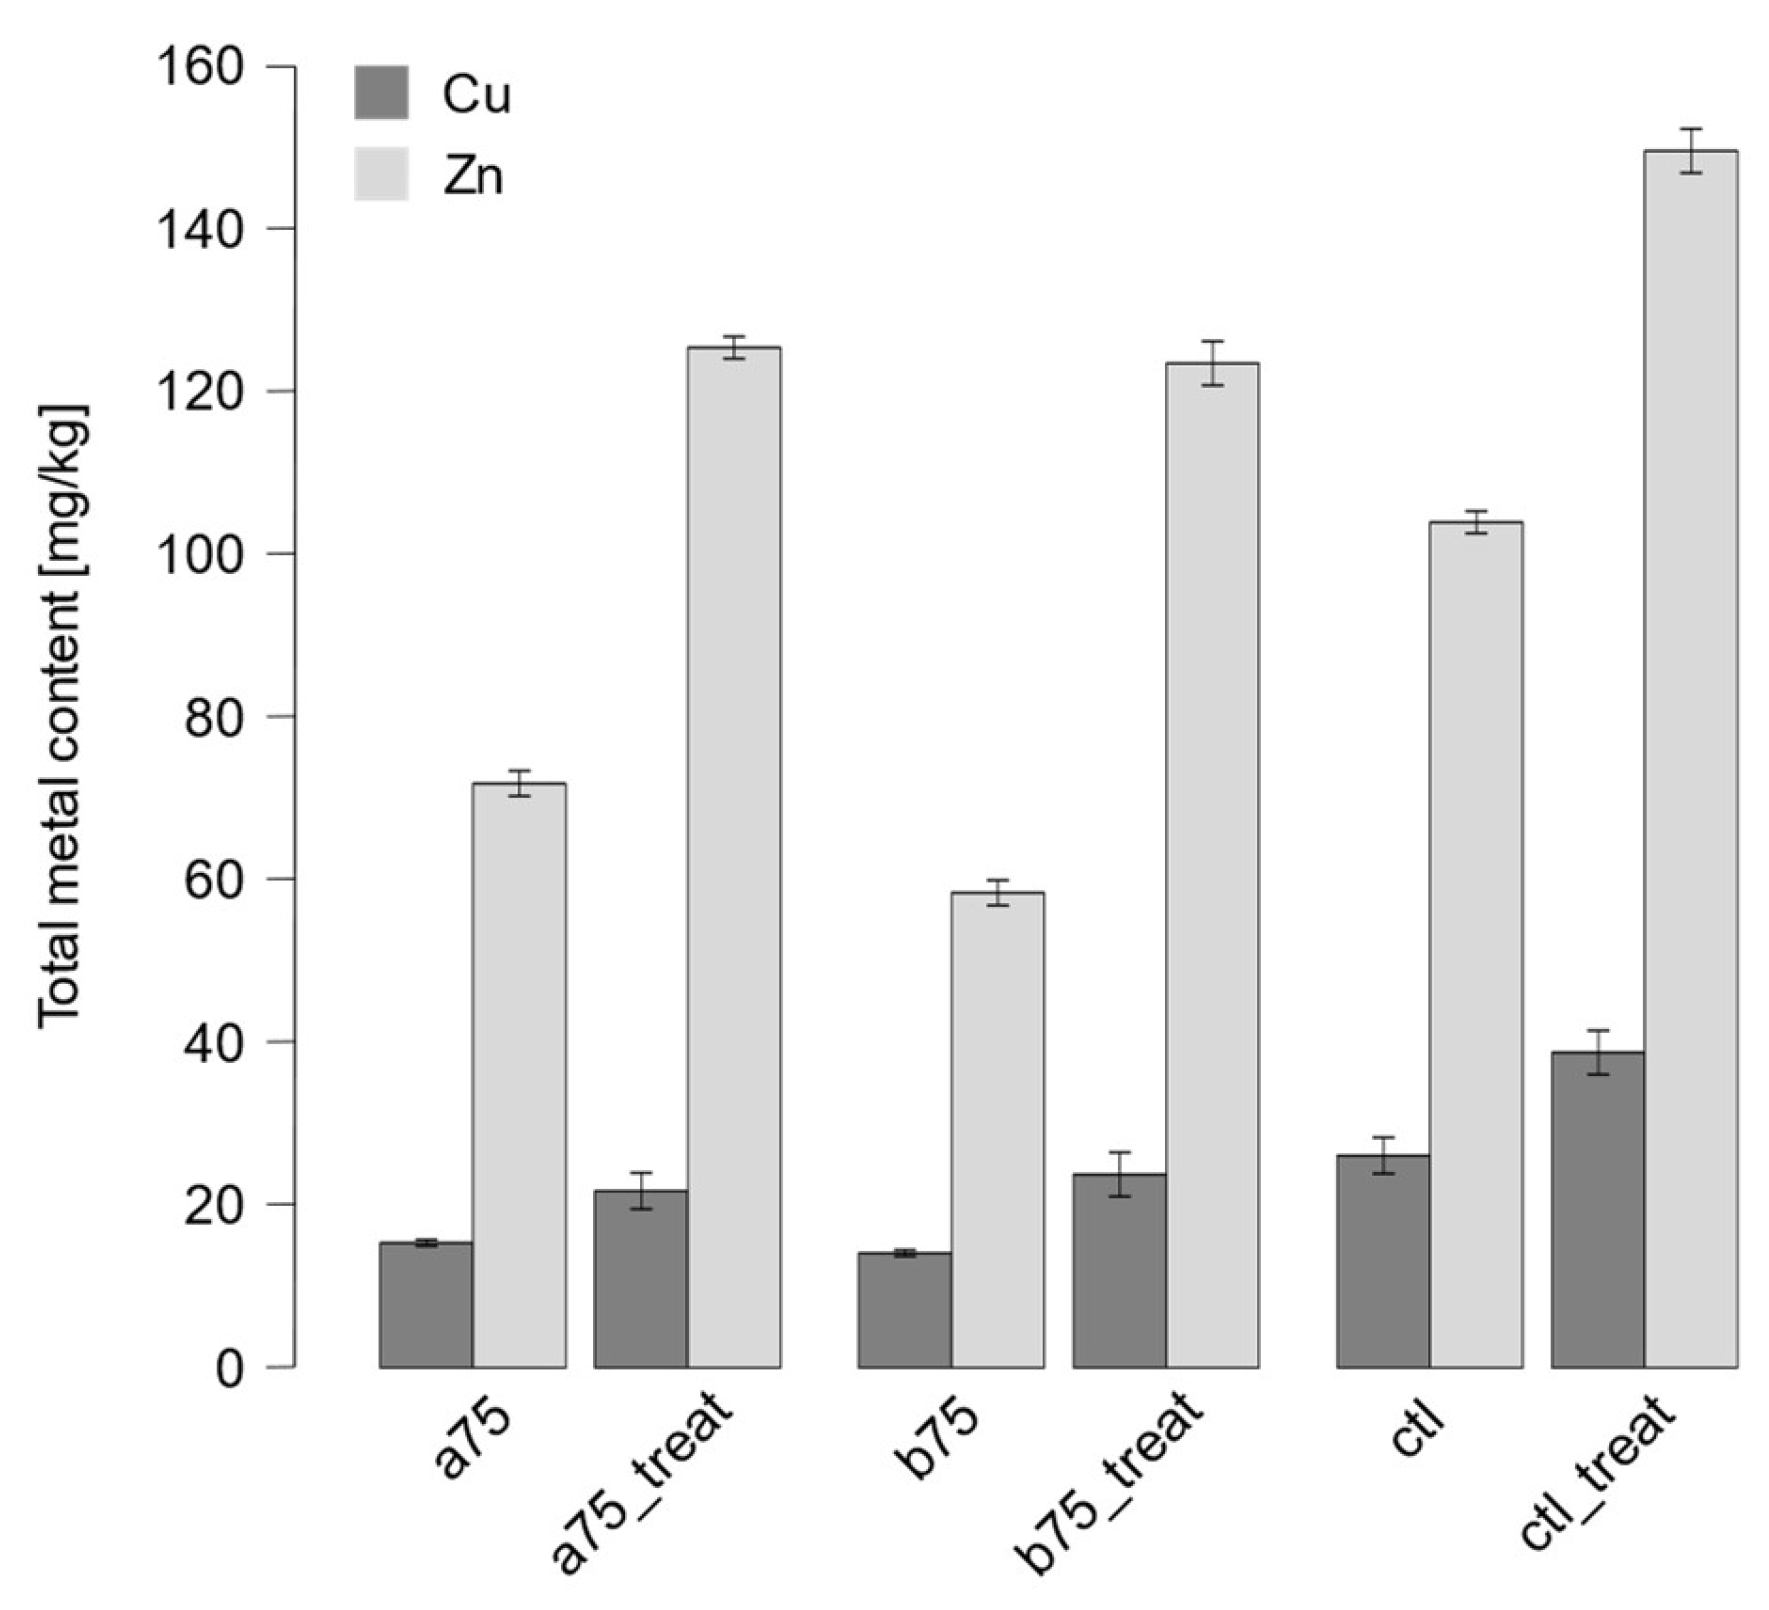
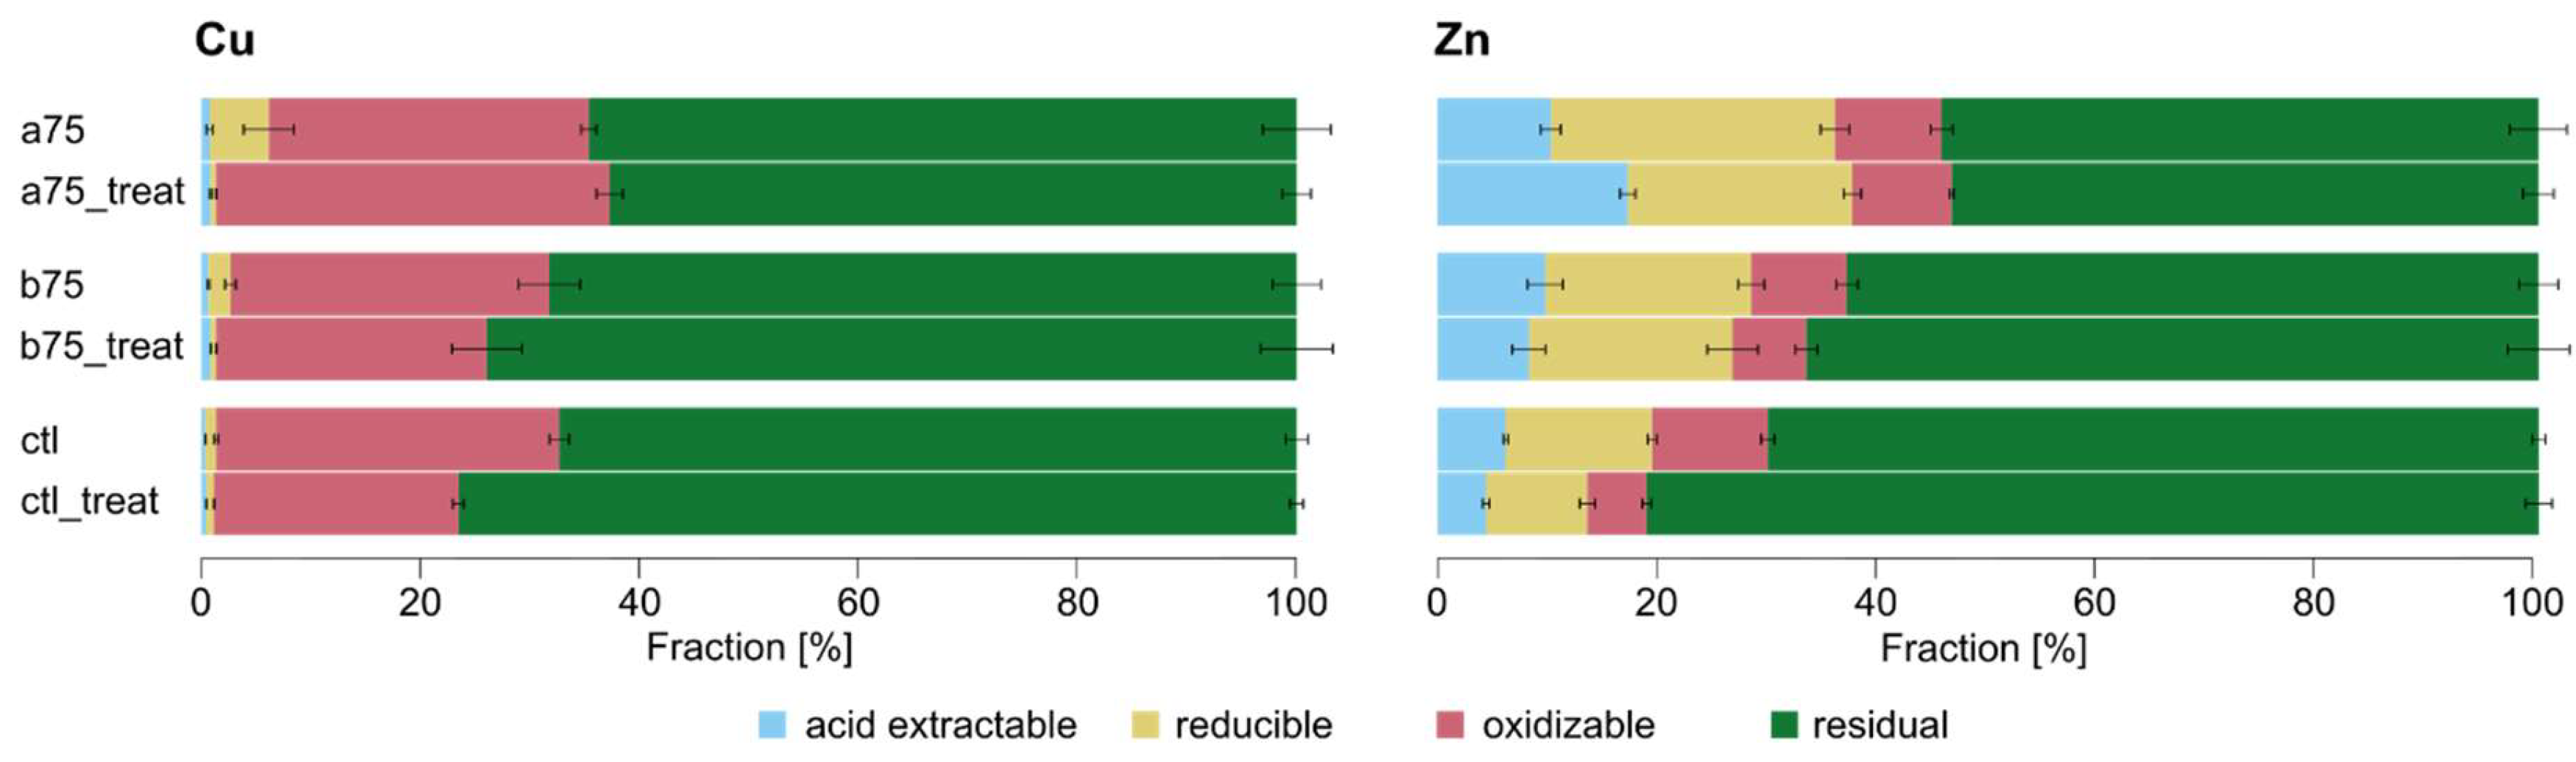
3.3. Sequential Extraction of Cu and Zn

After treatment with TAR, Cu and Zn accumulation was measured in the technosols a75 and b75 and the control (Figure 4).
Based on the sequential extraction, the residual Cu fraction was the dominant component in all samples and always accounted for more than 60% of the total content (Figure 5). In the untreated substrates, the residual Cu content is higher in ctl compared to a75 and b75. The following order was determined in the treated soils: ctl_treat > b75_treat > a75_treat.
The second largest Cu fraction in all substrates was the oxidizable, accounting for approximately 30% in the untreated soils, 22.3 % in ctl_treat and 35.9 % in a75_treat. Again, in the untreated substrates, the Cu contents were higher in ctl compared to a75 and b75. A similar pattern was seen in the treated substrates: ctl _treat > a75_treat > b75_treat.
The reducible and acid-exchangeable Cu fractions were < 1 mg/kg in all samples, and each represented less than 2% of the total contents. An exception was a75, where 0.87 mg/kg was measured for the acid exchangeable Cu fraction, corresponding to 5.45 %.
Considering the relative frequencies of mobilizable Cu (sum of S1-S3), a75_treat and b75_treat showed increased mobile phases of Cu compared to ctl_treat.
In summary, the proportion of the residual Cu fraction increased after treatment while the mobile Cu phases (S1-S3) decreased, except for a75_treat. The mobile Cu phase increased slightly, shifting from reducible to oxidizable fractions.
Of all treated soils, ctl_treat had the highest total Zn content, followed by a75_treat and b75_treat. However, the content of Zn in the untreated substrates was also higher in ctl than in a75 and b75. In the untreated soils, the fractionation obtained from BCR-SEP for a75 and b75 was as follows: residual >> reducible >> acid exchangeable > oxidizable, while for ctl, the order was: residual >> reducible > oxidizable > acid exchangeable. In the treated substrates, the fractionation in ctl_treat was identical to ctl, while in a75_treat and b75_treat, it was: residual >> reducible > acid exchangeable > oxidizable.
The residual Zn fraction was dominant in all samples. The reducible Zn fraction was the second largest in all samples. The highest reducible Zn fraction was found in substrate a75, followed by ctl and b75. The treated samples showed the following order: a75_treat > b75_treat > ctl_treat. The substrates a75 and b75 differ from ctl in terms of Zn fractionation. In the control soil, the oxidizable Zn fraction ranked third in the untreated and treated. In a75 and b75, the acid exchangeable Zn fraction was the third largest.
The lowest Zn contents of ctl were found in the acid exchangeable fraction, both treated and untreated. For a75 and b75, the oxidizable Zn fraction was the smallest in treated and untreated. In summary, the residual fraction increases after TAR treatment while the mobile phase decreases, except in a75_treat. There, the proportion of the mobile Zn phase remains nearly unchanged, with a shift of the reducible fraction towards the acid-exchangeable fraction.
Comparison of the soils after TAR treatment
To assess shifts in the chemical bindings of Cu and Zn after treatment with TAR, the treated substrates’ mean Cu and Zn contents were subtracted from those of the untreated soils (Table 4). The most pronounced shifts of Cu contents were found for a75, where oxidizable Cu was nearly as high as residual Cu, showing a decrease in reducible Cu on the other hand. b75 also showed a relative increase in oxidizable Cu, albeit less pronounced. In ctl, most Cu accumulation occurred in the residual phase. Analogous, the most pronounced shifts of Zn were found in a75, where a significant accumulation of Zn was found in the acid exchangeable phase, and only half of the Zn accumulation was found in the residual phase. In b75, most of the Zn accumulation occurred in the residual phase. In ctl, all highly mobile phases stayed the same or decreased, and only the residual phase increased.

4. Discussion

4.1. Risk of Substance Release

Except for Cr(VI) and V, the leaching of substances obtained from batch tests at L/S 2 was largely unremarkable compared to the German threshold values for soil solution TV_2. Concentrations of Cr(VI) in both RCM1 and RCM2 exceeded the threshold value substantially. However, Cr(VI) concentrations were below the threshold value in the six technosols, which will be normally applied in practice. The concentration of V in RCM1 exceeded the threshold value TV_2 and was substantially higher than in RCM2. Hence, while V concentrations were lowest in the control, in the technosols, we see a dose-response of V with an increasing ratio of RCM1, which, in contrast, is vaguer for RCM2. Crushed bricks release substantially more sulfate, Cr, and V than crushed concrete [24]. Vanadium release from CDW that contains bricks can be three times higher than in CDW based solely on concrete [13]. Our data confirm that an increased proportion of bricks in the CDW increases the release of some elements like Cr and V [13,24,25,26]. While in German legislation, an L/S-dependent decay behavior is assumed to evaluate recycled building materials for Cr discharges, there is no generalizable decay behavior for V [27]. While the high pH of mixed CDW is related more to its concrete than its brick phase [24], in our study, the pH of both CDW mixtures derived from the batch tests was high (> 10, cf. Table 3). Over time, the increased specific surface area and increased air and water supply during storage facilitate the carbonation of crushed CDW [13], resulting in a pH between 8 and 9 [28,29,30,31] while partly carbonated CDW is suggested to have a pH 10.5 to 11.9 [29,32]. This indicates that the CDW mixtures were not yet carbonated as they were sampled. Carbonation is associated with increased leaching of anionic compounds when the aging of concrete leads to the release of sulfate and its substituting ions, chromate, and vanadate [13,33]. Consequently, in our study, the sulfate leaching from the mixed CDW, the technosols, and the control correlated strongly with the leaching of Cr(VI) (r² = 0.81) and V (r² = 0.71). Furthermore, V release in soils is supposed to correlate to higher pH [34]. Therefore, we attribute the reduced release of V from the soil to a reduction in the pH value by adding soils with a neutral pH and to a reduced release of sulfate in the technosol mixtures. For EC, we observed a dose-dependent response, increasing with higher ratios of both RCM 1 and RCM 2.

4.2. Retention and Binding

The traffic area runoff TAR concentrations of Cu and Zn used as influent in this study were comparable with concentrations reported for urban roads with AADT > 15,000 vehicles [1]. The Zn/Cu ratio at RI_1 was 3.4, which concurs with the literature [1]. However, Zn concentrations and thus Zn/Cu ratio of TAR used for RI_2 (0.8) were lower than expected. We attribute this to the different sampling periods. The TAR for RI_1 was sampled in late winter/early spring, whereas the TAR for RI_2 was sampled during the summer months. In winter, metal loadings in traffic area runoff are expected to be higher, which is often caused by the application of de-icing salts and increased corrosion rates [1,35,36].
Metals from TAR were found to bind to soil particles by precipitation or adsorption, forming strong bonds that are difficult to change under typical environmental conditions [1,37]. Copper occurs in topsoils in oxic conditions, mostly in oxidation state II, and is not very exchangeable at pH > 5; its solution concentration is mainly determined by adsorption and desorption, depending on pH and soluble, organic or inorganic complexing agents [38]. We assume that due to the high carbonate content of the soils analyzed, Cu is present in the form of carbonate and organometallic complexes [38]. In addition, we assume that the microbial degradation of the substrate compost releases soluble organic complexing agents and promotes the mobilization of adsorbed Cu [38]. On the other hand, the content of exchangeable Zn is very low at pH > 6.5 as Zn2+, Zn(OH)+, and ZnCO3 are mainly present here, of which Zn(OH)+ in particular increases proportionally with increasing pH and is specifically adsorbed and fixed by oxides [38]. Furthermore, metals transported by the TAR to roadside soils are bound to particles, which in turn are largely retained by physical mechanisms, particularly in the upper soil layers [2,39]. Therefore, metal mobilities were determined in roadside soils depending on pH and organic matter [40,41,42].
Accordingly, Zn retention in our study was higher than Cu retention, comparable to findings reported from the US [43]. Our study found no correlations between Cu and Zn discharge in the effluents and its pH, EC, or DOC. Although DOC concentrations in the effluents were higher than in the influents (presumably due to the addition of compost), we suggest that due to the high charging rates applied in our study, retention times in the soil were not long enough to promote the complexation of Cu and organic matter. In addition, we can rule out unfavourable redox conditions due to the high oxygen content in the effluents. As the Cu and Zn retentions measured for RI_2 were significantly lower than RI_1, we consider it rather likely that the mechanical filtering effect of the coarse-grained soils with high water permeability was no longer present at the high charging rate. Hence, we assume that retention of particulate-bound Cu and Zn was impaired. This assumption is supported by the fact that there was no backwater in the plots during the irrigations, even at a high charging rate. Nevertheless, the Cu and Zn retentions of the studied technosols were not significantly lower than that of the control. The effluent concentrations of Cu and Zn of all analyzed technosols and the control were below the threshold of the German BBodSchV.
After the treatment with TAR, the direct AR pseudo-total analysis was generally unable to extract the same metal content as the sum of the BCR-SEP fractions (S1-4). However, we found accumulations compared to the non-treated soils for Cu and Zn. The relatively lower concentrations in the pseudo-total can also be reflected in the pseudo-accuracy of the reference material BCR-701, with the residual fraction slightly overestimated and the direct AR pseudo-total rather underestimated (cf. Table A5). The large difference cannot be fully explained. Possible reasons could be that the samples were not ground before direct digestion, leading to incomplete extraction of metal concentrations and that the AR digestion technique is more accurate for analyzing the residue than the raw material [19]. Davidson, et al. [44] and Rommel, Stinshoff and Helmreich [19] reported comparable deviations of summarized SEP fractions and pseudo-total digestion from sequential extractions of soil and filter media, respectively. Also, for these reasons, the recoveries are sometimes very poor (cf. Table A5). They are in the 109-234% range, which means that the sum of the fractions of metal concentrations is sometimes more than twice as high as the pseudo-total. Ideally, the values should be between 80-120% [45].
For Cu and Zn, the residual fraction increases slightly after treatment (approx. 2-11%), except in a75_treat, where a small increase in the mobile phase was observed. The residual fraction is >53% in all substrates. Due to the pseudo-accuracy calculated for this fraction, we attribute discrepancies to overestimating the residual fraction. Sutherland, et al. [46] reported lower residual fractions of Cu (35 %) and Zn (21%) in road-deposited sediments (RDS). In contrast, Pérez, López-Mesas and Valiente [37] found residual fractions of up to 80% for Cu in RDS. Rommel, Stinshoff and Helmreich [19] have found comparably high residual fractions in carbonate sand used to treat TAR from the same origin we used in this study. Zn and Cu are found predominantly in particulate form in traffic area runoff TAR, making the upper soil layer critically important. In this layer, metals are primarily retained mechanically by sedimentation and filtration, while chemical processes such as adsorption and binding to organic matter also contribute significantly to their immobilization [1,2]. Rommel, Stinshoff and Helmreich [19] sampled the TAR used in this study at the same sampling site as in this study and found concentrations of total Cu and Zn approx. 7 times higher than dissolved Cu and Zn.
For Cu, the oxidizable fraction is the second largest (approx. 22 to 36 %), while for Zn, it is negligible (about 5 to 11 %). In a75, treatment with TAR caused a shift of Cu from the reducible fraction (from 5.5 to 0.45 %) to the oxidizable fraction (from 29.2 to 35.9 %). Bacon and Davidson [47] point out that Cu expected in the oxidizable can also be released in the reducible phase, making interpretation difficult. Similar contents in the oxidizable fraction (approximately 26 %), which also correlate with organic carbon, were observed by Sutherland, et al. [48] and Kartal, et al. [49] in studies of RDS in Honolulu, Hawaii, and Kayseri, Turkey (cf. Table A6).
a75_treat also shows a shift of Zn, with a decrease in the reducible fraction (from 25.8 to 20.4 %) and an increase in the acid-exchangeable fraction (from 10.3 to 17.3 %). The latter, the most mobile and potentially harmful fraction, is strongly influenced by pH. Metals become more mobile the more acidic the soil. This behaviour is opposite to the pH in the substrates, especially for a75_treat and a75_treat. Bacon and Davidson [47] also found that a phase shift can occur during the extraction of Zn, which can distort the results. The findings of this study differ from other studies, where higher fractions of acid-exchangeable Zn were reported, ranging from 25 to 38 % [37,46,48,49].
A comparison of only the mobile fraction (S1-S3) shows a similar pattern in fractionation for Zn in the substrates a75_treat and b75_treat as in other studies [46,48,49]. However, the proportions of the individual fractions vary considerably, with overall higher Cu and Zn contents, especially in the acid-exchangeable fraction reported in these comparative studies.
No comparable pattern emerges for Cu. However, [37] reported a similar sequence of fractions, with the residue even accounting for about 80 %. In contrast, Kartal, Aydın and Tokalıoğlu [49] and Sutherland, Tack and Ziegler [46] reported the following order for Cu: acid-exchangeable < oxidizable < reducible. In contrast to b75_treat and ctl_treat, in a75_treat was an increase of Cu in both the mobile and residual phase.
b75, which contains higher proportions of concrete, mortar, and plaster, shows favourable distribution ratios than a75. This finding is in concordance with Pallewatta, et al. [50], who have found better retention in concrete-based waste than in masonry-based waste. Barrett, Katz and Taylor [3] point out that Portland cement concrete in roadside soils fosters metal retention mainly by controlling pH and precipitation. Furthermore, we hypothesize that in a75, where higher iron contents due to a higher brick ratio are to be expected, the presence of humic-coated Fe-oxide colloids combined with also higher Ca contents inherent in the CDW promotes the transport of Cu [51]. On the other hand, high Cu retention [6,7] and Zn retention [52] were found for brick or brick-dominated aggregates.
However, despite overall comparable Cu and Zn retentions when charged with TAR, both CDW-amended technosols showed unfavourable binding properties compared to the control. This is due to relative increases of mobile Cu and Zn phases which could be released by various environmental influences (e.g., changes in pH, de-icing salt input, enrichment of organic matter).

5. Conclusions

Technosols amended with brick-dominated CDW showed an dose-dependent increased leaching potential of V, which correlates with sulfate emissions. Therefore, V and sulfate content should always be analyzed and high contents should be avoided when bricks are used to amend topsoils of infiltration swales to not harm groundwater quality. However, CDW-amended technosols can be used in infiltration swales regarding the retention of metals from traffic area runoff. They had comparable Cu and Zn retentions as the control soil with the same particle size distribution. Considering the chemical binding of Cu and Zn, the amendment of concrete-dominated CDW is favourable to brick-dominated CDW. Still, both showed an increase of mobile Cu and Zn phases compared to the control, implying an increased potential for desorption and remobilization. Considering sustainability, using recycled construction and demolition waste in infiltration swales could be a sustainable solution for reducing CO2 emissions and resource consumption.

Author Contributions

SK: Conceptualization; Data curation; Formal analysis; Funding acquisition; Investigation; Methodology; Project administration; Resources; Software; Supervision; Validation; Visualization; Writing — original draft. JM: Investigation; Writing — review and editing. PS: Writing — review and editing. BH: Supervision; Writing — review and editing. All authors have read and agreed to the published version of the manuscript.

Funding

This research was funded by the City of Munich, Municipal Department and contributes to the EU URBACT project URGE (circUlaR buildinG citiEs). Parts of this work were additionally funded by The German Research Foundation (DFG) funds the Research Training Group Urban Green Infrastructure – Training Next Generation of Professionals for Integrated Urban Planning Research (GRK 2679/1).

Data Availability Statement

The data presented in this study are available on request from the corresponding author due to legal restrictions from the funding partner.

Acknowledgments

The authors thank Myriam Reif, Wolfgang Schröder, Dr. Carolin Heim, and Maximilian Damberger from the Technical University of Munich for their technical and analytical support. The authors thank the City of Munich’s Municipal Department for funding this study.

Conflicts of Interest

The authors declare no conflicts of interest. The funders had no role in the study’s design, in the collection, analyses, or interpretation of data, in the writing of the manuscript, or in the decision to publish the results.

Abbreviations

The following abbreviations are used in this manuscript:
AR Aqua regia
BCR Community Bureau of Reference, European Commission
CDW Construction and demolition waste
RCM Recycling mixture (in this study: crushed aggregates of mixed CDW)
RDS Road-deposited sediments
SEP Sequential extraction procedure
TAR Traffic area runoff
TV_1 Threshold values for seepage water according to BBodSchV
TV_2 Threshold values for soil solution according to BBodSchV

Appendix A

Table A1. List of methods, limits of quantification (LOQ), and threshold values according to BBodSchV.
Substance Method LOQ Unit BBodSchV [15]
TV_1 TV_2
Batch tests
pH DIN 38404-5: 2009-07
EC DIN EN 27888: 1993-11 10 µS/cm
Sb AR DIN EN ISO 17294-2: 2017-01 5 µg/L 5 10
As AR DIN EN ISO 17294-2: 2017-01 5 µg/L 10 25
Pb AR DIN EN ISO 17294-2: 2017-01 5 µg/L 10 85
B AR DIN EN ISO 17294-2: 2017-01 50 µg/L 1000 1000
Cd AR DIN EN ISO 17294-2: 2017-01 0.5 µg/L 3 7,5
Cr AR DIN EN ISO 17294-2: 2017-01 5 µg/L 50 50
Cr(VI) AR DIN ISO 15923-1: 2014-07 5 µg/L 8 8
Co AR DIN EN ISO 17294-2: 2017-01 5 µg/L 10 125
Cu AR DIN EN ISO 17294-2: 2017-01 5 µg/L 50 80
Mo AR DIN EN ISO 17294-2: 2017-01 5 µg/L 35 70
Ni AR DIN EN ISO 17294-2: 2017-01 5 µg/L 20 60
Hg AR DIN EN ISO 12846: 2012-08 0.2 µg/L 1 1
Se AR DIN EN ISO 17294-2: 2017-01 5 µg/L 10 10
Tl AR DIN EN ISO 17294-2: 2017-01 0.5 µg/L
V AR DIN EN ISO 17294-2: 2017-01 2 µg/L 4 70
Zn AR DIN EN ISO 17294-2: 2017-01 50 µg/L 600 600
Sn AR DIN EN ISO 17294-2: 2017-01 20 µg/L
DOC Filtration 0.45 µm DIN 1484 1 mg/l
Cl DIN ISO 15923-1: 2014-07 2 mg/l
SO4 DIN ISO 15923-1: 2014-07 2 mg/l
F DIN 38405-4: 1985-07 0.2 mg/l 1,5
Retention tests
pH on-site
EC on-site µS/cm
O2 on-site mg/L
Cu AR DIN EN ISO 17294-2: 2017-01 µg/L 50
Zn AR DIN EN ISO 17294-2: 2017-01 µg/L 600
Table A2. Mann-Whitney U statistics and p-values for Cu and Zn concentrations in the effluent of the technosols compared to the control.
Element Rain intensity Technosol U Statistic p-value
Cu 121 L/(s·ha) a75 21 0.732
a50 33 0.019
a25 36 0.005
b75 28 0.142
b50 36 0.005
b25 30 0.073
221 L/(s·ha) a75 18 1.000
a50 8 0.132
a25 12 0.394
b75 11 0.310
b50 15 0.699
b25 11.5 0.336
Zn 121 L/(s·ha) a75 19 0.935
a50 13 0.452
a25 26.5 0.196
b75 16.5 0.870
b50 14.5 0.618
b25 12 0.357
221 L/(s·ha) a75 21.5 0.630
a50 6.5 0.078
a25 31 0.041
b75 19 0.937
b50 28 0.132
b25 14 0.589
Table A3. Mean background concentrations and mean influent and effluent concentrations from TAR treatment; L/S = liquid to solid ratio at the beginning of TAR treatment; inf = inflow; n.a. = not analyzed.
Mean background concentrations (n = 4) Concentrations rain intensity RI_1 (n = 6) concentrations rain intensity RI_2 (n = 6)
L/S Cu [µg/L] Zn [µg/L] DOC [mg/L] Cu [µg/L] Zn [µg/L] DOC [mg/L] pH EC [µS/cm] Cu [µg/L] Zn [µg/L] DOC [mg/L] pH EC [µS/cm]
inf n.a. n.a. n.a. n.a. 73.4
±61.5
247
±169
7.4
±3.9
7.8 ±0.1 2,588 ±2,128 84.7
±34.6
68.1
±20.5
10.4 ±0.9 7.8 ±0.1 351 ±218
a75 0.51 6.5 ±2.6 6.5 ±2.6 35 ±14 7.0
±5.1
17.5
±13.8
15.4
±6.7
7.7
±0.1
2,648
±1060
17.1
±2.4
19.6
±3.6
21.6
±1.5
7.8
±0.1
683
±286
a50 0.57 7.0 ±3,5 5 ±0 31 ±13 12.7
±4.4
14.6
±14.3
16.2
±7.1
7.9
±0.3
2,471
±948
12.7
±4.3
15.7
±1.5
200.6
±3.1
7.8
±0.1
697
±3389
a25 0.55 6.5 ±2.6 5 ±0 38 ±18 15.3
±4.7
24.8
±18.8
9.4
±3.9
7.5
±0.1
2,896
±1520
15.4
±3.1
38.5
±24.3
13.6
±1.1
7.9
±0.0
643
±268
b75 0.47 5 ±0 5 ±0 23 ±10 9.5
±5.5
11.6
±9.1
11.6
±5.3
7.7
±0.1
2,270
±516
15.1
±2.9
21.8
±7.4
16.5
±0.8
7.8
±0.0
698
±277
b50 0.57 5 ±0 5 ±0 20 ±7 19.4
±12.9
9.7
±9.5
11.0
±5.1
7.9
±0.3
2,590
±901
16.9
±3.8
27.3
±6.7
16.1
±0.8
7.8 ±0.1 688
±330
b25 0.82 5 ±0 5 ±0 20 ±9 14.5
±9.3
8.3
±4.8
10.1
±4.6
7.8
±0.1
2,643
±829
15.7
±1.8
18.6
±6.2
15.5
±1.9
7.7 ±0.1 703
±323
ctl 0.84 5 ±0 7.0 ±3.5 14 ±5 5.0
±2.8
14.1
±15.1
11.6
±5.4
7.9
±0.2
2,099
±453
17.4
±2.9
20.2
±6.6
16.9
±1.9
7.7
±0.0
576
±257
Table A4. Total loads [mg] and load based retention [%] of Cu and Zn per substrate and rain intensity RI.
Cu Zn
Influent load Effluent load Retention Influent load Effluent load Retention
a75 RI_1 101 2.8 94.8 ±3.3 158 7.4 95.5 ±1.7
RI_2 27.4 7.5 50.3 ±27.4 27.2 8.4 66.3 ±14.6
Total 128 10.3 72.5±0.4 185 15.8 80.9±18.0
a50 RI_1 110 6.1 88.0 ±8.4 225 5.6 96.2 ±4.4
RI_2 46.0 6.0 71.5 ±20.6 40.2 7.3 73.9 ±15.7
Total 156 12.0 79.8±0.3 265 12.9 85.0±16.0
a25 RI_1 146 6.0 78.3 ±29.3 191 12.7 93.7 ±2.0
RI_2 131 6.2 69.6 ±37.1 40.4 14.6 48.2 ±32.9
Total 276 12.2 73.9±0.6 232 27.3 71.0±32.6
b75 RI_1 80.9 4.0 86.8 ±15.6 172 5.3 96.8 ±2.0
RI_2 31.5 5.9 66.1 ±19.7 39.4 8.5 76.9 ±12.6
Total 112 9.9 76.5±0.3 211 13.8 86.9±13.4
b50 RI_1 111 8.5 83.5 ±13.8 2134 4.5 97.2 ±2.9
RI_2 54.5 6.7 77.9 ±18.7 77.8 10.6 83.3 ±8.4
Total 166 15.2 80.7±0.2 292 15.1 90.3±9.3
b25 RI_1 130 5.1 90.5 ±13.1 320 2.7 98.0 ±1.8
RI_2 56.4 5.5 80.6 ±19.2 89.1 6.7 82.2 ±15.7
Total 187 10.5 85.6±0.2 410 9.4 90.1±13.7
ctl RI_1 75.7 2.1 90.2 ±8.5 150 7.3 93.2 ±5.3
RI_2 105 7.3 78.7 ±22.8 48.9 9.1 75.5 ±13.0
Total 181 9.4 73.9±17.6 199 16.3 84.3±13.3
Table A5. Cu and Zn content in S1 to S4 and their sum of the non-irrigated substrates a75, b75, and ctl and with TAR irrigated a75_treat, b75_treat, and ctl_treat, reported as mean values ± standard deviation; additionally pseudo-total content and the recovery as a difference between sum S1-S4 and Pseudo-total.
Sample S1
Acid exchangeable
S2
Reducible
S3
Oxidizable
S4
Residue
Sum
S1-S4a
Pseudo-total b Recovery
[mg/kg] [%] [mg/kg] [%] [mg/kg] [%] [mg/kg] [%] [mg/kg] [mg/kg] [%]
Cu a75 0.13
±0.06
0.82
±0.3
0.87
±0.48
5.45
±2.9
4.66
±0.26
29.2
±0.9
10.3
±0.42
64.5
±3.8
16.1
±0.69
8.28 193
b75 0.1
±0.0
0.68
±0.1
0.28
±0.03
1.91
±0.6
4.33
±1.28
29.6
±3.4
9.94
±1.59
67.9
±2.7
14.7
±2.04
7.57 194
ctl 0.1
±0.0
0.37
±0.0
0.28
±0.03
1.04
±0.2
8.41
±0.83
31.2
±1.1
18.2
±2.63
67.4
±1.3
27.1
±2.76
14.6 185
a75_treat 0.2
±0.0
0.89
±0.1
0.1
±0.0
0.45
±0.0
8.05
±0.34
35.9
±1.5
14.1
±1.57
62.8
±1.6
22.5
±1.61
17 132
b75_treat 0.22
±0.0
90
±0.1
0.11
±0.0
0.45
±0.0
6.04
±0.67
24.6
±4.0
18.2
±2.1
74.1
±4.0
24.6
±2.2
10.5 234
ctl_treat 0.2
±0.0
0.5
±0.0
0.27
±0.02
0.67
±0.0
8.93
±0.49
22.3
±0.7
30.7
±2.81
76.6
±0.7
40.1
±2.91
18 223
Zn a75 7.65
±1.16
10.3
±1.0
19.1
±0.88
25.8
±1.6
7.21
±0.76
9.7
±1.3
40.3
±4.43
54.2
±3.1
74.3
±1.23
61.9 120
b75 5.73
±0.50
9.49
±2.0
11.4
±3.08
18.9
±1.5
5.37
±1.79
8.89
±1.2
37.9
±8.7
62.8
±2.2
60.4
±4.33
49.6 122
ctl 6.66
±0.18
6.2
±0.3
14.3
±1.3
13.3
±0.5
11.2
±0.39
10.5
±0.8
75.3
±5.54
70.1
±0.7
107
±12.4
79.6 135
a75_treat 22.4
±1.16
17.3
±0.8
26.5
±0.62
20.4
±1.0
11.6
±0.07
8.98
±0.2
69.2
±4.09
53.3
±1.8
131
±7.18
108 120
b75_treat 10.4
±1.27
8.17
±1.9
23.3
±2.20
18.3
±2.8
8.68
±2.59
6.8
±1.2
85.3
±15.9
66.8
±3.5
128
±4.32
60.1 213
ctl_treat 6.75
±0.16
4.36
±0.3
14.2
±0.41
9.2
±0.8
8.32
±0.15
5.38
±0.4
125
±11.4
81.1
±1.5
155
±8.90
69.4 223
a Sum of means of S1-S4, b Values from single determination
Table A6. Comparison of the sequentially extracted fractions of Cu and Zn in this study with data from the literature; RDS = Road desposited sediment or similiar.
Type S1
Acid exchangeable [%]
S2
Reducible [%]
S3
oxidizable [%]
S4
residual [%]
total [mg/kg]
Cu
a75 Technosol 0.8 ±0.3 5.4 ±2.3 29.2 ±0.7 64.6 ±3.1 15.9 ±0.4
a75_treat Technosol 0.9 ±0.1 0.5 ±0.0 35.9 ±1.2 62.7 ±1.3 22.5 ±1.6
b75 Technosol 0.7 ±0.1 2.0 ±0.5 29.1 ±2.8 68.2 ±2.2 14.6 ±2.3
b75 _treat Technosol 0.9 ±0.0 0.5 ±0.0 24.7 ±3.2 73.9 ±3.3 24.6 ±1.4
ctl Soil 0.4 ±0.0 1.0 ±0.2 31.3 ±0.9 67.3 ±1.0 27.0 ±2.8
ctl_treat Soil 0.5 ±0.0 0.7 ±0.0 22.3 ±0.5 76.5 ±0.6 40.1 ±2.8
[46] RDS 7.0 ±1.4 37.2 ±2.6 20.5 ±2.2 35.3 ±3.1 409.0
[49] RDS 6.0 43.6 25.5 24.9 84.2
[37] RDS 1.9 8.2 10.3 79.6 670.0
[48] RDS 4.9 ±1.2 23.6 ±3.1 26.2 ±3.2 45.4 ±3.9 163.0
[53] RDS 7.3 44.6 26.8 21.3 207.0
[19] Carbonate sand 2.6 ±0.1 1.6 ±0.2 16.7 ±0.4 79.1 ±6.6 137 ±8
Zn
a75 Technosol 10.3 ±0.9 25.8 ±1.3 9.7 ±1.0 54.2 ±2.6 74.3 ±4.2
a75_treat Technosol 17.3 ±0.7 20.4±0.8 9.0 ±0.2 53.3 ±1.4 129.7 ±3.3
b75 Technosol 9.8 ±1.6 18.7 ±1.2 8.7 ±1.0 62.8 ±1.8 60.4 ±11.1
b75 _treat Technosol 8.3 ±1.5 18.5 ±2.3 6.7 ±1.0 66.5 ±2.8 128 ±15.0
ctl Soil 6.2 ±0.2 13.3 ±0.4 10.5 ±0.6 70.0 ±0.6 107.5 ±5.6
ctl_treat Soil 4.4 ±0.3 9.2 ±0.7 5.4 ±0.4 81.0 ±1.2 155 ±9.2
[46] RDS 27.2 ±2.5 42.1 ±2.0 9.5 ±0.6 21.2 ±1.6 671
[49] RDS 25.1 55.1 9.6 10.2 443
[37] RDS 28.8 28.9 14.1 28.3 640
[48] RDS 32.7 ±2.2 36.6 ±1.5 8.3 ±1.3 22.4 ±2.1 471
[53] RDS 26.7 42.5 13.2 17.6 344
[54] RDS 33.2 29.7 20.9 16.2 113.0
[19] Carbonate sand 14.4 ±0.1 10.4 ±0.7 6.7 ±0.9 68.5 ±4.6 813 ±37

References

  1. Huber, M.; Welker, A.; Helmreich, B. Critical review of heavy metal pollution of traffic area runoff: Occurrence, influencing factors, and partitioning. Sci Total Environ 2016, 541, 895–919. [Google Scholar] [CrossRef] [PubMed]
  2. Werkenthin, M.; Kluge, B.; Wessolek, G. Metals in European roadside soils and soil solution – A review. Environmental Pollution 2014, 189, 98–110. [Google Scholar] [CrossRef]
  3. Barrett, M.; Katz, L.; Taylor, S. Removal of Dissolved Heavy Metals in Highway Runoff. Transportation Research Record 2014, 2436, 131–138. [Google Scholar] [CrossRef]
  4. Gavrić, S.; Leonhardt, G.; Österlund, H.; Marsalek, J.; Viklander, M. Metal enrichment of soils in three urban drainage grass swales used for seasonal snow storage. Science of The Total Environment 2021, 760, 144136. [Google Scholar] [CrossRef]
  5. DWA. Arbeitsblatt DWA-A 138-1 - Anlagen zur Versickerung von Niederschlagswasser - Teil 1: Planung, Bau, Betrieb. 2024. [Google Scholar]
  6. Zhang, X.; Guo, S.; Liu, J.; Zhang, Z.; Song, K.; Tan, C.; Li, H. A Study on the Removal of Copper (II) from Aqueous Solution Using Lime Sand Bricks. Applied Sciences 2019, 9, 670. [Google Scholar] [CrossRef]
  7. Wang, J.; Zhang, P.; Yang, L.; Huang, T. Adsorption characteristics of construction waste for heavy metals from urban stormwater runoff. Chinese Journal of Chemical Engineering 2015, 23, 1542–1550. [Google Scholar] [CrossRef]
  8. Caro, D.; Lodato, C.; Damgaard, A.; Cristóbal, J.; Foster, G.; Flachenecker, F.; Tonini, D. Environmental and socio-economic effects of construction and demolition waste recycling in the European Union. Science of The Total Environment 2024, 908, 168295. [Google Scholar] [CrossRef] [PubMed]
  9. Soto-Paz, J.; Arroyo, O.; Torres-Guevara, L.E.; Parra-Orobio, B.A.; Casallas-Ojeda, M. The circular economy in the construction and demolition waste management: A comparative analysis in emerging and developed countries. Journal of Building Engineering 2023, 78, 107724. [Google Scholar] [CrossRef]
  10. Deeb, M.; Groffman, P.M.; Blouin, M.; Egendorf, S.P.; Vergnes, A.; Vasenev, V.; Cao, D.L.; Walsh, D.; Morin, T.; Séré, G. Using constructed soils for green infrastructure – challenges and limitations. SOIL 2020, 6, 413–434. [Google Scholar] [CrossRef]
  11. Minixhofer, P.; Scharf, B.; Hafner, S.; Weiss, O.; Henöckl, C.; Greiner, M.; Room, T.; Stangl, R. Towards the Circular Soil Concept: Optimization of Engineered Soils for Green Infrastructure Application. Sustainability 2022, 14, 905. [Google Scholar] [CrossRef]
  12. Chen, Y.; Zhou, Y. The contents and release behavior of heavy metals in construction and demolition waste used in freeway construction. Environmental Science and Pollution Research 2020, 27, 1078–1086. [Google Scholar] [CrossRef]
  13. Butera, S.; Christensen, T.H.; Astrup, T.F. Composition and leaching of construction and demolition waste: Inorganic elements and organic compounds. Journal of Hazardous Materials 2014, 276, 302–311. [Google Scholar] [CrossRef] [PubMed]
  14. Knoll, S.; Mindermann, S.; Porter, L.; Pauleit, S.; Duthweiler, S.; Prügl, J.; Helmreich, B. The potential of processed mineral construction and demolition waste to increase the water capacity of urban tree substrates - A pilot scale study in Munich. Sustainable Cities and Society 2024, 113, 105661. [Google Scholar] [CrossRef]
  15. German Federal Office of Justice. BBodSchV Bundes-Bodenschutz- und Altlastenverordnung. 2021. [Google Scholar]
  16. DIN. DIN 19529: Leaching of solid materials - Batch test for the examination of the leaching behaviour of inorganic and organic substances at a liquid to solid ratio of 2 l/kg. 2015, 19529, 27.
  17. Rommel, S.H.; Helmreich, B. Influence of Temperature and De-Icing Salt on the Sedimentation of Particulate Matter in Traffic Area Runoff. Water 2018, 10, 1738. [Google Scholar] [CrossRef]
  18. Rauret, G.; López-Sánchez, J.; Lück, D.; Yli-Halla, M.; Muntau, H.; Quevauviller, P. The certification of the extractable contents (mass fractions) of Cd, Cr, Cu, Ni, Pb and Zn in freshwater sediment following a sequential extraction procedure : BCR-701; Publications Office, 2001. [Google Scholar]
  19. Rommel, S.H.; Stinshoff, P.; Helmreich, B. Sequential extraction of heavy metals from sorptive filter media and sediments trapped in stormwater quality improvement devices for road runoff. Science of The Total Environment 2021, 782, 146875. [Google Scholar] [CrossRef]
  20. Virtanen, P.; Gommers, R.; Oliphant, T.E.; Haberland, M.; Reddy, T.; Cournapeau, D.; Burovski, E.; Peterson, P.; Weckesser, W.; Bright, J.; et al. SciPy 1.0: fundamental algorithms for scientific computing in Python. Nature Methods 2020, 17, 261–272. [Google Scholar] [CrossRef]
  21. McKinney, W.; et al. Data structures for statistical computing in python. In Proceedings of the 9th Python in Science Conference 2010; Volume 445, pp. 51–56.
  22. Hunter, J.D. Matplotlib: A 2D Graphics Environment. Computing in Science & Engineering 2007, 9, 90–95. [Google Scholar] [CrossRef]
  23. Waskom, M.L. seaborn: statistical data visualization. Journal of Open Source Software 2021, 9. [Google Scholar] [CrossRef]
  24. Vollpracht, A.; Weiler, L. Recycling of Slightly Contaminated Demolition Waste—Part 1: Inorganic Constituents. In Proceedings of the 3rd RILEM Spring Convention and Conference (RSCC 2020), Cham, 2021//, 2021; pp. 87–101. [Google Scholar]
  25. Galvín, A.P.; Ayuso, J.; Agrela, F.; Barbudo, A.; Jiménez, J.R. Analysis of leaching procedures for environmental risk assessment of recycled aggregate use in unpaved roads. Construction and Building Materials 2013, 40, 1207–1214. [Google Scholar] [CrossRef]
  26. Alonso-Santurde, R.; Coz, A.; Quijorna, N.; Viguri, J.R.; Andrés, A. Valorization of Foundry Sand in Clay Bricks at Industrial Scale. Journal of Industrial Ecology 2010, 14, 217–230. [Google Scholar] [CrossRef]
  27. Susset, B.; Maier, U.; Finkel, M.; Grathwohl, P. Weiterentwicklung von Kriterien zur Beurteilung des schadlosen und ordnungsgemäßen Einsatzes mineralischer Ersatzbaustoffe und Prüfung alternativer Wertevorschläge. 2018. [Google Scholar]
  28. Bary, B.; Sellier, A. Coupled moisture—carbon dioxide–calcium transfer model for carbonation of concrete. Cement and Concrete Research 2004, 34, 1859–1872. [Google Scholar] [CrossRef]
  29. Garrabrants, A.C.; Sanchez, F.; Kosson, D.S. Changes in constituent equilibrium leaching and pore water characteristics of a Portland cement mortar as a result of carbonation. Waste Management 2004, 24, 19–36. [Google Scholar] [CrossRef] [PubMed]
  30. Van Gerven, T.; Cornelis, G.; Vandoren, E.; Vandecasteele, C.; Garrabrants, A.C.; Sanchez, F.; Kosson, D.S. Effects of progressive carbonation on heavy metal leaching from cement-bound waste. AIChE Journal 2006, 52, 826–837. [Google Scholar] [CrossRef]
  31. Van Gerven, T.; Van Baelen, D.; Dutré, V.; Vandecasteele, C. Influence of carbonation and carbonation methods on leaching of metals from mortars. Cement and Concrete Research 2004, 34, 149–156. [Google Scholar] [CrossRef]
  32. Engelsen, C.J.; van der Sloot, H.A.; Wibetoe, G.; Petkovic, G.; Stoltenberg-Hansson, E.; Lund, W. Release of major elements from recycled concrete aggregates and geochemical modelling. Cement and Concrete Research 2009, 39, 446–459. [Google Scholar] [CrossRef]
  33. Müllauer, W.; Beddoe, R.E.; Heinz, D. Effect of carbonation, chloride and external sulphates on the leaching behaviour of major and trace elements from concrete. Cement and Concrete Composites 2012, 34, 618–626. [Google Scholar] [CrossRef]
  34. Reijonen, I.; Metzler, M.; Hartikainen, H. Impact of soil pH and organic matter on the chemical bioavailability of vanadium species: The underlying basis for risk assessment. Environmental Pollution 2016, 210, 371–379. [Google Scholar] [CrossRef] [PubMed]
  35. Helmreich, B.; Hilliges, R.; Schriewer, A.; Horn, H. Runoff pollutants of a highly trafficked urban road – Correlation analysis and seasonal influences. Chemosphere 2010, 80, 991–997. [Google Scholar] [CrossRef] [PubMed]
  36. Hilliges, R.; Endres, M.; Tiffert, A.; Brenner, E.; Marks, T. Characterization of road runoff with regard to seasonal variations, particle size distribution and the correlation of fine particles and pollutants. Water Science and Technology 2016, 75, 1169–1176. [Google Scholar] [CrossRef]
  37. Pérez, G.; López-Mesas, M.; Valiente, M. Assessment of Heavy Metals Remobilization by Fractionation: Comparison of Leaching Tests Applied to Roadside Sediments. Environmental Science & Technology 2008, 42, 2309–2315. [Google Scholar] [CrossRef]
  38. Amelung, W.; Blume, H.-P.; Fleige, H.; Horn, R.; Kandeler, E.; Kögel-Knabner, I.; Kretzschmar, R.; Stahr, K.; Wilke, B.-M. Scheffer/Schachtschabel - Lehrbuch der Bodenkunde, 17 ed.; Springer-Verlag GmbH Springer Nature: Berlin, 2018; p. 767. [Google Scholar]
  39. Boivin, P.; Saadé, M.; Pfeiffer, H.R.; Hammecker, C.; Degoumois, Y. DEPURATION OF HIGHWAY RUNOFF WATER INTO GRASS-COVERED EMBANKMENTS. Environmental Technology 2008, 29, 709–720. [Google Scholar] [CrossRef]
  40. Kocher, B.; Wessolek, G.; Stoffregen, H. Water and heavy metal transport in roadside soils. Pedosphere 2005, 15, 746–753. [Google Scholar]
  41. Kluge, B.; Wessolek, G. Heavy metal pattern and solute concentration in soils along the oldest highway of the world – the AVUS Autobahn. Environmental Monitoring and Assessment 2012, 184, 6469–6481. [Google Scholar] [CrossRef]
  42. Turer, D.G.; Maynard, B.J. Heavy metal contamination in highway soils. Comparison of Corpus Christi, Texas and Cincinnati, Ohio shows organic matter is key to mobility. Clean Technologies and Environmental Policy 2003, 4, 235–245. [Google Scholar] [CrossRef]
  43. Hatt, B.E.; Fletcher, T.D.; Deletic, A. Hydrologic and pollutant removal performance of stormwater biofiltration systems at the field scale. Journal of Hydrology 2009, 365, 310–321. [Google Scholar] [CrossRef]
  44. Davidson, C.M.; Duncan, A.L.; Littlejohn, D.; Ure, A.M.; Garden, L.M. A critical evaluation of the three-stage BCR sequential extraction procedure to assess the potential mobility and toxicity of heavy metals in industrially-contaminated land. Analytica Chimica Acta 1998, 363, 45–55. [Google Scholar] [CrossRef]
  45. Long, Y.-Y.; Hu, L.-F.; Fang, C.-R.; Wu, Y.-Y.; Shen, D.-S. An evaluation of the modified BCR sequential extraction procedure to assess the potential mobility of copper and zinc in MSW. Microchemical Journal 2009, 91, 1–5. [Google Scholar] [CrossRef]
  46. Sutherland, R.A.; Tack, F.M.G.; Ziegler, A.D. Road-deposited sediments in an urban environment: A first look at sequentially extracted element loads in grain size fractions. Journal of Hazardous Materials 2012, 225-226, 54–62. [Google Scholar] [CrossRef]
  47. Bacon, J.R.; Davidson, C.M. Is there a future for sequential chemical extraction? Analyst 2008, 133, 25–46. [Google Scholar] [CrossRef] [PubMed]
  48. Sutherland, R.A.; Tack, F.M.G.; Tolosa, C.A.; Verloo, M.G. Operationally Defined Metal Fractions in Road Deposited Sediment, Honolulu, Hawaii. Journal of Environmental Quality 2000, 29, 1431–1439. [Google Scholar] [CrossRef]
  49. Kartal, Ş.; Aydın, Z.; Tokalıoğlu, Ş. Fractionation of metals in street sediment samples by using the BCR sequential extraction procedure and multivariate statistical elucidation of the data. Journal of Hazardous Materials 2006, 132, 80–89. [Google Scholar] [CrossRef]
  50. Pallewatta, S.; Weerasooriyagedara, M.; Bordoloi, S.; Sarmah, A.K.; Vithanage, M. Reprocessed construction and demolition waste as an adsorbent: An appraisal. Science of The Total Environment 2023, 882, 163340. [Google Scholar] [CrossRef]
  51. Kretzschmar, R.; Sticher, H. Transport of humic-coated iron oxide colloids in a sandy soil: Influence of Ca2+ and trace metals. Environmental Science and Technology 1997, 31, 3497–3504. [Google Scholar] [CrossRef]
  52. Arabyarmohammadi, H.; Salarirad, M.M.; Behnamfard, A. Characterization and utilization of clay-based construction and demolition wastes as adsorbents for zinc (II) removal from aqueous solutions: an equilibrium and kinetic study. Environmental Progress & Sustainable Energy 2014, 33, 777–789. [Google Scholar] [CrossRef]
  53. Zhang, M.; Wang, H. Concentrations and chemical forms of potentially toxic metals in road-deposited sediments from different zones of Hangzhou, China. Journal of Environmental Sciences 2009, 21, 625–631. [Google Scholar] [CrossRef] [PubMed]
  54. Tokalıoğlu, Ş.; Kartal, Ş. Multivariate analysis of the data and speciation of heavy metals in street dust samples from the Organized Industrial District in Kayseri (Turkey). Atmospheric Environment 2006, 40, 2797–2805. [Google Scholar] [CrossRef]
Figure 1. Schematic representation of the study design.
Preprints 145367 g001
Figure 2. Cu, Zn, DOC and EC; grey boxes = RI_1, white boxes = RI_2; red solid line = TV_1, yellow areas = limits of quantification.
Preprints 145367 g002
Figure 3. Retention efficiencies of Cu and Zn based on influent and effluent loads for RI_1, RI_2, and total (= both rain intensities).
Preprints 145367 g003
Figure 4. Total contents of Cu and Zn in the technosols a75, b75 and ctl before treatment and the technosols after treatment with TAR (a75_treat, b75_treat and ctl_treat), based on sums of S1-4 derived from the sequential extraction procedure.
Preprints 145367 g004
Figure 5. Fractions of mobilizable (acid extractable, reducible, and oxidizable) and residual phases before and after treatment with TAR based on the sequential extraction procedure.
Preprints 145367 g005
Table 1. Technosol characteristics (as partly published in Knoll, et al. [14]; GWC = green waste compost; TS = topsoil; SS = subsoil, kf = hydraulic conductivity; n.a. = not analyzed.
Sample CDW Material ratios [% v/v] Grain size distribution [% w/w] kf [m/s]
± SD
CaCO3
[% w/w]
pH
before treatment with TAR
pH
after treatment with TAR
Bricks Concrete
+ mortar
+ plaster
GWC TS
+ SS
Clay Silt Sand Gravel
a75 RCM1: 75 % 41 27 10 22 9.6 13.8 40.7 35.9 1.8x10⁻³ ± 1.7x10⁻⁴ 45.3 7.5 8.0
a50 RCM1: 50 % 28 18 10 44 9.5 12.0 43.2 35.3 1.0x10⁻³ ± 7.6x10⁻⁵ 40.7 7.5 n.a.
a25 RCM1:
25 %
14 9 10 67 9.1 12.2 43.4 35.2 1.1x10⁻³ ± 8.1 x10⁻⁵ 29.3 7.5 n.a.
b75 RCM2: 75 % 20 48 10 22 8.9 12.4 42.1 36.6 2.2x10⁻⁴ ± 1.4x10⁻⁵ 53.7 7.8 8.2
b50 RCM2: 50 % 14 32 10 44 9.5 12.2 41.3 36.9 2.8x10⁻⁴ ± 1.6x10⁻⁵ 46.7 7.8 n.a.
b25 RCM2: 25% 7 16 10 67 10.5 11.3 42.9 35.3 3.1x10⁻⁴ ± 1.7x10⁻⁵ 34.6 7.7 n.a.
ctl - - - 10 90 9.3 11.4 43.7 35.7 9.6x10⁻⁴ ± 5.6x10⁻⁵ 22.3 7.8 7.6
Table 2. Four steps of the optimized BCR-SEP with corresponding fractions and solutions [18].
Step Fraction Solution Process description
S1 Acid extractable 40 mL acetic acid (0.11 mol/L) Addition of the solution to the samples in centrifuge tubes;Overnight extraction (16 ± 2 h) in an end-over-end shaker at 30 ± 10 rpm and 21 ± 2°C;Centrifugation at 4000 g for 20 min to separate the extract from the technosol;Pipetting off the supernatant, filtering with 0.45 µm, and stabilizing with 50 µl of 65% HNO₃;Washing the residue with 20 mL of ultrapure water, shaking for 15 min, centrifuging for 20 min, pipetting off, and discarding the supernatant
S2 Reducible 40 mL hydroxylammonium chloride (0.5 mol/L) Addition of the solution from a 1-L mixture (containing 25 ml of 2 mol/L HNO₃) to the residue;Continuation of the procedure as described in S1
S3 Oxidizable 2x 10 mL hydrogen peroxide (8.8 mol/L);50 mL ammonium acetate (1 mol/L) Addition of 10 ml H₂O₂ to the residue, covering the tubes, and reaction at 21 ± 2°C for 1 h with occasional manual shaking;Placement of the tubes in a water bath (85 ± 5°C), reduction of the volume to <3 mL (occasional manual shaking);Addition of 10 mL H₂O₂ (tubes in the water bath) and reaction until the volume is reduced to 1 mL (occasional manual shaking);Addition of 50 ml NH₄OAc (pH 2) and continuation of the procedure as described in S1
S4 Residue HNO₃: HCl = 3:1 Digestion of the residue with AR
Table 3. Substance concentrations in the eluate of the technosols a75, a50, a25, b75, b50, and b25, the control (ctl), and the two CDW mixtures RCM1 and RCM2 based on batch tests at L/S ratio = 2. Concentrations are mean values of the triplicate ± standard deviation; n.a. = not analyzed, < LOQ = below limit of quantification.
Technosols Soil CDW mixtures
a75 a50 a25 b75 b50 b25 ctl RCM1 RCM2
pH [-] 8.7
±0.1
8.8
±0.0
8.7
±0.0
8.8
±0.1
8.7
±0.1
8.7
±0.0
8.5
±0.0
10.5
±0.5
10.3
±0.3
EC [µS/cm] 278
±17.6
215
±9.5
205
±5.4
269
±39.3
217
±19.1
206
±4.0
212
±2.9
552
±28.1
503
±65.3
Fluoride [mg/L] 0.6
±0.2
0.5
±0.0
0.5
±0.0
0.4
±0.0
0.5
±0.0
0.5
±0.0
0.5
±0.0
0.6
±0.0
0.6
±0.1
Chloride [mg/L] 1.6
±0.9
< LOQ < LOQ < LOQ 2.0
±0.8
2.2
±0.9
< LOQ 3.7
±1.9
1.4
±0.6
SO4 [mg/L] 52.3
±6.0
26.7
±2.4
11.2
±1.4
44.0
±10.4
19.0
±0.8
9.6
±1.4
1.4
±0.5
167
±41.9
170
±8.2
Sb [µg/L] < LOQ 3.3
±1.2
4.2
±1.2
3.3
±1.2
< LOQ < LOQ 3.3
±1.2
< LOQ < LOQ
As [µg/L] 8.3
±0.5
7.0
±0.8
< LOQ 4.8
±1.6
5.7
±0.9
< LOQ < LOQ < LOQ < LOQ
Pb [µg/L] < LOQ 8.0
±2.2
4.3
±2.6
3.3
±1.2
4.3
±2.6
5.8
±2.7
< LOQ < LOQ < LOQ
B [µg/L] 150
±8.2
96.7
±17.0
70.0
±0.0
100
±8.2
103
±26.2
73.3
±4.7
< LOQ 193
±17.0
143
±60.2
Cd [µg/L] < LOQ < LOQ < LOQ < LOQ < LOQ < LOQ < LOQ < LOQ < LOQ
Cr [µg/L] < LOQ 4.3
±2.6
< LOQ < LOQ < LOQ < LOQ < LOQ 23.3
±2.5
37.3
±10.8
Cr(VI) [µg/L] < LOQ < LOQ < LOQ < LOQ < LOQ < LOQ < LOQ 25.0
±2.9
38.7
±10.9
Co [µg/L] < LOQ < LOQ < LOQ < LOQ < LOQ < LOQ < LOQ < LOQ < LOQ
Cu [µg/L] < LOQ 3.3
±1.2
3.3
±1.2
< LOQ < LOQ 3.3
±1.2
< LOQ < LOQ < LOQ
Mo [µg/L] 8.0
±0.8
5.3
±0.5
6.0
±0.0
6.3
±0.5
5.3
±0.5
4.8
±1.6
4.5
±1.5
9.8
±5.3
2.5
±0.0
Ni [µg/L] < LOQ < LOQ < LOQ < LOQ < LOQ < LOQ < LOQ < LOQ < LOQ
Hg [µg/L] < LOQ < LOQ < LOQ < LOQ < LOQ < LOQ < LOQ < LOQ < LOQ
Se [µg/L] < LOQ < LOQ < LOQ < LOQ < LOQ < LOQ < LOQ < LOQ < LOQ
Tl [µg/L] < LOQ < LOQ < LOQ < LOQ < LOQ < LOQ < LOQ < LOQ < LOQ
V [µg/L] 43.3
±4.7
33.3
±4.7
16.7
±4.7
26.7
±4.7
23.3
±4.7
20.0
±0.0
5.0
±0.0
166.7
±47.1
66.7
±9.4
Zn [µg/L] < LOQ 25.0
±0.0
25.0
±0.0
25.0
±0.0
25.0
±0.0
25.0
±0.0
25.0
±0.0
25.0
±0.0
25.0
±0.0
Sn [µg/L] < LOQ < LOQ < LOQ < LOQ < LOQ < LOQ < LOQ < LOQ < LOQ
DOC [mg/L] 5.7
±0.5
6.3
±0.5
6.7
±0.5
5.7
±0.5
5.7
±0.5
7.3
±1.2
6.0
±0.8
n.a. n.a.
Table 4. Cu and Zn shifts in the substrates; calculated as: Mean percentage of Cu and Zn of treated soils minus mean percentage in untreated substrates [%].
Metal Substrate S1
Acid exchangeable
S2
Reducible
S3
Oxidizable
S4
Residue
Sum S1-S4
Cu a75 1.1 -11.8 52.2 58.6 100
b75 1.2 -1.7 17.2 83.3 100
ctl 0.8 -0.1 3.9 95.5 100
Zn a75 26.5 13.3 8.0 52.2 100
b75 7.0 17.7 4.9 70.3 100
ctl 0.2 -0.1 -6.2 106.1 100
Disclaimer/Publisher’s Note: The statements, opinions and data contained in all publications are solely those of the individual author(s) and contributor(s) and not of MDPI and/or the editor(s). MDPI and/or the editor(s) disclaim responsibility for any injury to people or property resulting from any ideas, methods, instructions or products referred to in the content.
Copyright: This open access article is published under a Creative Commons CC BY 4.0 license, which permit the free download, distribution, and reuse, provided that the author and preprint are cited in any reuse.
Prerpints.org logo

Preprints.org is a free preprint server supported by MDPI in Basel, Switzerland.

Subscribe

Disclaimer

Terms of Use

Privacy Policy

Privacy Settings

© 2025 MDPI (Basel, Switzerland) unless otherwise stated