
Submitted:
09 January 2025
Posted:
10 January 2025
You are already at the latest version
Abstract
Introduction/Aim: Type 1 Diabetes (T1D) challenges glycemic control, with sleep dis-turbances affecting insulin sensitivity and glucose variability. This study aims to assess sleep quality in T1D patients and its impact on glycemic outcomes, particularly at bed-time. Methods: This retrospective observational study, conducted at an Italian clinical center, included T1D patients using Medtronic devices. Sleep quality was assessed us-ing the Italian version of the Pittsburgh Sleep Quality Index (PSQI), and glycemic out-comes were analyzed with CGM data. Statistical comparisons were made using de-scriptive statistics and non-parametric tests. Results: Of 45 patients, 4 were excluded, leaving 41 for analysis. The mean PSQI score was 6.0 ± 4.1, with 36.6% showing poor sleep quality. No significant differences in age, sex, BMI, or diabetes duration were found. Poor sleepers had higher Time in Elevated Glycemic Range 2 (TAR2) (6.3 ± 6.2%) compared to good sleepers (4.1 ± 5.0%). During bedtime hours, poor sleepers showed significantly higher TAR2 (6.7 ± 7.2% vs. 3.3 ± 6.2%, p = 0.013). Conclusions: Improving sleep quality may boost glycemic control and prevent nocturnal hyperglycemia. Future research should focus on sleep interventions in diabetes care.
Keywords:
Type 1 diabetes
; technological device
; Sleep Quality
; Cohort Study
1. Introduction
Diabetes is one of the most significant global public health challenges [1,2,3]. The World Health Organization (WHO) estimates that over 460 million people are affected by this condition, with predictions for exponential growth in the coming decades, largely driven by changes in dietary and lifestyle habits [4,5,6,7,8,9,10]. While Type 1 Diabetes (T1D) is less prevalent than Type 2 Diabetes (T2D), it remains a major concern, particularly among younger populations, due to its chronic nature and the therapeutic challenges it entails [11,12,13,14,15]. The epidemiology of diabetes, both nationally and globally, highlights an increasing burden on healthcare systems, exacerbated by factors such as aging populations, rising obesity rates, and the growing prevalence of sedentary lifestyles [16,17,18]. Although T2D affects a larger number of people worldwide, T1D presents unique challenges that require specific and innovative therapeutic approaches, particularly given its increasingly complex and technologically advanced management [19,20,21]. Diabetes management, especially for T2D, has made significant strides in recent decades, with a decisive shift toward personalized therapeutic strategies supported by increasingly sophisticated devices [22,23]. Among these innovations, the introduction of continuous glucose monitoring (CGM) systems and insulin pumps (IP) has marked a major step forward in achieving more precise glycemic control and improving the quality of life for patients [24,25]. For individuals with T1D, who must manage daily insulin doses to maintain stable blood sugar levels, the introduction of technologies such as CGM, IP, and "smart pens" has been a crucial advancement [26,27,28]. These devices not only enhance glycemic control but also help reduce the emotional and psychological burden associated with diabetes management—a key aspect that should never be underestimated in the overall, holistic management of T1D patients [29,30]. In recent years, increasing attention has been given to the relationship between sleep and glycemic regulation in individuals with T1D [31]. Sleep disturbances, such as reduced duration or poor-quality sleep, are common among T1D patients and can negatively impact glycemic control [32]. Sleep deprivation, for instance, may alter insulin sensitivity and increase glycemic variability, making it more challenging to maintain stable blood glucose levels both during the day and overnight. In particular, poor sleep quality can lead to greater glucose fluctuations, increasing the risk of hypoglycemia or hyperglycemia [33]. These issues are especially significant for T1D patients, who must manage insulin on a daily basis to maintain stable glucose levels [31,32,33]. While technologies such as continuous glucose monitoring (CGM) and insulin pumps (IP) have improved glycemic control, they do not always fully compensate for the negative effects of disturbed sleep [34]. Recent studies suggest that optimizing sleep quality could be an important strategy to improve glycemic control in T1D patients, particularly in paediatric population [35,36]. However, integrating sleep management with the use of technological devices remains a challenge, and further investigation is needed to better understand how sleep quality may influence long-term glycemic regulation, particularly during the night [31,32,33,34]. In this context, our study aims to support new research on this topic and expand the debate on an extremely crucial aspect of T1D management, particularly through modern technological tools that are now common in all chronic diseases in general [37].
Aims
Primary
The primary objectives of this analysis were to characterize the sleep quality of patients with T1D based on their Italian version of Pittsburgh Sleep Quality Index (PSQI) [38] (Supplemenatry File 1) scores and compare patient characteristics between groups.
Secondary
Compare glycemic outcomes during the 30 days preceding the PSQI assessment between groups, as primary objective but considering bedtime hours only.
2. Materials and Methods
2.1. Study Design
2.2. Ethical Considerations
The study was conducted in full compliance with the ethical principles outlined in the Declaration of Helsinki and in accordance with institutional and national research ethics guidelines. Ethical approval was granted by the Institutional Review Board of Ast Fermo (INF 03/2024, date March 3, 2024). All participants provided informed consent for the collection and use of their data.
2.3. Sample and Criteria
Patients using Medtronic Smart MDI (Simplera™ + InPen™) [https://www.medtronic-diabetes.com/en-gb/SmartMDI] or the MiniMed™ 780G system [https://www.medtronicdiabetes.com/products/minimed-780g-insulin-pump-system] were included in the study. The sample was selected for convenience at the recruiting center. All subjects meeting the criteria outlined below were included in the observation. To minimize potential confounding factors related to overall glycemic response, the exclusion criteria were carefully structured to ensure a valid interpretation of the collected data. The statistical methods employed, as described below, were chosen to best support the generalization of the results.
Inclusion criteria were: T1D diagnosis, male or female, aged ≥ 18 years, therapy requirement determined by the physician's judgment, at least 70% sensor usage during the 30 days prior to the PSQI assessment, and provision of signed informed consent.
Exclusion criteria included: refusal to consent to data use, presence of concomitant or suspected malignant diseases, pregnancy or breastfeeding, recent acute illnesses (within 3 months of enrollment) excluding viral illnesses, renal impairment (eGFR < 60 mL/min), severe liver failure, congestive heart failure (NYHA class IV), proliferative diabetic retinopathy, cholelithiasis, chronic or ongoing acute pancreatitis, and adherence to a ketogenic diet or other nutritional interventions considered supplementary therapeutic treatments.
2.4. Endpoints
Description of patients' sleep quality in terms of PSQI score, analyzed both as a continuous variable and as categorical (PSQI ≤ 5, PSQI > 5). Statistical comparison between groups based on age, gender, T1D duration, Body Mass Index (BMI), smoking status, and type of diabetes management device used. Statistical comparison of glycemic outcomes between groups was performed, including:
- Sensor Glucose (SG) mean, Standard Deviation (SD), and Coefficient of Variation (CV);
- Time Below Range level 2 (TBR2): percentage of time spent below 54 mg/dL;
- Time Below Range level 1 (TBR1): percentage of time spent between 54-69 mg/dL;
- Time Below Range (TBR): percentage of time spent below 70 mg/dL;
- Time In Range (TIR): percentage of time spent within 70-180 mg/dL;
- Time Above Range level 1 (TAR1): percentage of time spent between 181-250 mg/dL;
- Time Above Range level 2 (TAR2): percentage of time spent above 250 mg/dL;
- Time Above Range (TAR): percentage of time spent above 180 mg/dL.
2.5. Statistical Analysis
2.5.1. General Methodology
Descriptive statistics were used to summarize results. These include mean and SD, minimum, maximum, and median with InterQuartile Range (IQR) for continuous variables and counts and percentages for categorical variables. Summary statistics were reported with maximum two decimals, as appropriate. Bar charts were produced to visually represent some of the results. Continuous variables were compared between groups using the Wilcoxon rank-sum test, while categorical variables were compared using Fisher’s exact test. All tests were two sided and p-values < 0.05 were considered statistically significant. SAS software, version 9.4, (SAS Institute Inc., Cary, NC, USA) was used to perform all statistical analyses.
2.5.2. Data Analysis
All data were collected by the physicians from device data files, CareLinkTM reports [39], clinical records and other relevant sources, and shared through Excel spreadsheet using the SharePoint platform. Raw CGM data were utilized to calculate glycemic outcomes, as detailed in the next section.
2.5.3. Derived Variables
The Medtronic CGM systems track SG levels throughout the day and night and measures SG (mg/dL) at regular intervals, as frequently as every 5 minutes. Thus, 288 measurements are taken daily for a patient who keeps the system on all the time. The following Table 1 summarizes the criteria that were used to derive glycemic outcomes from CGM data:
2.5.4. Bedtime Hours
Bedtime hours refer to the range of hours from when a patient goes to bed to when they get up in the morning. To analyze glycemic outcomes based solely on bedtime hours, a patient-specific time range was determined. This range was established by reviewing the patient’s responses to the PSQI questions about the usual time they went to bed and got up during the past month.
2.5.5. Handling of Missing Data and Outliers and Validation Requirements
Potential outliers were retained in the analysis, and no imputation methods were applied to handle missing data. To ensure accuracy and reliability, all analyses were independently reviewed and validated by a second statistician.
3. Results
3.1. Patient Disposition
Out of the 45 patients considered, 4 were excluded from the analysis due to using the sensor for less than 70% of the time during the 30 days preceding the PSQI assessment. Consequently, the results presented in this manuscript refer to the remaining 41 subjects.
3.2. Sleep Quality
3.3. Patient Characteristics
Table 3 shows patient characteristics, comparing poor and good sleepers. No statistically significant differences were observed for the variables examined. Patients’ mean age was approximately 52 years in both groups. The proportion of females was equal to 46.7% (7/15) among poor sleepers, and 38.5% (10/26) among good sleepers. Poor sleepers had a shorter mean diabetes duration (19.2 ± 12.0 yrs.) compared to good sleepers (28.8 ± 15.1 yrs.). The mean BMI was 25.0 ± 4.1 kg/m² in the entire cohort (poor sleepers: 25.6 ± 3.6 kg/m²; good sleepers: 24.6 ± 4.4 kg/m²). Most patients (68.3%) used the MiniMedTM 780G system, with a higher proportion among good sleepers (73.1%) than poor sleepers (60.0%).
3.4. Glycemic Outcomes
Table 4 shows the glycemic outcomes of the cohort during the 30-day period preceding the PSQI assessment and Figure 1 rapresent average TIR, TBR and TAR during bedtime hours in the 30 days preceding PSQI assessment by sleep quality. No statistically significant differences were observed between good and poor sleepers. Average SG mean and SD were 153.9 ± 18.3 mg/dL and 47.4 ± 10.7 mg/dL for the entire sample, respectively. Average CV was within the recommended target of ≤ 36% 2 in both groups (poor sleepers: 31.2 ± 5.6%; good sleepers: 30.4 ± 4.6%). The mean TIR for the entire sample was 72.0 ± 11.5%, meeting the recommended target of > 70% 2. Poor sleepers demonstrated slightly lower TIR (70.0 ± 13.1%) compared to good sleepers (73.2 ± 10.6%). The mean TBR for the entire sample was 1.7 ± 2.4%, well within the target of < 4% 2, with TBR2 also meeting the recommended target of < 1% (0.3 ± 0.7%). However, the mean TAR for the entire sample was 26.2 ± 12.3%, slightly exceeding the target of < 25%. Poor sleepers exhibited higher TAR (28.5 ± 14.0%) than good sleepers (24.9 ± 11.3%). The mean TAR2 was 6.3 ± 6.2% for poor sleepers, exceeding the recommended target of < 5%, while was 4.1 ± 5.0% for good sleepers [41].
3.5. Glycemic Outcomes during Bedtime Hours
Table 5 shows the glycemic outcomes of the patients during the 30 days preceding the PSQI assessment, considering bedtime hours only and average TBR, TIR and TAR values during bedtime hours are shown in Figure 2. Bedtime hours were defined for each patient based on the PSQI responses as outlined in section 8.4. Poor sleepers had an average number of bedtime hours of 7.3 ± 1.3 per night, while this figure was 7.6 ± 1.0 for good sleepers.
Mean TAR2 was significantly higher in poor sleepers compared to good sleepers (6.7 ± 7.2% vs. 3.3 ± 6.2%, p = 0.013), with median values of 4.9% and 1.1%, respectively. No other statistically significant differences were observed.
4. Discussion
This analysis included 41 T1D patients treated with either the Medtronic Smart MDI system (SimpleraTM + InPenTM) or the MiniMedTM 780G system, undergoing a PSQI assessment and reaching a sensor use of at least 70% of the time during the 30 days preceding the assessment. A total of 15 (36.6%) patients had a PSQI score greater than 5, indicating poor sleep quality. No statistically significant differences were observed between good and poor sleepers in terms of age, sex, BMI, diabetes duration, smoking habit, device used for diabetes management, and glycemic outcomes during the 30 days preceding the PSQI assessment. However, when restricting the evaluation of the glycemic outcomes to the bedtime hours only, the mean TAR2 (> 250 mg/dL) was significantly higher in poor sleepers compared to good sleepers (6.7 ± 7.2% vs. 3.3 ± 6.2%, p = 0.013), with median values of 4.9% and 1.1%, respectively. This finding is in line with previous studies, which have highlighted how poor sleep quality negatively affects glycemic control in patients with type 1 diabetes. Therefore, monitoring sleep quality could be a useful intervention to optimize glycemic control, particularly during nighttime hours, and prevent episodes of hyperglycemia. Our results also align with a recent study conducted by Passanini et al., [43] which analyzed the use of the MiniMed™ 780G system for the treatment of type 1 diabetes. In this study, the use of an insulin delivery system, also the MiniMed™ 780G, led to improvements in both glycemic control and sleep quality, while also reducing the psychological distress associated with diabetes. Although both studies agree on the importance of sleep quality for glycemic control, there are differences in the details. Our study primarily focused on the effect of sleep quality on TAR2 and showed a significant difference between patients with good and poor sleep quality, while Passanini et al.'s study highlighted how the use of the MiniMed™ 780G was associated with a reduction in severe hypoglycemia and an improvement in time in the target glycemic range (TIR), without detecting a significant increase in TAR. This suggests that advanced devices like the MiniMed™ 780G may offer additional benefits, improving both glycemic control and sleep quality, with potential positive implications for overall diabetes management. Moreover, the results of our study are also consistent with another study [44], who observed a correlation between poor sleep quality and greater nocturnal glycemic variability, measured both by standard deviation (SD) and coefficient of variation (CV). Specifically, nights with poor sleep quality were associated with greater glycemic variability, emphasizing how sleep quality negatively impacts glycemic stability during the night. Again, our study confirms the importance of monitoring sleep quality to optimize nocturnal glycemic control in patients with type 1 diabetes. On the other hand, the study conducted by Martin-Nemeth et al. [45] explored the role of fear of hypoglycemia (FOH) as a factor contributing to poor sleep quality in patients with type 1 diabetes. Anxiety related to the risk of hypoglycemia could therefore be an additional factor to consider in the management of sleep quality and, consequently, in improving glycemic control. Indeed, our study did not directly explore this aspect, but it is important to highlight how psychological factors such as FOH may interact with sleep quality and negatively impact glycemic control. In another study [46] was found that poor sleep quality, measured by PSQI, was associated with higher levels of HbA1c and less optimal glycemic management. Additionally, several factors affecting sleep quality were identified, such as pain, coughing, snoring, and the inability to maintain continuous sleep, all of which were significantly correlated with poorer glycemic control. These factors may represent additional issues that negatively influence glycemic management in patients with type 1 diabetes, as seen in our study. Finally, a recent study [47] examined the effect of seasonal transitions on sleep quality and glycemic parameters in patients with type 1 diabetes treated with continuous glucose monitoring (CGM) systems. Although no significant changes in sleep quality were observed, the study found a deterioration in glycemic parameters, with an increase in GMI and a reduction in time in the target glycemic range (TIR) during seasonal changes. This suggests that, in addition to sleep quality, environmental factors such as seasonal changes may negatively influence glycemic control. Our results, which highlight the impact of sleep quality on glycemic control, fit into this broader context, emphasizing the importance of monitoring multiple factors, including seasonal ones, for optimal management of type 1 diabetes.
4.1. Limitations
This analysis was conducted on a selected set of patients, and given the retrospective observational nature of the data, selection bias may be present. Furthermore, the available patient characteristics were limited, potentially excluding factors that could influence sleep quality. Future analyses incorporating a broader range of patient characteristics and a larger sample size, allowing for covariate adjustment, are recommended to generate more robust evidence.
5. Conclusions
This research contributes to a deeper understanding of the link between sleep quality and glycemic control in patients with type 1 diabetes, highlighting the need to consider sleep quality as a modifiable factor that can positively influence glycemic management and potentially prevent episodes of nocturnal hyperglycemia. The study underscores the critical role of sleep quality in glycemic control, showing that poor sleep quality is associated with a higher time spent in the TAR2 during the night. Although no significant differences were observed between patients with good and poor sleep quality regarding age, sex, BMI, or diabetes duration, the findings suggest that monitoring sleep quality could be an effective strategy for optimizing glycemic control, particularly during nighttime, and preventing hyperglycemic episodes. Furthermore, this research enhances our understanding of the relationship between sleep and glycemic control, emphasizing that sleep quality should be viewed as a modifiable factor. When properly managed, it can positively influence glycemic stability and reduce the risk of long-term complications. Psychological and environmental factors, alongside physiological ones, seem to play an important role in both sleep quality and glycemic management, indicating that a holistic approach to diabetes care should address these aspects. Future research should focus on exploring specific interventions aimed at improving sleep quality as a strategy to optimize glycemic control and reduce the risk of long-term complications.
Supplementary Materials
The following supporting information can be downloaded at the website of this paper posted on Preprints.org, 1. Italian version of Pittsburgh Sleep Quality Index (PSQI); 2. STROBE Statement—checklist.
Author Contributions
Conceptualization, G.C. and P.P.; methodology, G.C. and S.M.; software, G.C.; validation, S.M. and G.C.; formal analysis, G.C.; investigation, G.C. and D.B.; data curation, G.C.; writing—original draft preparation, G.C., S.M., M.S., P.P. and S.M.P.; writing—review and editing, G.C., S.M.P, S.M., and F.P.; visualization, P.P., F.B., S.M., M.S., A.M., M.P., S.M.P., G.F., F.P., and G.C. supervision, G.C. and F.P.; project administration, G.C. and F.P. P.P. and F.B.. contributed equally as first authors; F.P. and G.C. contributed equally as second authors. All authors have read and agreed to the published version of the manuscript.
Funding
This research received no external funding.
Institutional Review Board Statement
This study adhered to the principles outlined in the Helsinki Declaration. Ethical approval was granted by the Istitutional Review Board of Ast Fermo with authorization code INF 03/2024, date March 3, 2024.
Informed Consent Statement
All participants were informed about the study's objectives, and the consent was obtained in compliance with all privacy regulations (Art. 13 EU Regulation 679/2016) before survey administration. The data were processed anonymously.
Data Availability Statement
The data that support the findings of this study are available on the text and Supplementary materials.
Acknowledgments
The authors wish to thank the following Medtronic employee for their technical and statistical support of this study. Special thanks for Ivan Merlo and Claudio Carrara.
Conflicts of Interest
The authors declare no competing interest.
References
- Ahmad, E.; Lim, S.; Lamptey, R.; Webb, D.R.; Davies, M.J. Type 2 diabetes. Lancet 2022, 400, 1803–1820. [Google Scholar] [CrossRef] [PubMed]
- Magliano, D.J.; Boyko, E.J. Committee IDFDAtes. IDF diabetes atlas. In Idf Diabetes Atlas; International Diabetes Feeration ©: Brussels, Belgium, Volume 2021. [Google Scholar]
- Wong, N.D.; Sattar, N. Cardiovascular risk in diabetes mellitus: Epidemiology, assessment and prevention. Nat. Rev. Cardiol. 2023, 20, 685–695. [Google Scholar] [CrossRef] [PubMed]
- World Health Organization (WHO). Diabetes. Available on: https://www.who.int/news-room/fact-sheets/detail/diabetes (access ). 25 November.
- Global Burden of Disease Collaborative Network. Global Burden of Disease Study 2021. Results. Institute for Health Metrics and Evaluation. Available on: https://vizhub.healthdata.org/gbd-results/ (access on , 2024). 1 November.
- GBD 2021 Diabetes Collaborators. Global, regional, and national burden of diabetes from 1990 to 2021, with projections of prevalence to 2050: a systematic analysis for the Global Burden of Disease Study 2021. Lancet. 2023, 402, 203–234. [Google Scholar] [CrossRef] [PubMed]
- Petrelli, F.; Cangelosi, G.; Scuri, S.; Nguyen, C.T.T.; Debernardi, G.; Benni, A.; et al. Conoscenze alimentari in pazienti afferenti ad un centro di diabetologia [Food knowledge of patients at the first access to a Diabetology center]. Acta Biomed, 2020, 91(3-S), 160-164. [CrossRef]
- Cangelosi, G.; Grappasonni, I.; Nguyen, C.T.T.; Acito, M.; Pantanett,i P. ; Benni, A.; Petrelli, F. Mediterranean Diet (MedDiet) and Lifestyle Medicine (LM) for support and care of patients with type II diabetes in the COVID-19 era: a cross-observational study. Acta Biomed. 2023, 94, e2023189. [Google Scholar] [CrossRef]
- GBD 2021 Diseases and Injuries Collaborators. Global incidence, prevalence, years lived with disability (YLDs), disability-adjusted life-years (DALYs), and healthy life expectancy (HALE) for 371 diseases and injuries in 204 countries and territories and 811 subnational locations, 1990-2021: a systematic analysis for the Global Burden of Disease Study 2021. Lancet. 2024, 403, 2133–2161. [Google Scholar] [CrossRef]
- Cangelosi, G.; Acito, M.; Grappasonni, I.; Nguyen, C.T.T.; Tesauro, M.; Pantanetti, P.; et al. Yoga or Mindfulness on Diabetes: Scoping Review for Theoretical Experimental Framework. Ann Ig. 2024, 36, 153–168. [Google Scholar] [CrossRef]
- Jacobsen LM, Sherr JL, Considine E, Chen A, Peeling SM, Hulsmans M, Charleer S, Urazbayeva M, Tosur M, Alamarie S, Redondo MJ, Hood KK, Gottlieb PA, Gillard P, Wong JJ, Hirsch IB, Pratley RE, Laffel LM, Mathieu C; ADA/EASD PMDI. Utility and precision evidence of technology in the treatment of type 1 diabetes: a systematic review. Commun Med, 2023; 3, 132. [CrossRef]
- Mallik R, Kar P, Mulder H, Krook A. The future is here: an overview of technology in diabetes. Diabetologia, 2019; ;67. [CrossRef]
- Handelsman Y, Hellman R, Lajara R, Roberts VL, Rodbard D, Stec C, Unger J. American Association of Clinical Endocrinology Clinical Practice Guideline: The Use of Advanced Technology in the Management of Persons With Diabetes Mellitus. Endocr Pract. 2021, 27, 505–537. [Google Scholar] [CrossRef]
- American Diabetes Association Professional Practice Committee. 7. Diabetes Technology: Standards of Care in Diabetes-2024. Diabetes Care 2024, Jan 1;47(Suppl 1):S126-S144. [CrossRef]
- Cangelosi, G.; Mancin, S.; Morales Palomares, S.; Pantanetti, P.; Quinzi, E.; Debernardi, G.; Petrelli, F. Impact of School Nurse on Managing Pediatric Type 1 Diabetes with Technological Devices Support: A Systematic Review. Diseases. 2024, 12, 173. [Google Scholar] [CrossRef]
- Jayedi, A.; Zargar, M.S.; Emadi, A.; Aune, D. Walking speed and the risk of type 2 diabetes: a systematic review and meta-analysis. Br J Sports Med. 2024, 58, 334–342. [Google Scholar] [CrossRef]
- Cao, L.; An, Y.; Liu, H.; Jiang, J.; Liu, W.; Zhou, Y.; et al. Global epidemiology of type 2 diabetes in patients with NAFLD or MAFLD: a systematic review and meta-analysis. BMC Med. 2024, 22, 101. [Google Scholar] [CrossRef]
- Gregory, G.A.; Robinson, T.I.G.; Linklater, S.E.; Wang, F.; Colagiuri, S.; de Beaufort, C.; Donaghue, K.C.; International Diabetes Federation Diabetes Atlas Type 1 Diabetes in Adults Special Interest Group; et al. Global incidence, prevalence, and mortality of type 1 diabetes in 2021 with projection to 2040: a modelling study. Lancet Diabetes Endocrinol. 2022, 10, 741–760. [Google Scholar] [CrossRef] [PubMed]
- Anandhakrishnan, A.; Hussain, S. Automating insulin delivery through pump and continuous glucose monitoring connectivity: Maximizing opportunities to improve outcomes. Diabetes Obes Metab. 2024, 18. [Google Scholar] [CrossRef] [PubMed]
- Farhat, I.; Drishti, S.; Bochner, R.; Bargman, R. Do hybrid closed loop insulin pump systems improve glycemic control and reduce hospitalizations in poorly controlled type 1 diabetes? J Pediatr Endocrinol Metab. 2024, 5. [Google Scholar] [CrossRef]
- Petrelli, F.; Cangelosi, G.; Scuri, S.; Pantanetti, P.; Lavorgna, F.; Faldetta, F.; et al. Diabetes and technology: A pilot study on the management of patients with insulin pumps during the COVID-19 pandemic. Diabetes Res Clin Pract. 2020, 169, 108481. [Google Scholar] [CrossRef]
- Petrovski, G.; Al Khalaf, F.; Campbell, J.; Umer, F.; Almajaly, D.; Hamdan, M.; Hussain, K. One-year experience of hybrid closed-loop system in children and adolescents with type 1 diabetes previously treated with multiple daily injections: drivers to successful outcomes. Acta Diabetol. 2021, 58, 207–213. [Google Scholar] [CrossRef]
- McAuley, S.A.; Lee, M.H.; Paldus, B.; Vogrin, S.; de Bock, M.I.; Abraham, M.B.; et al.; Australian JDRF Closed-Loop Research Group Six Months of Hybrid Closed-Loop Versus Manual Insulin Delivery With Fingerprick Blood Glucose Monitoring in Adults With Type 1 Diabetes: A Randomized, Controlled Trial. Diabetes Care. 2020, 43, 3024–3033. [Google Scholar] [CrossRef]
- Cobry, E.C.; Kanapka, L.G.; Cengiz, E.; Carria, L.; Ekhlaspour, L.; Buckingham, B.A.; et al.; iDCL Trial Research Group Health-Related Quality of Life and Treatment Satisfaction in Parents and Children with Type 1 Diabetes Using Closed-Loop Control. Diabetes Technol Ther. 2021, 23, 401–409. [Google Scholar] [CrossRef]
- Benioudakis, E.; Karlafti, E.; Kalaitzaki, A.; Kaiafa, G.; Savopoulos, C.; Didangelos, T. Technological Developments and Quality of Life in Type 1 Diabetes Mellitus Patients: A Review of the Modern Insulin Analogues, Continuous Glucose Monitoring and Insulin Pump Therapy. Curr Diabetes Rev. 2022, 18, e031121197657. [Google Scholar] [CrossRef]
- National Health Service (NHS) Digital. National Diabetes Audit 2021-22, type 1 Diabetes – overview. Available on: https://digital. nhs.uk/data-and-information/publications/statistical/national-diabetes-audit-type-1-diabetes/nda-type-1-2021-22-overview (accessed ). 24 November.
- Foster, N.C.; Beck, R.W.; Miller, K.M.; Clements, M.A.; Rickels, M.R.; DiMeglio, L.A.; et al. State of type 1 diabetes management and outcomes from the T1D exchange in 2016-2018. Diabetes Technol Ther. 2019, 21, 66–72. [Google Scholar] [CrossRef]
- Tejera-Pérez, C.; Chico, A.; Azriel-Mira, S.; Lardiés-Sánchez, B.; Gomez-Peralta, F.; Área de Diabetes-SEEN. Connected Insulin Pens and Caps: An Expert's Recommendation from the Area of Diabetes of the Spanish Endocrinology and Nutrition Society (SEEN). Diabetes Ther. 2023, 14, 1077–1091. [Google Scholar] [CrossRef]
- Nimri, R.; Nir, J.; Phillip, M. Insulin Pump Therapy. Am J Ther. 2020, 27, e30–e41. [Google Scholar] [CrossRef] [PubMed]
- Cernea, S.; Raz, I. Insulin Therapy: Future Perspectives. Am J Ther. 2020, 27, e121–e132. [Google Scholar] [CrossRef] [PubMed]
- Chakrabarti, A.; Trawley, S.; Kubilay, E.; Mohammad Alipoor, A.; Vogrin, S.; Fourlanos, S.; et al. Closed-Loop Insulin Delivery Effects on Glycemia During Sleep and Sleep Quality in Older Adults with Type 1 Diabetes: Results from the ORACL Trial. Diabetes Technol Ther. 2022, 24, 666–671. [Google Scholar] [CrossRef] [PubMed]
- Cobry, E.C.; Karami, A.J.; Meltzer, L.J. Friend or Foe: a Narrative Review of the Impact of Diabetes Technology on Sleep. Curr Diab Rep. 2022, 22, 283–290. [Google Scholar] [CrossRef]
- Brandt, R.; Park, M.; Wroblewski, K.; Quinn, L.; Tasali, E.; Cinar, A. Sleep quality and glycaemic variability in a real-life setting in adults with type 1 diabetes. Diabetologia. 2021, 64, 2159–2169. [Google Scholar] [CrossRef]
- Abu Irsheed, G.; Martyn-Nemeth, P.; Baron, K.G.; Reutrakul, S. Sleep Disturbances in Type 1 Diabetes and Mitigating Cardiovascular Risk. J Clin Endocrinol Metab. 2024, 109, 3011–3026. [Google Scholar] [CrossRef]
- Hilliard, M.E.; Levy, W.; Anderson, B.J.; Whitehouse, A.L.; Commissariat, P.V.; Harrington, K.R.; et al. Benefits and Barriers of Continuous Glucose Monitoring in Young Children with Type 1 Diabetes. Diabetes Technol Ther. 2019, 21, 493–498. [Google Scholar] [CrossRef]
- Jaser, S.S.; Foster, N.C.; Nelson, B.A.; Kittelsrud, J.M.; DiMeglio, L.A.; Quinn, M.; Willi, S.M.; Simmons, J.H. T1D Exchange Clinic Network. Sleep in children with type 1 diabetes and their parents in the T1D Exchange. Sleep Med. 2017, 39, 108–115. [Google Scholar] [CrossRef]
- Sguanci, M.; Mancin, S.; Gazzelloni, A.; Diamanti, O.; Ferrara, G.; Morales Palomares, S.; Parozzi, M.; Petrelli, F.; Cangelosi, G. The Internet of Things in the Nutritional Management of Patients with Chronic Neurological Cognitive Impairment: A Scoping Review. Healthcare 2025, 13, 23. [Google Scholar] [CrossRef]
- Curcio, G.; Tempesta, D.; Scarlata, S.; Marzano, C.; Moroni, F.; Rossini, P.M.; Ferrara, M.; De Gennaro, L. Validity of the Italian version of the Pittsburgh Sleep Quality Index (PSQI). Neurol Sci. 2013, 34, 511–519. [Google Scholar] [CrossRef]
- Medtronic. Care link report. Available on: https://www.medtronicdiabetes.com/customer-support/carelink-software-support/ carelink-reports (access ). 30 November.
- Cuschieri, S. The STROBE guidelines. Saudi J Anaesth. 2019, 13 (Suppl 1), S31–S34. [Google Scholar] [CrossRef]
- Buysse DJ, Reynolds CF 3rd, Monk TH, Berman SR, Kupfer DJ. The Pittsburgh Sleep Quality Index: a new instrument for psychiatric practice and research. Psychiatry Res. 1989, 28, 193–213. [Google Scholar] [CrossRef]
- Battelino T, Danne T, Bergenstal RM, et al. Clinical Targets for Continuous Glucose Monitoring Data Interpretation: Recommendations From the International Consensus on Time in Range. Diabetes Care. 2019;42(8):1593-1603. [CrossRef]
- Passanisi S, Lombardo F, Mameli C, Bombaci B, Macedoni M, Zuccotti G, Dovc K, Battelino T, Salzano G, and Delvecchio M. Safety, Metabolic and Psychological Outcomes of Medtronic MiniMed 780GTM in Children, Adolescents and Young Adults: A Systematic Review. Diabetes Therapy. [CrossRef]
- Brandt R, Park M, Wroblewski K, Quinn L, Tasali E, and Cinar A. Sleep Quality and Glycaemic Variability in a Real-Life Setting in Adults with Type 1 Diabetes. Diabetologia. 2021; 64: (10):, 2159–69. [CrossRef]
- Martyn-Nemeth P, Phillips SA, Mihailescu D, Farabi SS, Park C, Lipton R, Idemudia E, and Quinn L. Poor Sleep Quality Is Associated with Nocturnal Glycaemic Variability and Fear of Hypoglycaemia in Adults with Type 1 Diabetes. Journal of Advanced Nursing. 2018; 74 (10): 2373–80. [CrossRef]
- Mehrdad M, Azarian M, Sharafkhaneh A, Alavi A, Zare R, Hassanzadeh Rad R, and Dalili S. Association Between Poor Sleep Quality and Glycemic Control in Adult Patients with Diabetes Referred to Endocrinology Clinic of Guilan: A Cross-Sectional Study. International Journal of Endocrinology and Metabolism. 2021; 20 (1): 1–8. [CrossRef]
- Angelino S, Longo M, Caruso P, Scappaticcio L, Di Martino N, Di Lorenzo C, Forestiere D, et al. Sleep Quality and Glucose Control in Adults with Type 1 Diabetes during the Seasonal Daylight Saving Time Shifts. Diabetes Research and Clinical Practice, . 2024; 217 (August): 111859. [CrossRef]
Figure 1.
Average TIR, TBR and TAR in the 30 days preceding PSQI assessment by sleep quality.
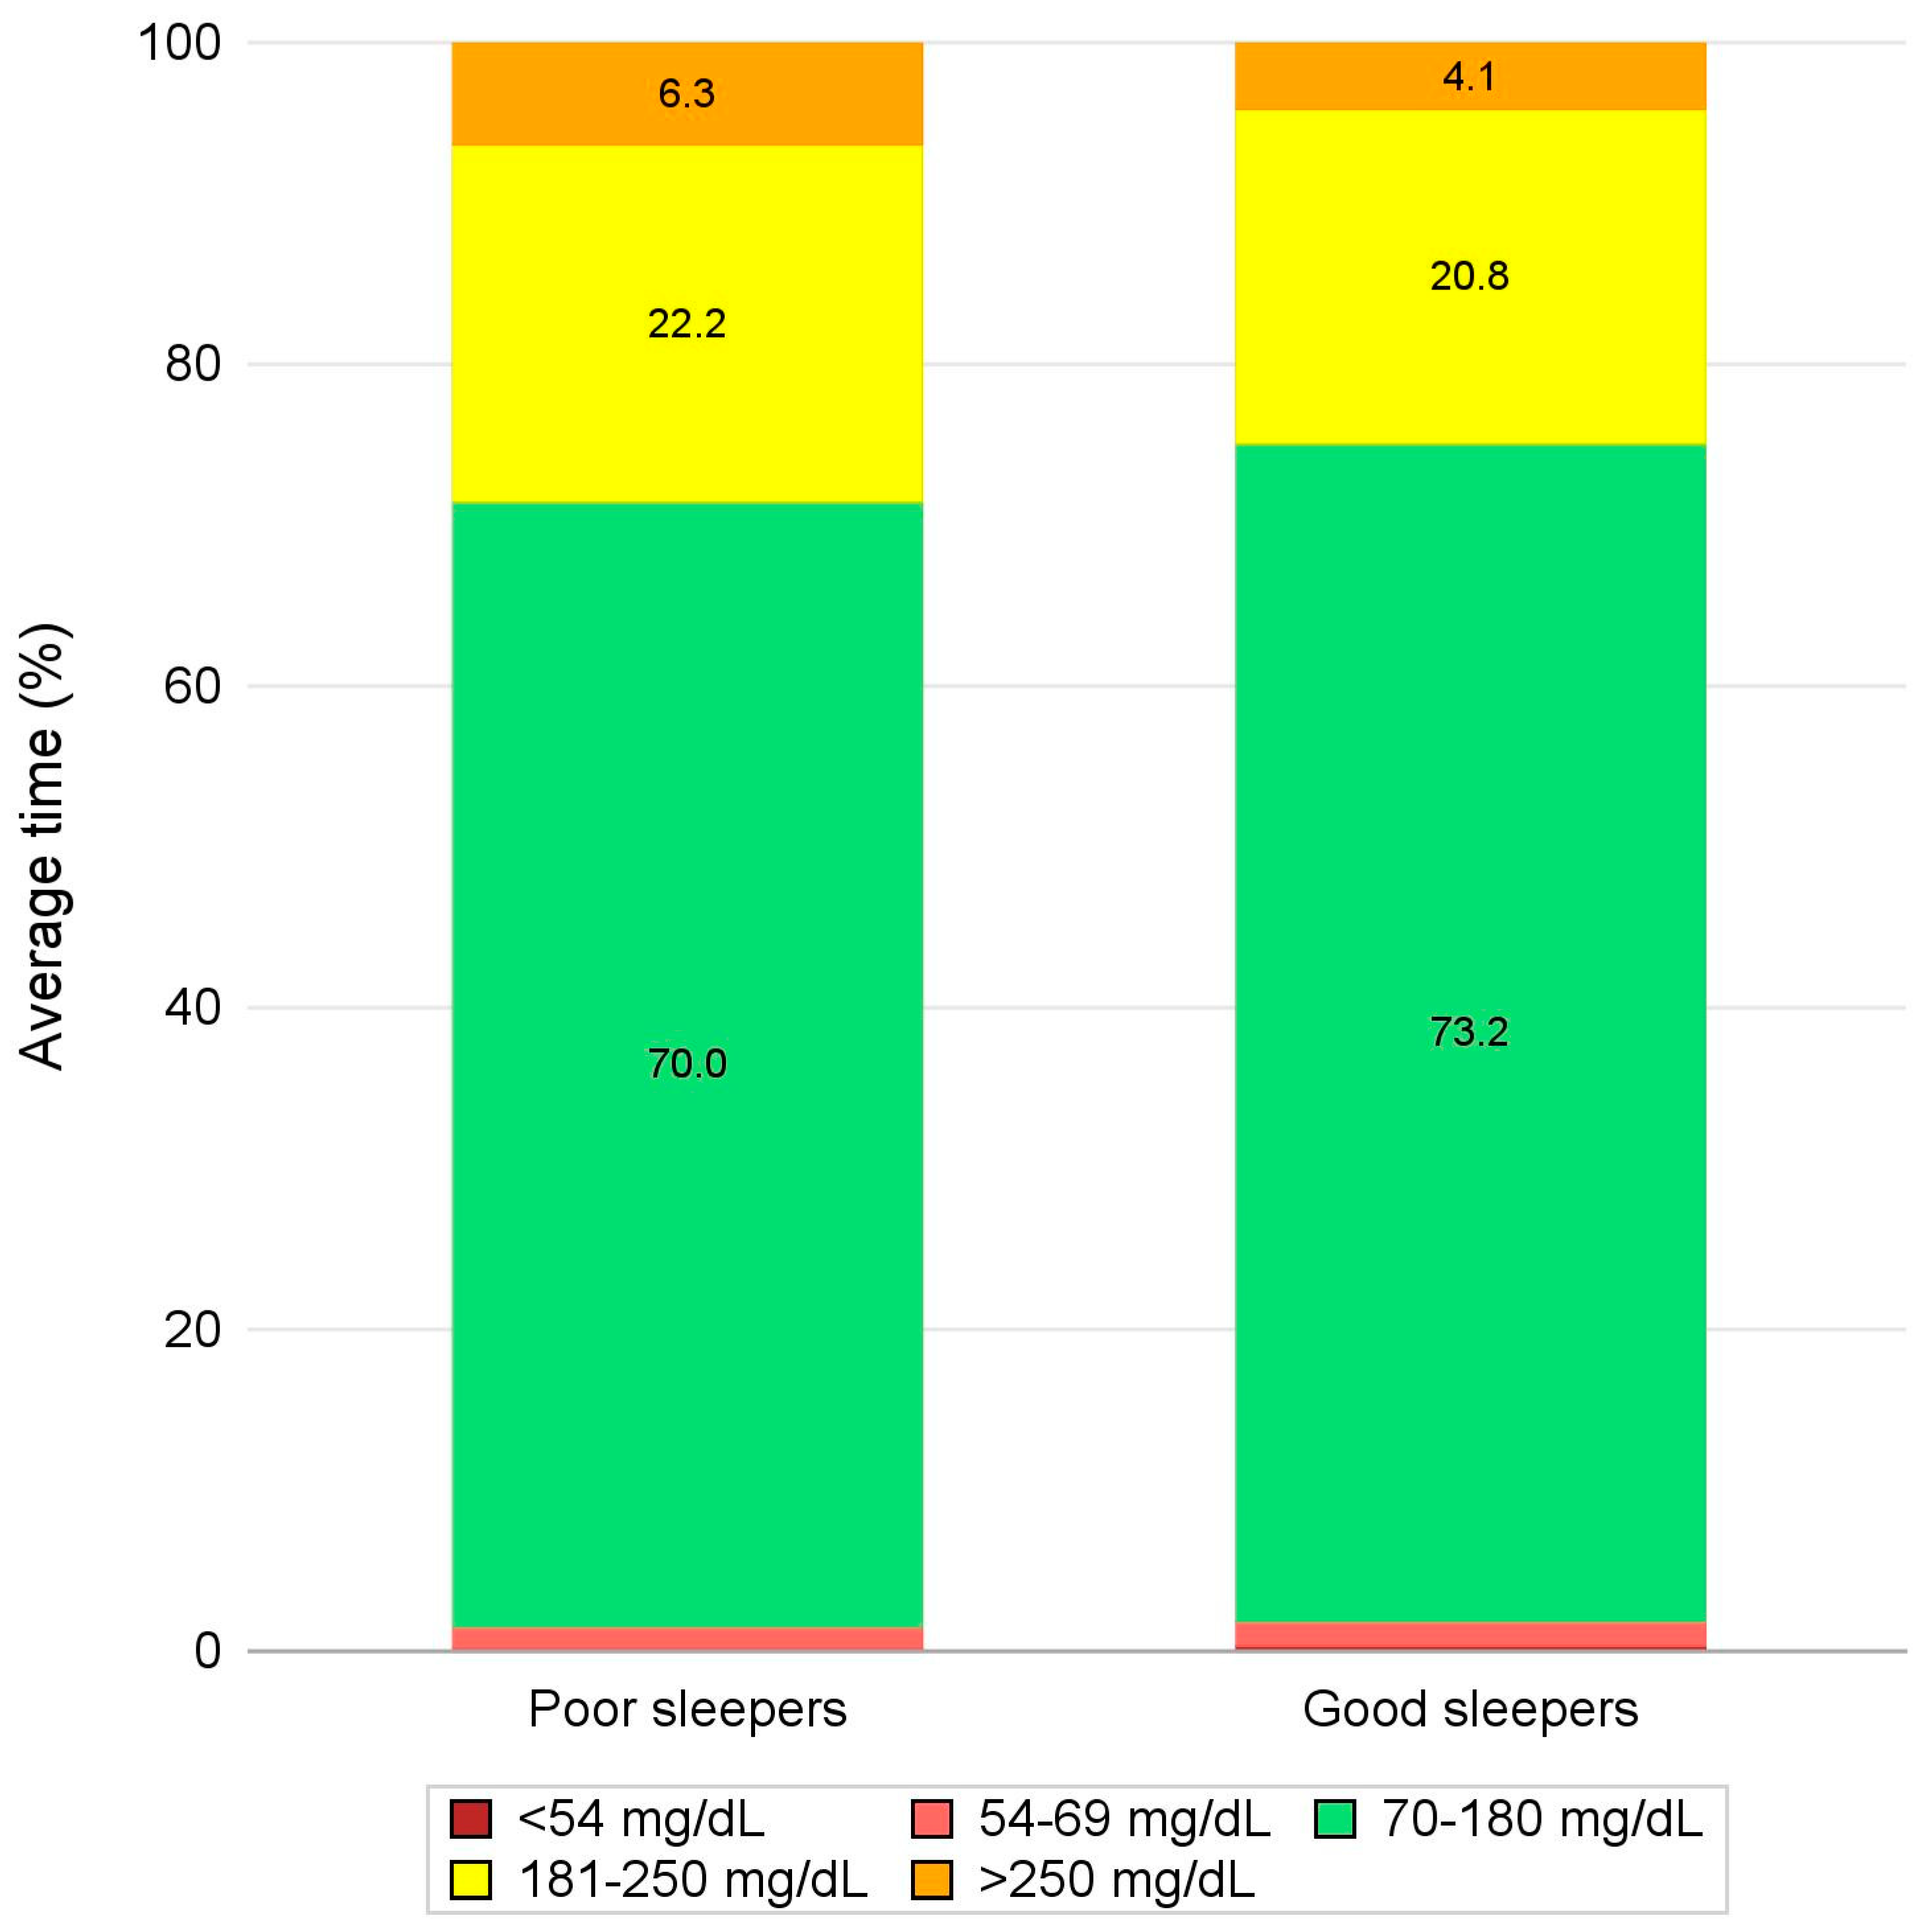
Figure 2.
Average TIR, TBR and TAR during bedtime hours in the 30 days preceding PSQI assessment by sleep quality.
Figure 2.
Average TIR, TBR and TAR during bedtime hours in the 30 days preceding PSQI assessment by sleep quality.
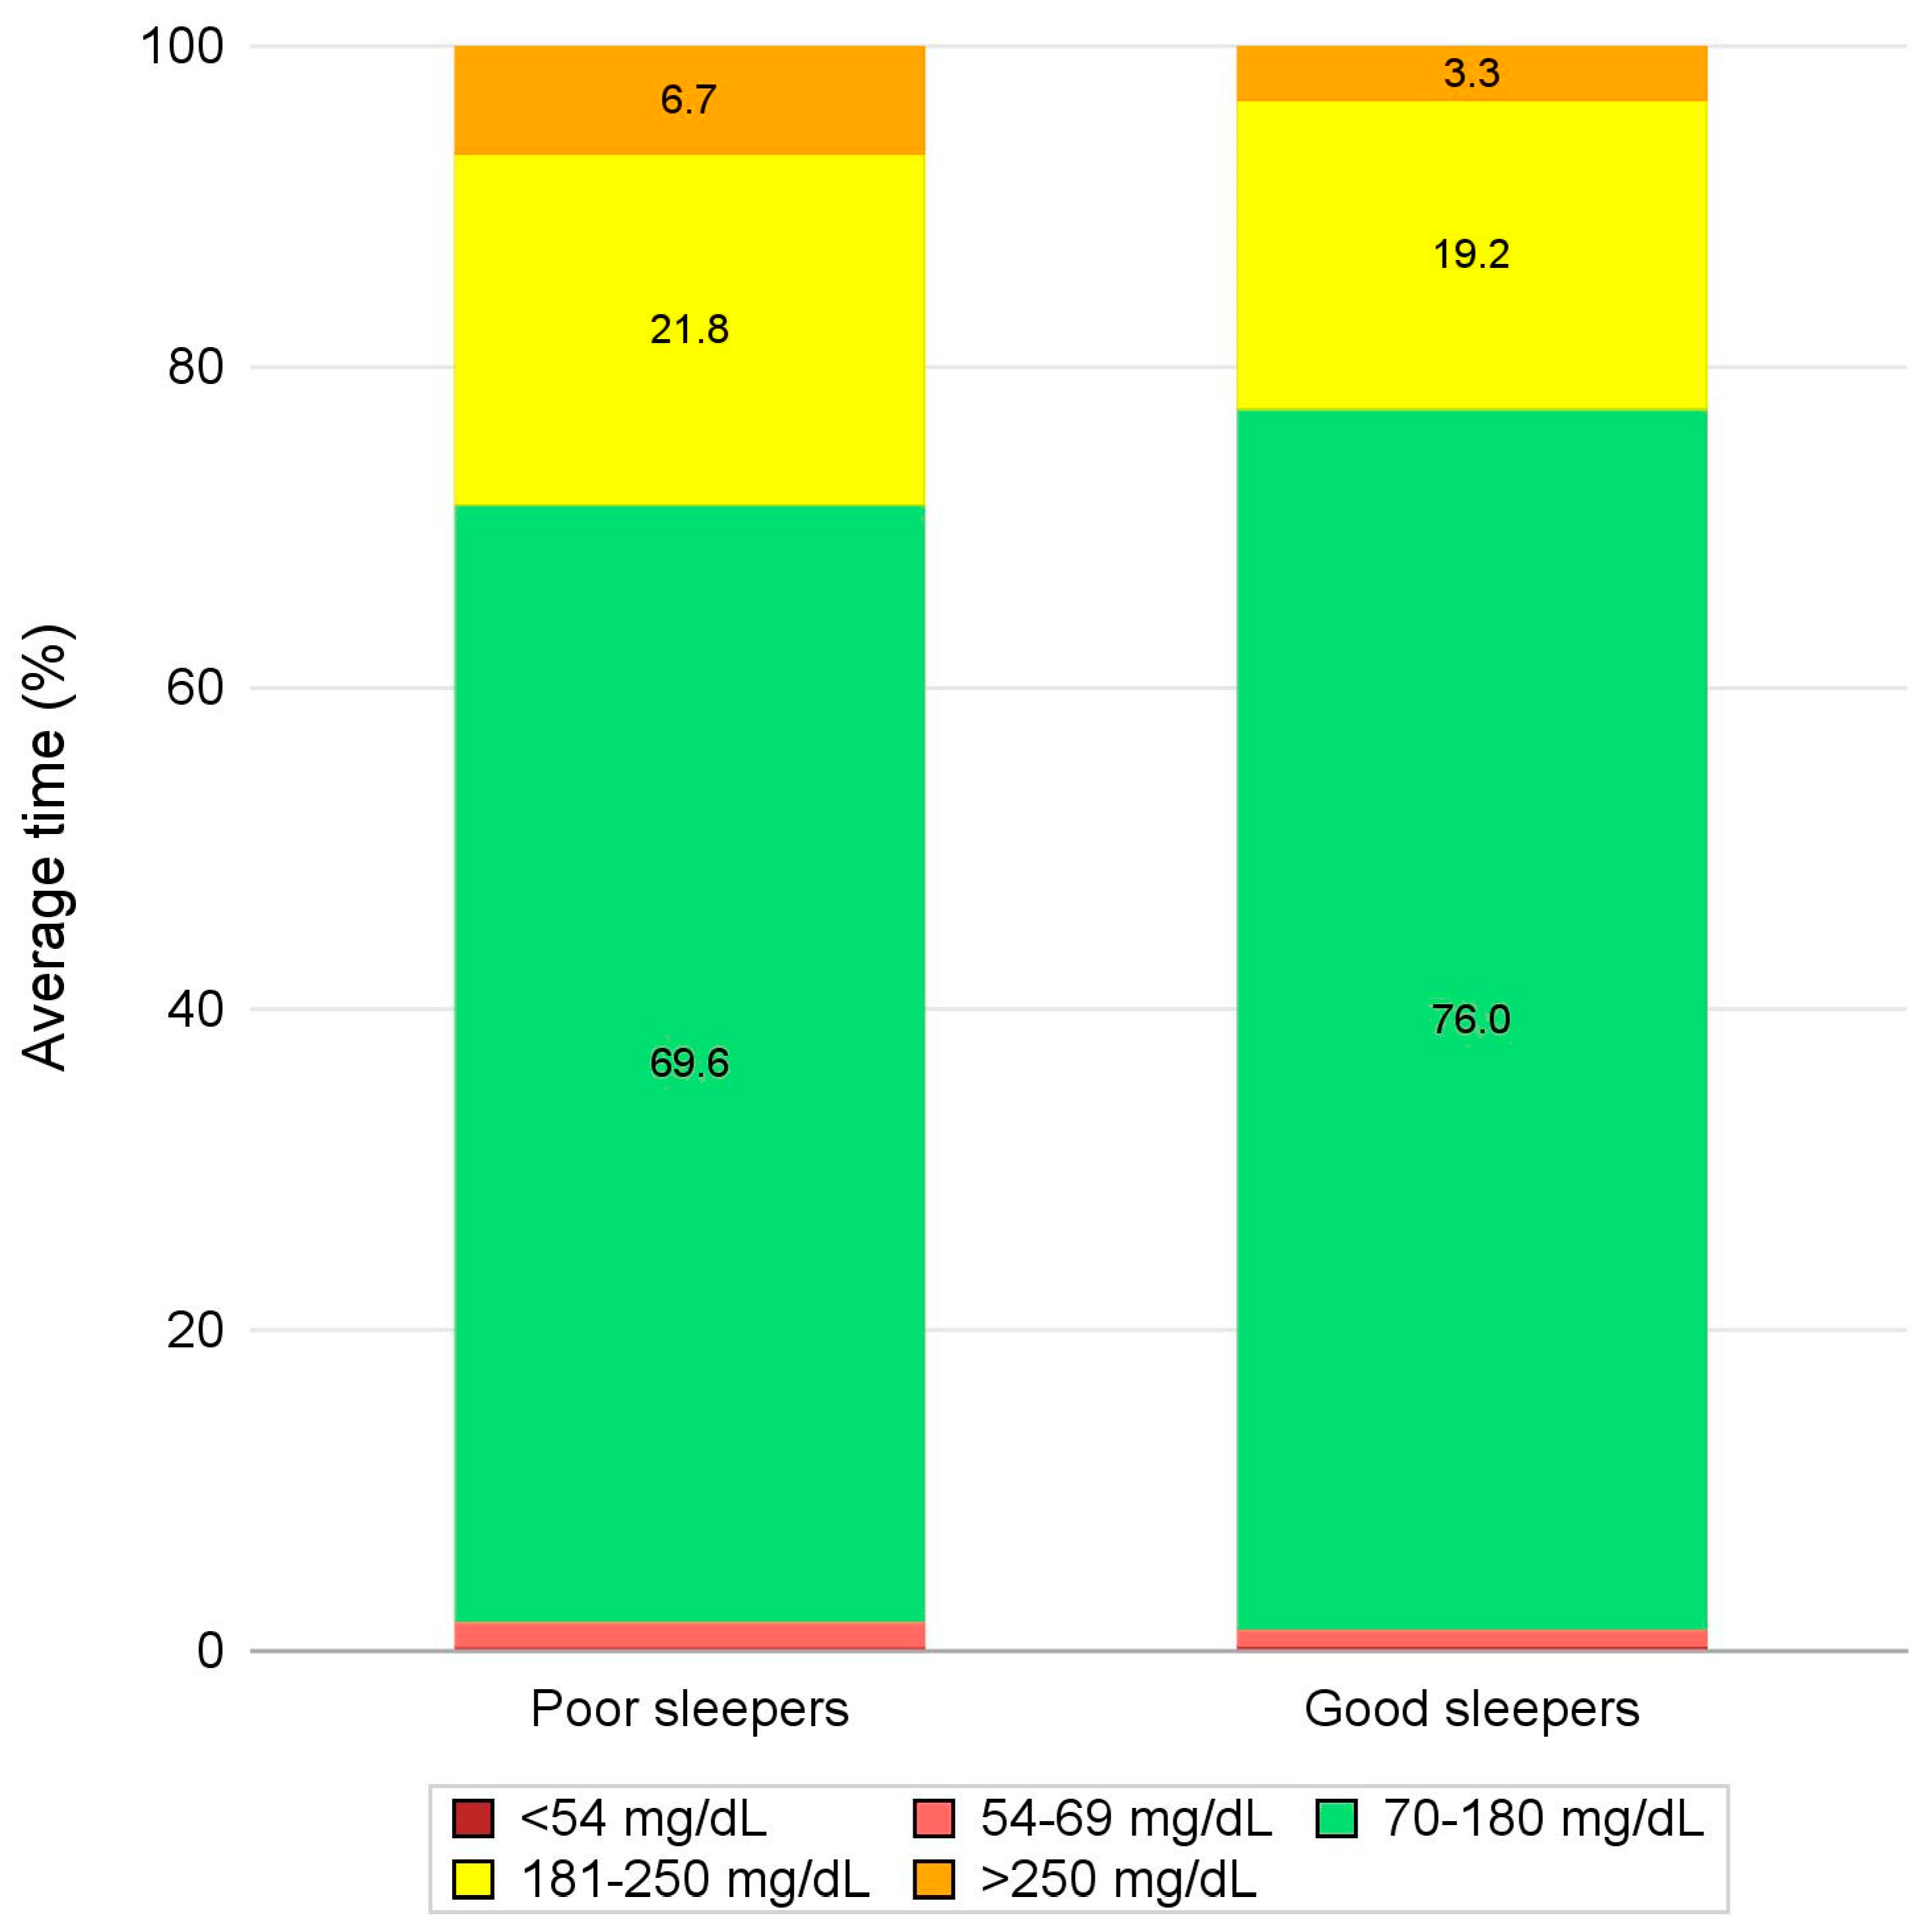

Table 1.
Criteria that were used to derive glycemic outcomes from CGM data.
| Variable | Derivation for a given period |
|---|---|
| Sensor usage (%) | (Number of CGM measurements / (Number of minutes in the period of interest / 5) * 100 |
| SG mean, SD, and CV | Mean, SD, and CV of CGM measurements |
| TIR metrics | (Number of CGM measurements in the range of interest / Number of CGM measurements) * 100 |
Legend. SG: sensor glucose; SD: standard deviation; CV: Coefficient of Variation; TIR: Time-in-range; CGM: continuous glucose monitoring.
Table 2.
Sleep quality in T1D patients.
| Summary Statistic |
Total (N = 41) |
|
|---|---|---|
| PSQI | Available Measures (%) | 41 (100.0%) |
| Mean ± SD | 6.0 ± 4.1 | |
| Median (IQR) | 4.0 (3.0-8.0) | |
| Min-Max | 1.0 - 17.0 | |
| Sleep quality | ||
| Poor sleepers (PSQI greater than 5) | % (n/Available Measures) | 36.6% (15/41) |
| Good sleepers (PSQI lower or equal to 5) | % (n/Available Measures) | 63.4% (26/41) |
Legend. PSQI: Pittsburgh Sleep Quality Index; SD: standard deviation; IQR: InterQuartile Range.
Table 3.
Patient characteristics by sleep quality.
| SummaryStatistic | Total(N = 41) | Poor sleepers(N = 15) | Good sleepers(N = 26) | p-value | |
|---|---|---|---|---|---|
| Age (yrs.) | Available Measures (%) | 41 (100.0%) | 15 (100.0%) | 26 (100.0%) | 0.850 |
| Mean ± SD | 51.9 ± 11.6 | 52.2 ± 12.3 | 51.7 ± 11.5 | ||
| Median (IQR) | 51.0 (43.0-63.0) | 51.0 (43.0-63.0) | 50.5 (42.0-64.0) | ||
| Min-Max | 26.0 - 72.0 | 26.0 - 72.0 | 29.0 - 70.0 | ||
| Female | % (n/Available Measures) | 41.5% (17/41) | 46.7% (7/15) | 38.5% (10/26) | 0.745 |
| Diabetes duration (yrs.) | Available Measures (%) | 39 (95.1%) | 15 (100.0%) | 24 (92.3%) | 0.058 |
| Mean ± SD | 25.1 ± 14.6 | 19.2 ± 12.0 | 28.8 ± 15.1 | ||
| Median (IQR) | 25.0 (14.0-34.0) | 17.0 (10.0-32.0) | 27.0 (21.5-37.0) | ||
| Min-Max | 1.0 - 61.0 | 1.0 - 40.0 | 5.0 - 61.0 | ||
| BMI (kg/m2) | Available Measures (%) | 39 (95.1%) | 15 (100.0%) | 24 (92.3%) | 0.516 |
| Mean ± SD | 25.0 ± 4.1 | 25.6 ± 3.6 | 24.6 ± 4.4 | ||
| Median (IQR) | 24.9 (21.7-28.7) | 24.9 (23.0-28.7) | 24.6 (20.7-28.6) | ||
| Min-Max | 18.0 - 32.4 | 19.8 - 32.2 | 18.0 - 32.4 | ||
| Smoking habit | |||||
| Current smoker | % (n/Available Measures) | 22.5% (9/40) | 26.7% (4/15) | 20.0% (5/25) | 0.204 |
| Former smoker | % (n/Available Measures) | 15.0% (6/40) | 26.7% (4/15) | 8.0% (2/25) | |
| Non-smoker | % (n/Available Measures) | 62.5% (25/40) | 46.7% (7/15) | 72.0% (18/25) | |
| Device | |||||
| MiniMedTM 780G | % (n/Available Measures) | 68.3% (28/41) | 60.0% (9/15) | 73.1% (19/26) | 0.492 |
| Medtronic Smart MDI | % (n/Available Measures) | 31.7% (13/41) | 40.0% (6/15) | 26.9% (7/26) |
Legend. BMI: Body Mass Index; SD: standard deviation; IQR: InterQuartile Range.
Table 4.
Glycemic outcomes during the 30 days preceding PSQI assessment by sleep quality.
| SummaryStatistic | Total(N = 41) | Poor sleepers(N = 15) | Good sleepers(N = 26) | p-value | |
|---|---|---|---|---|---|
| SG mean (mg/dL) | Available Measures (%) | 41 (100.0%) | 15 (100.0%) | 26 (100.0%) | 0.310 |
| Mean ± SD | 153.9 ± 18.3 | 157.5 ± 20.4 | 151.8 ± 17.1 | ||
| Median (IQR) | 150.7 (142.0-168.6) | 159.0 (142.0-172.4) | 149.0 (142.0-162.9) | ||
| Min-Max | 117.0 - 197.5 | 120.8 - 194.5 | 117.0 - 197.5 | ||
| SG SD (mg/dL) | Available Measures (%) | 41 (100.0%) | 15 (100.0%) | 26 (100.0%) | 0.228 |
| Mean ± SD | 47.4 ± 10.7 | 49.4 ± 12.1 | 46.3 ± 9.8 | ||
| Median (IQR) | 44.9 (40.0-51.4) | 49.5 (42.5-53.5) | 42.1 (39.9-48.9) | ||
| Min-Max | 29.9 - 81.2 | 29.9 - 81.2 | 35.3 - 77.3 | ||
| SG CV (%) | Available Measures (%) | 41 (100.0%) | 15 (100.0%) | 26 (100.0%) | 0.598 |
| Mean ± SD | 30.7 ± 5.0 | 31.2 ± 5.6 | 30.4 ± 4.6 | ||
| Median (IQR) | 30.2 (27.3-32.4) | 30.6 (26.1-33.6) | 29.2 (27.3-31.7) | ||
| Min-Max | 21.6 - 44.8 | 23.2 - 44.8 | 21.6 - 43.6 | ||
| TBR2 (%) | Available Measures (%) | 41 (100.0%) | 15 (100.0%) | 26 (100.0%) | 0.250 |
| Mean ± SD | 0.3 ± 0.7 | 0.2 ± 0.3 | 0.4 ± 0.8 | ||
| Median (IQR) | 0.1 (0.0-0.3) | 0.0 (0.0-0.4) | 0.1 (0.0-0.3) | ||
| Min-Max | 0.0 - 3.9 | 0.0 - 1.0 | 0.0 - 3.9 | ||
| TBR1 (%) | Available Measures (%) | 41 (100.0%) | 15 (100.0%) | 26 (100.0%) | 0.167 |
| Mean ± SD | 1.4 ± 1.9 | 1.3 ± 2.1 | 1.5 ± 1.7 | ||
| Median (IQR) | 0.8 (0.2-1.7) | 0.4 (0.1-1.4) | 1.0 (0.4-2.0) | ||
| Min-Max | 0.0 - 7.5 | 0.0 - 6.9 | 0.0 - 7.5 | ||
| TBR (%) | Available Measures (%) | 41 (100.0%) | 15 (100.0%) | 26 (100.0%) | 0.137 |
| Mean ± SD | 1.7 ± 2.4 | 1.5 ± 2.4 | 1.9 ± 2.4 | ||
| Median (IQR) | 0.9 (0.2-2.1) | 0.5 (0.1-1.8) | 1.1 (0.5-2.3) | ||
| Min-Max | 0.0 - 11.4 | 0.0 - 7.5 | 0.0 - 11.4 | ||
| TIR (%) | Available Measures (%) | 41 (100.0%) | 15 (100.0%) | 26 (100.0%) | 0.473 |
| Mean ± SD | 72.0 ± 11.5 | 70.0 ± 13.1 | 73.2 ± 10.6 | ||
| Median (IQR) | 73.3 (65.0-81.7) | 70.3 (59.3-81.9) | 75.5 (68.4-81.7) | ||
| Min-Max | 43.5 - 92.7 | 43.5 - 92.7 | 44.9 - 85.8 | ||
| TAR1 (%) | Available Measures (%) | 41 (100.0%) | 15 (100.0%) | 26 (100.0%) | 0.490 |
| Mean ± SD | 21.3 ± 7.9 | 22.2 ± 9.2 | 20.8 ± 7.2 | ||
| Median (IQR) | 21.3 (15.7-26.9) | 23.2 (16.3-30.5) | 21.2 (15.7-25.9) | ||
| Min-Max | 5.3 - 36.2 | 5.3 - 36.2 | 6.7 - 34.2 | ||
| TAR2 (%) | Available Measures (%) | 41 (100.0%) | 15 (100.0%) | 26 (100.0%) | 0.120 |
| Mean ± SD | 4.9 ± 5.5 | 6.3 ± 6.2 | 4.1 ± 5.0 | ||
| Median (IQR) | 2.6 (1.4-6.5) | 5.1 (1.7-8.4) | 2.4 (1.0-4.9) | ||
| Min-Max | 0.1 - 20.7 | 0.1 - 20.3 | 0.1 - 20.7 | ||
| TAR (%) | Available Measures (%) | 41 (100.0%) | 15 (100.0%) | 26 (100.0%) | 0.365 |
| Mean ± SD | 26.2 ± 12.3 | 28.5 ± 14.0 | 24.9 ± 11.3 | ||
| Median (IQR) | 23.7 (17.2-35.0) | 29.7 (17.9-40.5) | 23.6 (16.9-31.0) | ||
| Min-Max | 5.4 - 56.1 | 5.4 - 56.1 | 7.3 - 54.9 |
Legend. SG: Sensor Glucose; SD: standard deviation; IQR: InterQuartile Range; Min-Max: minimum-maximum; CV: Coefficient of Variation; TBR2: Time Below Range level 2; TBR1: Time Below Range level 1; TBR: Time Below Range; TIR: Time In Range; TAR1: Time Above Range level 1; TAR2: Time Above Range level 2; TAR: Time Above Range.
Table 5.
Glycemic outcomes during bedtime hours in the 30 days preceding PSQI assessment by sleep quality.
Table 5.
Glycemic outcomes during bedtime hours in the 30 days preceding PSQI assessment by sleep quality.
| SummaryStatistic | Total(N = 41) | Poor sleepers(N = 15) | Good sleepers(N = 26) | p-value | |
|---|---|---|---|---|---|
| SG mean (mg/dL) | Available Measures (%) | 41 (100.0%) | 15 (100.0%) | 26 (100.0%) | 0.379 |
| Mean ± SD | 153.0 ± 22.5 | 157.5 ± 24.5 | 150.5 ± 21.3 | ||
| Median (IQR) | 147.5 (141.0-164.5) | 150.5 (142.0-174.0) | 147.1 (135.3-161.0) | ||
| Min-Max | 121.3 - 213.9 | 121.3 - 204.5 | 122.0 - 213.9 | ||
| SG SD (mg/dL) | Available Measures (%) | 41 (100.0%) | 15 (100.0%) | 26 (100.0%) | 0.113 |
| Mean ± SD | 44.1 ± 12.6 | 48.1 ± 13.5 | 41.7 ± 11.6 | ||
| Median (IQR) | 41.4 (35.5-49.8) | 49.8 (34.4-54.9) | 40.1 (35.5-45.8) | ||
| Min-Max | 26.8 - 84.6 | 27.8 - 72.9 | 26.8 - 84.6 | ||
| SG CV (%) | Available Measures (%) | 41 (100.0%) | 15 (100.0%) | 26 (100.0%) | 0.091 |
| Mean ± SD | 28.7 ± 5.9 | 30.6 ± 7.3 | 27.5 ± 4.8 | ||
| Median (IQR) | 28.3 (24.2-31.6) | 29.9 (24.2-35.0) | 28.0 (23.7-29.5) | ||
| Min-Max | 17.4 - 42.5 | 17.4 - 42.5 | 19.0 - 39.6 | ||
| TBR2 (%) | Available Measures (%) | 41 (100.0%) | 15 (100.0%) | 26 (100.0%) | 0.977 |
| Mean ± SD | 0.3 ± 0.8 | 0.3 ± 0.7 | 0.3 ± 0.9 | ||
| Median (IQR) | 0.0 (0.0-0.1) | 0.0 (0.0-0.1) | 0.0 (0.0-0.2) | ||
| Min-Max | 0.0 - 4.2 | 0.0 - 1.9 | 0.0 - 4.2 | ||
| TBR1 (%) | Available Measures (%) | 41 (100.0%) | 15 (100.0%) | 26 (100.0%) | 0.691 |
| Mean ± SD | 1.2 ± 2.2 | 1.5 ± 3.1 | 1.0 ± 1.5 | ||
| Median (IQR) | 0.5 (0.0-1.2) | 0.4 (0.0-0.9) | 0.6 (0.0-1.4) | ||
| Min-Max | 0.0 - 9.9 | 0.0 - 9.9 | 0.0 - 5.5 | ||
| TBR (%) | Available Measures (%) | 41 (100.0%) | 15 (100.0%) | 26 (100.0%) | 0.711 |
| Mean ± SD | 1.5 ± 2.8 | 1.8 ± 3.8 | 1.4 ± 2.2 | ||
| Median (IQR) | 0.5 (0.0-1.3) | 0.4 (0.0-1.0) | 0.6 (0.0-1.7) | ||
| Min-Max | 0.0 - 11.8 | 0.0 - 11.8 | 0.0 - 9.5 | ||
| TIR (%) | Available Measures (%) | 41 (100.0%) | 15 (100.0%) | 26 (100.0%) | 0.163 |
| Mean ± SD | 73.7 ± 15.7 | 69.6 ± 16.9 | 76.0 ± 14.9 | ||
| Median (IQR) | 77.3 (66.8-85.3) | 71.0 (60.1-84.2) | 78.7 (70.3-86.5) | ||
| Min-Max | 32.6 - 95.3 | 37.8 - 95.1 | 32.6 - 95.3 | ||
| TAR1 (%) | Available Measures (%) | 41 (100.0%) | 15 (100.0%) | 26 (100.0%) | 0.636 |
| Mean ± SD | 20.2 ± 10.8 | 21.8 ± 12.7 | 19.2 ± 9.6 | ||
| Median (IQR) | 19.1 (12.1-26.2) | 19.5 (12.1-30.1) | 17.9 (12.1-24.0) | ||
| Min-Max | 3.8 - 53.6 | 3.8 - 53.6 | 4.6 - 43.6 | ||
| TAR2 (%) | Available Measures (%) | 41 (100.0%) | 15 (100.0%) | 26 (100.0%) | 0.013 |
| Mean ± SD | 4.6 ± 6.7 | 6.7 ± 7.2 | 3.3 ± 6.2 | ||
| Median (IQR) | 1.8 (0.5-5.6) | 4.9 (1.4-10.6) | 1.1 (0.5-2.8) | ||
| Min-Max | 0.0 - 27.7 | 0.3 - 27.7 | 0.0 - 27.3 | ||
| TAR (%) | Available Measures (%) | 41 (100.0%) | 15 (100.0%) | 26 (100.0%) | 0.310 |
| Mean ± SD | 24.8 ± 16.0 | 28.5 ± 17.7 | 22.6 ± 14.9 | ||
| Median (IQR) | 20.6 (13.2-33.2) | 24.5 (13.5-39.9) | 19.8 (12.6-27.0) | ||
| Min-Max | 4.1 - 65.0 | 4.1 - 61.2 | 4.7 - 65.0 |
Legend. SG: Sensor Glucose; SD: standard deviation; IQR: InterQuartile Range; Min-Max: minimum-maximum; CV: Coefficient of Variation; TBR2: Time Below Range level 2; TBR1: Time Below Range level 1; TBR: Time Below Range; TIR: Time In Range; TAR1: Time Above Range level 1; TAR2: Time Above Range level 2; TAR: Time Above Range.
Disclaimer/Publisher’s Note: The statements, opinions and data contained in all publications are solely those of the individual author(s) and contributor(s) and not of MDPI and/or the editor(s). MDPI and/or the editor(s) disclaim responsibility for any injury to people or property resulting from any ideas, methods, instructions or products referred to in the content. |
© 2025 by the authors. Licensee MDPI, Basel, Switzerland. This article is an open access article distributed under the terms and conditions of the Creative Commons Attribution (CC BY) license (http://creativecommons.org/licenses/by/4.0/).
Copyright: This open access article is published under a Creative Commons CC BY 4.0 license, which permit the free download, distribution, and reuse, provided that the author and preprint are cited in any reuse.


