
Submitted:
09 January 2025
Posted:
10 January 2025
You are already at the latest version
Abstract
The growing demand for sustainable agricultural practices requires the search for innovative solutions to improve crop yield and quality. This study investigated the soil-specific effects of the bio growth regulator Supporter on seed potato yield and quality in different potato varieties, with the aim of unlocking the sustainable potential under different environmental conditions. Field trials were conducted on several soil types using the bio growth stimulator Supporter at a rate of 300 ml per hectare (diluted in 30 liters of water) during pre-planting treatments. Standardized agronomic practices, including continuous fertilization, weed control and pest control, were applied at all test sites to ensure comparability. The results showed that the use of the bio growth stimulator Supporter significantly increased tuber yield and quality, especially in soils with moderate fertility levels. In the Supporter treatments, better tuber size uniformity, higher seed potato mass fraction and number, higher average seed potato mass and higher multiplication coefficient were observed. The effectiveness of Supporter varied across study locations and soil types, with sandy and clay soils showing the most pronounced benefits, while clay soils showed more limited responses. The results underscore the potential of Supporter as a sustainable tool for increasing potato seed production, while also emphasizing the need for soil-specific recommendations. This study highlights the importance of integrating growth regulators into precision agriculture to optimize crop performance and support global food security goals.
Keywords:
bio-growth regulator
; soil-specific effects
; tuber yield and quality
; sustainable agriculture
; potato varieties
; seed tuber weigh
; multiplication rate
1. Introduction
The production of seed potatoes in the world and in Europe is at a varied level. The share of certified seed potato material in the total use of propagating material in potato cultivation has been over 30% for several years. This is due to the decrease in the area of potato cultivation and the concentration of cultivation in larger farms, which benefit to a greater extent from biological progress [1]. Potato is a root crop whose origin is associated with South America, but its seed production began in Europe, where the most scientific and research work on this crop was carried out. Cooperation between scientists from Germany and the United States began the development of certified seed potatoes at the beginning of the 20th century. The 1970s saw the development of tissue culture technology based on rapid propagation on artificial media in a controlled environment, which in the case of potatoes allowed its use in the production of disease-free seed potatoes [2]. In the 1990s, the concept of producing elite tubers was introduced to obtain high-quality seed potatoes. Such tubers reached full size before the appearance of virus vectors and were therefore free from virus infection (secondary infection) [3]. New, soilless methods of seed potato production are aeroponics and hydroponics. These techniques provide greater control over the plant's water status, nutrition, and stolon zone temperature [4]. Increasing the yield of plants, including potatoes, is possible thanks to the use of mineral and organic fertilization. However, excessive and unbalanced use of mineral fertilizers can reduce the activity and diversity of soil microorganisms [5], change the physicochemical properties of the soil, such as soil pH [6], stability of soil aggregates and water retention capacity [7]. Such action leads to a deterioration of soil health [8], increased disease intensity and reduced yield [9]. The decrease in soil microbiological activity and general health as a result of the use of inorganic fertilizers has therefore increased the interest of farmers in using biostimulants that improve crop productivity, as well as soil health.
According to EU Regulation 2019/1009, the term biostimulant defines: "EU fertilizing product, the function of which is to stimulate plant nutrition processes, independently of the nutrient content of the product, in order to improve one or more of the following characteristics of the plant and/or the plant rhizosphere: (a) nutrient use efficiency, (b) resistance to abiotic stress, (c) quality characteristics, or (d) availability of limited nutrients in the soil or rhizosphere" [10]. Biostimulants in plant cultivation, including potatoes, enhance the physiological processes of plants, improving their vigor, productivity, quality and durability [11].
Biostimulants in plant cultivation, including potatoes, enhance the physiological processes of plants, improving their vigor, productivity, quality and durability [11]. Currently, there are six groups of biostimulants available on the market, including matriculants, humic substances such as humic and fulvic acids, protein hydrolysates and amino acids, biopolymers, inorganic compounds and seaweed extracts, which are widely used in agriculture worldwide [12]. The use of biostimulants has a positive effect on soil biology, increases root and shoot growth, and improves resistance to stress factors [13,14,15,16,17]. The main impact of biostimulants on crops is shown in Figure 1.
In potato cultivation, the Supporter biostimulator is used to dress potato tubers. This preparation increases the resistance of plants to environmental stresses, contributing to the improvement of their efficiency and development [18]. This growth stimulator contains a mixture of active ingredients, such as amino acids, vitamins, microelements and substances stimulating metabolism. The advantage of its use is increased resistance to pests, diseases and environmental stresses, which consequently leads to increased yields. Application of the Supporter preparation can also have an impact on improving the quality of crops by increasing the content of nutrients and substances affecting aroma and taste [Supporter®]. Spraying with the Supporter biostimulator also increases the resistance of plants to unfavorable environmental conditions during the growing season, such as drought, high temperatures or soil salinity.
With the growing demand for sustainable agricultural practices, the use of natural products in increasing crop yield and quality has gained considerable attention. Agrochemistry, which focuses on chemical processes and substances that affect agricultural productivity, plays a key role in this context. The incorporation of natural bioregulators into crop management practices is in line with the global shift towards environmentally friendly and sustainable agricultural methods.
Seed potatoes are a fundamental part of potato production, and their treatment is crucial to ensure healthy crop development. Traditional seed potato dressing methods often involve the use of chemical pesticides and fertilizers, which can have harmful effects on the environment and human health. However, the use of natural growth modulators offers a promising alternative, providing benefits such as increased yield, increased plant resistance to disease, and increased stress tolerance.
2. Materials and Methods
Field studies were conducted between 2015 and 2017 in four locations in Poland (Figure 2).
- -
- Barankowo (Greater Poland Voivodeship)—coordinates: 53◦18′35′′ N, 16◦58′19′′ E.
- -
- Głubczyce (Opole Voivodeship)—coordinates: 50◦12′0′′ N, 17◦50′3′′ E.
- -
- Kędrzyno (West Pomeranian Voivodeship)—coordinates: 54◦3′55′′ N, 15◦27′1′′ E.
- -
- Ryn (Wormian–Masuria Voivodeship)—coordinates: 53◦56′57′′ N, 21◦30′54.17′′ E.
2.1. Field Research
The study investigated three key factors influencing potato cultivation: (1) cultivation methods, specifically seed potato treatment with the biostimulator Supporter prior to planting, compared to a control treatment where tubers were soaked in distilled water, (2) potato varieties, including Innovator, Lilly, Lady Claire, and Verdi, and (3) cultivation locations, namely Barankowo, Głubczyce, Kędrzyno, and Ryn. The experiment was conducted using a randomized complete block design (RCBD) with three replications. Seed treatment with Supporter was performed immediately before planting using a wet grouting method. Tubers were coated with a mortar containing Supporter at a concentration of 300 mL per hectare, supplemented with additional water to achieve the desired consistency. The treatment was applied using a specialized potato planter equipped with a built-in treater (Figure 3). The traditional cultivation method, in which tubers were soaked in distilled water, served as the control treatment to assess the efficacy of the Supporter-based seed potato treatment technology.
2.1.1. Potato Cultivation and Protection
In all study locations and years, spring barley served as the preceding crop for potatoes. Organic and mineral fertilization was applied uniformly across all treatments, consisting of biennial compost (straw + red clover + hay) at a rate of 35 t·ha⁻¹ and mineral fertilization at 90 kg N·ha⁻¹, 90 kg P·ha⁻¹, and 135 kg K·ha⁻¹. Mineral fertilizers were applied in spring using polyphosphate (NPK 6-20-30, S7) for the base dose, while the remaining nitrogen was supplemented as urea (46%).
Weed control targeted broadleaf weeds immediately after planting, prior to potato emergence, following thorough field preparation and harrowing. Monocotyledonous weed control was conducted between the potato’s first leaf pair development and the start of tuber formation phases (BBCH 12–40) or after inter-row cultivation, just before row closure.
To manage late blight, fungicides with active substances such as cyazofamid, fluopicolide, mancozeb, mandipropamide, and difenoconazole were applied. Potato beetle infestations were controlled using neonicotinoids and pyrethroids.
Potatoes were planted in the second half of April at a spacing of 75 × 33 cm, with a plot size of 25 m² designated for harvesting. Seed material was EU Class A, adhering to the standards outlined in the Polish Minister of Agriculture and Rural Development regulation (Journal of Laws, 2014).
Harvesting was performed during the technical maturity phase of tubers (BBCH 99) using an elevator digger. For early varieties, this occurred in mid-August, while for mid-early varieties, harvesting took place in the first decade of September.
During harvest, total tuber yield was recorded, and samples were collected from 10 plants to assess yield structure. Tubers were sorted into size fractions: <28 mm, 28–35 mm, 35–50 mm, 55–60 mm, and >60 mm in diameter, following Roztropowicz [19]. Tubers sized 28–60 mm were classified as seed potatoes. Seed potatoes were considered to be tubers with a diameter of 28–60 mm. To calculate the multiplication coefficient, the product of the tuber yield of the 28–60 mm fraction and the average weight of one tuber was divided by the number of seed potatoes intended for 1 ha (40,000). The reproduction coefficient was calculated as the number of seed potatoes obtained per hectare divided by 40,000. A summary of the basic operations and maintenance procedures is presented:
Potato cultivation involves various technologies and techniques aimed at optimizing production. Below is an overview of selected elements of potato cultivation presented in a descriptive form:
Pre-Planting Treatments: In traditional technology, no additional treatments are applied before planting. However, in the supported technology, a special treatment is used where a solution containing 300 ml of the supporter mixed with 30 liters of water per hectare is applied to prepare the field.
Fertilization: Both traditional and supported technologies utilize the same fertilization practices. Biennial compost made of straw, red clover, and hay is applied at a rate of 35 tons per hectare. Additionally, mineral fertilizers are used, with 90 kg of nitrogen (N), 90 kg of phosphorus (P), and 135 kg of potassium (K) per hectare.
Weed Control Systems: In the traditional technology, weeds are managed with Afalon 450 SC at 2 liters per hectare and Fusilade Super 125 EC at 2 liters per hectare. In the supported technology, Afalon 450 SC is also used at the same rate, but Fusilade Forte 150 EC is applied instead at a slightly reduced rate of 1.5 liters per hectare.
Potato Beetle Control: The control of potato beetles is identical in both traditional and supported technologies. Four products are applied:
- -
- Calypso 480 SC at 0.1 liters per hectare (1 application).
- -
- Actara 25 WG at 0.08 kilograms per hectare (1 application).
- -
- Cyperkil Max 500 EC at 0.05 liters per hectare (1 application).
- -
- Karate Zeon 050CS at 0.1 liters per hectare (1 application).
Potato Blight Control: For managing potato blight, the same measures are used in both systems:
- -
- Pyton Consento 450 SC at 2 liters per hectare (1 application).
- -
- Infinito 687.5 S.C. at 1.6 liters per hectare (1 application).
- -
- Ridomil Gold MZ 67.8 WG at 2 kilograms per hectare (1 application).
- -
- Acrobat MZ 69 WG at 2 kilograms per hectare (1 application).
Harvest: Harvesting was carried out with an elevator digger in both technologies. The harvest takes place when the tubers reach technical ripeness, which corresponds to 99° on the BBCH scale, as described by Bleinholder et al. [20].
Preceding Crops: The preceding crop rotation includes potato, spring barley, faba bean, and winter wheat. Additionally, a cover crop of white mustard is incorporated into the rotation to improve soil health and fertility.
This structured approach ensures the effective management of resources and crop protection, aiming to maximize yield and quality in both traditional and supported potato cultivation technologies.
2.2. Characteristics of Potato Varieties
The analyzed potato varieties differ in several characteristics, including earliness (length of the vegetation period), flesh color, culinary type, starch content, and yield potential. The culinary classification of the varieties ranges from B (general-purpose) to BC (general-purpose to mealy). Among the examined varieties, Innovator stands out for its highest yield, as confirmed by COBORU trials [21,22], whereas Verdi is notable for its highest starch content in tubers. Differences in starch content were also observed among the cultivars Lady Claire, Innovator, and Lilly (Table 1).
2.3. Characteristics of the Supporter Biostimulator
The full name of the preparation is SUPPORTER® YIELD MODULATOR, registered as a European Community Trademark (No. 014199475, figurative mark) by Spiess-Urania Chemicals GmbH. The product was introduced to the market under the provisions of the Act on Fertilizers and Fertilization of July 10, 2007 – Article 5 [23].
Supporter® is classified as a plant growth promoter and is not subject to classification or labeling requirements under Regulation (EC) No 1272/2008 (CLP). The product is marketed by CERTIS EUROPE B.V., Polish Branch, based on registration LSN 008304-00/00 issued in Germany to Spiess-Urania Chemicals GmbH (Frankenstraße 18b, D-20097 Hamburg) [24].
Supporter® serves as a yield biostimulator specifically formulated for the treatment of potato tubers and corn seeds. Its composition includes synthetic amino acids and SL amino acids, which promote plant growth and development by enhancing nutrient uptake efficiency and fostering the formation of robust root systems. As a result, treated plants exhibit increased resistance to environmental stresses, such as drought and nutrient deficiencies [24].
2.4. Soil Analysis Methodology
Each year, prior to starting the experiment, 20 soil samples were collected from the arable layer (0–20 cm) in accordance with PN-R-04031 [25]. These samples, with a total weight of approximately 0.5 kg, were analyzed to assess several soil properties, including granulometric composition, content of available phosphorus, potassium, magnesium, soil pH, and humus content [26]. Soil pH was determined in both a 1 mol KCl dm−3 solution and in water using the potentiometric method [27]. The available magnesium content was measured using the Schachtschabel method [28], while available phosphorus and potassium were analyzed using the Egner-Riehm method [29,30]. Humus content was assessed via the Tiurin method, adapted by Simakov [30]. The macro- and microelement concentrations were analyzed using Atomic Absorption Spectrometry (AAS). The results of these analyses were compared with the standard values provided by the Institute of Fertilization and Soil Science – National Research Institute [31]. Compost assessments included dry mass, organic matter, pH, and nutrient content. Potassium, calcium, and magnesium levels were determined according to PB 27, 2nd edition (06.04.2009), while nitrogen was assessed following the standards outlined in [32], and phosphorus was evaluated based on PB 26, 2nd edition (26/04/2009).
2.5. Soil Conditions
Table 2 summarizes the content of available phosphorus (P2O5), potassium (K2O), magnesium (Mg), soil pH (measured in KCl), and humus content for four locations over three years (2015-2017). Values are presented in g·kg⁻¹ for nutrients and pH for the soil reaction.
Levels of mineral nitrogen were calculated using the methodology provided by Fotyma et al. [33]. Table 2 presents the content of macroelements (P2O5, K2O, Mg) and the pH reaction (pH in KCl) in the soil from 2015 to 2017 across four locations in Poland: Kędrzyno, Barankowo, Ryn, and Głubczyce. In Kędrzyno, available phosphorus decreased over the three years from 24.8 g·kg⁻¹ in 2015 to 17.0 g·kg⁻¹ in 2017, indicating phosphorus deficiency in the soil. The available potassium content ranged from 9.0 to 18.0 g·kg⁻¹, classifying the soil as low to moderately fertile. Magnesium levels increased from 3.4 g·kg⁻¹ in 2015 to 6.2 g·kg⁻¹ in 2017. The soil's pH was slightly acidic to neutral [31].
In Barankowo, available phosphorus was high, with values ranging from 25.0 to 31.9 g·kg⁻¹, while potassium content varied between 12.4 and 12.7 g·kg⁻¹, indicating relatively stable fertility. Magnesium content ranged from 2.9 to 3.3 g·kg⁻¹, and the soil pH remained slightly acidic [26,32]. In Ryn, located in northeastern Poland, phosphorus levels were lower (1.5 to 15.0 g·kg⁻¹), while potassium ranged from 16 to 19 g·kg⁻¹, and the soil was slightly acidic [26,32]. In Głubczyce, in southern Poland, phosphorus content ranged from 25.2 to 27.8 g·kg⁻¹ in 2015-2016 to 21.8 g·kg⁻¹ in 2017. Potassium levels were high, ranging from 19.1 to 21.6 g·kg⁻¹, and magnesium concentrations were similarly elevated. The soil's pH ranged from slightly acidic to neutral [31,32].
Humus content varied based on location. In Kędrzyno, Barankowo, and Ryn, humus content remained relatively consistent between 1.0 and 1.4 g·kg⁻¹ each year. However, Głubczyce exhibited higher humus levels, ranging from 1.6 to 1.8 g·kg⁻¹, although a downward trend was observed in 2016 and 2017, suggesting potential soil degradation or other influencing factors [26].
The presence of organic matter is crucial for soil quality as it impacts fertility, soil structure, water retention, and overall soil functionality [26]. A decrease in humus content could indicate soil degradation, requiring corrective measures, such as adjusting farming practices or using soil amendments to improve soil structure and conserve humus. These soil analyses reveal significant variation in macroelement levels and pH across the localities and over the years, with important implications for agricultural practices, particularly for adjusting fertilization strategies to suit changing soil conditions.
The soil conditions in the studied localities also varied. In Głubczyce, soils classified as very good and good (wheat-beetroot) in class II dominated. In Kędrzyno, potatoes were cultivated on podzolic soils developed from loamy clays and clayey sands. Barankowo, in western Poland, had potatoes cultivated on class IV podzolic soils. Ryn, in northeastern Poland, had an experiment established on brown soils formed from calcium-rich rocks [26,34].
2.6 Meteorological Conditions
This study incorporated meteorological data from COBORU experimental stations located within the research area. Over the three-year period, the highest total rainfall was recorded in Kędrzyno (West Pomeranian Voivodeship) at 1572.8 mm, followed by Głubczyce (Opole Voivodeship) with 1147.6 mm (Table 3).
In contrast, the lowest rainfall totals were observed in Ryn (1042.9 mm, and Barankowo (1052.9 mm). Kędrzyno not only experienced the highest precipitation levels but also recorded the lowest average air temperatures relative to the other locations, highlighting its unique climatic conditions within the study area (Table 3).
During the potato growing season, the highest average air temperatures were recorded in Głubczyce, ranging from 15.2 to 15.9°C, while the lowest temperatures were observed in Kędrzyno, with values between 12.2 and 14.9°C. In Barankowo and Ryn, thermal conditions were similar, ranging from 13.4 to 15.3°C and 13.8 to 14.5°C, respectively (Table 3).
To assess rainfall effectiveness during the growing season, the Sielianinov hydrothermal coefficient was calculated. This coefficient enabled the classification of climatic conditions across years and locations. In Kędrzyno, the years 2015 and 2016 were classified as fairly humid, while 2017 was very humid. In Barankowo, 2015 (k = 0.8) and 2016 (k = 1.0) were classified as dry, whereas 2017 was very humid (k = 1.9). In Ryn (Warmian-Masurian Voivodeship), the conditions were classified as dry in 2015 (k = 0.9), fairly dry in 2016 (k = 1.3), and fairly humid in 2017 (k = 1.8). In Głubczyce, the year 2015 was very dry (k = 0.7), 2016 was classified as optimal (k = 1.6), and 2017 as humid (k = 2.1) (Figure 4)
The hydrothermal coefficient values for 2015–2017 revealed distinct spatial and temporal variability in the occurrence of extreme rainfall conditions across the study sites. While the values for Barankowo and Ryn tended to remain within a range from dry to humid and showed limited variation, Głubczyce exhibited the greatest variability, with extremely low values in 2015 and the highest in 2017. In contrast, Kędrzyno consistently recorded the highest average hydrothermal coefficient values over the three years, indicating a higher level of humidity compared to the other locations (Figure 4).
2.7. Statistical Calculations
The statistical analysis was performed using SAS 9.2 software [36] based on a four-factor model that included varieties, cultivation technologies, locations, and years. In the model, years were treated as a random factor. The analysis employed analysis of variance (ANOVA) to evaluate the significance of main effects and their interactions.
To compare group means, Tukey's multiple comparison test was applied at a significance level of p = 0.05. The significance of variability sources was determined using the Fisher–Snedecor test. The ANOVA model incorporated main effects as well as two-way interactions between the analyzed factors, with particular emphasis on their statistical significance [37].
The application of Tukey's test allowed for a detailed comparison of means, effectively identifying statistically homogeneous groups. Differences between means were considered significant only when they exceeded the Least Significant Difference (LSD) threshold. This approach ensured precise detection of meaningful differences while maintaining rigorous statistical control [37].
By employing Tukey's method, the study enabled thorough comparative analyses and accurate classification of homogeneous groups, thereby providing a robust basis for identifying significant effects and interactions among the studied factors [37].
3. Results
3.1. Share of Seed Potatoes
The Table 4 illustrates the influence of cultivation technology, potato varieties, and years of cultivation on the share of seed potatoes. The influence of years, technologies and varieties, as well as their interactions, turned out to be statistically significant.
The highest share of tubers of this size was found in Kędrzyno in north-west Poland on typical potato soils, the lowest participation was observed in Głubczyce in south-west Poland on good soils. It should be added, however, that the following localities: Kędrzyno, Barankowo and Ryn were in the same homogeneous group in terms of the value of this feature and did not differ significantly from each other (Table 4).
The interaction between technologies and locations showed a large variability. This indicates that the effect of the cropping technology (conventional vs. Supporter) on the percentage of seed potatoes was location dependent. For example, while the Supporter technology performed better in one location, it may not have had the same effect in another. The use of the Supporter growth stimulator contributed to an increase in the share of seed potato tubers in all locations, however, in Głubczyce and Kędrzyno this effect was not statistically significant. This variability can be attributed to differences in environmental conditions (e.g. soil type, rainfall and temperature) that influenced the cropping technology used. Local adaptation of the technology is therefore crucial to maximizing the percentage of seed potatoes in specific regions (Table 4).
The interaction between technologies and years indicates a moderate level of variability in technology effectiveness across years. For example, in 2016, when water availability was optimal, Supporter increased seed potato share more effectively, compared with the dry year of 2015 or the mixed conditions of 2017. This suggests that the effectiveness of cropping technologies is influenced by annual weather conditions, particularly water availability. In years with favorable conditions, biostimulants such as Supporter may improve results, while in drought years their effect may be more muted. The year-by-location interaction had the highest LSD value, indicating significant variability in seed potato share based on the interaction between specific locations and conditions across years. For example, locations with adequate soil water retention may have had relatively stable seed potato share even in dry years such as 2015, while other locations with poor water retention or greater rainfall deficits experienced significant reductions. This variability highlights the critical role of environmental factors, including local weather patterns, in shaping potato yield and seed potato share. The interactions considered suggest that although cropping technologies such as Supporter can improve seed potato share, their effectiveness is highly dependent on location and year (Table 4). The greatest variability was observed for the year × location interaction, emphasizing the importance of considering both annual weather conditions and local environmental factors when implementing the technology. This supports the need for recommendations on potato cropping practices by region and year to optimize seed yield and quality. No interaction between the values of this trait was found in localities between years or in the interaction of locality x variety.
The cultivation technology significantly differentiated the share of seed potato mass in the total yield and contributed to the increase in the value of this feature, compared to the traditional technology without the use of the Supporter growth biostimulator (Table 5).
The highest share of seed tubers was shown for the Innovator variety, and the lowest for the Verdi variety. The following varieties were homogeneous in terms of the value of this feature: Lilly and Innovator, and Verdi and Lady Claire (Table 5).
The highest average share of seed tubers was recorded in 2015, and the lowest in 2016. The difference in the value of this feature between 2016 and 2017 turned out to be insignificant. The variability between years may result from both weather and environmental factors (Table 5).
The interactions of years with technologies (Y × T) and years with varieties (Y × V) indicate that the effect of technology and varieties on the share of seed potatoes in the total yield was dependent on thermal and humidity conditions. For example, the Supporter biostimulator technology showed better results in 2016 for some varieties, which suggests that the differences in the share of seed potatoes are strongly differentiated depending on the variety and year (Table 5).
The effect of cultivation technology on the studied varieties in the years of the study turned out to be statistically insignificant. All varieties responded better to the Supporter biostimulator technology, only the Verdi and Innovator varieties did not show such a response in the dry 2015, and Innovator, Lady Claire and Lilly produced a greater mass of seed potatoes in the traditional technology. However, these differences were not statistically significant (Table 5).
3.2. Yield of Seed Potatoes
The yield of seed potatoes depended on the total yield and the share of seed potato tubers with a diameter of 28 to 60 mm. The influence of experimental factors on the value of this feature depending on the variety, cultivation technology and research location is presented in Table 6 and Table 7. In the Table 6 analyzed the impact of cultivation technology, variety, and year on seed potato yield (t·ha−1), averaged across locations.
Cultivation technology significantly differentiated the seed potato yield. The use of the Supporter biostimulator before planting on tubers increased the value of this feature by 16.9%, and depending on the variety by 10.9% to 28.9%, compared to traditional technology. The greatest effect of this technology was observed in the Innovator variety, and the smallest in the Lady Claire variety. The Verdi and Lady Claire varieties were homogeneous in terms of the value of this feature (Table 6).
Influence of varieties: The Lilly variety was distinguished by a significantly higher yield than all other varieties. The Innovator variety was characterized by the lowest seed potato yield and was statistically significantly different from all other varieties. None of the varieties were homogeneous in terms of seed potato yield. All differences between the average yields of the varieties were greater than 3.22 t ha−1, which indicates statistically significant differences (Table 6).
Conditions in the years of the study significantly modified the seed potato yield. The highest seed potato yield was obtained in the optimal thermal conditions of 2016, while the significantly lowest was obtained in the dry 2015. The difference between the seed potato yield in 2016 and 2017 and 2016 and 2015 turned out to be statistically insignificant (Table 6).
Technology × Variety interaction. The Innovator, Lilly and Lady Claire varieties responded significantly to the cultivation technology using the Supporter biostimulator. The technology using Supporter significantly increased the seed potato yield of the following varieties: Innovator, Lilly and Lady Claire, while it had no significant effect on the Verdi variety (Table 6).
The technology with Supporter significantly increased the seed potato yield compared to the traditional technology. The Lilly variety produced the highest yields, while Innovator produced the lowest. The year 2016 was the best in terms of yield, significantly different from 2015, but not from 2017. Significant interactions occurred between technology and varieties (greater effect of technology with Supporter biostimulant for Innovator, Lilly and Lady Claire) (Table 6).
The locations of the experiments and the cultivation technologies significantly differentiated the value of this feature. Depending on the location, the seed potato yield ranged from 27.07 t ha-1 in Barankowo (central-western Poland) to 43.26 t ha-1 - in the case of Ryn (north-eastern Poland) (Table 7).
The cultivation technologies contributed to the increase in the value of this feature, on average by 20.5% and depending on the location by 7.8 to 32.7% (Table 7). The highest increase in seed potato yield compared to traditional cultivation was observed in Głubczyce (40.55 t·ha−1) and Ryn (39.63 t·ha−1). In the remaining locations, this yield was lower and amounted to 32.89 t·ha−1 – Kędrzyno and 26.04 t·ha−1 – Barankowo. The increase in seed potato yield after using the Supporter growth biostimulator in these localities ranged from 2.73 to 7.52 t·ha−1 (Table 7). Figure 5 shows the effect of cultivation location and applied technology on seed potato yield. The use of Supporter increased seed potato yield in all locations compared to traditional cultivation (Figure 5).
The influence of cultivation technology on the share of seed potatoes in the total yield also depended on the location of the experiments. In three locations (Barankowo, Kędrzyno and Głubczyce) this effect was positive and statistically significant. In Ryn, where climatic conditions were the least favorable, this effect was positive but statistically insignificant (Figure 5).
3.3. Number of Seed Potatoes
The number of seed potatoes is one of the key agrotechnical factors influencing the yield and quality of seed potatoes (Table 8 and Table 9).
A comparison of traditional cultivation technology and the use of Supporter biostimulant in potato cultivation shows that the technology itself did not have a statistically significant effect on the number of seed potatoes per ha, although a positive trend towards an increase in the number of seed potatoes in the yield can be observed, but these differences are within the range of natural variability and were not statistically significant. This suggests that the effect of Supporter biostimulant on the number of seed potatoes may depend on interactions with other factors, such as environmental conditions or a specific variety (Table 8).
Differences between potato varieties were statistically significant. The Innovator variety showed the highest average number of seed potatoes in all years and technologies, indicating the potential of this variety for higher productivity in different environmental conditions. Verdi, on the other hand, had the lowest average number of seed potatoes, indicating a lower production potential in terms of the number of seed potatoes compared to other varieties. Lilly, Innovator and Lady Claire showed average performance in this range, with Lilly slightly exceeding Lady Claire. These results highlight that the choice of potato variety has a greater impact on the number of seed potatoes than the cultivation technology (Table 8).
The effect of years was statistically significant. The highest average number of seed potatoes was observed in 2015, probably due to favorable meteorological conditions that favored the production of seed potato tubers by potato varieties. Both 2016 and 2017 saw significantly lower numbers of seed potatoes, which was related to weather conditions in these years. This indicates that annual weather conditions had a greater impact on the number of seed potatoes than the cultivation technology used. These results are consistent with previous findings emphasizing the critical role of water availability and climatic conditions during the growing season (Table 8).
Interactions between factors: The interactions of technology × variety (T×V) and technology × year (T×Y) were not significant, indicating that the performance of specific varieties or years was not strongly dependent on the cultivation technology. Similarly, the interaction of year × variety (Y×V) was not significant, suggesting that varieties responded similarly across years, despite variability in annual weather conditions (Table 8).
The results highlight the following: Variety selection is a key factor in achieving higher seed potato yields. Growers should prioritize high-yielding varieties such as Innovator or Lilly to achieve consistent results. Interannual variability plays a significant role, highlighting the importance of adapting cultural practices to current weather conditions. For example, irrigation and water management may be necessary in drought-like years. Supporter biostimulant did not significantly increase seed potato yields, suggesting that its potential benefits may be more pronounced under specific stress conditions (e.g. drought) or for improving other quality traits rather than quantity. These results support the need for integrated cultivation strategies, including variety selection, monitoring weather conditions, and site-specific management practices, to optimize seed potato production (Table 9).
The highest number of seed potatoes was obtained in Kędrzyno, located in northwestern Poland, while the lowest number was recorded in Barankowo, located in the Greater Poland Voivodeship, which experienced the most significant rainfall deficit during the growing season. The number of seed potatoes in Głubczyce (southwestern Poland) and Ryn (northeastern Poland) was homogenous in terms of this characteristic (Table 9).
Neither cultivation technologies nor the interaction between years and technologies had a significant impact on this trait. However, weather conditions during the study years significantly influenced the number of seed potatoes. The highest number was recorded in 2016, which had optimal water availability, whereas the lowest was observed in the dry year of 2015. Differences between the years 2015 and 2017, as well as 2016 and 2017, along with the interaction between years and locations, were statistically insignificant (Table 9).
3.4. Share of Number of Seed Potatoes
The average seed potato share across all varieties, technologies and years was 82.27%. This indicates a moderate to high seed potato share of total production under the conditions studied (Table 10). The difference between traditional technology and technology with Supporter was not statistically significant. This suggests that Supporter biostimulant does not significantly effect of number seed potato share, although it may show small numerical improvements in some cases. Variety effect: Differences between varieties were statistically significant. Innovator showed the highest overall mean, producing a high percentage of seed potatoes in all technologies and years. Innovator and Lilly varieties and Verdi Lady Claire were homogeneous in terms of the value of this trait. These results suggest that Innovator and Lilly are the most productive varieties in terms of the fraction of tubers with seed size, under the conditions studied (Table 10).
Differences between years were statistically significant. In 2015, the highest average percentage of tubers was recorded due to favorable environmental conditions for seed potato production. Years 2016 and 2017 had similar and lower averages, reflecting the possible impact of less favorable weather conditions such as water stress or temperature fluctuations (Table 10). These results emphasize that annual variability of weather conditions has a significant effect on seed potato production.
Interactions between factors: Interactions between varieties × technology (V × T) and years × localities (Y × L) were not significant. This means that the varieties performed similarly in both cultivation technologies (traditional and with Supporter biostimulant) (Table 10).
A consistently high percentage of seed potatoes was produced in both technologies and in all years (the highest in 2015 with the traditional technology). Lady Claire: In 2015 it performed better with the Supporter biostimulant technology (92.01%) compared to the traditional technology. It showed variability between years but generally maintained competitive results. Lilly: showed stable performance across years and technologies, demonstrating adaptability and reliability. Verdi: had the lowest overall average (78.31%), indicating that it is less productive in terms of seed potato percentage under the given conditions (Table 10).
Implications for potato cultivation: Variety selection is crucial in seed potato production, as the results clearly show statistically significant differences between varieties. Innovator and Lilly are particularly effective in obtaining high seed potato yields. Annual weather conditions (e.g. rainfall and temperature) play a significant role in determining seed potato participation, with 2015 providing the best conditions in this experiment. Supporter biostimulant did not lead to a statistically significant improvement in the tuber number section of the seed potato fraction, but its small numerical advantage suggests potential benefits under certain stress conditions or for certain varieties. The analysis suggests that to increase seed potato participation, producers should priorities resistant, high-yielding varieties such as Innovator or Lilly, and focus on adapting practices to annual weather variability. Although Supporter technology did not demonstrate significant differences, its potential benefits may warrant further investigation under certain stress or soil conditions (Table 10).
The average share of seed potatoes varied significantly between locations, with Kędrzyno showing the highest overall average (92,65%) and Głubczyce the lowest (78.31%). The localities of Kędrzyno, Barankowo and Ryn were found to be homogeneous in terms of the value of this feature. Barankowo consistently achieved good results, particularly in 2015 (99.31%) due to favorable meteorological conditions. Głubczyce achieved the lowest result in 2016 (62.78%), probably due to unfavorable weather or soil conditions (Table 11).
The interaction between localities and technologies (L × T) was significant. Supporter technology improved the share of number seed potatoes in some locations, especially Barankowo, where it achieved the highest value (95.01%). However, in other localities, its impact was minimal (e.g., Kędrzyno and Głubczyce) (Table 11).
Interactions Between Years and Localities: The interaction between years and localities (Y × L) was not significant (ns), suggesting consistent yearly trends across all localities (Table 11).
Key Observations: Barankowo performed best overall, benefiting significantly from Supporter technology. The impact of Supporter technology was variable, depending on locality and environmental conditions. Weather conditions in 2015 were particularly favorable, whereas 2016 presented challenges across all localities.
Locality and yearly weather conditions were the most critical factors influencing seed potato share. While Supporter technology showed benefits in certain localities (e.g., Barankowo), its effects were inconsistent, emphasizing the need for further research under diverse conditions.
3.5. Average Seed Potato Mass
The average seed potato mass is an important parameter that affects the yield potential and quality of the seed potato. It is related to many factors, both environmental, technological and biological. In the conducted studies, the value of this feature was related to all the factors of the experiment (Table 12).
Lilly had the highest overall mean weight (74.91 g), demonstrating superior performance across all years and technologies. Innovator consistently produced the smallest seed potatoes (46.98 g overall), suggesting that this variety may not be optimal for producing larger seed potatoes under the tested conditions (Table 12).
Effect of Technologies: Cultivation technology significantly influenced potato weight. The Supporter technology resulted in higher mean weights (67.05 g) compared to the traditional technology (59.29 g) (Table 12).
The benefit of Supporter was most pronounced in the case of variety Lady Claire, where the weight increased from 65.96 g (Traditional) to 83.96 g (Supporter) in 2017 (Table 12).
Effect of Years: Years significantly influenced potato weight. The highest weights were observed in 2016 (67.15 g), likely due to favorable weather or growing conditions. In contrast, weights were lowest in 2015 (57.45 g), indicating suboptimal conditions for seed potato growth that year (Table 12).
Interactions: Variety × Technology (V × T): Significant interaction, indicating that the effect of technology varied across varieties. For instance, Lilly consistently benefited from Supporter, whereas Verdi and Innovator showed smaller differences. Year × Technology (Y×T): Significant interaction, suggesting that the performance of technologies depended on the growing year. Supporter consistently outperformed Traditional in 2016 and 2017 but showed less improvement in 2015. Year × Variety (Y×V): Significant interaction, demonstrating variability in variety performance across years. For example, variety Lilly performed exceptionally well in 2016 (80.00 g) compared to 2015 (69.99 g) (Table 12).
Key Observations: Supporter technology was most effective in Lady Claire and Lilly, particularly in 2017. Varieties showed substantial differences in weight, with Lilly and Lady Claire consistently outperforming Innovator (Table 12).
Environmental conditions in 2016 were most conducive to producing larger seed potatoes, irrespective of variety or technology (Table 12).
These findings emphasize the importance of matching appropriate technology with varieties and adapting to yearly climatic variations for improved productivity. The highest average seed potato weight was obtained in the Barankowo location (77.94), and the lowest in the Kędrzyno location (49.21) (Table 13).
Technology impact: The Supporter biostimulator technology was more effective than the traditional technology in all locations (Table 13).
The best results were recorded in 2016, slightly worse in 2015 and 2017. The last two years were homogeneous to each other (Table 13).
Interactions: Differences in results depending on the technology and location were statistically significant. The effectiveness of the technology with the Supporter biostimulator was particularly visible in Barankowo and Głubczyce, where the differences between the technologies were the greatest (Table 13).
Thus, the Supporter technology significantly improved the results compared to the traditional technology. Location and conditions in a given year had a significant impact on the results, with the best results obtained in Baranków and in 2016. Interactions between locations, years and cultivation technology indicate the complexity of the relationships that affect the results. The choice of location and technology should therefore be adapted to specific environmental conditions, as both factors clearly affect the results. The results obtained can be a valuable guide for agricultural practitioners in the selection of technology and location in order to maximize the quality of seed potatoes (Table 13).
3.6. Reproduction Coefficient
The propagation coefficient in the experiment carried out depended on the potato cultivation technology used (Table 14).
Influence of cultivation technology: The average multiplication coefficient for the traction technology was 4.99, which was statistically lower compared to the Supporter biostimulant technology (6.67) (Table 14).
Influence of varieties: The Lilly variety achieved the highest multiplication coefficient (7.73), significantly outperforming other varieties, especially Innovator (3.90). The Lady Claire variety also achieved high results (6.65). The differences between varieties were significant (Table 14).
Influence of years: The highest average multiplication coefficient was achieved in 2016 (6.20), indicating significantly more favorable conditions during this period, compared to 2015 (5.73) and 2017 (5.55) (Table 14).
The Supporter biostimulant technology significantly improved the multiplication coefficient for all varieties, especially for Lilly and Lady Claire. Varieties differed in their multiplication efficiency depending on the year and technology, indicating interactions between factors (Y x V and Y x T) (Table 14).
Cultivation technology with Supporter biostimulator significantly increased the reproduction coefficient, especially for Lilly and Lady Claire varieties. The reproduction efficiency depended on the variety, weather conditions in a given year and the technology used.
The multiplication coefficient is a parameter used to assess the efficiency of plant reproduction (including potatoes) in a given cultivation system, technology, location or time. In the case of potatoes, the multiplication coefficient determines the ratio of the number of tubers (or tuber mass) obtained from one planted tuber during one vegetation cycle. The higher the multiplication coefficient, the greater the number of tubers produced in relation to the number of tubers planted, which indicates the efficiency of reproduction. The highest average reproduction coefficient was achieved in Ryn (8.26), and the lowest in Kędrzyno (4.27). The differences between locations were statistically significant (Table 15).
Technology using the Supporter biostimulator gave better results than the traditional technology in all locations. The average for the technology with Supporter was 6.74, while for the traditional technology it was a reproduction coefficient of 4.91 (Table 15).
Year impact: The highest reproduction coefficient was achieved in 2016 (6.28), while in 2015 only (5.86), and 2017 (5.34) (Table 15).
Interactions: Significant differences were observed in the interaction of technology with locations (L x T). In the Ryn location, the technology using the Supporter biostimulator gave the highest results (average 9.16), which indicates the high effectiveness of this technology in optimal location conditions (Table 16). In the Kędrzyno location, the difference between technologies was the smallest, which may indicate limited effectiveness of the Supporter technology in more difficult environmental conditions (Table 15).
General observation: The combination of the Supporter biostimulator technology and favorable location conditions (e.g. Ryn) may bring the best results. In favorable conditions (e.g. 2016), this technology performs the best. Thus, the Supporter biostimulator technology significantly improves potato propagation efficiency, but its effectiveness depends on the location and year. Ryn location and 2016 provided the best results, which suggests that the impact of the technology is enhanced by favorable environmental conditions. The Kędrzyno location seems to be more demanding, which indicates the need for further optimization of the technology in less favorable conditions (Table 15). The choice of location and technology should therefore be adapted to specific environmental conditions, as both factors clearly affect the results. The results obtained can be a valuable guide for agricultural practitioners in the selection of technology and location in order to maximize the quality of seed potatoes.
3.7. Statistical Characteristics of Seed Potato Yield and Independent Variables
Table 16 presents descriptive statistics for the dependent variable y (seed potato yield) and selected independent variables (x).
The seed potato yield (y) averaged 34.43 t ha-1, which indicates a typical level of production in the study sample. The average share of seed potato weight in the total yield was 82.38%, which suggests good seed potato quality. The average number of seed potatoes from 10 plants (x2) was 133,4, which reflects the productivity of individual plants. The average number of seed potatoes per hectare (x3) was 525.8 thousand. The average weight of a single seed potato (x4) was 63.17 g, indicating an average tuber size. The reproduction coefficient was 5.83, which means that each tuber used as a seed potato yields almost 9 new tubers on average (Table 16).
The median for all variables is very close to the means, suggesting a relatively symmetrical distribution of the data, with no significant number of extreme values (Table 16).
The standard deviation for seed potato yield (y): was 9.17 t ha-1, indicating that the yield in the sample differs on average by this value from the mean. This indicates some variation in yields under the conditions studied. The independent variables are variables from x1 to x5: The smallest variation (7.78%) was in the average share of seed potato weight in the total yield, indicating stability of seed potato weight. Higher variation was observed in the number of seed potatoes from 10 plants and the total number of seed potatoes from 1 ha of area (43.08 and 147.72, respectively), which may be due to the influence of environmental or variety variables. The potato reproduction rate (x5) had relatively small variation (1.27) (Table 16).
Kurtosis: All variables were characterized by negative kurtosis, which indicates distributions flatter than the normal distribution. This means that there were fewer extreme values (slight "tails" of the distribution) in the sample (Table 16).
Skewness: All variables, except y (slightly positive skewness – 0.39), were characterized by negative values, which suggests a slight tendency of the data to shift towards higher values. In general, however, the distributions were close to symmetrical distributions (Table 16).
The coefficient of variation (V) shows the relative variability in relation to the mean. The highest variability was characteristic of independent variables x2 (32.30%) and x3 (28.10%), which indicates slightly larger differences between samples in the number of seed potatoes. The lowest variability was characteristic of variables x1 (9.45%) and x4 (14.31%), which indicates relative stability of seed potato mass. The coefficient of variation of seed potato yield (y) of 26.63% indicates moderate yield variability in the tested sample (Table 16).
3.8. Correlation Analysis of Variables Influencing Seed Potato Yield
The simple Pearson correlation matrix is shown in Figure 6. Correlations of variables with seed potato yield (y): applied to five independent variables from x1 to x5. The correlation between seed potato yield and the share of seed potato mass was r=-0.21. This is a weak, negative correlation, which suggests that with the increase in the % share of seed potato mass, their yield tends to decrease slightly. The correlation of the number of seed potatoes from 10 plants (x2) as well as the number of seed potatoes calculated per 1 ha and their yield was r=-0.01, which means practically no relationship between the number of seed potatoes and their yield per unit area. The correlation between the average seed potato mass and their yield was r=-0.17, which indicates a weak, positive relationship. An increase in the average seed potato mass may slightly increase the potato yield. The relationship between the multiplication rate and seed potato yield was only r= 0.05, indicating a very weak, positive relationship (Figure 6).
Correlations between independent variables (x1–x5) showed that the strongest correlation was between the number of seed potatoes obtained from 1 ha (x3) and the multiplication coefficient (x5) and it was r=0.78, which indicates a strong, positive relationship. This means that a higher number of seed potatoes per ha is associated with a higher multiplication coefficient. Therefore, seed potato yield (y) is most strongly correlated with the average seed of potato weight (x4), which may suggest that seed potato weight plays a more important role in yield than other variables. The strongest correlation between independent variables was between the number of seed potatoes in thousands per ha (x3) and the multiplication coefficient (x5) (Figure 6).
Other, general values of correlation coefficients were low, which may indicate the need for further research on the influence of other factors on seed potato yield.
4. Discussion
4.1. The Role of High-Quality Seed Material and Modern Technologies in Potato Cultivation
A fundamental element of successful potato cultivation is the use of high-quality seed material, which significantly influences yield and production efficiency. The demand for certified seed potatoes remains substantial, accounting for approximately 50 to 70% of the total production costs. In many countries, low potato yields are largely caused by the limited availability or poor quality of seed potatoes, highlighting the need for innovative cultivation technologies.
One promising approach to improving seed potato quality and productivity is the use of growth biostimulants. Scientific studies confirm the positive effects of biostimulants on soil health and fertility, including enhancements in soil microbial activity, nutrient availability, and physical properties such as aggregate stability, moisture retention, and pH balance [13,16,38,39].
Research conducted worldwide further highlights the beneficial impact of biostimulants on potato yield. Positive results have been reported by Pytlarz-Kozicka [40], and Pytlarz-Kozicka & Zagórski [41], Samy et al. [42], and Anikin and Issayev [43], confirming yield increases and improved tuber quality following biostimulant application. In the current study, the application of the Supporter growth modulator demonstrated a notable improvement in seed potato yield compared to traditional cultivation methods. Similar effects were observed by Pytlarz-Kozicka and Słabiński [44], who noted that untreated control plots had a higher percentage of small tubers (<30 mm), resulting in lower yields.
The percentage of seed potatoes within the total yield was significantly influenced by the cultivation technology. In this experiment, the use of the Supporter preparation increased the share of marketable seed potatoes, particularly within the optimal tuber diameter range of 35–50 mm. Additionally, soil type played a key role, as shown in field studies across four locations in Poland. These findings align with earlier results from Wierzejska-Bujakowska et al. [45], where seed potato yields were highest on weak soils (59.4%), slightly lower on light clay sands (55.0%), and lowest on strong clay sands (49.4%). The yield of seed potatoes is also determined by the potato cultivation system. According to Pytlarz-Kozicka [40], potatoes grown in the organic system gave yields half as low as in the conventional system. Moreover, as the author states, the yields obtained in the organically cultivated objects were characterized by a higher percentage of seed potatoes, a lower multiplication coefficient and a lower average tuber mass than in the conventionally cultivated objects.
In the conducted experiment, an increase in the weight of seed potatoes was noted as a result of using the Supporter growth biostimulator compared to traditional cultivation. The reaction depended on the cultivated varieties. The Innovator and Lilly varieties had a higher weight of seed potatoes, while the Verdi and Lady Clair varieties had a lower weight. This thesis is consistent with the research conducted by Zarzecka et al., [46]. The authors noted an increase in the weight of tubers after applying the Asahi SL preparation and the Tytanit biostimulant, while the use of the Moddus 250 EC regulator caused the tubers to become smaller.
4.2. Genetic Factors in Shaping the Quality Parameters of Seed Potatoes
The Role of Genetic Factors in Seed Potato Quality: Genetic factors play a critical role in determining the quality parameters of seed potatoes. Potato varieties differ in yield potential, adaptive capacity, disease resistance, and tuber quality, all of which are governed by their unique genetic traits. The weight of an individual seed tuber is largely determined by the variety's genotype. High-yielding varieties generally produce larger tubers. Results from the present study indicate that the "Supporter" technology had a greater impact on varieties with higher genetic potential, resulting in increased seed tuber weight. According to Boguszewska-Mańkowska et al. [47] and Zarzyńska & Boguszewska-Mańkowska [48], varieties differ in their response to supportive technologies, with high-performing genotypes responding more effectively to foliar fertilizers and biostimulants.
Genetic Determinants of Tuber Number and Size: Genotype also determines the number and size of tubers, which influence the distribution of seed tuber mass within the yield. This is a key factor in selecting seed tubers for further cultivation. Traits like the number of sprouts and eyes are genetically controlled and influence tuber germination ability. Potato varieties differ in the number of eyes per tuber, which in turn affects the number of stems produced by the plant. Based on the obtained results, varieties with a higher number of eyes utilized seed tuber mass more effectively, leading to a higher multiplication coefficient. Research by Nowacki et al. [21], Boguszewska-Mańkowska et al. [47], and Zarzyńska & Boguszewska-Mańkowska [48] shows that genetic predisposition to produce a greater number of stems positively impacts multiplication ability, although it may result in reduced tuber weight.
Adaptive Capacity to Environmental Conditions: The adaptive capacity of potato varieties to environmental conditions is another determinant of seed tuber quality. Genotype governs a variety's ability to endure stressful conditions such as drought or fluctuating temperatures. Boguszewska-Mańkowska et al. [47] applied various ensemble learning models and achieved improved performance outcomes, with extreme gradient boosting as the final classifier. Their study evaluated this classifier with an accuracy of 96.7%, using several potato parameters, including relative yield decline, stem weight, tuber maturity, leaf assimilation area, leaf mass, yield per plant, climatic water balance, and indices such as MSTI and DSI, which distinguished potato tolerance groups under drought stress. In the conducted studies, during years with less favorable weather conditions (e.g., 2015), differences between varieties were more pronounced, underscoring the importance of genotype. According to Vos & Havercort [49], varieties with better water stress tolerance produce more uniform seed tubers, which is critical under varying climatic conditions.
This research highlights the importance of genetic factors and their influence on the production and quality of seed potatoes, with genotype-environment interactions playing a pivotal role in determining these traits.Dół formularza
4.3. Disease Resistance and Impact on Seed Potato Quality
Genetic Factors Affecting the Quality Parameters of Seed Potatoes: Disease Resistance and Tuber Health. Potato varieties differ significantly in their resistance to diseases such as late blight and viruses like PVY and PLRV, which directly impacts the health of seed tubers. In this study, the health of tubers grown using the “Supporter” technology was notably better, especially in varieties more susceptible to infections. According to Ostonakulov & Lukova [50], genetic resistance plays a critical role in seed potato germination ability and quality during storage.
Genotype and Response to Supportive Technologies: Potato varieties vary in their sensitivity to biostimulants, fertilizers, and supportive technologies. In the case of the “Supporter” technology, varieties with higher yield potential (e.g., those producing larger seed tuber mass) showed greater improvement compared to traditional cultivation methods. The research by Zarzecka et al. [46] confirms that genotypes with better responses to foliar fertilization and biostimulants achieve higher yield indicators, which directly affects seed potato quality.
Multiplication Potential: Multiplication potential is a crucial genetic trait of a variety. The multiplication coefficient, which determines the number of tubers obtained from a single plant, depends on the genotype. In this study, the multiplication coefficient was higher for varieties with a genetic predisposition to produce a greater number of smaller tubers under the “Supporter” technology. According to Struik and Wiersema [51], varieties with higher multiplication coefficients are preferred in seed potato production.
Impact of Genetic Factors on Quality Parameters: Genetic factors significantly influence the quality parameters of seed potatoes. Both the results of this study and recent research indicate that the genotype determines the mass, size, health, storage capacity, and multiplication potential of seed potatoes. Additionally, genotype interactions with environmental conditions and cultivation technologies play a key role. In practice, selecting the right variety with desirable genetic traits and implementing supportive technologies like “Supporter” can significantly improve seed potato quality and future yields.
Genetic Research and Varietal Advances: In recent years, research has focused on identifying genes responsible for desirable traits, such as pathogen resistance and tolerance to abiotic stresses. Work on the genetic resources of tetraploid potatoes aims to secure and evaluate genetic material for breeding new varieties [51]. Integrated potato production incorporates varietal progress through targeted genetic improvements to enhance agricultural and utility characteristics. As a result, higher-quality seed tubers can be obtained, leading to increased yields and improved tuber quality [24].
Practical Implications: This study highlights the importance of genetic resistance and the use of healthy seed material in counteracting the negative effects of biotic factors on yield and tuber quality. Sawicka [52] emphasizes that varieties with increased genetic resistance are crucial for mitigating these challenges.
In conclusion, genetic factors have a substantial impact on seed potato quality. Advances in genetic research and the breeding of new varieties contribute to the improvement of quality parameters, which is critical for efficient potato production. The varieties examined in this study significantly influenced all key characteristics of seed potato yield, including the proportion of seed tuber mass, their number, mass, and multiplication coefficient. Sawicka and Pszczółkowski [53] demonstrated that genetic properties of varieties strongly affect yield and the number of seed tubers, while having less influence on their average mass and multiplication coefficient.
This study confirms that integrating varietal selection with innovative technologies such as “Supporter” offers significant opportunities for enhancing the quality and productivity of seed potato cultivation.
4.4. The Role of Agrotechnics in Maximizing the Reproduction Coefficient
The success of seed potato production and the introduction of new varieties largely depends on effective agrotechnics. As noted by Roztropowicz et al. [19], maximizing the reproduction coefficient requires a strategic approach that considers tuber size, stem density, planting spacing, tuber initiation, and soil moisture conditions. Agrotechnical measures are essential for optimizing tuber growth and achieving high-quality seed material [52].
The reproduction coefficient in the conducted studies was 5.83. A significantly higher coefficient was obtained by Sawicka and Pszczółkowski [53], but in years with a significant rainfall deficit. The value of this coefficient was also directly related to the average seed potato weight. In our own studies, it was 69.6 g. The value of this feature is influenced by genetic, agrotechnical and environmental factors. Potato varieties have a genetically diversified ability to accumulate mass. Varieties with a higher yield potential often produce heavier tubers. Varieties may have different preferences as to the optimal seed potato weight, which affects their growth potential and plant development. The cultivation technology had a significant impact on the value of this feature. Supporting technologies, such as biostimulants or specialist fertilizers, can increase the growth rate and seed potato weight due to better assimilation of nutrients. Deficiency of mineral components (e.g. nitrogen, phosphorus, potassium) can limit tuber growth, reducing their mass. Regular and appropriately selected irrigation also affects the development of seed potatoes and their final mass [52]. The influence of the environment, and therefore the location and climatic conditions as well as soil quality affect this quality feature of seed potatoes. Usually, fertile soils rich in organic matter and microelements promote the growth of tuber mass, soils poor in organic matter and with a weak sorption complex limit their mass [46,53]. Climatic conditions, including precipitation, both its excess and deficiency during the growing season, can negatively affect the mass of seed potatoes. Optimal air and soil temperature also promotes proper tuber growth. Too high or too low temperatures can limit mass accumulation. The location of the study, and especially the influence of regional differences in environmental conditions (e.g. soil, microclimate) turned out to be crucial, as shown by the results of our own research, that the location in Barankowo had the greatest influence on the mass of the average seed potato. Variability between years influenced the development of tubers. In years with more rainfall and stable temperatures, a greater mass of seed potatoes can be expected in the total yield. In turn, environmental stresses (e.g. drought, frost, excessive rainfall) reduce their final mass. In addition, disease infections, including viral, bacterial or fungal diseases, can limit the development of tubers, reducing their mass. Pests (e.g. Colorado potato beetle, cutworms) can also weaken the plant, reducing the number of resources available for seed potato development. The size and mass of the seed potato also affect the yield. Seed potatoes with a larger mass usually have more energy reserves, which translates into: faster germination, stronger development of stems and roots, and higher tuber yield. However, too much seed potato mass can lead to uneven growth, and smaller seed potatoes may have difficulty developing in unfavorable conditions. These factors translate into the practical application of seed potato mass and the selection of seed potato mass for planting. Farmers often select medium-weight seed potatoes (e.g. 40-80 g), because they are the most efficient in terms of yield [46,54]. The use of the Supporter technology contributed to an increase in seed potato mass, which indicates its usefulness in agricultural practice. The mass of the medium-sized seed potato is therefore the result of the interaction of various factors, such as: variety, location, environmental conditions, technology used and agrotechnical practices. Increasing the seed potato mass can have a positive effect on yield, but it is necessary to take into account local conditions and specific variety requirements.
In the conducted experiment, the reproduction coefficient was significantly influenced by the cultivation technology. Plots treated with the Supporter biostimulant exhibited higher reproduction coefficients compared to traditional methods, consistent with findings by Pytlarz-Kozicka and Słabiński [44]. For instance, dressing seed potatoes with Prestige 290 FS and Nuprid 600 FS in their study increased the reproduction coefficient from 0.9 to 1.6 relative to the untreated control.
The results also revealed that the reproduction coefficient varied depending on the potato variety, which corroborates earlier research conducted at Jadwisin by Roztropowicz and Goc [54]. Importantly, planting time emerged as a critical factor, with no significant changes in the reproduction coefficient for planting dates up to May 17. However, a significant decrease was noted for late planting (e.g., May 30), emphasizing the importance of timely field operations. The influence of the tested varieties on the reproduction coefficient is also confirmed by research conducted by foreign scientists [45,50]. The value of the reproduction coefficient, in addition to the cultivated variety, is also determined by the size of the seed potatoes, as well as the planting density. In the studies of Gójski [54], the reproduction coefficient in all the studied varieties and for each size of seed potatoes increased with the increase in the seed potato density. According to the author, in order to obtain an approximate reproduction coefficient for each size of seed potatoes, large tubers should be planted every 40 cm, medium-sized - every 30 cm, and small - every 20 cm in the row.
The value of the multiplication factor also depends on the location of the crop. According to Gójski and Manikowski [55] on lighter soils (light loamy sand) the highest multiplication coefficient was obtained with later potato harvest dates - usually 130 days after planting or after reaching full maturity, while on stronger soils (heavy loamy sand) the highest multiplication rate was obtained with earlier harvest dates - usually 115-130 days after planting.
4.5. Seed Potato Yield Variability
The average seed potato yield of 34.43 t ha⁻¹ indicates a typical production level in the study sample, which is consistent with the results of other studies on intensive potato cultivation. Yield variability, defined by the coefficient of variation at the level of V = 27.41%, suggests moderate variability of environmental, agrotechnical or genetic conditions. According to the latest studies [56,59], significant factors influencing yield variability are water and thermal conditions during vegetation, as well as fertilization efficiency and seed potato quality. The obtained results suggest that further studies should take into account factors such as: soil water content, phosphorus and nitrogen fertilization, and seed potato health. The role of seed potato quality: The negative correlation (r =-0.21) between the share of seed potato mass in yield and the yield itself suggests that a larger share of seed potatoes may lead to a decrease in yield. This result is consistent with previous studies [51,52], which indicate negative effects of excessive seed potato mass on propagation efficiency. Further research should focus on the optimal size of seed potatoes and their quality to minimize production losses. Average seed potato mass (x4) as a key yield factor: The positive correlation (r=0.17) between individual seed potato weight and yield emphasizes the importance of seed potato mass in yield. This result is consistent with the literature, which has shown that larger seed potatoes often contain more energy reserves and can develop a developed root system faster [60]. At the same time, the efficiency of larger seed potatoes may be limited under conditions of water deficit or high planting density [47]. Further research could therefore take into account the interaction between seed potato size and environmental conditions, especially drought stress. Correlations between the number of seed potatoes and yield (x2, x3): The lack of significant correlations between the number of seed potatoes (both from 10 plants and per hectare) and yield (r = -0.01) may be due to the large influence of other environmental and genetic factors. The conducted studies indicate that the number of seed potatoes per unit area is more related to vegetative reproduction than to the quality of the crop [58]. It is recommended to analyze the effect of planting density and fertilization strategy in order to improve production efficiency. Multiplication coefficient (x5): A strong positive correlation (r = 0.78) between the number of seed potatoes per 1 ha and the multiplication coefficient indicates that the number of tubers obtained is a key indicator of multiplication efficiency. However, the weak correlation between the multiplication coefficient and potato yield (r = 0.05) suggests that the coefficient alone is not a sufficient indicator of production success. Recent studies [59] emphasize the need to consider the quality of the tubers obtained, not just their quantity. Statistical distribution of variables and data stability: The low variability of variables such as the share of seed potato mass (9.45%) or the average seed potato mass (15.86%) indicates high stability of these parameters in the studied sample. Negative kurtosis and skewness values close to zero suggest flat and symmetric distributions, which is beneficial from the point of view of the reliability of the results. These studies are consistent with the results of other analyses of a similar nature [60]. Therefore, experiments should be conducted that take into account different environmental variants, such as water stress, fertilization or disease pressure, to better determine the effect of environmental variables on seed potato yield and reproduction. It is also recommended to analyze the interactions between potato genotypes and the variables studied to identify the varieties best adapted to local conditions. It is also worth considering the study of additional variables, such as tuber dry matter content, seed potato germination capacity and soil nutrient levels, which may better explain yield variability.
4.6. Summaries
Studies confirm the important role of growth biostimulants, such as Supporter, in increasing seed potato yield and improving the reproductive rate of potatoes. Their use in combination with appropriate agricultural practices and taking into account the soil type allows for more effective coping with the challenges in potato production. Growth biostimulants not only improve seed potato quality, but also fit into the concept of precision agriculture and sustainable soil health management, which is in line with the latest trends in agricultural science and practice [14,17,39]. Statistical analysis showed that seed potato yield (y) was relatively stable in the study sample, and the variability was mainly due to differences in the number of seed potatoes (x2, x3). In turn, the share of seed potato mass in the total yield (x1) and the reproduction coefficient (x5) were characterized by the lowest variability, which may indicate their lower susceptibility to environmental changes or the stability of the genetic traits of the studied varieties.
The negative kurtosis and low skewness values of the data suggest their approximation to the normal distribution, which allows the use of classical statistical methods for further analysis. The high correlation coefficient between the number of seed potatoes per hectare (x3) and the reproduction coefficient (x5) indicates the possibility of optimizing the cultivation technology in order to increase the number of seed potatoes, while maintaining their quality.
These results are consistent with the literature, which emphasizes the role of modern agronomic strategies, such as biostimulants, in improving the yield and quality of potatoes, while minimizing the negative impact on the environment [51,56,60,61]. Further research should focus on understanding the synergies between genetic, environmental and cultivation technology factors to develop a more comprehensive approach to managing potato production in the context of climate change and increasing quality requirements.
5. Conclusions
The use of the Supporter growth biostimulator in the experiment significantly increased the yield of seed potatoes compared to traditional cultivation methods. The stimulating effect of the biostimulator was influenced by the variety of potatoes grown, the specific location of the experiment, and prevailing environmental conditions. Its application not only improved the yield but also resulted in a higher multiplication coefficient, demonstrating its superiority over traditional methods.
The results highlight the critical role of cultivation technology, variety selection, and environmental conditions in optimizing seed potato weight. Supporter technology provided a measurable advantage, especially for high-performing varieties like Lilly and Lady Claire.
The conducted studies confirm the global findings regarding the positive impact of biostimulants on seed potato yield and multiplication efficiency. This underscores the importance of integrating biostimulants like Supporter into seed potato cultivation to enhance productivity. Moreover, the improved multiplication rate achieved through this technology aligns with the broader objective of increasing the availability of high-quality seed materials for agricultural use.
The results also highlighted the significant influence of potato varieties and cultivation location on yield and quality. Different varieties responded differently to the Supporter biostimulator, indicating the importance of selecting varieties that are well-suited to the specific growing conditions. Additionally, the yield and multiplication coefficient varied significantly across the experimental locations, emphasizing the role of environmental factors such as soil type, climate, and microclimatic conditions. These findings highlight the necessity of matching varieties to specific locations to maximize the effectiveness of biostimulant application.
To further optimize the multiplication rate and quality of seed potatoes, it is necessary to complement the use of biostimulants with other measures:
- -
- Varietal Selection and Zoning: Adhering to the principle of zoning potato varieties based on their disease resistance and adaptability to specific climatic and soil conditions is essential, particularly in high-risk areas.
- -
- Agrotechnological Innovations: Continuous improvement in cultivation techniques, including optimal planting density, nutrient management, and irrigation practices, is crucial for maximizing the benefits of biostimulant application.
- -
- Adaptation to Challenging Conditions: The Supporter technology demonstrated substantial benefits in improving both seed tuber mass and the multiplication coefficient, particularly in locations with less favorable growing conditions. Its use should be strongly promoted in such regions to ensure sustainable yields.
In conclusion, the application of biostimulants like Supporter represents a modern and effective approach to seed potato production. By integrating this technology with tailored agrotechnical practices, careful varietal selection, and location-specific management strategies, growers can achieve higher yields, improved quality, and enhanced disease resistance, contributing to the long-term sustainability of potato cultivation. Further research and widespread promotion of such innovative solutions are recommended to fully exploit their potential in diverse agricultural systems.
Author Contributions
For research articles with several authors, a short paragraph specifying their individual contributions must be provided. The following statements should be used “Conceptualization, P.B., B.S. and P.P.; methodology, P.B, B.S., B.K-M.; software, T.S.H.; validation, B.K-M, T.S.H., and P.P.; formal analysis, T.S.H.; investigation, P.B., B.S.; resources, P.P., B.K-M.; T.S.H., P.B., data curation, T.S.H.; writing—original draft preparation: P.B., P.P., B.K-M., T.S.H.; writing—review and editing, B.S., B.K-M., P.P.; visualization, T.S.H., B.K-M.; supervision, B.S., B.K-M.; project administration, P.B.; funding acquisition, P.B. All authors have read and agreed to the published version of the manuscript.
Funding
This research received no external funding.
Data Availability Statement
Data are available from the corresponding author.
Acknowledgments
We would like to thank the Management of the Institute of Plant Breeding Acclimatization - National Research Institute in Radzików for administrative and technical support.
Conflicts of Interest
The authors declare no conflicts of interest.
References
- FAO (2023). Statistical Yearbook. World Food And Agriculture 2023. Food and Agriculture Organization of the United Nations Rome: Rome, Italy, 2023; ISBN 978-92-5-138262-2.
- Mohapatra, P.P. , Batra, V.K. Tissue culture of potato (Solanum tuberosum L.): A review. Int. J. of Cur. Mic. App. Sci. 2017, 6, 489–495. [Google Scholar] [CrossRef]
- Young, N. Seed Potato Systems in Developed Countries: Canada, The Netherlands and Great Britain. International Potato Centre, Lima, Peru, 1990; 128p. [Google Scholar]
- Ritter, E. , Angulo, B., Riga, P., Herran, C., Relloso, J., San Jose, M. Comparison of hydroponic and aeroponic cultivation systems for the production of potato minitubers. Potato Research 2001, 44, 127–135. [Google Scholar] [CrossRef]
- Sabir, M. S. , Shahzadi, F., Ali, F., Shakeela, Q., Niaz, Z., & Ahmed, S. Comparative effect of fertilization practices on soil microbial diversity and activity: an overview. Current Microbiology 2021, 78, 3644–3655. [Google Scholar] [PubMed]
- Ge, G. , Li, Z., Fan, F., Chu, G., Hou, Z., & Liang, Y. Soil biological activity and their seasonal variations in response to long-term application of organic and inorganic fertilizers. Plant and Soil 2010, 326, 31–44. [Google Scholar] [CrossRef]
- Siddique, M. , Sultana, J., & Abdullah, M. Aggregate stability: an indicator of quality and resistivity of arable Soil. Asian Journal of Soil Science and Plant Nutrition 2017, 1, 1–7. [Google Scholar] [CrossRef]
- Bassouny M, Chen J. Effect of long-term organic and mineral fertilizer on physical properties in root zone of a clayey Ultisol. Arch Agron Soil Sci. 2016, 62, 819–28. [Google Scholar] [CrossRef]
- Sharma, A. , Chetani, R. A. Review of the Effect of Organic and Chemical Fertilizers on Plants. Int J Res Appli Sci Engineer Techn. 2017, 5, 677. [Google Scholar] [CrossRef]
- E.U. Regulation of the European Parliament and of the Council Laying Down Rules on the Making Available on the Market of EU Fertilizing Products and Amending Regulations (EC) No 1069/2009 and (EC) No 1107/2009 and Repealing Regulation (EC) No 2003/2003. 2019. Available online: https://eur-lex.europa.eu/legal-content/EN/TXT/?uri=OJ:L:2019:170:TOC (accessed on 10 September 2024).
- Bulgari, R. , Cocetta, G., Trivellini, A., Vernieri, P., Ferrante, A. Biostimulants and crop responses: A review. Biol. Agric. Hortic., 2014, 31, 1–17. [Google Scholar] [CrossRef]
- Zulfiqar, F. , Moosa, A., Ali, H. M., Bermejo, N. F., & Munné-Bosch, S. Biostimulants: A sufficiently effective tool for sustainable agriculture in the era of climate change? Plant Physiology and Biochemistry 2024, 211, 108699. [Google Scholar] [CrossRef]
- Li, X. , Zhou, L., & Liu, W. The effects of biostimulants on potato yield and soil properties under varying climatic conditions. Journal of Soil Science and Plant Nutrition 2023, 23, 450–462. [Google Scholar]
- Li, L. , Tong, L., & Lv, Y. Influence of bio-fertilizer type and amount jointly on microbial community composition, crop production and soil health. Agronomy 2023, 13, 1775. [Google Scholar] [CrossRef]
- Pacci, S. , Dengiz, O., & Agbor, D. T. Impact of biostimulants on soil quality. International Symposium on,,Soil Science and Plant Nutrition’’ 2023. 8-9 December Samsun – Turkey.
- Wadduwage, J. , Liu, H., Egidi, E., Singh, B. K., Macdonald, C. A. Effects of biostimulant application on soil biological and physicochemical properties: a field study. J. Sustain Agric Environ. 2023, 2, 285–300. [Google Scholar] [CrossRef]
- Wadduwage, S. , Karunaratne, A., & Wickramasinghe, W. Biostimulants for soil fertility enhancement: A meta-analysis. Frontiers in Sustainable Agriculture 2023, 5, 102–118. [Google Scholar]
- Noaema, A.H.; Sawicka, B.; Barbaś, P.; Krochmal-Marczak, B. The Effect of Supporter1 on the Reduction of Rhizoctonia Solani on Potato Tubers; 56th Scientific Session of the Institute of Plant Protection; National Research Institute: Poznań, Poland, 2016; p. 103, Abstracts, 11-12.02. [Google Scholar]
- Roztropowicz, S. Methodology of Observation, Measurements and Sampling in Agricultural Experiments with Potatoes; Plant Breeding and Acclimatization Institute: Section: Jadwisin, Poland, 1999; pp. 1–50. (In Polish) [Google Scholar]
- Lenartowicz, T.; Erlichowski, T. New potato varieties 2017. Pol. Potato 2017, 2, 4–8. Available online: https://ziemniak-bonin.pl/polish-potato-02-2017/?lang=en (accessed on 16 October 2024). (In Polish).
- Nowacki, W. , Barbaś P., Boguszewska-Mańkowska D., Jankowska J., Pietraszko M., Trawczyński C., Zarzyńska K., Michalak K., Urbanowicz J. Characteristics of the national register of potato cultivars. http://pw.ihar.edu.pl/wp-content/uploads/2020/10/Charakterystyka-2020.pdf. (In Polish)
- Ustawa z dnia 10 lipca 2007, r.; o nawozach i nawożeniu. Dz.U. 2007 nr 147 poz. 1033. Available online: https://isap.sejm.gov.pl/isap.nsf/DocDetails.xsp?id=wdu20071471033 (accessed on 16 October 2024). (In Polish).
- Supporter®. Agricultural Crop Yield Modulator. Instruction for Use: Supporter (PL). Available online: https://certisbelchim.pl/pdf/Label/Supporter_LABEL.pdf (accessed on 16 October 2024).
- PN-R-04031:1997. Analiza chemiczno-rolnicza gleby. Pobieranie próbek. Wydawca: Polski Komitet Normalizacyjny, Warszawa. (in Polish).
- Mocek, A. Soil science, 1st ed.; PWN Scientific Publishing House: Warsaw, Poland, 589 pp, 2015, 978-83-01-18795-8. (In Polish).
- Lützenkirchen, J. , Preočanin, T., Kovačević, D., Tomišič, V., Lövgren, L., Kallay, N. 2012. Potentiometric titrations as a tool for surface charge determination. Croat. Chem. Acta 2012, 85, 391–417. [Google Scholar] [CrossRef]
- PN-R-04020:1994+AZ1:2004; Chemical and Agricultural Analysis of Soil. Polish Committee for Standardizations: Warsaw, Poland, 2004. (In Polish)
- PN-R-04023:1996; Chemical and Agricultural Analysis of Soil. Determination of Available Phosphorus Content in Mineral Soils. Polish Committee for Standardizations: Warsaw, Poland, 1996. (In Polish)
- PN-R-04022:1996+AZ1:2002; Chemical and Agricultural Analysis of Soil. Determination of Available Potassium Content in Mineral Soils. Polish Committee for Standardization: Warsaw, Poland, 2002. (In Polish)
- Wójcikowska-Kapusta, A. , Niemczuk B. Effect of type of use on content of various magnesium and potassium forms in profiles of rendzinas. Acta Agrophysica 2006, 8, 765–771. (in Polish). [Google Scholar]
- Nawrocki, S. Fertilizer Recommendations. Part. I. Limit Numbers for Valuation of Soils in Macro- and Microelements; IUNG, Puławy, Poland, pp. 44, 1991, (In Polish).
- PN-Z-15011-3: 2001. Polish version. Compost from municipal waste. Determination: pH, organic content, organic carbon, nitrogen, phosphorus and potassium. PKN Publisher, Warsaw, 2001 (in Polish).
- Fotyma, M. , Kęsik K., Pietruch Cz. Mineral nitrogen in soils as an indicator of the fertilizer needs of plants and the condition of soil and groundwater purity. Nawozy i Nawożenie/Fertilizers and Fertilization 2010, 38, 5–80. (in Polish). [Google Scholar]
- WRB, 2014. World reference base for soil resources 2014. International soil classification system for naming soils and creating legends for soil maps. http://www.fao.org/3/i3794en/I.
- Skowera, B. , Kopcińska, J., Kopeć, B. Changes in thermal and precipitation conditions in Poland in 1971–2010. Ann. Wars. Univ. Life Sci. Land Reclam. 2014, 46, 153–162. [Google Scholar] [CrossRef]
- SAS Institute. SAS/STAT®9.2. User’s Guide; SAS Institute: Cary, NC, USA, 2008. [Google Scholar]
- Tatarczak, A. Statistics. Vol. I - Textbook Part II - Case studies. Ed. WSEI-Lublin, 277 pp., 2021, ISBN 978-83-66159-83-9. (in Polish).
- Aamir, M. , Rai, K. K., Zehra, A., Dubey, M. K., Kumar, S., Shukla, V., & Upadhyay, R. S. 2020. Microbial bioformulation-based plant biostimulants: a plausible approach toward next generation of sustainable agriculture. In Microbial endophytes (pp. 195–225). Woodhead Publishing.
- Cerdà, A. , Jangid, K., & Govers, G. Soil health and agricultural sustainability: Insights from biostimulant research. Agricultural Research & Technology 2022, 11, 123–135. [Google Scholar]
- Pytlarz-Kozicka, M. Porównanie produkcji nasiennej ziemniaka w systemie ekologicznym i konwencjonalnym. Biuletyn IHAR 2010, 255, 101–108. (in Polish). [Google Scholar] [CrossRef]
- Pytlarz-Kozicka, M. , Zagórski, P. The influence of biological potato tuber treatments on health conditions of potato plants and potato yield. Progress in Plant Protection/Postępy w Ochronie Roślin 2013, 53, 333–339. [Google Scholar]
- Samy, M. M. , Abd El Aal, A. M. H., Khalil, M. M. The impact of some treatments on improving seed potato production in the summer season. Middle East J 2014, 3, 1065–1073.ce. [Google Scholar]
- Аnikina, I. , Issayeva, K. Use of the preparation based on Solanum nigrum as a potato yield stimulator. Bulg. J. Agric. Sci. 2023, 29, 272–276. [Google Scholar]
- Pytlarz-Kozicka, M. , Słabicki, W. Wpływ zaprawiania sadzeniaków i terminu zbioru na zdrowotność roślin i plonowanie ziemniaka. Zeszyty Naukowe Uniwersytetu Przyrodniczego we Wrocławiu: Rolnictwo 2013, 596, 97–106. (In Polish) [Google Scholar]
- Wierzejska-Bujakowska, A. , Kaczorek, S. , Gójski, B., Goc, K., Manikowski, Z. Wpływ warunków glebowo-klimatycznych na wydajność sadzeniaków u 15 odmian ziemniaka. Zeszyty Problemowe Postępów Nauk Rolniczych 1988, 342, 21–30. (In Polish) [Google Scholar]
- Zarzecka, K. , Gugała, M., Sikorska, A., Grzywacz, K., & Niewęgłowski, M. Marketable yield of potato and its quantitative parameters after application of herbicides and biostimulants. Agriculture 2020, 10, 49. [Google Scholar] [CrossRef]
- Boguszewska-Mańkowska, D. , Ruszczak B., Zarzyńska K. Classification of Potato Varieties Drought Stress Tolerance Using Supervised Learning. Applied Sciences 2022, 12, 1939. [Google Scholar] [CrossRef]
- Zarzyńska, K. , Boguszewska-Mańkowska D. Commercial Quality of Potato Tubers of Different Varieties from Organic and Conventional Production System. Agronomy 2024, 14, 778. [Google Scholar] [CrossRef]
- Vos, J. , Haverkort J. Chapter 16 - Water Availability and Potato Crop Performance [In book:] Potato Biology and Biotechnology. Edited by: Dick Vreugdenhil, John Bradshaw, Heather A. Ross, 2007, 333-351. Elsevier Science, ISBN: 978-0-444-51018-1. [CrossRef]
- Ostonakulov, T. E. , Lukova, I. N. Productivity, yield of seed tubers and multiplication factor of potato varieties as secondary crop, depending on planting methods. Potato and vegetables 2022, 10, 24–27. [Google Scholar] [CrossRef]
- Struik, P. C. , & Wiersema, S. G. (2020). Seed potato technology. Wageningen Academic Publishers.
- Sawicka, B. An attempt for improvement of seed potatoes quality using minitubers in the field cultivation. Annales Universitatis Mariae Curie-Skłodowska Lublin – Polonia, LIX, 3 Sectio E 2004, 59, 1233–1244. [Google Scholar]
- Sawicka, B. , Pszczółkowski P. The effect of application of biopreparations and fungicides on the yield and selected parameters of seed value of seed potatoes. Acta Agroph. 2018, 25, 239–255. [Google Scholar] [CrossRef]
- Roztropowicz, S. , & Goc, K. Wpływ terminu sadzenia na wydajność sadzeniaków w plonie ziemniaków uprawianych w różnych warunkach glebowych i klimatycznych. Zeszyty Problemowe Postępów Nauk Rolniczych (In Polish). 1988, 63–74. (In Polish) [Google Scholar]
- Gójski, B. Wpływ wielkości bulw matecznych na udział sadzeniaków w plonie odmian wczesnych. Zesz. Probl. Post. Nauk Rol. 1988, 342, 41–47. (In Polish) [Google Scholar]
- Gójski, B. , Manikowski, Z. Wpływ terminu zbioru na współczynnik rozmnażania u 17 odmian ziemniaka. Zesz. Probl. Post. Nauk Rol. 1988, 342, 75–84. (In Polish) [Google Scholar]
- Kumar, M.K. , Tiwari, R.K., Jaiswal A.K., Kumar, A., Dutt S., Kumar R., Kumar A., Dutt S., Kumar R., Kumar D., Singh, B. Post-harvest management and value addition in potato: emerging technologies in preserving quality and sustainability in potato processing. Indian Journal of Agronomy 68 (XXII Biennial National Symposium Special issue) S241-S261 (2023), 241-261.
- Ewing, E.E. , & Struik, P.C. Physiology of tuber growth and development in potato. Journal of Agronomy and Crop Science 2022, 208, 245–258. [Google Scholar]
- Haverkort, A.J. , & Struik, P.C. Yield levels of potato crops: recent achievements and future prospects. Field Crops Research 2015, 182, 76–85. [Google Scholar] [CrossRef]
- Van Es, H.M. , & Karlen, D.L. Revisiting the relationship between soil quality and potato yields. Soil Science Society of America Journal 2019, 83, 1562–1575. [Google Scholar]
- Haverkort, A.J. On processing potato. [internal PhD, WU, Wageningen University]. Wageningen University. [CrossRef]
Figure 1.
The most important biostimulant effects on crops. Source: own.
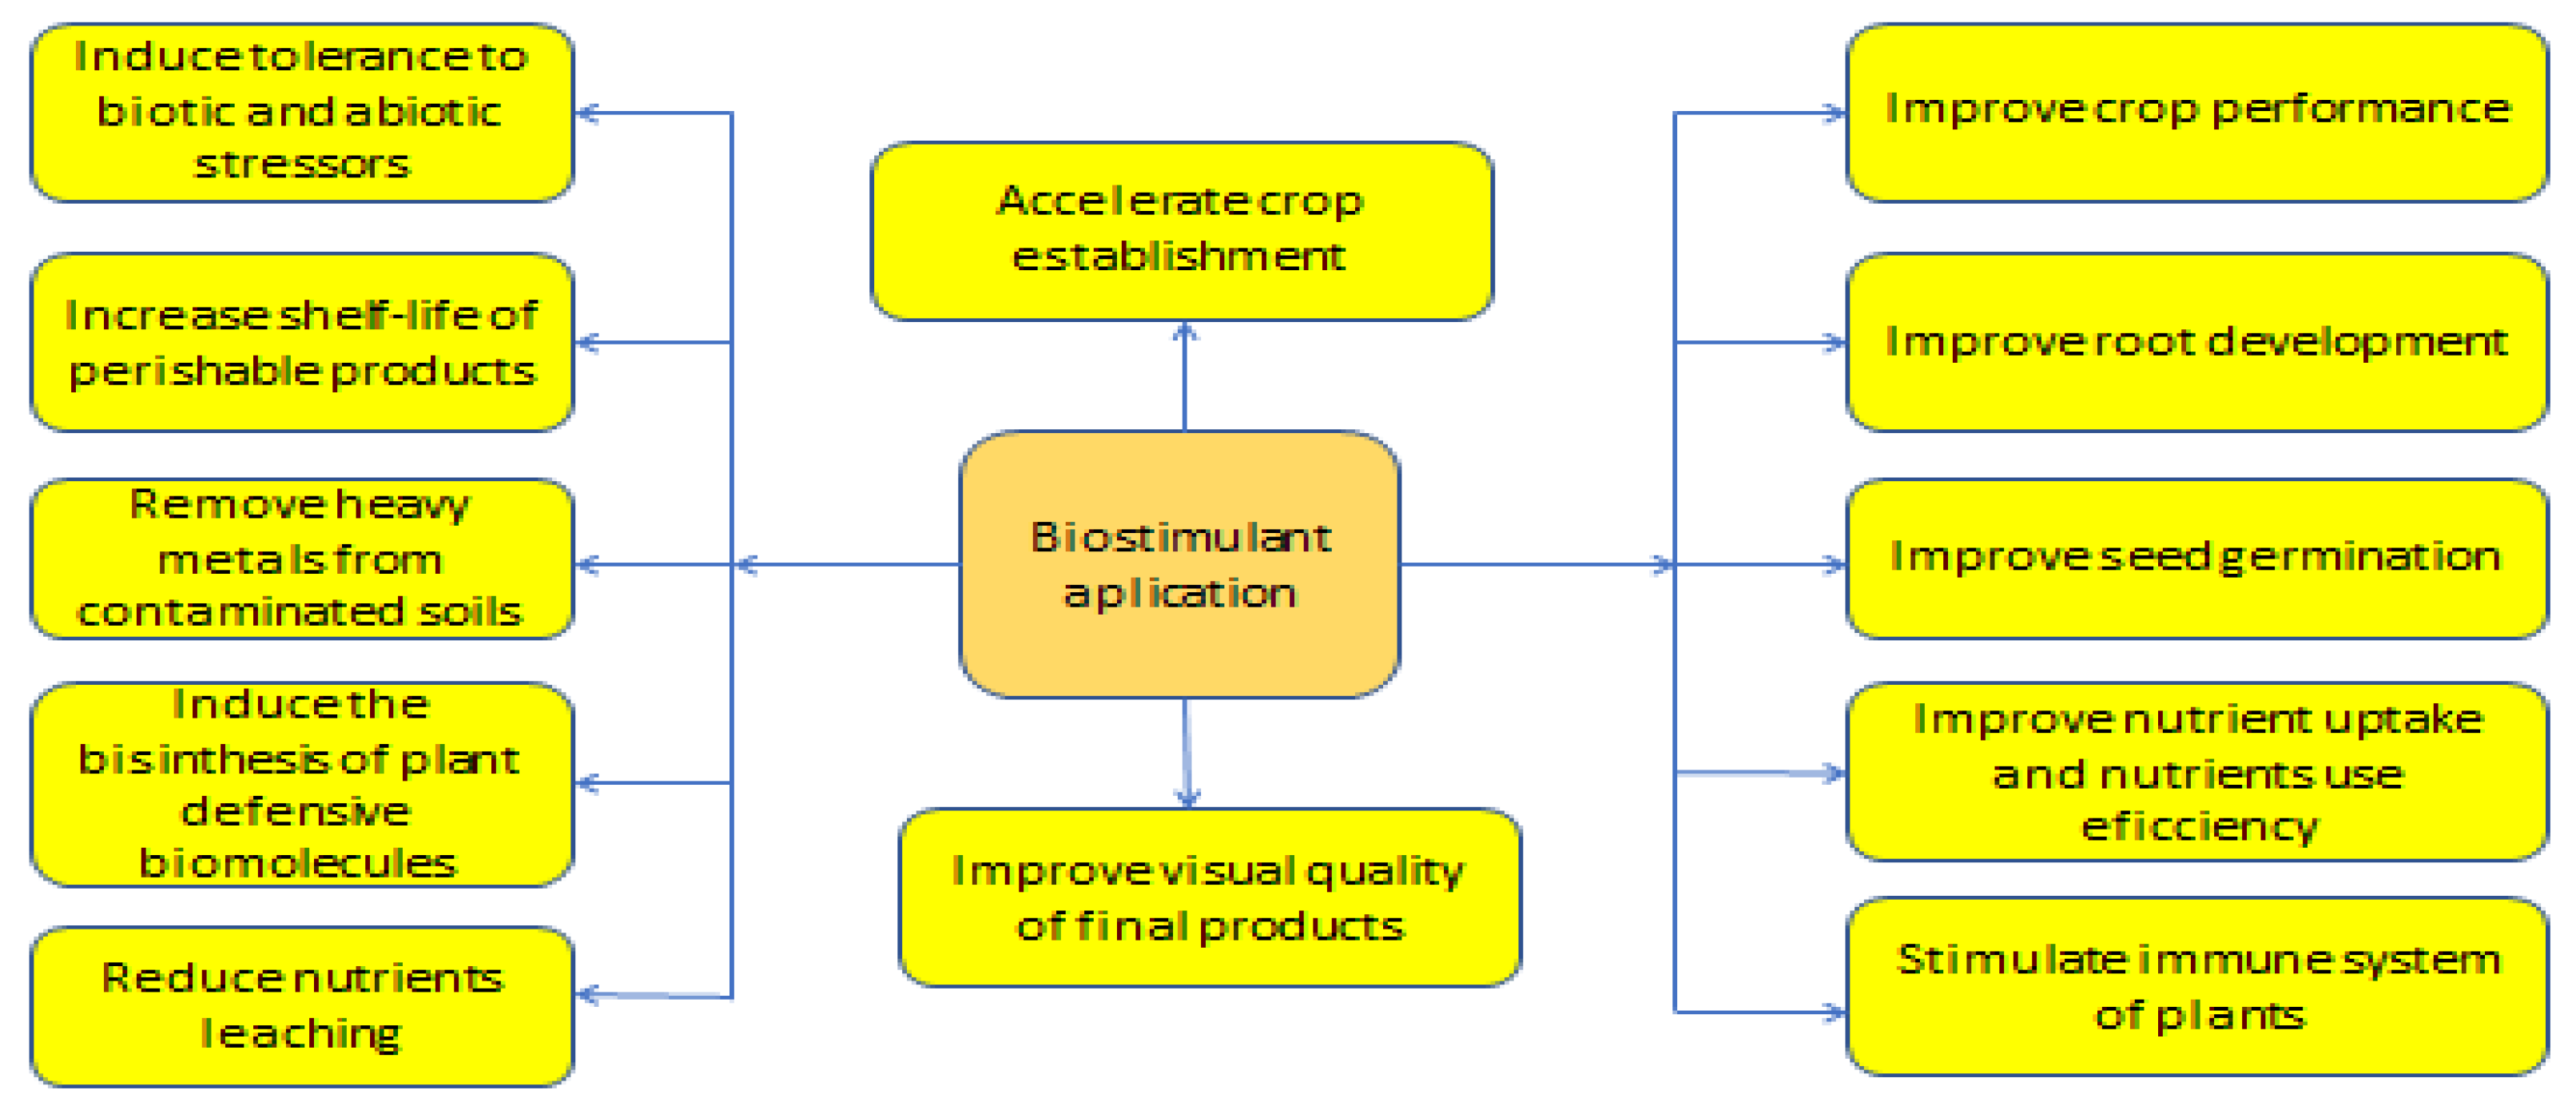
Figure 2.
Research location in Poland. Source: own.
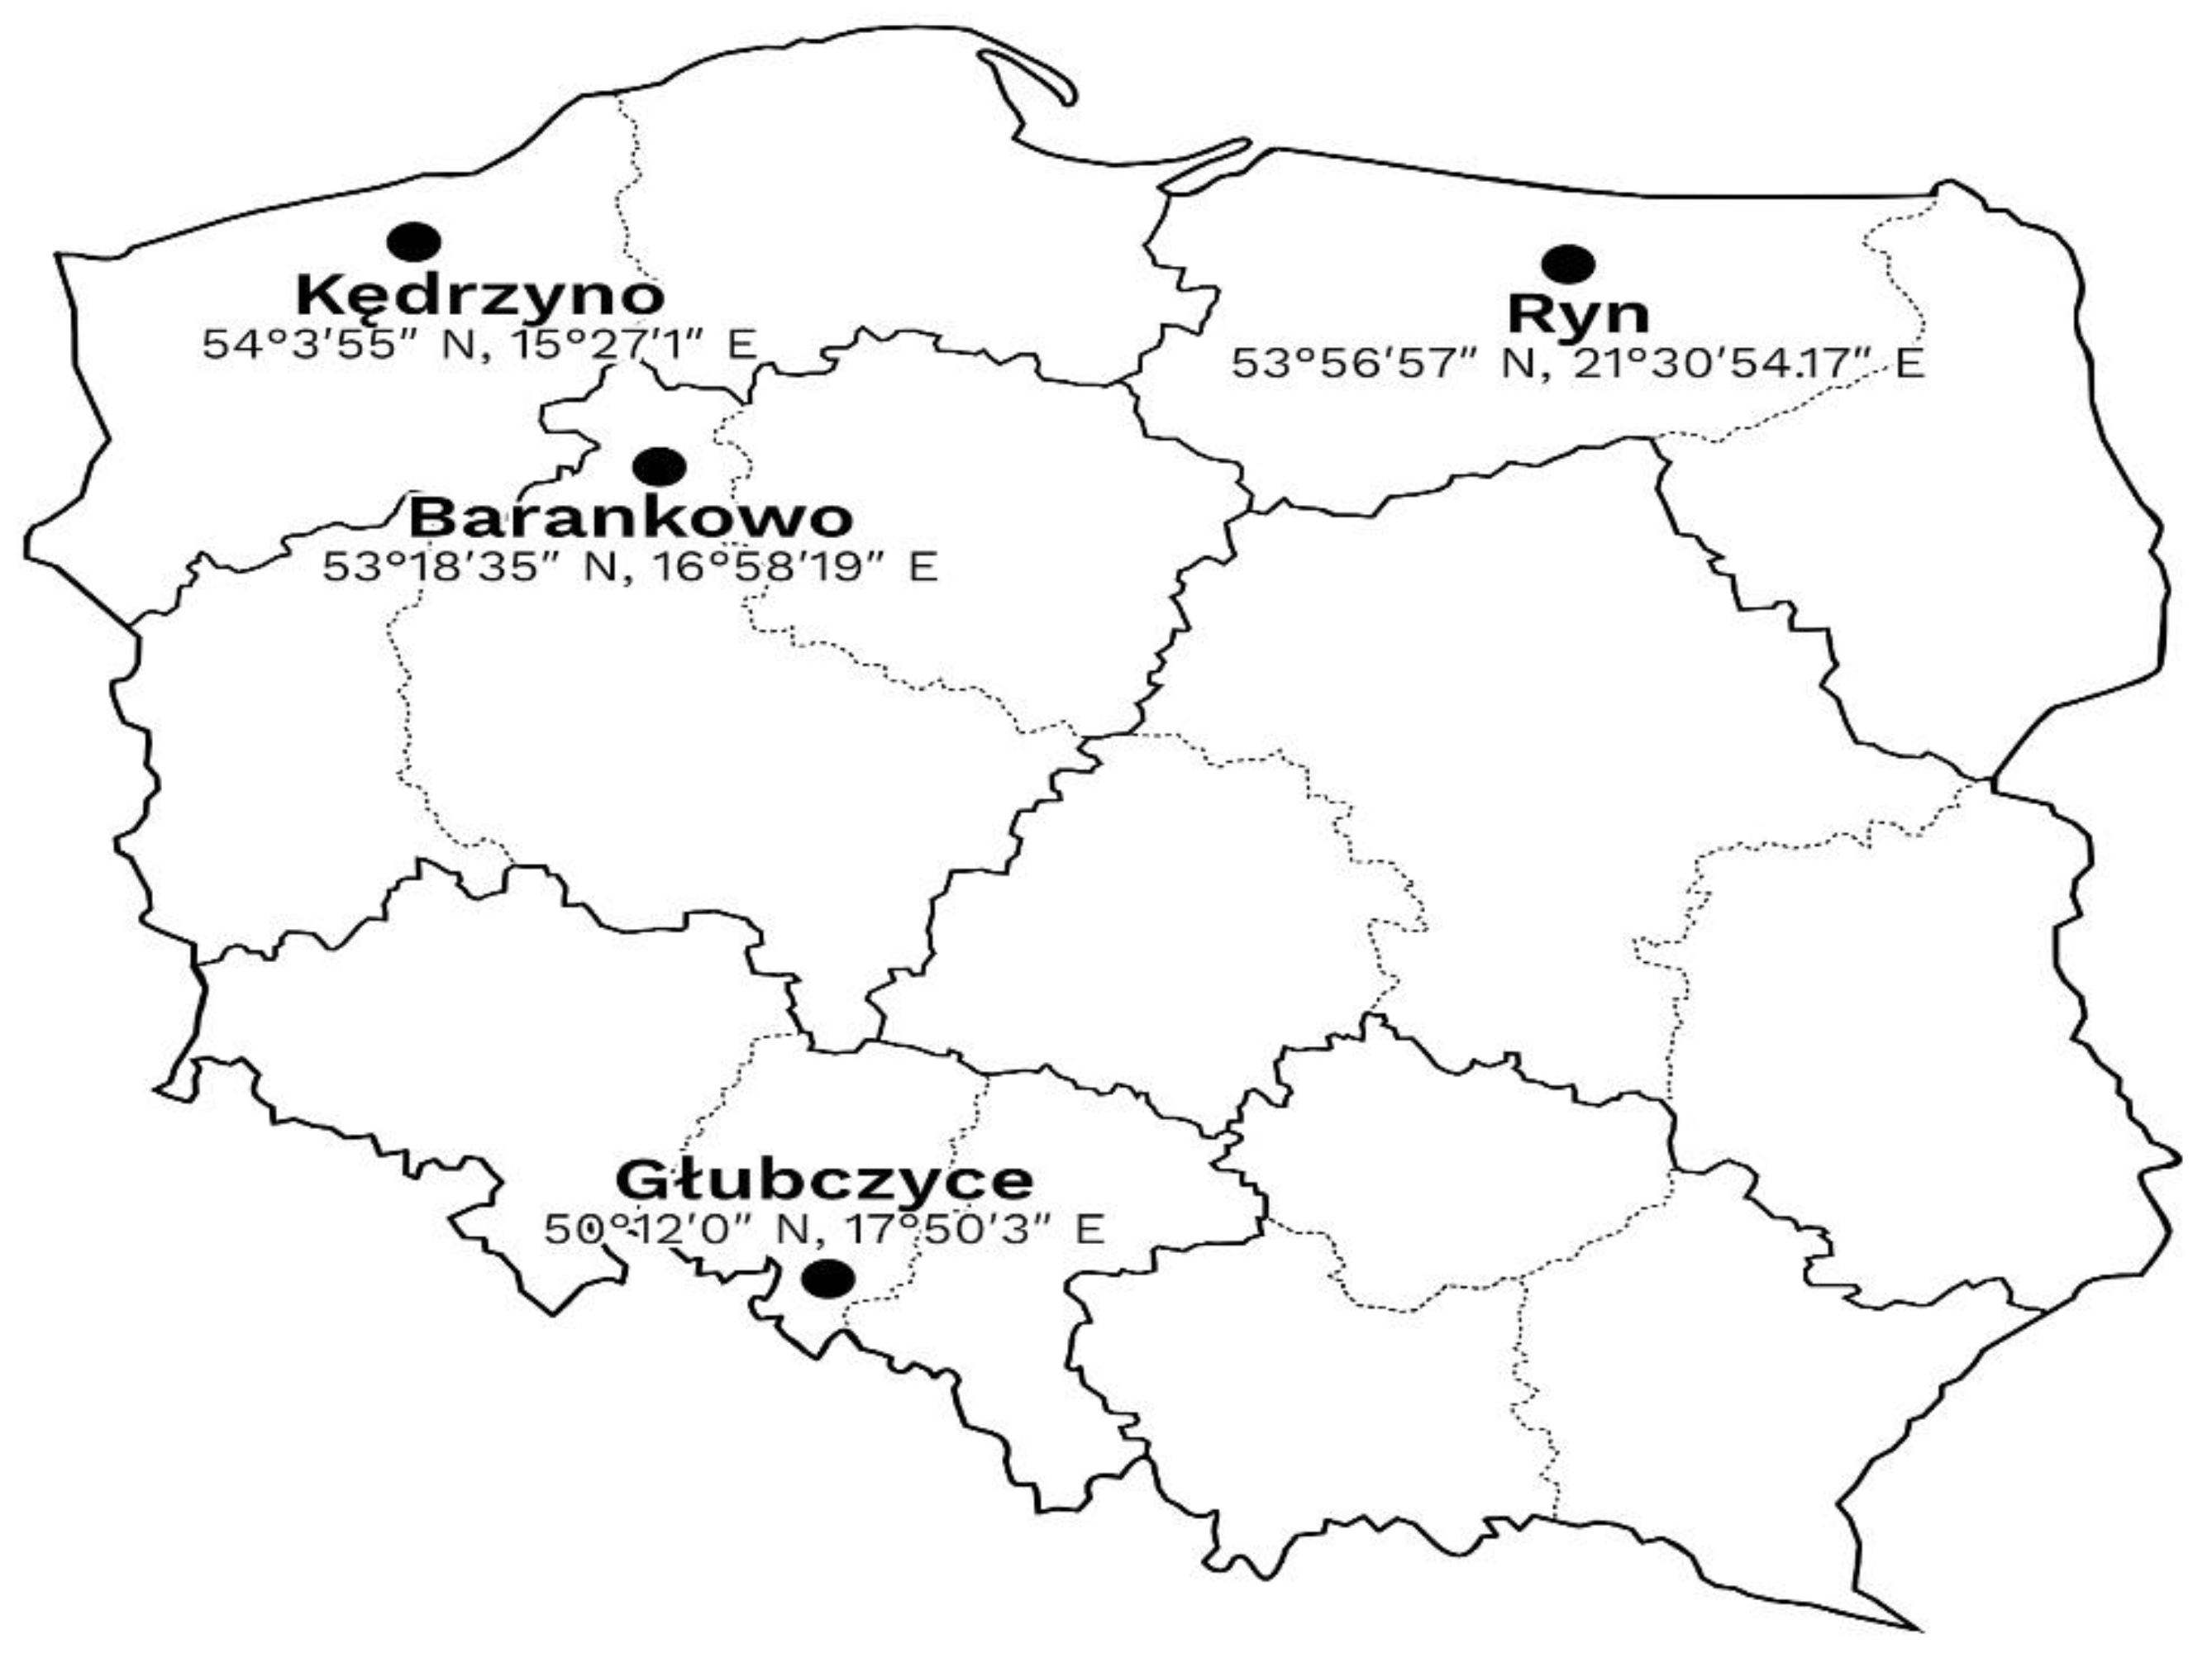
Figure 3.
Planter with mounted dressing device, source: own.
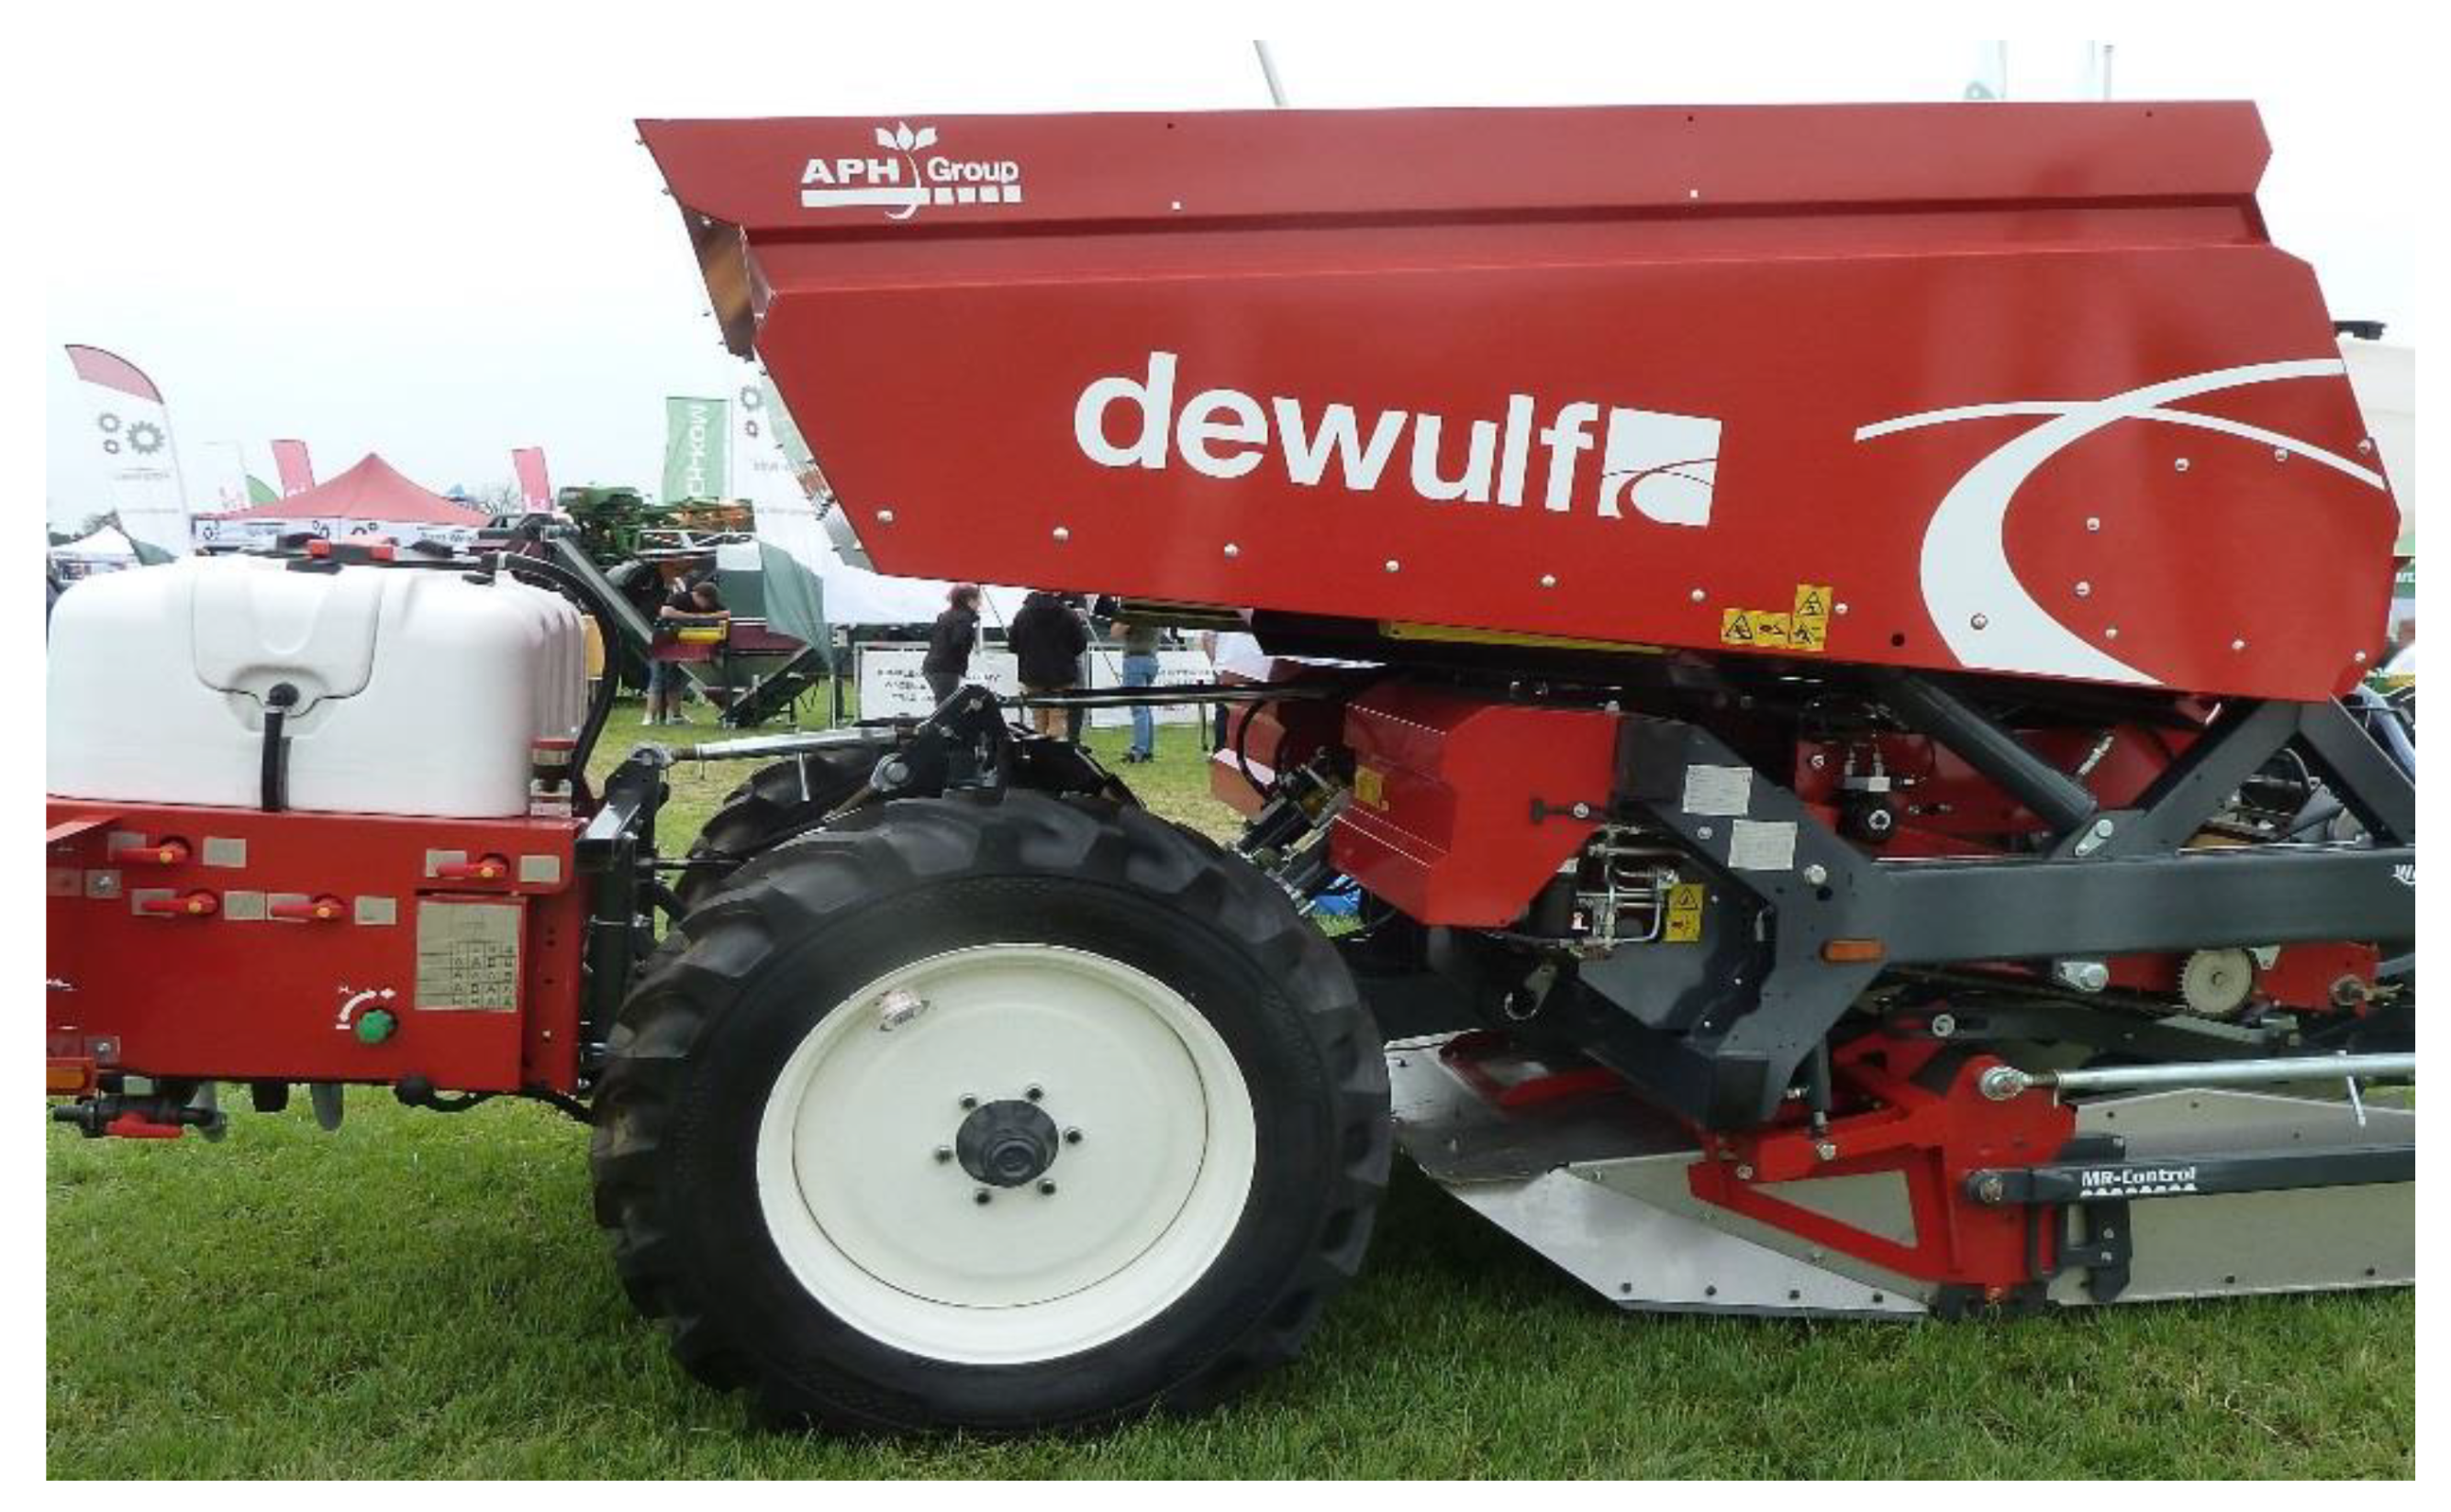
Figure 4.
Sielianinov hydrothermal coefficients. The value of the hydrothermal coefficient was calculated according to the formula: k = P/∑t x 10, where: P – monthly sum of precipitation in mm, ∑t – monthly sum of air temperatures >0°C [35]. Extremely dry month: k≤0.4, very dry – 0.4< k≤ 0.7, Dry 0.7< k ≤ 1.0, Fairly dry 1.0 < k ≤ 1.3, optimal 1.3 < k ≤ 1.6, quite humid 1.6< k ≤ 2.0, humid 2.0< k ≤ 2.5, very humid2.5 < k ≤ 3.0, extremely humid k > 3.0.
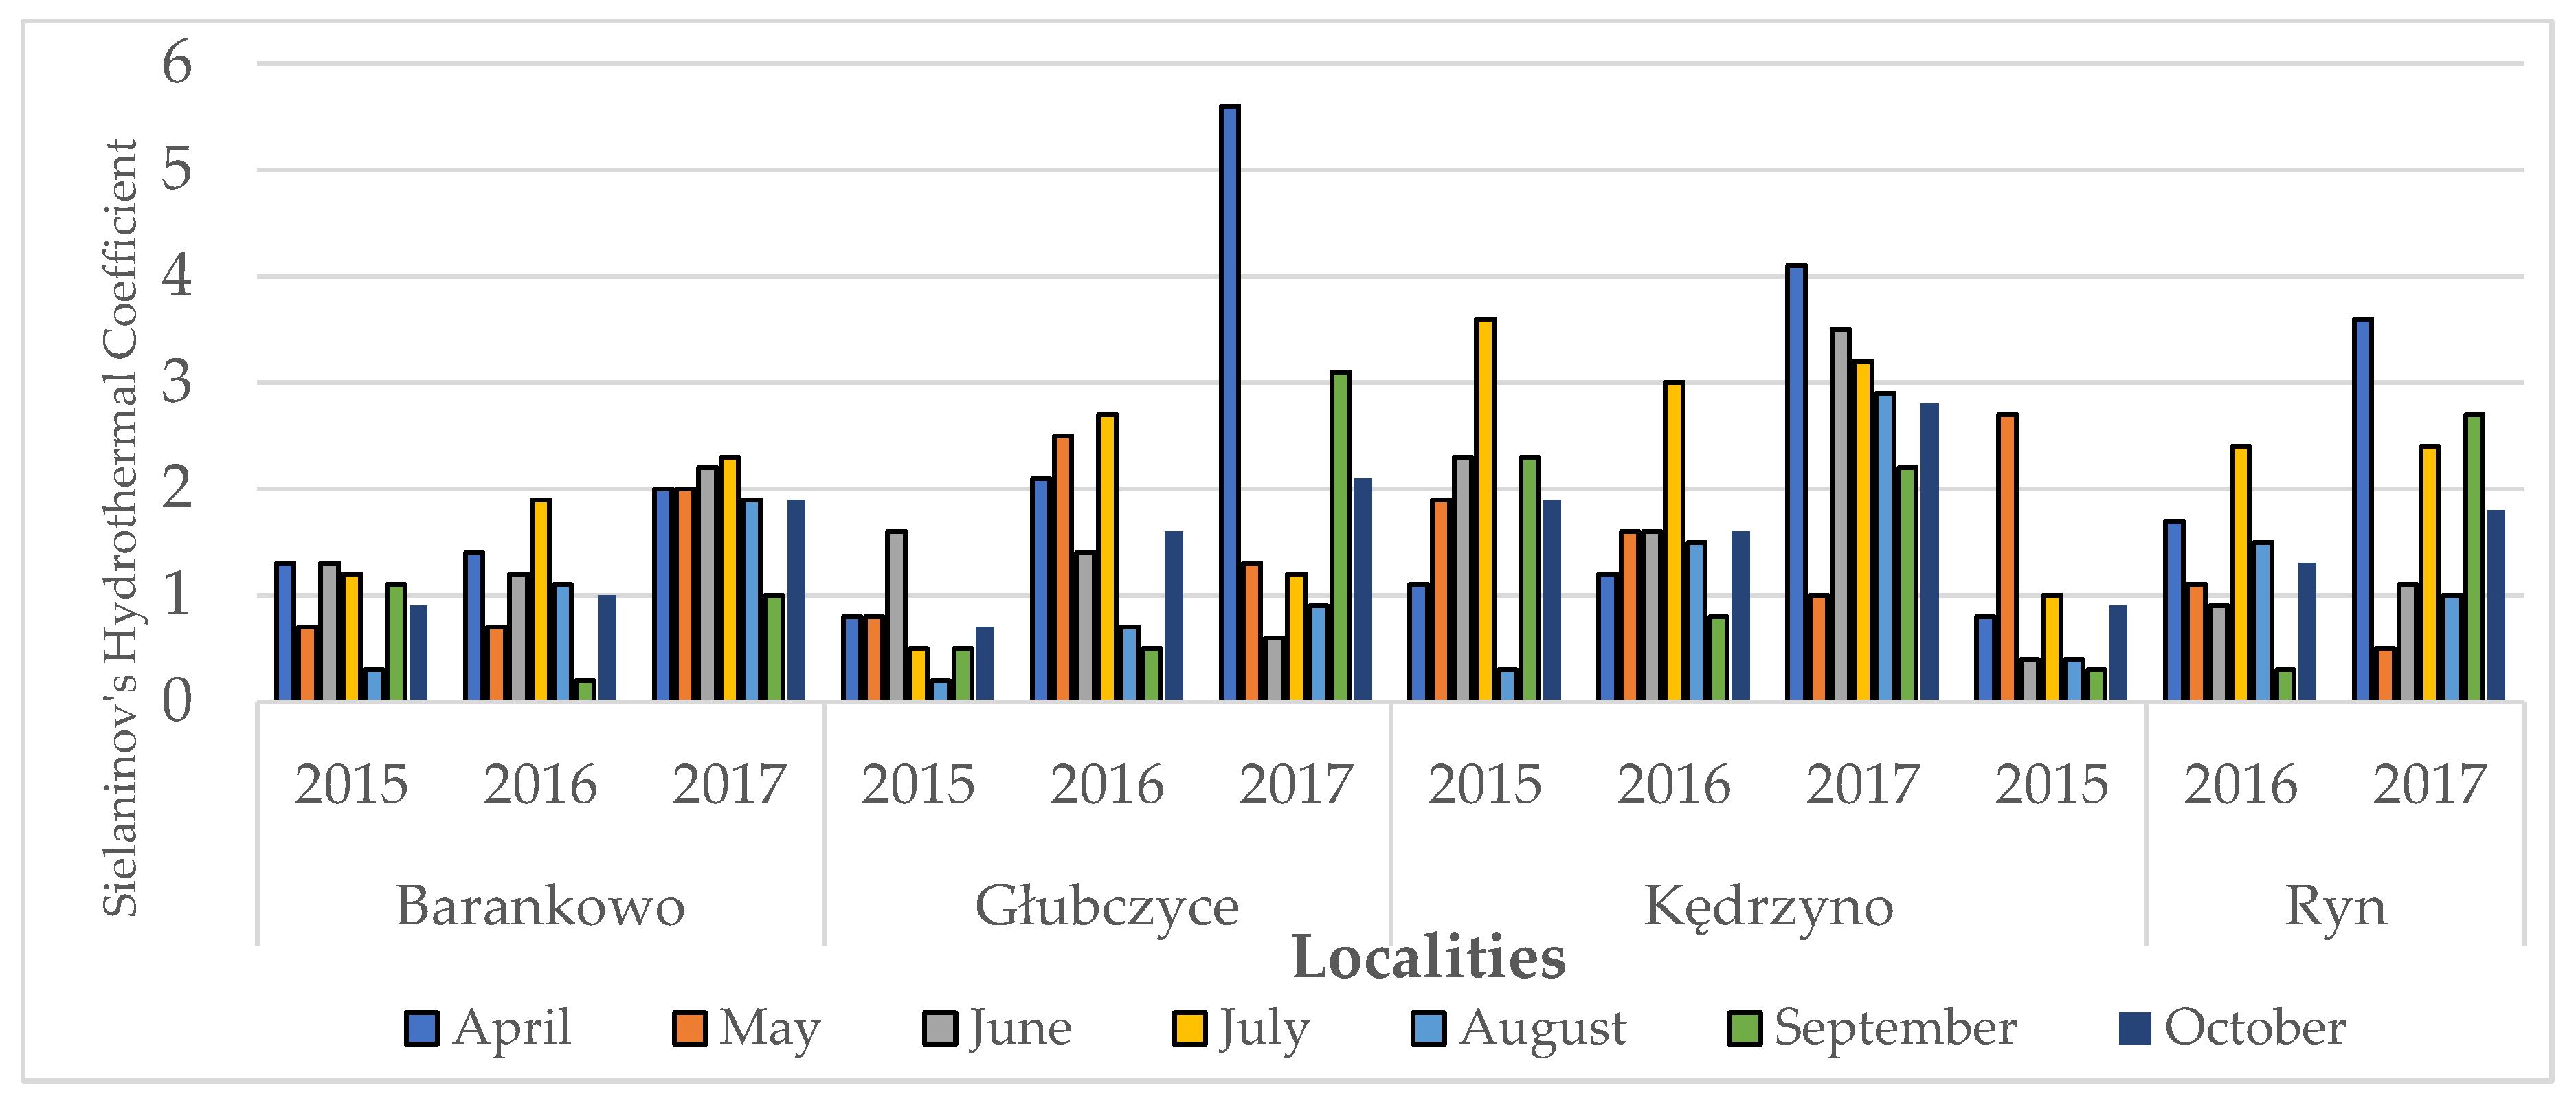
Figure 5.
The influence of the location and cultivation technology on the seed potato yield (t·ha−1).
Figure 5.
The influence of the location and cultivation technology on the seed potato yield (t·ha−1).
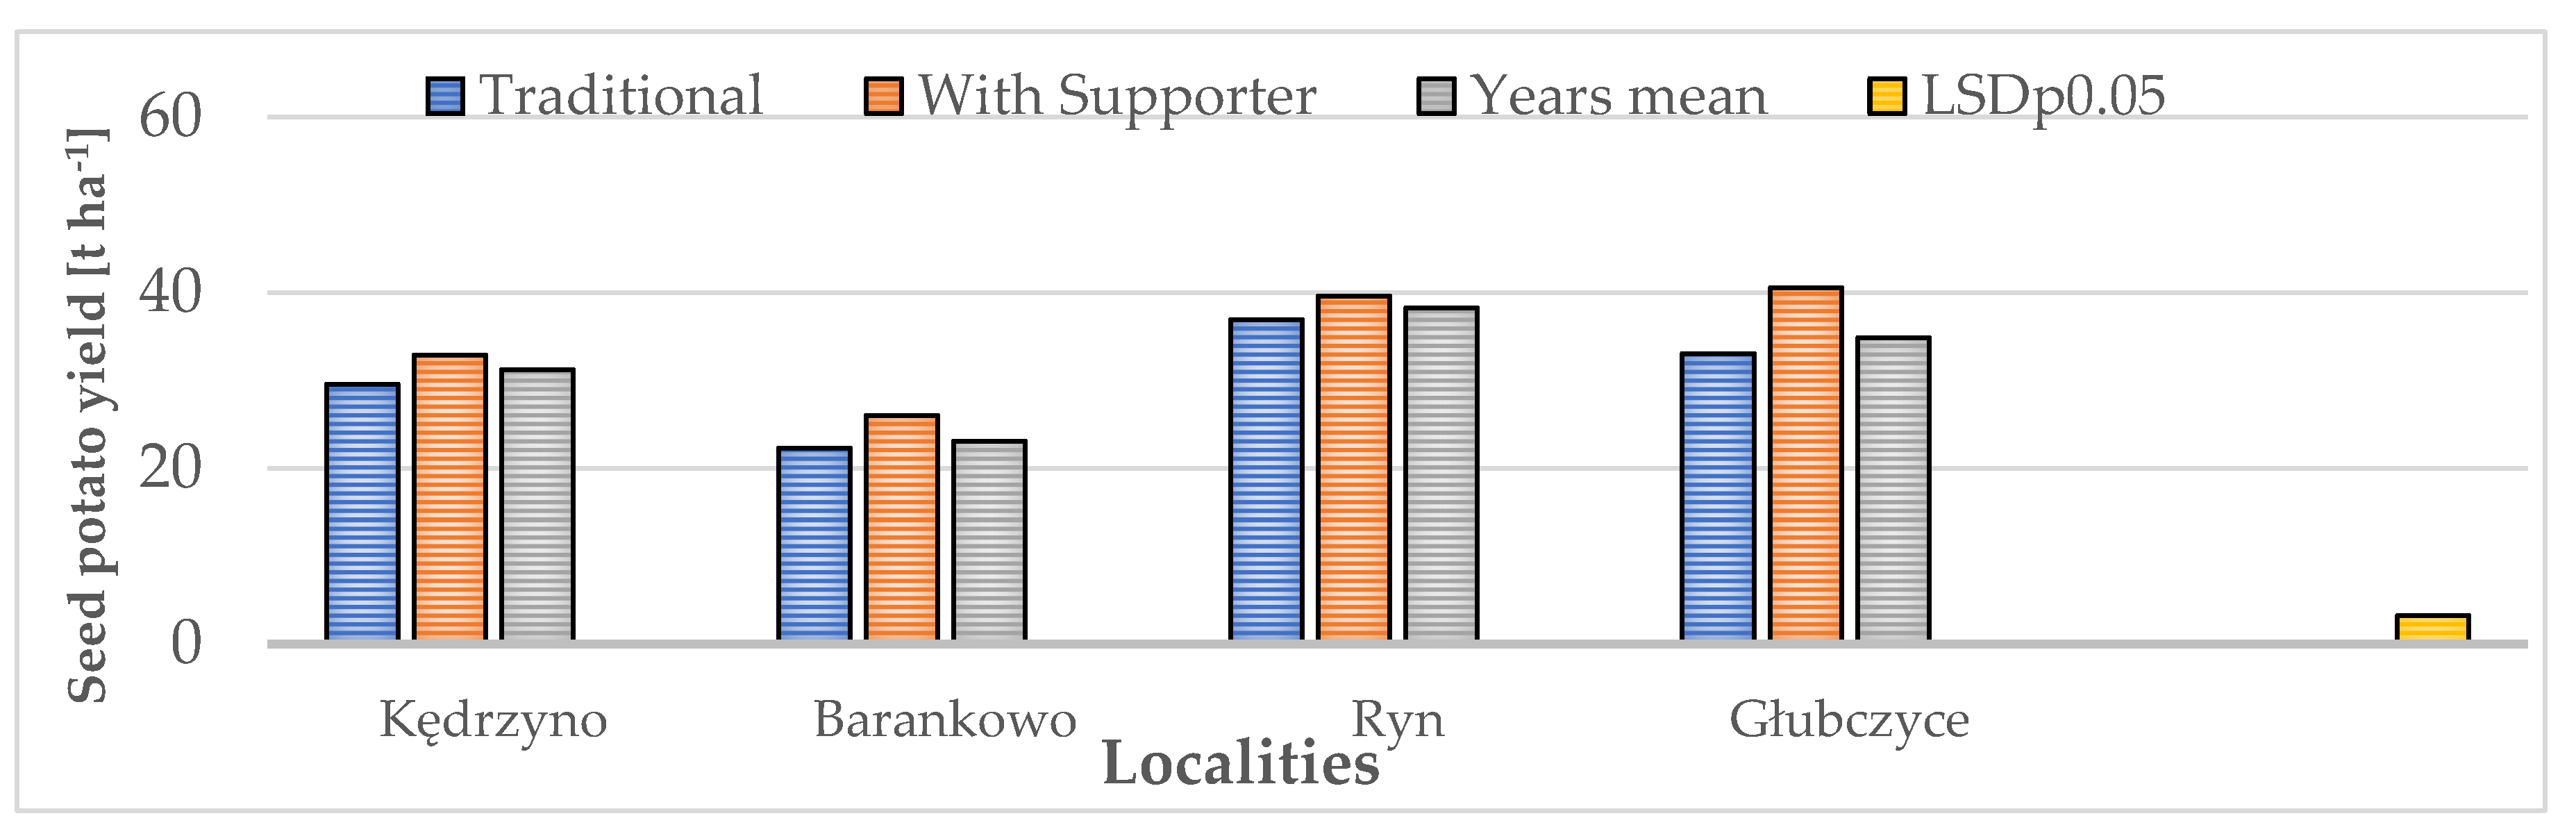
Figure 6.
Simple Pearson correlation coefficients for the dependent variable (y) and independent variables (x) y – seed potato yield x1 – % of seed potato weight, x2 – number of seed potatoes from 10 plants, x3 – number of seed potatoes in thousands per ha, x4 – average weight of one seed potato, x5 – reproduction coefficient.
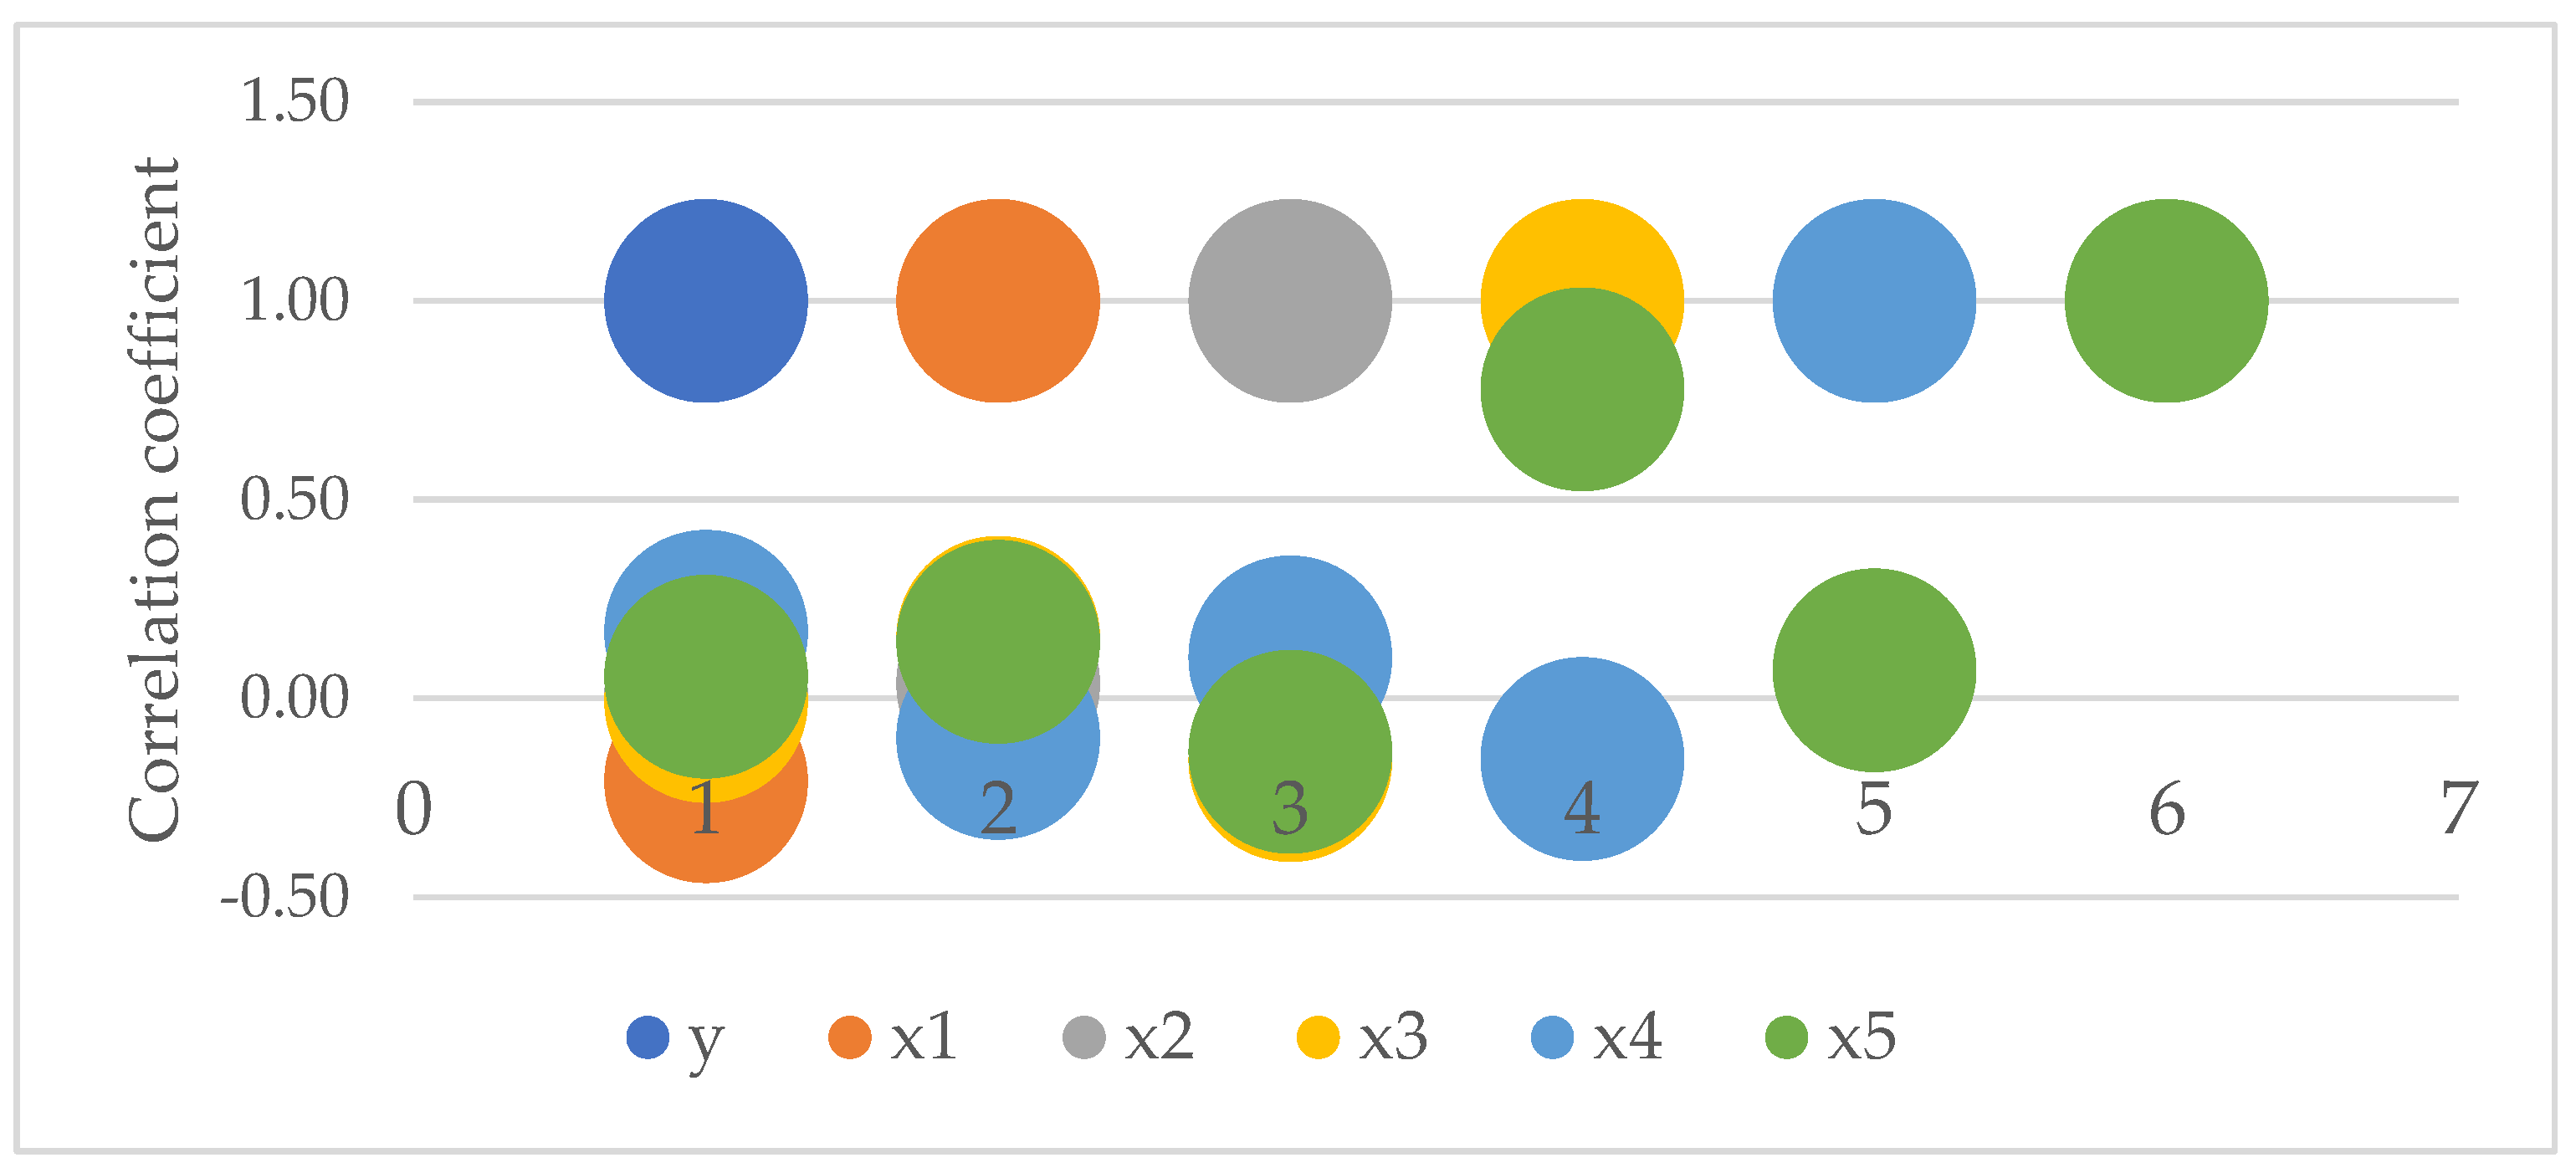

Table 1.
Characteristics of the tested potato varieties.
| Varieties | Breeder | Peel color | Flesh color | Culinary type | Starch content (%) | Yield of tubers (t · ha-1) |
|---|---|---|---|---|---|---|
| Early varieties | ||||||
| Innovator | HZPC Holland, BV | yellow | creamy | B | 14.8 | 44.2 |
| Lilly | Solana Polska | yellow | yellow | BC | 14.0-14.5 | 40.0 |
| Lady Claire | HZPC Holland, BV | yellow | light yellow | BC | 16.7 | 38.4 |
| Moderately variety | ||||||
| Verdi | Solana Poland | yellow | yellow | BC | 19-20 | 36.4 |
Source: own.
Table 2.
Soil Properties and Nutrient Content (2015-2017).
| Location | Year | Available Phosphorus (P2O₅) | Available Potassium (K2O) | Available Magnesium (Mg) | Soil pH (KCl) | Humus Content (g·kg⁻¹) |
|---|---|---|---|---|---|---|
| Kędrzyno | 2015 | 24.8 | 9.0 | 3.4 | 5.6 | 1.01 |
| 2016 | 18.8 | 18.0 | 3.9 | 6.0 | 1.06 | |
| 2017 | 17.0 | 15.0 | 6.2 | 6.4 | 1.12 | |
| Barankowo | 2015 | 31.9 | 14.8 | 3.3 | 5.8 | 1.2 |
| 2016 | 25.0 | 12.7 | 3.2 | 6.0 | 1.4 | |
| 2017 | 30.4 | 12.4 | 2.9 | 5.9 | 1.3 | |
| Ryn | 2015 | 14.5 | 16.0 | 3.6 | 6.1 | 1.1 |
| 2016 | 14.7 | 17.5 | 3.8 | 6.3 | 1.3 | |
| 2017 | 15.0 | 19.0 | 4.0 | 6.4 | 1.4 | |
| Głubczyce | 2015 | 27.8 | 22.6 | 11.8 | 6.6 | 1.8 |
| 2016 | 25.2 | 21.5 | 12.8 | 6.5 | 1.7 | |
| 2017 | 21.8 | 19.1 | 12.0 | 6.4 | 1.6 |
Source: Own experimental results obtained at the Agro-Ecological Laboratory, University of Life Sciences in Lublin.
Table 3.
Total Rainfall and Average Air Temperature in Barankowo, Głubczyce, Kędrzyno, and Ryn (May-September, 2015-2017).
Table 3.
Total Rainfall and Average Air Temperature in Barankowo, Głubczyce, Kędrzyno, and Ryn (May-September, 2015-2017).
| Location | Year | Total Rainfall [mm] |
Average Air Temperature [°C] |
|---|---|---|---|
| Barankowo | 2015 | 237.1 | 13.4 |
| 2016 | 306.9 | 15.3 | |
| 2017 | 508.9 | 14.1 | |
| Głubczyce | 2015 | 218.4 | 15.9 |
| 2016 | 472.3 | 15.7 | |
| 2017 | 465.9 | 15.2 | |
| Kędrzyno | 2015 | 383.9 | 12.2 |
| 2016 | 476.1 | 14.9 | |
| 2017 | 712.8 | 14.0 | |
| Ryn | 2015 | 241.3 | 14.5 |
| 2016 | 350.0 | 13.8 | |
| 2017 | 451.6 | 14.1 |
Sources: own according to Meteorological Stations in Barankowo, Głubczyce, Kędrzyno & Ryn, Poland.
Table 4.
Influence of Cultivation Technology, Localities, and Years on the Share of Seed Potatoes (%).
Table 4.
Influence of Cultivation Technology, Localities, and Years on the Share of Seed Potatoes (%).
| Variety | Technology | 2015 | 2016 | 2017 | Mean |
|---|---|---|---|---|---|
| Verdi | Traditional | 80.69 | 82.46 | 68.39 | 77.18 |
| With Supporter | 94.48 | 73.72 | 86.88 | 85.03 | |
| Mean | 82.97 | 87.26 | 79.99 | 83.40 | |
| Innovator | Traditional | 89.13 | 70.17 | 79.78 | 79.69 |
| With Supporter | 86.81 | 78.40 | 78.76 | 81.33 | |
| Mean | 80.52 | 83.73 | 74.08 | 79.45 | |
| Lilly | Traditional | 94.68 | 77.79 | 83.99 | 85.49 |
| With Supporter | 88.15 | 81.18 | 87.89 | 85.74 | |
| Mean | 92.01 | 78.75 | 75.83 | 82.20 | |
| Lady Claire | Traditional | 88.84 | 80.36 | 80.45 | 83.22 |
| With Supporter | 80.60 | 83.10 | 71.24 | 78.31 | |
| Mean | 94.58 | 75.76 | 85.43 | 85.26 | |
| Overall Mean | Traditional | 85.56 | 84.22 | 83.94 | 84.57 |
| With Supporter | 90.57 | 74.46 | 77.81 | 80.95 | |
| Years Mean | 87.83 | 79.38 | 79.60 | 82.27 |
SD p0.05, Technologies (T) – 1.81, Localities (L) – 3.62, T×L – 7.24, Years (Y) – 2.72, Y×T – 5.43, Y×L – 10.86.
Table 5.
Influence of Cultivation Technology, Varieties, and Years of Cultivation on the Share of Seed Potatoes (%).
Table 5.
Influence of Cultivation Technology, Varieties, and Years of Cultivation on the Share of Seed Potatoes (%).
| Technology | Varieties | Years | Mean | ||
| 2015 | 2016 | 2017 | |||
| Traditional | Verdi | 80.69 | 82.46 | 68.39 | 77.18 |
| Innovator | 94.48 | 73.72 | 86.88 | 85.03 | |
| Lilly | 82.97 | 87.26 | 79.99 | 83.40 | |
| Lady Claire | 89.13 | 70.17 | 79.78 | 79.69 | |
| Mean | 86.81 | 78.40 | 78.76 | 81.33 | |
| With Supporter | Verdi | 80.52 | 83.73 | 74.08 | 79.45 |
| Innovator | 94.68 | 77.79 | 83.99 | 85.49 | |
| Lilly | 88.15 | 81.18 | 87.89 | 85.74 | |
| Lady Claire | 92.01 | 78.75 | 75.83 | 82.20 | |
| Mean | 88.84 | 80.36 | 80.45 | 83.22 | |
| Overall Mean | Verdi | 80.60 | 83.10 | 71.24 | 78.31 |
| Innovator | 94.58 | 75.76 | 85.43 | 85.26 | |
| Lilly | 85.56 | 84.22 | 83.94 | 84.57 | |
| Lady Claire | 90.57 | 74.46 | 77.81 | 80.95 | |
| Mean | 87.83 | 79.38 | 79.60 | 82.27 | |
LSD p0.05, Technologies (T) – 1.81, Varieties (V) – 3.62, T×V – 7.24, Years (Y) – 2.72, Y×T – 5.43, Y×V – 10.86.
Table 6.
Impact of cultivation technology, varieties, and years on seed yield (t·ha−1) (average for location).
Table 6.
Impact of cultivation technology, varieties, and years on seed yield (t·ha−1) (average for location).
| Technology | Varieties | Years | Mean | ||
| 2015 | 2016 | 2017 | |||
| Traditional | Verdi | 26.89 | 35.81 | 26.13 | 29.61 |
| Innovator | 19.72 | 22.46 | 24.80 | 22.33 | |
| Lilly | 39.47 | 36.22 | 35.03 | 36.91 | |
| Lady Claire | 28.93 | 34.11 | 36.04 | 33.03 | |
| Mean | 28,75 | 32.15 | 30.50 | 30.47 | |
| With Supporter | Verdi | 25.42 | 43.22 | 30.03 | 32.89 |
| Innovator | 34.30 | 21.99 | 30.08 | 28.79 | |
| Lilly | 53.32 | 39.13 | 40.13 | 44.19 | |
| Lady Claire | 28.79 | 40.29 | 40.81 | 36.63 | |
| Mean | 35,46 | 36.16 | 35.26 | 35.63 | |
| Overall Mean |
Verdi | 26.15 | 39.52 | 28.08 | 31.25 |
| Innovator | 27.01 | 22.23 | 27.44 | 25.56 | |
| Lilly | 46.39 | 37.67 | 37.58 | 40.55 | |
| Lady Claire | 28.86 | 37.20 | 38.43 | 34.83 | |
| Mean | 32.11 | 34.15 | 32.88 | 34.43 | |
LSDp0.05, Technologies (T) – 1.61, Varieties (V) – 2.42, T x V – 3.38, Years (Y) – 2.02, Y x T – 4.83, Y x V – 9.66.
Table 7.
The influence of experiment location and cultivation technology on seed potato yield in t ha-1 (average for varieties).
Table 7.
The influence of experiment location and cultivation technology on seed potato yield in t ha-1 (average for varieties).
| Localities | Technology | 2015 | 2016 | 2017 | Mean |
|---|---|---|---|---|---|
| Kędrzyno | Traditional | 31.89 | 39.88 | 26.13 | 32.63 |
| With Supporter | 29.58 | 45.95 | 30.03 | 35.19 | |
| Mean | 30.74 | 42.91 | 28.08 | 33.91 | |
| Barankowo | Traditional | 20.66 | 24.33 | 24.80 | 23.26 |
| With Supporter | 36.05 | 26.48 | 30.08 | 30.87 | |
| Mean | 28.36 | 25.41 | 27.44 | 27.07 | |
| Ryn | Traditional | 41.65 | 40.53 | 35.03 | 39.07 |
| With Supporter | 56.11 | 46.12 | 40.13 | 47.45 | |
| Mean | 48.88 | 43.33 | 37.58 | 43.26 | |
| Głubczyce | Traditional | 31.23 | 28.28 | 36.04 | 31.85 |
| With Supporter | 30.18 | 46.12 | 40.81 | 39.04 | |
| Mean | 30.71 | 43.33 | 38.43 | 37.49 | |
| Overall Mean |
Traditional | 31.36 | 33.25 | 30.50 | 31.70 |
| With Supporter | 37.98 | 38.24 | 38.43 | 38.22 | |
| Mean | 34.67 | 35.75 | 32.88 | 34.43 |
LSDp0.05, Technologies (T) – 1.61, Localities (L) – 2.42, L x T – 3.28, Years (Y), 2.02, Y x T - 4.83, Y x L – 9.66.
Table 8.
Effect of cultivation technology, varieties and years on the number of seed potatoes (thousands of pieces per ha) (average for localities).
Table 8.
Effect of cultivation technology, varieties and years on the number of seed potatoes (thousands of pieces per ha) (average for localities).
| Technology | Varieties | Years | Mean | ||
| 2015 | 2016 | 2017 | |||
| Traditional | Verdi | 514.80 | 526.09 | 436.33 | 492.41 |
| Innovator | 602.78 | 470.33 | 554.29 | 542.47 | |
| Lilly | 529.35 | 556.72 | 510.34 | 532.13 | |
| Lady Claire | 568.65 | 447.68 | 509.00 | 508.44 | |
| Mean | 553.90 | 500.21 | 502.49 | 518.86 | |
| With Supporter | Verdi | 515.33 | 535.87 | 474.11 | 508.44 |
| Innovator | 606.90 | 497.86 | 537.54 | 547.43 | |
| Lilly | 564.16 | 519.55 | 562.50 | 548.74 | |
| Lady Claire | 588.86 | 503.61 | 486.07 | 526.18 | |
| Mean | 568.81 | 514.22 | 515.05 | 532.70 | |
| Overall varieties |
Verdi | 515.07 | 530.98 | 455.22 | 500.42 |
| Innovator | 604.84 | 484.09 | 545.92 | 544.95 | |
| Lilly | 546.75 | 538.14 | 536.42 | 540.44 | |
| Lady Claire | 578.76 | 475.65 | 497.53 | 517.31 | |
| Mean | 561.35 | 507.21 | 508.77 | 525.78 | |
LSDp0.05, Varieties (V) – 44,31 Technologies (T) – ns*, L x T – ns, Years (Y), 35,49, Y x V – ns, *not significant at p0.05.
Table 9.
The influence of research location, technology and years on the number of seed potatoes in thousands of pieces per ha (average for varieties).
Table 9.
The influence of research location, technology and years on the number of seed potatoes in thousands of pieces per ha (average for varieties).
| Localities | Technology | 2015 | 2016 | 2017 | Mean |
|---|---|---|---|---|---|
| Kędrzyno | Traditional | 718.40 | 701.20 | 740.00 | 719.87 |
| With Supporter | 582.40 | 812.00 | 585.20 | 659.87 | |
| Mean | 650.40 | 756.60 | 662.60 | 689.87 | |
| Barankowo | Traditional | 302.40 | 301.20 | 281.20 | 294.93 |
| With Supporter | 348.00 | 354.40 | 325.20 | 342.53 | |
| Mean | 325.20 | 327.80 | 303.20 | 318.73 | |
| Ryn | Traditional | 505.20 | 530.40 | 484.00 | 506.53 |
| With Supporter | 621.20 | 530.40 | 585.20 | 578.93 | |
| Mean | 563,20 | 530.40 | 534.60 | 542.73 | |
| Głubczyce | Traditional | 481.20 | 566.40 | 693.20 | 580.27 |
| With Supporter | 462.40 | 570.40 | 537.20 | 523.33 | |
| Mean | 471.80 | 568.40 | 615.20 | 551.80 | |
| Overall localities |
Traditional | 501.80 | 524.80 | 549.60 | 525.40 |
| With Supporter | 503.50 | 566.80 | 508.20 | 526.17 | |
| Mean | 502.65 | 545.80 | 528.90 | 525.78 | |
LSDp0.05, Localities (L) – 44.31 Technologies (T) – ns*, L x T – ns, Years (Y) – 35.49, Y x L – ns, * not significant et p0.05.
Table 10.
Effect of cultivation technology, varieties and years on the share of number of seed potatoes (%).
Table 10.
Effect of cultivation technology, varieties and years on the share of number of seed potatoes (%).
| Technology | Varieties | Years | Mean | ||
| 2015 | 2016 | 2017 | |||
| Traditional | Verdi | 80.69 | 82.46 | 68.39 | 77.18 |
| Innovator | 94.48 | 73.72 | 86.88 | 85.03 | |
| Lilly | 82.97 | 87.26 | 79.99 | 83.40 | |
| Lady Claire | 89.13 | 70.17 | 79.78 | 79.69 | |
| Mean | 86.81 | 78.40 | 78.76 | 81.33 | |
| With Supporter | Verdi | 80.52 | 83.73 | 74.08 | 79.45 |
| Innovator | 94.68 | 77.79 | 83.99 | 85.49 | |
| Lilly | 88.15 | 81.18 | 87.89 | 85.74 | |
| Lady Claire | 92.01 | 78.75 | 75.83 | 82.20 | |
| Mean | 88.84 | 80.36 | 80.45 | 83.22 | |
| Overall varieties |
Verdi | 80.60 | 83.10 | 71.24 | 78.31 |
| Innovator | 94.58 | 75.76 | 85.43 | 85.26 | |
| Lilly | 85.56 | 84.22 | 83.94 | 84.57 | |
| Lady Claire | 90.57 | 74.46 | 77.81 | 80.95 | |
| Mean | 87.83 | 79.38 | 79.60 | 82.27 | |
LSDp0.05, Varieties (V) – 7.07 Technologies (T) – ns*, V x T – 14.15, Years (Y) – 5.31, Y x V – 21.22, *not significance at p00.5.
Table 11.
Effect of cultivation technology, varieties and years on the share of number of seed potatoes (%) (Average for varieties).
Table 11.
Effect of cultivation technology, varieties and years on the share of number of seed potatoes (%) (Average for varieties).
| Experimental factors | Years | Mean | |||
|---|---|---|---|---|---|
| Localities | Technology | 2015 | 2016 | 2017 | |
| Kędrzyno | Traditional | 95.97 | 91.79 | 94.20 | 93.92 |
| With Supporter | 93.82 | 88.95 | 91.38 | 91.38 | |
| Mean | 94.90 | 90.37 | 92.79 | 92.65 | |
| Barankowo | Traditional | 99.14 | 80.94 | 88.03 | 89.37 |
| With Supporter | 99.48 | 94.98 | 90.56 | 95.01 | |
| Mean | 99.31 | 87.96 | 89.30 | 92.19 | |
| Ryn | Traditional | 88.24 | 96.79 | 84.56 | 89.86 |
| With Supporter | 93.01 | 95.50 | 92.41 | 93.64 | |
| Mean | 90.63 | 96.15 | 88.49 | 91.80 | |
| Głubczyce | Traditional | 96.22 | 58.31 | 82.01 | 78.85 |
| With Supporter | 96.62 | 67.24 | 69.45 | 77.77 | |
| Traditional | 95.97 | 91.79 | 94.20 | 93.92 | |
LSDp0.05, Localities (L) – 7.07, L x T – 14.15, Years (Y) –5.31, Y x L – ns*, * not significant et p0.05.
Table 12.
Effect of cultivation technology, varieties and years on weight of one seed potato (g).
| Technology | Varieties | Years | Mean | ||
| 2015 | 2016 | 2017 | |||
| Traditional |
Verdi Innovator Lilly Lady Claire |
52.23 32.72 74.56 50.87 |
68.07 47.75 65.06 76.19 |
59.89 44.74 68.64 70.81 |
60.06 41.74 69.42 65.96 |
| Mean | 52,60 | 64.27 | 61.02 | 59.29 | |
| With Supporter | Verdi Innovator Lilly Lady Claire |
49.33 56.52 94.51 48.89 |
80.65 44.17 75.32 80.00 |
63.91 55.96 71.34 83.96 |
64.63 52.21 80.39 70.95 |
| Mean | 62,31 | 70.04 | 68.79 | 67.05 | |
| Overall varieties |
Verdi Innovator Lilly Lady Claire |
50.78 44.62 84.54 49.88 |
74.36 45.96 70.19 78.10 |
61.90 50.35 69.99 77.38 |
62.35 46.98 74.91 68.45 |
| Mean | 57.45 | 67.15 | 64.91 | 63.17 | |
LSDp0.05, Varieties (V) – 6.32 Technologies (T) – 3.26, V x T – 12.63,Years (Y) – 4.74, Y x T – 9.48, Y x V – 18.95.
Table 13.
The influence of research location, technology and years on the weight of average single seed potato (average for varieties) (g).
Table 13.
The influence of research location, technology and years on the weight of average single seed potato (average for varieties) (g).
| Localities | Technology | 2015 | 2016 | 2017 | Mean |
|---|---|---|---|---|---|
| Kędrzyno | Traditional | 44.39 | 56.87 | 35.31 | 45.53 |
| With Supporter | 50.79 | 56.59 | 51.32 | 52.90 | |
| Mean | 47.59 | 56.73 | 43.31 | 49.21 | |
| Barankowo | Traditional | 68.32 | 76.07 | 79.10 | 74.50 |
| With Supporter | 83.61 | 74.72 | 85.83 | 81.39 | |
| Mean | 75.97 | 75.39 | 82.47 | 77.94 | |
| Ryn | Traditional | 76.98 | 76.41 | 72.38 | 75.26 |
| With Supporter | 81.85 | 79.13 | 68.57 | 76.52 | |
| Mean | 79.42 | 77.77 | 70.48 | 75.89 | |
| Głubczyce | Traditional | 52.51 | 49.93 | 51.99 | 51.48 |
| With Supporter | 65.27 | 70.35 | 71.76 | 69.13 | |
| Mean | 58.89 | 60.14 | 61.88 | 60.30 | |
LSDp0.05, Localities (L) – 6.32 Technologies (T) – 3.26, L x T – 12.63, Years (Y) – 4.74, Y x T – 9.48, Y x L – 18.95.
Table 14.
The influence of cultivation technology, varieties and years on the potato multiplication coefficient (average for location).
Table 14.
The influence of cultivation technology, varieties and years on the potato multiplication coefficient (average for location).
| Technology | Varieties | Years | Mean | ||
| 2015 | 2016 | 2017 | |||
| Traditional | Verdi | 3.51 | 6.09 | 3.91 | 4.51 |
| Innovator | 4.04 | 3.17 | 3.30 | 3.50 | |
| Lilly | 7.36 | 5.89 | 6.01 | 6.42 | |
| Lady Claire | 3.68 | 6.50 | 6.38 | 5.52 | |
| Mean | 4.65 | 5.41 | 4.90 | 4.99 | |
| with Supporter | Verdi | 3.13 | 8.71 | 4.84 | 5.56 |
| Innovator | 4.85 | 3.83 | 4.21 | 4.29 | |
| Lilly | 12.60 | 7.37 | 7.16 | 9.04 | |
| Lady Claire | 6.70 | 8.06 | 8.57 | 7.77 | |
| Mean | 6.82 | 6.99 | 6.19 | 6.67 | |
|
Overall varieties |
Verdi | 3.32 | 7.40 | 4.38 | 5.03 |
| Innovator | 4.44 | 3.50 | 3.75 | 3.90 | |
| Lilly | 9.98 | 6.63 | 6.58 | 7.73 | |
| Lady Claire | 5.19 | 7.28 | 7.47 | 6.65 | |
| Mean | 5.73 | 6.20 | 5.55 | 5.83 | |
LSDp0.05, Varieties (V) – 0.57 Technologies (T) – 0.27, V x T – 1.10, Years (Y) 0.41, Y x T – 0.82, Y x V – 1.65.
Table 15.
The influence of cultivation technology, localities and years on the potato multiplication coefficient (average for varieties).
Table 15.
The influence of cultivation technology, localities and years on the potato multiplication coefficient (average for varieties).
| Localities | Technology | 2015 | 2016 | 2017 | Mean |
|---|---|---|---|---|---|
| Kędrzyno | Traditional With Supporter |
3.54 3.76 |
5.67 6.50 |
2.31 3.85 |
3.84 4.70 |
| Mean | 3.65 | 6.09 | 3.08 | 4.27 | |
| Barankowo | Traditional With Supporter |
3.53 7.54 |
4.63 4.95 |
4.90 6.45 |
4.35 6.31 |
| Mean | 5.53 | 4.79 | 5.68 | 5.33 | |
| Ryn | Traditional With Supporter |
7.99 11.48 |
7.74 9.12 |
6.34 6.88 |
7.36 9.16 |
| Mean | 9.73 | 8.43 | 6.61 | 8.26 | |
| Głubczyce | Traditional With Supporter |
4.10 4.92 |
3.53 8.11 |
4.68 7.32 |
4.10 6.79 |
| Mean | 4.51 | 5.82 | 6.00 | 5.45 | |
| Overall localities |
Traditional With Supporter |
4.79 6.92 |
5.39 7.17 |
4.56 6.13 |
4.91 6.74 |
| Mean | 5.86 | 6.28 | 5.34 | 5.83 | |
LSDp0.05, Localities (L) – 0.57 Technologies (T) – 0.27, L x T – 1.10, Years (Y) 0.41, Y x T – 0.82, Y x V – 1.65.
Table 16.
Descriptive statistics of the dependent variable (y) and selected independent variables (y).
Table 16.
Descriptive statistics of the dependent variable (y) and selected independent variables (y).
| Specification | y | x1 | x2 | x3 | x4 | x5 |
|---|---|---|---|---|---|---|
| Mean | 34.43 | 82.38 | 133.39 | 525.78 | 63.17 | 5.83 |
| Median | 32.38 | 83.01 | 131.00 | 533.80 | 63.45 | 6.11 |
| Standard deviation | 9.17 | 7.78 | 43.08 | 147.72 | 9.04 | 1.27 |
| Kurtosis | -0.05 | -0.34 | -0.99 | -0.80 | -0.41 | -0.30 |
| Skewness | 0.39 | -0.33 | 0.03 | -0.06 | -0.07 | -0.36 |
| Coefficient of variation V(%) | 26.63 | 9.45 | 32.30 | 28.10 | 14.31 | 21.78 |
y – seed potato yield x1 – % of seed potato weight, x2 – number of seed potatoes from 10 plants, x3 – number of seed potatoes in thousands per ha, x4 – average weight of seed potato (g), x5 – reproduction coefficient.
Disclaimer/Publisher’s Note: The statements, opinions and data contained in all publications are solely those of the individual author(s) and contributor(s) and not of MDPI and/or the editor(s). MDPI and/or the editor(s) disclaim responsibility for any injury to people or property resulting from any ideas, methods, instructions or products referred to in the content. |
© 2025 by the authors. Licensee MDPI, Basel, Switzerland. This article is an open access article distributed under the terms and conditions of the Creative Commons Attribution (CC BY) license (http://creativecommons.org/licenses/by/4.0/).
Copyright: This open access article is published under a Creative Commons CC BY 4.0 license, which permit the free download, distribution, and reuse, provided that the author and preprint are cited in any reuse.


