
Submitted:
13 January 2025
Posted:
14 January 2025
You are already at the latest version
Abstract
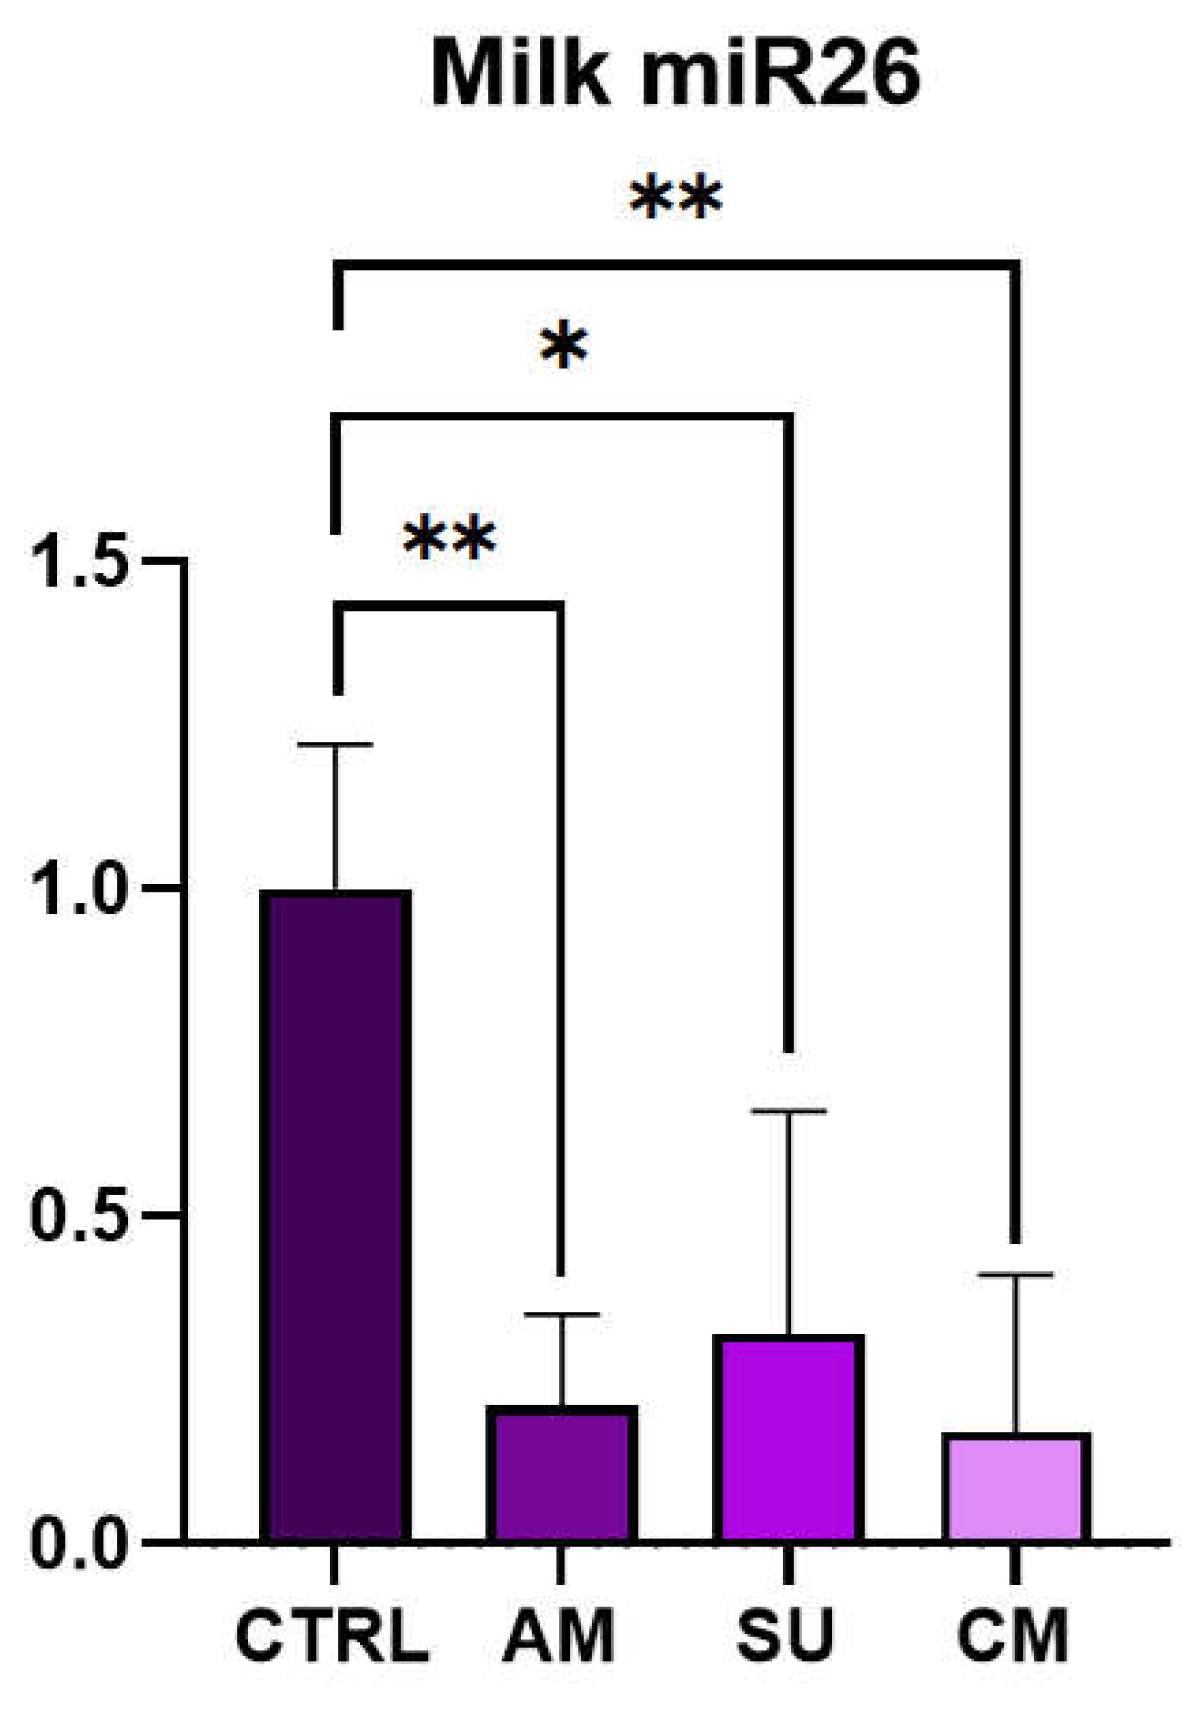
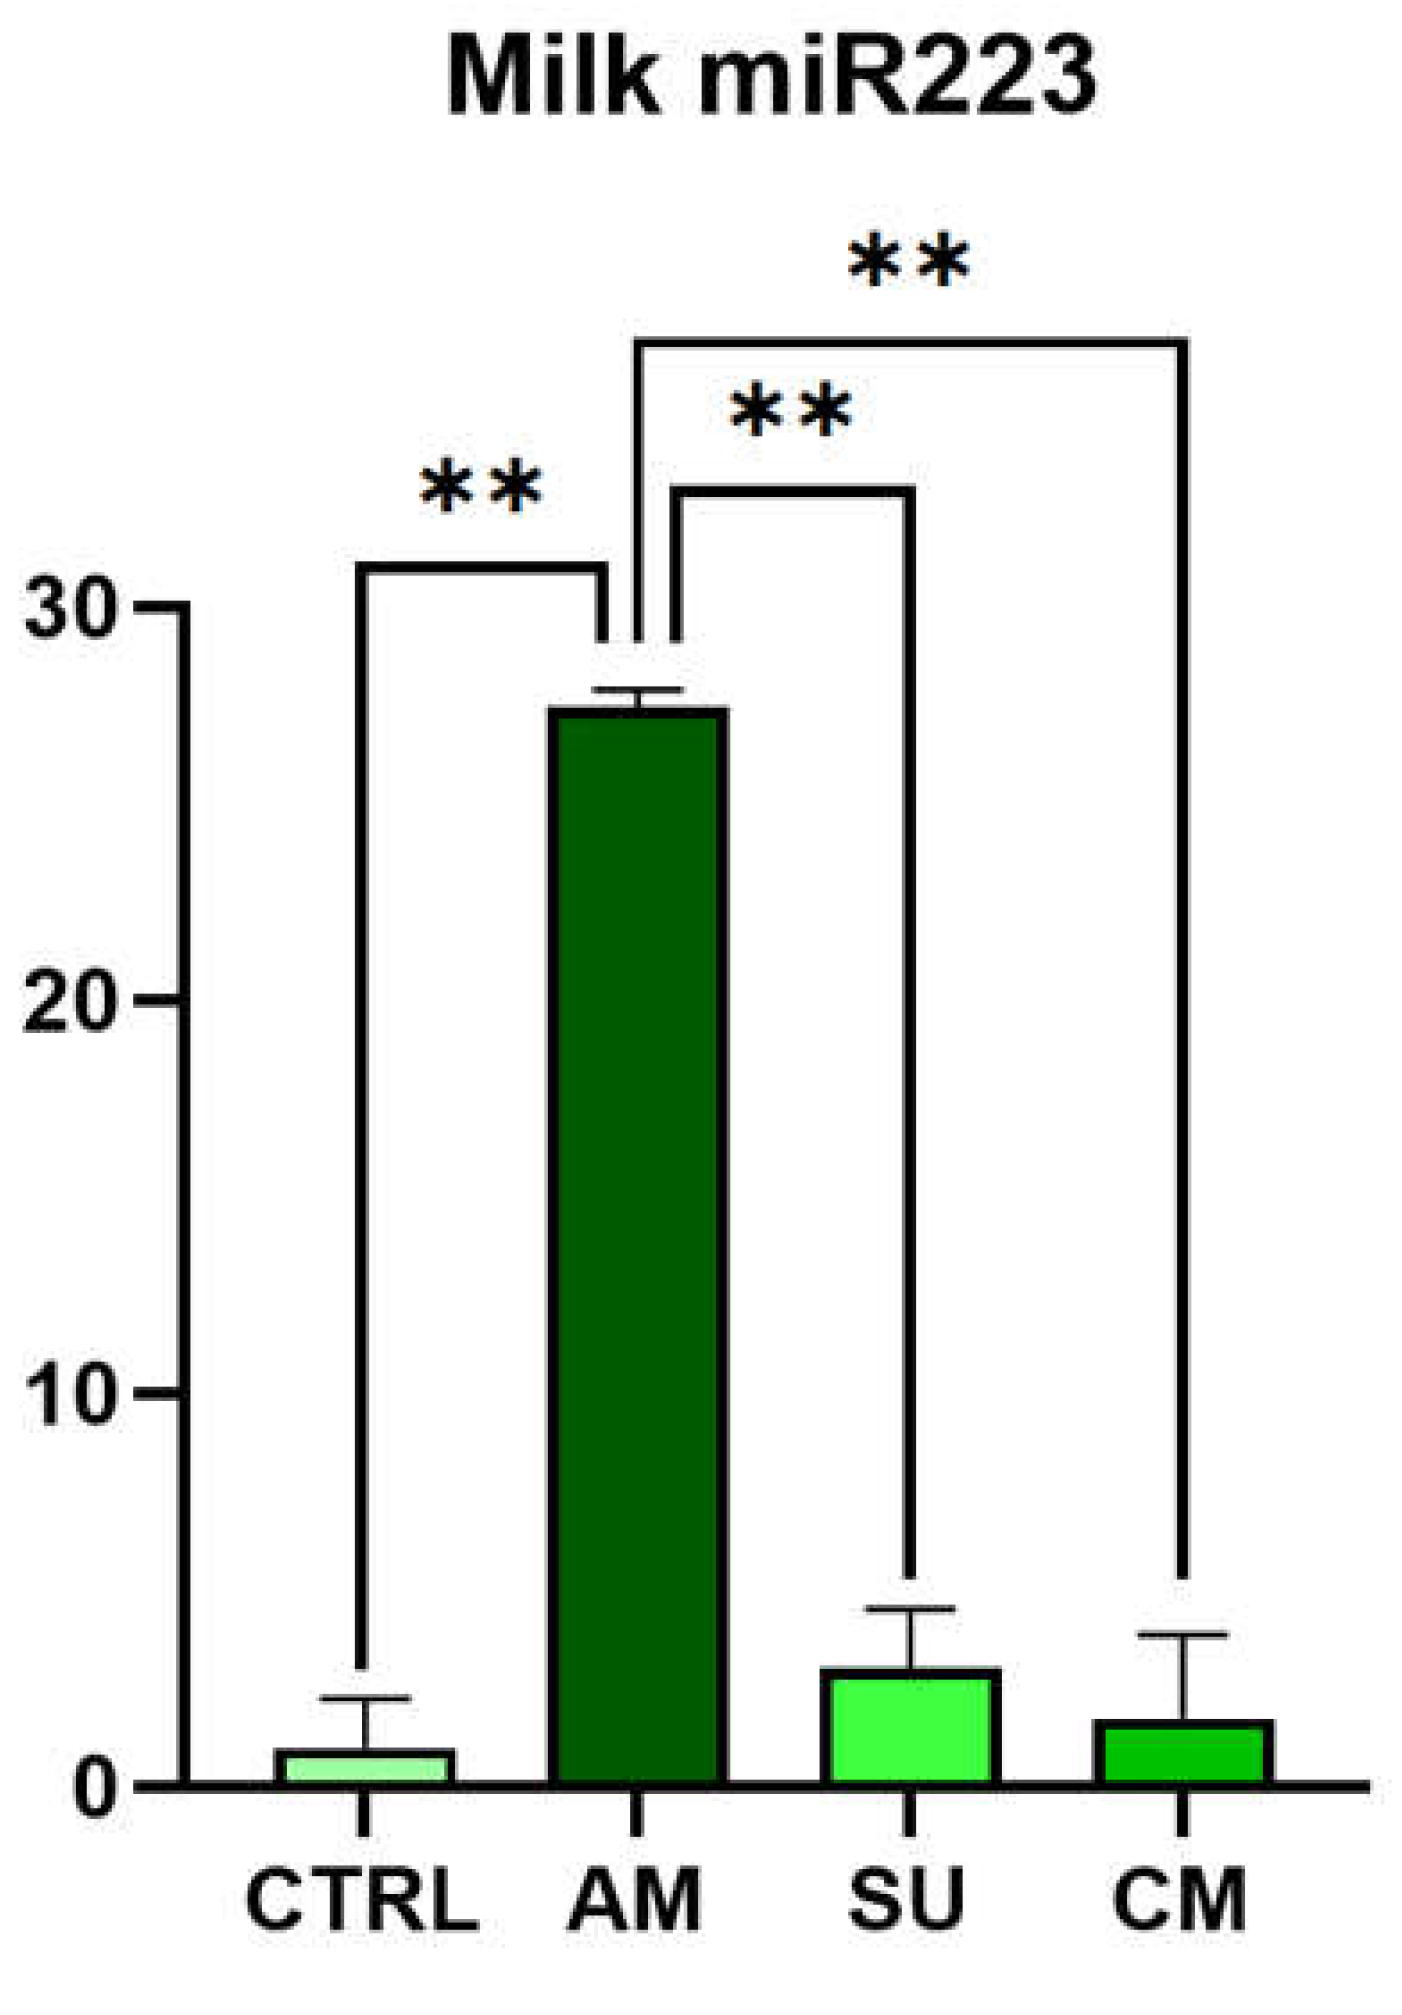
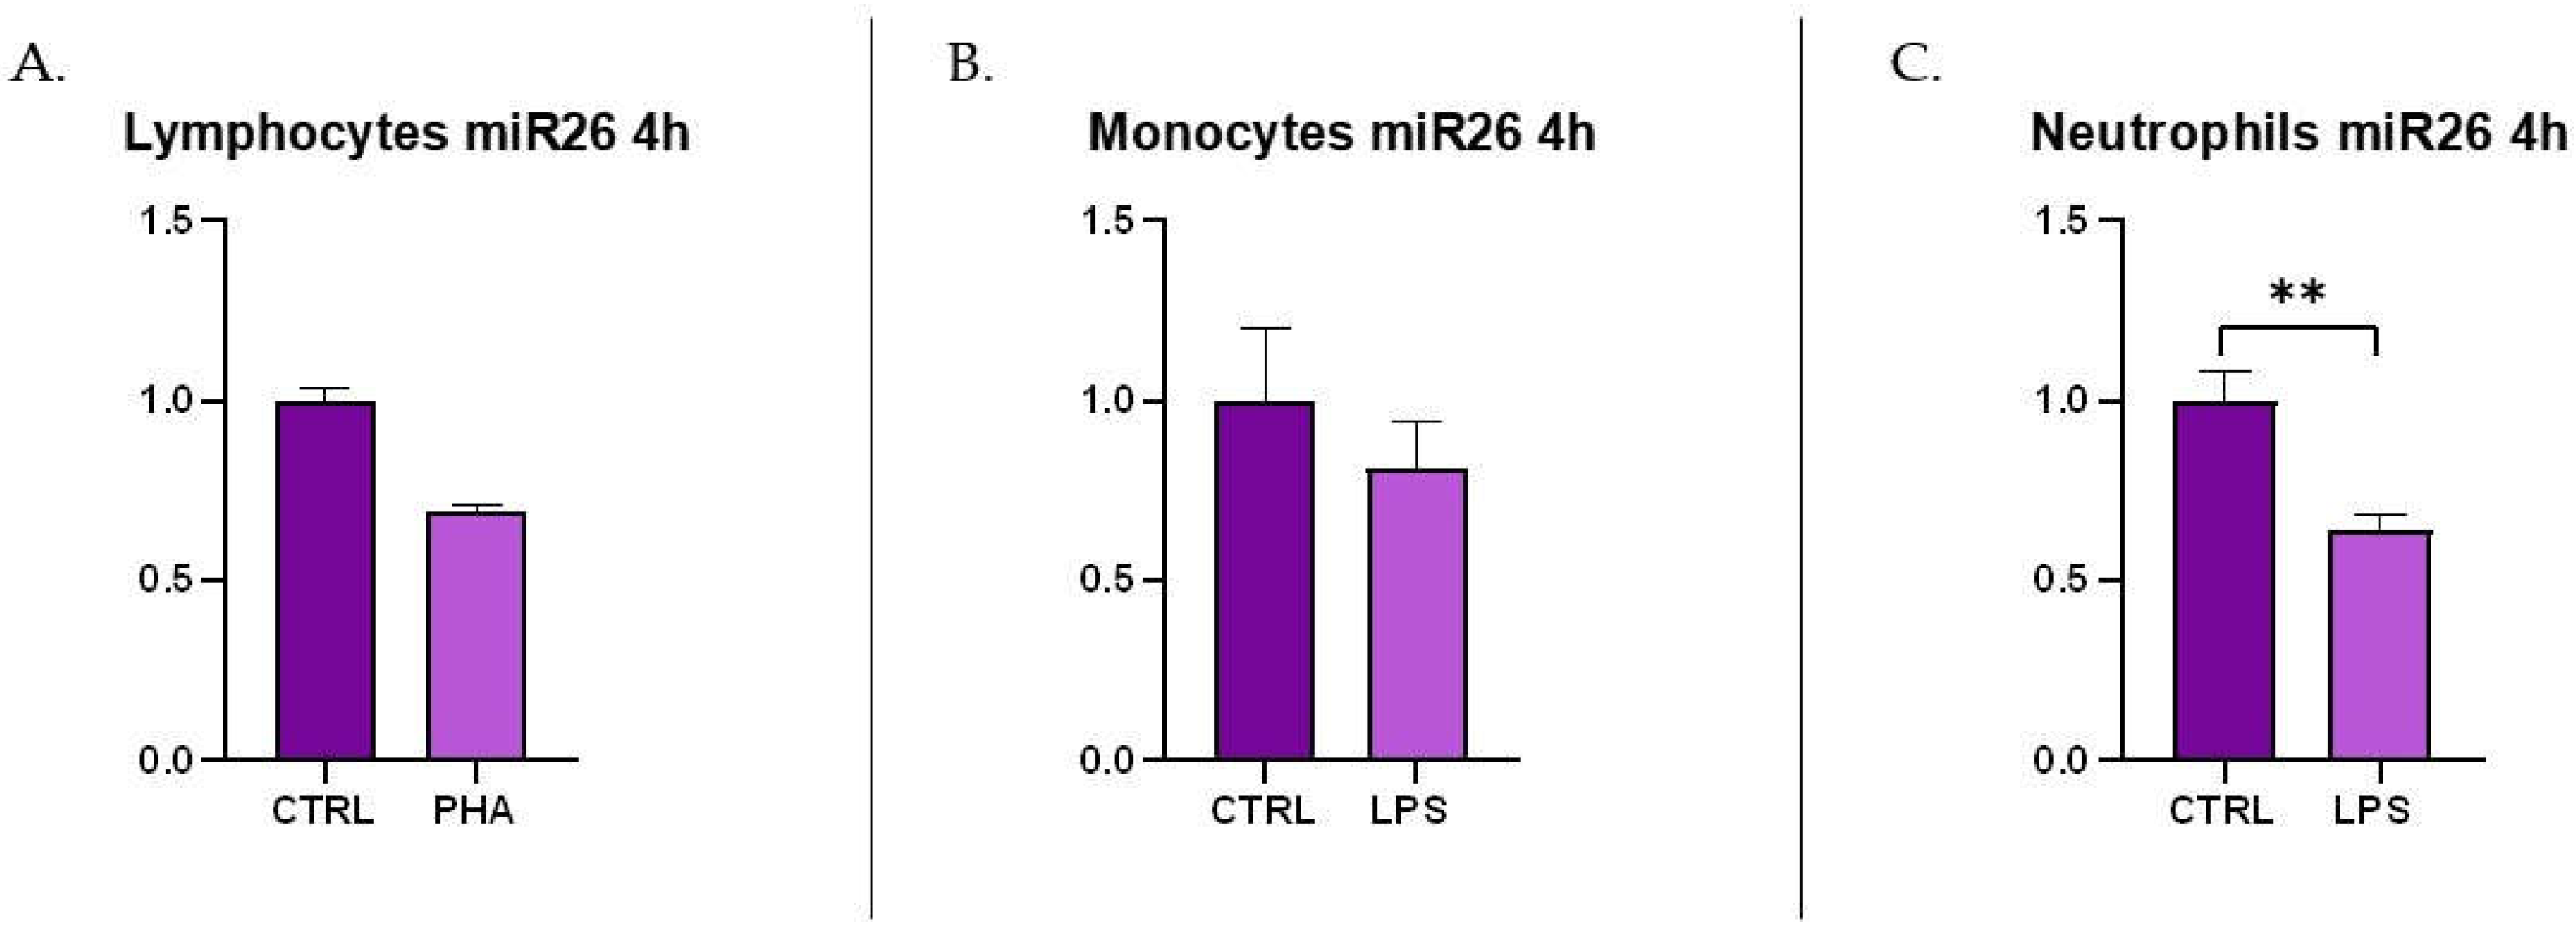
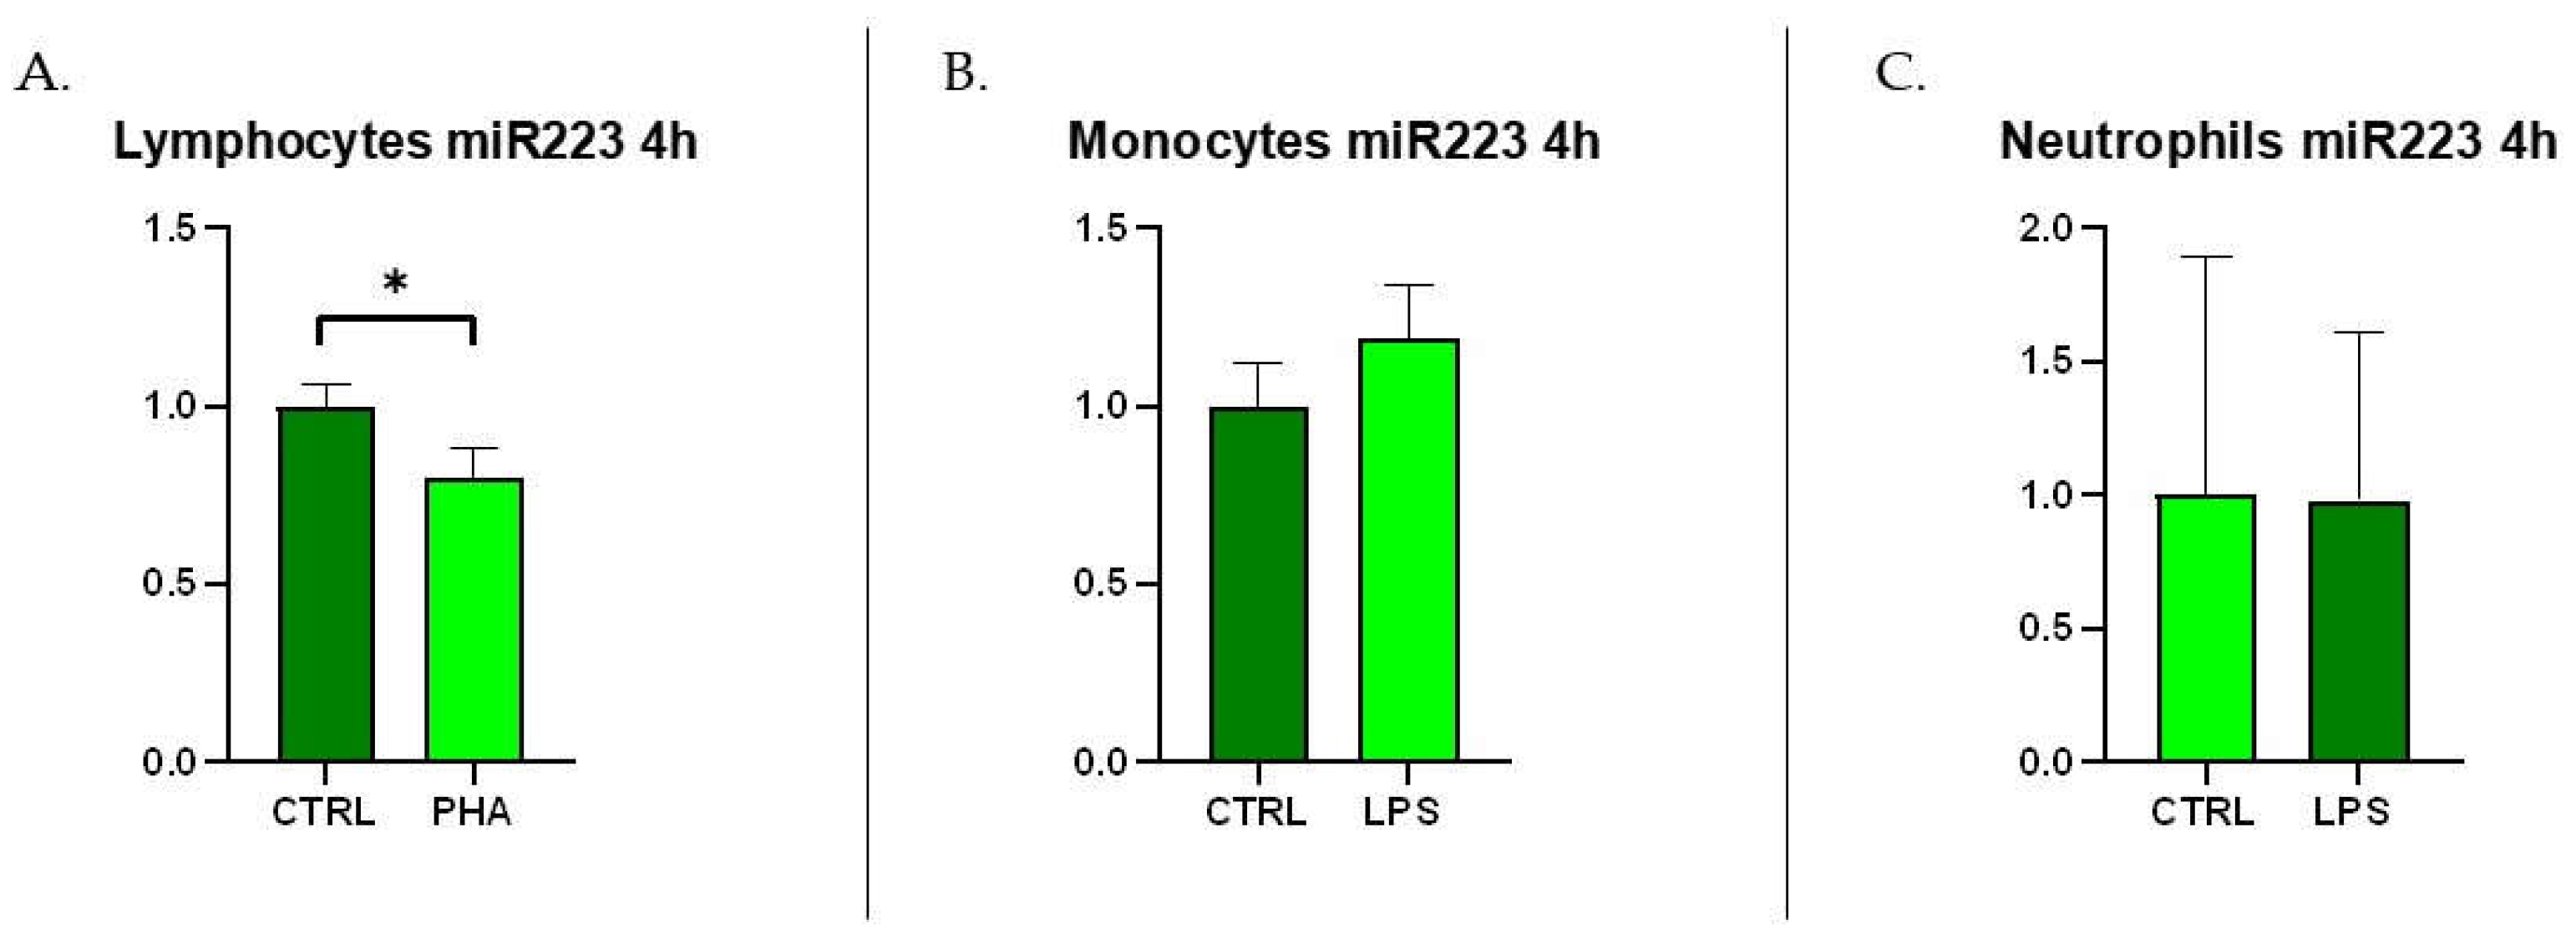
Mastitis is the disease that causes the greatest economic losses in dairy farming, significantly im-pairing animal welfare and the quality and quantity of milk produced. MicroRNAs are increasingly gaining attention, both in human and veterinary medicine, as biomarkers for various diseases. This study evaluated the diagnostic potential of four circulating microRNAs (miR-26-5p, miR-142-5p, miR-146a, and miR-223-3p) by examining changes in their expression in milk samples from dairy cows at different immune cells subpopulations correlated to different stage of mastitis in validated method. Additionally, the project has analysed the possible source of these circulating microRNA by the measurement of their secretion from activated immune cells (lymphocytes, monocytes, and neutrophils). miR-223-3p has been significantly expressed in acute stage of mastitis (p<0.01) but not in chronic or susceptible stages. mir-26-5p has been significantly reduced in acute, chronic and susceptible groups of animals. In immune cell cultures miR-26 has been shown to downregulate in LPS-stimulated neutrophils while miR-223 has been shown to be upregulated in PHA-stimulated lymphocytes. The differential expression of miR-223-3p and miR-26-5p together with differential and classic somatic cell count could be utilized for identifying the evolutionary stage of masti-tis-related inflammatory pathology.
Keywords:
1. Introduction
2. Materials and Methods
2.1. Ethical Statement
2.2. Milk Samples
2.3. Circulating microRNAs Extraction and Reverse Transcription
2.4. Gene Expression Analysis
2.5. Isolation of Bovine Lymphocytes, Monocytes and Neutrophils
2.6. Inflammatory Stimulation of Bovine Immune Cells Cultures
2.7. Statistical Analysis
3. Results
3.1. SCC and DSCC in Milk Samples
3.2. c-miRNAs Expression in Milk
3.3. c-miRNAs Expression in Immune Cells
4. Discussion
5. Conclusions
Author Contributions
Funding
Institutional Review Board Statement
Informed Consent Statement
Data Availability Statement
Acknowledgments
Conflicts of Interest
References
- Huszenicza, G.; Jánosi, S.; Kulcsár, M.; Kóródi, P.; Reiczigel, J.; Kátai, L.; Peters, A.; De Rensis, F. Effects of Clinical Mastitis on Ovarian Function in Post-partum Dairy Cows. Reprod. Domest. Anim. 2005, 40, 199–204. [CrossRef]
- Sharun, K.; Dhama, K.; Tiwari, R.; Gugjoo, M.B.; Yatoo, M.I.; Patel, S.K.; Pathak, M.; Karthik, K.; Khurana, S.K.; Singh, R.; et al. Advances in therapeutic and managemental approaches of bovine mastitis: a comprehensive review. Veter- Q. 2021, 41, 107–136. [CrossRef]
- Zecconi, A.; Zaghen, F.; Meroni, G.; Sora, V.; Martino, P.A.; Laterza, G.; Zanini, L. Early Milk Total and Differential Cell Counts as a Diagnostic Tool to Improve Antimicrobial Therapy Protocols. Animals 2023, 13, 1143. [CrossRef]
- Piccinini, R.; Binda, E.; Belotti, M.; Casirani, G.; Zecconi, A. Comparison of blood and milk non-specific immune parameters in heifers after calving in relation to udder health. Veter- Res. 2005, 36, 747–757. [CrossRef]
- Damm, M.; Holm, C.; Blaabjerg, M.; Bro, M.N.; Schwarz, D. Differential somatic cell count—A novel method for routine mastitis screening in the frame of Dairy Herd Improvement testing programs. J. Dairy Sci. 2017, 100, 4926–4940. [CrossRef]
- Zecconi, A.; Vairani, D.; Cipolla, M.; Rizzi, N.; Zanini, L. Assessment of subclinical mastitis diagnostic accuracy by differential cell count in individual cow milk. Ital. J. Anim. Sci. 2018, 18, 460–465. [CrossRef]
- Stocco, G.; Summer, A.; Cipolat-Gotet, C.; Zanini, L.; Vairani, D.; Dadousis, C.; Zecconi, A. Differential Somatic Cell Count as a Novel Indicator of Milk Quality in Dairy Cows. Animals 2020, 10, 753. [CrossRef]
- Stocco, G.; Cipolat-Gotet, C.; Stefanon, B.; Zecconi, A.; Francescutti, M.; Mountricha, M.; Summer, A. Herd and animal factors affect the variability of total and differential somatic cell count in bovine milk. J. Anim. Sci. 2022, 101. [CrossRef]
- Arora, S.; Dev, K.; Agarwal, B.; Das, P.; Syed, M.A. Macrophages: Their role, activation and polarization in pulmonary diseases. 2017, 223, 383–396. [CrossRef]
- Halasa, T.; Kirkeby, C. Differential Somatic Cell Count: Value for Udder Health Management. Front. Veter- Sci. 2020, 7. [CrossRef]
- Ceciliani, F.; Morales, G.Á.; De Matteis, G.; Grandoni, F.; Ferreira, R.F.; Roccabianca, P.; Lecchi, C. Methods in isolation and characterization of bovine monocytes and macrophages. Methods 2020, 186, 22–41. [CrossRef]
- Rosales, C. Neutrophil: A Cell with Many Roles in Inflammation or Several Cell Types?. Front. Physiol. 2018, 9, 113. [CrossRef]
- Sarikaya, H.; Schlamberger, G.; Meyer, H.; Bruckmaier, R. Leukocyte Populations and mRNA Expression of Inflammatory Factors in Quarter Milk Fractions at Different Somatic Cell Score Levels in Dairy Cows. J. Dairy Sci. 2006, 89, 2479–2486. [CrossRef]
- Miretti, S.; Lecchi, C.; Ceciliani, F.; Baratta, M. MicroRNAs as Biomarkers for Animal Health and Welfare in Livestock. Front. Veter- Sci. 2020, 7. [CrossRef]
- Lai, Y.-C.; Fujikawa, T.; Maemura, T.; Ando, T.; Kitahara, G.; Endo, Y.; Yamato, O.; Koiwa, M.; Kubota, C.; Miura, N. Inflammation-related microRNA expression level in the bovine milk is affected by mastitis. PLOS ONE 2017, 12, e0177182. [CrossRef]
- Luoreng, Z.-M.; Wang, X.-P.; Mei, C.-G.; Zan, L.-S. Comparison of microRNA Profiles between Bovine Mammary Glands Infected with Staphylococcus aureus and Escherichia coli. Int. J. Biol. Sci. 2018, 14, 87–99. [CrossRef]
- Srikok, S.; Patchanee, P.; Boonyayatra, S.; Chuammitri, P. Potential role of MicroRNA as a diagnostic tool in the detection of bovine mastitis. Prev. Veter- Med. 2020, 182, 105101. [CrossRef]
- Luoreng, Z.-M.; Yang, J.; Wang, X.-P.; Wei, D.-W.; Zan, L.-S. Expression Profiling of microRNA From Peripheral Blood of Dairy Cows in Response to Staphylococcus aureus-Infected Mastitis. Front. Veter- Sci. 2021, 8. [CrossRef]
- Cuccato, M.; Divari, S.; Giannuzzi, D.; Grange, C.; Moretti, R.; Rinaldi, A.; Leroux, C.; Sacchi, P.; Cannizzo, F.T. Extracellular vesicle miRNome during subclinical mastitis in dairy cows. Veter- Res. 2024, 55, 1–13. [CrossRef]
- Tzelos, T.; Ho, W.; Charmana, V.I.; Lee, S.; Donadeu, F.X. MiRNAs in milk can be used towards early prediction of mammary gland inflammation in cattle. Sci. Rep. 2022, 12, 1–8. [CrossRef]
- ICAR (International Committee for Animal Recording). 2023 Section 2 – Guidelines for Dairy Cows Milk Recording.
- Ioannidis, J.; Risse, J.; Donadeu, F.X. Profiling of MicroRNAs in the Biofluids of Livestock Species. In MicroRNA Protocols. Methods in Molecular Biology; Ying, SY. (eds); Humana Press, New York, NY 2018; vol 1733.
- Schanzenbach, C.I.; Kirchner, B.; Ulbrich, S.E.; Pfaffl, M.W. Can milk cell or skim milk miRNAs be used as biomarkers for early pregnancy detection in cattle?. PloS one 2017, 12(2), e0172220.
- Del Pozo-Acebo, L.; Hazas, M.L.L.; Tomé-Carneiro, J.; Gil-Cabrerizo, P.; San-Cristobal, R.; Busto, R.; García-Ruiz, A.; Dávalos, A. Bovine Milk-Derived Exosomes as a Drug Delivery Vehicle for miRNA-Based Therapy. Int. J. Mol. Sci. 2021, 22(3), 1105.
- Ferrari, L.; Martelli, P.; Saleri, R.; De Angelis, E.; Cavalli, V.; Bresaola, M.; Benetti, M.; Borghetti, P. Lymphocyte activation as cytokine gene expression and secretion is related to the porcine reproductive and respiratory syndrome virus (PRRSV) isolate after in vitro homologous and heterologous recall of peripheral blood mononuclear cells (PBMC) from pigs vaccinated and exposed to natural infection. Veter- Immunol. Immunopathol. 2013, 151, 193–206. [CrossRef]
- Kouoh, F.; Gressier, B.; Luyckx, M.; Brunet, C.; Dine, T.; Ballester, L.; Cazin, M.; Cazin, J.C. A Simple Method for Isolating Human and Rabbit Polymorphonuclear Neutrophils(PMNs).. Biol. Pharm. Bull. 2000, 23, 1382–1383. [CrossRef]
- Leroux, C.; Cuccato, M.; Pawłowski, K.; Cannizzo, F.T.; Sacchi, P.; Pires, J.A.A.; Faulconnier, Y. Milk fat miRNome changes in response to LPS challenge in Holstein cows. Veter- Res. 2023, 54, 1–10. [CrossRef]
- Fei, Y.; Gai, Y.; Liao, Q.; Zhang, L.; Li, Z.; Li, B.; Bai, M.; Li, N.; Deng, L. An Integrated Analysis of Lactation-Related miRNA and mRNA Expression Profiles in Donkey Mammary Glands. Genes 2022, 13, 1637. [CrossRef]
- He, X.; Cheng, X.; Ding, J.; Xiong, M.; Chen, B.; Cao, G. Hyperglycemia induces miR-26-5p down-regulation to overexpress PFKFB3 and accelerate epithelial–mesenchymal transition in gastric cancer. Bioengineered 2022, 13, 2902–2917. [CrossRef]
- Uttamani, J.R.; Naqvi, A.R.; Estepa, A.M.V.; Kulkarni, V.; Brambila, M.F.; Martínez, G.; Chapa, G.; Wu, C.D.; Li, W.; Rivas-Tumanyan, S.; et al. Downregulation of miRNA-26 in chronic periodontitis interferes with innate immune responses and cell migration by targeting phospholipase C beta 1. J. Clin. Periodontol. 2022, 50, 102–113. [CrossRef]
- Tzelos, T.; Lee, S.; Pegg, A.; Donadeu, F.X. Association between blood miR-26a levels following artificial insemination, and pregnancy outcome in dairy cattle. PLOS ONE 2023, 18, e0289342. [CrossRef]
- Di Mauro, S.; Filipe, J.; Facchin, A.; Roveri, L.; Addis, M.F.; Monistero, V.; Piccinini, R.; Sala, G.; Pravettoni, D.; Zamboni, C.; et al. The secretome of Staphylococcus aureus strains with opposite within-herd epidemiological behavior affects bovine mononuclear cell response. Veter- Res. 2023, 54, 1–9. [CrossRef]
- Lu, J.; Gu, B.; Lu, W.; Liu, J.; Lu, J. miR-142-5p regulates lipopolysaccharide-induced bovine epithelial cell proliferation and apoptosis via targeting BAG5. Exp. Ther. Med. 2021, 22, 1–11. [CrossRef]
- Hue, D.T.; Petrovski, K.; Chen, T.; Williams, J.L.; Bottema, C.D. Analysis of immune-related microRNAs in cows and newborn calves. J. Dairy Sci. 2023, 106, 2866–2878. [CrossRef]
- Sun, J.; Aswath, K.; Schroeder, S.G.; Lippolis, J.D.; Reinhardt, T.A.; Sonstegard, T.S. MicroRNA expression profiles of bovine milk exosomes in response to Staphylococcus aureus infection. BMC Genom. 2015, 16, 1–10. [CrossRef]
- Wang, X.-P.; Luoreng, Z.-M.; Zan, L.-S.; Li, F.; Li, N. Bovine miR-146a regulates inflammatory cytokines of bovine mammary epithelial cells via targeting the TRAF6 gene. J. Dairy Sci. 2017, 100, 7648–7658. [CrossRef]
- Wang, X.P.; Luoreng, Z.M.; Zan, L.S.; Raza, S.H.A.; Li, F.; Li, N.; Liu, S. Expression patterns of miR-146a and miR-146b in mastitis infected dairy cattle. Mol. Cell. Probes 2016, 30, 342–344. [CrossRef]
- Johnnidis, J.B.; Harris, M.H.; Wheeler, R.T.; Stehling-Sun, S.; Lam, M.H.; Kirak, O.; Brummelkamp, T.R.; Fleming, M.D.; Camargo, F.D. Regulation of progenitor cell proliferation and granulocyte function by microRNA-223. Nature 2008, 451, 1125–1129. [CrossRef]
- Li, L.; Huang, J.; Zhang, X.; Ju, Z.; Qi, C.; Zhang, Y.; Li, Q.; Wang, C.; Miao, W.; Zhong, J.; Hou, M.; Hang, S. One SNP in the 3'-UTR of HMGB1 gene affects the binding of target bta-miR-223 and is involved in mastitis in dairy cattle. Immunogenetics 2012, 64(11), 817–824.
- Jiao, P.; Wang, X.-P.; Luoreng, Z.-M.; Yang, J.; Jia, L.; Ma, Y.; Wei, D.-W. miR-223: An Effective Regulator of Immune Cell Differentiation and Inflammation. Int. J. Biol. Sci. 2021, 17, 2308–2322. [CrossRef]
- Yan, Y.; Lu, K.; Ye, T.; Zhang, Z. MicroRNA 223 attenuates LPS induced inflammation in an acute lung injury model via the NLRP3 inflammasome and TLR4/NF κB signaling pathway via RHOB. Int. J. Mol. Med. 2019, 43(3), 1467–1477.
- Valmiki, S.; Ahuja, V.; Puri, N.; Paul, J. miR-125b and miR-223 Contribute to Inflammation by Targeting the Key Molecules of NFκB Pathway. Front. Med. 2020, 6, 313. [CrossRef]
- Jiao, P.; Wang, J.; Yang, J.; Wang, X.; Luoreng, Z. Bta-miR-223 Targeting the RHOB Gene in Dairy Cows Attenuates LPS-Induced Inflammatory Responses in Mammary Epithelial Cells. Cells 2022, 11(19), 3144.
- Zhou, M.; Barkema, H.W.; Gao, J.; Yang, J.; Wang, Y.; Kastelic, J.P.; Khan, S.; Liu, G.; Han, B. MicroRNA miR-223 modulates NLRP3 and Keap1, mitigating lipopolysaccharide-induced inflammation and oxidative stress in bovine mammary epithelial cells and murine mammary glands. Veter- Res. 2023, 54, 1–14. [CrossRef]
- Ifergan, I.; Chen, S.; Zhang, B.; Miller, S.D. Cutting Edge: MicroRNA-223 Regulates Myeloid Dendritic Cell–Driven Th17 Responses in Experimental Autoimmune Encephalomyelitis. J. Immunol. 2016, 196, 1455–1459. [CrossRef]
- Mohajeri, M.; Banach, M.; Atkin, S.L.; Butler, A.E.; Ruscica, M.; Watts, G.F.; Sahebkar, A. MicroRNAs: Novel Molecular Targets and Response Modulators of Statin Therapy. Trends Pharmacol. Sci. 2018, 39, 967–981. [CrossRef]
- Sun, Y.; Liu, M.-W.; Zhao, Y.-H.; Lu, Y.-X.; Wang, Y.-A.; Tong, C.-W. BAICALIN ATTENUATES LIPOPOLYSACCHARIDE-INDUCED RENAL TUBULAR EPITHELIAL CELL INJURY BY INHIBITING THE TXNIP/NLRP3 SIGNALLING PATHWAY VIA INCREASING miR-223-3p EXPRESSION. JBRHA 2020, 34, 69–82.
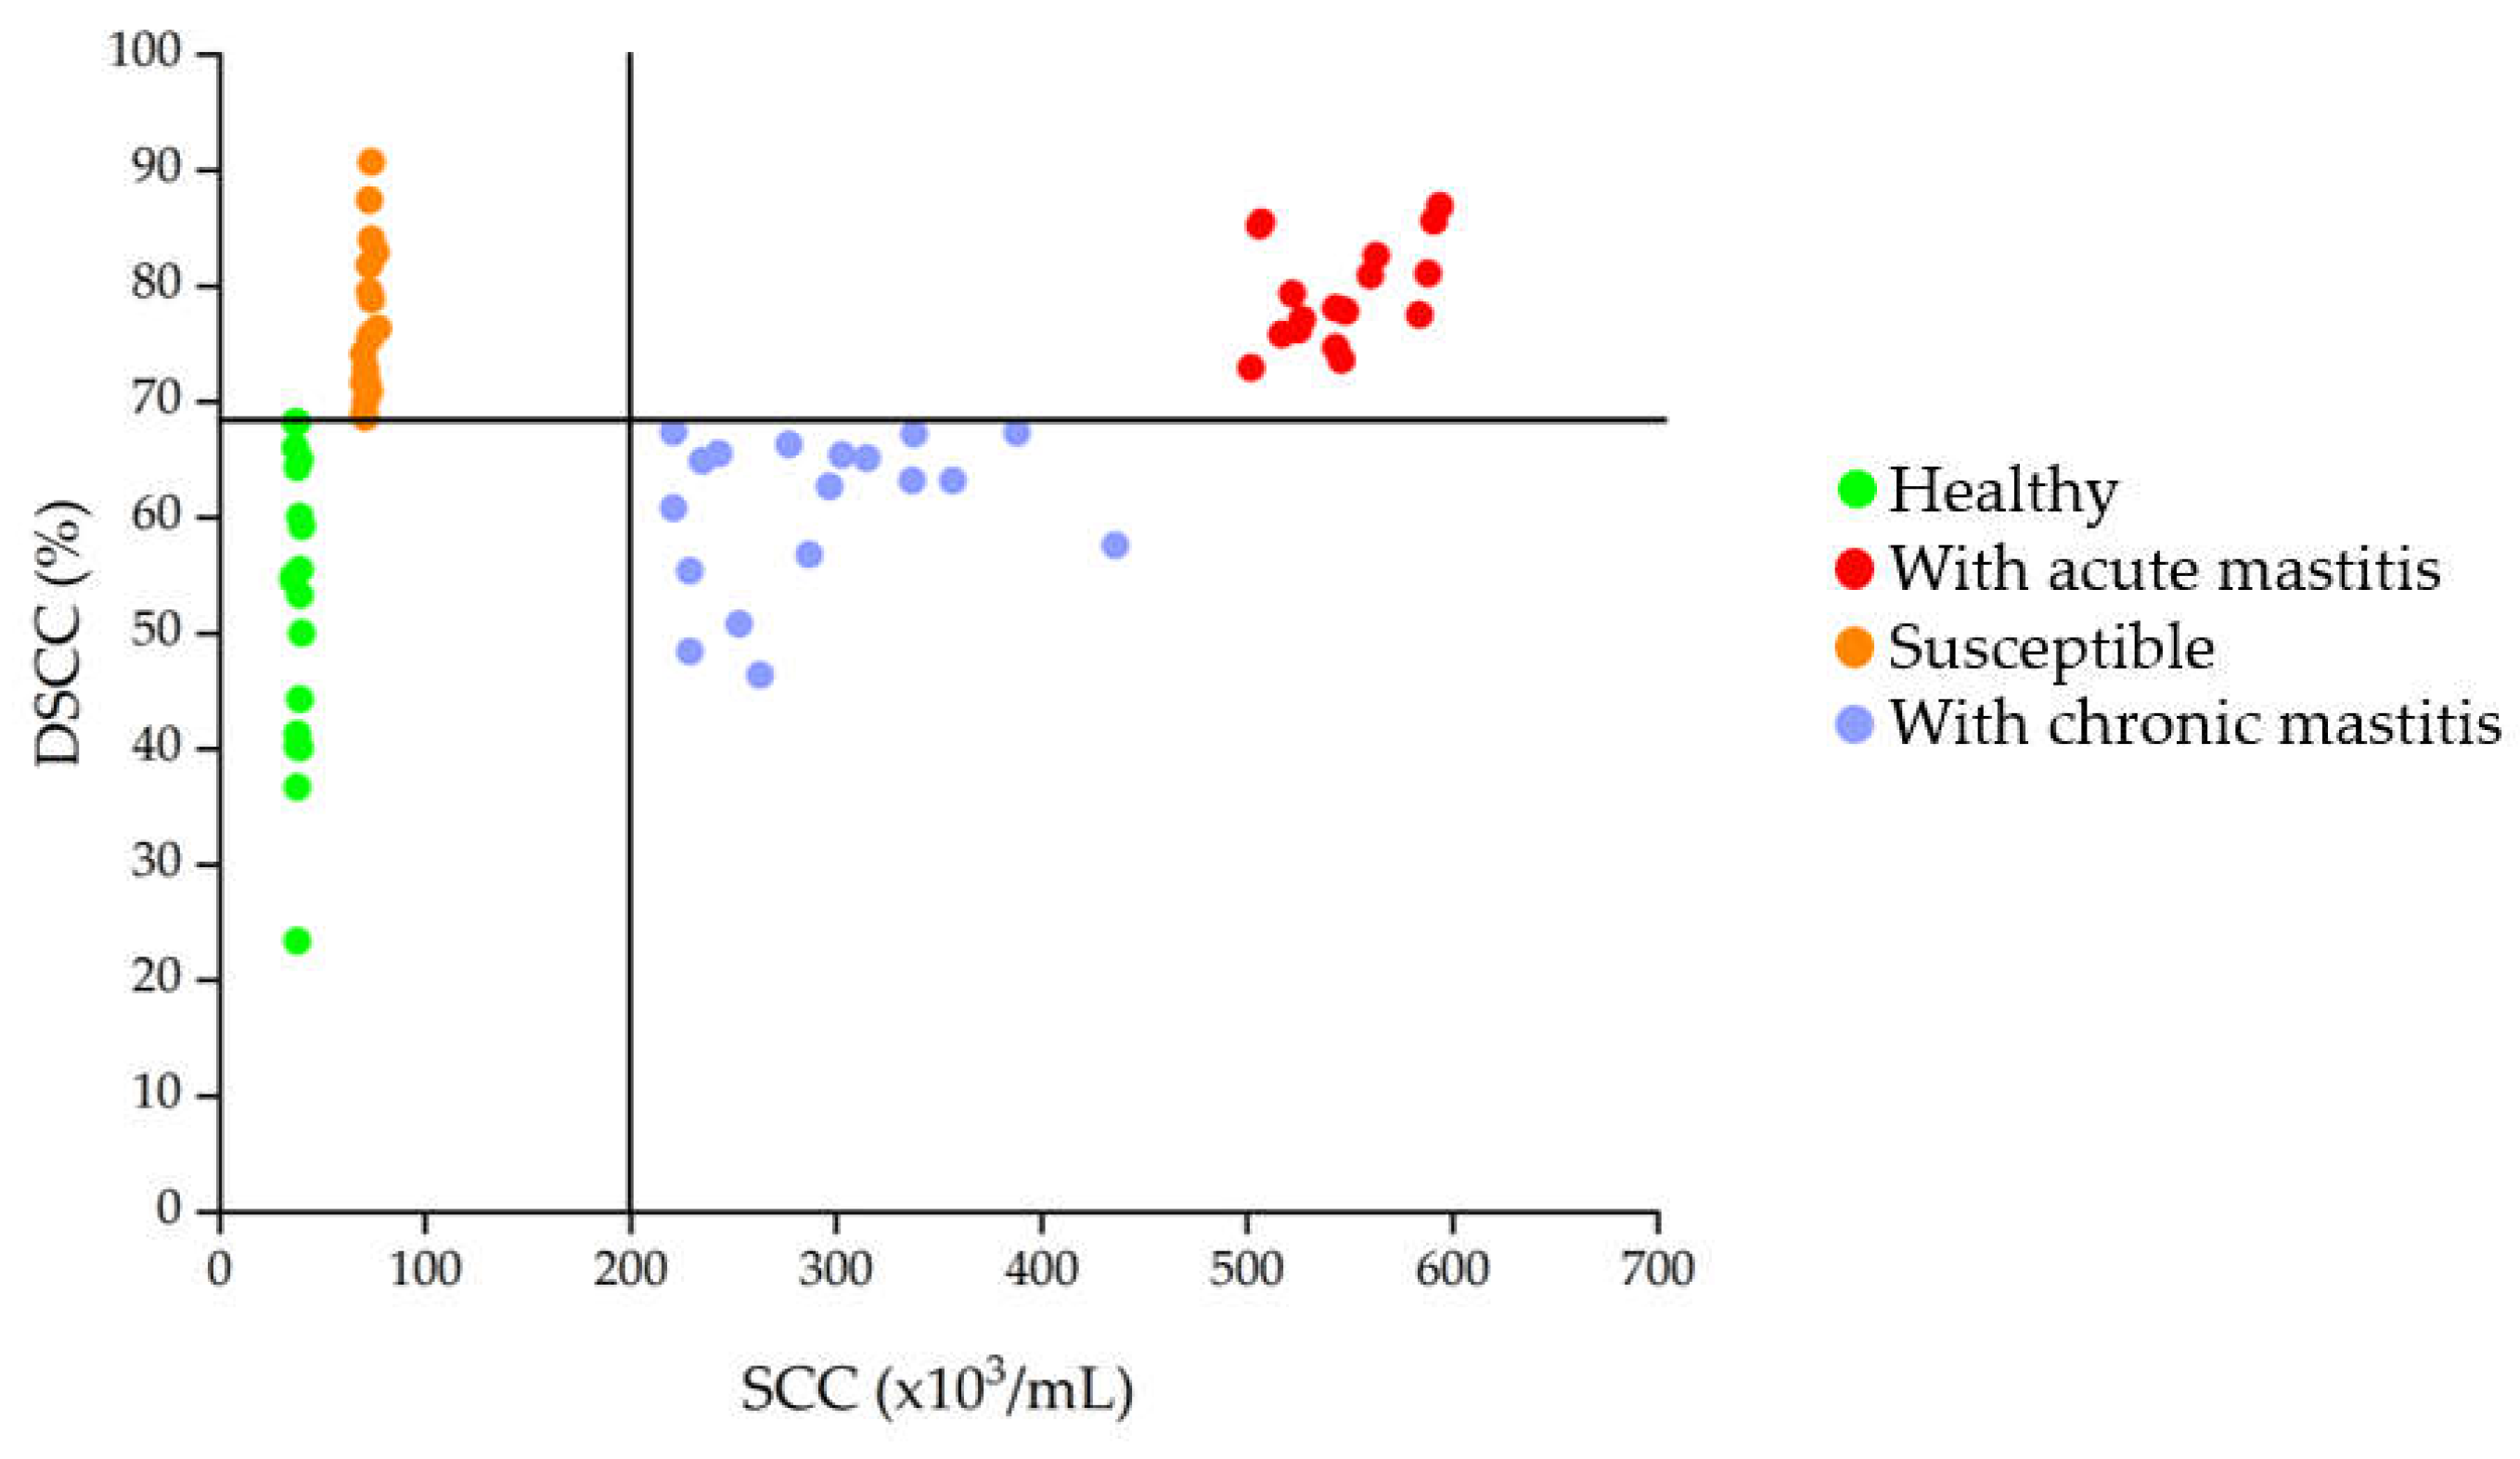

| Group | SCC value (cells/mL) | DSCC value (%) | Description |
| CTRL | < 2 x 10⁵ | < 68.5 | Indicative values of absence of inflammation |
| SU | < 2 x 10⁵ | > 68.5 | Indicative values of initial inflammation resulting in increased susceptibility to mastitis |
| AM | > 2 x 10⁵ | > 68.5 | Indicative values of acute inflammatory state |
| CM | > 2 x 10⁵ | < 68.5 | Indicative values of a chronic decease |
| Group | Parity | Days in milk (d) | Milk yield (kg/d) |
| CTRL | 2,83 ± 1.34 | 184 ± 108 | 13,75 ± 4.81 |
| SU | 2,56 ± 1.34 | 205 ± 118 | 12,44 ± 3.79 |
| AM | 3,00 ± 2.14 | 181 ± 117 | 11,36 ± 4.38 |
| CM | 2,72 ± 1.93 | 217 ± 107 | 10,53 ± 3.84 |
| Group | Fat (%) | Protein (%) | Casein (%) | Lactose (%) | SCC (cells/mL) | DSCC (%) |
| CTRL | 4.06 | 3.70 | 2.95 | 4.85 | 0.38 x 10⁵ ± 0.01 | 52.52 |
| SU | 4.08 | 3.72 | 2.96 | 4.84 | 0.73 x 10⁵ ± 0.02 | 76.73 |
| AM | 4.08 | 3.78 | 2.98 | 4.65 | 5.45 x 10⁵ ± 0.30 | 79.37 |
| CM | 4.39 | 3.98 | 3.15 | 4.62 | 2.91 x 10⁵ ± 0.62 | 60.80 |
Disclaimer/Publisher’s Note: The statements, opinions and data contained in all publications are solely those of the individual author(s) and contributor(s) and not of MDPI and/or the editor(s). MDPI and/or the editor(s) disclaim responsibility for any injury to people or property resulting from any ideas, methods, instructions or products referred to in the content. |
© 2025 by the authors. Licensee MDPI, Basel, Switzerland. This article is an open access article distributed under the terms and conditions of the Creative Commons Attribution (CC BY) license (http://creativecommons.org/licenses/by/4.0/).


