1. Introduction
The concept of territorial cohesion has evolved significantly since its inception, becoming a cornerstone of spatial planning and regional development policies. Initially introduced in the European policy framework during the late 1990s, territorial cohesion emerged as a response to growing concerns about disparities in development, social inequality, and regional imbalances. It emphasizes the need to foster more balanced development across regions by enhancing economic performance, promoting social inclusion, and ensuring sustainable use of resources [
1]. As a multidimensional concept, territorial cohesion extends beyond economic metrics to encompass social, cultural, and environmental dimensions, aligning with broader goals of sustainability and equity [
2].
One of the primary challenges of operationalizing territorial cohesion lies in its measurement. Territorial cohesion encompasses diverse and interrelated elements, including economic competitiveness, social equity, environmental sustainability, and spatial connectivity [
3]. Developing metrics that adequately capture these dimensions while accounting for territorial diversity is a complex task. Traditional indicators, such as GDP per capita or employment rates, often fail to reflect the nuanced realities of territorial dynamics, particularly in peripheral and rural areas [
4]. Moreover, data limitations, such as a lack of spatially disaggregated or longitudinal data, further complicate the measurement process [
5]. Despite these challenges, robust metrics are essential to identify territorial disparities, monitor progress, and design effective interventions [
6].
Recent research has sought to address these measurement challenges through innovative methodologies, including composite indices, spatial econometrics, and participatory approaches [
7]. Composite indices, for instance, aggregate multiple indicators into a single measure, offering a holistic perspective on territorial cohesion. However, their construction requires careful consideration of indicator selection, weighting, and normalization to avoid misrepresentation or bias [
8]. Spatial econometrics, on the other hand, allows researchers to analyze spatial relationships and dependencies, shedding light on patterns of convergence or divergence across regions [
9]. Participatory approaches engage stakeholders in defining territorial priorities and evaluating cohesion, ensuring that metrics align with local realities and aspirations [
10].
Territorial cohesion is integral to territorializing public policies—an approach that tailors policy interventions to the specific characteristics, resources, and needs of different regions. By recognizing and leveraging the unique attributes of each territory, territorialized policies can foster inclusive and sustainable development [
11]. This approach aligns with the principles of place-based development, which emphasize local agency, endogenous resources, and community participation [
12]. For example, policies promoting renewable energy production in wind-rich regions or cultural tourism in areas with rich heritage can generate economic benefits while respecting territorial identity and values [
13].
The importance of territorializing public policies is particularly evident in the European Union’s cohesion policy, which aims to reduce regional disparities and promote harmonious development across member states. The policy’s place-based approach prioritizes investment in less-developed regions, urban-rural linkages, and cross-border cooperation, recognizing the diversity of territorial challenges and opportunities [
14]. Similarly, the OECD’s Territorial Outlook underscores the need for integrated policies that address economic, social, and environmental dimensions, ensuring alignment with the United Nations Sustainable Development Goals (SDGs) [
15].
Territorial cohesion also contributes to the well-being of communities by addressing inequalities and enhancing quality of life. By reducing disparities in access to services, infrastructure, and opportunities, territorial cohesion policies promote social inclusion and resilience [
16]. Moreover, fostering territorial identity and community engagement strengthens social capital, enhancing collective capacity to address challenges and seize opportunities [
17]. For instance, initiatives such as participatory budgeting or local development strategies enable communities to influence decision-making processes, ensuring that policies reflect public expectations and aspirations [
18].
Despite its relevance, achieving territorial cohesion faces several barriers, including institutional fragmentation, resource constraints, and conflicting interests. Institutional fragmentation—both vertically (across government levels) and horizontally (across sectors)—often hampers policy coherence and integration [
19]. Addressing this requires robust governance frameworks that facilitate coordination, cooperation, and stakeholder engagement [
20]. Resource constraints, particularly in less-developed regions, limit the capacity to implement territorialized policies effectively. Innovative financing mechanisms, such as public-private partnerships or EU structural funds, can help address these limitations [
21]. Conflicting interests among stakeholders, such as between economic development and environmental preservation, necessitate inclusive and transparent decision-making processes that balance competing priorities [
22].
Territorial cohesion is not only a policy objective but also a dynamic process that evolves with changing societal needs, environmental challenges, and technological advancements. The COVID-19 pandemic, for instance, has highlighted the importance of resilience and adaptability in territorial cohesion policies. Remote work, digitalization, and shifts in mobility patterns have reshaped spatial dynamics, presenting both challenges and opportunities for territorial cohesion [
23]. Similarly, the transition to a green economy and the pursuit of climate neutrality require policies that address spatial disparities while promoting sustainable practices [
24].
Looking ahead, advancing territorial cohesion will require innovative approaches that integrate quantitative and qualitative insights, foster multi-level governance, and embrace territorial diversity. Collaborative platforms, such as territorial observatories or regional forums, can facilitate knowledge exchange and joint action among stakeholders [
25]. Moreover, leveraging emerging technologies, such as geographic information systems (GIS) or big data analytics, can enhance the capacity to monitor and evaluate territorial cohesion [
26]. By embracing these innovations, policymakers can design and implement interventions that not only reduce disparities but also enhance the well-being and resilience of communities [
27].
Territorial cohesion remains a critical objective for promoting balanced, inclusive, and sustainable development. While measuring territorial cohesion poses significant challenges, advances in methodologies and participatory approaches offer promising pathways for capturing its complexity. Territorializing public policies, informed by territorial values, resources, and public expectations, is essential for fostering development and well-being. By addressing institutional, financial, and societal barriers, and by leveraging opportunities such as digitalization and the green transition, policymakers can ensure that territorial cohesion contributes to a more equitable and resilient future.
The proposed research introduces a novel methodology to evaluate territorial cohesion by identifying six critical dimensions of territorial development: demography, equity, competitiveness, governance, sustainability, and connectivity. This innovative approach integrates multiple indicators to create a comprehensive territorial assessment framework. Utilizing data from diverse sources and leveraging tools such as ArcMap for geographic analysis, the methodology ensures a nuanced understanding of territorial dynamics. The normalization method applied, prioritizing equal weighting and avoiding biases from variable magnitudes, allows for a fair comparison across municipalities. This study's focus on Portugal as a case study underscores its utility in addressing the country deep-rooted spatial asymmetries.
This research stands out from existing studies by not merely measuring quality of life but also emphasizing the territorial processes that influence cohesion. Most methodologies addressing quality of life focus on socio-economic indicators without integrating dimensions such as governance, sustainability, or connectivity. The inclusion of these dimensions enhances the scope of analysis and provides insights into how spatial structures influence development outcomes. Furthermore, by using normalization over standardization, the methodology accommodates non-Gaussian distributions typical of territorial datasets, ensuring the robustness of results. These contributions advance the territorialization of public investments and policies, providing a granular framework for tailoring interventions to the unique strengths and challenges of specific regions.
The study significantly contributes to the territorialization of public policies by offering actionable insights into regional disparities and potentials. For policymakers, understanding the varying performances of municipalities in areas such as demographic stability, equitable access to services, or sustainable practices enables the design of more targeted interventions. For instance, policies promoting population retention in inland areas or improving connectivity in isolated regions can be more precisely calibrated. Moreover, the governance dimension highlights the importance of participatory frameworks and fiscal management in fostering local resilience. This methodology supports aligning public investments with territorial values, resources, and public expectations, enhancing policy effectiveness and community well-being.
By advancing the understanding of territorial cohesion, this research provides valuable tools for scholars and practitioners in regional planning and development. Its case-study approach demonstrates how a robust, multi-dimensional framework can elucidate complex spatial dynamics. Additionally, the findings offer a replicable model for other regions with similar challenges, extending its relevance beyond Portugal. The innovative integration of diverse dimensions and rigorous methodological design ensures that this study not only addresses existing knowledge gaps but also sets a new benchmark in evaluating and promoting territorial cohesion globally.
2. Materials and Methods
To analyse demographic, social, economic, and territorial dynamics, various indicators were collected using data from the National Statistics Institute (INE), the Directorate-General for Territory (DGT), municipal websites, and official reports. Demographic data after 2021 corresponds to Provisional Estimates of Resident Population—post-census estimates based on the 2021 Census results. The data presented do not include the revision of the Provisional Estimates of Resident Population conducted in June 2024 (which includes displaced persons from Ukraine benefiting from the Temporary Protection regime in Portugal). Part of this information was analysed using ArcMap, a GIS software by ESRI. Six analytical profiles are proposed, each evaluated with several simple and composite indicators. The methodology assumes equal weighting for all indicators, based on an indicator normalisation methodology.
Normalisation methods allow the transformation of any element within a class of equivalence of forms or data under a group of geometric transformations into a specific form, fixed for each class. This data transformation ensures that the final algorithm (municipal performance profiles) is not biased by variables with a greater order of magnitude. The approach was based on normalisation rather than standardisation, as the value distribution is not Gaussian, and standardising the variables would result in a mean of 0 and a standard deviation of 1. In contrast, the normalisation exercise aims to place the variables within a range of 0 to 1, or between -1 and 1 if there are negative results. The formula used for data normalisation relies on the minimum and maximum values of each indicator, with the final value calculated as follows:
x = (x - xmin) / (xmax - xmin).
The results made it possible to identify trends and compare the performance of municipalities based on demographic, equity, competitiveness, connectivity, governance, and sustainability criteria. A general profile is analysed for each of the six themes, ranked into seven levels that consider the country's average performance: average values, similar to those observed in Portugal (95%-105% of the national average); three groups below the national average (<75%; 75%-85%; 85%-95%); and three groups above the national average (>125%; 115%-125%; 105%-115%). In this exercise, all indicators are normalised, with the maximum value (positive) representing the nominal value of one.
The six analysed themes were calculated as follows:
A. Demography
Demography is measured through a composite indicator:
i) Demographic and social dynamics.
The demographic dynamics index (IDD) measures the capacity to retain and stabilise the resident population, calculated as follows:
IDD = VP + N + M + E + PA
where:
VP = Population growth, measured through the indicator [Rate of population change (‰)]
N = Demographic dynamics, measured through the indicator [Crude birth rate (‰) average over the last five years]
M = Migration dynamics, measured through the indicator [Average migration growth rate (%) over the last five years]
E = Social dynamics, measured through the indicator [Aging index (Nº)]
PA = Active population retention, measured through the indicator [Renewal index of the working-age population (Nº)]
B. Equity
Equity (EQU) of a territory is measured through three composite indicators:
i) Access to goods and services; ii) Demographic and social dynamics; iii) Social and economic inequality.
Thus:
EQU = IABS + IDDS - IDSE
The access to goods and services index (IABS) measures a resident's ability to access education, health, housing, and employment, calculated as:
IABS = ED + S - H + E
where:
ED = Access to education, measured through the indicator [Gross pre-school enrolment rate (%)]
S = Access to health, measured through the indicator [Doctors per 1000 inhabitants (Nº)]
H = Access to housing, measured by considering the number of years a couple needs to purchase a new house, assuming 60% of their income is allocated to housing costs, using the indicator [Average property value (€) / ((Average monthly income x 2 x 14) x 60/100)]
E = Access to employment, measured through the indicator [Employment rate (%)]
The social dynamics index (IDS) measures aspects of social capital, such as qualifications, employability, and financial return, calculated as:
IDS = ES + A + R + D
where:
ES = Higher qualifications, measured through the indicator [Proportion of residents aged 30-34 with at least higher education (%)]
A = Lack of qualifications, measured through the indicator [Illiteracy rate (%)]
R = Income, measured through the indicator [Average monthly income (Nº)]
D = Employment dynamics, measured through the indicator [Unemployment rate (%)]
The social and economic inequality index (IDSE) measures aspects of municipal social cohesion, such as dependence on social benefits, wage disparities, or insecurity, calculated as:
IDSE = AS + DS + I + PC
where:
AS = Social benefits dependency, measured through the indicator [Recipients of social integration income per 1000 active-age residents (‰)]
DS = Wage disparities, measured through the indicator [Disparity in average monthly income (by educational level - %) of employed population]
I = Insecurity, measured through the indicator [Crime rate (‰)]
PC = Purchasing power, measured through the indicator [Per capita purchasing power (PT = 100)]
C. Competitiveness
Competitiveness (COM) of a territory is measured through three composite indicators:
i) Productivity; ii) Business dynamics; iii) Innovation, knowledge, and development.
Thus:
COM = IPr + IDE + IICD
The productivity index (IPr) measures a territory's productive capacity, calculated as:
IPr = PR + EX + VN
where:
PR = Business productivity, measured through the indicator [Gross value added (€) per company]
EX = Export importance, measured through the indicator [(Exports – Imports of goods and services (€)) / Companies (Nº)]
VN = Diversification of productive activity, measured through the indicator [Concentration of turnover in the four largest companies (%)]
The business dynamics index (IDE) measures various aspects of economic activity, such as the vitality and diversification of the business fabric, calculated as:
IDE = VIT + DGE + GE + DE
where:
VIT = Business vitality, measured through the indicator [Survival rate (%) of companies created 2 years earlier]
DGE = Dependence on large companies for employment, measured through the indicator [Concentration of staff in the four largest companies (%)]
GE = Presence of large companies, measured through the indicator [Proportion of large companies in total companies (%)]
DE = External employment dependency, measured through the indicator [Residents employed outside the municipality (%)]
The innovation, knowledge, and development index (IICD) measures issues associated with the qualifications of the employed population and employment in research, knowledge, and ICT, calculated as:
IICD = TCID + TQ
where:
TCID = Workers in communication, research, and development, measured through the indicator [Proportion of workers employed in information, communication, or research and development activities (%)]
TQ = Qualified workers, measured through the indicator [Proportion of employed population with higher education (%)]
D. Governance
(Good) Governance (GOV) of a territory is measured through two indicators:
i) Financial management; ii) Participation.
Thus:
GOV = IGF + P
The financial management index (IGF) measures municipal financial performance, including sustainability and investment capacity, calculated as:
IGF = IF + CI + END
where:
IF = Municipal financial independence, measured through the indicator [Proportion of own revenues in total municipal revenues (%)]
CI = Investment capacity limitation, measured through the indicator [Personnel expenses as a proportion of total expenses (%)]
END = Debt per inhabitant, measured through the indicator [Municipal debt per capita (€)]
P = Participation, analysed through the participation of resident voters in the most recent municipal elections, measured using the indicator [Abstention rate in municipal elections (%)]
E. Sustainability
Sustainability (S) of a territory is measured through three composite indicators:
i) Promotion and protection of the environment; ii) Individual and collective behaviours; iii) Pressure on the territory.
Thus:
S = IPDMA + ICIC + IPT
The municipal environmental protection and defense index (IPDMA) measures municipal involvement in protecting and enhancing the environment, calculated as:
IPDMA = GR + PB
where:
GR = Waste management, measured through the indicator [Municipal waste management expenses per 1000 inhabitants (€)]
PB = Biodiversity protection, measured through the indicator [Municipal biodiversity and landscape protection expenses per 1000 inhabitants (€)]
The individual and collective behaviours index (ICIC) measures the involvement of various agents (public, private, civil society, and third sector) in environmental protection and enhancement, calculated as:
ICIC = SR + CE + EA
where:
SR = Waste separation, measured through the indicator [Proportion of selectively collected urban waste (%)]
CE = Energy consumption, measured through the indicator [Domestic electricity consumption per inhabitant (kWh)]
EA = Environmental companies, measured through the indicator [Companies in water, waste management, and pollution sectors (%)]
The territorial pressure index (IPT) measures the density and concentration of population distribution, calculated as:
IPT = DP + POV
where:
DP = Density, measured through the indicator [Population density (inh./km²)]
POV = Settlement dispersion, measured through the indicator [Proportion of residents in settlements with less than 2000 inhabitants (%)]
F. Connectivity
Connectivity (CO) of a territory is measured through two indicators:
i) Communications; ii) Mobility.
Thus:
CO = CD + IMI
CD = Digital connectivity, measured through the indicator [Fixed broadband internet access per 100 inhabitants (Nº)]
The individual mobility index (IMI) measures daily circulation patterns, calculated as:
IMI = TC + DP
where:
TC = Use of public transport, measured through the indicator [Proportion of employed or student residents using public transport for commuting (%)]
DP = Average commuting duration, measured through the indicator [Average commuting duration (minutes) of employed or student residents]
3. Results
This section may be divided by subheadings. It should provide a concise and precise description of the experimental results, their interpretation, as well as the experimental conclusions that can be drawn.
3.1. Demography
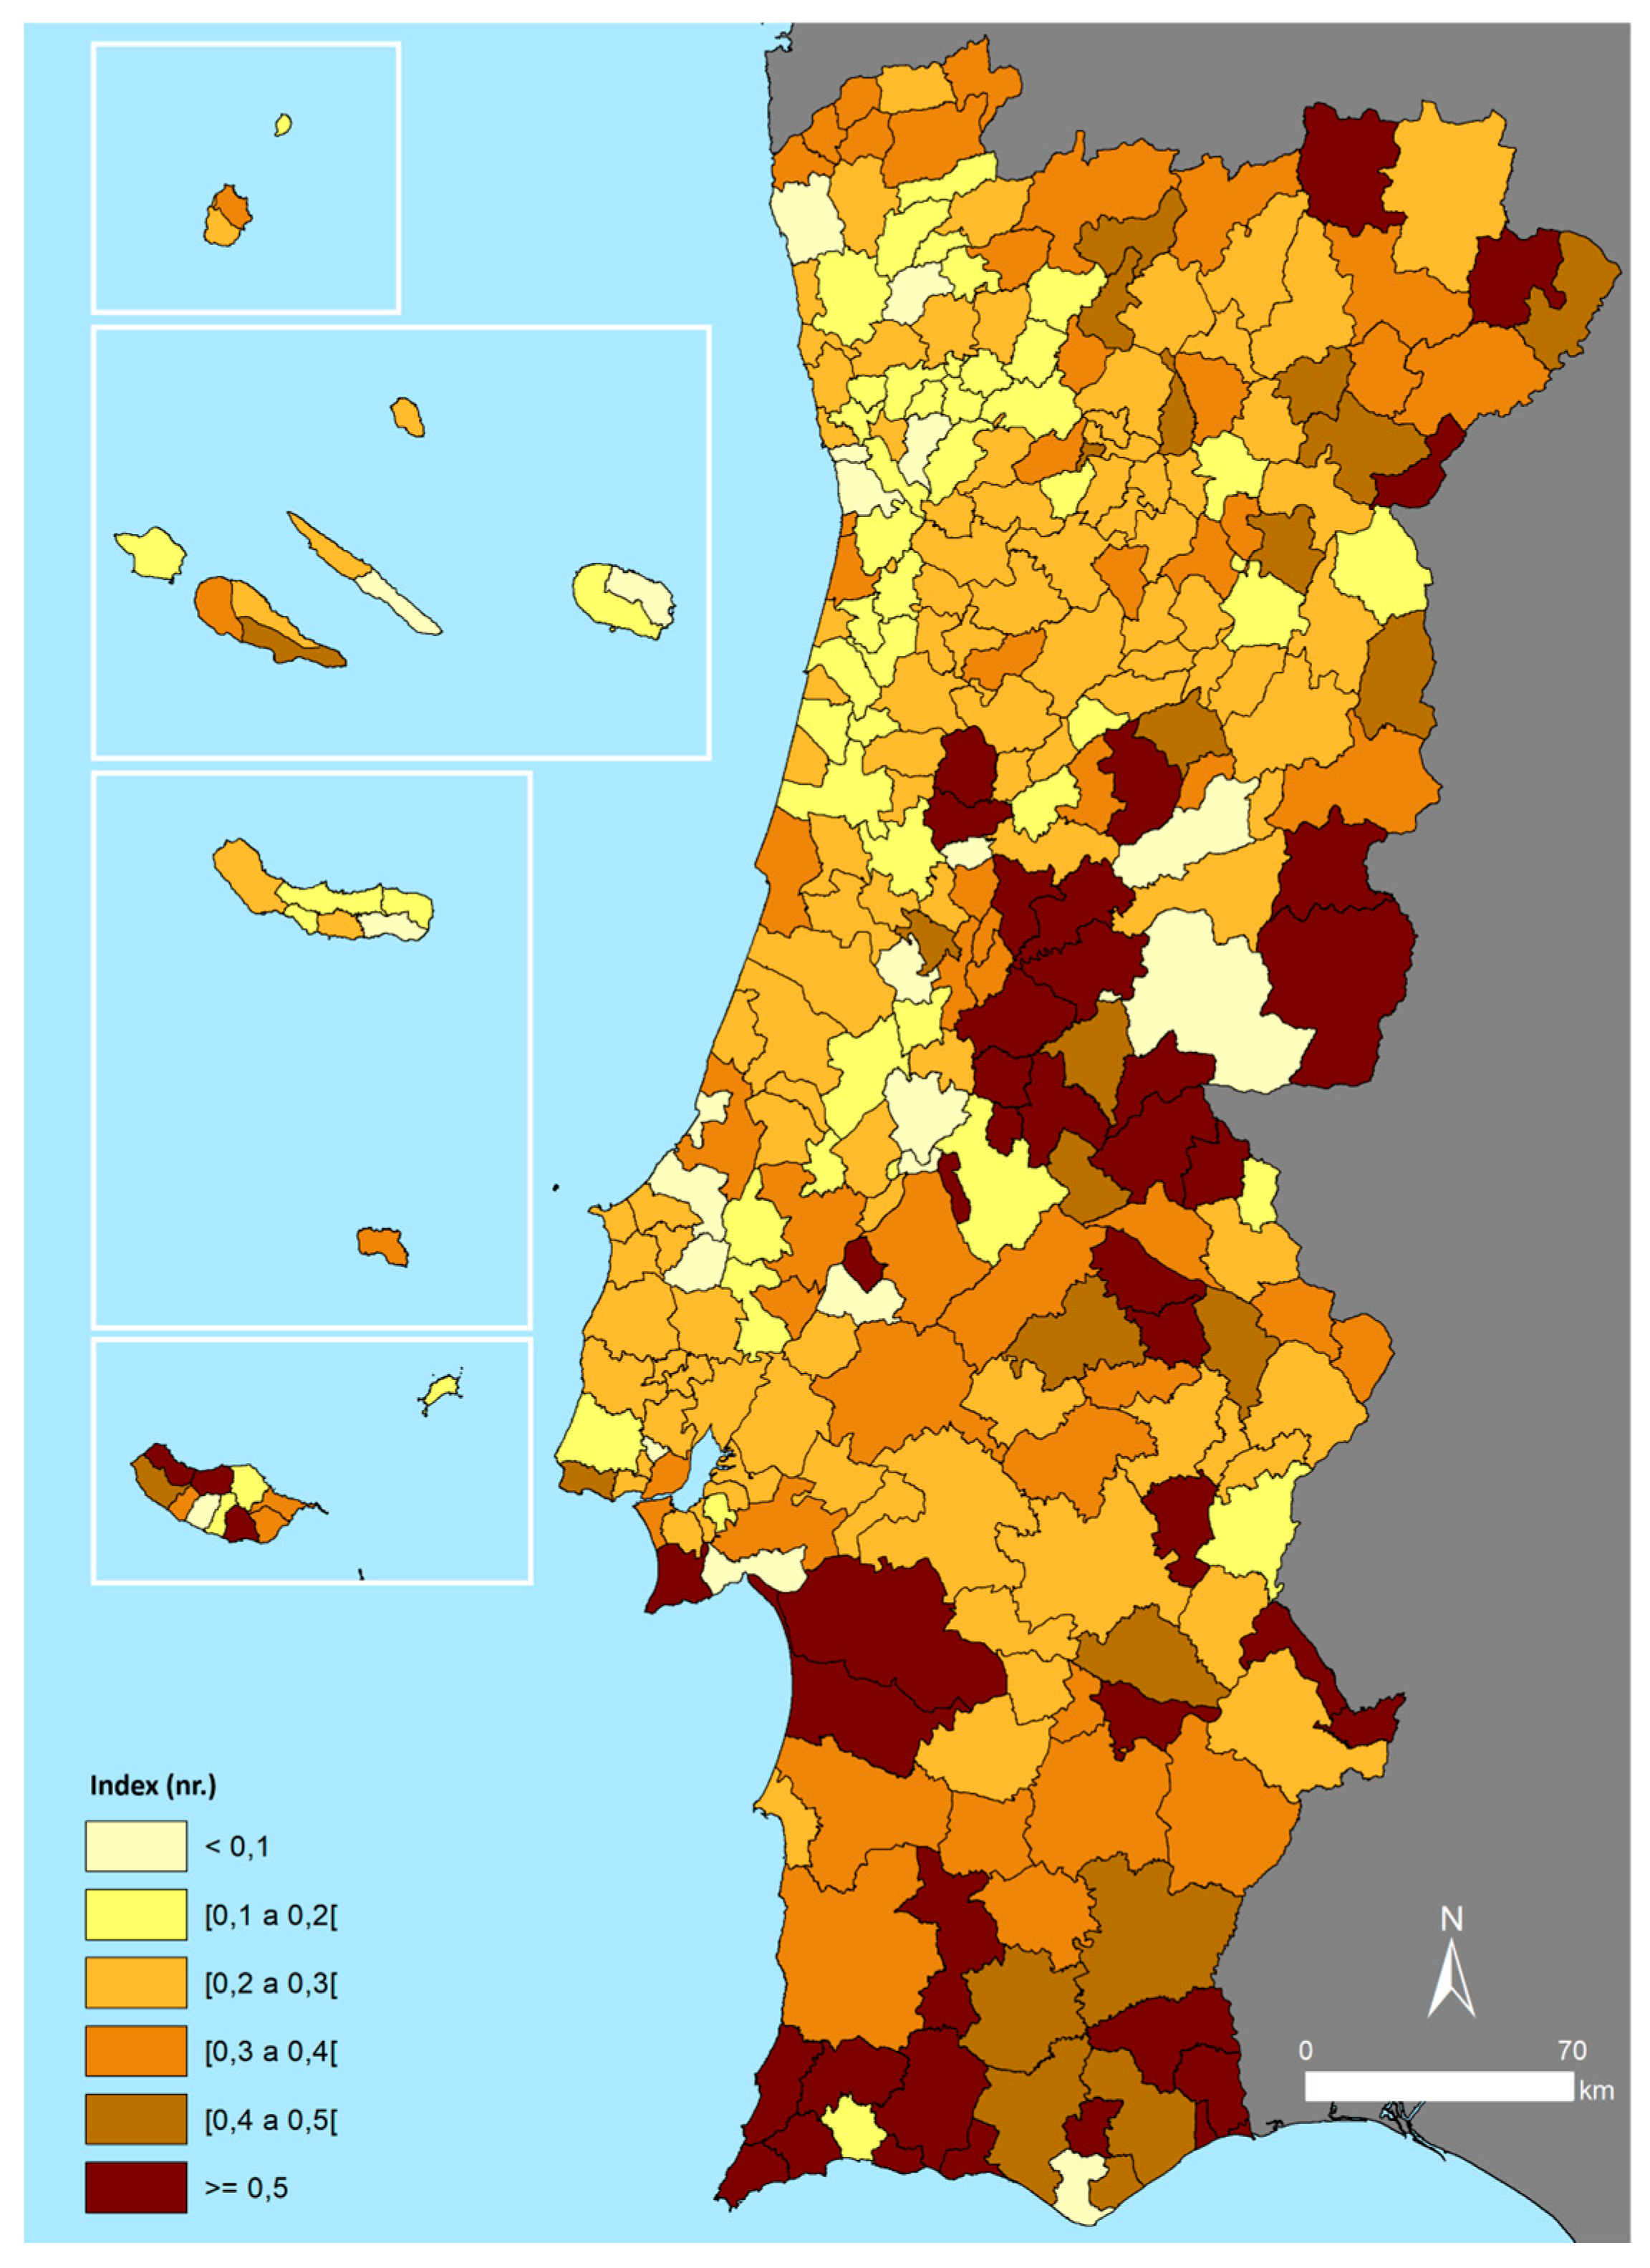
Portugal exhibits a deeply asymmetrical demographic profile, characterized by significant differences between a small number of municipalities with positive dynamics (79) and a vast majority of councils (229) immersed in a demographic decline, often termed by government structures as a 'demographic winter' (
Figure 1). These spatial inequalities translate into a territorial mosaic where the strong population dynamism of the Lisbon Metropolitan Area stands out, and to a more moderate extent, some Algarve municipalities, coastal cities, or municipalities with a strong attraction capability, such as Braga or Odemira.
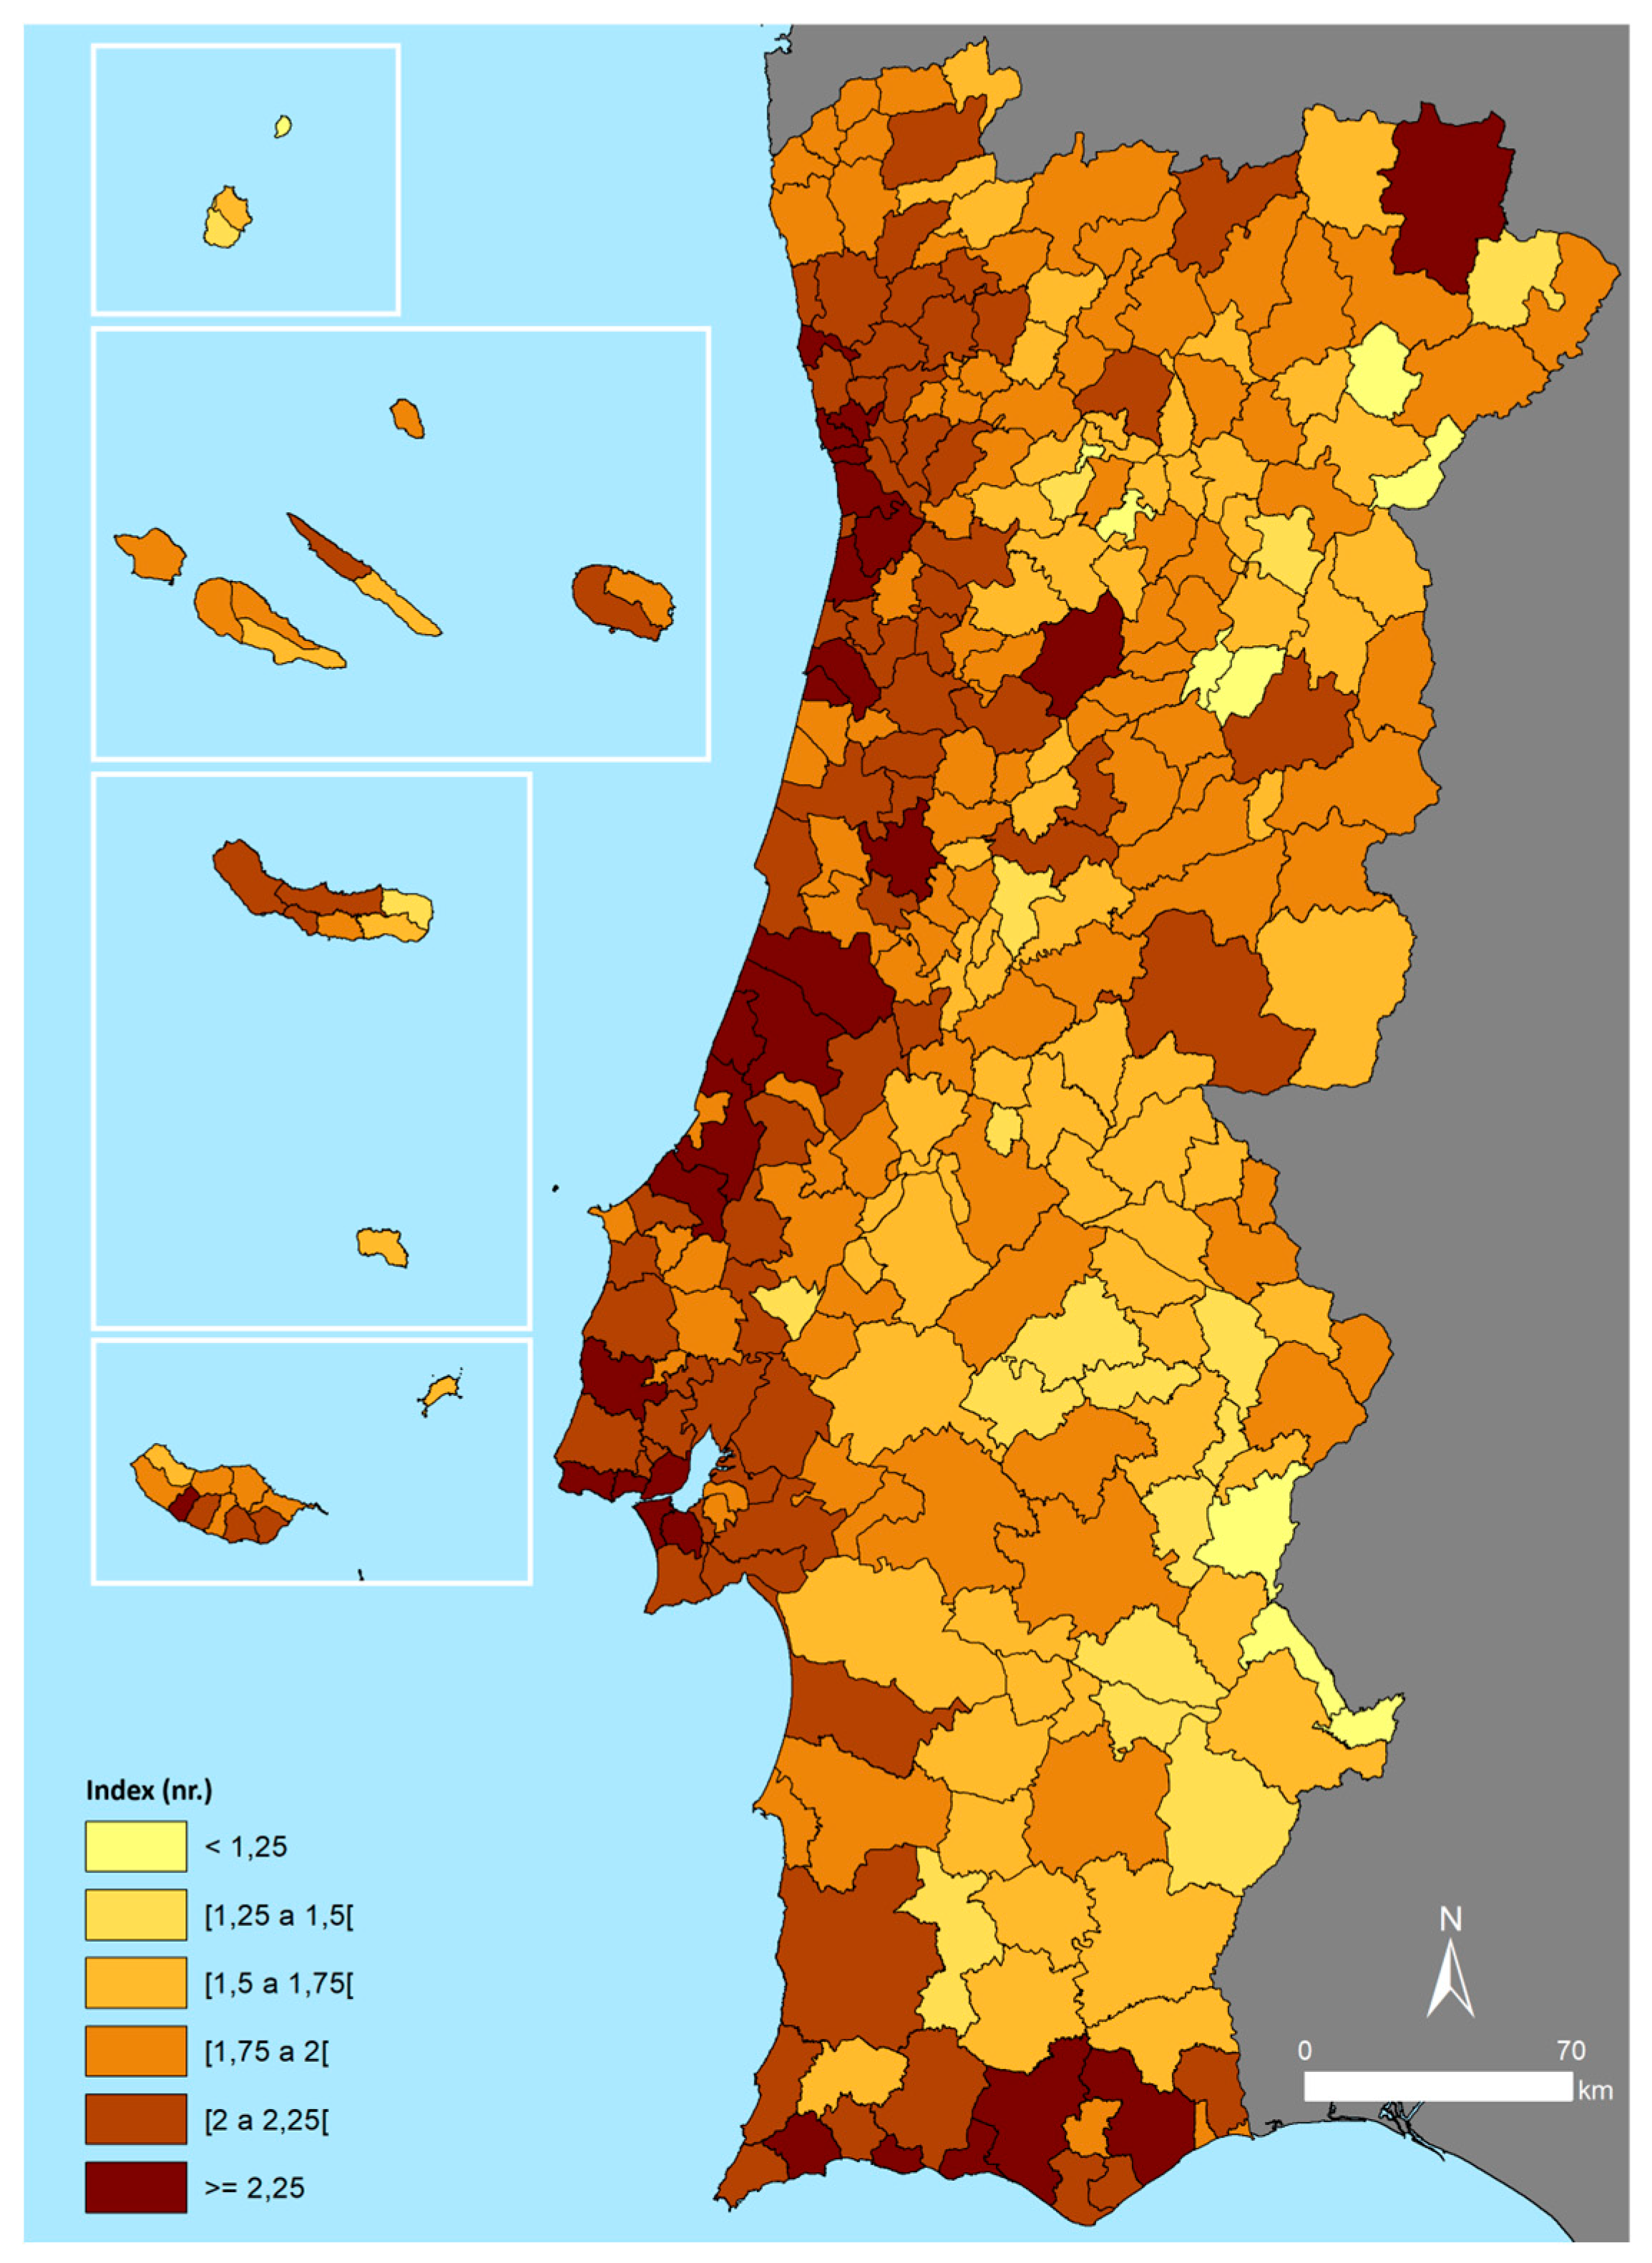
When examining various indicators, we see that between 2011 and 2021 (census period), 83.8% of the councils lost residents, with almost a third of the municipalities registering population losses exceeding ten percentage points (102). This depopulation process is pervasive across the country, most intensely in the northern and central inland regions of mainland Portugal. The Lisbon Metropolitan Area and the Algarve are the most dynamic regions. In 2023, only 5.2% of the 308 Portuguese municipalities had a positive natural growth rate, while only three councils (Barrancos, Resende, and Vila Franca do Campo) recorded a negative migratory balance. Observing the dynamics over the last five years (2019-2023), it's evident that, although generally positive, migratory dynamics also vary unevenly across the territory. Once again, the Lisbon Metropolitan Area and the Algarve exhibit the highest growth, albeit accompanied by several municipalities in the Central Region. Conversely, there's a significant loss of population due to emigration, primarily concentrated in Tâmega e Sousa and surrounding areas.
The average birth rate over the last five years supports the notion of a country operating at two speeds. Despite a general decline nationwide, significantly lower values are observed in nearly all municipalities in the northern and central inland regions of Portugal. As a result, the aging that characterizes the country (and Europe in general) is felt much more intensely in these territories, with 42.5% of the councils having 250 or more elderly per young person in 2023. Additionally, analyzing the active-age population renewal index (the ratio of people potentially entering to those exiting the workforce) highlights an associated problem, with a loss of human capital and labour, where 28.9% of the municipalities have a value below 60.
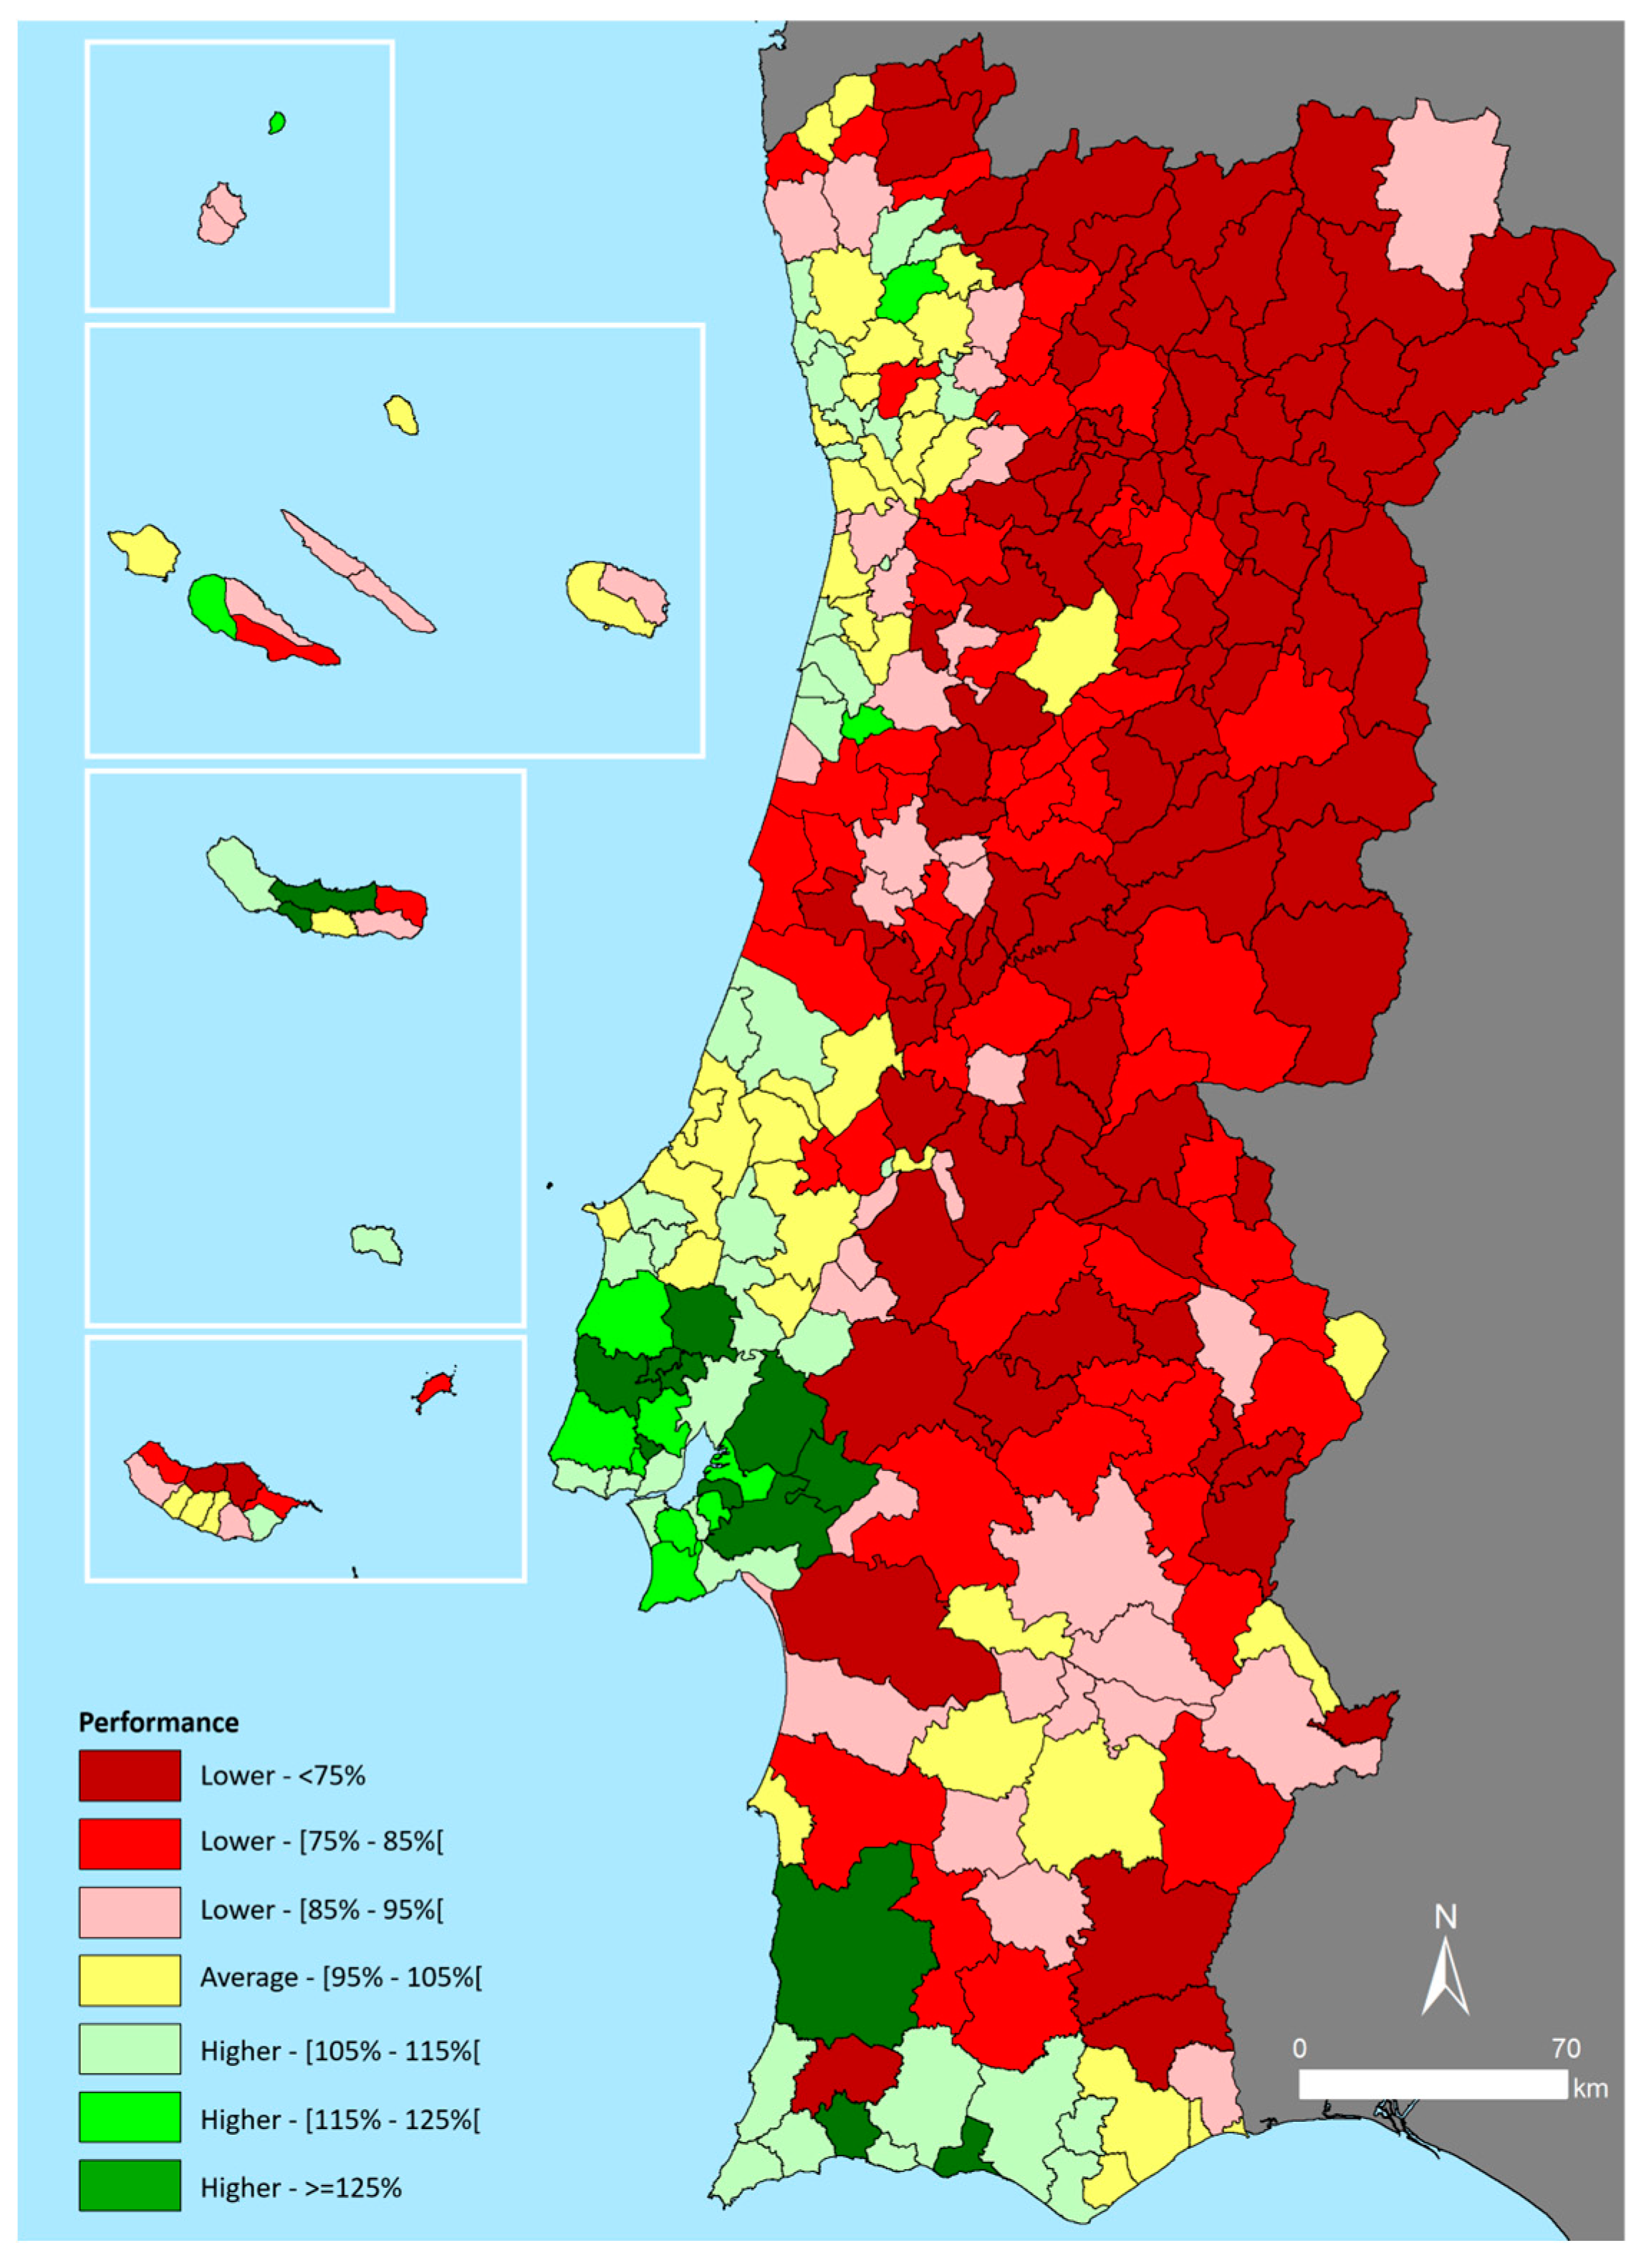
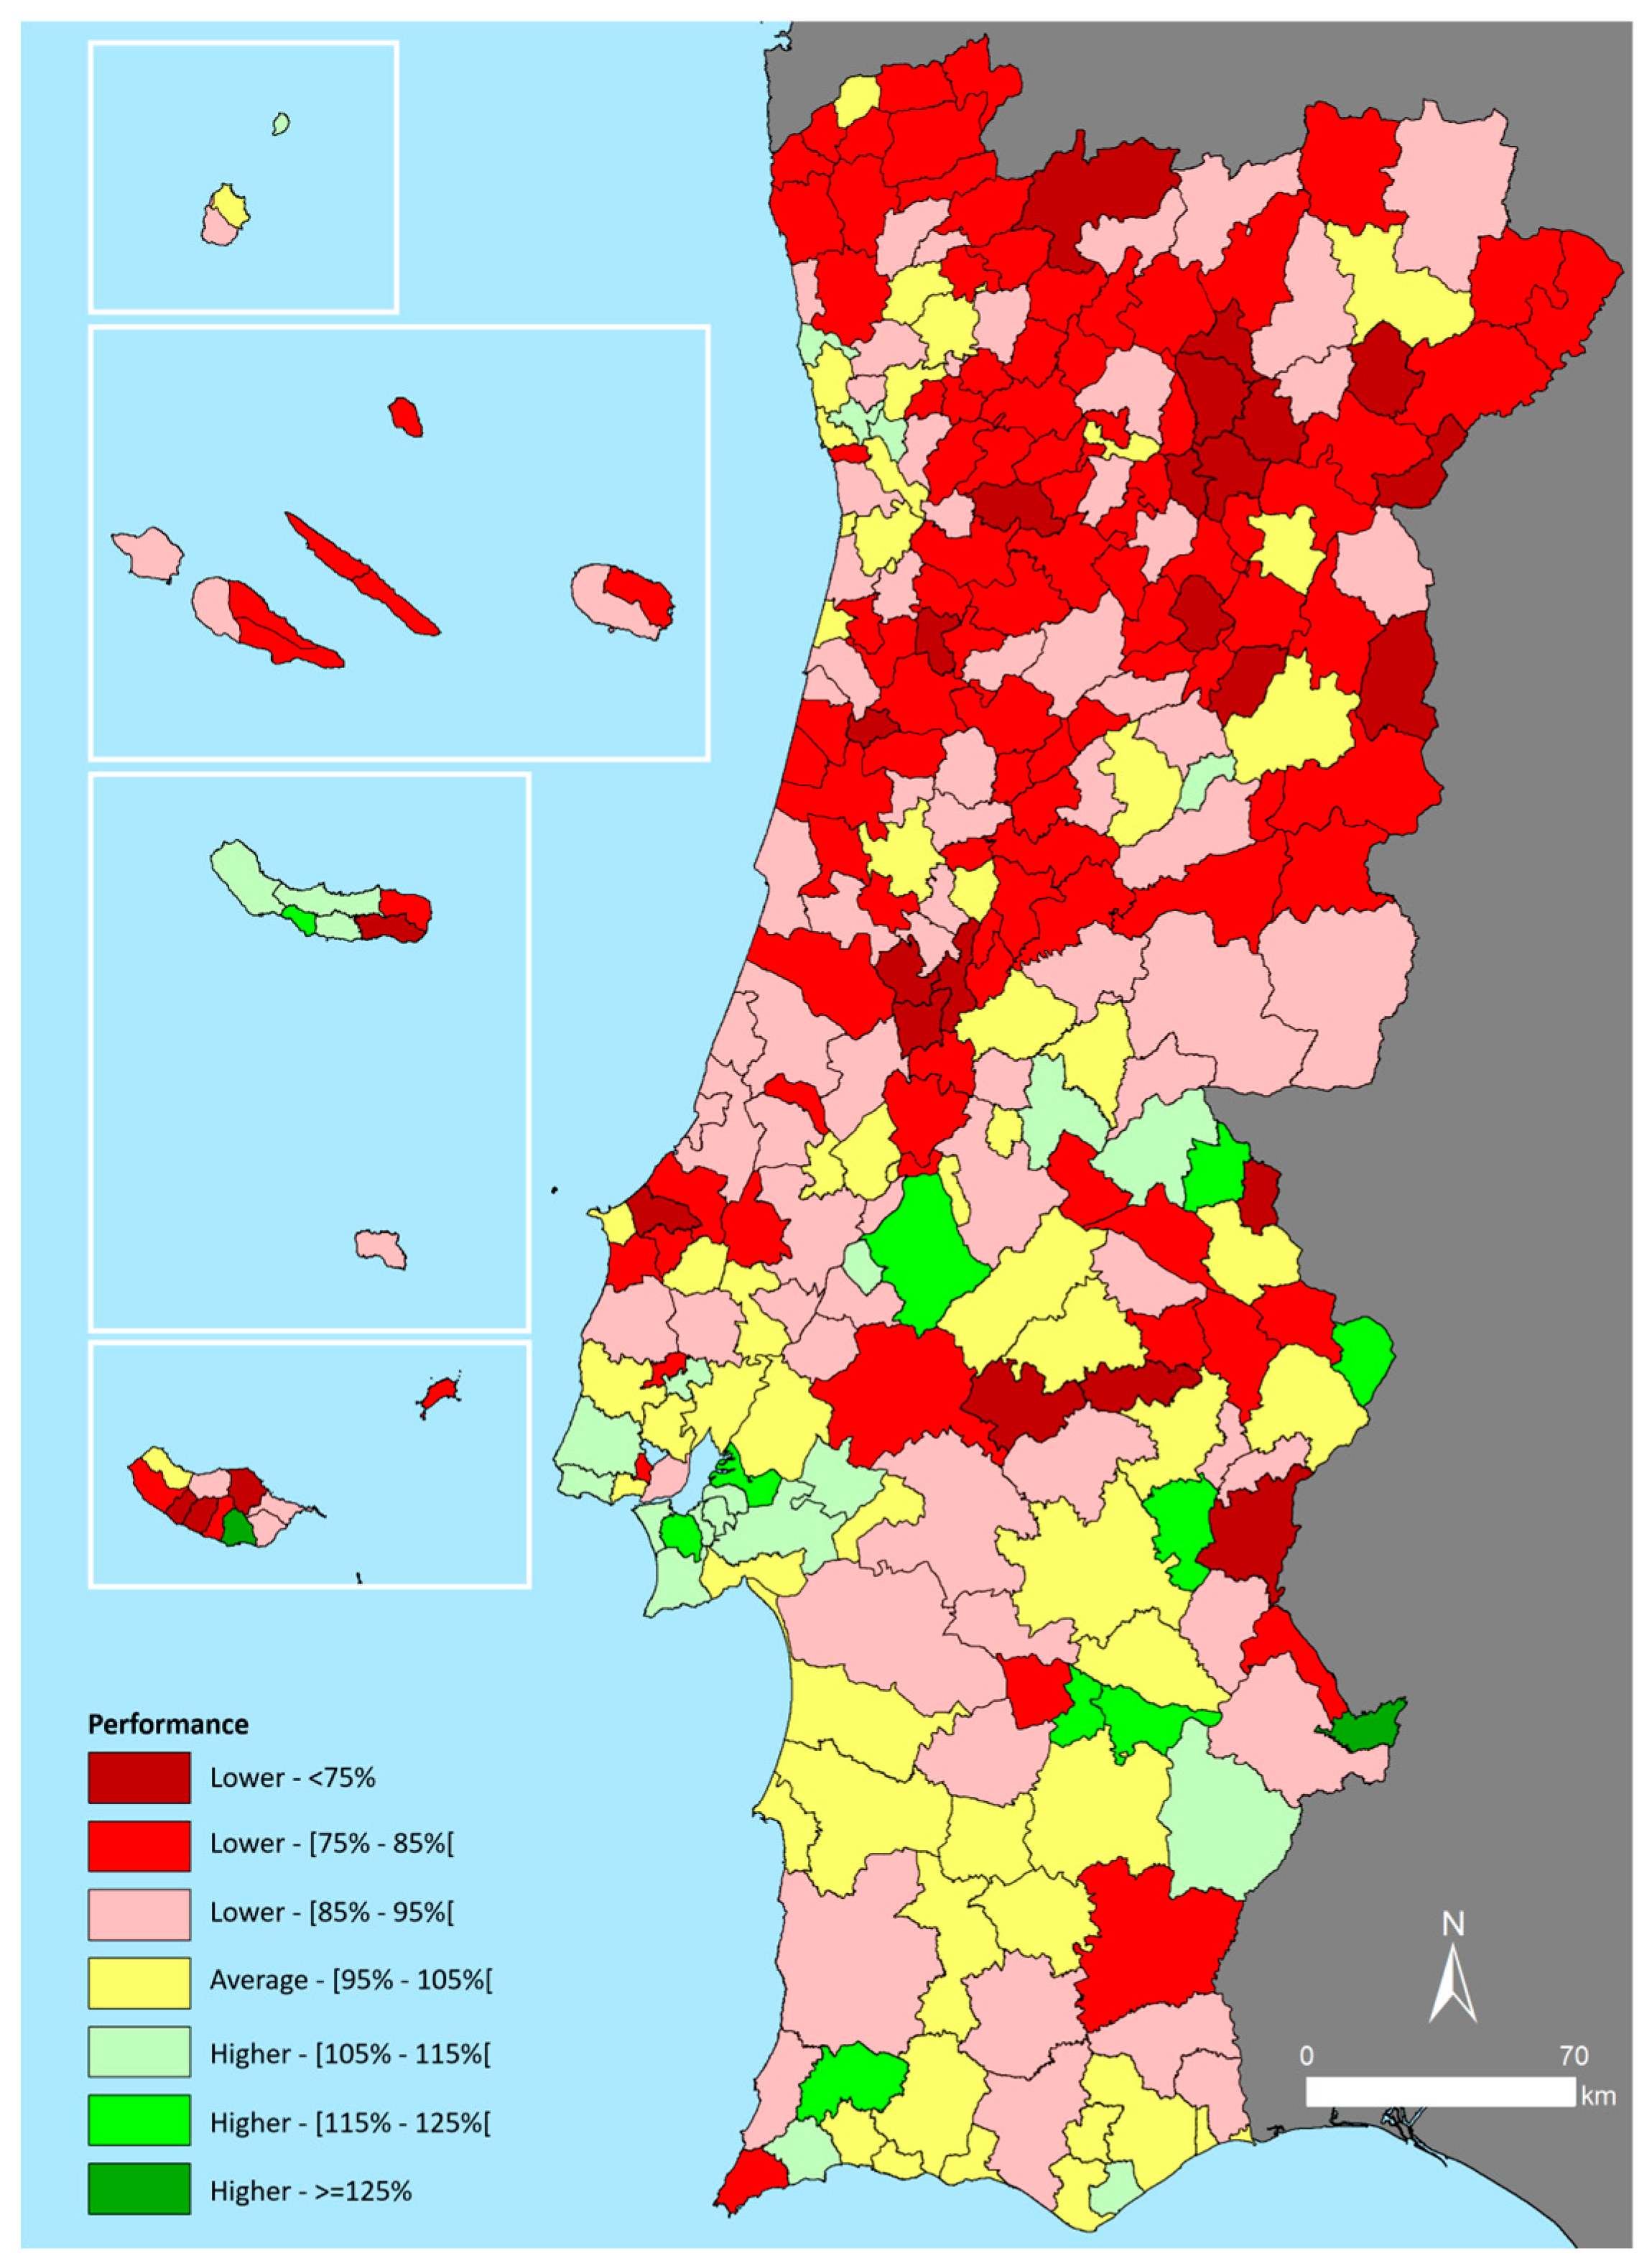
3.2. Equity
In terms of equity, which involves social cohesion, the Portuguese territory is quite asymmetrical, although the municipalities are increasingly aligning with the national average behavior (
Figure 2). However, a stark difference exists between major urban spaces and the rest of the country. Only forty municipalities perform above the national average, notably Lisbon, Oeiras, Coimbra, Porto, Cascais, Alcochete, Braga, and Aveiro. In contrast, the most negative performance is seen in Penamacor, Freixo de Espada à Cinta, Idanha-a-Nova, Mourão, and Monforte, all located inland and close to the Spanish border.
This uneven performance in terms of equity is influenced by various factors. One is the unequal access to goods and services (
Figure 3), which clearly reflects the division between major urban centers and the rest of the country. In this case, municipalities like Lisbon, Coimbra, Loulé, Cascais, and Porto record the highest values, while a concentration of less favorable conditions for residents is observed in "interior" municipalities such as Tabuaço, Freixo de Espada à Cinta, Idanha-a-Nova, Sabugal, Penamacor, or Pampilhosa da Serra.
These disparities are evident across various domains, notably in unequal access to education, health, housing, and employment. In education, the crude rate of pre-school enrollment presents a less asymmetrical scenario, although with some pressure spots in municipalities around Porto (Trofa, Paredes, Gondomar) and Lisbon (Odivelas, Moita, Seixal), indicating issues with pre-school education supply, which is clearly insufficient to meet demand. Health care access also varies, whether due to the distance needed to reach certain specialties or the ratio of doctors to residents, which is clearly more favorable in major urban areas. In 2023, the ratio of 10 doctors per 1000 inhabitants was only exceeded in Coimbra, Porto, Lisbon, Oeiras, and Faro.
This urban polarization of opportunities also extends to employment, although the highest employment rates among residents continue into municipalities with a strong industrial presence, such as Vizela, Lousada, or Paços de Ferreira. The downside is housing access. While housing is a national issue—and the reduction in housing stock available for rent and rising prices are widespread—the problem is significantly more pronounced in major cities. Indeed, if we consider allocating 60% of a couple's annual income to purchasing a new home and the average transaction prices of these properties, a couple residing in Loulé, Cascais, or Lisbon would need respectively 19.41, 18.70, and 15.83 years to complete this purchase, while in municipalities like Monforte, Oleiros, Mesão Frio, Alter do Chão, Fornos de Algodres, Vimioso, Gavião, Trancoso, Barrancos, Pampilhosa da Serra, Vila Velha de Ródão, or Penedono it would take less than a year and a half.
A second dimension of analysis measures the social dynamics of the territory, especially issues related to social capital and the capacity for individual and collective achievement (
Figure 4). In this area, the asymmetries between the coastal strip from Viana do Castelo to Setúbal and the rest of the territory (with some exceptions, naturally) are even more pronounced. The two metropolitan areas and cities such as Aveiro, Braga, Coimbra, or Castro Verde are the councils with the greatest dynamism in terms of qualifications and employability, contrasting with less dense areas where the poorest performance is observed in Pampilhosa da Serra, Mourão, Freixo de Espada à Cinta, and Idanha-a-Nova.
This asymmetry is evident in various indicators, ranging from the concentration of highly qualified populations to illiteracy and from income earned from employment to the manifestation of unemployment. These differences exhibit a territorial matrix dominated by this coastal polarization but also present some interesting particularities in some cases.
The concentration of young adults with higher education is predominantly a metropolitan phenomenon, extending to key urban centers and municipalities with higher education institutions that boost job opportunities and talent retention. The municipalities excelling in this indicator are Lisbon, Porto, Coimbra, Oeiras, Braga, Aveiro, Bragança, Maia, Cascais, and Odivelas. Conversely, municipalities like Cinfães, Vila Franca do Campo, Povoação, Castanheira de Pera, and Mourão show the opposite trend. Illiteracy rates, despite decades of improvement, still show significant territorial asymmetry, with higher rates in the inland regions of the North and Central Portugal and the Alentejo. In some councils like Idanha-a-Nova, Penamacor, Monforte, and Alcoutim, illiteracy rates exceeded ten percentage points in the 2021 Census.
The average monthly income reflects similar disparities but shows a pronounced metropolitan effect, widening the gap between these areas and other municipalities along the coast. In 2021, only eight councils had an average monthly income over 1500 euros, mostly in metropolitan areas. Interestingly, Castro Verde, influenced economically by the Somincor mine, recorded the highest average monthly wage. The unemployment rate map of 2021 shows varied patterns, with a strong incidence in metropolitan spaces and tourist-active regions like the Algarve and Madeira, and more broadly across the interior of the Northern Region.
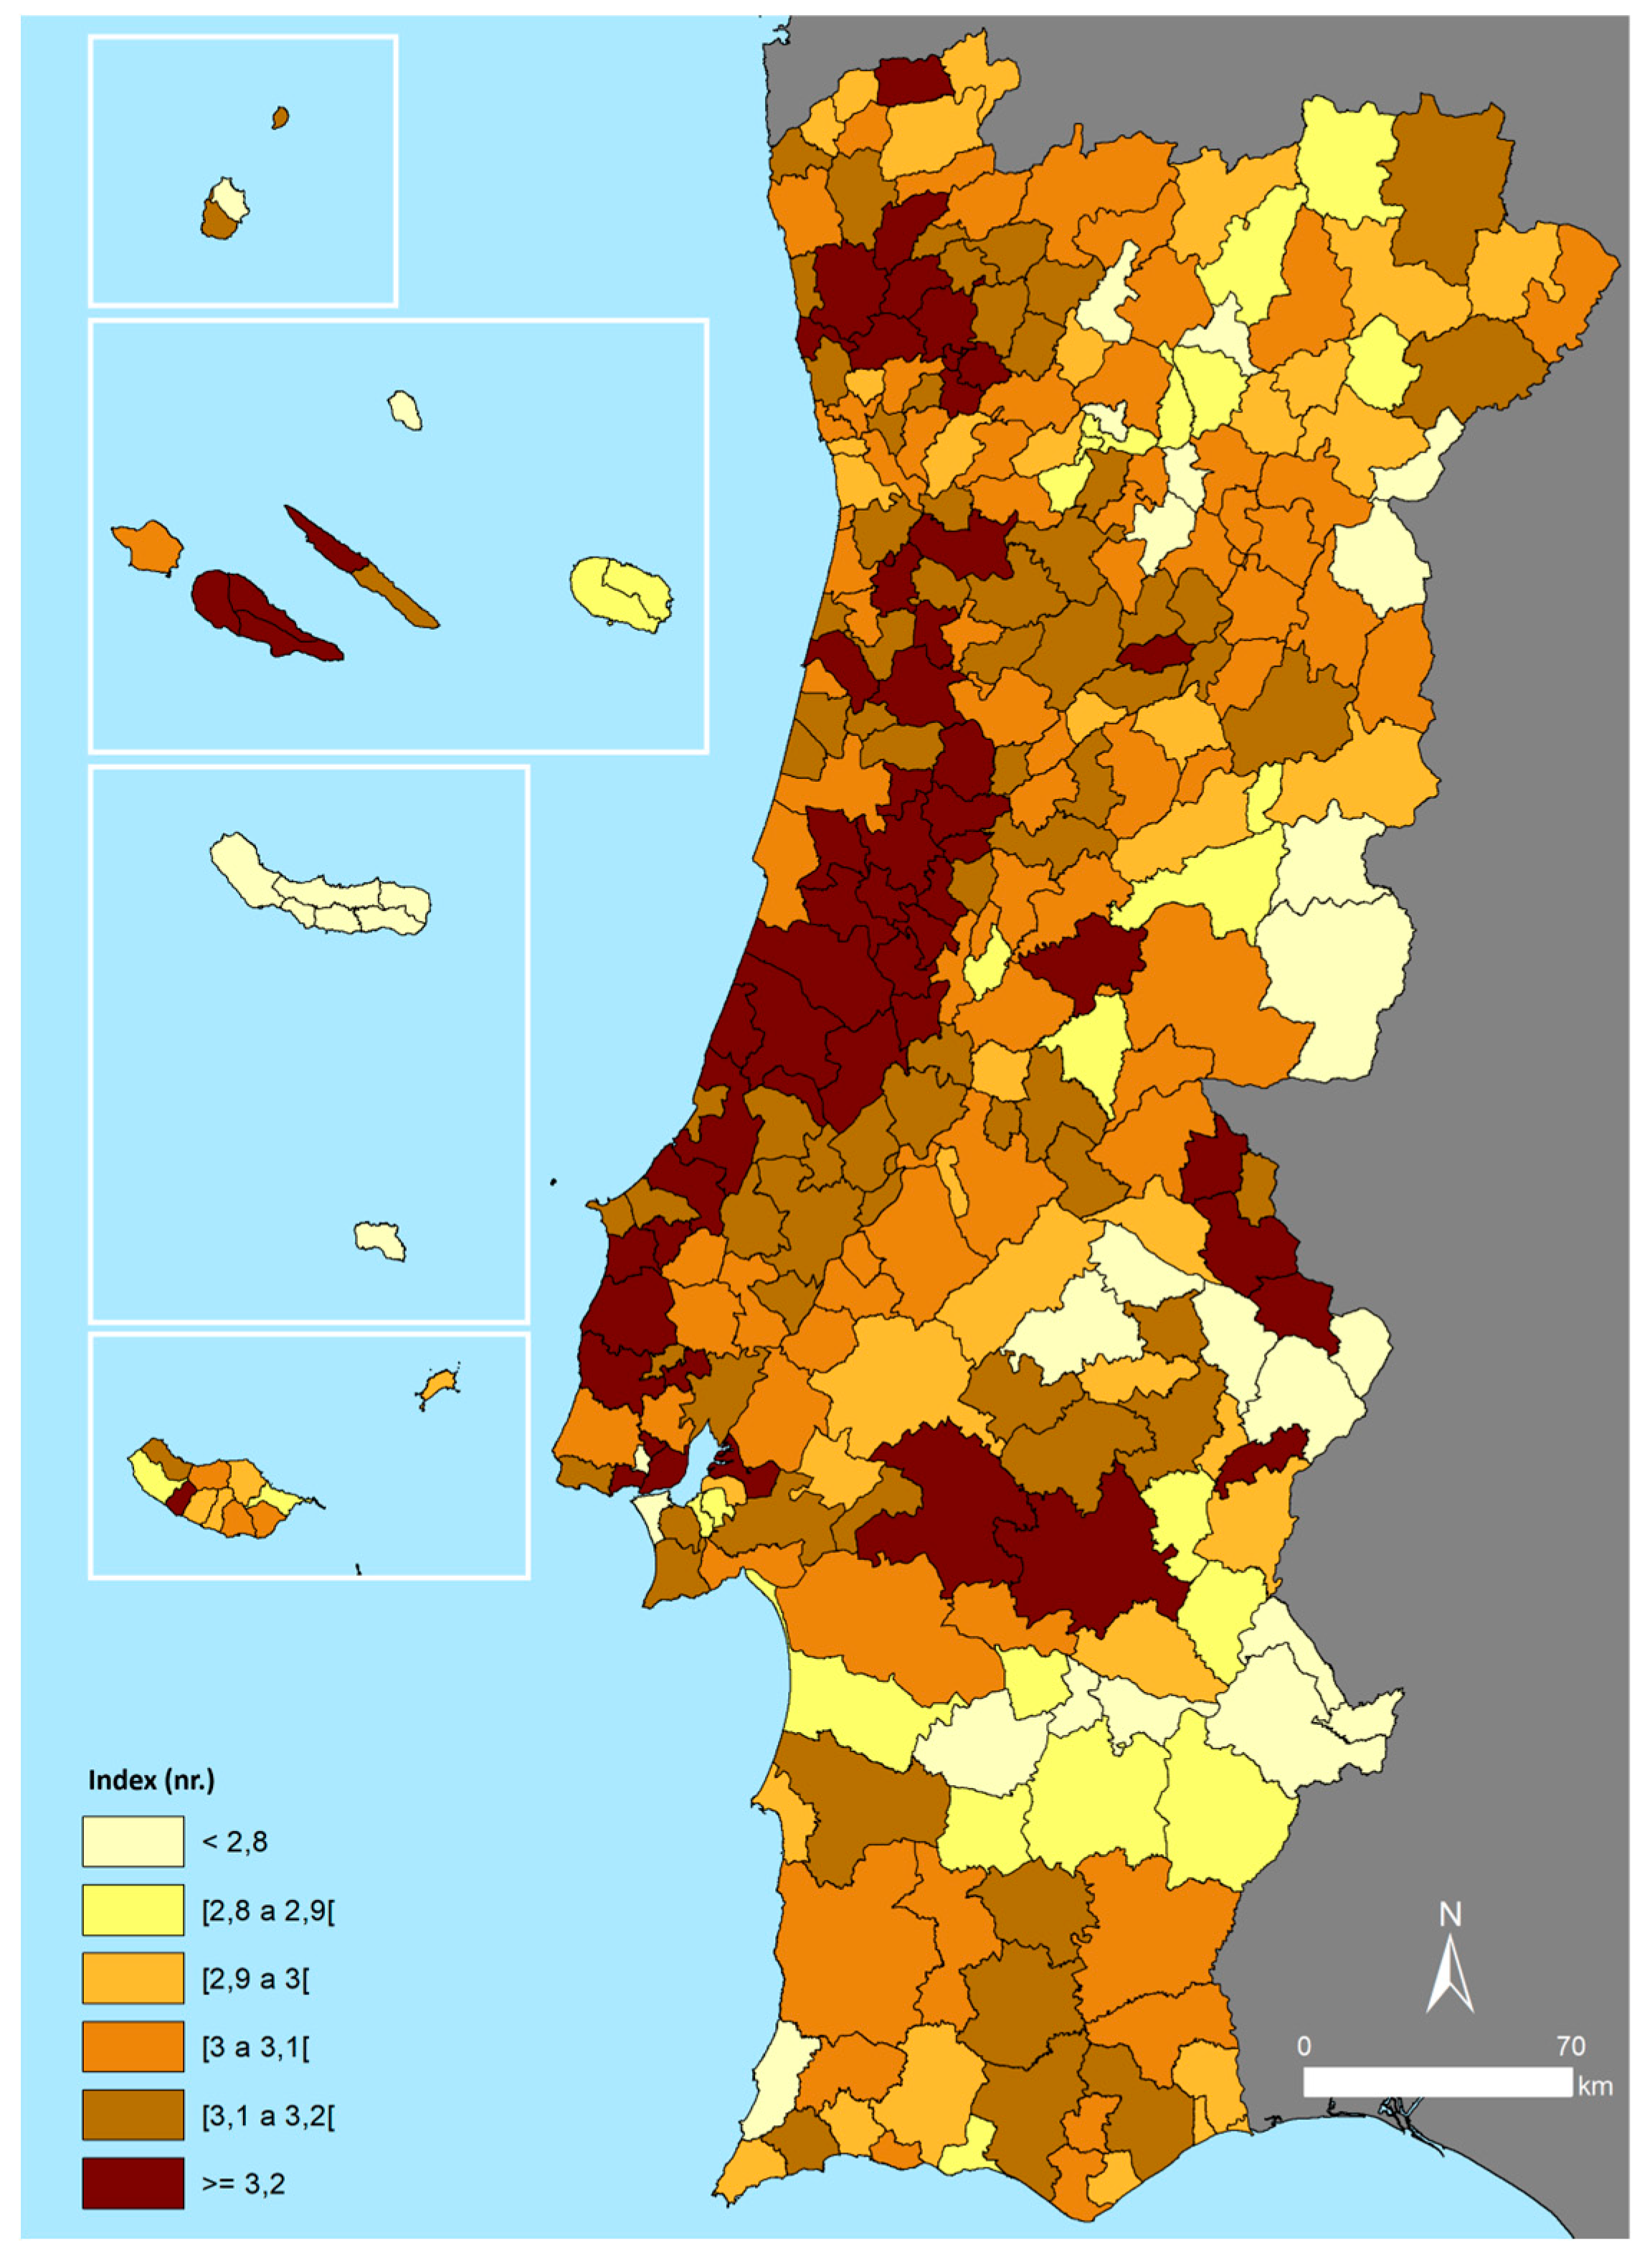
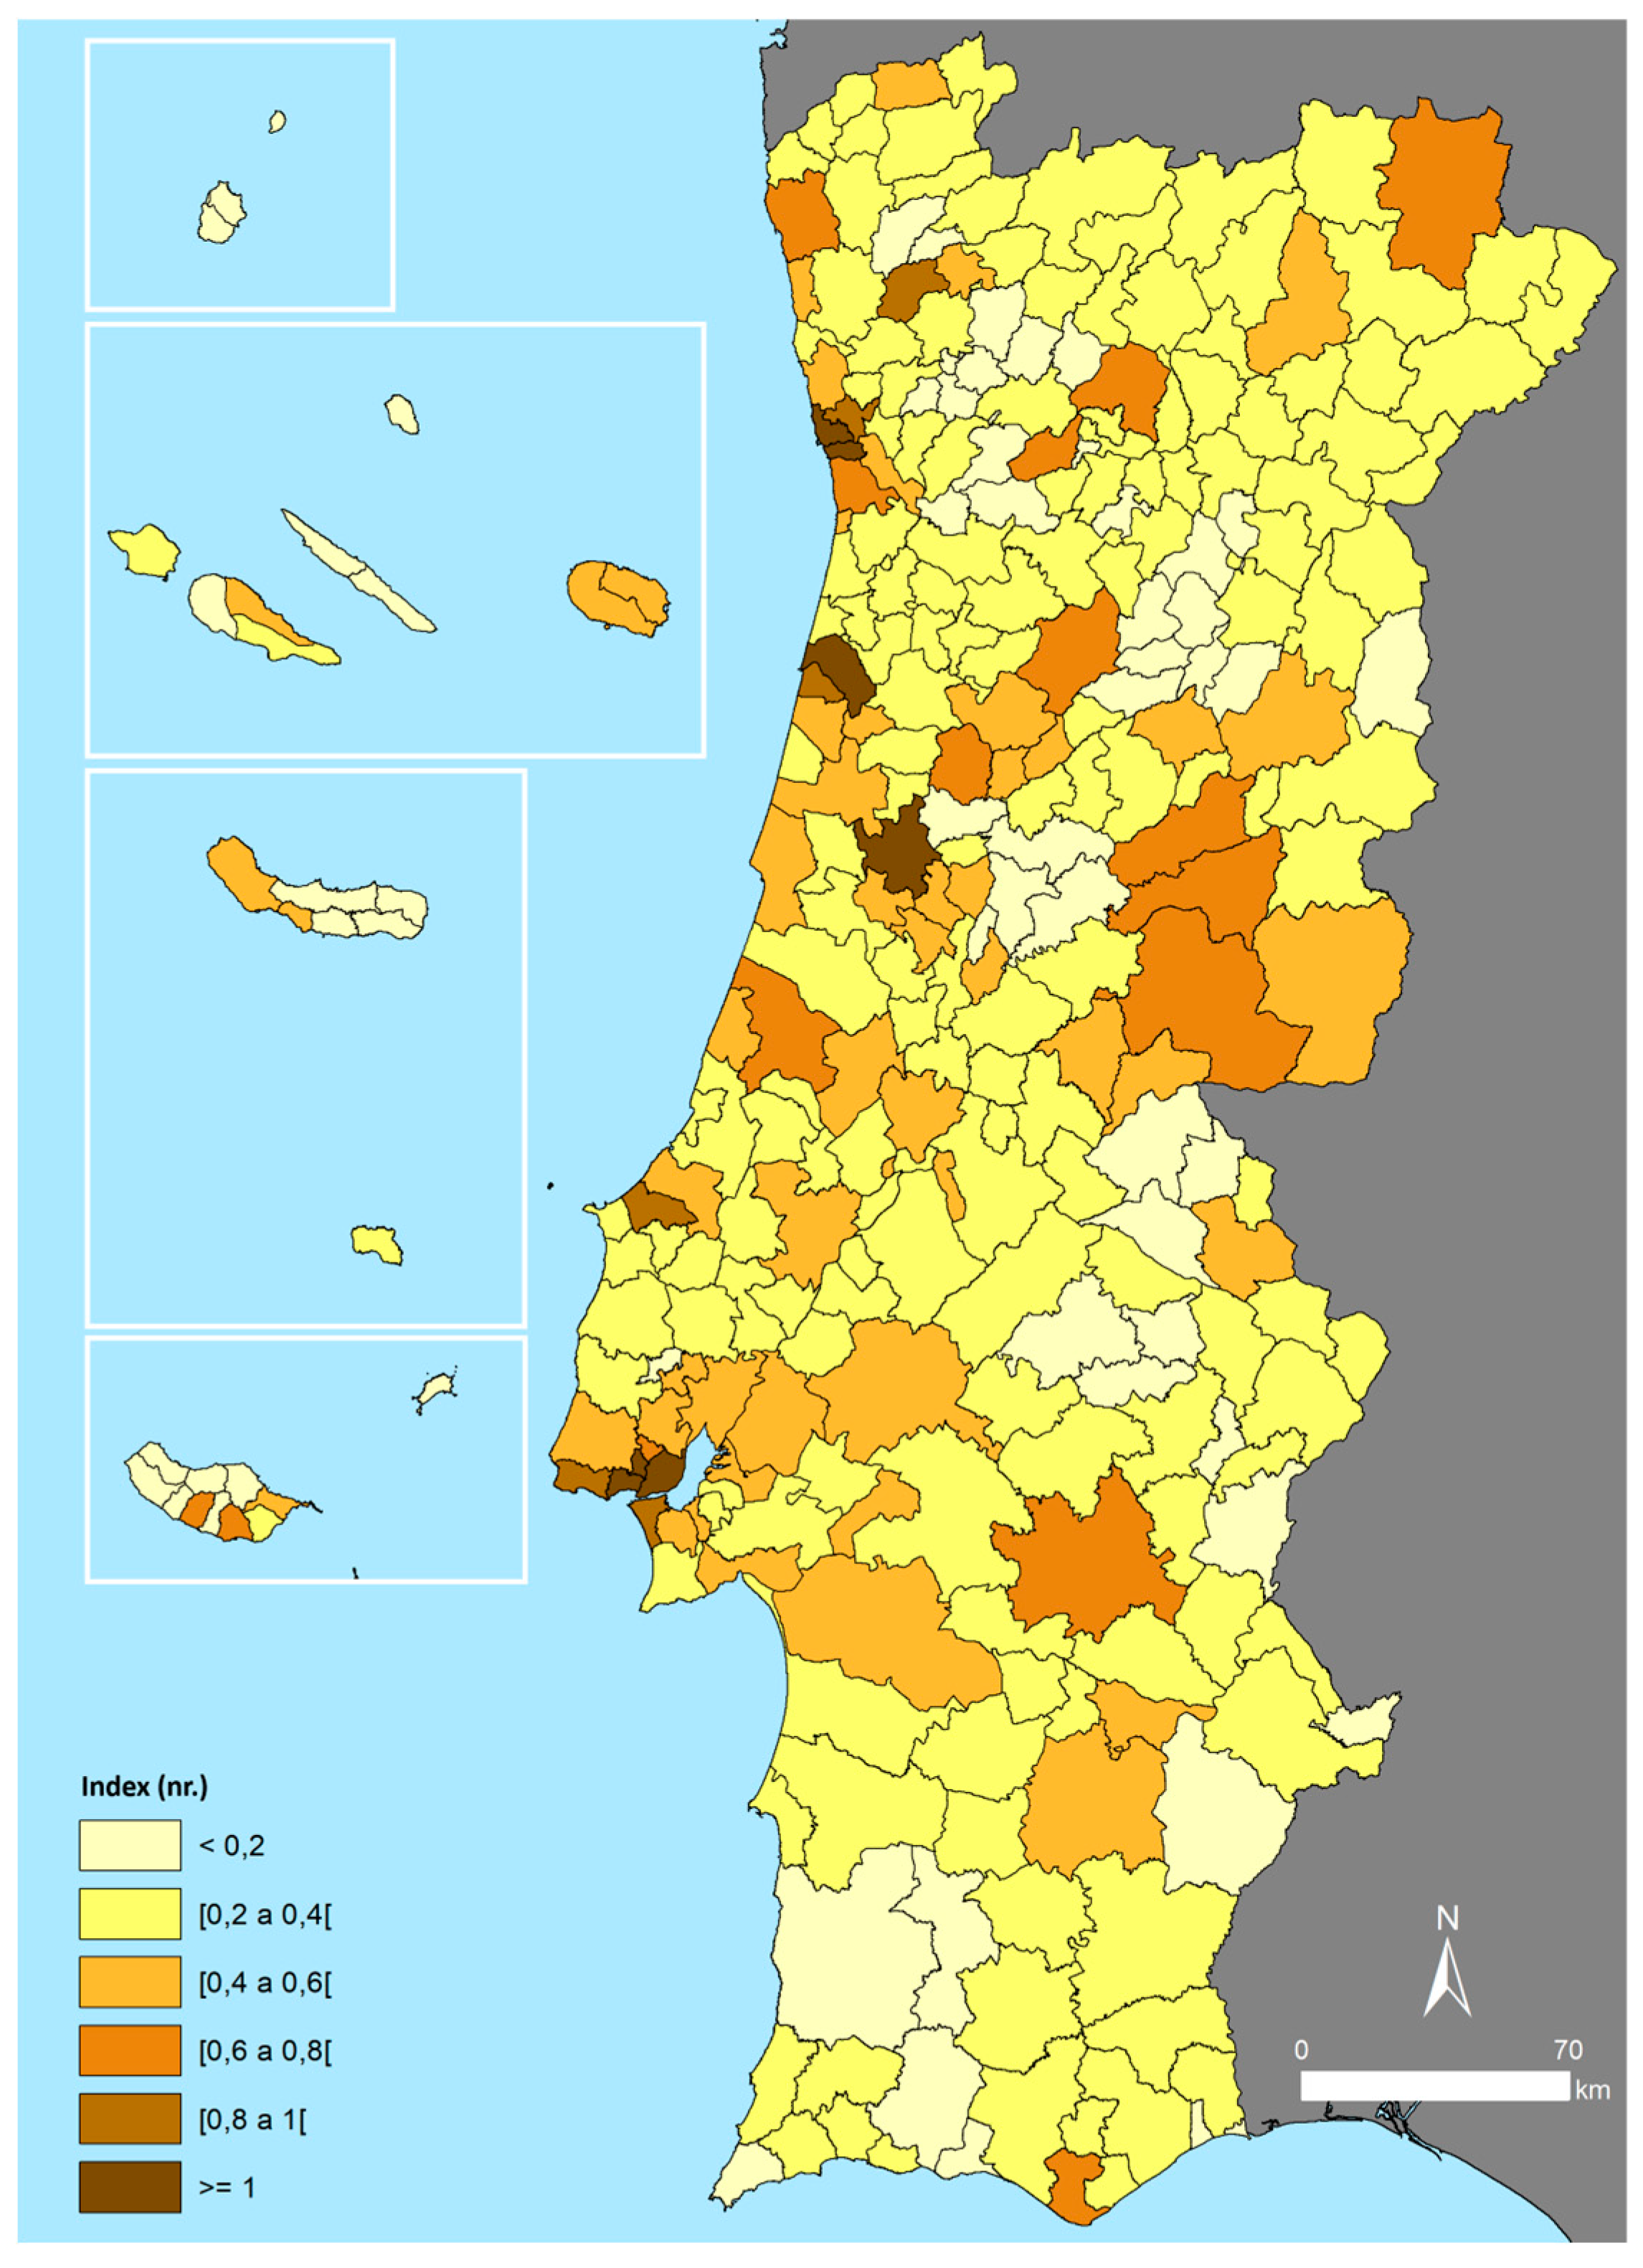
The third dimension of territorial equity analysis emerges through observing social and economic inequalities (
Figure 5). This analysis reveals unique patterns, with the best performance (least inequality) observed in the Central Region, some Lisbon Metropolitan Area municipalities, north of the Porto Metropolitan Area, and the Central group of the Azores. Municipalities like Oeiras, Mafra, Leiria, Mealhada, Lisbon, Alcochete, Lourinhã, Lajes do Pico, and Caldas da Rainha show the best performance, whereas the greatest inequalities appear in Ribeira Grande, Mourão, Monforte, Moura, Vila do Porto, and Avis.
One aspect of this study pertains to the reliance on social benefits and their concentration in certain areas. Analysis of the number of social insertion income beneficiaries per thousand active-age inhabitants reveals significant regional variations, with pronounced concentrations in Alentejo, the northern inland, Porto's Metropolitan Area, and the Eastern Azores. Notably, in twelve municipalities – Ribeira Grande, Mourão, Moura, Monforte, Nordeste, Lagoa, Ponta Delgada, Povoação, Murça, Elvas, Peso da Régua, and Porto – there are over 70 beneficiaries per thousand active-age inhabitants, with the top four exceeding 125. Conversely, in 2022, areas like Barcelos, Oliveira de Frades, and others registered fewer than 10 RSI beneficiaries per thousand, highlighting a higher concentration in the northern regions, particularly in the Alto Minho and Cávado intermunicipal communities.
One aspect that contributes to this study is the dependence on social benefits and their concentration in certain contexts. By analyzing the number of recipients of social insertion income per thousand active-age residents, we observe that the territorial mosaic differs slightly, with a more pronounced concentration in Alentejo, the interior of the Northern Region, the Porto Metropolitan Area, and the Eastern Azores group. It is important to note that in twelve councils—Ribeira Grande, Mourão, Moura, Monforte, Nordeste, Lagoa, Ponta Delgada, Povoação, Murça, Elvas, Peso da Régua, and Porto—there are more than 70 beneficiaries per thousand active-age residents, with the top four exceeding 125 per thousand. The lowest values, below 10 beneficiaries of RSI per thousand active-age residents in 2022, are recorded in the councils of Barcelos, Oliveira de Frades, Vizela, Arraiolos, Alcoutim, Vouzela, Vila Verde, Ponte de Lima, Óbidos, Monção, Melgaço, Terras de Bouro, Arcos de Valdevez, Paredes de Coura, Esposende, Guimarães, Vale de Cambra, and Oliveira de Azeméis, showing a greater concentration in the North, especially in the intermunicipal communities of Alto Minho and Cávado. The map of the variation of the average monthly earnings weighted by the employment weight of the various levels of qualification in the total employment for others shows less territorial patterns of concentration, although the differences are quite significant between some municipalities. In fact, in five municipalities (Vila do Porto, Amadora, Santa Cruz das Flores, and Almada) the wage disparity between levels of qualification exceeds 35%, while in fifteen others (six of them in metropolitan areas) it also exceeds thirty percentage points. The smallest disparities, under 10%, are recorded in Ponta do Sol, Cinfães, Lourinhã, Lajes do Pico, Porto Moniz, Castro Daire, Almeida, and Oleiros.
Crime rates show a concentration of high values in three territorial contexts: Alentejo, Algarve, and the Eastern Azores group, in addition to the presence of the country's two main cities in this portrait. In fifteen municipalities, the values recorded in 2022 exceeded 50‰, notably in Avis, Albufeira, Barrancos, Ribeira Grande, Mourão, Loulé, Lisbon, Alvito, Aljezur, Vila do Bispo, Porto, Campo Maior, Santa Cruz das Flores, Grândola, and Sines. The safest municipalities, with lower crime rates in 2022 (under 15‰), were Sernancelhe, Calheta, Miranda do Corvo, Soure, and Armamar.
Economically, the study on municipal purchasing power per capita reflects an extremely unequal country, with different speeds and opportunities depending on the location each one chooses to live or work. Considering that the average value of Portugal is indexed at 100 in this analysis, we find that only 31 of the 308 Portuguese municipalities (10.1%) show a performance above the national average. This includes several municipalities from the two metropolitan areas (especially around the cities of Lisbon and Porto) and the Algarve, along with some of the main urban centers. Lisbon (186.34), Oeiras (165.5), Porto (147.63), Cascais (121.83), Sines (120.33), Coimbra (119.76), Aveiro (119.68), Alcochete (118.86), Matosinhos (118.06), and São João da Madeira (116.73) top this list. At the opposite extreme, 64 municipalities (20.8%) have a purchasing power value below 70, with Ponta do Sol, Porto Moniz, Penamacor, Vinhais, and Baião standing out as the councils with the poorest performance.
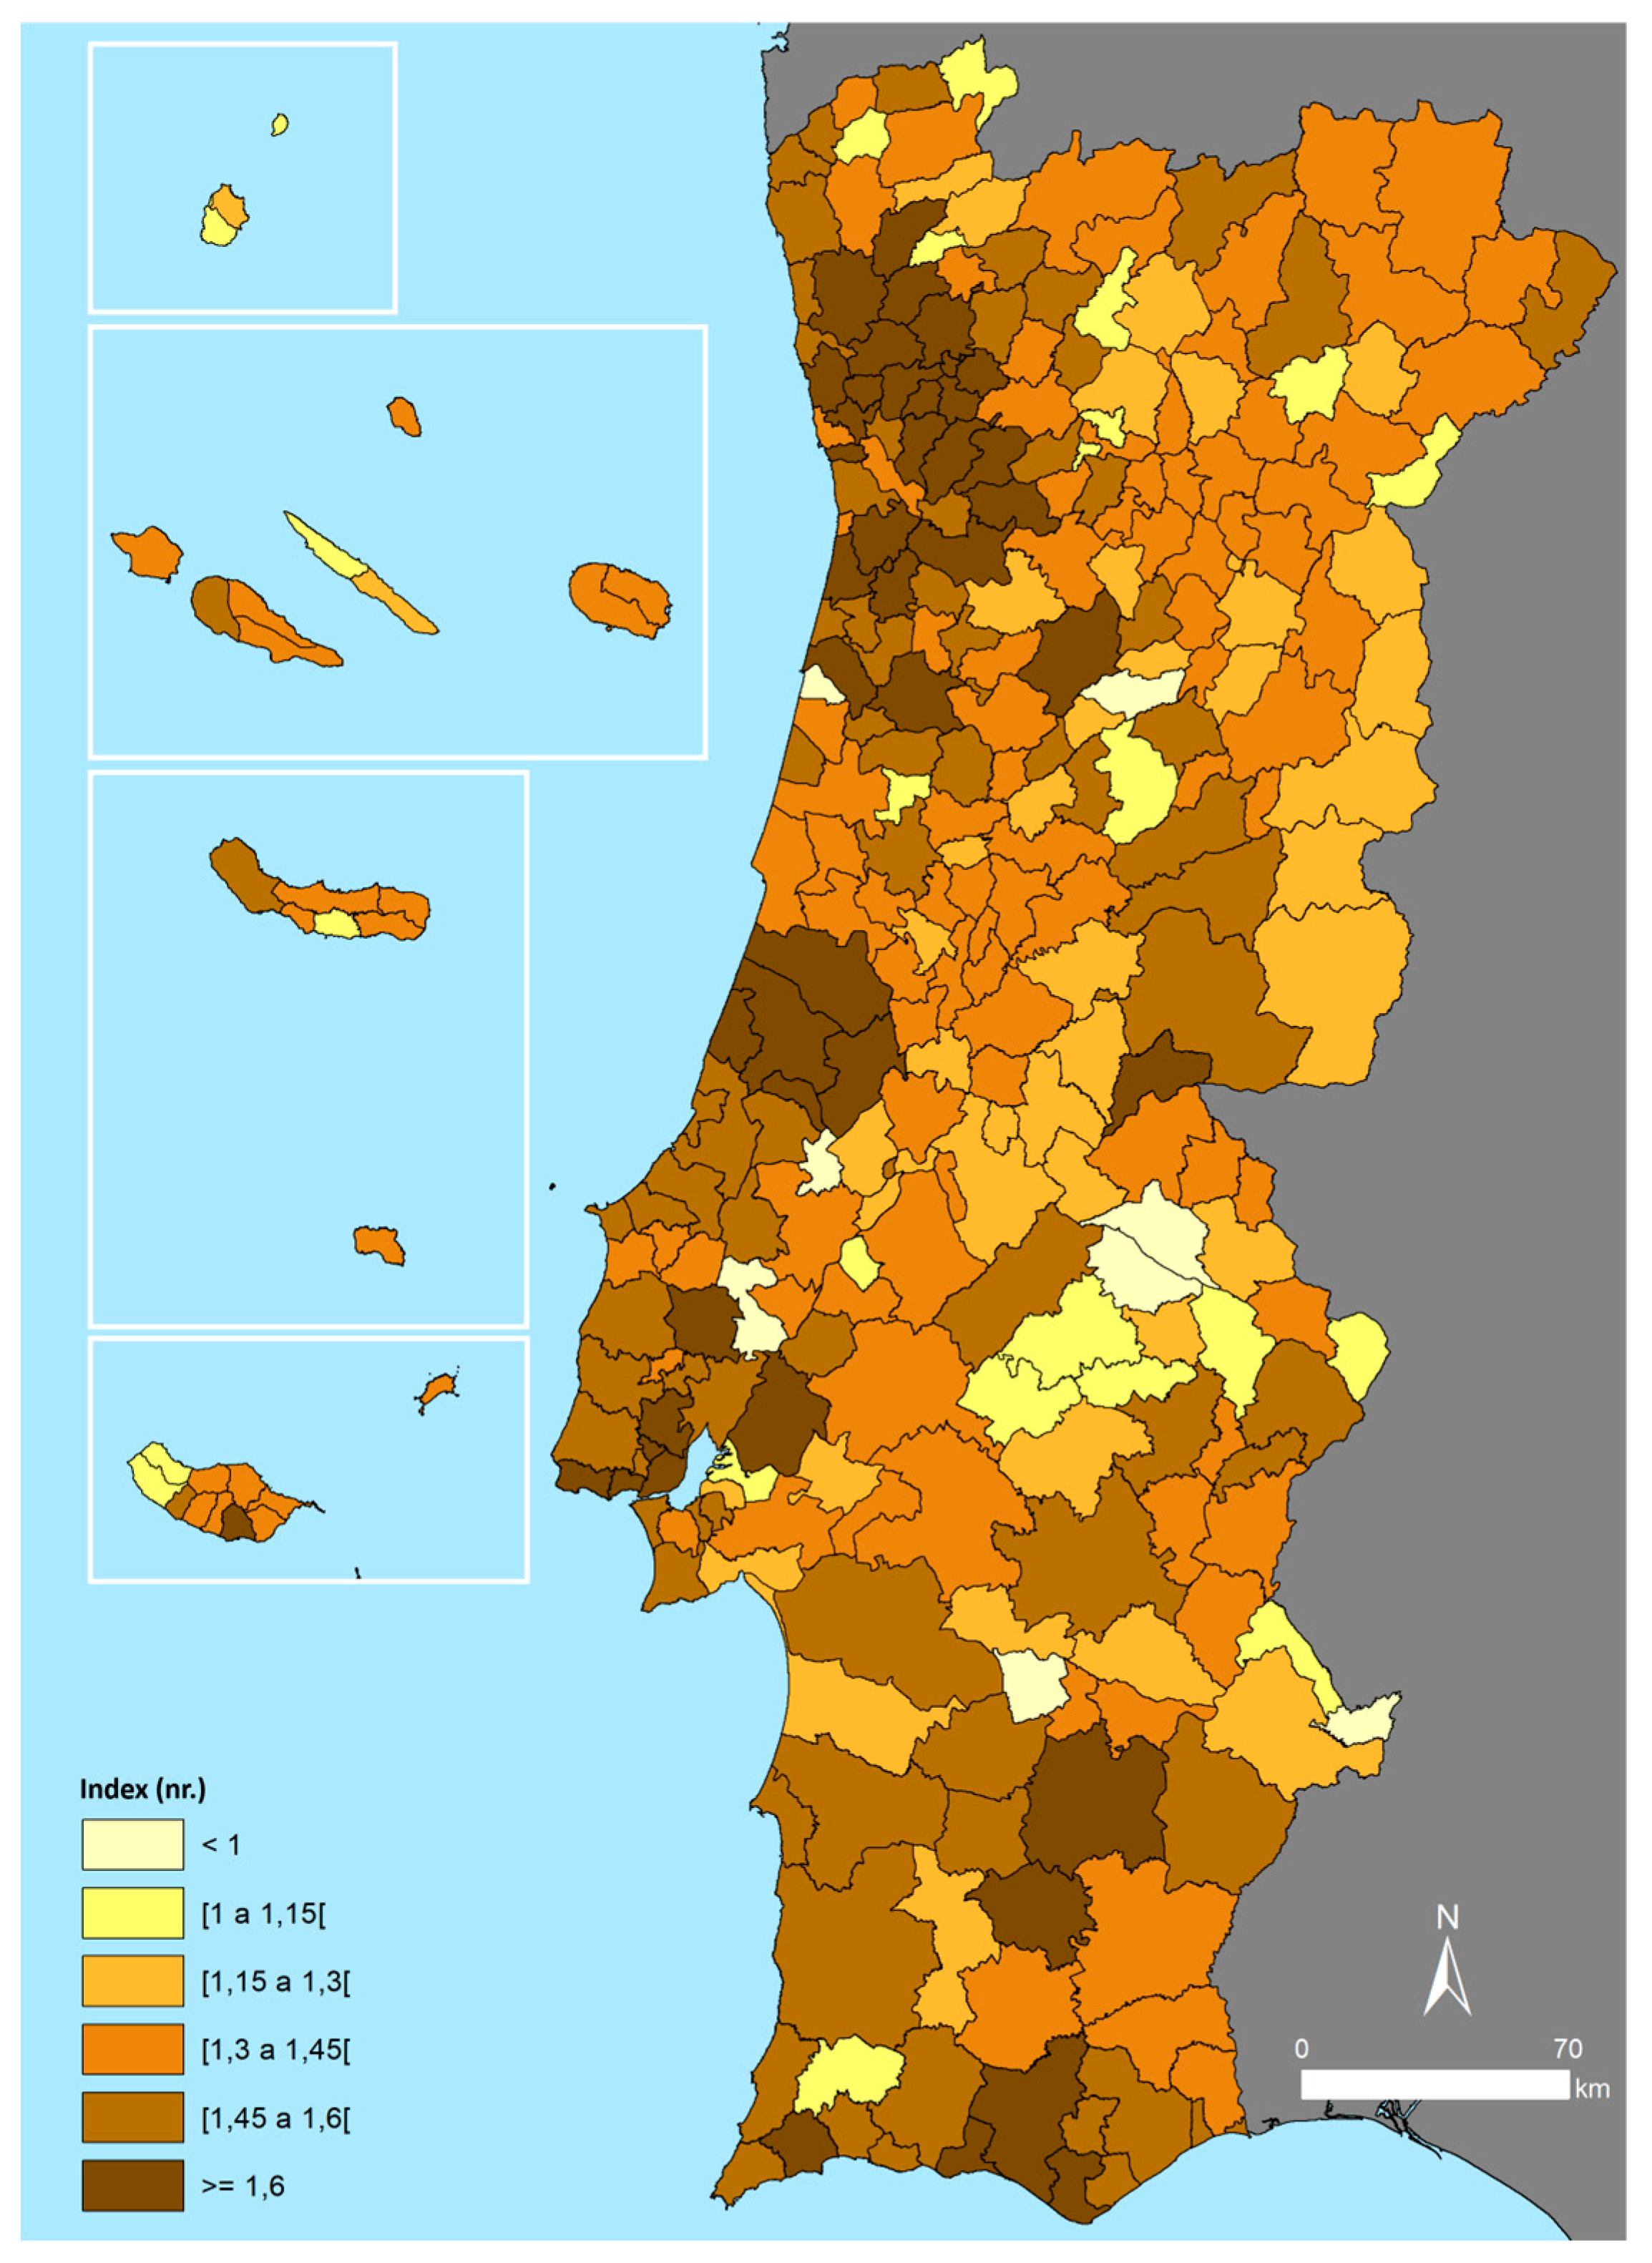
3.3. Competitiveness
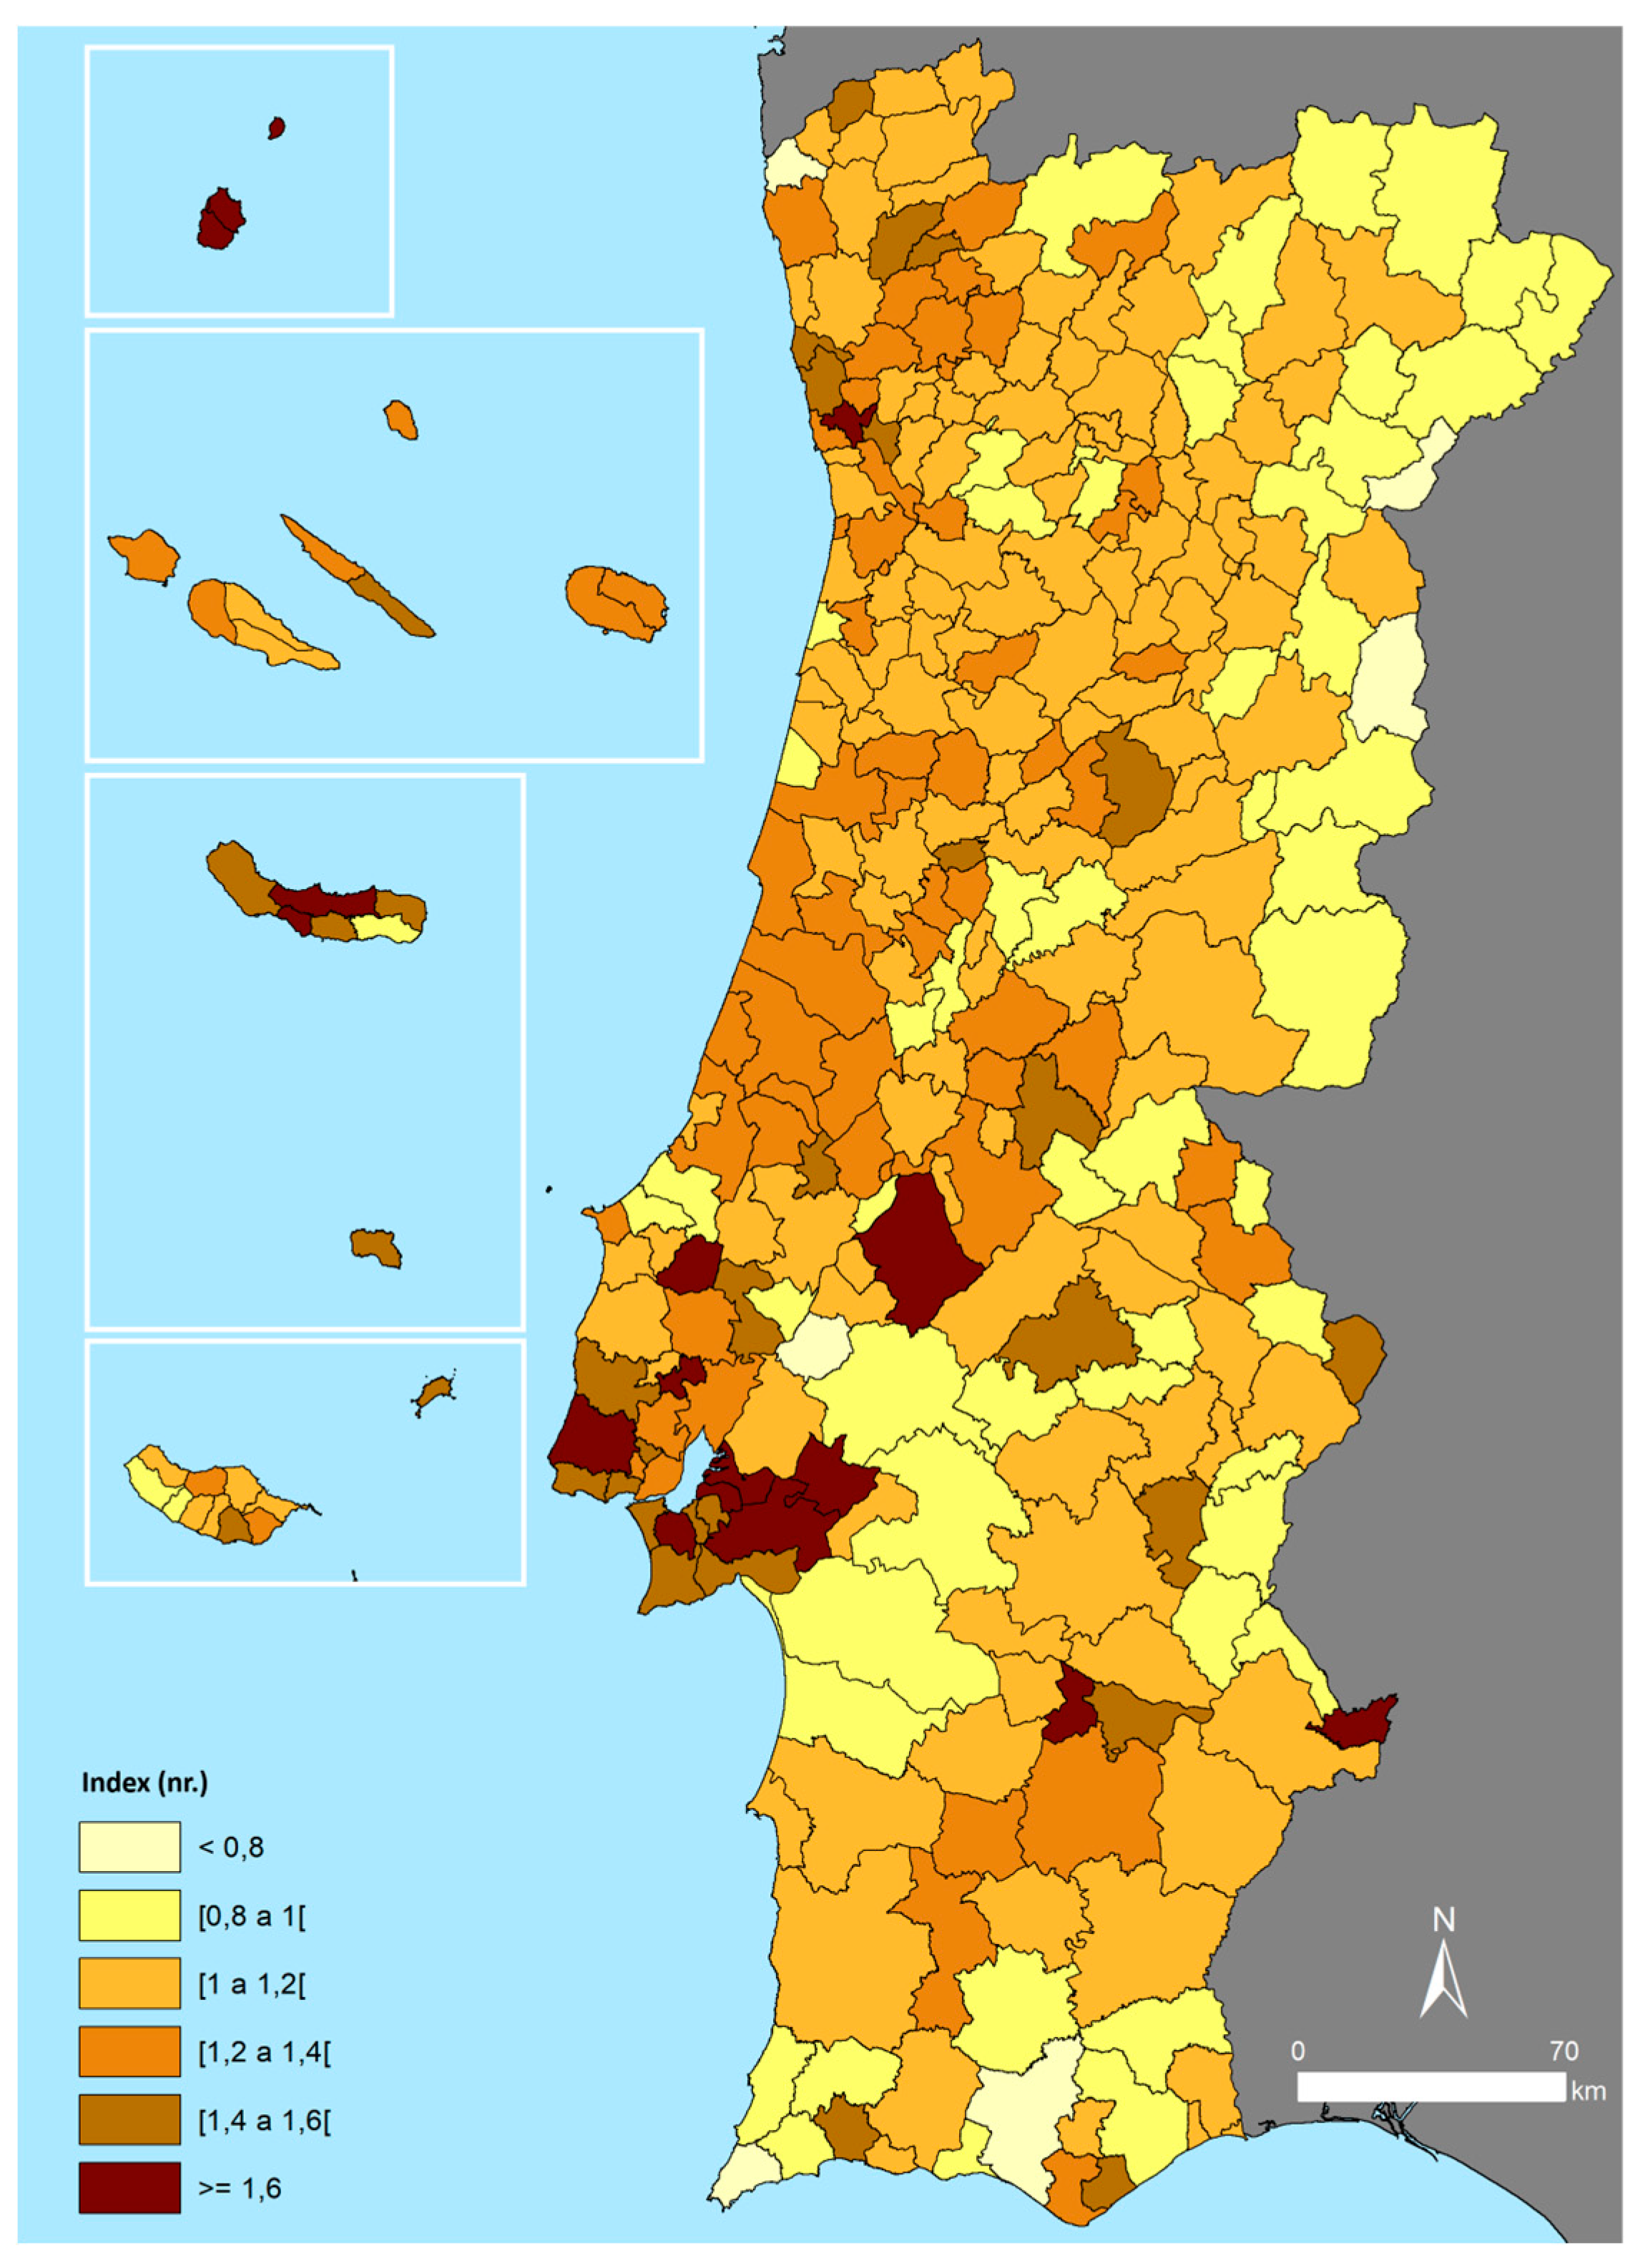
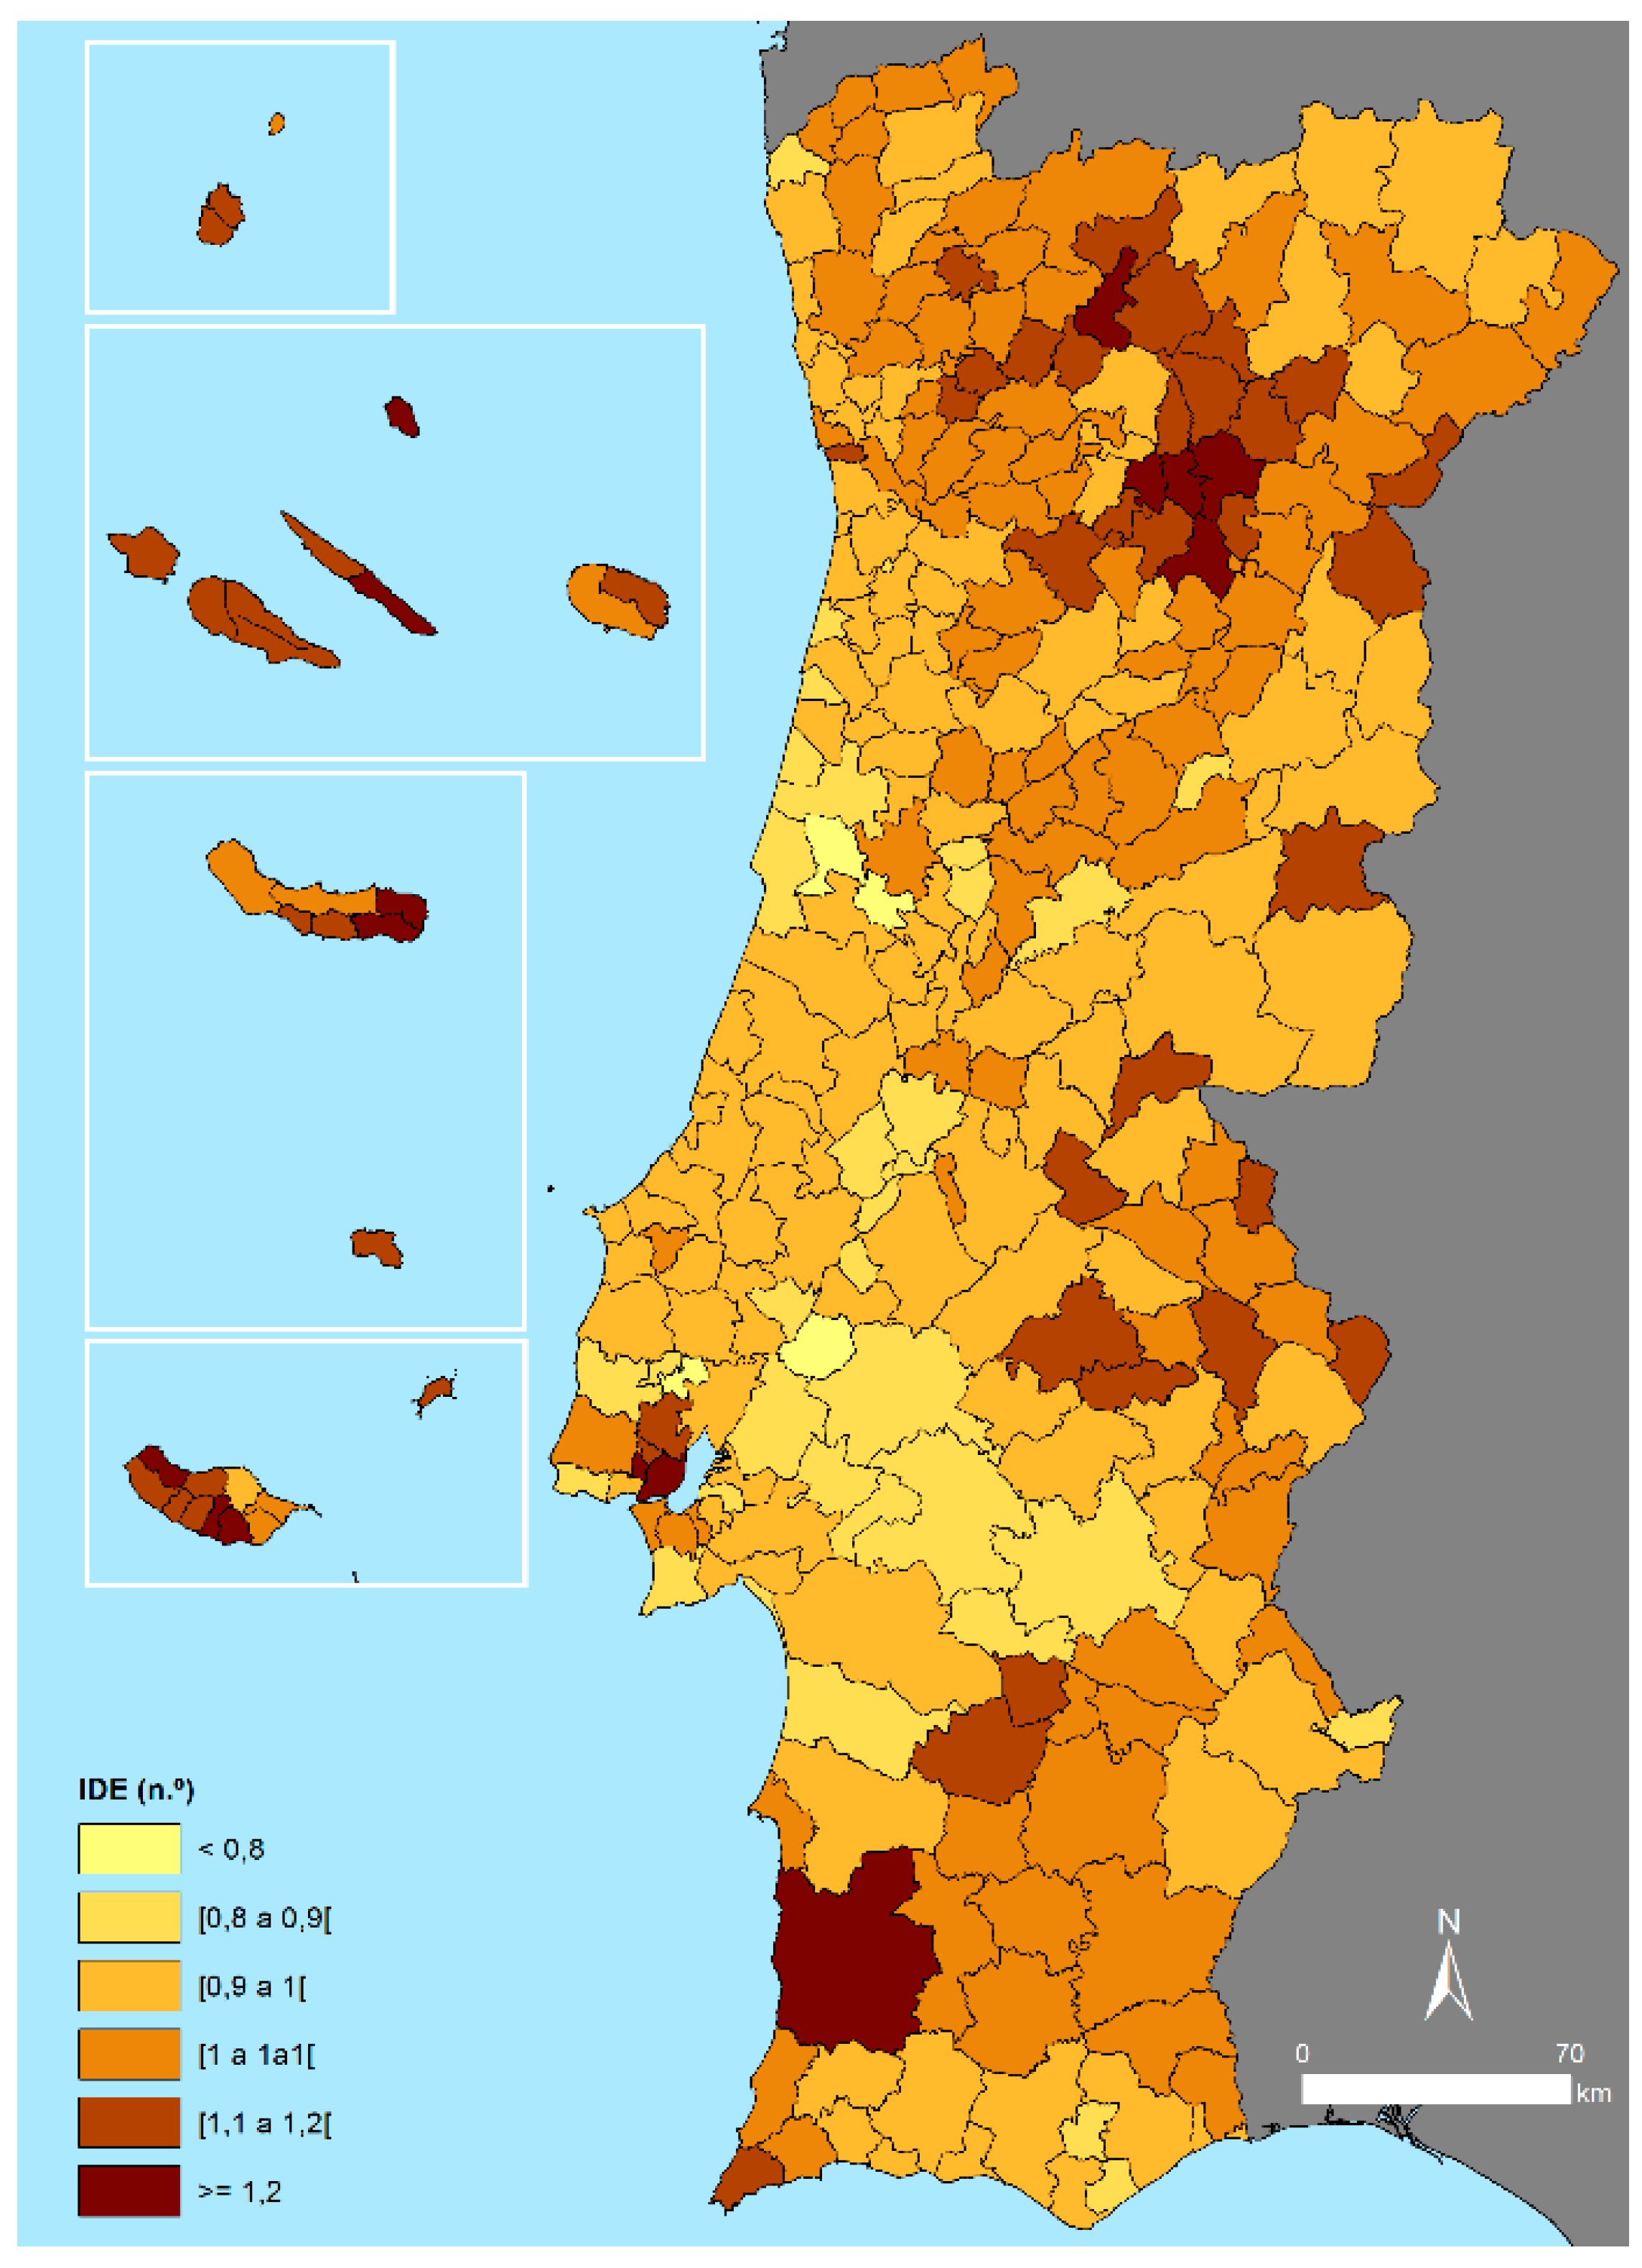
The dimension of territorial competitiveness is characterized by a territorial mosaic with municipal performance significantly below the national average, encompassing 97.4% of municipalities (
Figure 6). Indeed, only eight municipalities exhibit higher economic competitiveness, in this order of magnitude: Lisbon, Porto, Oeiras, Coimbra, Funchal, Vila Velha de Ródão, Aveiro, and Braga. Negative performance is widespread across almost the entire country, though it is most pronounced and concentrated in the Alto Alentejo and the Central Region. Municipalities recording the lowest values include Alvito, Azambuja, Vila Nova da Barquinha, Lajes das Flores, Sardoal, Sobral de Monte Agraço, Porto Moniz, Mourão, and Mangualde.
This analysis of the economic competitiveness of the Portuguese territory involves three composite indices. The first is associated with economic productivity, displaying a territorial mosaic marked by the significance of regions with a deep industrial tradition, notably Ave, Cávado, Tâmega e Sousa, and the Leiria Region (
Figure 7). At the municipal level, the ten municipalities with the best performance are Felgueiras, Lisbon, Guimarães, Barcelos, Águeda, Oeiras, Pombal, Santa Maria da Feira, Paredes, and Cinfães, contrasting with Crato, Azambuja, Alter do Chão, Alvito, Alcanena, Barrancos, Mangualde, Ílhavo, and Porto Moniz, which appear at the bottom of this list.
Productivity is analyzed using three indicators. The first, business productivity, analyzed through the average gross value added (GVA) per company, reflects a trend towards higher values concentrated in metropolitan areas and the Central Region of Portugal. Municipalities like Vila Velha de Ródão, Oeiras, Lisbon, and Castro Verde show GVAs over three hundred thousand euros per company, whereas in Alvito, Vinhais, Alfândega da Fé, among others, it does not reach fifteen thousand euros per company, highlighting existing asymmetries. The significance of exports, analyzed through the trade balance per number of companies, reveals varied national trends but shows a dependency on importing certain goods and services, especially in more populated areas without significant industrial activity. Here, 51% of municipalities show a positive balance, with notable ones including Castro Verde and Constância. Conversely, Azambuja and Lisbon record the most negative values. Lastly, the map of business activity diversification shows a concentration of turnover in the four largest companies, with 46.8% of municipalities having over 30% of turnover concentrated in their four largest companies. Only 10.1% of councils have a concentration below 15%, with places like Albufeira and Barcelos even below 9%.
The second composite indicator is the business dynamics index (
Figure 8). This shows a map marked by very diverse territorial patterns, with higher values concentrated in the Northern and Central regions and some municipalities of Alentejo and the Autonomous Region of Azores. Municipalities performing well include Vila do Porto and Lisbon, while lower records are seen in Montijo and Amadora.
Business dynamics are measured from four distinct indicators. The first relates to business vitality, showing a greater ability for business survival in the Northern Region, although the differences are not markedly high. At the municipal level, a survival rate of businesses created two years earlier above 70% is registered in Vila do Porto, Corvo, Penedono, Resende, Castro Daire, Sabugal, Murtosa, and Vila de Rei. In contrast, values below 50% are found in Castelo de Vide, Oleiros, Figueira de Castelo Rodrigo, Porto Santo, Almodôvar, Sardoal, and Lajes das Flores. The second indicator examines the dependency on large companies for employment, revealing no very clear territorial patterns. However, several municipalities experience a significant concentration of personnel in the four largest companies, exceeding 40% in Campo Maior, Castro Verde, Vila Velha de Ródão, Tábua, Constância, and Mesão Frio. This concentration is less than 4% in six municipalities: Sesimbra, Lagos, Albufeira, Silves, Valpaços, and Alcobaça.
The third area of analysis for business dynamics concerns the predominant size of companies operating in the territory. It is observed that in 49.4% of Portuguese municipalities, no large companies are operating, predominantly in environments where small and medium-sized enterprises prevail. In municipalities like Vila Velha de Ródão, Oliveira de Frades, Oeiras, Vila Nova de Cerveira, and Campo Maior, the proportion of large companies within the total number of companies is more significant. Finally, the fourth indicator, which contributes to understanding territorial dynamics, examines the dependency on external employment. This dependency is significantly higher in major urban clusters, specifically in the two metropolitan areas and around cities like Coimbra, Funchal, or Ponta Delgada. In councils such as Vila Nova da Barquinha, Moita, Odivelas, Condeixa-a-Nova, Amadora, Valongo, Seixal, Barreiro, Sobral de Monte Agraço, Santa Cruz, Alcochete, Gondomar, and Montemor-o-Velho, over 55% of the employed population residing there works in another municipality. In five island municipalities – Vila do Porto, Corvo, Horta, Porto Santo, and Santa Cruz da Graciosa – this figure is less than 10%.
Lastly, the third composite indicator analyses issues of innovation, knowledge, and development (
Figure 9). This map shows strong differentiation in some municipalities relative to others, with notable emphasis on major urban centers and territories hosting higher education institutions. Lisbon, Porto, Oeiras, Coimbra, Matosinhos, Amadora, and Aveiro top the list, while Corvo, Cinfães, São Vicente, and Porto Moniz occupy the positions with the poorest performance.
This analysis involves two indicators. The first assesses the importance of employment in sectors like communication, research, and development. As with the previous map, a higher incidence of such employment is evident in a few municipalities, especially in metropolitan contexts or areas with higher education facilities. The presence of jobs in information and communication activities or research and development is generally low—non-existent in 17.5% of municipalities—and exceeds five percentage points in only seven municipalities: Porto and Lisbon (where it is over 10%), Oeiras, Coimbra, Matosinhos, Aveiro, and Amadora. The second indicator more broadly examines the significance of skilled labor by looking at the proportion of the employed population that has completed higher education. Although previous patterns persist, there is a clear trend of concentrated skilled employment in the heart of the two metropolitan areas. In Lisbon, Oeiras, and Porto, over 45% of the employed population are higher education graduates, with only three other municipalities—Amadora, Coimbra, and Matosinhos—exceeding 30%. These figures are typically lower in some insular contexts or areas with a strong industrial tradition (especially in the North), where less than 9% of the employed population has higher education in municipalities such as Cinfães, Corvo, Porto Santo, among others.
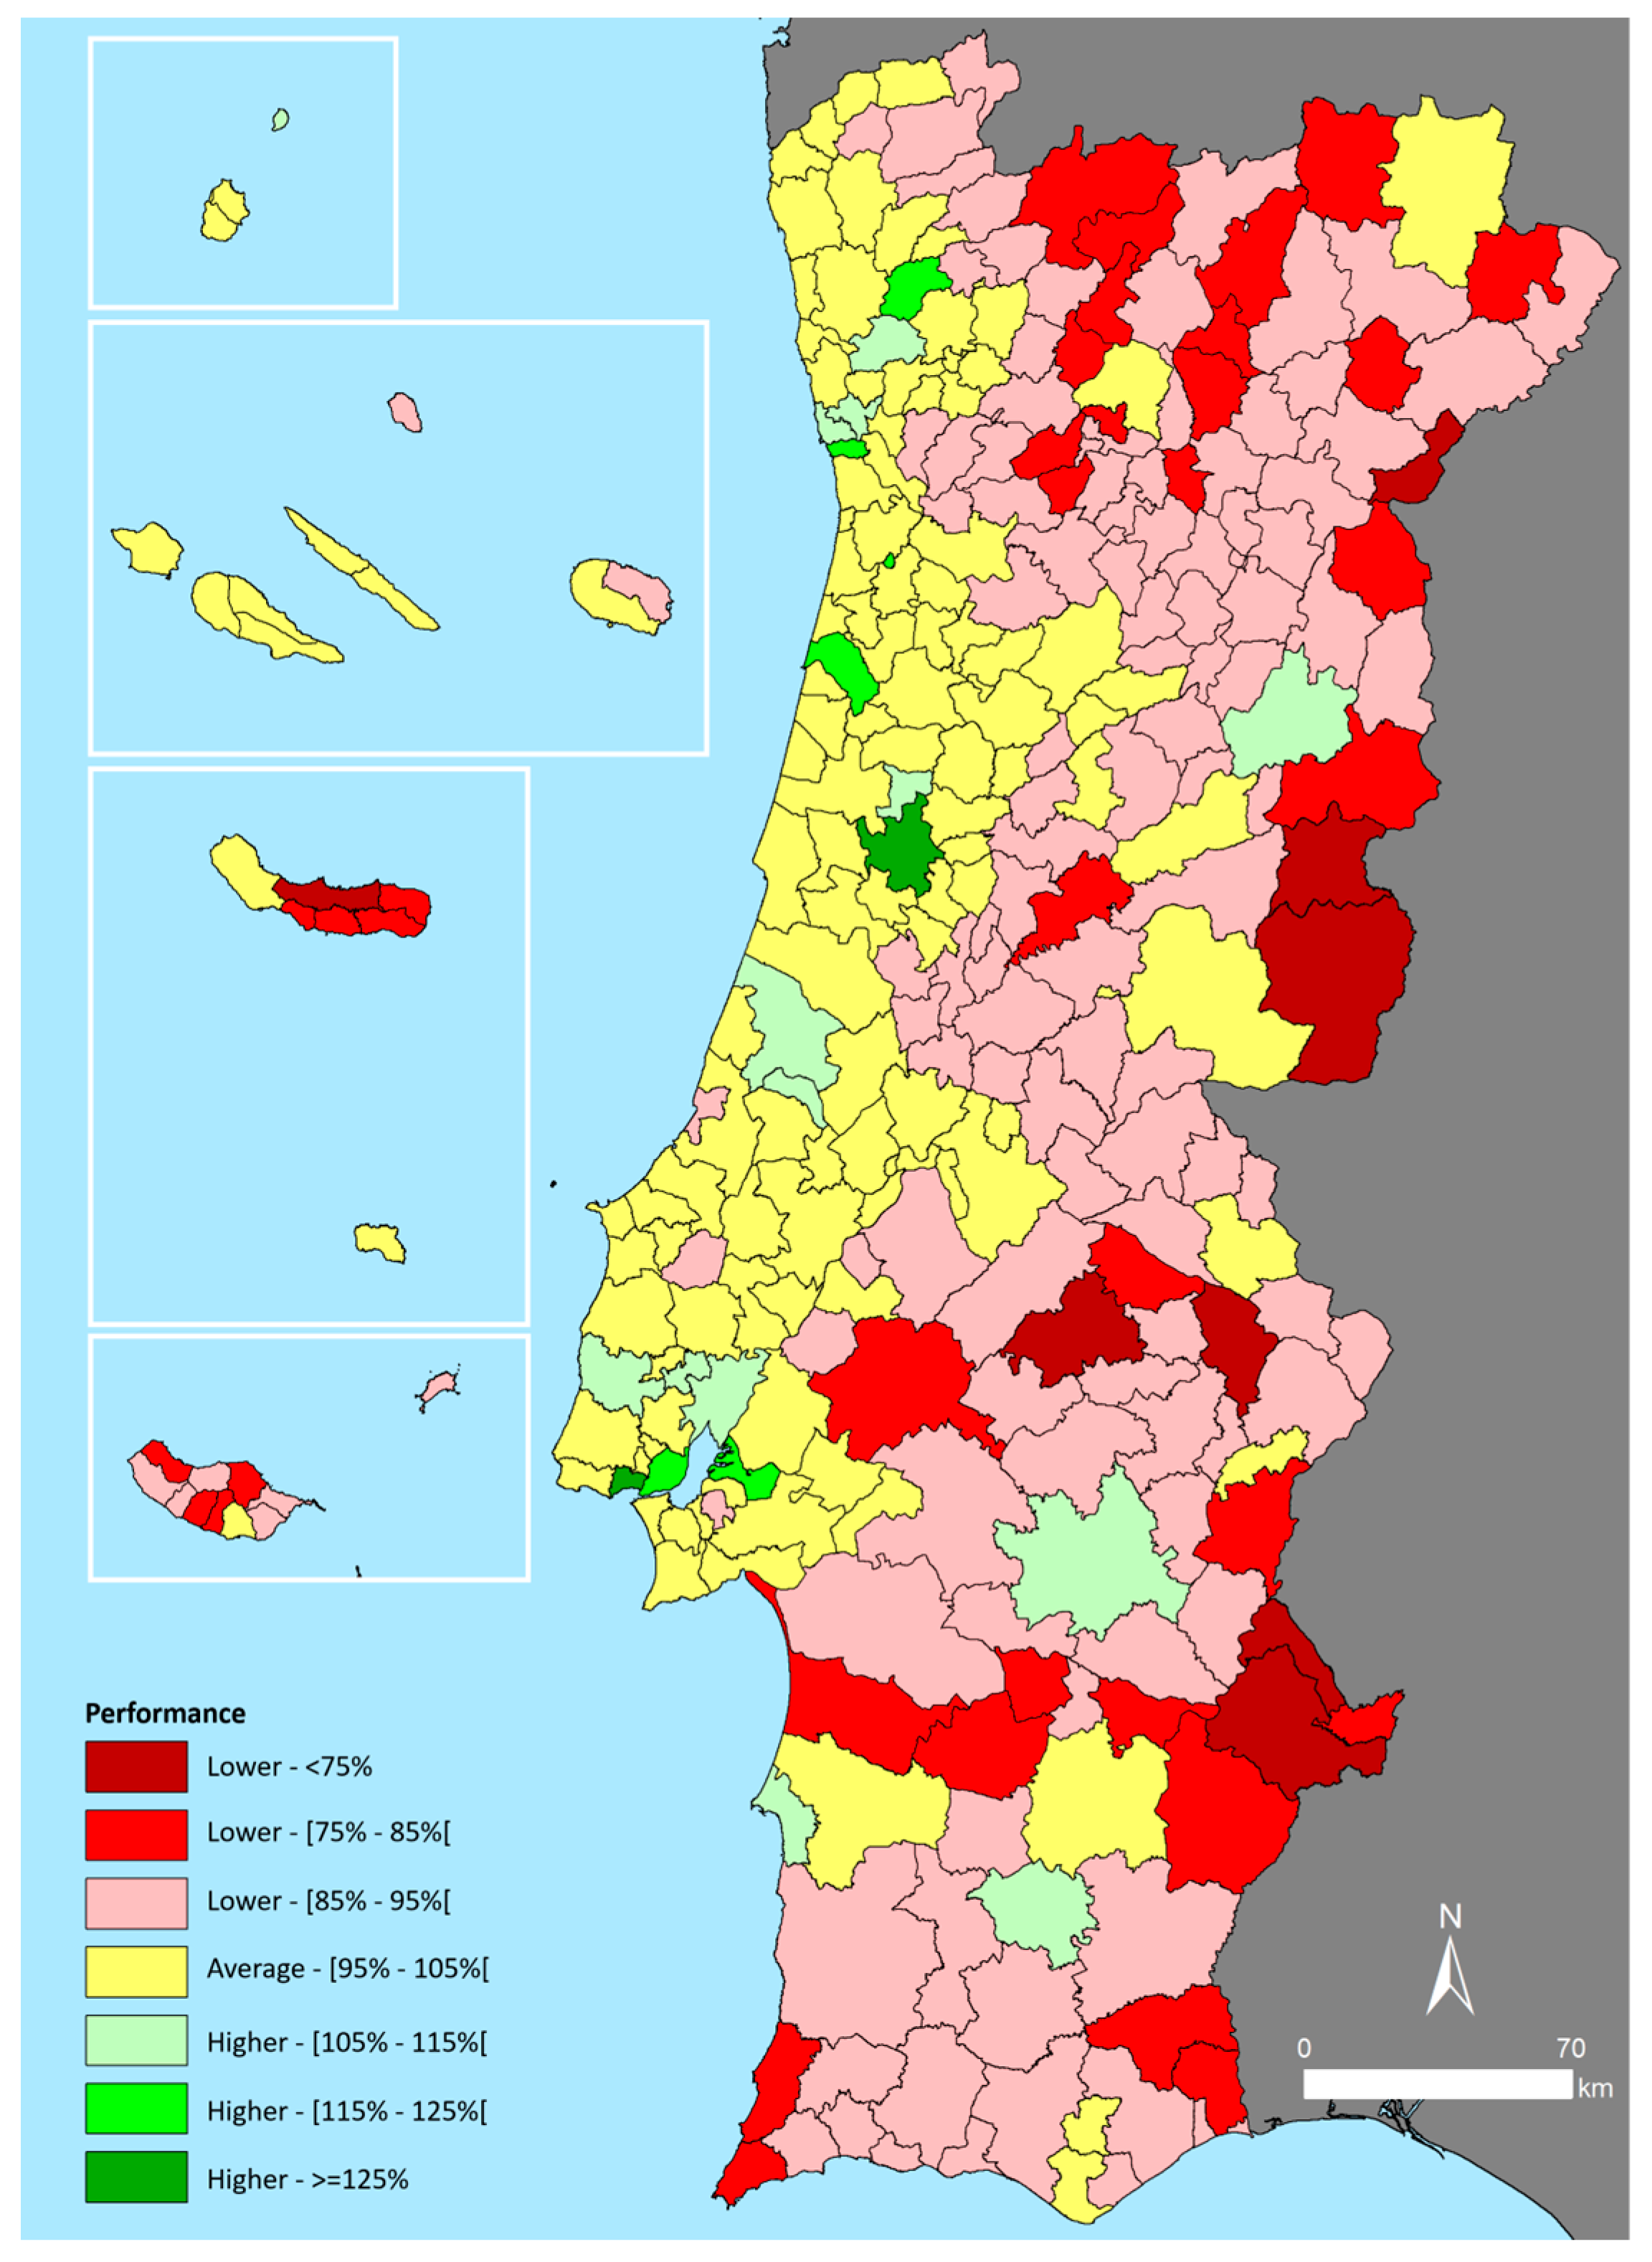
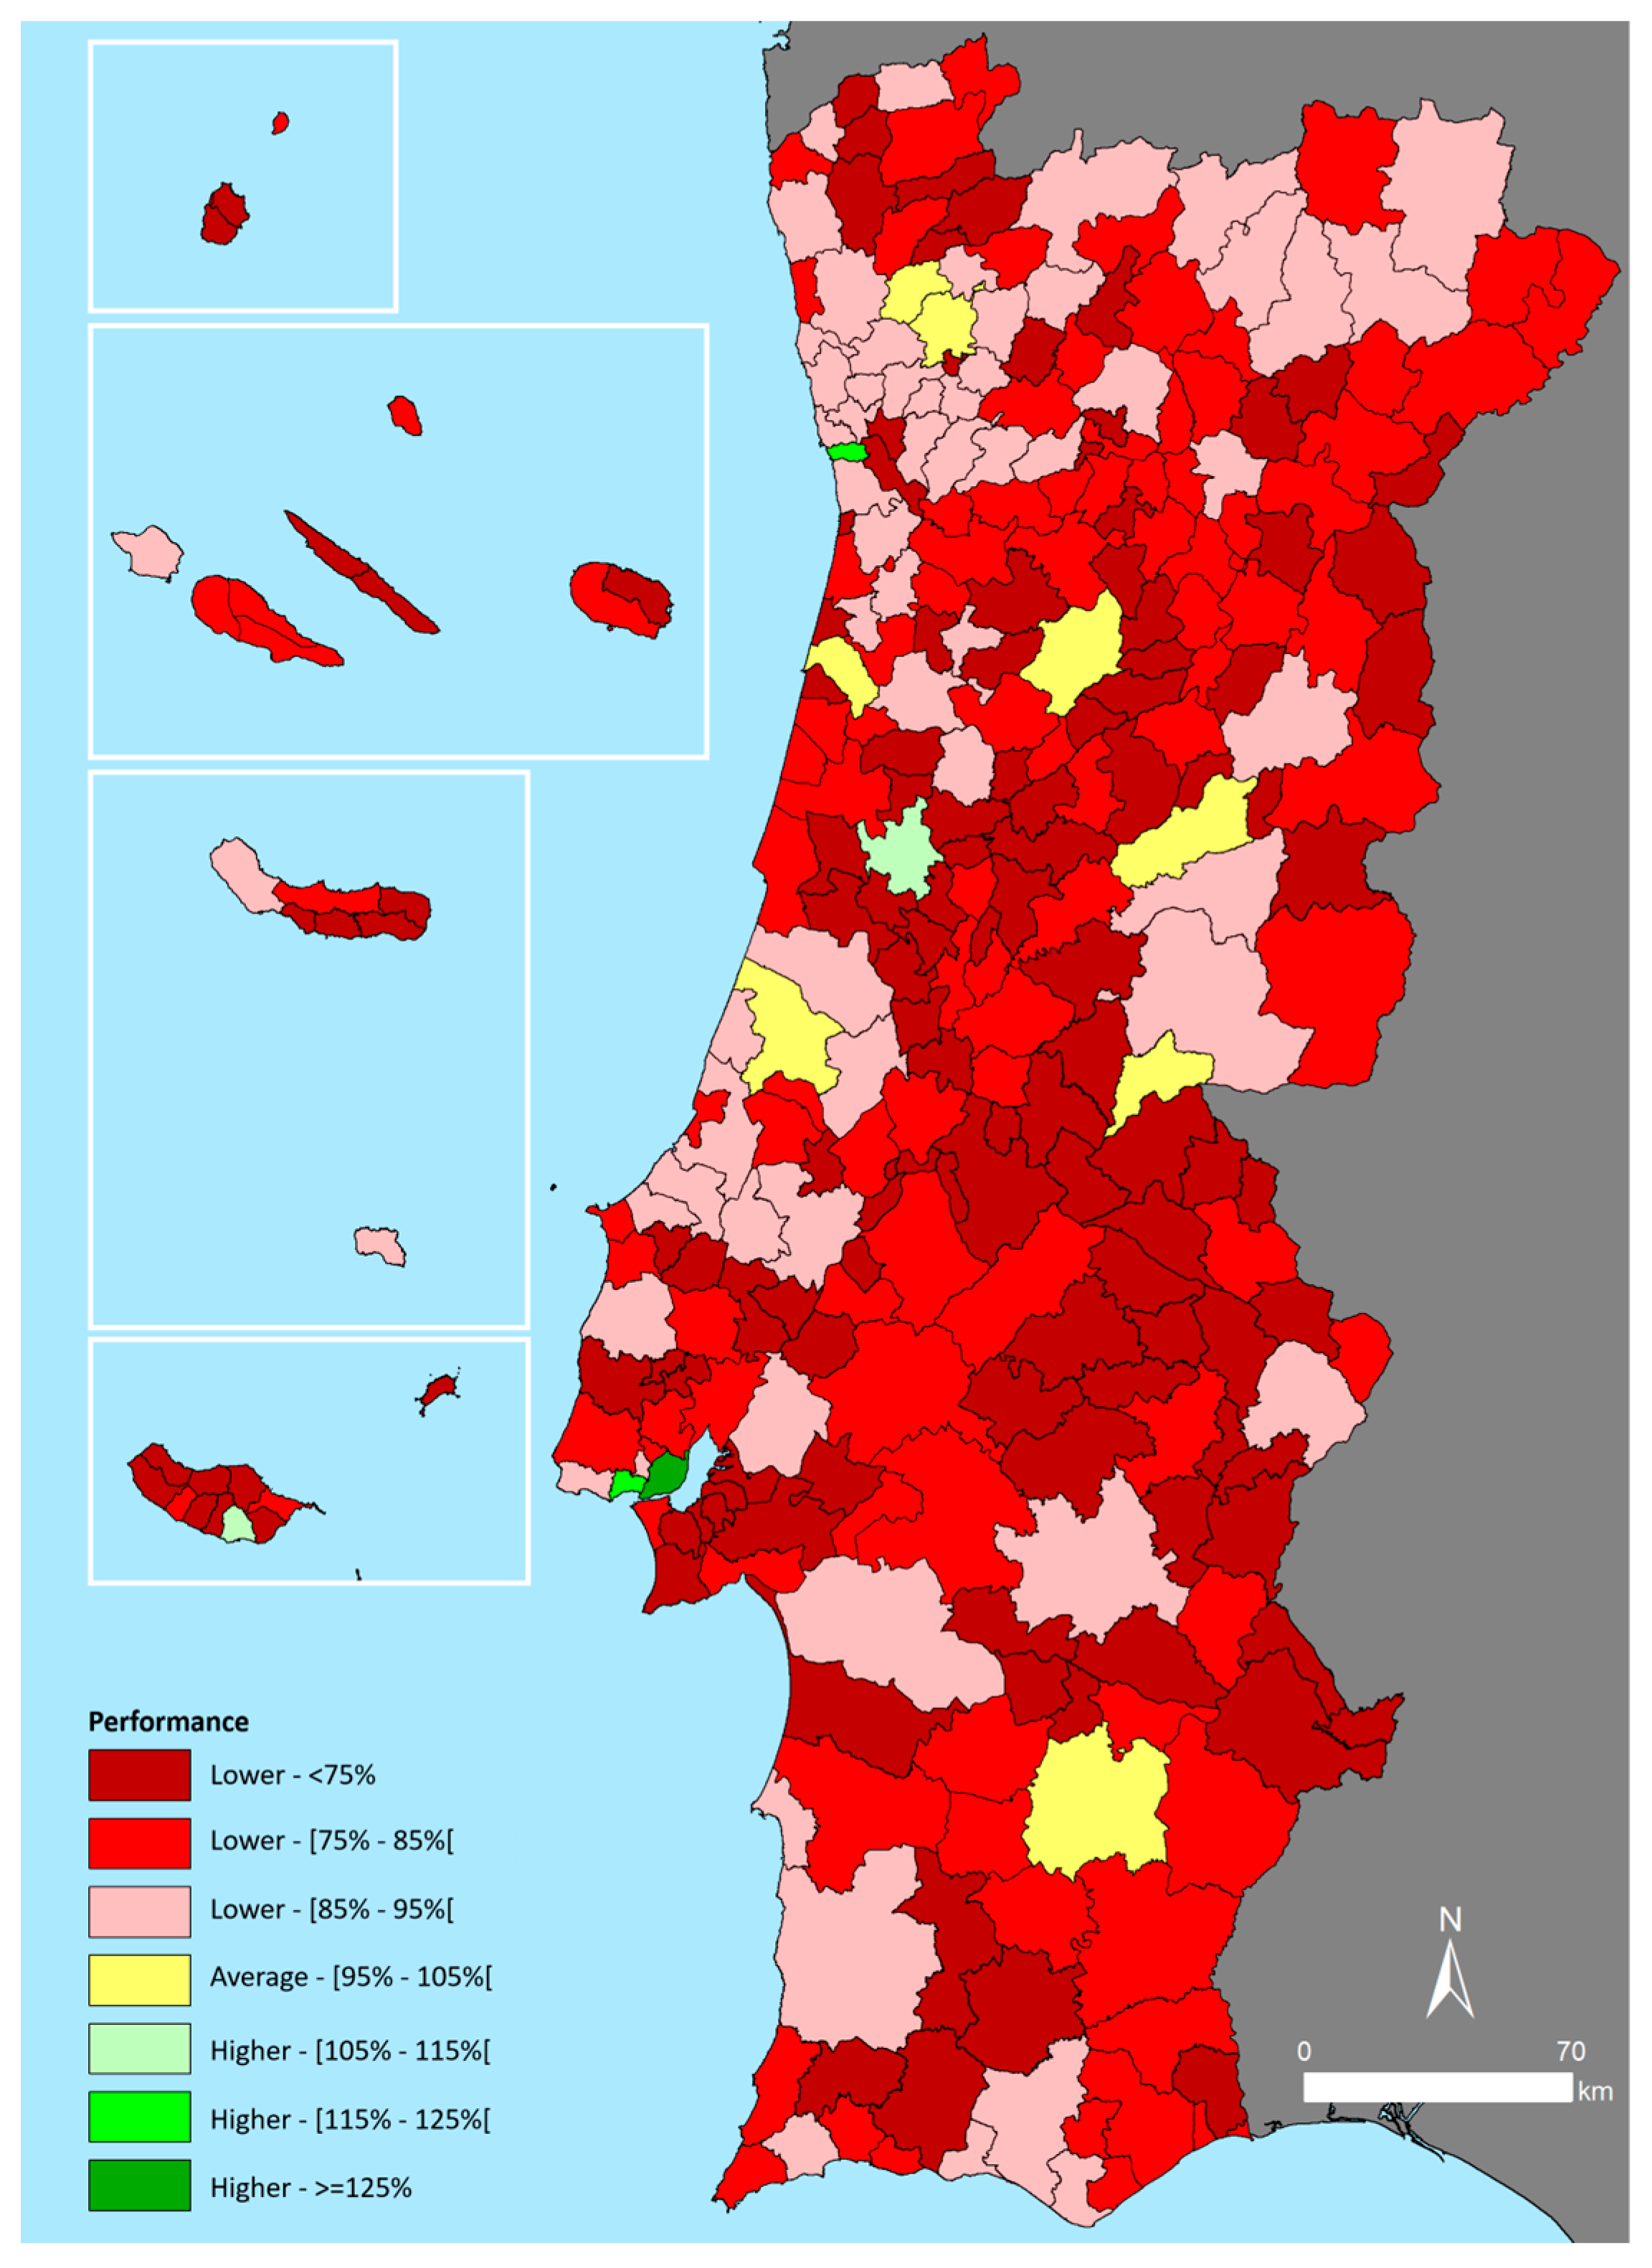
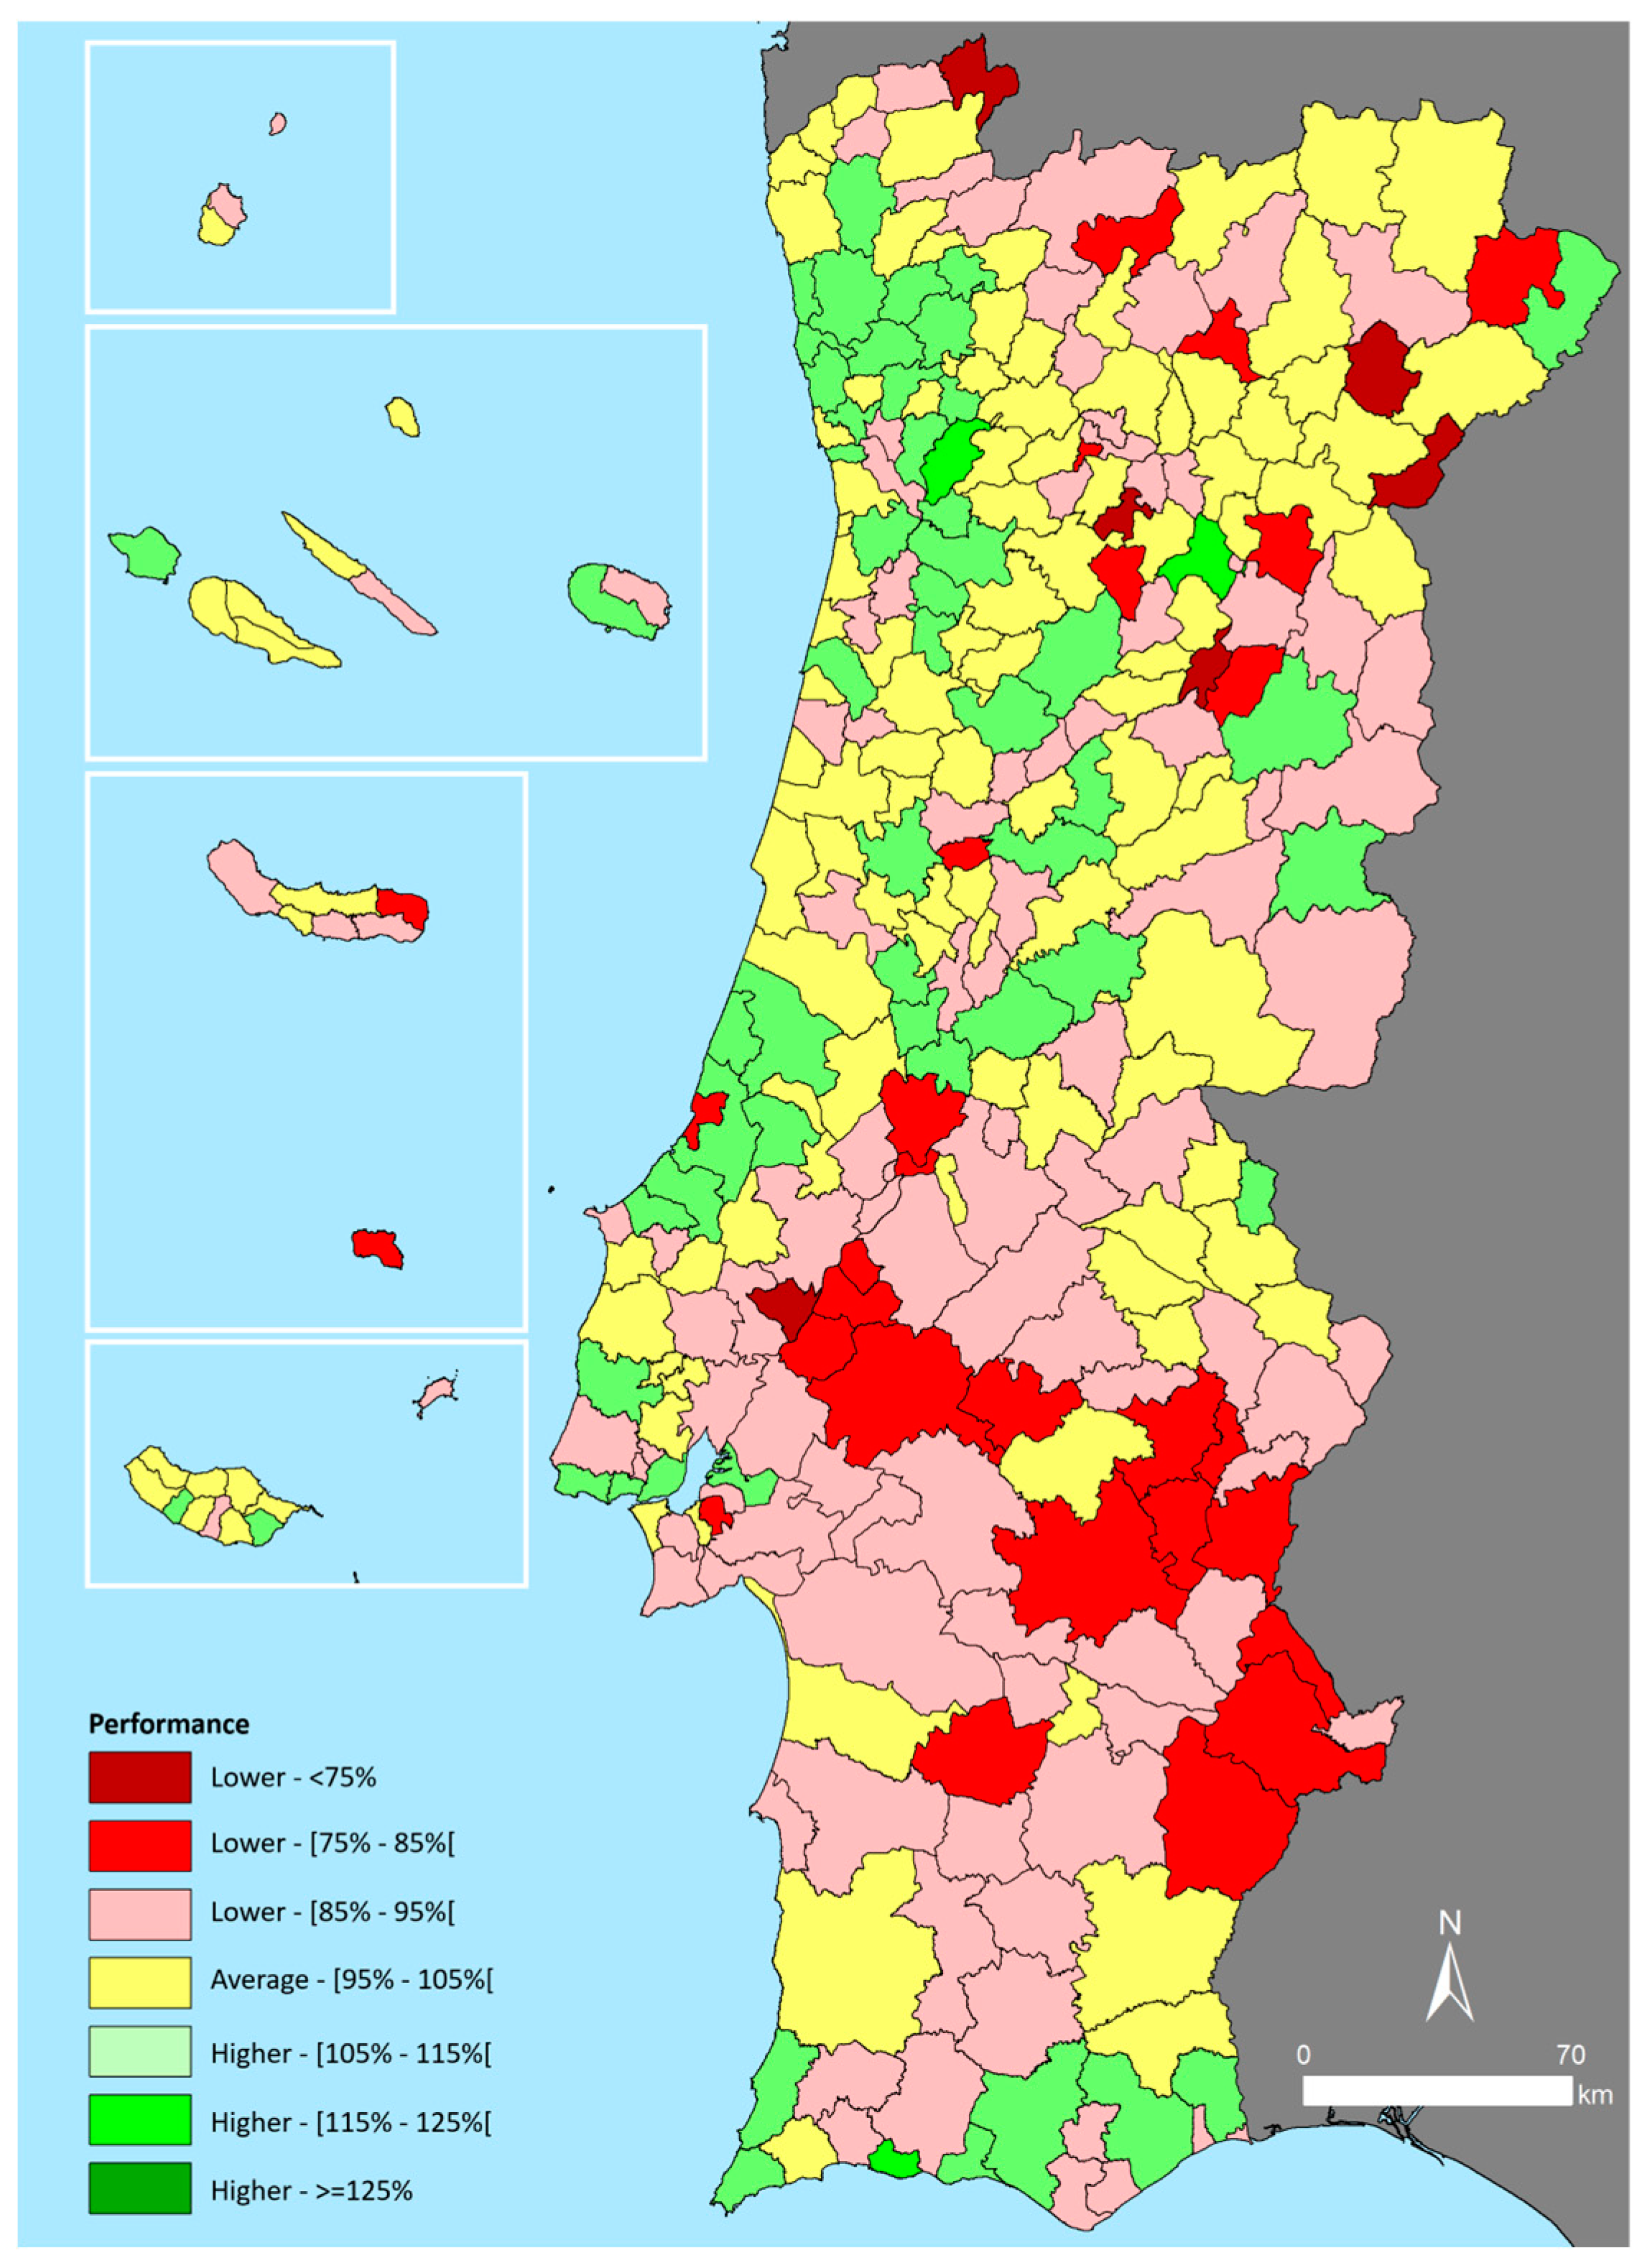
3.4. Governance
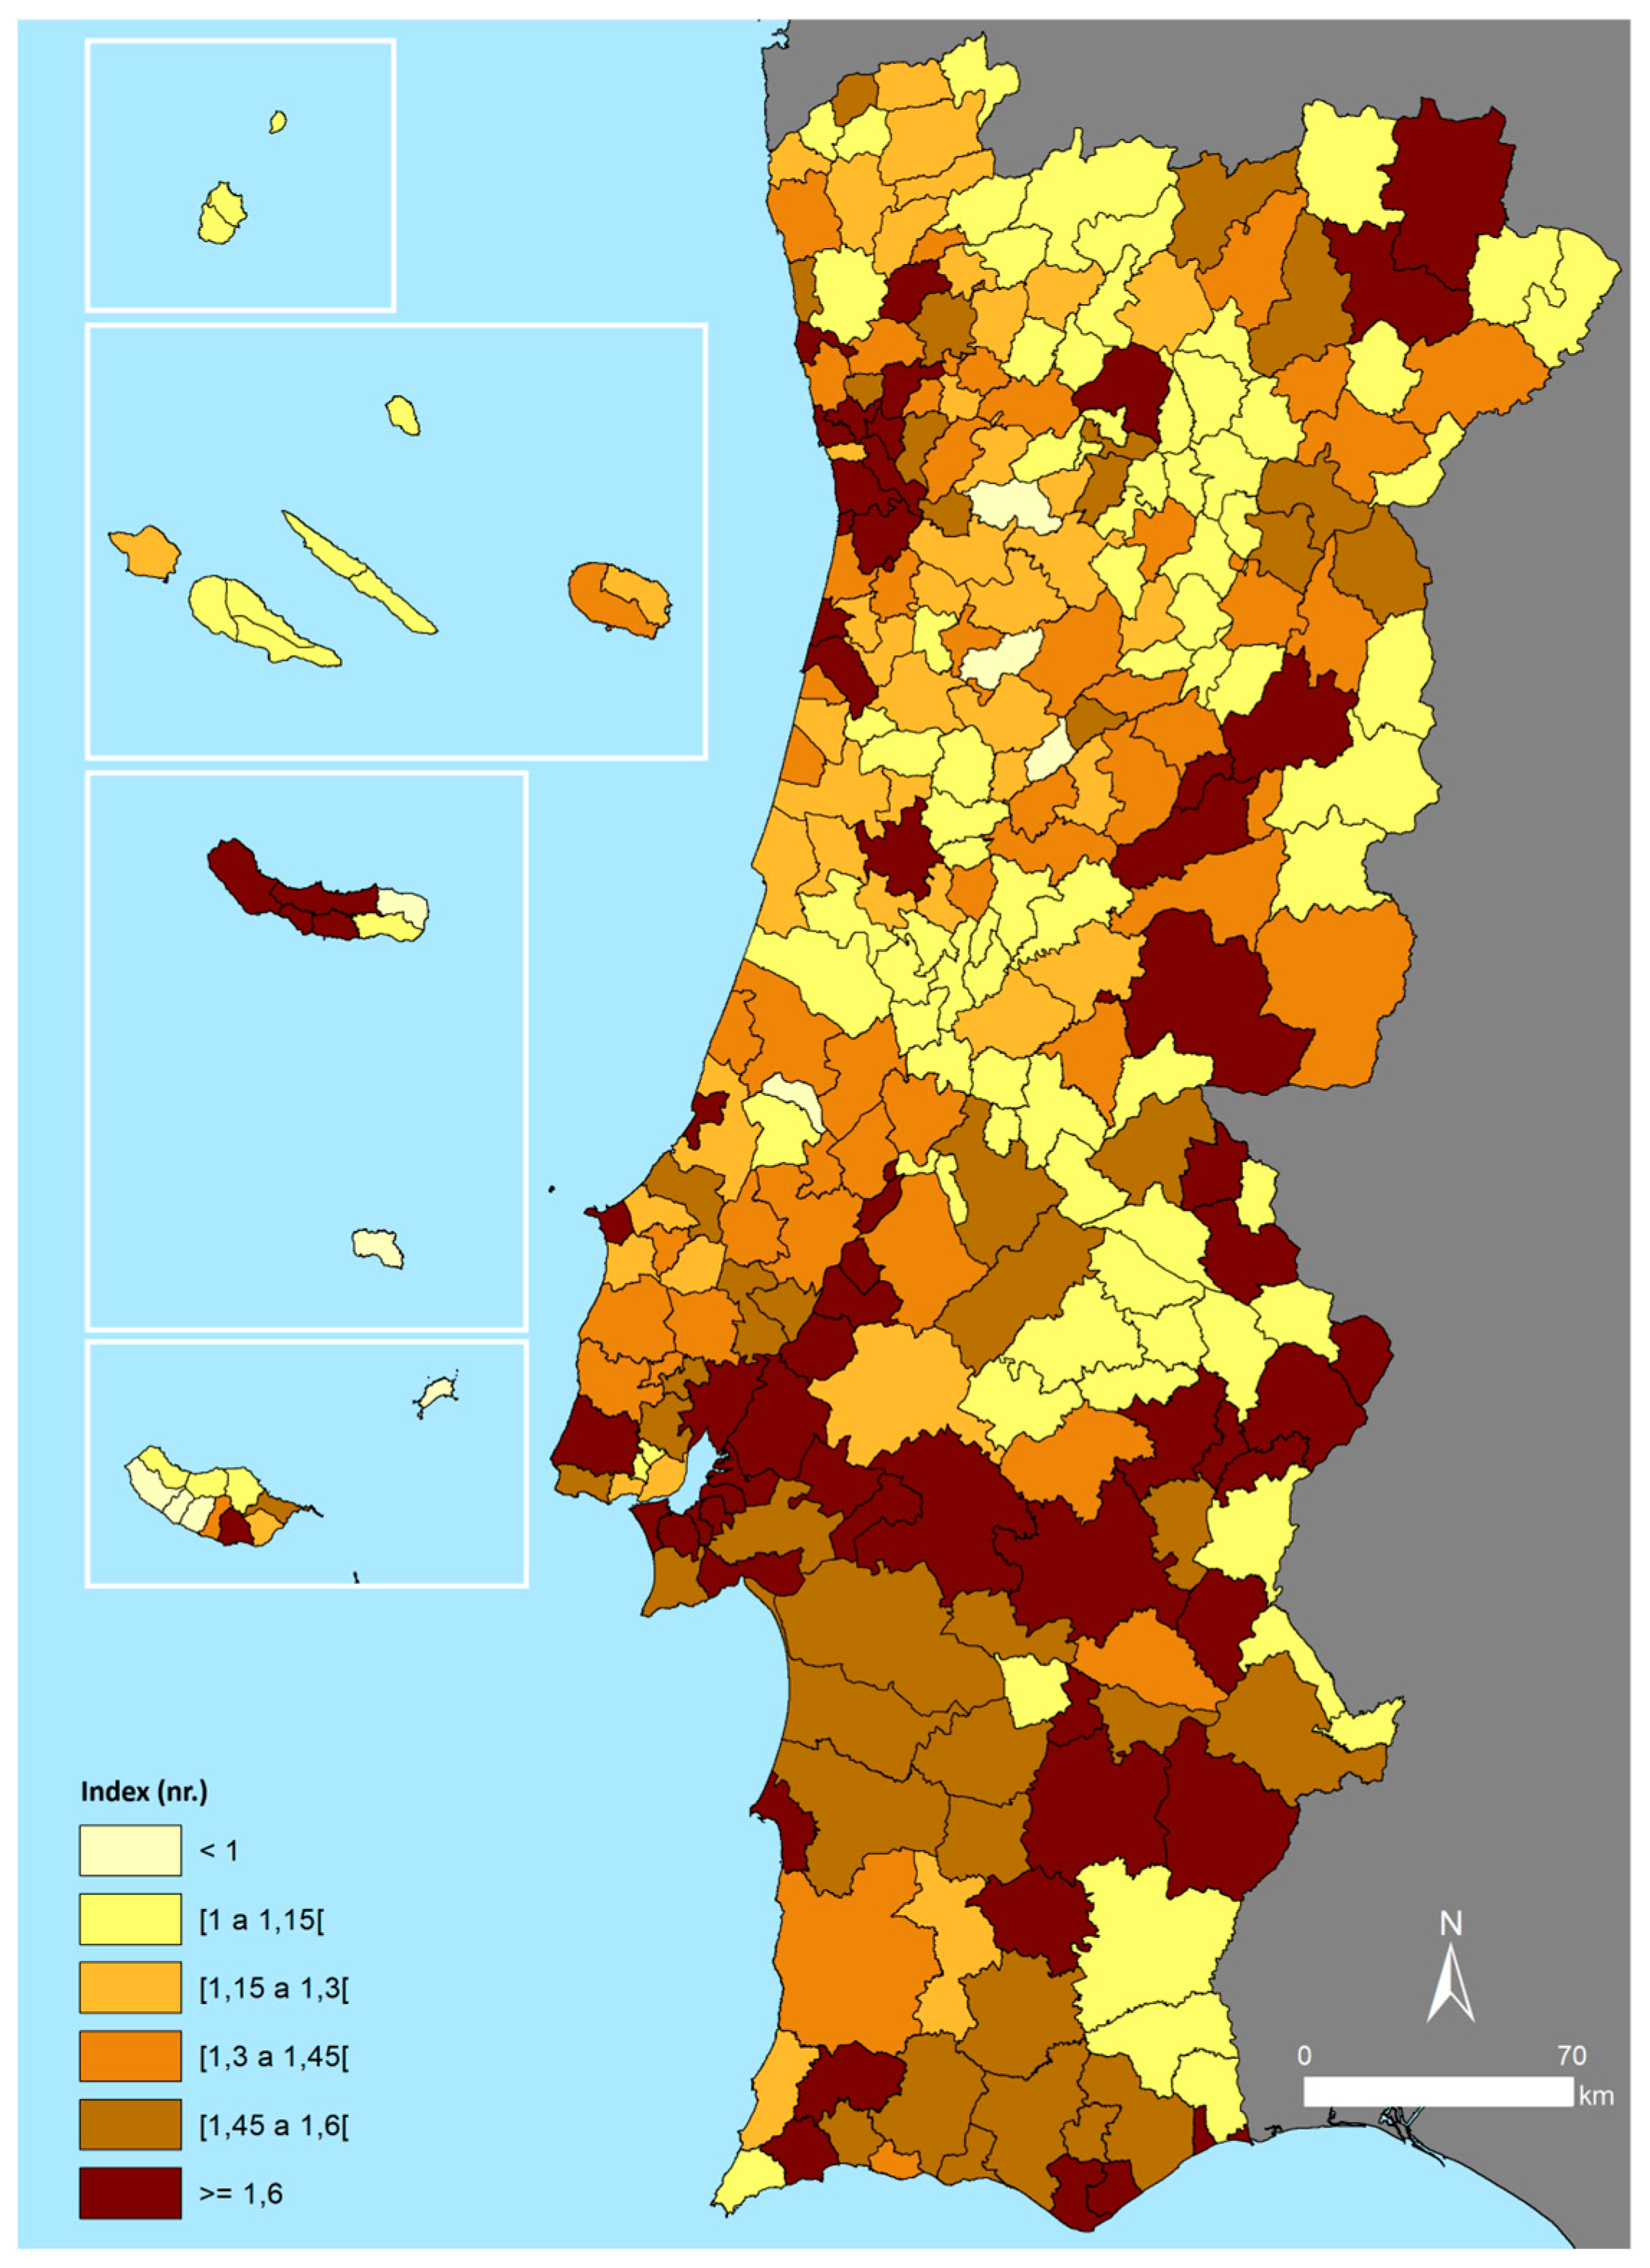
The dimension related to the governance of territories once again shows a country with considerable asymmetries, where the majority of municipalities (65.9%) perform below the average for Portugal (
Figure 10). However, the intensity of these differences is less than what we observe in other development dimensions, as performances that approach the national average or are moderately above or below these values predominate. Notably positive are various municipalities in the Northern Region around the Porto Metropolitan Area, extending to Ave, Cávado, Alto Minho, and Tâmega e Sousa, as well as several councils in the Central Region (especially concentrated near Leiria and Coimbra) and the Algarve. The municipalities with the best records include Lagoa (Algarve), Sernancelhe, Penafiel, Arouca, Leiria, Castelo de Paiva, Viseu, Póvoa de Lanhoso, Cascais, and Barcelos. Conversely, the poorest performances are particularly concentrated in the Alentejo and also appear frequently, albeit more isolated, in the interior of the Northern Region and the Eastern group of the Azores. Fornos de Algodres, Melgaço, Cartaxo, Alfândega da Fé, Freixo de Espada à Cinta, Tarouca, and Serpa show the worst records.
One of the sub-dimensions considered for analyzing good governance of territories is related to the financial management capacity of municipalities (
Figure 11). This analysis once again highlights a strong difference between the coastal strip from Viana do Castelo to Setúbal, the Algarve, and the two archipelagos with their own regional administrative structures, compared to the rest of the territory. Lagoa (Algarve), Cascais, Loulé, Albufeira, Oeiras, Lisbon, Leiria, Caldas da Rainha, Lagos, and Mafra stand out as the municipalities with the highest performance, all located in the center or south of mainland Portugal. Municipalities that show greater vulnerabilities in this index include Fornos de Algodres, Freixo de Espada à Cinta, Alfândega da Fé, Mourão, Alandroal, Mesão Frio, and Celorico da Beira.
This analysis involves three indicators. The first assesses the financial independence of municipalities. In 2019, only 22.7% of Portuguese councils were considered financially independent, defined as having at least 50% of their total revenues from their own sources. Coastal areas and the Algarve mostly comprise these municipalities, with notable ones like Lisbon and Loulé having over 80% of their revenues from their own sources. In contrast, places like Corvo and Pampilhosa da Serra have less than ten percent.
The second indicator looks at investment capacity limitations due to personnel expenses. This shows distinct regional differences, with Northern and Central regions and the Autonomous Regions performing better than others. Municipalities like Porto Santo and Cartaxo have personnel expenses exceeding 45% of total expenditures.
Finally, the debt map shows spatial heterogeneity, with coastal areas differing from the interior. Arronches and Penedono, for example, have debt less than thirty euros per capita, whereas in places like Fornos de Algodres and Vila Real de Santo António, it exceeds three thousand euros per inhabitant.
The second sub-dimension of governance analysis involves civic engagement and participation, measured by the abstention rate in the 2021 local elections. Higher abstention rates in metropolitan areas and the Algarve suggest that in populous municipalities, voter disengagement is more pronounced. For instance, in Sintra and Loulé, abstention exceeded 58%, whereas it was below 25% in smaller or less populous areas like Corvo and Freixo de Espada à Cinta..
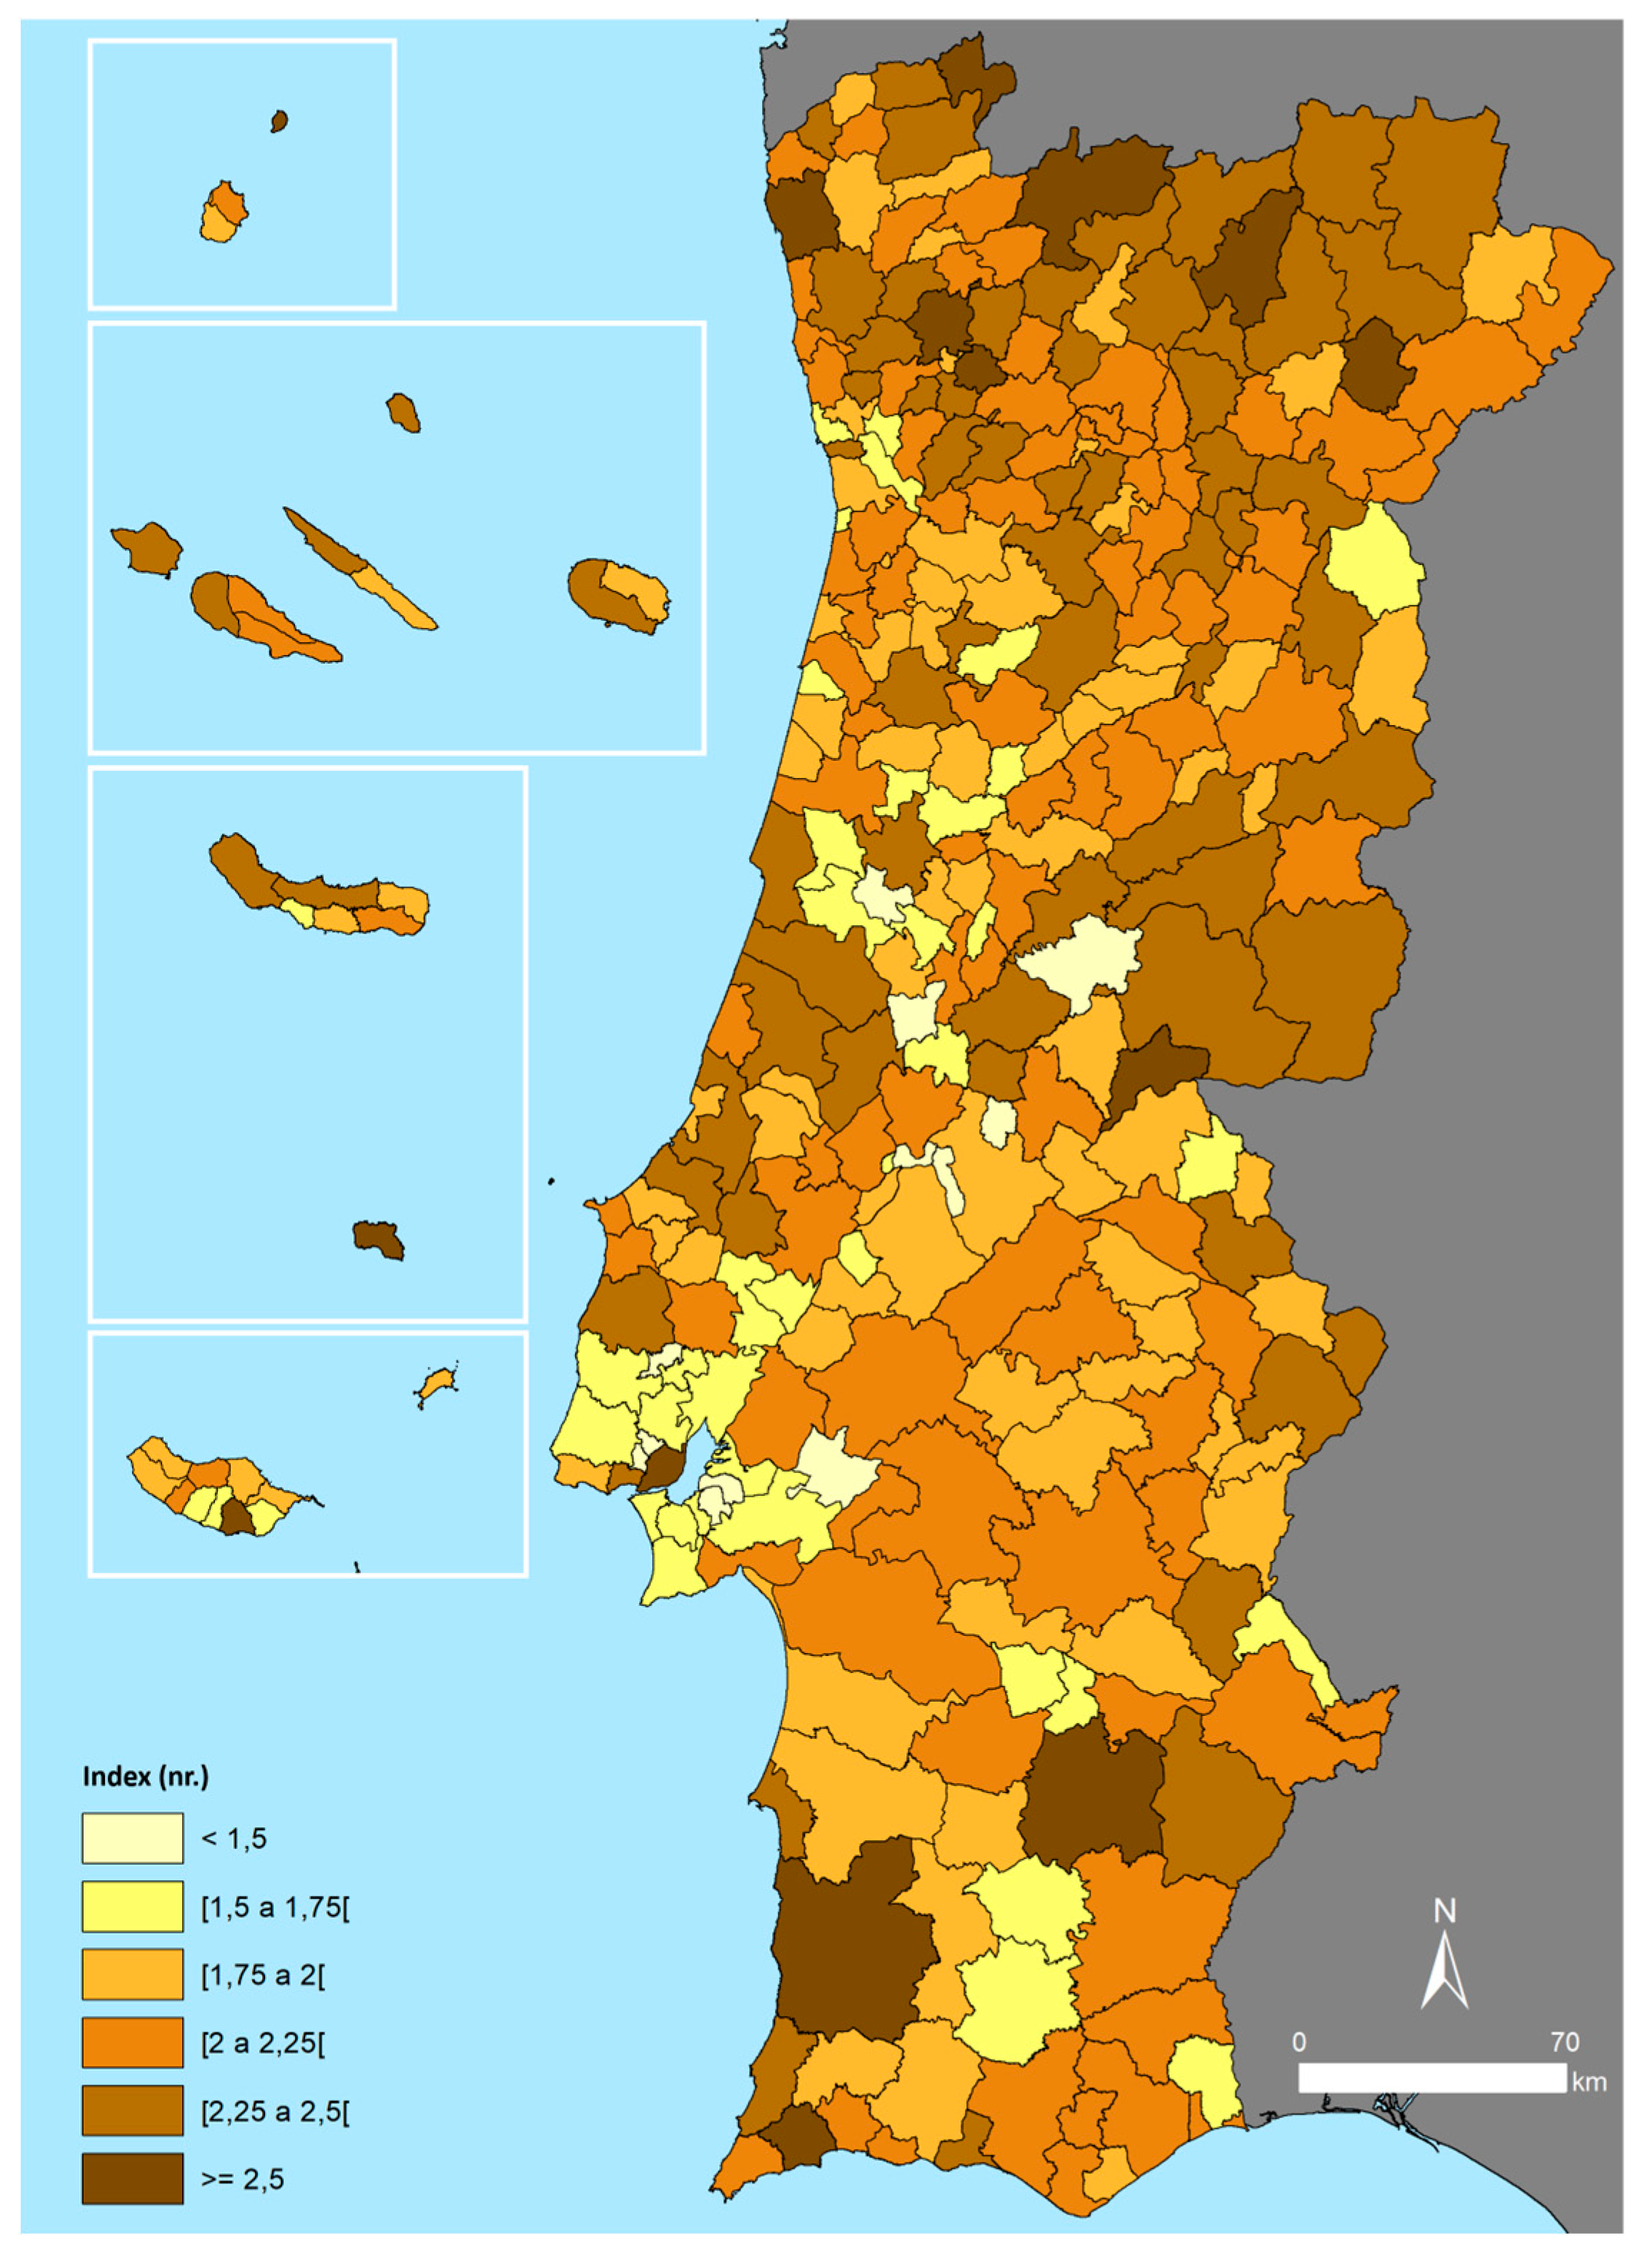
3.5. Sustainability
Sustainability is a universally recognized paradigm, especially in its association with territorial-based development. When analyzing this dimension, we find that Portugal still exhibits significant spatial asymmetries, with the most concerning performances concentrated in the North and Central regions, and lower incidence in the South and metropolitan areas, except for Lisbon and Porto (
Figure 12). At the municipal level, the differences are quite significant; only 19.2% of municipalities perform above the national average – notably Funchal, Barrancos, Monchique, Redondo, Alcochete, Chamusca, Seixal, Lagoa (Azores), Castelo de Vide, and Campo Maior – with particularly weak performances in Alandroal, Povoação, Alvaiázere, and Ribeira Brava.
The sustainability analysis includes three sub-dimensions. The first is linked to an environmental protection and defense index, where the interior of the Central Region, Madeira, Alentejo, and Algarve excel (
Figure 13). At the municipal level, councils such as Barrancos, Monchique, Mação, Sardoal, and Porto Moniz stand out, while the poorest performances are recorded in Vila Nova de Poiares, Tomar, and Covilhã.
This index is essentially composed of municipal investment in the environment and its relation to the population size. Regarding waste management expenses, the highest investment volumes are seen in Alentejo, Algarve, the northeastern border areas of Portugal, and the island regions, generally corresponding to areas with smaller populations. Included here are municipalities like Porto Moniz, Albufeira, Nisa, Aljezur, Lagos, Lagoa (Algarve), Vila Real de Santo António, and Vila do Bispo, where investment exceeds 160,000 euros per thousand inhabitants. In the context of biodiversity and landscape protection, the highest investment per capita is recorded in the Algarve and Central Region, contrasting with the metropolitan and insular areas. In four municipalities—Mação, Sardoal, Barrancos, and Monchique—this investment even surpasses 180,000 euros per thousand inhabitants.
The second sub-dimension of analysis considers individual and collective behaviors with a direct impact on the environment (
Figure 14). There are no clearly marked territorial patterns, despite the highest values being concentrated in the Lisbon Metropolitan Area and the Azores Autonomous Region. At the municipal level, Corvo, Chamusca, Lagoa, Cadaval, Palmela, and Ribeira Grande stand out, while Vila do Bispo, Loulé, Caminha, Freixo de Espada à Cinta, and Almeida occupy the last places on the list.
For this scenario, the three selected indicators contribute in different ways. Regarding waste separation for recycling, the proportion of urban waste selectively collected remains low nationally, falling below 15% in 32.8% of Portuguese municipalities. The highest values are found in the Algarve, the Azores Autonomous Region, and metropolitan areas, although it only exceeds 40% in six municipalities: Lajes das Flores, Lagoa (Azores), Cadaval, Vidigueira, Palmela, and Lagoa (Algarve). In 17 municipalities, the values recorded in 2022 were below 10%: Mogadouro, Alpiarça, Vinhais, Vimioso, Freixo de Espada à Cinta, Alijó, Almeida, Montalegre, Cinfães, Salvaterra de Magos, Pampilhosa da Serra, Mesão Frio, Murça, Castelo de Paiva, Ferreira do Alentejo, Felgueiras, and Paredes.
Concerning energy consumption, the highest domestic consumption occurs in the Algarve, directly linked to the intensity of tourism activity, while it is less pronounced in Alentejo. This consumption exceeds 2,000 kilowatts per inhabitant in Loulé, Lagoa (Algarve), Vila do Bispo, Albufeira, Lagos, Aljezur, Castro Marim, Grândola, Tavira, Silves, and Óbidos. It is below 1,000 kilowatts per inhabitant in only five municipalities: Amadora, Santa Cruz das Flores, Câmara de Lobos, Ribeira Grande, and Vila Franca de Xira.
Finally, the number of companies operating in environmental domains remains low, being non-existent in 32.8% of Portuguese municipalities. Indeed, they represent more than 0.5% of the total number of companies only in Corvo, Chamusca, and Arruda dos Vinhos.
The third and final sustainability sub-dimension analyses the pressure on the territory (
Figure 15). This map reveals very distinct territorial patterns, with the highest pressure indicators in major urban and metropolitan areas but also, to a more or less consistent extent, across Central Alentejo. The highest values are recorded in Alcochete, Sines, Campo Maior, Benavente, and Vila Franca de Xira, while the lowest values are observed in Ponta do Sol, Batalha, Ribeira Brava, and Porto Santo.
This mosaic is shaped by population density and settlement dispersion. In the first case, the differences between the two metropolitan areas, the coastal strip connecting them, and the rest of the territory are quite striking. To grasp the scale, it is worth noting that in ten municipalities—Amadora, Porto, Odivelas, Lisbon, Oeiras, São João da Madeira, Matosinhos, Almada, Cascais, and Barreiro—population density exceeds 2,100 inhabitants per square kilometre, while in 43.2% of municipalities it is below 50 inhabitants per square kilometre, and even less than 5 inhabitants per square kilometre in Alcoutim and Mértola. Settlement dispersion, in turn, is particularly intense in the two autonomous regions as well as in the North and Central regions. In 28.9% of Portuguese municipalities, more than 90% of the population resides in small settlements, posing additional challenges, for example, in terms of infrastructure development.
3.6. Connectivity
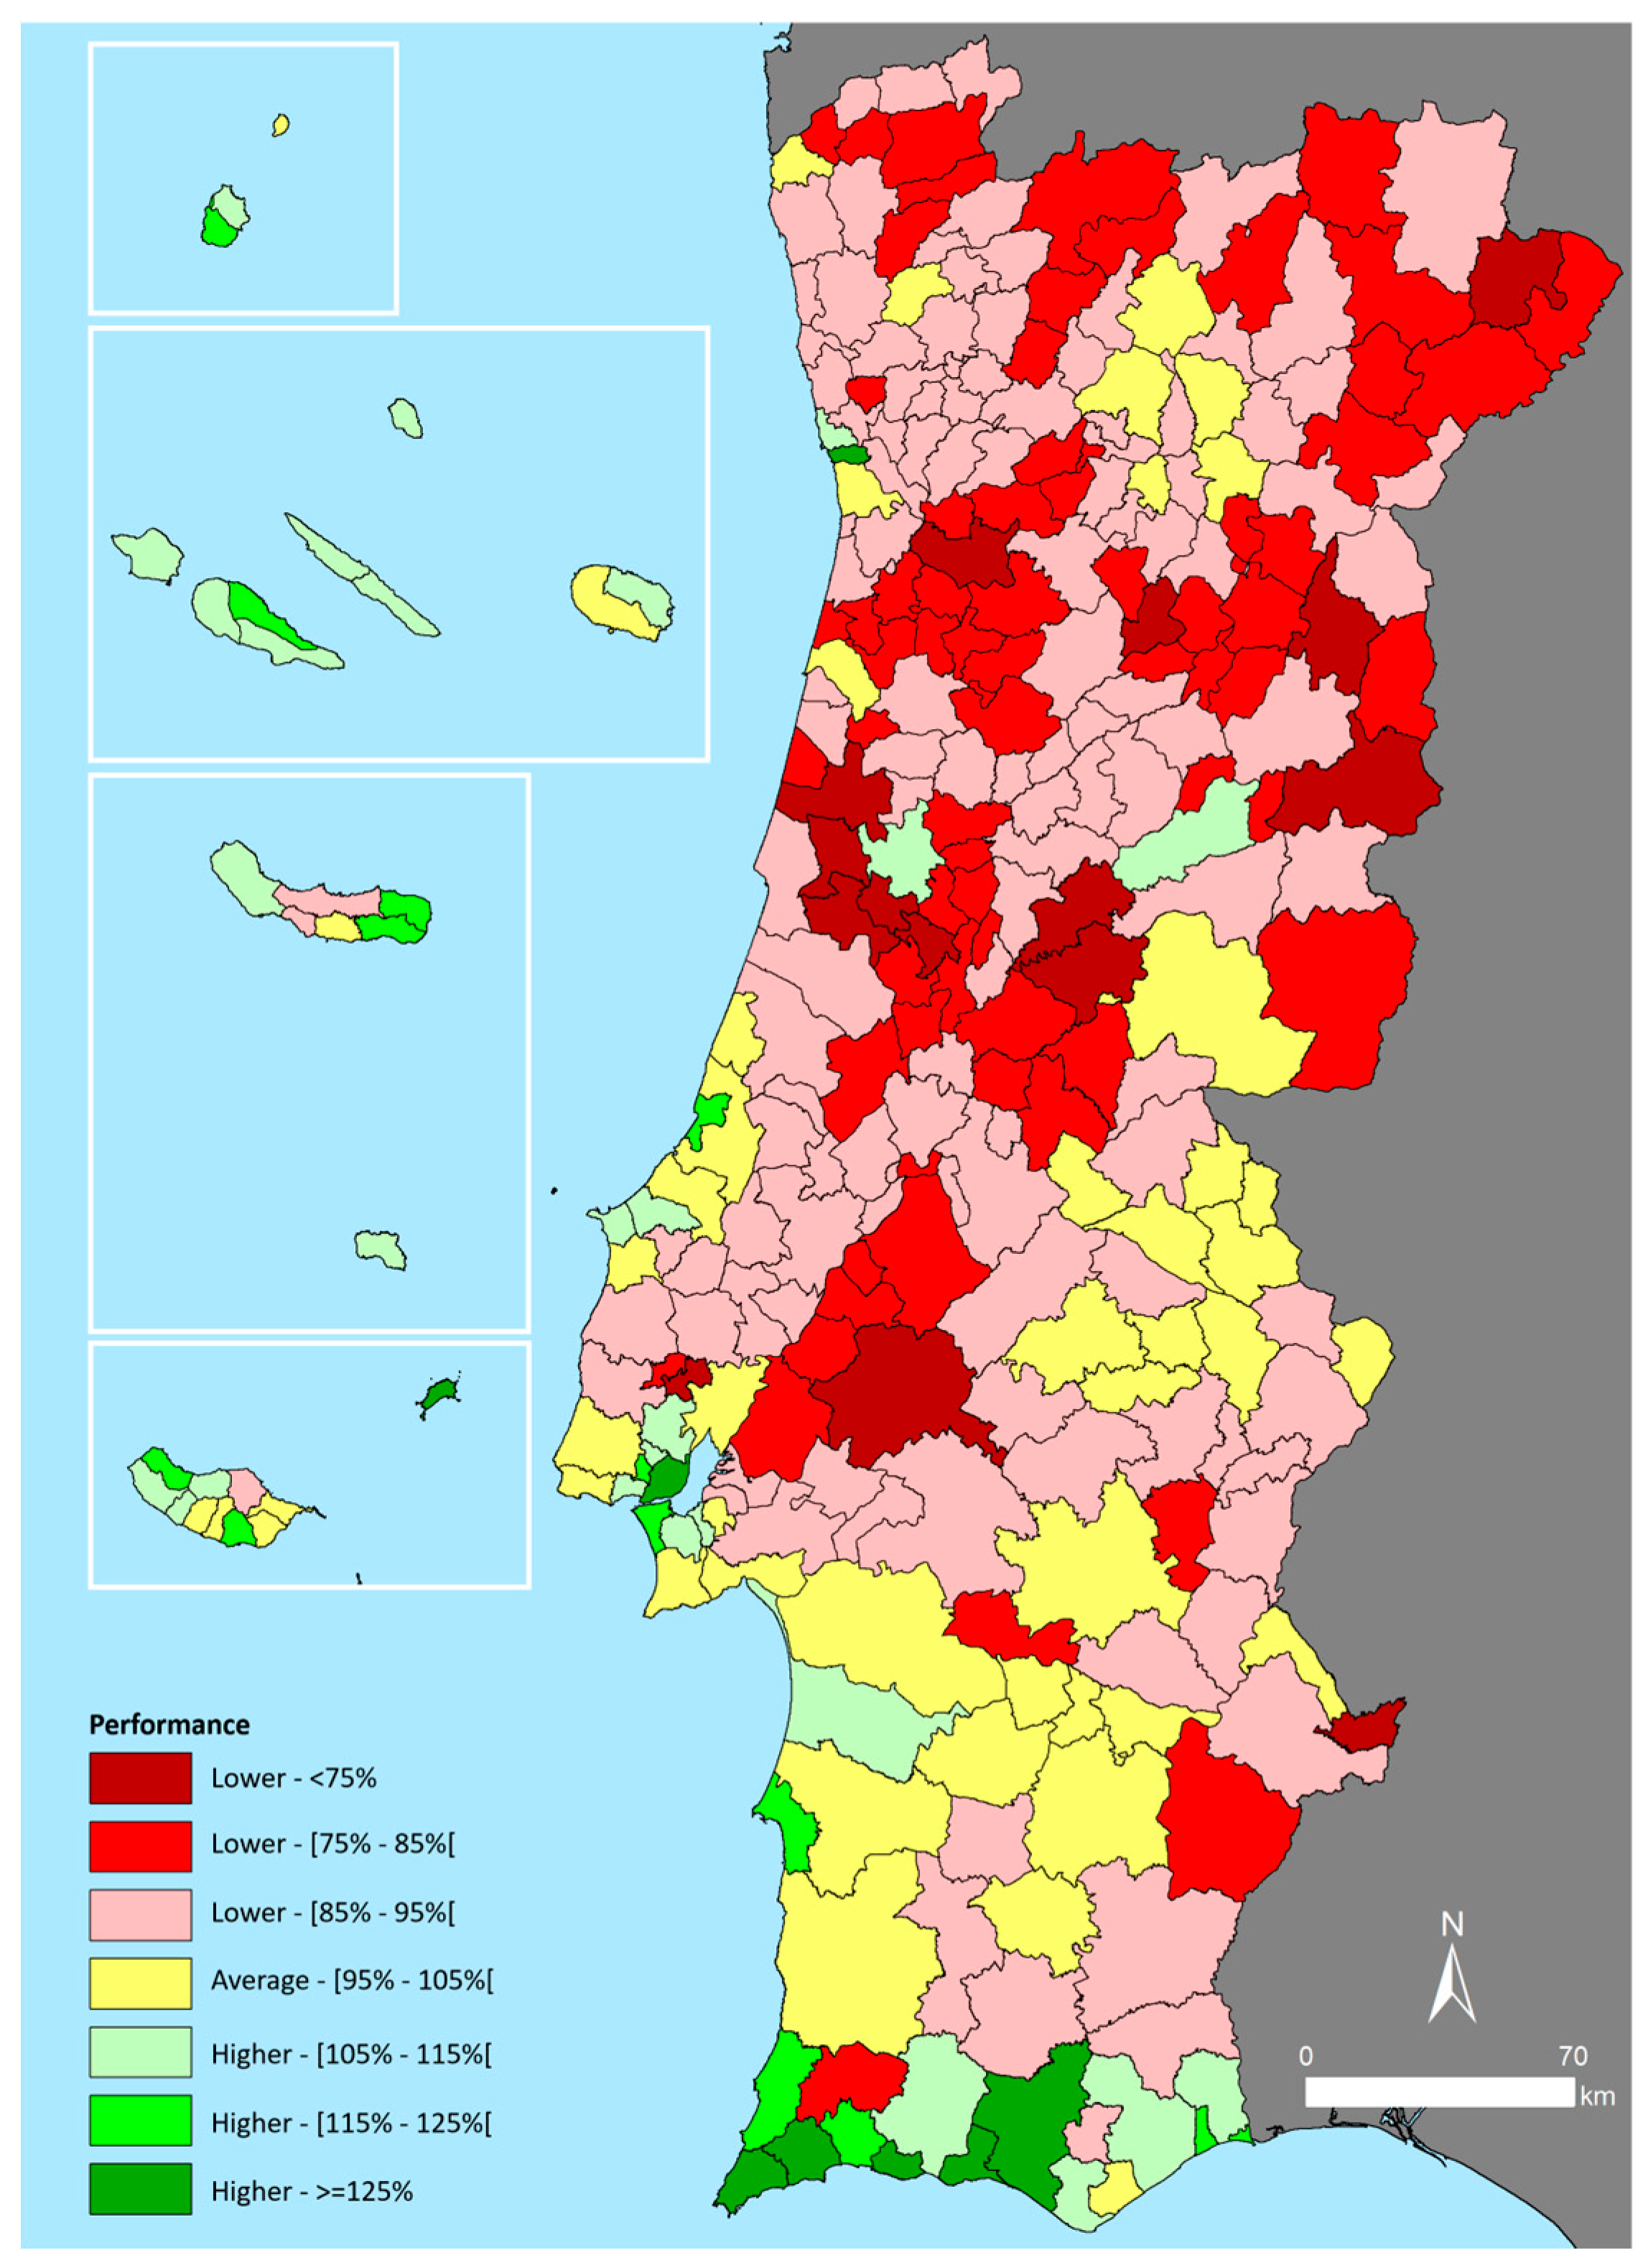
The dimension of connectivity analyses issues related to digitalisation and individual mobility patterns, based on available data. The overall map reveals a context marked by significant asymmetries, particularly evident in the contrast between the cities of Lisbon and Porto, the Algarve, and the island municipalities, compared to a considerable portion of municipalities in the North and Central regions of Portugal (
Figure 16). At the municipal level, the councils with the best performance in connectivity are Lisbon, Vila do Bispo, Lagos, Albufeira, Loulé, Porto, Porto Santo, Lagoa (Azores), Porto Moniz, and Nordeste. Conversely, the most significant challenges are observed in Montemor-o-Velho, Condeixa-a-Nova, Barrancos, Vimioso, Oleiros, and Arruda dos Vinhos.
The digital connectivity map reflects these asymmetries, further highlighting the poorer performance of the inland areas of the Northern and Central regions of Portugal. However, it is worth noting that only 22.4% of municipalities have digital connectivity indicators—measured by the ratio of internet access to residents—above the national average. The municipalities of Albufeira, Loulé, Lagos, Vila do Bispo, Lagoa (Algarve), Lisbon, and Portimão stand out with the highest values, almost all located in the Algarve. Conversely, Sernancelhe, Vimioso, Celorico de Basto, Penedono, Aguiar da Beira, Cinfães, and Resende record the lowest values.
Regarding individual mobility behaviours, the overall indicator presents a territorial mosaic with smaller differences and no clear territorial patterns, except for better performance in the Autonomous Regions of Madeira and the Azores (
Figure 17). The municipalities of Nordeste, Porto Moniz, Calheta (Madeira), Câmara de Lobos, Santa Cruz da Graciosa, and São João da Pesqueira have the highest values, contrasting with Arruda dos Vinhos, Condeixa-a-Nova, Montemor-o-Velho, and Salvaterra de Magos, which record the lowest values.
This dynamic is reflected in differentiated use of public transport and varying durations of commuting movements. In the first case, only 26.6% of municipalities report that public transport is used by 15% or more of the employed or student resident population, making this primarily a metropolitan phenomenon, although with notable values in areas like Tâmega e Sousa. Indeed, the municipalities where public transport use is most common (above 27%) are Barreiro, Amadora, Seixal, Almada, Moita, Odivelas, Lisbon, and Baião. In Corvo, Bragança, São Brás de Alportel, Marinha Grande, and São João da Madeira, this figure is below 5%.
In the second case, longer commuting durations are observed in the two metropolitan areas and adjacent regions—albeit to a lesser extent in Coimbra—reflecting greater congestion. In 17.2% of municipalities, these daily journeys typically last more than 20 minutes, exceeding 25 minutes in eleven municipalities: Barreiro, Moita, Seixal, Almada, Sesimbra, Baião, Sintra, Vila Franca de Xira, Cinfães, Loures, and Odivelas. In Corvo and Porto Santo, commuting times are below 10 minutes.
4. Discussion
The results of this study provide a significant contribution to understanding and addressing territorial cohesion through an innovative multi-dimensional framework. By analyzing six core dimensions—demography, equity, competitiveness, governance, sustainability, and connectivity—this research offers a comprehensive evaluation of territorial development in Portugal. These findings align with and extend prior studies by providing an integrated approach to understanding territorial asymmetries and their implications for policy-making.
From the perspective of previous studies, the multi-dimensional methodology employed in this research builds upon foundational concepts of territorial cohesion, such as those articulated by Barca et al. (2012) and Faludi (2009), which emphasize the importance of place-based approaches to regional development. The inclusion of indicators such as demographic stability, access to services, and environmental sustainability resonates with earlier findings that highlight the interconnectedness of these factors in fostering balanced territorial development. However, this study extends these insights by incorporating novel dimensions such as governance and connectivity, providing a more holistic perspective. The normalization approach used in this research ensures comparability across municipalities with diverse characteristics, addressing limitations identified in earlier methodologies that relied heavily on standardized indicators, which may not adequately reflect non-Gaussian distributions common in territorial data.
The findings reveal profound spatial asymmetries within Portugal, with stark contrasts between metropolitan areas and inland or peripheral regions. For instance, the demographic dimension underscores the severe depopulation in interior municipalities, a trend consistent with the "demographic winter" described in earlier national reports. Similarly, equity assessments highlight disparities in access to education, healthcare, and housing, which are more pronounced in less urbanized areas. These results reaffirm the need for tailored interventions, as advocated in previous studies, while also demonstrating the added value of integrating diverse dimensions such as governance and sustainability into the analysis. This comprehensive approach allows for a deeper understanding of the underlying factors driving territorial disparities, enabling more effective policy responses.
One of the critical contributions of this study lies in its potential for replication in other contexts. The methodology’s reliance on publicly available data, such as those provided by national statistical institutes and geographic information systems, makes it adaptable to diverse regional settings. The normalization technique employed ensures that the analysis remains robust across varying data scales and distributions, a critical consideration for replication. Furthermore, the multi-dimensional framework can be tailored to incorporate additional dimensions or indicators relevant to specific regional challenges, enhancing its applicability. For example, regions facing distinct environmental pressures could integrate more granular ecological indicators, while areas with significant economic disparities might prioritize metrics related to income distribution or employment dynamics.
The implications of these findings extend beyond academic discourse to inform practical policy-making. By providing a detailed assessment of municipal performance across multiple dimensions, this research equips policymakers with the tools to design targeted interventions that address specific regional needs. For instance, policies aimed at enhancing connectivity in underperforming municipalities can draw on the connectivity dimension to identify priority areas for infrastructure investments. Similarly, the equity dimension provides insights into where improvements in access to education, healthcare, and housing are most urgently needed. The governance dimension underscores the importance of strengthening local administrative capacities, highlighting the role of fiscal independence and participatory governance in fostering resilience.
While the study provides valuable insights, it is not without limitations. One notable limitation is the reliance on publicly available data, which may not always capture the most current or context-specific nuances of territorial dynamics. Additionally, the equal weighting of indicators, while methodologically consistent, may oversimplify the relative importance of certain dimensions in specific contexts. Furthermore, the absence of qualitative data, such as stakeholder perspectives, limits the depth of the analysis in understanding local priorities and challenges. Finally, the static nature of the data used does not account for temporal dynamics, such as the long-term effects of policy interventions or sudden socio-economic changes, which could significantly impact territorial cohesion.
Future research directions should explore the dynamic interplay between the dimensions analyzed in this study. For instance, how do improvements in governance influence other dimensions such as sustainability or competitiveness? Longitudinal studies could also provide valuable insights into how territorial performance evolves over time, particularly in response to policy interventions. Additionally, expanding the framework to include emerging challenges such as climate change adaptation or digital transformation could enhance its relevance in addressing contemporary territorial issues.
Another promising avenue for future research is the application of this methodology to cross-border regions or transnational contexts. Territorial cohesion often transcends national boundaries, and applying this framework to such settings could provide valuable insights into the effectiveness of cross-border cooperation initiatives. Furthermore, integrating qualitative methods, such as stakeholder interviews or participatory workshops, could complement the quantitative analysis by capturing local perspectives and priorities, enriching the overall understanding of territorial cohesion.
The broader implications of this research highlight the importance of adopting a holistic and place-based approach to regional development. By integrating diverse dimensions and employing a robust methodological framework, this study not only advances the academic understanding of territorial cohesion but also provides practical tools for policymakers. Its adaptability ensures its relevance across various contexts, making it a valuable resource for addressing territorial disparities and promoting sustainable development globally. Future studies building on this work can further refine the methodology, explore its applications in diverse settings, and address emerging challenges, ensuring its continued contribution to advancing the field of regional development.