
Submitted:
02 February 2025
Posted:
04 February 2025
You are already at the latest version
Abstract
Today’s advancements in neuroimaging have been pivotal in enhancing our understanding 1 of brain development and function using various MRI techniques. This study utilizes images from 2 T1-weighted imaging and diffusion-weighted imaging to identify gray matter and white matter 3 coherent growth patterns within 2 years from 9-10-year-old participants of the Adolescent Brain 4 Cognitive Development (ABCD) Study. The motivation behind this investigation lies in the need 5 to comprehend the intricate processes of brain development during adolescence, a critical period 6 characterized by significant cognitive maturation and behavioral change. While traditional methods 7 like Canonical Correlation Analysis (CCA) capture linear interactions of brain regions, deep Canonical 8 Correlation Analysis with autoencoder (DCCAE) extracts nonlinearly brain patterns. The study 9 involves a comparative analysis of changes in gray and white matter over two years, exploring their 10 interrelation based on correlation scores and extracting significant features using both CCA and 11 DCCAE methodologies, and finding the association between the extracted features with cognition 12 and Child Behavior Checklist. The results showed that both CCA and DCCAE components identified 13 similar brain regions associated with cognition and behavior, indicating that brain growth patterns 14 over these two-year period are linear. The variance explained by CCA and DCCAE components for 15 cognition and behavior suggests that brain growth patterns better account for cognitive maturation 16 compared to behavioral changes. This research advances our understanding of neuroimaging analysis 17 and provides valuable insights into the nuanced dynamics of brain development during adolescence. 18 Our GitHub implementation is publicly available on https://github.com/rsapkota1/Multimodal- 19 feature-extraction-using-CCA-and-DCCAE.
Keywords:
Multimodal
; Brain development
; CCA
; DCCAE
1. Introduction
Over the past decades, advancements in neuroimaging have played a crucial role in understanding the brain development[1,2] contributing significantly to biomedical research [3,4]. Numerous studies have utilized traditional machine learning [5,6,7,8,9], deep learning [10,11,12,13], and genetic analyses [14,15] to investigate various aspects of brain organization, including its anatomy, functional dynamics, and network connectivity. Increasingly, various MRI imaging techniques, such as T1-weighted imaging, diffusion-weighted imaging, task-based or resting-state functional MRI are commonly employed to study brain function and structure more effectively[16,17]. Multimodal neuroimaging analyses, which combine data from two or more neuroimaging modalities, leverage complementary information and overcome the limitations of each. This approach has yielded more reliable results [3,4], providing comprehensive insight into the understanding of brain and cognition, as well as abnormal brain function and mental disorders [4,18]. Recent studies also suggest that neural interfaces, which establish a direct link between the brain and external devices, can present new opportunities in future for integrating multi-modalities to advance brain-computer communication[19].
Various approaches such as parallel Independent Component Analysis, Canonical Correlation Analysis (CCA), as well as deep learning based fusion, have been explored for integrating multimodal data, as extensively reviewed in [18,20,21,22]. This study specifically focuses on CCA-based methodologies due to their straightforward implementation and widespread use. CCA facilitates a linear transformation of data, and reveals maximally linearly correlated hidden patterns[23]. An extension of CCA known as Deep Canonical Correlation Analysis (DCCA) leverages deep neural networks to capture non-linear hidden features of each data modality and then maximizes the relationship between two sets of hidden features, resulting in highly correlated representations across data modalities[24,25].
This study examined Adolescent Brain Cognitive Development (ABCD) data. ABCD study is a longitudinal cohort consisting of youth aged 9-10 at baseline from 21 different sites across US and is the largest and long-term study that follows the youth for 10 years with annual lab-based assessments and bi-annual imaging acquisitions [26]. It is designed to examine the interplay between biological, behavioral, and environmental factors on brain development and health outcomes in children and adolescents [27]. ABCD studies leverage the measurement of brain structure and function relevant to adolescent development and addiction, providing evidence for the feasibility and age-appropriateness of the procedures and the generalizability of findings [28]. Also, the study of neurocognitive development is crucial for distinguishing premorbid vulnerabilities from the consequences of behaviors like substance use [29].
We investigated the structural changes within two years of brain development between 9-10-year-old and 11-12-year-old, using images of gray matter and white matter from the ABCD Study. Our hypothesis posits that gray matter and white matter grow coherently during this period, implying a significant relationship between changes in gray matter density and white matter integrity. Such brain structural changes underline the observed cognitive maturation and behavioral changes outwardly. While CCA captures linear interactions of brain regions, we recognize the potential contribution of non-linear interactions across brain regions. To address this, we implemented two approaches: CCA and an extension of DCCA, DCCA with autoencoder (DCCAE), which incorporates both the reconstruction objective from an autoencoder and a standard CCA correlation objective [30]. Gray matter and white matter growth patterns extracted from both approaches are compared and contrasted. Furthermore, We explore their associations with cognitive and behavioral changes. The contribution of this study is twofold. During the two years of critical brain development, this study aims to understand the growth of GM and FA and their significant changes underlying cognitive and behavior changes, as well as to determine whether the brain growth pattern across regions is linear or non-linear.
2. Materials and Methods
2.1. Participants and Data
We have employed baseline data (9-10 years) and two-year follow-up (11-12 years) data from two different types of imaging modalities: gray matter density (GM) images from T1 weighted structural MRI and white matter fractional anisotropy (FA) images from diffusion MRI. Following a quality check, the gray matter images consist of 11, 573 baseline participants and 3,947 two-year follow-up participants. Similarly, the white matter images consist of 10, 267 baseline participants and 3,745 two-year participants. The number of common participants with baseline and follow-up of gray matter and white matter is 3302.
In this study, the cognitive measures we used are fluid intelligence (a person’s ability to handle new and unfamiliar situations and how quickly), crystallized intelligence (a person’s ability to apply knowledge previously gained through education and experience) and total composite (encompasses both fluid and crystallized). Behavioral assessments are form Child Behavior Checklist (CBCL), a tool used to identify behavioral and emotional issues in children and adolescents, which is made up of eight syndrome scales: anxious/depressed, depressed, somatic complaints, social problems, thought problems, attention problems, rule-breaking behavior and aggressive behavior. Two years changes in the cognitive and behavioral measures are computed by direct subtraction of baseline from year-two follow-up data, and utilized for association analyses with brain structural growth patterns extracted by both CCA and DCCAE approaches explained later on.
2.2. Gray Matter Image Processing
T1-weighted MRI images were segmented into GM maps and normalized into Montreal Neuroimaging Institute (MNI) space using Statistical Parametric Mapping 12 (SPM12) software toolbox. Then the gray matter density maps were smoothed by a Gaussian Kernel ( 6 mm3), resliced to 1.5 mm3 voxels. Further quality control was conducted to retain GM maps with a correlation greater than 0.9 with the mean GM map across all the individuals.
2.3. White Matter Image Processing
The diffusion MRI images were preprocessed using FSL (v6.0.1) for distortion correction, eddy current correction and motion correction, then registered into MNI space using non-linear registration with ANTs[31]. The calculation of diffusion tensor using FSL tools gives FA maps and additional scalar images. Further quality control for FA maps was conducted to retain maps with a correlation greater than 0.9 with the mean FA map across all the individuals.
2.4. Development Changes in Gray Matter and White Matter
A mask was generated to include voxels with a mean value of GM and FA >0.2 baseline samples separately and applied to each data. The same baseline mask was used for GM and FA’s two-year samples. The result obtained was GM matrix of size 3302 X 490539 for both baseline and two-year and FA matrix of size 3302 X 94440 for both baseline and two-year. The change in the GM within two years, termed GM, was obtained by subtracting baseline data from two-year follow-up data. Similarly, the change in FA within two years, FA, was obtained. To reduce the data dimension, PCA was applied to each matrix of GM and FA to derive 100 features for each. The variance explained by the PCA features for GM and FA captures >80% and >65% respectively. We targeted to capture a large amount of variance while eliminating potential noises. 100 GM principal components (PCs) have captured >80% of total GM variance, however, to capture the same amount FA variance, 740 PCs were needed which increased dramatically the chance of noise inclusion. We decided to include only the first 100 FA PCs that captured over 65% of total variance, removing components each carrying <2% of variances. Thus, choosing 100 PCs for both image types allowed us to maximize relevant data representation, mitigate noise, and balance the input complexity from both image types.
2.5. CCA Feature Extraction
CCA is a statistical technique used to uncover linear relationships between two datasets [32]. Let X and Y denote two datasets, where and , with n as the number of samples and p and q as the numbers of variables for each dataset. The covariances of X, Y, and are represented by , , and respectively.
CCA finds weight matrices u and v to maximize the correlation between the canonical covariates and . These weight matrices are linear projection vectors obtained through solving a generalized eigenvalue decomposition of covariance matrix between GM and FA datasets, ensuring that the transformed features are maximally correlated. The objective function for optimization is presented in Equation (1).
2.6. DCCA Feature Extraction
Andrew et. al [24] first proposed the non-linear extension of CCA using neural networks called DCCA. The output of the neural networks is subjected to the computation of correlation scores. We used a more robust variation of DCCA named DCCAE [33], which combines the benefits of DCCA for capturing correlations and an autoencoder (AE) for learning better representations. The AE consists of an encoder that reduces input dimensionality and a decoder that reconstructs the data, minimizing the error. The reconstruction error for two datasets X and Y is calculated using Mean Square Error (MSE) as shown in Equation (2).
Here, X and Y represent original data, and represent reconstructed data, and and are the network parameters of the decoders. For the two views X and Y, consider two Deep Neural Networks (DNN) as encoders f and g that extract non-linear features and respectively. The latent representations are then subjected to CCA transformation, described by weights u and v, maximizing correlation as shown in Equation (3). Thus, DCCAE first employs a nonlinear transformation with deep neural networks, learned by iteratively optimizing the cost function, then applies the CCA on the transformed latent data representation by computing u, and v matrices. Altogether, the nonlinear transformation and u, v matrices define the latent DCCAE components.
Here, and are original data of two views, and are reconstructed data of the two networks, p and q are decoder functions, is the weight parameter, and are regularization parameters. DCCAE combines the dual objectives of correlation loss and reconstruction loss simultaneously. The model aims to minimize MSE for optimal learning representations and maximize correlation between the two encoded sets.
We employed an open-source DCCAE model [33]. The model outputs correlation scores between GM and FA for a specified number of components. In the objective function, the weight value regulates both the reconstruction and correlation losses. We set a weight value of 0.08 for the reconstruction part and a weight value (1- 0.08) = 0.92 for the correlation part. The assignment of weight was determined through cross-validation scores.
2.7. Evaluation of Multimodal Latent Imaging Features
2.7.1. CCA Implementation and Feature interpretation
In our CCA analysis, we utilized utilizing 100 principal components (PCs) each for GM and FA. This choice of smaller variables (7874 X 100 for GM and 7874 X 100 for FA) than the total number of variables serves to mitigate the risk of overfitting. The dataset was partitioned into 80% for training and 20% for testing. We set the number of latent dimensions as 20 components producing 20 correlation scores from the training samples. The derived CCA transformation was then applied to testing data to get 20 correlation scores. Correlation was deemed significant if the p-value of the correlation was less than 0.0025 in both training and testing data, adhering to the Bonferroni correction of 20 tests.
For significantlt correlated CCA components, we implemented the Linear Mixed Effect (LME) Model to find brain growth patterns’ association with cognition (fluid intelligence, crystallized intelligence, and total composite score, separately) and behavioral changes. In the LME models, CCA-extracted components (GM and FA tested separately), age and sex are fixed effect independent variables, the collection site is a random effect variable, and change in cognition or behavior is the dependent variable (tested separately for each measure). These analyses were conducted using hold-out testing data.
2.7.2. DCCAE Implementation and Feature Interpretation
The same input data as in the CCA model were used in the DCCAE model. The partitioning of the dataset into training and testing samples mirrored that of the CCA model. During the training of the DCCAE model, we applied 5-fold cross-validation to fine-tune hyperparameters, optimizing the sum of the first 10 correlation scores. The identified optimal hyperparameters included a batch size of 256, 150 epochs, a learning rate of 0.01, and a neural network architecture (encoder) of a two-layer MLP with 100 and 20 neurons respectively. The encoder’s output was utilized to extract canonical variables through the CCA method, with the latent dimensions set at 20. The best-performing DCCAE model was projected onto the testing sample, and, akin to the CCA approach, we determined the significance of components. These significant DCCAE’s components were evaluated using LME models to find the association between cognition and behavioral measures in a similar way in CCA.
To identify the significant contributing features, we applied the occlusion approach. Specifically, we set one input feature of GM or FA, separately, to zero, while keeping all other features unchanged, applied the modified data to the model to obtain the latent representation, and computed the difference between the new latent representation and the original latent representation. Subsequently, the mean of each column of the resulting differences was calculated, forming a vector of size 1 x 20 (where 20 represents the latent dimensions). This process was repeated for each of the 100 GM or FA features, yielded a matrix of 100 x 20 for GM or FA, respectively, termed the contribution score matrix. From the contribution matrices, we calculated the absolute value and selected the top PC components for the DCCAE components.
2.7.3. Relation Between CCA and DCCAE Components
To understand how the CCA latent representation are related to the DCCAE latent representation we calculated the correlation between each of the significant components of CCA with each of the significant components of DCCAE. In addition, we tested the prediction power or explanation power of derived latent brain growth patterns for cognition and behavior. Specifically, for both CCA and DCCAE components, we combined GM and FA components together as independent variables, along with age, sex, site to predict cognitive or behavioral change using LME models. The total variance explained by combined GM and FA components were computed for fluid intelligence, crystallized intelligence and total composite score, and for each of the eight CBCL syndromes.
3. Results
3.1. Features Obtained from CCA Model
From the CCA model, we found 15 pairs (1st, 2nd, 3rd, 4th, 5th, 7th, 8th, 9th, 10th, 13th, 14th, 15th, 16th and 19th) of GM and FA features were significantly correlated (p-value<0.0025) in the training samples and are verified in the testing samples. The mean correlation scores in training and testing of these 15 significant pairs were 0.34 and 0.21 respectively. Table 1 illustrates the correlation between the first five pairs of components and respective p-value.
3.2. Features Obtained from DCCAE Model
From the DCCAE model, the first 13 pairs of latent GM and FA features were significantly correlated (p-value<0.0025) and verified in testing samples. The mean correlation scores in training, validation and testing of these 13 significant pairs were 0.52, 0.35 and 0.33 respectively. Table 2 illustrate the correlation between the first five pairs of canonical variates and their respective p-value.
3.3. Correlation of CCA and DCCAE Components
We calculated the correlation between each of the 15 significant components of CCA with each of the 13 components of DCCAE. Out of the 15 components of CCA, 12 CCA GM components and 11 FA components showed a correlation >0.15 with at least one DCCAE component. As an example, Table 3 and Table 4 present the correlation scores between the first three components of CCA with DCCAE components that have correlation scores greater than 0.15, along with their respective p-values.
3.4. Top Brain Regions Contributing to CCA and DCCAE Components
To illustrate the brain regions, the top PCs of the first three significantly correlated GM and FA components were plotted for both CCA and DCCAE results. To plot the brain regions, the CCA/DCCAE components were traced back to PCA components using the weight matrix of CCA/DCCAE, and the top PCA components were then mapped to the brain regions.
Figure 1 and Figure 2 depict GM and FA regions for CCA respectively, while Figure 3 and Figure 4 portray GM and FA regions for DCCAE respectively, with green indicating positively correlated GM and FA regions and red indicating negatively correlated regions. The GM regions identified by the first component of CCA include the middle temporal gyrus, precentral gyrus, middle frontal gyrus, superior frontal gyrus, and sub-gyral regions. The second component highlights the cuneus, middle occipital gyrus, superior frontal gyrus, lingual gyrus, and superior temporal gyrus. The third component encompasses the superior frontal gyrus, middle frontal gyrus, cuneus, superior temporal gyrus, middle occipital gyrus, and thalamus. Similarly, the first component of DCCAE reveals cuneus, middle temporal gyrus, precentral gyrus, middle frontal gyrus, rectal gyrus, superior temporal gyrus, inferior parietal lobule, middle frontal gyrus and superior frontal gyrus. The second component identifies cuneus, middle occipital gyrus, superior frontal gyrus, middle frontal gyrus, sub-gyral, postcentral gyrus, precuneus and middle temporal gyrus. The third component includes middle temporal gyrus, precentral gyrus, cuneus, lingual gyrus, middle occipital gyrus, inferior frontal gyrus, postcentral gyrus and inferior parietal lobule.
Similarly, the FA regions identified by the first component of CCA include corticospinal tract, anterior thalamic radiation and forceps minor. The second component highlights corticospinal tract, anterior thalamic radiation, forceps minor and inferior longitudinal fasciculus. The third component recognizes anterior thalamic radiation, forceps minor, inferior longitudinal fasciculus and inferior fronto-occipital fasciculus. Likewise, the first component of DCCAE point out anterior thalamic radiation, forceps minor, inferior longitudinal fasciculus, corticospinal tract and inferior fronto-occipital fasciculus. The second component spot forceps minor, inferior longitudinal fasciculus, corticospinal tract and anterior thalamic radiation. The third component includes corticospinal tract, anterior thalamic radiation and forceps minor.
3.5. Association of CCA and DCCAE Components with Cognition
From the LME models of CCA components and DCCAE components performed separately, Table 5 and Table 6 show the GM and FA components that were associated with fluid intelligence, crystallized intelligence and total composite score. The computed p-value for each significant component indicates the strength of the association between the identified brain regions and cognition, while the sign denotes whether this association is positive or negative. The NA represents none of the components were significant.
3.6. Association of CCA and DCCAE Components with CBCL
Table 7 and Table 8 show the GM and WM components that were associated with CBCL’s syndrome scales from the LME models of CCA components and DCCAE components, respectively. The sign represents whether the association between the brain regions (identified by the mentioned components) and the CBCL is positive or negative. The NA represents none of the components were significant.
3.7. Total Variation Explained by Brain Components of CCA and DCCAE
4. Ablation Study
We conducted an ablation study to examine the impact of non-linearity on the correlation strength in DCCAE. Specifically, our encoder model consists of one hidden layer with 100 neurons, which is the key element to model non-linearity. For the ablation study, we removed the hidden layer, resulting in an encoder composed solely of the input and output layers. We then assessed the correlation between the latent representations obtained from the output layers from the gray matter and white matter encoders. Our findings revealed that 16 pairs of GM and FA components were significantly correlated (p-value < 0.0025). The mean correlation scores for these 16 significant pairs were 0.52 in the training set, 0.44 in the validation set, and 0.38 in the testing set. Table 11 illustrates the correlations between the first five pairs of components. This ablation study demonstrates that the removal of the hidden layer resulted in a notable decrease in correlation scores, making them comparable to those obtained through linear CCA as shown in Table I in the main text.
5. Discussion
In this study, we implemented both CCA and DCCAE models to extract correlated components from GM and FA changes within two years during adolescence, and such components represent brain growth patterns in GM density and FA integrity coherently in two years. Using data from over three thousand children from the general population similar numbers of GM-FA component pairs were extracted and verified from CCA and DCCAE models. Comparison of correlation strength suggests that the DCCAE yielded remarked highly correlated GM-FA pairs in both training and testing data when compared to CCA results. In both CCA and DCCAE, the correlation scores in the testing data were lower than those in the training data, this attenuation is expected when applying the model to independent testing data. Importantly, the persistence of statistically significant correlations in the testing data demonstrates the robustness of the model and suggests that the observed relationships are not a result of overfitting but rather reflect genuine associations between GM and FA features. CCA being a linear model only captures linear interactions among brain regions and thus linear relationship between GM and FA of white matter. On the other hand, DCCAE incorporates the deep learning architecture that is able to extract both linear and non-linear interactions among brain regions and thus more intricate relation between GM and FA of white matter. We speculate that this may be the main reason for stronger relations between GM and FA matter components in the DCCAE results.
When examining the direct similarity between components of CCA and DCCAE, we found out that most of the CCA components (for both GM and FA ) have high and significant correlations (shown in Tables 3 and 4) with some of the DCCAE components. For example, CCA GM component 1 is significantly and negatively correlated to DCCAE GM components 1 and 2, and positively correlated to DCCAE GM component 3. Similar results were observed for FA components where CCA FA component 1 was linked to DCCAE FA components 1 and 2 negatively and component 3 positively. The negative correlation observed in Tables 3 and 4 does not indicate a fundamental contradiction in the relationship between GM and FA features. Instead, it suggests that for the same brain region, CCA encodes a change in one direction (increase or decrease), while DCCAE encodes it in the opposite direction. However, the underlying GM-FA association remains consistent across both models. This difference in sign can be further illustrated in Figure 1 and 3, where the first components from CCA and DCCAE show similar spatial patterns, particularly in the posterior occipital region but the color representation differs indicating an increase in one model and a decrease in the other.
We also examined the contributing brain regions of components that shared the same brain regions. The top PCs of the CCA and DCCAE components highlighted common regions for GM and FA. The first CCA component correlates with the first, second and third DCCAE components. The brain regions of the first CCA components which include middle temporal gyrus, precentral gyrus, middle frontal gyrus, superior temporal gyrus and sub-gyral while DCCAE’s first component identified middle temporal gyrus, middle frontal gyrus, and sub-gyrus, DCCAE’s second component identified middle temporal gyrus and middle forntal gyrus, DCCAE’s third component identified superior temporal gyrus and precentral gyrus. Similarly, common FA regions were also observed for CCA FA component and DCCAE FA components. The brain regions of the first CCA components include corticospinal tract, anterior thalamic radiation and forceps minor, and DCCAE’s first, second and third components identified the brain regions pointed by the first component of CCA.
The significant correlations between CCA and DCCAE components and the shared brain regions of components from two approaches suggest that both linear and non-linear approaches extract similar brain growth patterns in the two years. Maybe two years is short enough that non-linear growth patterns in brain structure can be estimated in a linear fashion with reasonable accuracy.
The GM brain regions identified by CCA and DCCAE show a negative association with cognition, including the superior frontal gyrus, middle temporal gyrus, and precuneus, while a positive association is observed with cognition in regions such as the inferior frontal gyrus and medial frontal gyrus. However, for the FA, only CCA components are related to fluid intelligence and the brain regions are negatively related which includes anterior thalamic radiation and forceps minor.
Regarding the CBCL behavioral syndromes, five CCA GM components showed significant associations with aggressive behavior, somatic complaints, withdrawn/depressed, and thought problems. These components include brain regions such as superior temporal gyrus, middle temporal gyrus, inferior frontal gyrus and middle frontal gyrus and cuneus which are negatively related to behavior. For white matter, CCA showed associations for anxious/depressed, attention problem, and withdrawn/depressed that includes brain regions negatively related such as superior longitudinal fasciculus, anterior thalamic radiation and corticospinal tract while thought problems had positive associations with brain region inferior longitudinal fasciculus and forceps minor.
Similarly, the CBCL syndrome analysis using DCCAE in gray matter revealed negative associations for aggressive behavior, anxious/depressed, and somatic complaints including brain regions: superior temporal gyrus, inferior frontal gyrus, superior frontal gyrus, middle temporal gyrus, middle frontal gyrus, cingulate gyrus, sub-gyrus and precentral gyrus along with positive associations for attention problems and withdrawn/depressed with brain regions inferior frontal gyrus and superior temporal gyrus. In white matter, DCCAE showed brain region has negative associations for attention problems, rule-breaking behavior and somatic complaints indicating regions: anterior thalamic radiation, corticospinal tract, forceps minor and inferior fronto-occipital fasciculus, while thought problems had positive associations with brain regions forceps minor and inferior longitudinal fasciculus.
The examination of total variance of cognitive and behavioral changes explained by the components extracted from CCA or DCCAE indicates that brain growth patterns could explain cognitive maturation much better than the behavioral changes, and CCA and DCCAE components overall demonstrate comparable ability in terms of explaining cognitive and behavioral changes.
6. Conclusions
We know that DCCAE is a more complex model compared to CCA which can learn non-linear patterns in data. However, this complexity also increases the risk of overfitting and has a high chance of capturing the noise as well. Even though the DCCAE exceeds the CCA in terms of correlation between GM-FA components in both training and testing datasets, there is no increase in the number of meaningful components that are associated with cognition and behavior. Since CCA and DCCAE extract components that identify similar brain regions associated with both cognition and CBCL, and the variances explained by CCA and DCCAE brain components for cognition and behavior are approximately the same, so taking into account of extra computational cost and complexity by DCCAE, we can use the simple CCA method for extracting the latent features. So, when comparing the linear and non-linear approaches to capture the brain growth pattern within two years, we found that the linear approach CCA can be a good estimation of the changes even though the literature review shows that the brain growth follows a non-linear pattern.
In our study, behavioral and cognitive measures were analyzed separately to examine their association with brain structural changes in brain development. Specifically, cognitive measures (i.e., fluid intelligence, crystallized intelligence, and total composite score) were investigated independently from CBCL eight behavioral syndromes. This approach allows us to identify neurobiological contributions to cognitive function or behavioral regulation, providing a clearer understanding of how brain structure supports these separate domains. While the interesting relationship between cognition and behavior, as well as the potential modulation or mediating relation between brain, cognition and behavior is important, and worth in-depth investigation. In our current results, GM CCA components 1, 2 and 7, GM DCCAE the 9th component, and FA CCA the 14th component are associated with both cognition and behavior. These results suggest the same brain regional growth patterns may support cognitive maturation and behavior change during development. This relationship is warranted for further investigation.
The findings of this study should be interpreted with consideration of the following limitations. We used the linear approach PCA to reduce the dimension of GM and FA to 100 features and implemented the non-linear method DCCAE to extract the correlated features. So, the entire comparison is constrained to PCA input features. Future investigations of fully non-linear approaches such as the use of a Convolutional Neural Network to directly extract the hidden features from 3D images are necessary. Brain structural changes beyond 2 years may be more suitable to test non-linear versus linear growth patterns, given that brain growth patterns within two years are linear.
Author Contributions
Ram Sapkota: Writing – review & editing, Writing – original draft, Methodology, Formal analysis, Data curation, Conceptualization. Bishal Thapaliya: Writing – review & editing, Visualization, Validation, Investigation. Bhaskar Ray: Writing – review & editing, Validation, Resources. Pranav Suresh: Writing – review & editing, Validation, Investigation. Jingyu Liu: Writing – review & editing, Validation, Supervision, Project administration, Investigation, Funding acquisition, Conceptualization.
Funding
This research was funded by NIH grant: MH130595
Data Availability Statement
Data will be made available on request.
Acknowledgments
We express our gratitude to the participants of the Adolescent Brain Cognitive Development (ABCD) Study and their families for their valuable time and commitment to this project. The data utilized in this article were sourced from the Adolescent Brain Cognitive Development (ABCD) Study (https://abcdstudy.org).
Conflicts of Interest
The authors declare no conflicts of interest.
References
- Tierney, A.L.; Charles, A. Nelson, I. Brain Development and the Role of Experience in the Early Years. Zero Three 2009, 2, 9–13. [Google Scholar]
- Goldblatt, R.; Holz, N.; Tate W., G.; Sherman, K.; Ghebremicael, S.; Bhuyan S., S.; Al-Ajlouni, A. Yazan, Santillanes, S.; Araya, G.; Abad, Shermaine, H.M.M.; Wesley, T.K.; et al. Linking neuroimaging and mental health data from the ABCD Study to UrbanSat measurements of macro environmental factors 2024. p. 1285–1297.
- Zhang, Y.D.; Dong, Z.; Wang, S.H.; Yu, X.; Yao, X.; Zhou, Q.; Hu, H.; Li, M.; Jiménez-Mesa, C.; Ramirez, J.; et al. Advances in multimodal data fusion in neuroimaging: Overview, challenges, and novel orientation. Information Fusion 2020, 64, 149–187. [Google Scholar] [CrossRef] [PubMed]
- Tulay, E.E.; Metin, B.; Tarhan, N.; Arıkan, M.K. Multimodal Neuroimaging: Basic Concepts and Classification of Neuropsychiatric Diseases. Clinical EEG and neuroscience 2019, 50, 20–33. [Google Scholar] [CrossRef] [PubMed]
- Sapkota, R.; Thapaliya, B.; Suresh, P.; Ray, B.; Calhoun, V.D.; Liu, J. Multimodal Imaging Feature Extraction with Reference Canonical Correlation Analysis Underlying Intelligence 2024. pp. 2071–2075.
- Ray, B.; Chen, J.; Fu, Z.; Suresh, P.; Thapaliya, B.; Farahdel, B.; Calhoun, V.D.; Liu, J. Replication and Refinement of Brain Age Model for Adolescent Development 2024. pp. 1–5.
- Ray, Bhaskar Jensen, D.; Suresh, P.; Thapaliya, B.; Sapkota, R.; Farahdel, B.; Fu, Z.; Chen, J.; Calhoun, V.D.; Liu, J. Adolescent brain maturation associated with environmental factors: a multivariate analysis 2024.
- Farahdel, B.; Thapaliya, B.; Suresh, P.; Ray, B.; Calhoun, V.D.; Liu, J. Brain community detection in the general children population 2024. pp. 1–6.
- Farahdel, B.; Thapaliya, B.; Suresh, P.; Ray, B.; Calhoun, V.D.; Liu, J. Confirmatory Factor Analysis on Mental Health Status using ABCD Cohort 2021. pp. 3540–3547.
- Suresh, P.; Ray, B.; Thapaliya, B.; Farahdel, B.; Kazemivash, B.; Chen, J.; Duan, K.; Calhoun, V.D.; Liu, J. Effective Training Strategy for NN Models of Working Memory Classification with Limited Samples 2023. pp. 1–4.
- Thapaliya, B.; Wu, Z.; Sapkota, R.; Ray, B.; Suresh, P.; Ghimire, S.; Calhoun, V.; Liu, J. Graph-based deep learning models in the prediction of early-stage Alzheimers 2024. pp. 1–5.
- Thapaliya, B.; Miller, R.; Chen, J.; Wang, Y.P.; Akbas, E.; Sapkota, R.; Ray, B.; Suresh, P.; Ghimire, S.; Calhoun, V.D.; et al. DSAM: A deep learning framework for analyzing temporal and spatial dynamics in brain networks. Medical Image Analysis 2025, 101, 103462. [Google Scholar] [CrossRef] [PubMed]
- Thapaliya, B.; Akbas, E.; Chen, J.; Sapkota, R.; Ray, B.; Suresh, P.; Calhoun, V.D.; Liu, J. Brain networks and intelligence: A graph neural network based approach to resting state fMRI data. Medical Image Analysis 2025, 101, 103433. [Google Scholar] [CrossRef] [PubMed]
- Thapaliya, B.; Calhoun, V.D.; Liu, J. Environmental and genome-wide association study on children anxiety and depression 2021. pp. 2330–2337.
- Thapaliya, B.; Ray, B.; Farahdel, B.; Suresh, P.; Sapkota, R.; Holla, B.; Mahadevan, J.; Chen, J.; Vaidya, N.; Perrone-Bizzozero, N.I.; et al. Cross-continental environmental and genome-wide association study on children and adolescent anxiety and depression 2024. 15.
- Liu, S.; Cai, W.; Liu, S.; Zhang, F.; Fulham, M.; Feng, D.; Pujol, S.; Kikinis, R. Multimodal neuroimaging computing: a review of the applications in neuropsychiatric disorders. Brain informatics 2015, 64, 167–180. [Google Scholar] [CrossRef] [PubMed]
- Thapaliya, B.; Akbas, E.; Chen, J.; Sapkota, R.; Ray, B.; Suresh, P.; Calhoun, V.; Liu, J. Brain Networks and Intelligence: A Graph Neural Network Based Approach to Resting State fMRI Data 2024. [2311.03520].
- Calhoun, V.D.; Sui, J. Multimodal fusion of brain imaging data: A key to finding the missing link(s) in complex mental illness. Biological psychiatry. Cognitive neuroscience and neuroimaging 2016, 3, 230–244. [Google Scholar] [CrossRef] [PubMed]
- Xu, S.; Liu, Y.; Lee, H.; Weidong, L. Neural interfaces: Bridging the brain to the world beyond healthcare 2024. 4(5).
- Sui, J.; Adali, T.; Yu, Q.; Calhoun, V.D. A Review of Multivariate Methods for Multimodal Fusion of Brain Imaging Data. J Neurosci Methods 2012, 68–81. [Google Scholar] [CrossRef] [PubMed]
- Sui, J.; Adali, T.; Pearlson, G.; Yang, H.; Sponheim, S.R.; White, T.; Calhoun, V.D. A CCA+ ICA based model for multi-task brain imaging data fusion and its application to schizophrenia. Neuroimage 2010, 51, 123–134. [Google Scholar] [CrossRef] [PubMed]
- Li, Y.; Daho, M.E.H.; Conze, P.H.; Zeghlache, R.; Boité, H.L.; Tadayoni, R.; Cochener, B.; Lamard, M.; Quellec, G. A review of deep learning-based information fusion techniques for multimodal medical image classification, 2024, [2404.15022].
- Zhuang, X.; Yang, Z.; Cordes, D. A technical review of canonical correlation analysis for neuroscience applications. Human Brain Mapping 2020, 41, 3807–3833. [Google Scholar] [CrossRef] [PubMed]
- Andrew, G.; Arora, R.; Bilmes, J.; Livescu, K. Deep Canonical Correlation Analysis. Proceedings of the 30th International Conference on Machine Learning 2013, 28, 1247–1255. [Google Scholar]
- Wang, W.; Arora, R.; Livescu, K.; Bilmes, J.A. On Deep Multi-View Representation Learning: Objectives and Optimization. Proceedings of the 32nd International Conference on Machine Learning 2015, 37. [Google Scholar]
- Garavan, H.; Bartsch, H.; Conway, K.; Decastro, A.; Goldstein, R.; Heeringa, S.; Jernigan, T.; Potter, A.; Thompson, W.; Zahs, D. Recruiting the ABCD sample: Design considerations and procedures. Developmental cognitive neuroscience 2018, 32, 16–22. [Google Scholar] [CrossRef] [PubMed]
- Karcher, N.R.; Barch, D.M. The ABCD study: understanding the development of risk for mental and physical health outcomes. Neuropsychopharmacology 2021, 46, 131–142. [Google Scholar] [CrossRef] [PubMed]
- Casey, B.J.; et al. . The Adolescent Brain Cognitive Development (ABCD) Study: Imaging acquisition across 21 sites. Developmental Cognitive Neuroscience 2018, 32, 43–54. [Google Scholar] [CrossRef] [PubMed]
- Luciana, M.; Bjork, J.; Nagel, B.; Barch, D.; Gonzalez, R.; Nixon, S.; Banich, M. Adolescent neurocognitive development and impacts of substance use: Overview of the ABCD baseline neurocognition battery. Developmental Cognitive Neuroscience 2018. [Google Scholar] [CrossRef] [PubMed]
- Mallinar, N.; Rosset, C. Deep Canonically Correlated LSTMs, 2018, [arXiv:stat.ML/1801.05407]. arXiv:stat.ML/1801.05407].
- Avants, B.B.; Tustison, N.; Song, G.; et al. Advanced normalization tools (ANTS). Insight j 2009, 2, 1–35. [Google Scholar]
- Hotelling, H. Relations Between Two Sets of Variates 1992. pp. 162–190.
- Chapman, J.; Wang, H.T. CCA-Zoo: A collection of Regularized, Deep Learning based, Kernel, and Probabilistic CCA methods in a scikit-learn style framework. Journal of Open Source Software 2021, 6, 3823. [Google Scholar] [CrossRef]
Figure 1.
Coronal, sagittal and axial views of first, second, and third components of GM identified by CCA
Figure 1.
Coronal, sagittal and axial views of first, second, and third components of GM identified by CCA
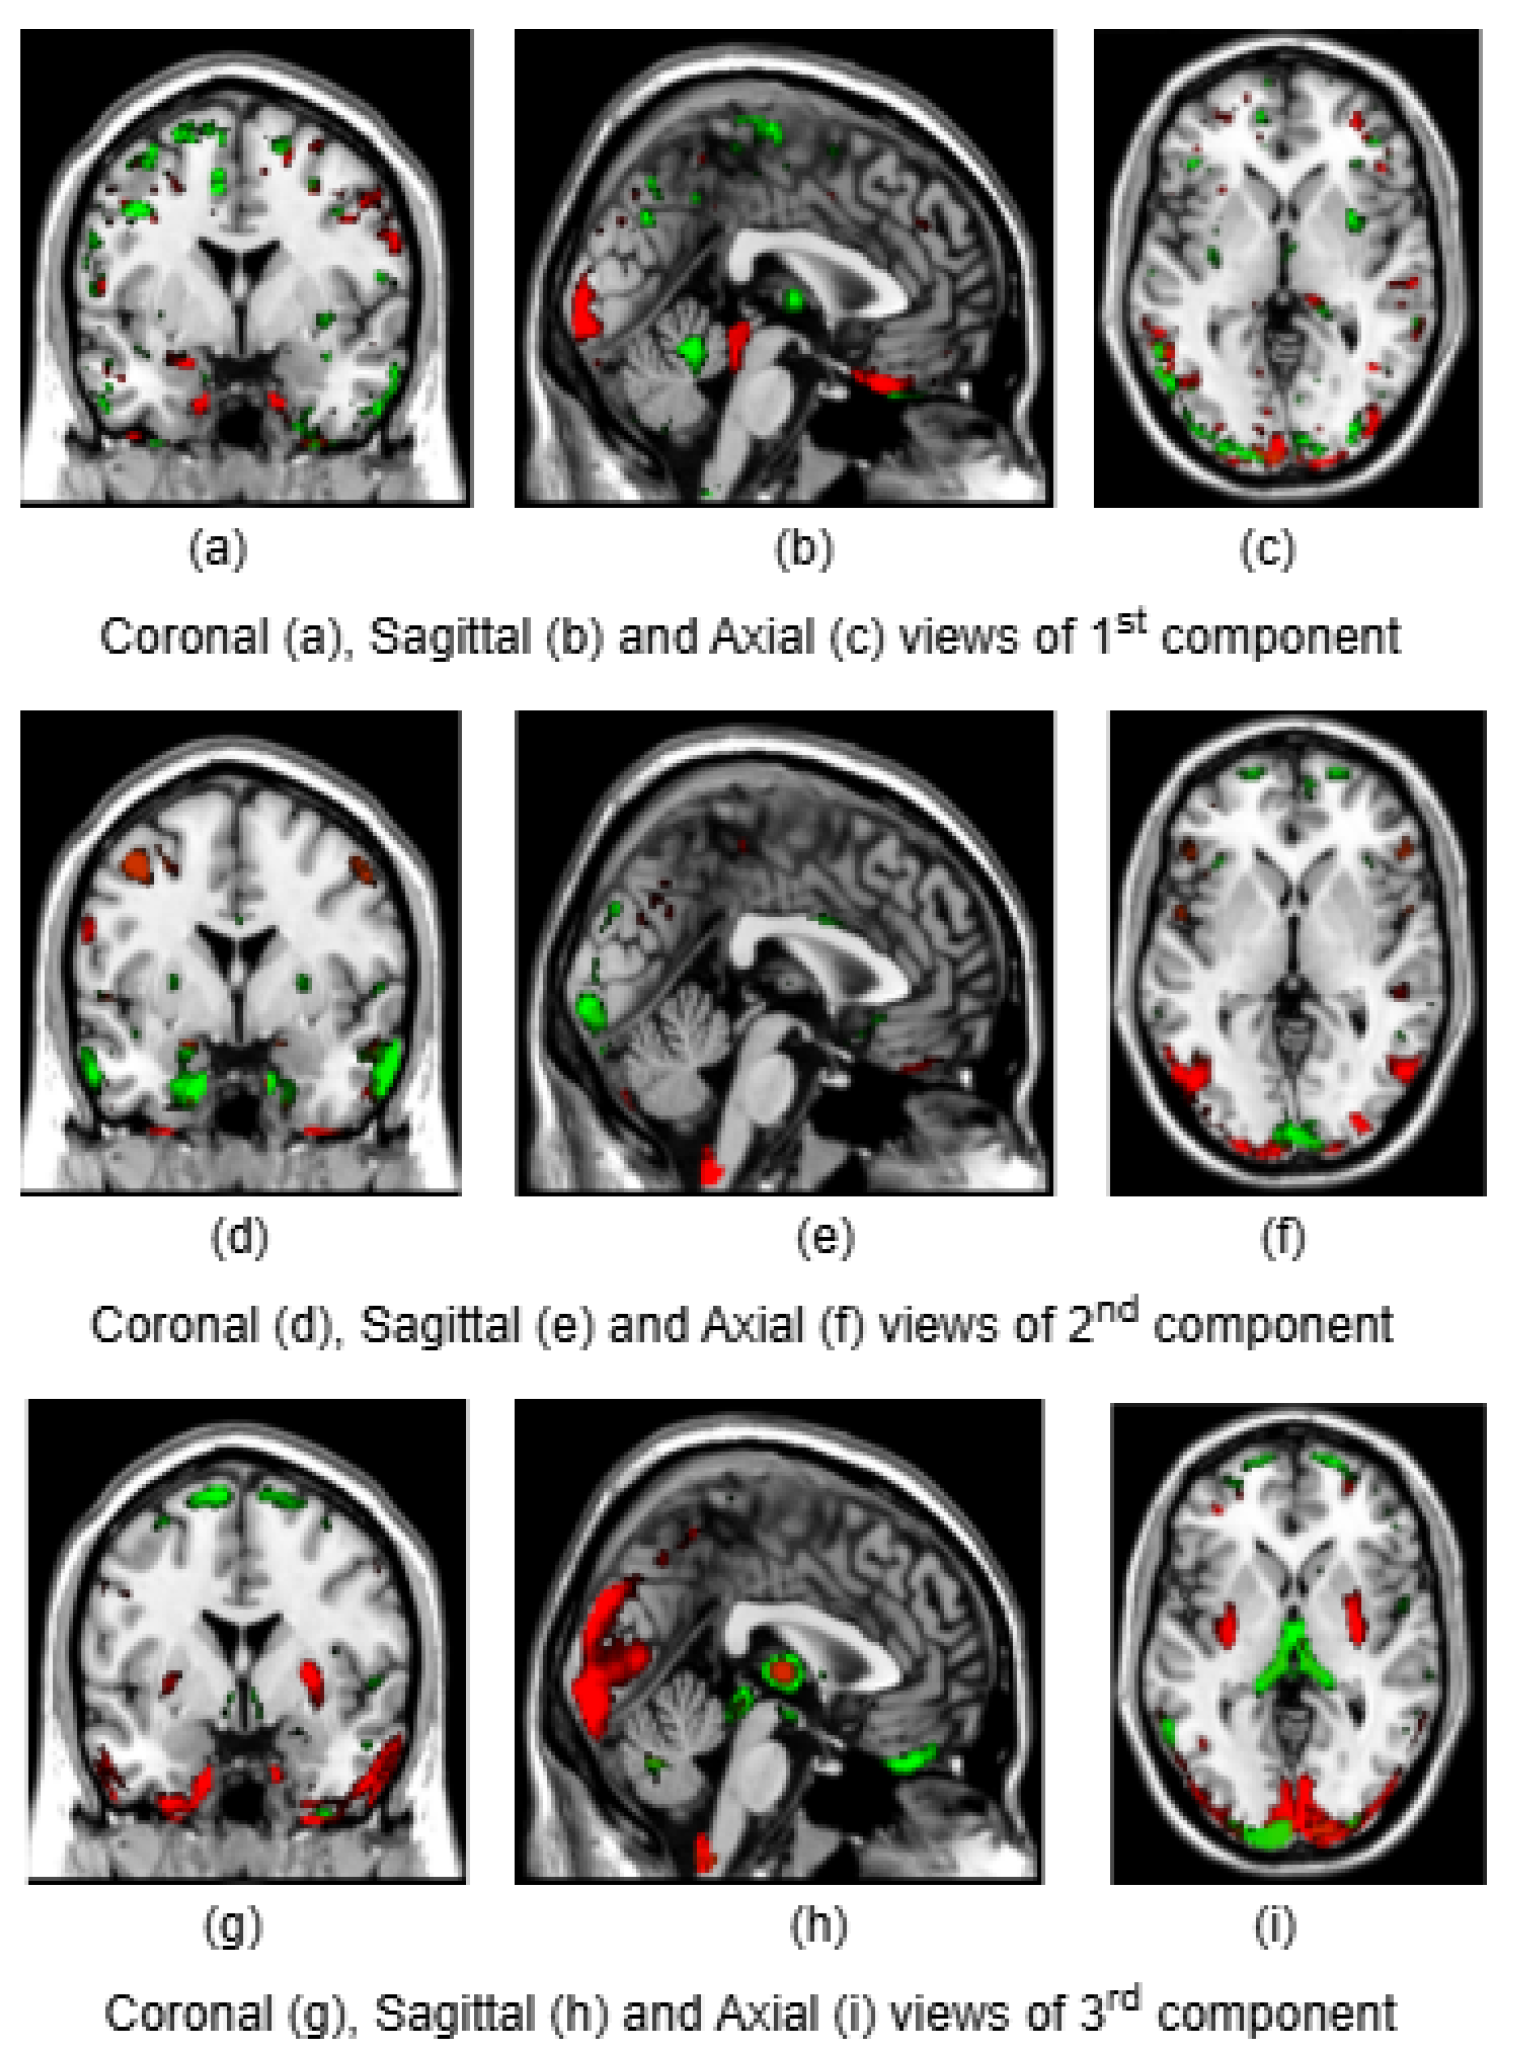
Figure 2.
Coronal, sagittal and axial views of first, second, and third components of FA identified by CCA
Figure 2.
Coronal, sagittal and axial views of first, second, and third components of FA identified by CCA
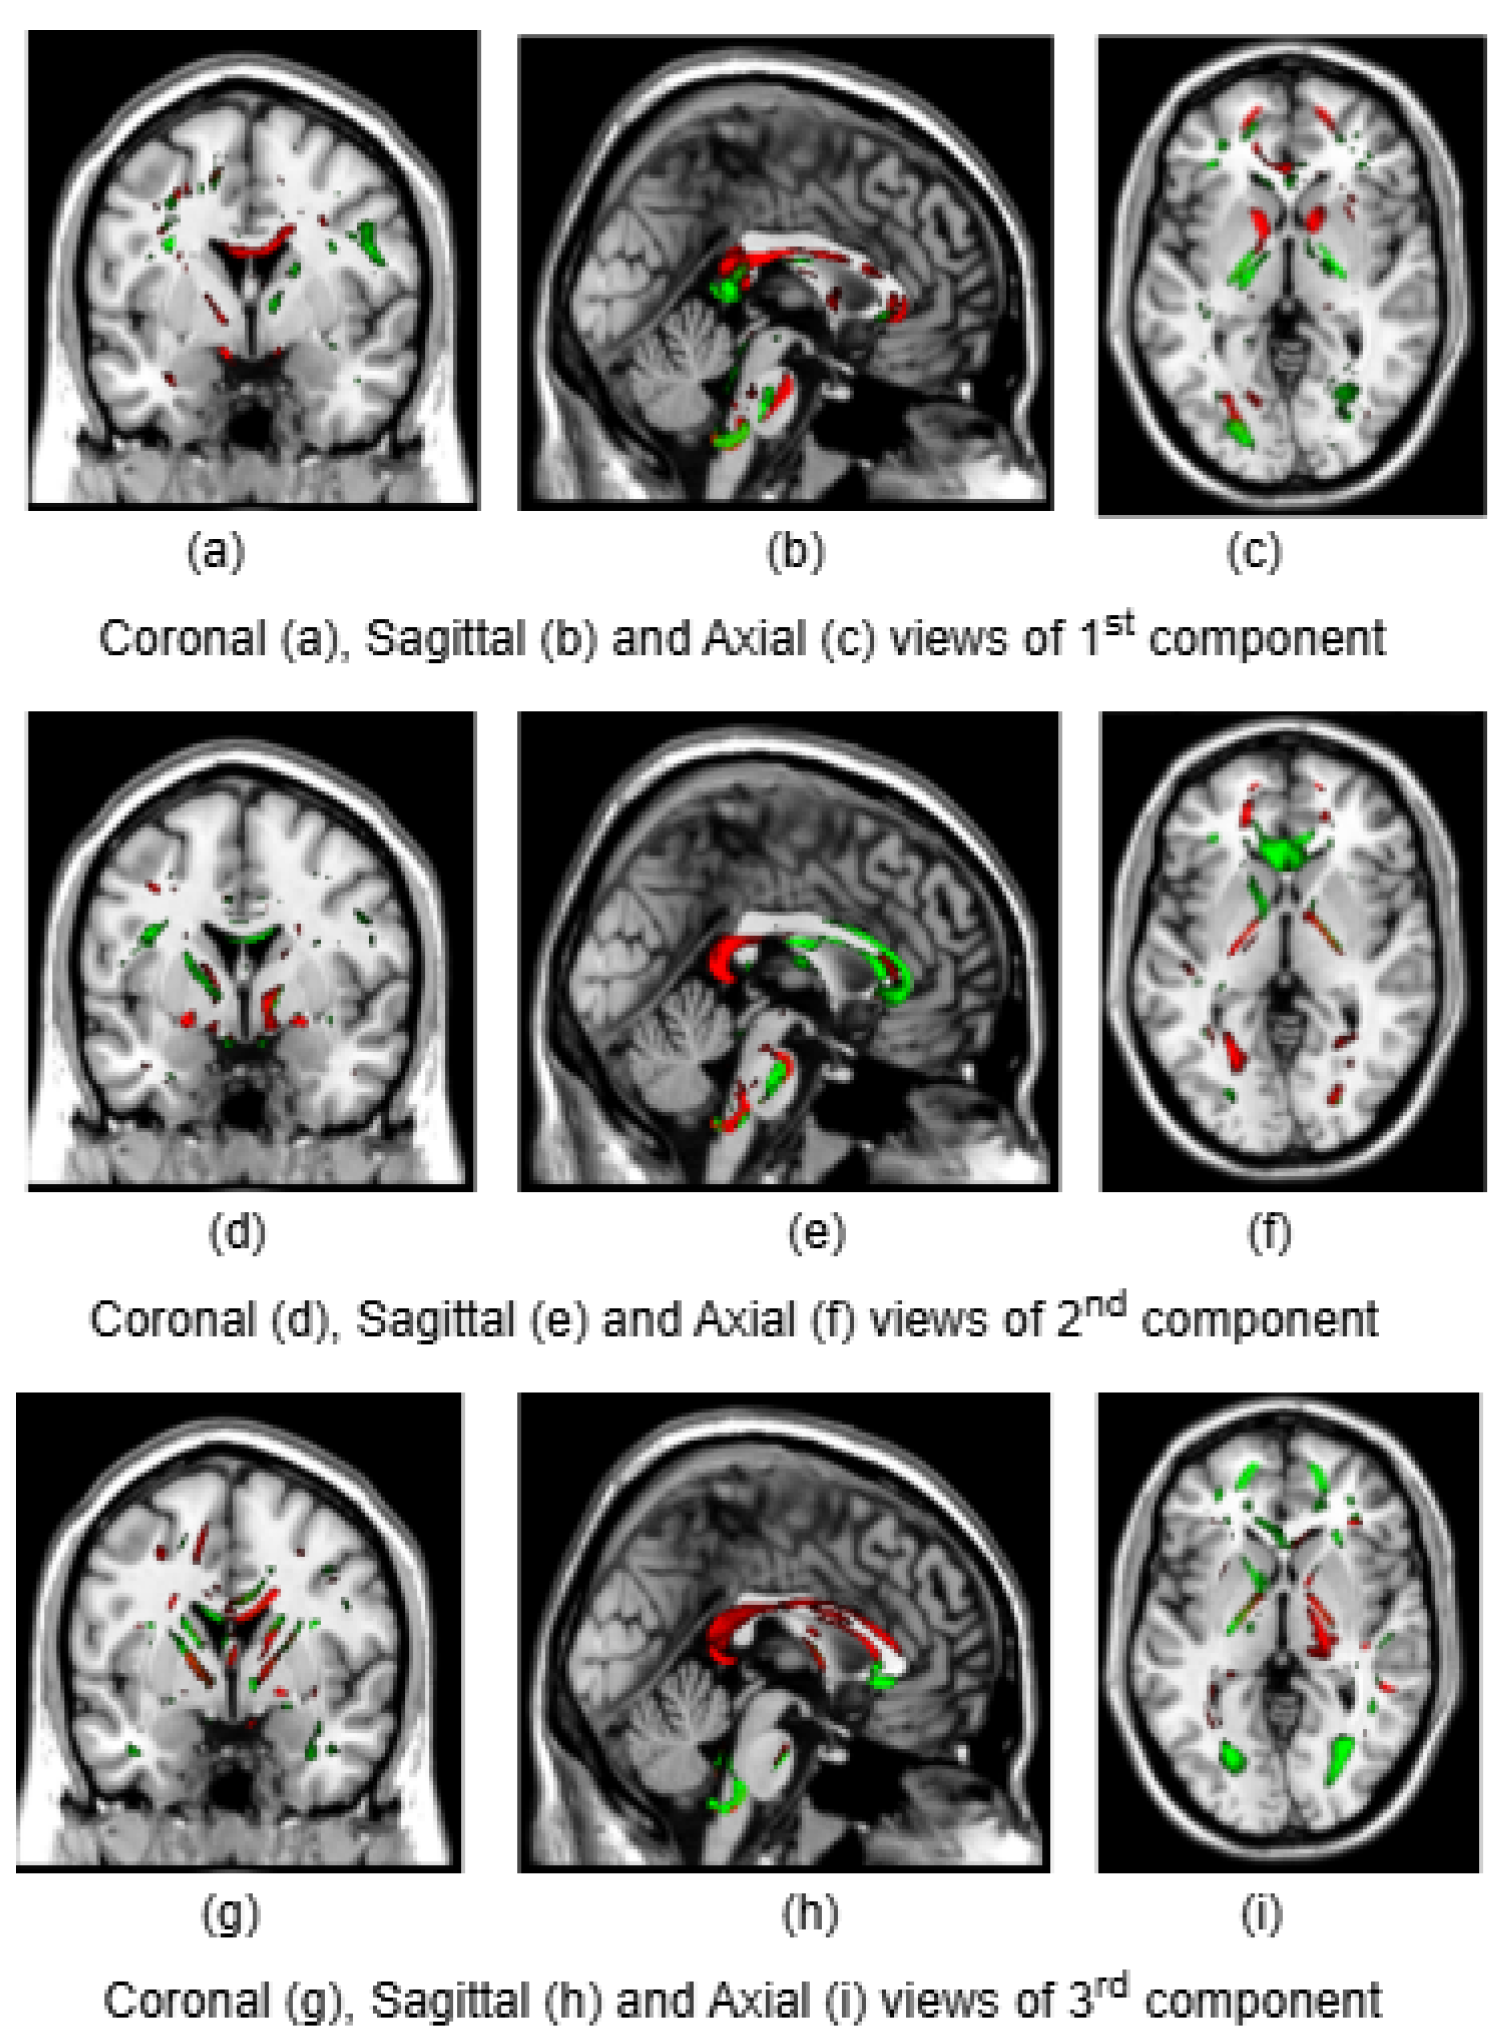
Figure 3.
Coronal, sagittal and axial views of first, second, and third components of GM identified by DCCAE
Figure 3.
Coronal, sagittal and axial views of first, second, and third components of GM identified by DCCAE
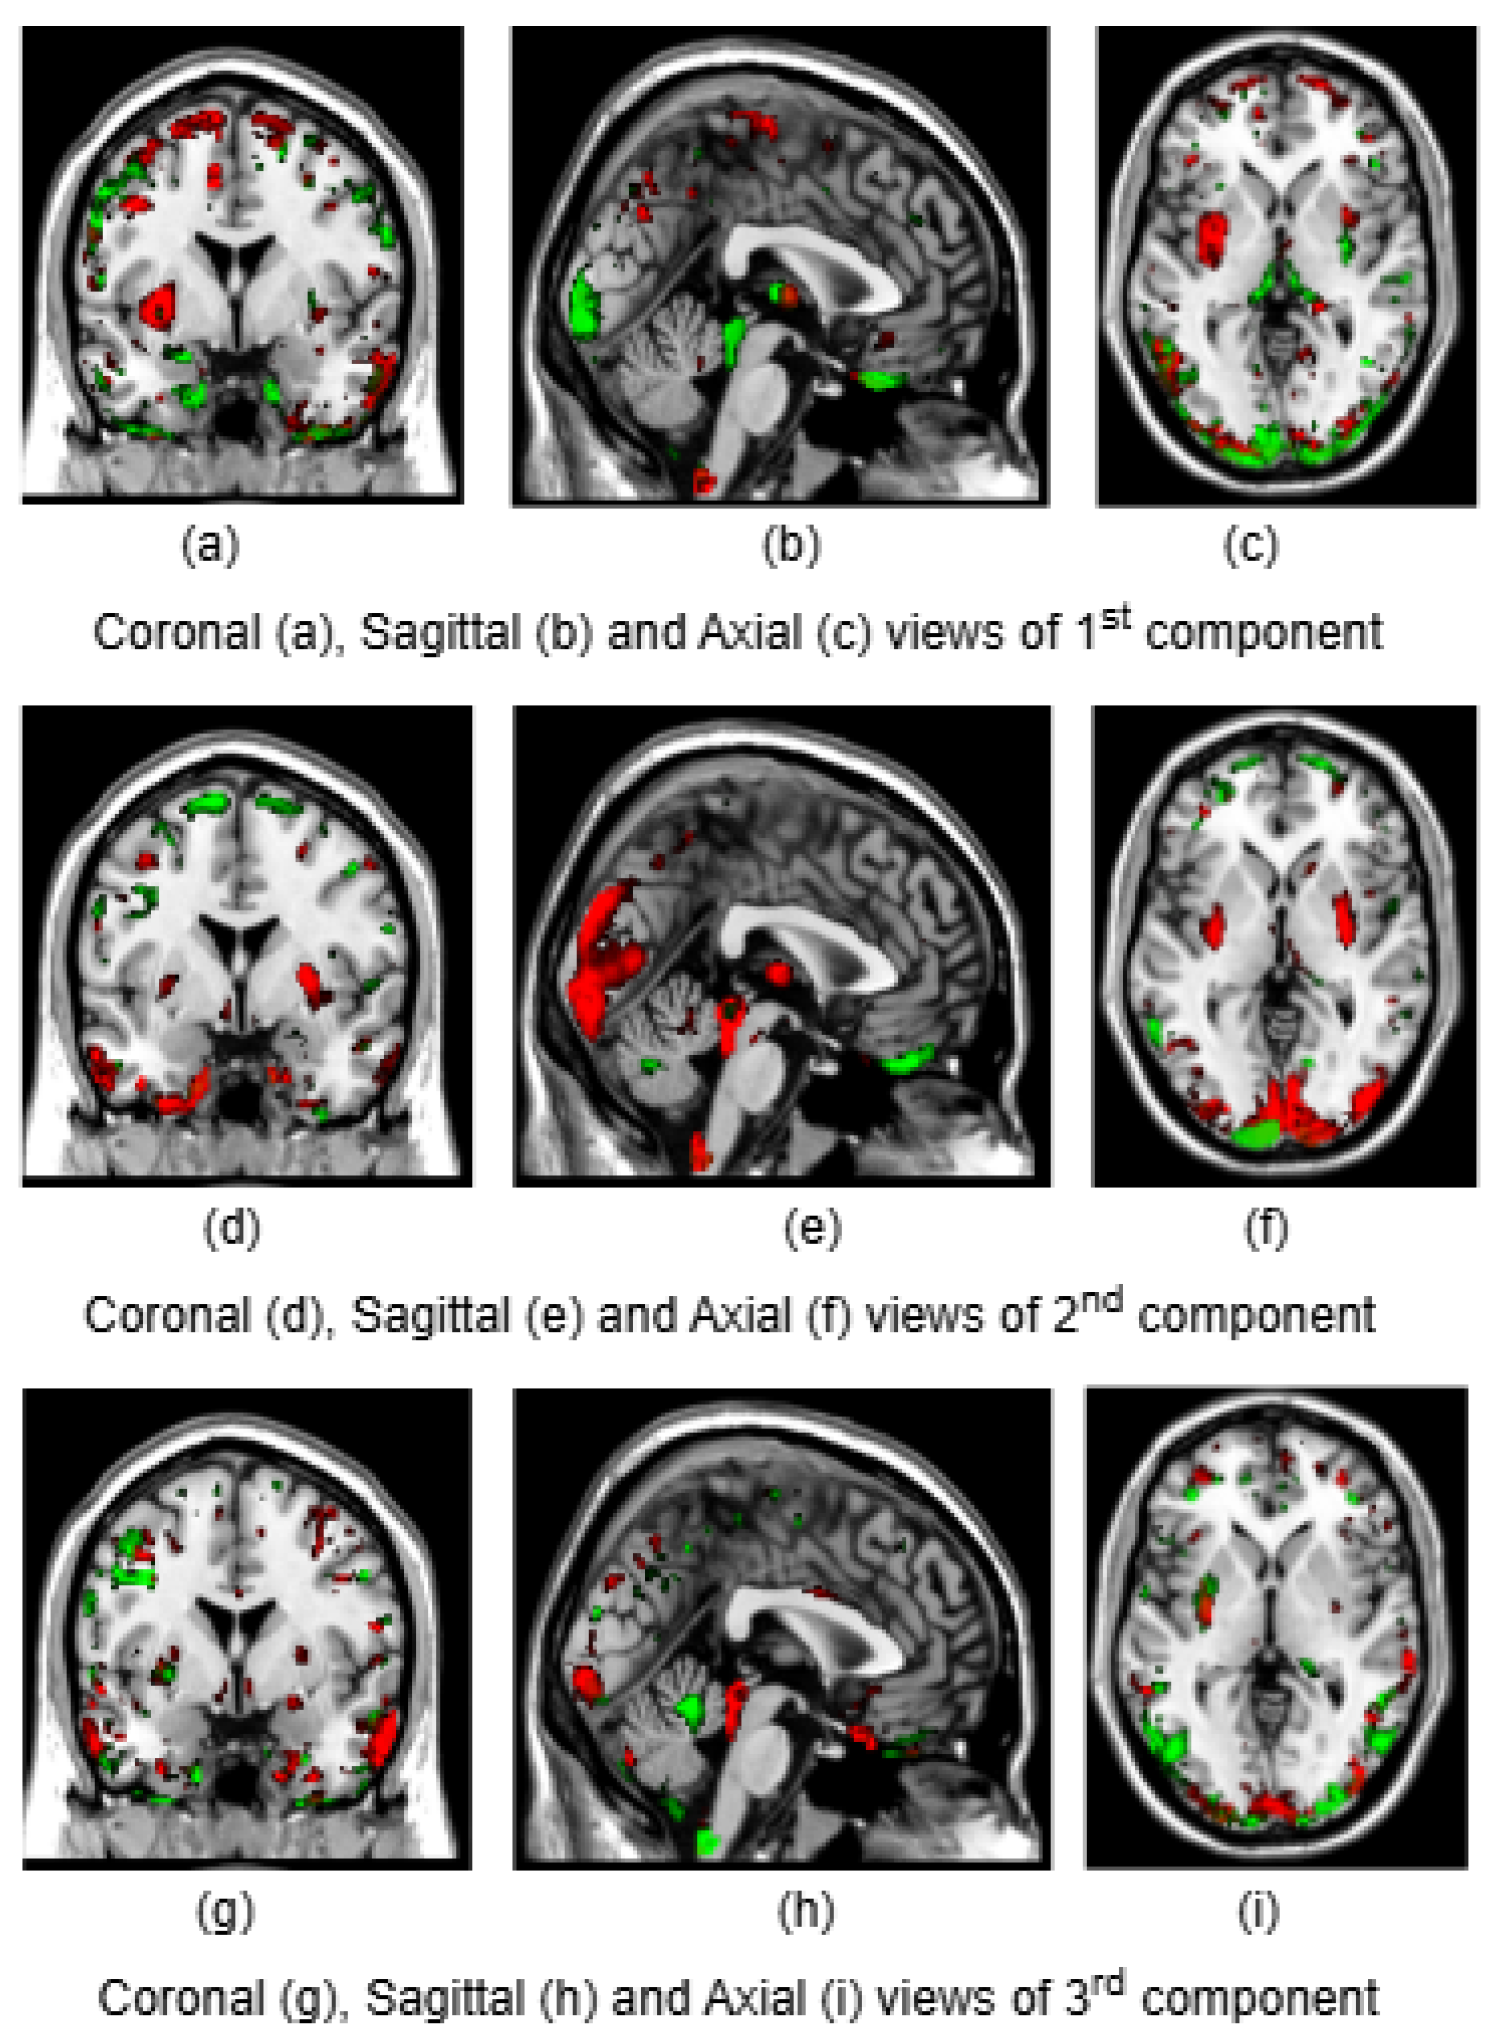
Figure 4.
Coronal, sagittal and axial views of first, second, and third components of FA identified by DCCAE
Figure 4.
Coronal, sagittal and axial views of first, second, and third components of FA identified by DCCAE
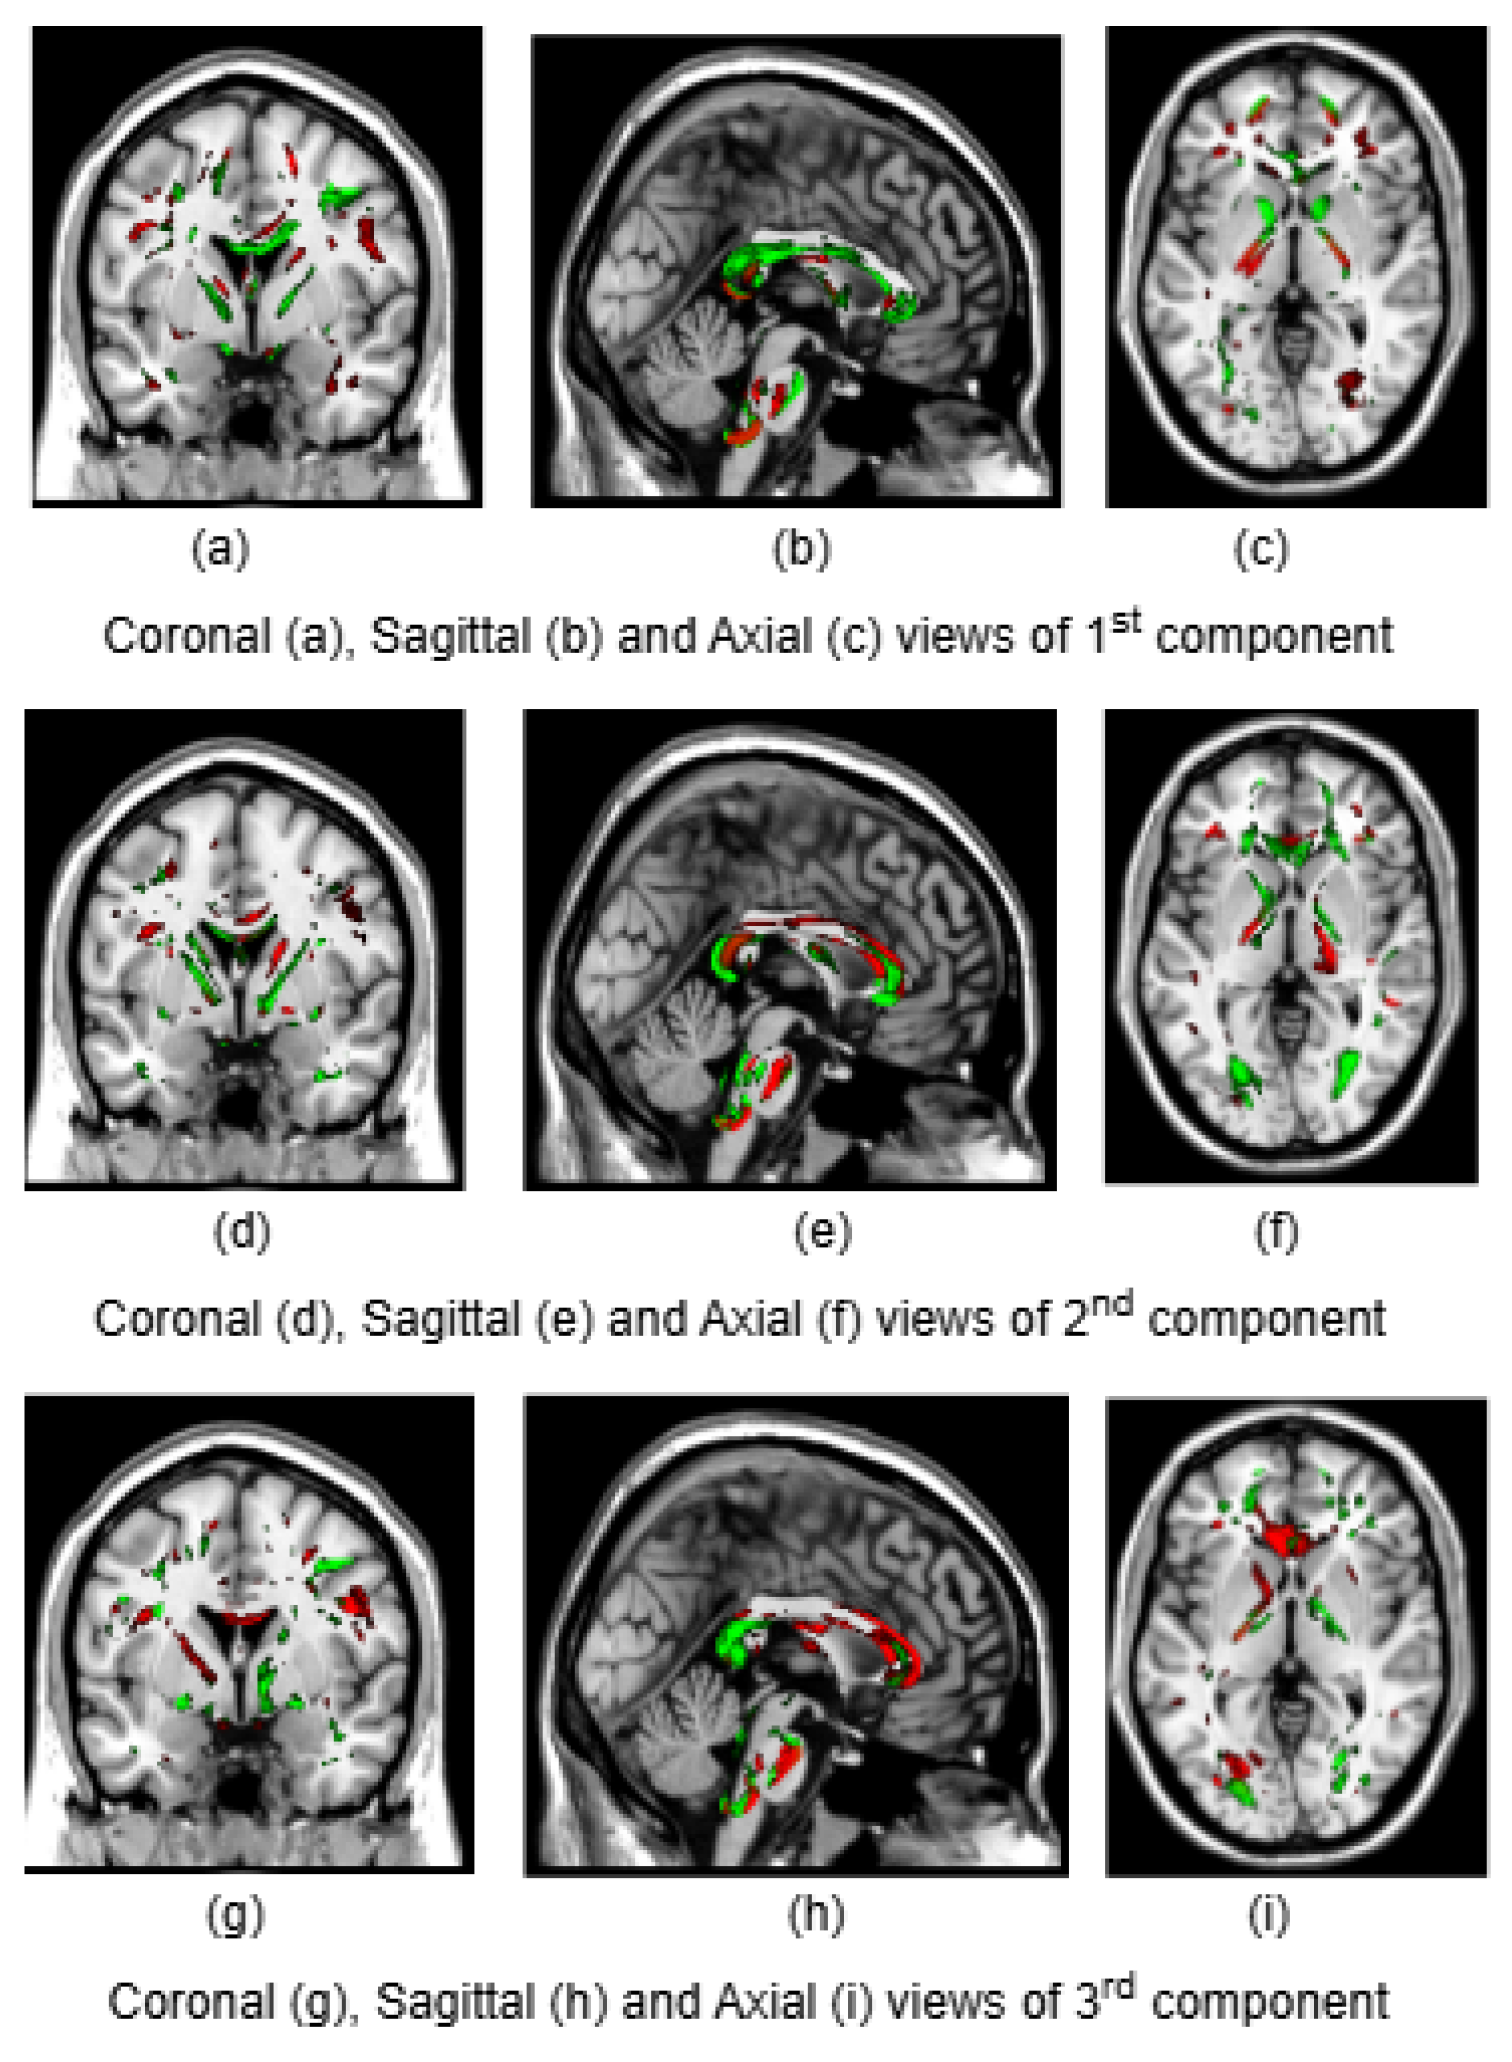

Table 1.
Correlation of CCA features in training and testing
| Score | 1st comp | 2nd comp | 3rd comp | 4th comp | 5th comp |
|---|---|---|---|---|---|
| Training | 0.61 (1.8E-178) | 0.54 (4.2E-120) | 0.48 (7.8E-114) | 0.33 (5.8E-48) | 0.32 (2.5E-40) |
| Testing | 0.22 (7.7E-09) | 0.44 (3.6E-33) | 0.32 (2.8E-17) | 0.12 (1.2E-04) | 0.26 (1.7E-12) |
Table 2.
Correlation of DCCAE features in training, validation and testing
| Score | 1st comp | 2nd comp | 3rd comp | 4th comp | 5th comp |
|---|---|---|---|---|---|
| Training | 0.82 (4.1E-293) | 0.74 (3.5E-250) | 0.71 (2.1E230) | 0.68 (1.2E-210) | 0.60 (5.3E-160) |
| Validation | 0.61 (2.4E-55) | 0.54 (6.8E-41) | 0.51 (2.2E-35) | 0.45 (6.1E-26) | 0.41 (3.5E-20) |
| Testing | 0.58 (4.7E-50) | 0.54 (6.7E-41) | 0.46 (1.3E-28) | 0.40 (5.2E-19) | 0.38 (7.8E-17) |
Table 3.
Correlation and p-value of CCA and DCCAE latent features (Gray Matter)
| CCA components | DCCAE components | Correlation score | P-value |
|---|---|---|---|
| 1st | 1st | -0.46 | 3.10E-174 |
| 2nd | -0.20 | 6.3E-32 | |
| 3rd | 0.32 | 2.34E-84 | |
| 2nd | 1st | -0.18 | 3.83E-27 |
| 2nd | -0.19 | 1.97E-30 | |
| 3rd | -0.41 | 4.33E-139 | |
| 3rd | 1st | -0.30 | 1.13E-71 |
| 2nd | 0.38 | 5.32E-119 | |
| 5th | -0.20 | 1.50E-32 |
Table 4.
Correlation and p-value of CCA and DCCAE latent features (White Matter)
| CCA components | DCCAE components | Correlation score | P-value |
|---|---|---|---|
| 1st | 1st | -0.43 | 3.38E-149 |
| 2nd | -0.22 | 1.20E-37 | |
| 3rd | 0.33 | 1.20E-85 | |
| 2nd | 1st | -0.23 | 1.91E-43 |
| 2nd | -0.24 | 6.67E-46 | |
| 3rd | -0.44 | 4.44E-161 | |
| 5th | -0.24 | 2.48E-47 | |
| 3rd | 1st | -0.48 | 3.02E-194 |
| 2nd | 0.46 | 1.90E-174 |
Table 5.
Association of CCA’s GM and FA components with cognition
| GRAY MATTER (CCA components) | WHITE MATTER (CCA components) | |
|---|---|---|
| Fluid | 2nd comp (0.03) (-), 7th comp (0.01) (-) | 13th comp (0.04) (-), 14th comp (0.04) (-) |
| Crystallized | 9th comp (0.03) (-) | NA |
| Total composite | 1st comp (0.04) (+), 10th comp (0.04) (-) | NA |
Table 6.
Association of DCCAE’s GM and FA components with cognition
| GRAY MATTER (DCCAE components) | WHITE MATTER(DCCAE components) | |
|---|---|---|
| Fluid | NA | NA |
| Crystallized | 9th comp (0.03) (-) | NA |
| Total composite | 1st comp (0.04) (-), 9th comp (0.04) (-) | NA |
Table 7.
Association of CCA’s components with CBCL syndrome
| GRAY MATTER (CCA components) | WHITE MATTER (CCA components) | |
|---|---|---|
| Aggressive Behavior | 3rd comp (0.03) (-), 4th comp (0.04) (-) | NA |
| Anxious/Depressed | NA | 14th comp (0.023) (-) |
| Attention Problems | NA | 4th comp (0.02) (-) |
| Rule-Breaking Behavior | NA | NA |
| Somatic Complaints | 1st comp (0.01) (-), 7th comp (0.03) (-) | NA |
| Social Problems | NA | NA |
| Thought Problems | 2nd comp (0.02) (-) | 5th comp (0.02) (+), 15th comp (0.01) (+) |
| Withdrawn/Depressed | 2nd comp (0.03) (-), 3rd comp (0.01) (-) | 7th comp (0.03) (-) |
Table 8.
Association of DCCAE’s components with CBCL syndrome
| GRAY MATTER (DCCAE components) | WHITE MATTER (DCCAE components) | |
|---|---|---|
| Aggressive Behavior | 5th comp (0.01) (-), 8th comp (0.01) (-) | NA |
| Anxious/Depressed | 5th comp (0.03) (-) | NA |
| Attention Problems | 9th comp (0.01) (+) | 7th comp (0.03) (-) |
| Rule-Breaking Behavior | NA | 4th comp (0.01) (-) |
| Somatic Complaints | 4th comp (0.04) (-), 9th comp (0.01) (-) | 5th comp (0.03) (-) |
| Social Problems | NA | NA |
| Thought Problems | NA | 2nd comp (0.04) (+) |
| Withdrawn/Depressed | 3rd comp (0.04) (+) | NA |
Table 9.
Total variance explained by CCA and DCCAE components for cognition
| Variance explained by | ||
|---|---|---|
| CCA components (%) | DCCAE components(%) | |
| Fluid | 11.11 | 9.8 |
| Crystallized | 9.99 | 3.09 |
| Total composite | 14.0 | 16.27 |
Table 10.
Total variance explained by CCA and DCCAE components for CBCL
| Variance explained by | ||
|---|---|---|
| CCA components (%) | DCCAE components(%) | |
| Aggressive Behavior | 1.01 | 0.7 |
| Anxious/Depressed | 1.03 | 1.01 |
| Attention Problems | 2.04 | 1.5 |
| Rule-Breaking Behavior | 1.01 | 1.23 |
| Somatic Complaints | 1.11 | 1.01 |
| Social Problems | 1.28 | 2.04 |
| Thought Problems | 3.09 | 1.01 |
| Withdrawn/Depressed | 2.04 | 2.04 |
Table 11.
Correlation of DCCAE features in training, validation and testing without hidden layers
| Score | 1st comp | 2nd comp | 3rd comp | 4th comp | 5th comp |
|---|---|---|---|---|---|
| Training | 0.63 | 0.57 | 0.52 | 0.46 | 0.43 |
| Validation | 0.60 | 0.49 | 0.40 | 0.37 | 0.35 |
| Testing | 0.49 | 0.43 | 0.36 | 0.34 | 0.30 |
Disclaimer/Publisher’s Note: The statements, opinions and data contained in all publications are solely those of the individual author(s) and contributor(s) and not of MDPI and/or the editor(s). MDPI and/or the editor(s) disclaim responsibility for any injury to people or property resulting from any ideas, methods, instructions or products referred to in the content. |
© 2025 by the authors. Licensee MDPI, Basel, Switzerland. This article is an open access article distributed under the terms and conditions of the Creative Commons Attribution (CC BY) license (http://creativecommons.org/licenses/by/4.0/).
Copyright: This open access article is published under a Creative Commons CC BY 4.0 license, which permit the free download, distribution, and reuse, provided that the author and preprint are cited in any reuse.


