Submitted:
14 February 2025
Posted:
14 February 2025
You are already at the latest version
Abstract
When designing and operating wind turbine parks, risks to people and the environment aris-ing from the operation of wind turbines should be identified and assessed. This paper presents one aspect of such risks – possible negative impacts of existing or planned wind turbine parks on the living conditions and activities of people near these parks. To assess and analyze relevant impacts, this paper uses the intuitionistic fuzzy method IF-DEMATEL. The choice of this method is associated with an extremely high degree of uncertainty of the initial information. In such cir-cumstances, it is more convenient for experts to express their subjective assessments in the form of linguistic terms. Then these linguistic terms are transformed into the form of triangular intui-tionistic fuzzy numbers (TINFs). These numbers form a set of initial data for using the IF-DEMATEL method.
Keywords:
wind farms
; negative impacts of parks
; direct negative impacts
; general negative impacts
; IF-DEMATEL method
1. Introduction
The transition to “green” types of electricity is an urgent need to reduce the negative impact on the environment and human life from existing sources of electricity. One of these sources is wind generators, which allow for the production of “clean” electricity.
However, the operation of wind farms also causes some negative impacts on the external environment. These negative impacts are sources of risks for various environmental entities, as well as for the life and activities of people near wind farms. Therefore, when designing and operating wind farms, the task of minimizing these negative impacts must be solved. To successfully solve this problem, potential negative impacts must be identified, assessed and analyzed.
The DEMATEL method was developed specifically for assessing various types of influences between factors in complex multifactorial problems. The original version of the DEMATEL method assumed crisp subjective assessments of influences. Later, the original DEMATEL method was extended to various forms of fuzzy input data: standard fuzzy numbers, interval-valued fuzzy numbers, and intuitionistic fuzzy numbers. In this paper, the intuitionistic fuzzy version of the DEMATEL method, IF-DEMATEL, is used because it allows for the successful use of highly uncertain initial information.
The article is structured as follows. Section 2 presents the basic data on the production of electricity based on wind turbines and the resulting negative impacts on the external environment and the living conditions and activities of people living near these parks. Section 3 discusses the evolution of the DEMATEL method towards increasing uncertainty of the initial data. Section 4 presents the definition of triangular intuitionistic fuzzy numbers (TIFNs) and the main operations on these numbers. Section 5 includes the calculation procedures of the IF-DEMATEL method. Section 6 formulates and solves a specific problem: identification and assessment of potential negative impacts of the planned wind turbine park in the Limbaži district of Latvia on the living and working conditions of people who will live near this park. Section 7 discusses the results obtained. Section 8 describes the materials and method used in this paper. Section 9 provides the conclusions drawn from the results obtained in the work.
2. Localized Negative Impacts of Wind Power Generation
In the 20th century, the main sources for generating electricity were hydropower and natural resources: oil products, coal and gas. When these types of fuel were burned, a large number of harmful substances were formed and emitted into the atmosphere. Together with emissions from vehicles and other sources, this caused severe pollution of the Earth’s atmosphere, which resulted in adverse climate changes.
In recent decades, in order to reduce the negative consequences of human techno genic activity in the field of electricity production, a course has been taken to use other, more environmentally friendly resources for electricity production. The main ones of these resources are solar radiation energy and wind energy.
In this article, we focus on the use of wind energy for electricity generation and some of the side effects associated with these processes.
The main advantage of wind energy is its environmental friendliness [1]. In other words, this method of electricity production does not cause any global negative impacts on the external environment. In addition, it does not use non-renewable natural resources such as oil and gas, and there is no damage to the external environment, which occurs during the extraction, transportation and use of such natural resources.
Wind energy is not only a cost-effective electricity generation technology that reduces pollutant emissions, it also significantly reduces the external costs of extracting and processing fossil fuels and conserves the natural resources themselves for more sustainable use in the future [1].
Wind power generation has increased significantly in recent years. Issue [2] presents data on the amount of electric energy (GW) generated from wind power in six leading countries: China – 31,527; UK – 14,741; Germany – 8,300; Netherlands – 5,269; Denmark – 2,343 and Belgium – 2,263.
According to the data presented in [3], in 2020, the total amount of electricity in the United States was obtained from the following sources:
- Renewable – 20%;
- Nuclear – 20%;
- Coal 19%;
- Natural gas – 40%;
- Petroleum – 1%.
In turn, the total amount of electricity obtained from renewable sources is distributed as follows:
- Wind – 8.4%;
- Hydro – 7.3%;
- Solar – 2.3%;
- Biomass – 1.4%;
- Geothermal – 0.4%.
Although wind farms do not create global impacts on the external environment, there are local impacts that are sources of risks for the local external environment and the population living near such parks.
The variability of wind power creates additional volatility in electricity markets. The intermittency of wind power requires the use of conventional backup power plants to provide the base load. An additional problem is the deterioration of wind turbine efficiency over their lifetime. Staffel and Green [11] show that degradation can reduce a wind farm’s output by 12% over its twenty-year lifetime.
Electricity generated by wind power is more expensive than electricity generated by traditional sources. The increase in its cost is ultimately passed on to consumers. Connecting new wind farms to existing transmission lines often requires laying new power lines, which also increases the cost of wind power. Moreover, increasing the volume of wind power produced can lead to increased unemployment in traditional electricity production areas.
Another group is formed by the impacts of the wind power generation process on the local external environment [2,4,12]. Direct impacts of wind turbines on the local external environment result in the death of birds and bats due to their collisions with the blades of wind turbines. In [4] it is stated that about 250 species of birds and 24 species of bats die in collisions with the blades of wind turbines.
In the long term, the impacts of wind farms may result in fragmentation of some populations, partial or complete displacement of some populations to other habitats, expansion of the habitat of invasive plant and animal populations, and other negative consequences.
As noted in [1], the local impacts of wind farms on the external environment are complex and can vary across spatial and temporal scales, location, seasons, ecosystem types, and other factors. Moreover, many of the impacts are cumulative.
Wind farms have significant impacts on the living conditions and health of individuals living near them [8,9,10,13,14,15,16]. The various impacts of this kind can be classified into the following groups:
- Impacts on human health.
These impacts are mainly related to noise and the flickering shadow effect caused by the operation of wind turbines.
- 2.
- Impact on property prices.
Given the adverse impacts on health and living conditions of people near wind turbines, the value of housing and other property in such areas may decrease significantly. This leads to unjustified losses when selling housing and property.
- 3.
- Impact on economic activity of people.
If some economic activity is carried out in the area of an existing or under construction wind turbine park, this activity may be significantly hampered. For example, the use of the area of the planned wind turbine park for agricultural production may lead to its reduction or even complete cessation.
- 4.
- Impact on people’s aesthetic feelings.
If an existing wind farm is located in a picturesque area, then the presence of this park can significantly affect people’s aesthetic perception of this picturesque area.
This paper proposes a formal analysis of the influence of factors associated with the construction and/or operation of wind farms on factors associated with the life and activities of people living near these parks.
3. Evolution of the DEMATEL Method
A crisp version of the DEMATEL method was first presented in [17] and was further developed in works [18,19].
The name of the method is associated with the organization in which the authors of the method worked: Decision Making Trial and Evaluation Laboratory. The primary goal of the method was to identify, evaluate and analyze the connections (influences) between various factors in complex multifactorial systems (situations). A simple and clear example of using the DEMATEL method to solve this type of problem can be found in the work [20], in which the authors identify connections (influences) between factors that influence the successful activity of individuals in various social groups.
The crisp version of the DEMATEL method has found wide practical application in solving various types of problems. Among the many works on this topic, we mention [21,22]. Extensive literature reviews on the crisp DEMATEL method can be found in [23,24].
Let us briefly present the sequence of calculation procedures performed when using the crisp DEMATEL method for assessing and analyzing the influences between relevant factors [22]. Let there be m factors and n experts whose initial task is to assess potential influences between the factors. The expert assesses the strength (intensity) of relevant influences using a suitable qualitative scale. Most often, a scale with five gradations (labels) is used: 0 – 1 – 2 – 3 - 4. Each of the experts performs assessments of direct influences between the factors, reflecting their subjective judgments using labels on a given scale. The assessment results are presented in the form of a table of size
where is the assessment of the -th expert of the degree of influence of the factor
on the factor .
The following sequence of computational procedures
is then performed.
1. The results of individual expert assessments are aggregated in any suitable way. As a result, a table of aggregated direct influences is formed.
2. The values in the table of aggregated direct influences are normalized by the expression
where
3. The normalized table of direct influences represents all the estimated direct influences between factors. However, in addition to the direct influences, there are indirect influences that result from successively interconnected intermediate factors. In order to identify and estimate the common influences that result from both direct and indirect influences, a table (matrix) of common influences D must be defined.
where is a unary matrix.
4. To exclude insignificant influences between factors, a threshold value for the strength (intensity) of influences should be determined. This value can be determined either by expert means or based on the following expression [25].
where , , , are the elements of the matrix ; - the total number of factors.
5. Based on the comparison of values with the threshold value , an abbreviated table of general influences is formed.
6. Based on the table data, the following reference values are calculated:
- vector of values
- vector of values
7. Based on the calculated values and , these vectors are formed:
For clarity and subsequent analysis, the initial set of factors can be graphically represented in coordinate space.
The value reflects the intensity of influences that a factor contributes to a system of factors or receives from a system of factors. This value shows the role of a factor that it plays in the system.
In turn, the value reflects the intensity of the effect, which is the result of the influences that the factor receives from other factors. If the value is positive, the factor is a source of pure influence, and this factor can be attributed to the group of cause factors. If the value is negative, this means that the factor belongs to the group of effect factors. In other words, the influences on this factor exceed the influence from this factor.
In the crisp DEMATEL method, expert assessments of influences are expressed on an ordinal scale 0 – 1 – 2 – 3 – 4. In other words, each of the relevant assessments is expressed in the form of a deterministic real number. However, in reality, experts often find it difficult to express their judgments in such a limited form. Human thinking is structured in such a way that experts find it easier to express their uncertain judgments about the influences between factors qualitatively in the form of linguistic terms, such as ″weak influence″, ″medium influence″, and the like. The initial expert assessments in the form of linguistic terms can be assigned suitable triangular (or trapezoidal) fuzzy numbers.
To meet the need to use uncertain estimates of influences between factors, a fuzzy version of the DEMATEL method was proposed: F-DEMATEL. The initial version of this method was proposed in [26] and was further developed in [27,28].
In the original F-DEMATEL method, linguistic terms are specified, using which experts perform their assessments of the influences between factors. These initial assessments are then transformed into corresponding triangular fuzzy numbers. There are different types of fuzzy numbers, which are matched with linguistic terms. The most widely used system of linguistic terms and the corresponding system of fuzzy numbers is proposed in [29].
If a group of m experts performs the influence assessment, the results of their assessments are presented in m tables. The results in all tables are then processed using the CFDS method – Converting Fuzzy Data in to Crisp Values [30].
As a result of five computational operations, a normalized table of direct influences is determined, which is an analogue of the table of direct influences in the crisp DEMATEL method. Subsequent computational procedures are performed according to the rules of the crisp DEMATEL method.
In addition to the original F-DEMATEL method, other variants have been proposed. One of the variants is used in the works [31,32]. In this variant, the initial expert assessments are also expressed in the form of linguistic terms, which are translated into the corresponding triangular fuzzy numbers.
Let the initial fuzzy estimations of the influences between factors be performed by a group of m experts. Let us denote by the individual fuzzy estimate of the k-th expert’s influence of the factor on the factor . The aggregated fuzzy values of the direct influences are given in the table , where
Based on the data in the table , a table of normalized fuzzy direct influences is formed, where
The table is divided into three tables (matrices):
, , .
For each of the matrices , the matrix of common influences is determined using the expressions
Based on the matrices , a table of general influences is formed, where
The values , , , are defuzzified based on the Best Non-fuzzy Performance Value (BNP) method [30].
All further computational procedures are performed according to the rules of the crisp DEMATEL method.
Another version of the F-DEMATEL method, among other works, is used in [33]. The initial computational procedures, as in the above-mentioned version of the F-DEMATEL method, are also performed in a fuzzy environment. However, after the formation of a fuzzy table of general influences subsequent computational procedures are also performed in a fuzzy environment.
1. The calculation of fuzzy values of the vector is performed according to the expression
2. The calculation of fuzzy values of the vector is performed according to the expression
3. Formation of fuzzy vectors and .
After defuzzification of fuzzy values , further analysis of the obtained results is performed in a crisp environment.
With the help of standard fuzzy numbers, specific uncertainties about the estimated influences can be successfully modeled. In this context, the specificity of the uncertainty is characterized as follows. By establishing a linguistic term for assigning an influence intensity, the expert actually defines a triangular fuzzy number as an estimate of the corresponding influence. In this way, he confirms that the actual estimate of the influence is located in the interval reflecting the basis of the relevant fuzzy number. The uncertainty is related only to the degree of belonging of any value in the interval to the set of real numbers in this interval.
In general, uncertainties regarding the estimated influences may be more complex. With respect to some actual value of influence in the interval of all such values, the expert may have some judgments regarding the degree of belonging of this value to the corresponding interval (fuzzy number). At the same time, the expert may have doubts about the actual belonging of this value to the corresponding interval (fuzzy number). This type of uncertainty often occurs in problems of discrete expert assessments; however, fundamentally it cannot be modeled using standard fuzzy numbers.
In order to expand the possibilities of modeling such uncertainties, K. T. Atanassov [34] introduced intuitionistic fuzzy sets (IFSs). Intuitionistic fuzzy numbers (IFNs) were introduced in [35]. In this paper, triangular IFNs are used to estimate mutual influences between factors.
Finally, it should be noted that in addition to the concept of IFNs, the concept of intuitionistic fuzzy values (IFVs) is also used in the literature. This concept is different from the concept of IFNs. There are versions of the F-DEMATEL method based on IFVs.
4. Introduction to Triangular Intuitionistic Fuzzy Numbers (TIFNs)
Let us present the necessary minimum of data on TIFNs, which is necessary for a qualified presentation of the IF-DEMATEL method.
An intuitionistic fuzzy number is an intuitionistic fuzzy set defined on the set of real numbers. Any intuitionistic fuzzy number is characterized by a membership function and a non-membership function. An approximate view of the graphs of the functions is shown in Figure 1.
In this paper, we will denote TIFN as . Let us describe simplified expressions for arithmetic operations on TIFNs [36]. Let there be two TIFNs:
Addition:
Subtraction:
Multiplication:
Multiplication by a constant :
Division:
5. Calculation Procedures of the IF-DEMATEL Method
Suppose that subjective assessments of the influences between factors are performed by a group of m experts. Each expert makes his initial assignments in the form of linguistic terms. Table 1 contains the linguistic terms and their corresponding TIFNs. These TIFNs are obtained based on the data presented in [37] by reducing all characteristic values of the original TIFNs by a factor of 10. The purpose of this transformation is to simplify subsequent calculations.
Using the data of Table 1, the initial qualitative assignments of influences are transformed into the corresponding TIFNs. The full set of TIFNs corresponding to the assignments of the k-th expert is represented in the form of a table of direct influences . The value at the intersection of the i-th row and the j-th column displays the intuitionistic fuzzy estimate of the k-th expert of the degree of influence of the factor on the factor . In the diagonal cells of the table, 0 are written. As a result of the assessments of all experts, we have m tables of individual fuzzy estimates of direct influences.
To perform subsequent relevant calculations, it is necessary to assign weights to the experts. To do this, each expert makes subjective assessments of the competence of other experts using the linguistic terms presented in Table 2 [38].
In this paper, we use standard TFNs as fuzzy estimates of expert competence because they are easier to process.
The results of the assessments of the k-th expert are presented in the form of a vector , , where is the fuzzy assessment by the k-th expert (k-th row of the table) of the degree of competence of the j-th expert, (j-th column of the table).
The aggregation of the obtained results is performed according to the expression
where
(The summation is performed over the columns of the matrix of initial fuzzy estimates.)
The resulting fuzzy values are defuzzified using the expression [30]
Normalization of the crisp values of the weights is performed according to the expression
The following computational procedures are then performed:
1. Aggregation of individual fuzzy estimates of direct influences according to expression (26).
2. By analogy with expressions (11) - (12), the normalization of aggregated fuzzy estimates of direct influences is carried out according to expressions (35-36).
The entire set of normalized values is presented in the form of a table .
3. To form a fuzzy table of general influences, the following tables are formed: , , , and . According to expression (4), these tables are transformed into the form:
where I is a unary table.
There is no need to calculate the table since it is equal to the table .
4. Based on Tables 34–38, a fuzzy table of general influences is formed.
5. By summing up the fuzzy values in the rows of the matrix , we obtain the fuzzy values of the vector :
6. By summing up the fuzzy values in the columns of the matrix , we obtain the fuzzy values of the vector :
7. Defuzzification of fuzzy values of vectors and is performed according to expression (30).
8. Based on the calculated crisp values and , these vectors are formed:
Based on the values and , a detailed analysis of the relevant influences is performed.
6. A Case Study: Evaluation and Analysis of the Impacts of Wind Turbine Park Factors on Risk Factors for Human Life and Activities
As shown in Section 2, the presence of a wind farm can have negative impacts on the lives and activities of people in the vicinity of the park. The objective is to identify, structure, assess and analyze such impacts.
Three experts participate in the study: E1, E2, and E3. Based on their knowledge and experience, the experts identified the following two groups of factors.
- Factors related to the construction and operation of a wind turbine park:
f1 - Park structure. This concept includes the number of wind turbines, their type and mutual arrangement.
f2 - Noise level generated by wind turbines.
f3 - Flickering shadow effect generated by wind turbines.
Factors associated with the life and activities of people near the wind turbine park.
f4 - Health and well-being of residents.
f5 - Conditions of economic activity of residents.
f6 - Cost of housing and property of residents.
Based on their subjective judgments, the experts established a structure of influences between the factors. This structure is schematically presented in Figure 2.
Given the uniqueness of the problem, there is a high degree of uncertainty in quantifying influences. Therefore, it seems appropriate to present influence’s estimates in the form of TIFNs.
It is clear from Figure 2 that factors f1, f2 and f3 are sources of influences, and factors f4, f5, f6 are effect factors. This follows from the fact that arrows exit from all nodes corresponding to factors f1, f2, f3, but do not exit from any of the nodes corresponding to factors f4, f5, f6.
Before relevant evaluations and calculations can be performed, the task of assigning expert weights must be performed. To do this, each expert evaluates the competence levels of the remaining experts using the linguistic terms in Table 2. Table 3 presents the results of the qualitative expert evaluations and their corresponding TIFNs.
Using expression (32), we calculate the aggregated fuzzy values of the weights.
Using expression (33), we perform defuzzification of the obtained fuzzy values.
Normalizing the obtained clear values according to expression (34), we have the following values of expert weights.
We aggregate individual fuzzy estimates of direct influences in Table 4, Table 5 and Table 6 using expression (29). As an example, let us calculate the fuzzy aggregate value .
The calculations of the remaining aggregate values are performed by analogy. Fuzzy aggregate estimates of direct influences are presented in Table 7.
2. Using expressions (32) and (33), we normalize the TIFNs in Table 7. For that purpose, the last row of Table 7 displays the maximum values . The normalized fuzzy estimates of direct influences are given in Table 8.
Based on the data in Table 8, we form tables , , , , . Recall that there is no need to form table, since it is equal to table .
We transform the obtained tables according to expressions (37) – (41). Using the obtained results, we form a table of fuzzy common influences (Table 9).
Using the data from Table 9, we calculate the fuzzy value of the vector by expression (42).
The calculation of the remaining fuzzy values is performed by analogy. As a result, we have:
Using the data from Table 9, we calculate the fuzzy value of the vector by expression (43).
The calculation of the remaining fuzzy values is performed by analogy. As a result, we have:
Using expression (30), we defuzzify fuzzy values .
The remaining values of ri are calculated by analogy. The crisp values of ri are presented in the second row of Table 10.
Using expression (30), we defuzzify fuzzy value .
The remaining ci values are calculated by analogy. The exact ci values are given in the fourth row of Table 10.
Using expression (44), we calculate the crisp value of the vector :.
The remaining values are calculated by analogy. The calculated values are shown in the sixth row of Table 10.
Using expression (45), we calculate the crisp value of the vector :
The remaining values are calculated by analogy. The calculated values are presented in the eighth row of Table 10.
In Figure 3, factors f1 – f6 are shown in the coordinate space , .
7. Discussion
The specificity of the problem in the present work is that all relevant factors are a priori explicitly divided into two groups: cause factors f1, f2, f3, and effect factors f4, f5, f6. The resulting impact estimates only confirm this fact: the values , , are positive, while the values , , are negative. The greatest intensity of impact is exhibited by factor f1, since it has the maximum value. It follows from Figure 2 that factor f1 directly influences both cause factors f2, f3, and effect factor f6. In addition, factor f1 indirectly influences factors f4, f5 through factors f2, f3. It follows that factor f1 is the main cause factor, which directly and indirectly influences risk factors f4, f5, f6.
Factors f2, f3, on the one hand, are subject to the influence of factor f1 and, on the other hand, influence factors f4, f5. The intensities of incoming and outgoing influences for these factors are such that the intensity of incoming influences is less than the intensity of outgoing influences; therefore, the values and , are positive, and these factors actually play the role of causal factors.
It follows directly from Figure 2 that factors f4, f5, f6 are effect factors. The least total influence is for factor f5. Total influences on factors f4, f6 significantly exceed the total influence on factor f5. At the same time, the total influence on factor f6 exceeds the total influence on factor f4,
Let us display the above formal presentations of the results in a simple verbal form.
The determining cause factor is the factor ″Park structure″. This factor directly influences the cause factors ″Noise level″ and ″Effect of flickering shadows″ and the effect factors ″Conditions of economic activity″ and ″Value of estate″.
The cause factors ″Noise level″ and ″Shimmering shadow effect″ both influence the effect factors ″State of health and well-being of people″ and ″Condition of economic activity″. In the context of the task presented in this paper, it is clear that the structure of the potential wind turbine park significantly influences the risk factors ″State of health and well-being of people″ and ″Condition of economic activity″ and to a lesser extent influences ″Value of estate″. Using the obtained results, the following recommendation can be formulated for the design of the future wind turbine park in Limbaži district, Latvia. The park structure should be formed in such a way as to minimize the negative impacts on the life and activities of people near this park, associated with the operation of this park in the future.
8. Materials and Methods
The material for the study in this paper is the possible negative impacts on the life and activities of people near the planned wind farm in the Limbaži district of Latvia. The main sources of information are expert assessments of relevant impacts, expressed in the form of linguistic terms, which are transformed into TINFs according to the relevant rules. The processing of the initial assessments in the form of TIFNs is carried out on the basis of the intuitionistic fuzzy version of the DEMATEL method. The results obtained will be used in designing the structure of the future wind farm.
9. Conclusions
This paper presents the problem of assessing the influences of factors associated with a potential wind farm in the vicinity of the city of Limbaži in Latvia on the risk factors for people who will live near this park. The initial data for solving this problem are very uncertain. The experts who performed the relevant assessments were not able to express their judgments in the form of real numbers. Therefore, they were asked to express their subjective judgments regarding the influences between the factors in the form of linguistic terms, which were subsequently transformed into suitable TIFNs.
The overall assessment and analysis of relevant impacts were performed based on the fuzzy intuitionistic version of the DEMATEL method. This version has been successfully used to assess and analyze impacts between various factors and has proven its effectiveness in many practical tasks.
The analysis of the obtained results shows that the determining factor of potential risks for residents in the vicinity of a potential wind turbine park is the future structure of this park. Therefore, this structure should be designed and implemented in such a way as to minimize potential risks for people who will live near this park.
References
- Jabber, S. Environmental Impacts of Wind Energy. Journal of Clean Energy Technologies 2013, 1, 251–54. [Google Scholar] [CrossRef]
- WFO-Report-2024Q1. Global Offshore Wind Report. wlo-global.org/wp-content/uploads/2024/04/WFO-Report- 2024Q1.
- Christol, C., Oteri, F., Laurienti, M. Land-Based Wind Energy Siting: A Foundation and Technical Resource (Report) 2021. U.S. Department of Energy, Office of Energy Efficiency & Renewable Energy.
- info@awwi.org.202-656-3303. . Wind Turbine with Wildlife and Their Habitats. American Wind Wildlife Institute (AWWI) 2020.
- Dorell, J., Lee K. 2020. The Cost of Wind: Negative Economic Effects of Global Wind Energy Development. Energies 2020, 13 (14), 3667. [CrossRef]
- Varela-Vázquez P., Sánchez-Carreira M. 2015. Socioeconomic impact of wind energy on peripheral regions. Renewable and Sustainable Energy Reviews 2015 50, 982–90. [CrossRef]
- Stefek, J., Kaelin, A., Tegen, S., Roberts, O., Kayser. D. Economic Impacts from Wind Energy in Colorado Case Study: Rush Creek Wind Farm. Technical Report NREL/TP-5000-73659 2019, NREL, Office of Energy Efficiency & Renewable Energy.
- Stehly, T., Duffy, P., Hernando, D. M. Cost of Wind Energy Review. The 12th annual Cost of Wind Energy Review 2022, National Renewable Energy Laboratory. https://www.nrel.gov/docs/fy24osti/88335.pdf.
- Connolly, K. The regional economic impact of offshore wind energy developments in Scotland. Renewable Energy 2020, 160, 148–59. [Google Scholar] [CrossRef]
- Kehinde, A., Ijumba N., Colton, J. 2020. Exploring the environmental and economic impacts of wind energy: a cost-benefits perspective. Int. Journal of Sustainable Developments & World Ecology 2020, 27(1), 1-14. [CrossRef]
- Staffel, I. , Green, R. How does wind farm performance decline with age? Renewable Energy 2014, 66, 775–86. [Google Scholar] [CrossRef]
- Nazir, M. Sh., Ali, N., Bilal, M., Iqbal, H. M. N. Potential environmental impacts of wind energy development: A global perspective. Current Opinion in Environmental Science & Health 2020, 13, 85–90. [CrossRef]
- Glasson, J., Durning, B., Welch, K., Olorundami. T. 2022. The local socio-economic impacts of offshore wind farms. Environmental Impact Assessment Review 2022, 95 (2), 106783. [CrossRef]
- Alem-Fonseca, M., Herberz, T., Karanayil, V., Fardin, A. A Qualitative meta-analysis of the socioeconomic impacts of offshore wind farms. Sustinere: Journal of environment and Sustainability 2020, 4 (3): 155–71. [CrossRef]
- Layton, J., Henderson, A.. Disadvantages of Wind Energy: Do Wind Turbines Affect Health? 2023, https://science.howstuffworks.com/environmental/green-science/wind-turbines-health.htm.
- Roy, J. J., Krogh, C., Horner, B. Adverse health effects of industrial wind turbines. Canadian Journal of rural medicine 2014, 59 (5), 473-75.
- Fontela, E. , André Gabus, A. 1972. World Problems, an Invitation to Further Thought within the Framework of DEMATEL 1972, Battelle Geneva Research Centre, Geneva.
- Gabus, A. , André and Fontela, E. 1973. Perceptions of the World Problem Antique: Communication Procedure, Communicating with Those Bearing Collective Responsibilities. DEMATEL. Report No. 1 1973, Battelle Geneva Research Centre, Geneva.
- Fontela, E., Emilio and André Gabus, A. The DEMATEL Observer 1976, Battelle Geneva Research Centre, Geneva.
- Tamura, H., Katsuhiro Akazawa, K. 2005. Structural modeling and systems analysis of uneasy factors for realizing safe, secure and reliable society. Journal of Telecommunications and Information Technology 2005, 3, 64 – 72. [CrossRef]
- Uyanik, C., Tuzkaya, G., Kalender, Z. T., Senay Oguztimur, S. 2020. An Integrated DEMATEL-IF-TOPSIS Methodology for Logistic Centers’ Location Selection Problem: An Application for Istanbul Metropolitan Area. Transport 2020, 35 (6), 548 –56. [CrossRef]
- Tsai, J.–F., Wang, Ch.–P., Lin, M.–H., Huang, Sh.–W. Analysis of Key Factors for Supplier Selection in Taiwan’s Thin-Film Transistor Liquid-Crystal Display Industry. Mathematics 2021, 9, 396. [CrossRef]
- Si, Sh.-L., You, X.–Y., Liu, H–Ch., Zhang, P. 2018. DEMATEL Technique: A Systematic Review of the State-of-the-Art Literature on Methodologies and Applications. Mathematical Problems in Engineering 2018, 1– 33. [CrossRef]
- Koca, G., Yildirim, S. 2021. Bibliometric Analysis of DEMATEL Method. Decision Making: Applications in Management and Engineering 2021, 4 (1), 85–103. [CrossRef]
- Ou Yang, Y.-P., Shihe, H.-M., Leu, J.-D., Tzeng, G.H. 2008. A Novel Hybrid MCDM Model Combined with DEMATEL and ANP with Applications. Int. Journal of Operational Research 2008, 5 (3), 160–68.
- Lin, Ch.-J., Wu, W-W. A Fuzzy Extension of the DEMATEL Method for Group Decision Making. European Journal of Operational Research 2004, 156.
- Hsu, Ch.-Y., Chen, K.-T., Tzeng, G.-H. 2007. FMCDM with Fuzzy DEMATEL Approach for Customers’ Behavioral Model. Int. Journal of Fuzzy Systems 2007, 9 (4), 236–46.
- Tseng, M.-L., Lin, Y. 2009. Application of fuzzy DEMATEL to develop a cause and effect model of municipal solid waste management in Metro Manila. Environmental Monitoring and Assessment 2009, 158 (1 – 4), 519–33. [CrossRef]
- Chang, B., Chang, Ch.-W., Wu, Ch.-H. 2011. Fuzzy DEMATEL method for developing supplier selection criteria. Expert Systems with Applications 2011, 38, 1850 –58. [CrossRef]
- Opricovic, S., Tzeng, G.-H. 2003. Defuzzification within Multicriteria Decision Model. Int. Journal of Uncertainty, Fuzziness and Knowledge-Based Systems 2003, 11 (5), 635–52. [CrossRef]
- Tsai, S.-B., Chien, M.-F., Xue Y., Li, L. Jiang, X., Chen, Q., Wang, L. Using the Fuzzy DEMATEL to Determine Environmental Performance: A Case of Printed Circuit Board Industry in Taiwan. PLOS ONE, Public Library of Science 2015, 10 (6), 1–18. [CrossRef]
- Çelik, M. T., Seher Arslankaya, S. Analysis of quality control criteria in an business with the fuzzy DEMATEL method: Glass Business Example. Journal of Engineering Research 2023, 11 (4). [CrossRef]
- Seker, S. , Zavadskas, E.K. Application of Fuzzy DEMATEL Method for Analyzing Occupational Risks of Construction Sites. Sustainability 2017, 9, 2083. [Google Scholar] [CrossRef]
- Atanassov, K..T. 1986. Intuitionistic Fuzzy Sets. Fuzzy Sets and Systems 1986, 20, 87 – 96. [CrossRef]
- Burillo, P. , Bustince, H., Mohedano, V. Some definitions on intuitionistic fuzzy number. Fuzzy based expert systems, fuzzy Bulgarian enthusiasts 1994, 28–30. Sofia. Bulgaria.
- Zhang, X. , Liu, P. 2010. Method for aggregating triangular intuitionistic information and its application to decision making. Technological and Economic Development 2010, 16, 280–90. [Google Scholar] [CrossRef]
- Keshavarzfard, R. , Makui, A. 2015.An IF-DEMATEL-AHP based on Triangular Fuzzy Numbers (TIFNs). Decision Science Letters 2015, 4, 237–246. [Google Scholar] [CrossRef]
- Li, H., Yang, J., Xiang, Z. 2022. A Fuzzy Linguistic Multi-Criteria Decision-Making Approach to Assess Emergency Suppliers. Sustainability, 2020, 14, 13114. [CrossRef]
Figure 1.
Approximate view of the graphs of the membership function and non-membership function TIFN .
Figure 1.
Approximate view of the graphs of the membership function and non-membership function TIFN .
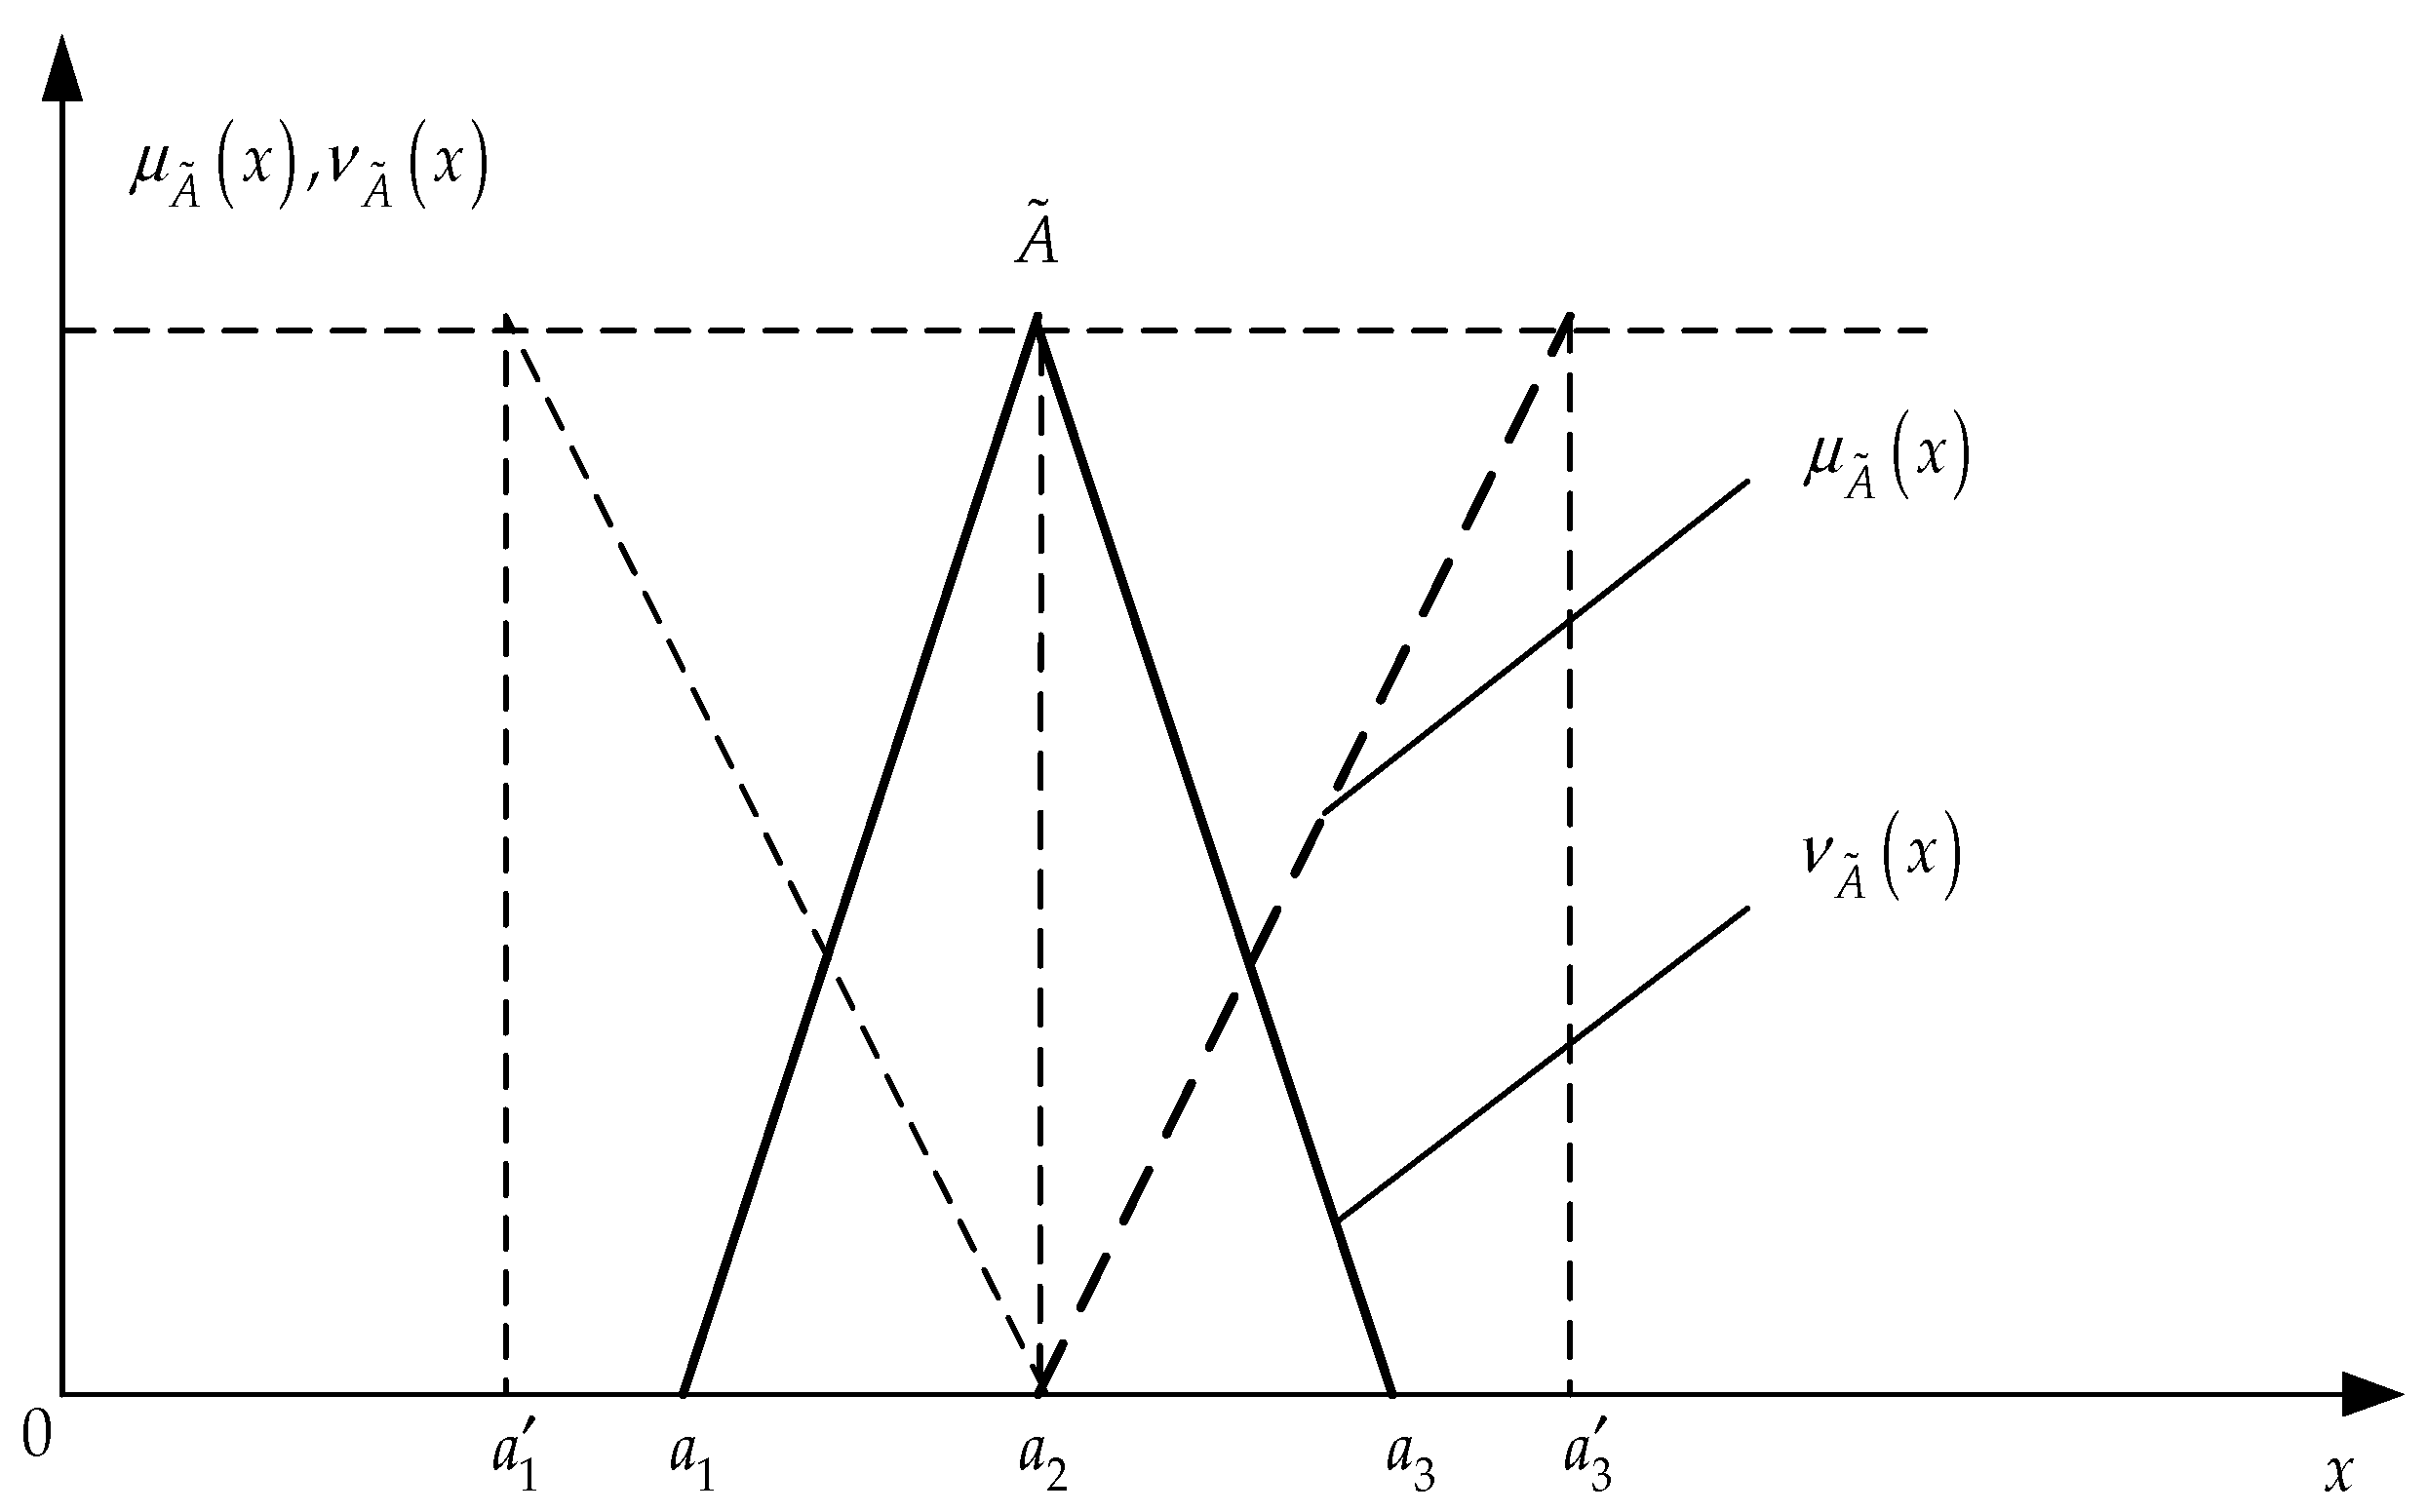
Figure 2.
Schematic representation of the influences between wind farm-related factors and risk factors for residents.
Figure 2.
Schematic representation of the influences between wind farm-related factors and risk factors for residents.
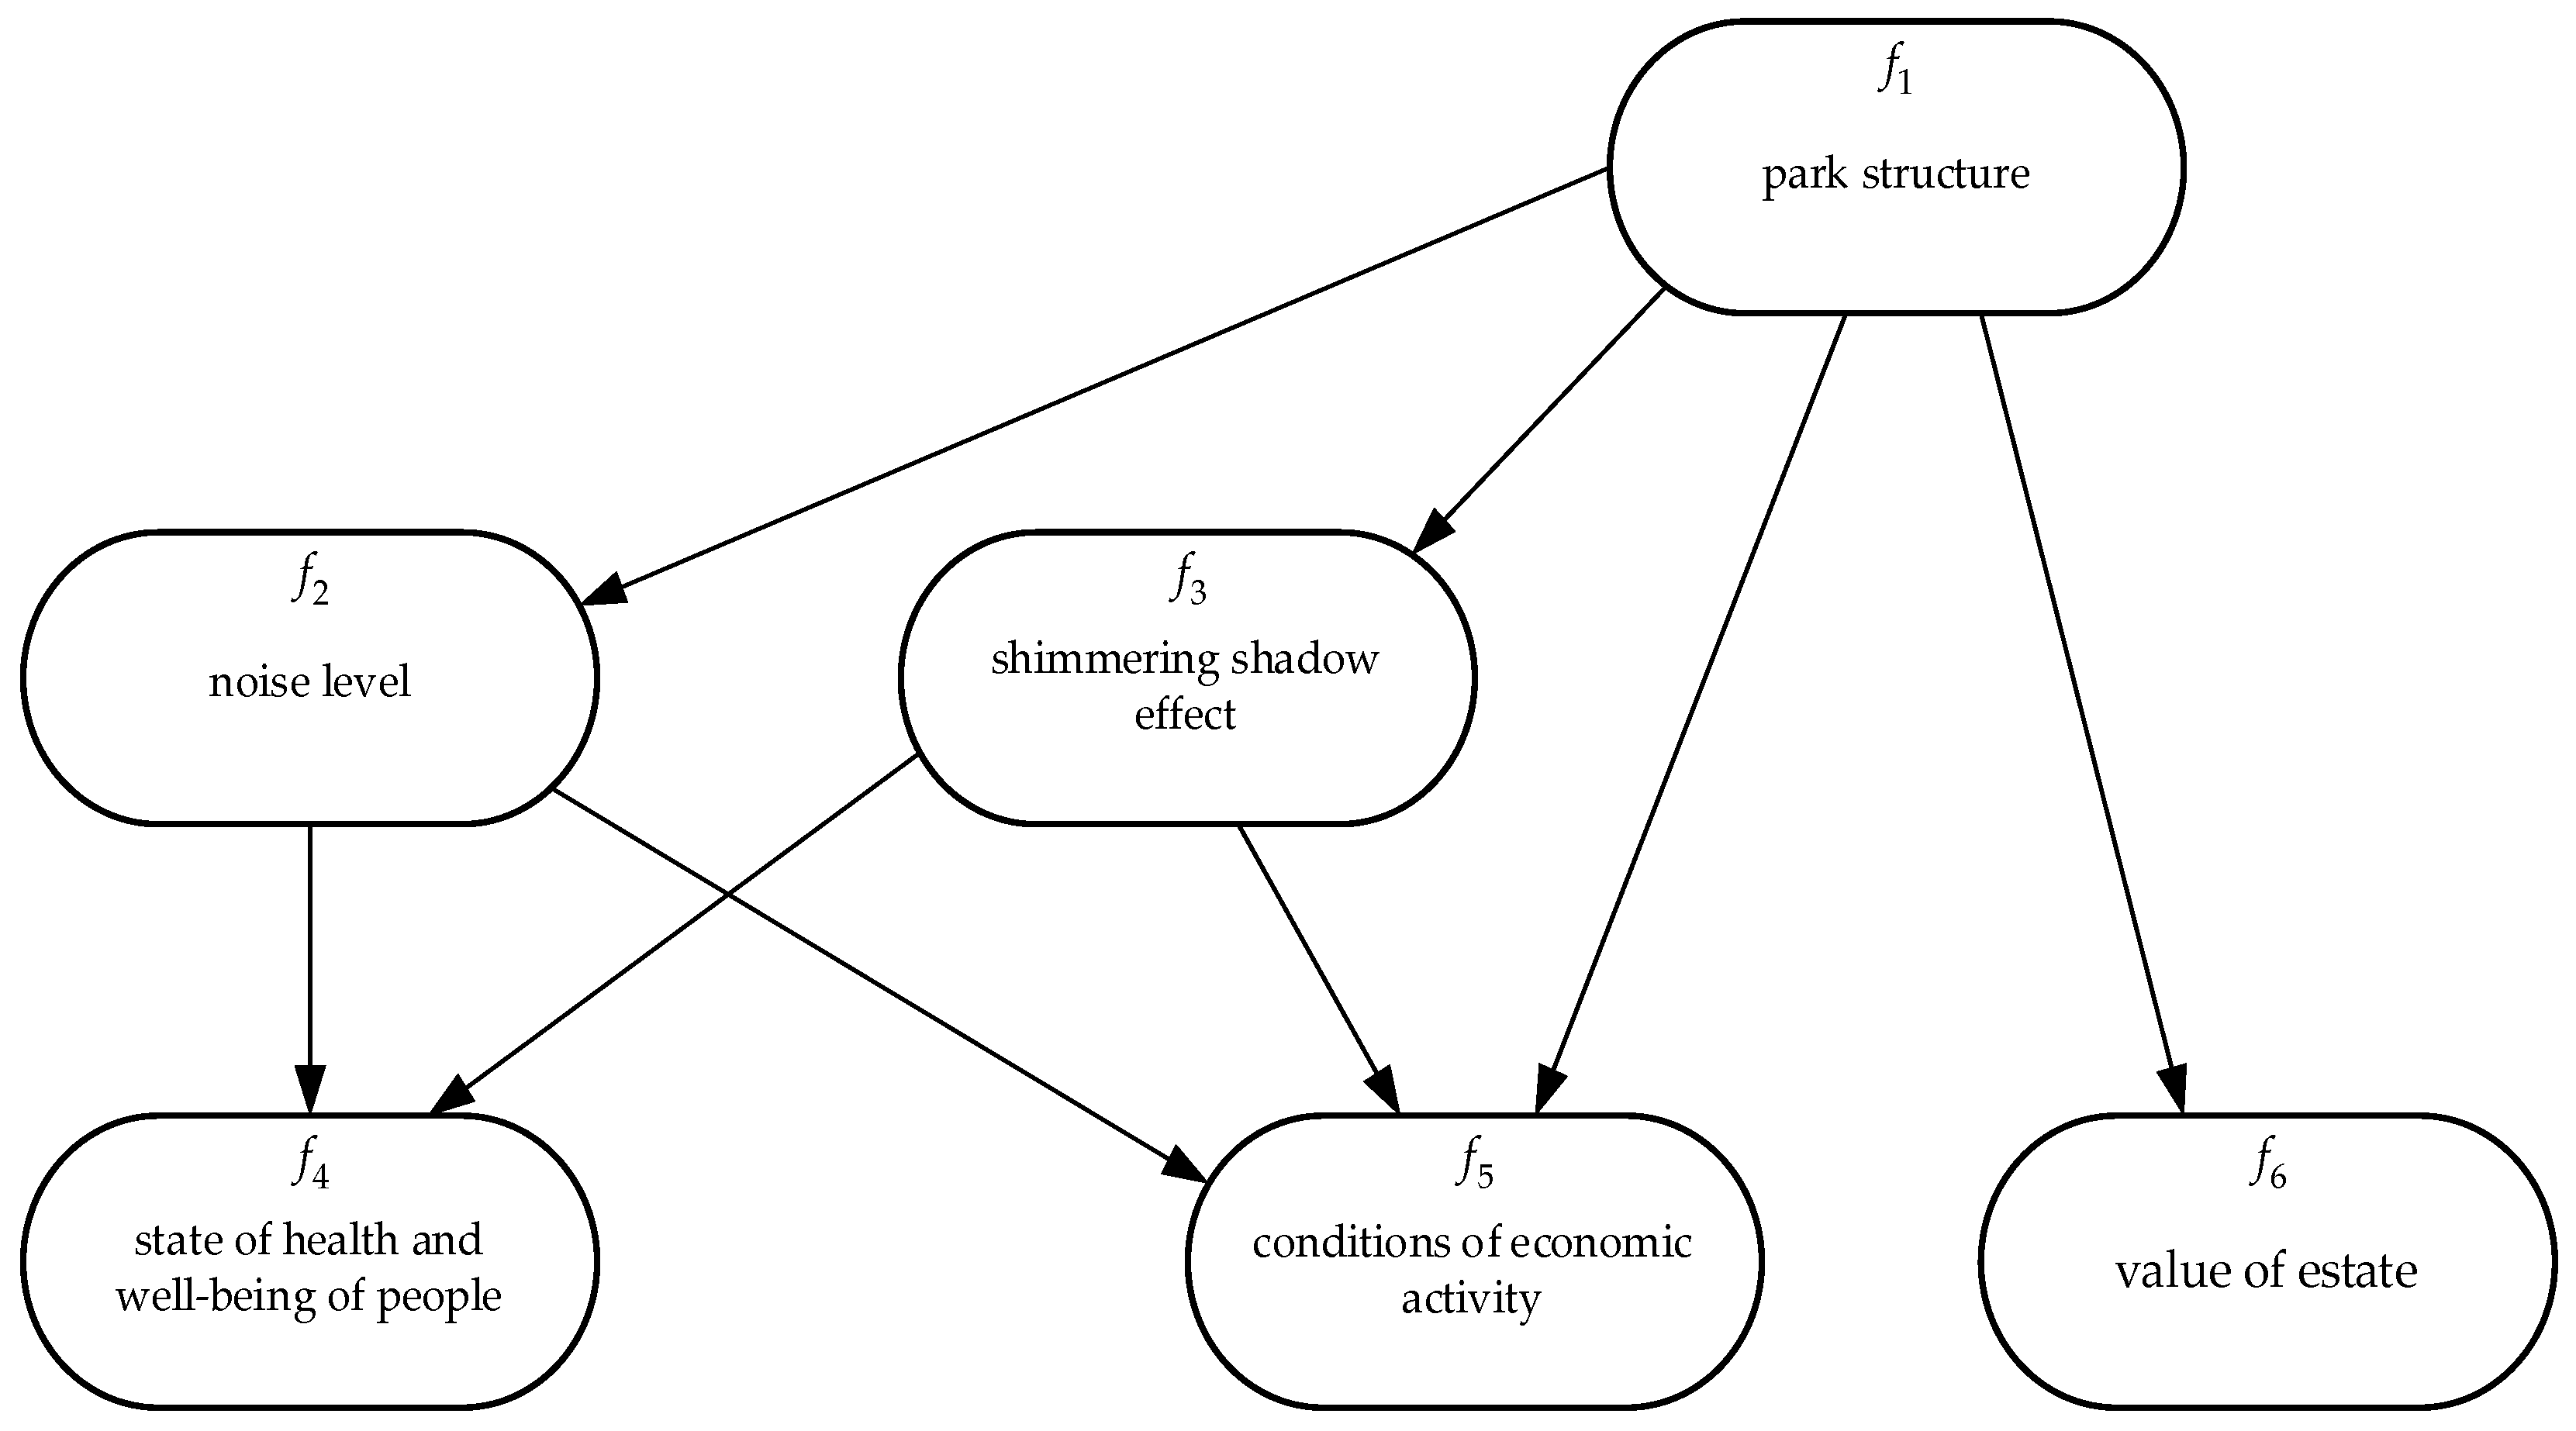
Figure 3.
Factors f1 – f6 in the coordinate space , .
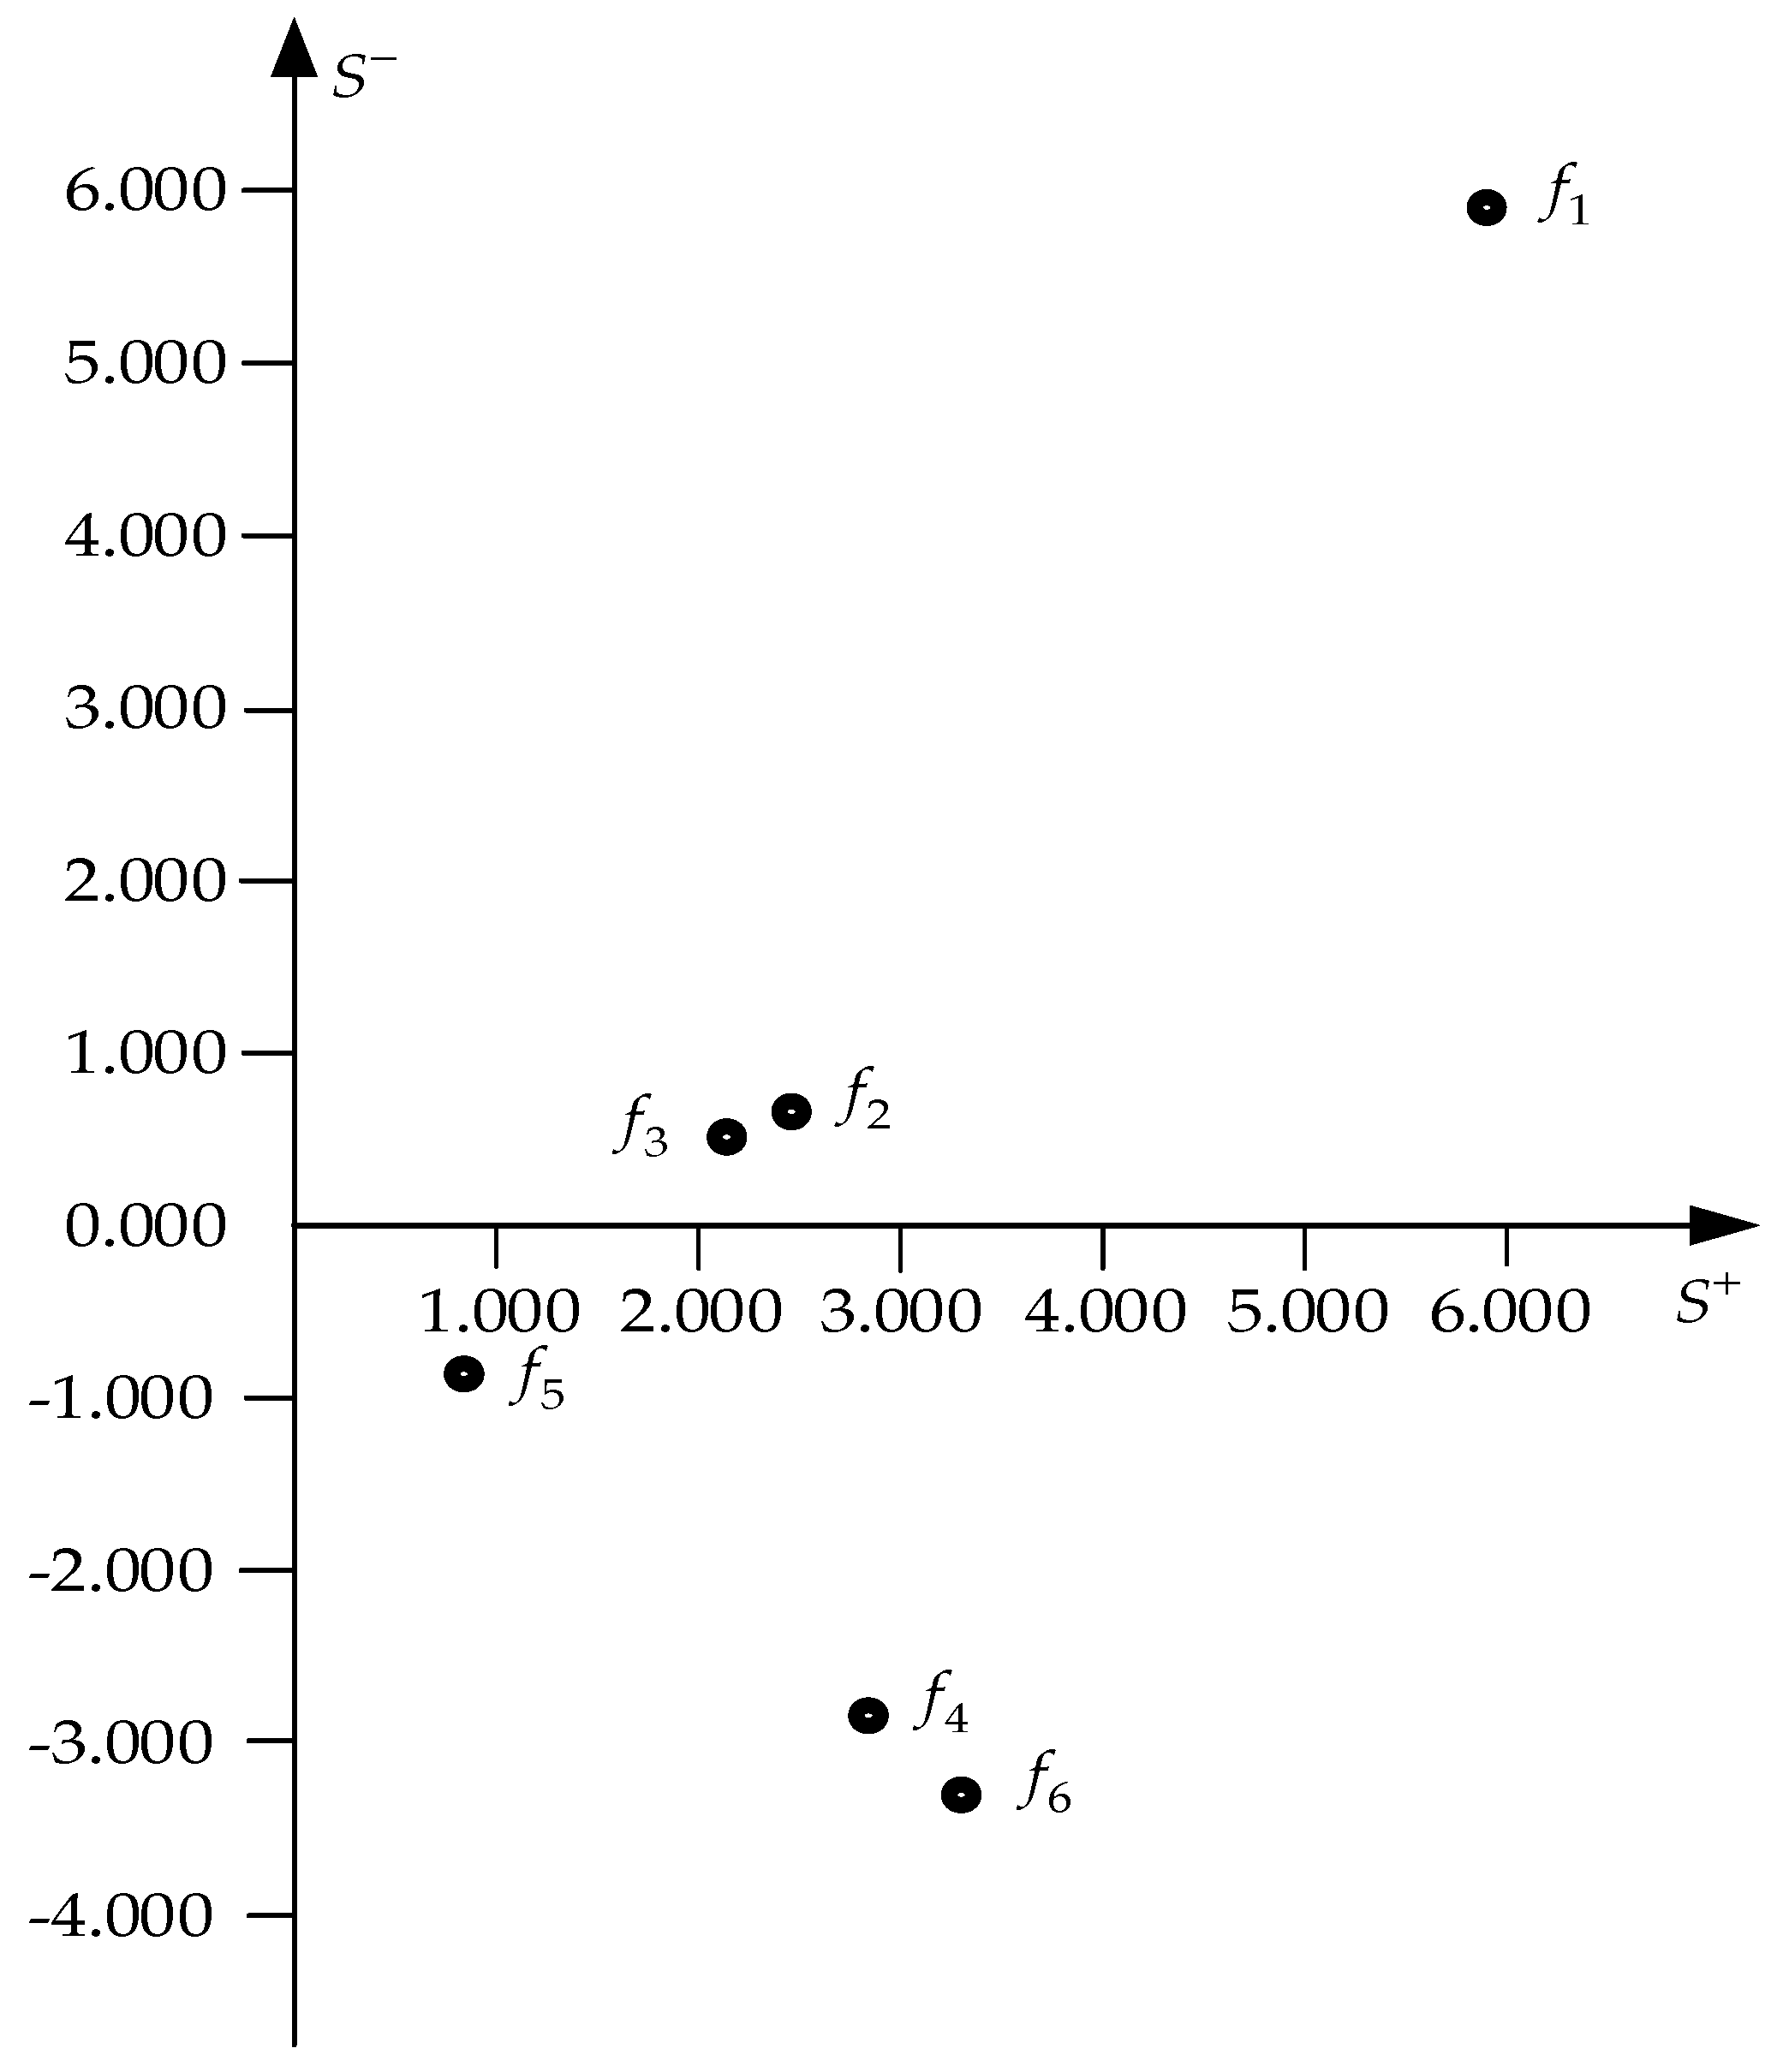

Table 1.
Linguistic terms reflecting subjective expert judgments about the degree of influence between two factors and their corresponding TIFNs.
Table 1.
Linguistic terms reflecting subjective expert judgments about the degree of influence between two factors and their corresponding TIFNs.
| Linguistic terms | TIFNs |
|---|---|
| Very high influence (VH) | (0.75, 0.80, 0.85) (0.70, 0.80, 0.90) |
| High influence (H) | (0.55, 0.60, 0.65) (0.50, 0.60, 0.70) |
| Low influence (L) | (0.35, 0.40, 0.45) (0.30, 0.40, 0.50) |
| Very low influence (VL) | (0.15, 0.20, 0.25) (0.10, 0.20, 0.30) |
| No influence (NO) | (0.00, 0.00, 0.00) (0.00, 0.00, 0.00) |
Table 2.
Linguistic terms reflecting each expert’s subjective judgments about the competence of other experts, and the corresponding TFNs.
Table 2.
Linguistic terms reflecting each expert’s subjective judgments about the competence of other experts, and the corresponding TFNs.
| Linguistic terms | TFNs |
|---|---|
| Extremely important (EI) | (0.8, 0.9, 1.0) |
| Very important (VI) | (0.7, 0.8, 0.9) |
| Important (I) | (0.6, 0.7, 0.8) |
| Middle (M) | (0.4, 0.5, 0.6) |
| Unimportant (U) | (0.3, 0.4, 0.5) |
| Very unimportant (VU) | (0.1, 0.2, 0.3) |
Table 3.
Qualitative and fuzzy results of mutual assessments of the degree of competence of experts.
Table 3.
Qualitative and fuzzy results of mutual assessments of the degree of competence of experts.
| E1 | E2 | E3 | |
| E1 | (0, 0, 0) | (VI) (0.7, 0.8, 0.0) |
(I) (0.6, 0.7, 0.8) |
| E2 | (VI) (0.7, 0.8, 0.9) |
(0, 0, 0) | (M) (0.4, 0.5, 0.6) |
| E3 | (I) (0.6, 0.7, 0.8) |
(VI) (0.7, 0.8, 0.9) |
(0, 0, 0) |
Table 4.
Qualitative results of influence assessments by expert E1 and corresponding TIFNs.
| f1 | f2 | f3 | |
|---|---|---|---|
| f1 | (0.00, 0.00, 0.00) | (L) (0.35, 0.40, 0.45) (0.30, 0.40, 0.50) |
(L) (0.35, 0.40, 0.45) (0.30, 0.40, 0.50) |
| f2 | (0.00, 0.00, 0.00) | (0.00, 0.00, 0.00) | (0.00, 0.00, 0.00) |
| f3 | (0.00, 0.00, 0.00) | (0.00, 0.00, 0.00) | (0.00, 0.00, 0.00) |
| f4 | (0.00, 0.00, 0.00) | (0.00, 0.00, 0.00) | (0.00, 0.00, 0.00) |
| f5 | (0.00, 0.00, 0.00) | (0.00, 0.00, 0.00) | (0.00, 0.00, 0.00) |
| f6 | (0.00, 0.00, 0.00) | (0.00, 0.00, 0.00) | (0.00, 0.00, 0.00) |
| f4 | f5 | f6 | |
| f1 | (0.00, 0.00, 0.00) | (L) (0.35, 0.40, 0.45) (0.30, 0.40, 0.50) |
(H) (0.55, 0.60, 0.65) (0.50, 0.60, 0.70) |
| f2 | (L) (0.35, 0.40, 0.45) (0.30, 0.40, 0.50) |
(0.00, 0.00, 0.00) | (L) (0.35, 0.40, 0.45) (0.30, 0.40, 0.50) |
| f3 | (L) (0.35, 0.40, 0.45) (0.30, 0.40, 0.50) |
(0.00, 0.00, 0.00) | (L) (0.35, 0.40, 0.45) (0.30, 0.40, 0.50) |
| f4 | (0.00, 0.00, 0.00) | (0.00, 0.00, 0.00) | (0.00, 0.00, 0.00) |
| f5 | (0.00, 0.00, 0.00) | (0.00, 0.00, 0.00) | (0.00, 0.00, 0.00) |
| f6 | (0.00, 0.00, 0.00) | (0.00, 0.00, 0.00) | (0.00, 0.00, 0.00) |
Table 5.
Qualitative results of expert influence assessments by expert E2 and corresponding TIFNs.
| f1 | f2 | f3 | |
|---|---|---|---|
| f1 | (0.00, 0.00, 0.00) | (H) (0.55, 0.60, 0.65) (0.50, 0.60, 0.70) |
(L) (0.35, 0.40, 0.45) (0.30, 0.40, 0.50) |
| f2 | (0.00, 0.00, 0.00) | (0.00, 0.00, 0.00) | (0.00, 0.00, 0.00) |
| f3 | (0.00, 0.00, 0.00) | (0.00, 0.00, 0.00) | (0.00, 0.00, 0.00) |
| f4 | (0.00, 0.00, 0.00) | (0.00, 0.00, 0.00) | (0.00, 0.00, 0.00) |
| f5 | (0.00, 0.00, 0.00) | (0.00, 0.00, 0.00) | (0.00, 0.00, 0.00) |
| f6 | (0.00, 0.00, 0.00) | (0.00, 0.00, 0.00) | (0.00, 0.00, 0.00) |
| f4 | f5 | f6 | |
| f1 | (0.00, 0.00, 0.00) | (H) (0.55, 0.60, 0.65) (0.30, 0.40, 0.50) |
(H) (0.55, 0.60, 0.65) (0.50, 0.60, 0.70) |
| f2 | (H) (0.55, 0.60, 0.65) (0.50, 0.60, 0.70) |
(0.00, 0.00, 0.00) | (H) (0.55, 0.60, 0.65) (0.50, 0.60, 0.70) |
| f3 | (L) (0.35, 0.40, 0-.45) (0.30, 0.40, 0.50) |
(0.00, 0.00, 0.00) | (L) (0.35, 0.40, 0-.45) (0.30, 0.40, 0.50) |
| f4 | (0.00, 0.00, 0.00) | (0.00, 0.00, 0.00) | (0.00, 0.00, 0.00) |
| f5 | (0.00, 0.00, 0.00) | (0.00, 0.00, 0.00) | (0.00, 0.00, 0.00) |
| f6 | (0.00, 0.00, 0.00) | (0.00, 0.00, 0.00) | (0.00, 0.00, 0.00) |
Table 6.
Qualitative results of expert influence assessments by expert E3 and corresponding TIFNs.
| f1 | f2 | f3 | |
|---|---|---|---|
| f1 | (0.00, 0.00, 0.00) | (H) (0.55, 0.60, 0.65) (0.50, 0.60, 0.70) |
(H) (0.55, 0.60, 0.65) (0.50, 0.60, 0.70) |
| f2 | (0.00, 0.00, 0.00) | (0.00, 0.00, 0.00) | (0.00, 0.00, 0.00) |
| f3 | (0.00, 0.00, 0.00) | (0.00, 0.00, 0.00) | (0.00, 0.00, 0.00) |
| f4 | (0.00, 0.00, 0.00) | (0.00, 0.00, 0.00) | (0.00, 0.00, 0.00) |
| f5 | (0.00, 0.00, 0.00) | (0.00, 0.00, 0.00) | (0.00, 0.00, 0.00) |
| f6 | (0.00, 0.00, 0.00) | (0.00, 0.00, 0.00) | (0.00, 0.00, 0.00) |
| f4 | f5 | f6 | |
| f1 | (0.00, 0.00, 0.00) | (H) (0.55, 0.60, 0.65) (0.30, 0.40, 0.50) |
(VH) (0.75, 0.80, 0.85) (0.70, 0.80, 0.90) |
| f2 | (H) (0.55, 0.60, 0.65) (0.50, 0.60, 0.70) |
(0.00, 0.00, 0.00) | (H) (0.55, 0.60, 0.65) (0.50, 0.60, 0.70) |
| f3 | (H) (0.55, 0.60, 0.65) (0.50, 0.60, 0.70) |
(0.00, 0.00, 0.00) | (H) (0.55, 0.60, 0.65) (0.50, 0.60, 0.70) |
| f4 | (0.00, 0.00, 0.00) | (0.00, 0.00, 0.00) | (0.00, 0.00, 0.00) |
| f5 | (0.00, 0.00, 0.00) | (0.00, 0.00, 0.00) | (0.00, 0.00, 0.00) |
| f6 | (0.00, 0.00, 0.00) | (0.00, 0.00, 0.00) | (0.00, 0.00, 0.00) |
Table 7.
Fuzzy aggregate estimates of direct influences .
| f1 | f2 | f3 | |
|---|---|---|---|
| f1 | (0.000,0.000,0.000) | (0.480,0.531,0.580) (0431,0.531,0.629) |
(0.405,0.456,0.505) (0.384,0.456,0.555) |
| f2 | (0.000,0.000,0.000) | (0.000,0.000,0.000) | (0.000,0.000,0.000) |
| f3 | (0.000,0.000,0.000) | (0.000,0.000,0.000) | (0.000,0.000,0.000) |
| f4 | (0.000,0.000,0.000) | (0.000,0.000,0.000) | (0.000,0.000,0.000) |
| f5 | (0.000,0.000,0.000) | (0.000,0.000,0.000) | (0.000,0.000,0.000) |
| f6 | (0.000,0.000,0.000) | (0.000,0.000,0.000) | (0.000,0.000,0.000) |
| f4 | f5 | f6 | |
| f1 | (0.000,0.000,0.000) | (0.480,0.531,0.580) (0.431,0.531,0.629) |
(0.606,0.655,0.706) (0.555,0.655,0.755) |
| f2 | (0.480,0.531,0.580) (0.431,0.531,0.629) |
(0.000,0.000,0.000) | (0.480,0.531,0.580) (0.431,0.531,0.629) |
| f3 | (0.405,0.456,0.505) (0.384,0.456,0.555) |
(0.000,0.000,0.000) | (0.405,0.456,0.505) (0.384,0.456,0.555) |
| f4 | (0.000,0.000,0.000) | (0.000,0.000,0.000) | (0.000,0.000,0.000) |
| f5 | (0.000,0.000,0.000) | (0.000,0.000,0.000) | (0.000,0.000,0.000) |
| f6 | (0.000,0.000,0.000) | (0.000,0.000,0.000) | (0.000,0.000,0.000) |
| 0.629 | 0.629 | 0.755 |
Table 8.
Normalized fuzzy estimates of direct influences .
| f1 | f2 | f3 | |
|---|---|---|---|
| f1 | (0.000,0.000,0.000) | (0.763,0.844,0.920) (0.685,0.844,1.000) |
(0.730,0.822,0.910) (0.692,0.822,1.000) |
| f2 | (0.000,0.000,0.000) | (0.000,0.000,0.000) | (0.000,0.000,0.000) |
| f3 | (0.000,0.000,0.000) | (0.000,0.000,0.000) | (0.000,0.000,0.000) |
| f4 | (0.000,0.000,0.000) | (0.000,0.000,0.000) | (0.000,0.000,0.000) |
| f5 | (0.000,0.000,0.000) | (0.000,0.000,0.000) | (0.000,0.000,0.000) |
| f6 | (0.000,0.000,0.000) | (0.000,0.000,0.000) | (0.000,0.000,0.000) |
| f4 | f5 | f6 | |
| f1 | (0.000,0.000,0.000) | (0.763,0.844,0.920) (0.685,0.844,1.000) |
(0.803,0.867,0.935) (0.735,0.867,1.000) |
| f2 | (0.763,0.844,0.920) (0.685,0.844,1.000) |
(0.000,0.000,0.000) | (0.636,0.703,0.768) (0.571,0.703,0.832) |
| f3 | (0.644,0.725,0.803) (0.610,0.725,0.882) |
(0.000,0.000,0.000) | (0.636,0.604,0.669) (0.509,0.604,0.735) |
| f4 | (0.000,0.000,0.000) | (0.000,0.000,0.000) | (0.000,0.000,0.000) |
| f5 | (0.000,0.000,0.000) | (0.000,0.000,0.000) | (0.000,0.000,0.000) |
| f6 | (0.000,0.000,0.000) | (0.000,0.000,0.000) | (0.000,0.000,0.000) |
Table 9.
Fuzzy estimates of common influences .
| f1 | f2 | f3 | |
|---|---|---|---|
| f1 | (0.000,0.000,0.000) | (0.763,0.844,0.920) (0.685,0.844,1.000) |
(0.730,0.822,0.910) (0.692,0.822,1.000) |
| f2 | (0.000,0.000,0.000) | (0.000,0.000,0.000) | (0.000,0.000,0.000) |
| f3 | (0.000,0.000,0.000) | (0.000,0.000,0.000) | (0.000,0.000,0.000) |
| f4 | (0.000,0.000,0.000) | (0.000,0.000,0.000) | (0.000,0.000,0.000) |
| f5 | (0.000,0.000,0.000) | (0.000,0.000,0.000) | (0.000,0.000,0.000) |
| f6 | (0.000,0.000,0.000) | (0.000,0.000,0.000) | (0.000,0.000,0.000) |
| f4 | f5 | f6 | |
| f1 | (1.052,1.350,1.577) (0.891,1.350,1.882) |
(0.763,0.844,0.920) (0.685,0.844,1.000) |
(1.679,1.985,2.250) (1.478,1.985,2.567) |
| f2 | (0.763,0.844,0.920) (0.685,0.844,1.000) |
(0.000,0.000,0.000) | (0.636,0.703,0.768) (0.571,0.703,0.832) |
| f3 | (0.644,0.725,0.803) (0.610,0.725,0.882) |
(0.000,0.000,0.000) | (0.636,0.604,0.669) (0.509,0.604,0.735) |
| f4 | (0.000,0.000,0.000) | (0.000,0.000,0.000) | (0.000,0.000,0.000) |
| f5 | (0.000,0.000,0.000) | (0.000,0.000,0.000) | (0.000,0.000,0.000) |
| f6 | (0.000,0.000,0.000) | (0.000,0.000,0.000) | (0.000,0.000,0.000) |
Table 10.
Defuzzified values of vectors , and values of vectors , .
| r1 | r2 | r3 | r4 | r5 | r6 | |
| 5.877 | 1.546 | 1.342 | 0.000 | 0.000 | 0.000 | |
| C | c1 | c2 | c3 | c4 | c5 | c6 |
| 0.000 | 0.870 | 0.826 | 2.847 | 0.870 | 3.330 | |
| 5.877 | 2.436 | 2.168 | 2.847 | 0.870 | 3.330 | |
| 5.877 | 0.676 | 0.516 | -2.847 | -0.870 | -3.300 |
Disclaimer/Publisher’s Note: The statements, opinions and data contained in all publications are solely those of the individual author(s) and contributor(s) and not of MDPI and/or the editor(s). MDPI and/or the editor(s) disclaim responsibility for any injury to people or property resulting from any ideas, methods, instructions or products referred to in the content. |
© 2025 by the authors. Licensee MDPI, Basel, Switzerland. This article is an open access article distributed under the terms and conditions of the Creative Commons Attribution (CC BY) license (http://creativecommons.org/licenses/by/4.0/).
Copyright: This open access article is published under a Creative Commons CC BY 4.0 license, which permit the free download, distribution, and reuse, provided that the author and preprint are cited in any reuse.


