Loading [MathJax]/jax/output/HTML-CSS/fonts/Gyre-Pagella/Main/Regular/Main.js
Preprint
Article

Genetic Diversity and Performance of Durum Wheat (Triticum turgidum L. ssp. Durum Desf.) Germplasm Based on Agro-Morphological and Quality Traits: Experimentation and Statistical Analysis

Submitted:

24 February 2025

Posted:

25 February 2025

You are already at the latest version

Abstract

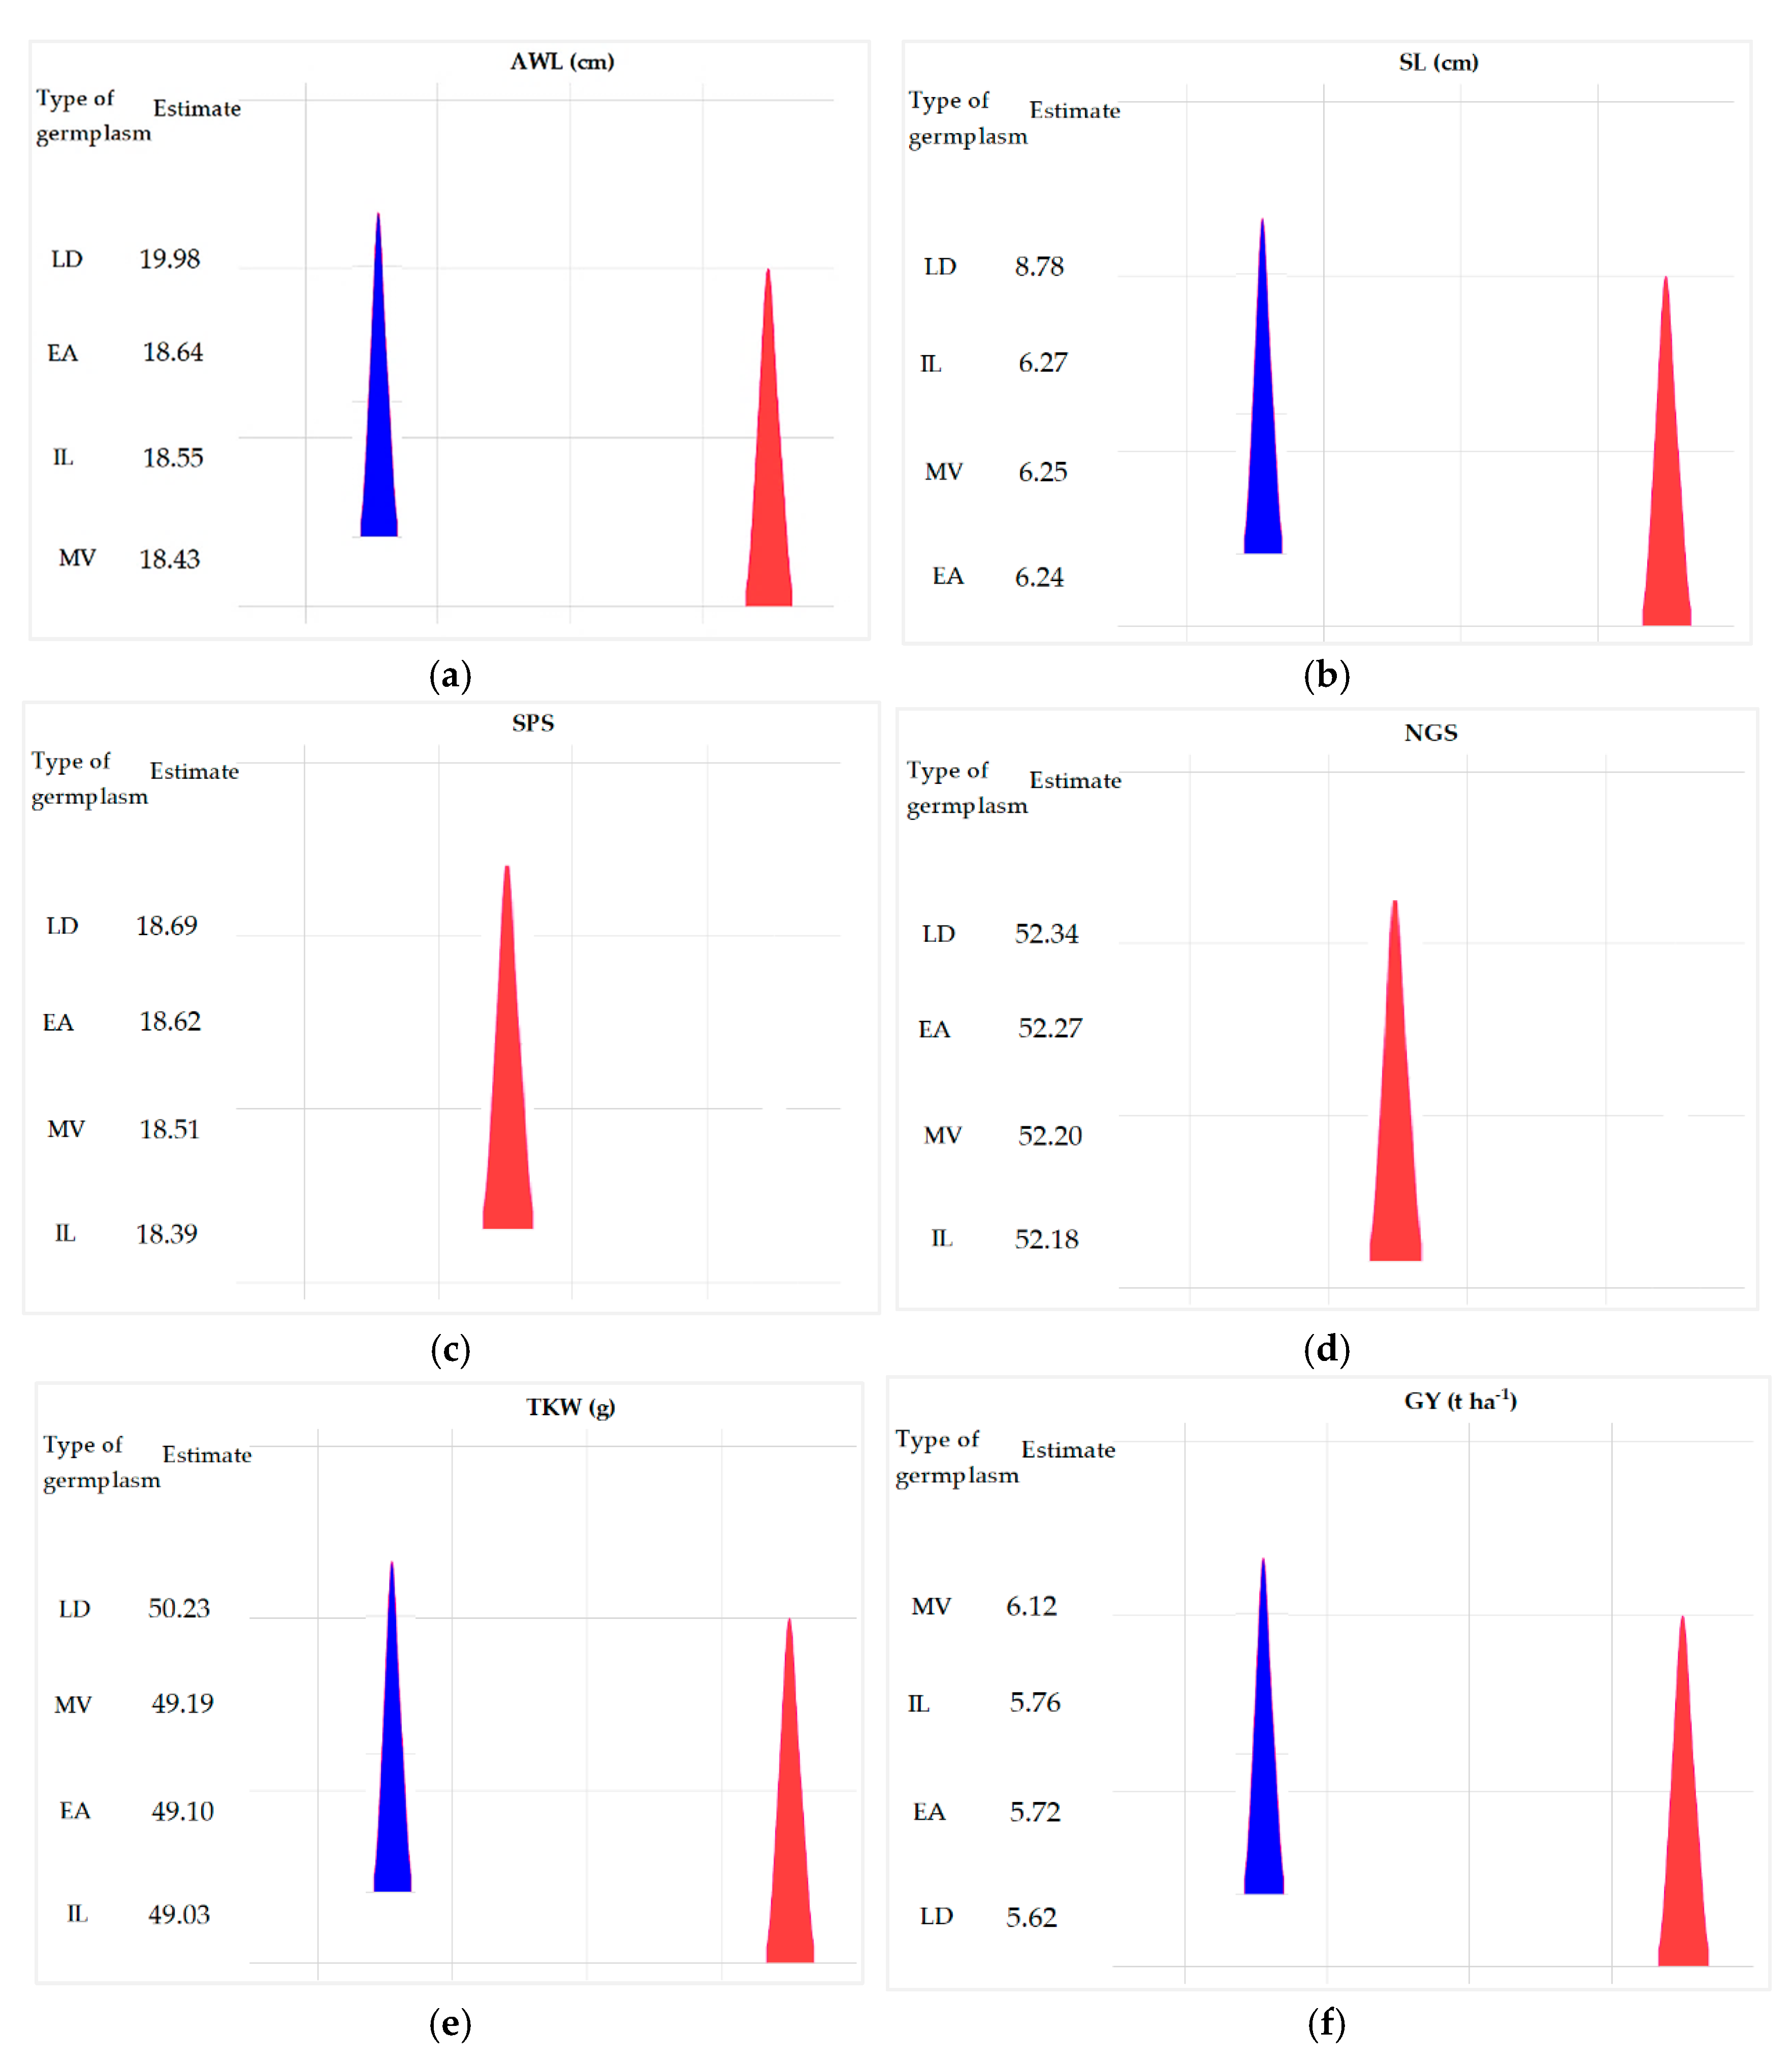
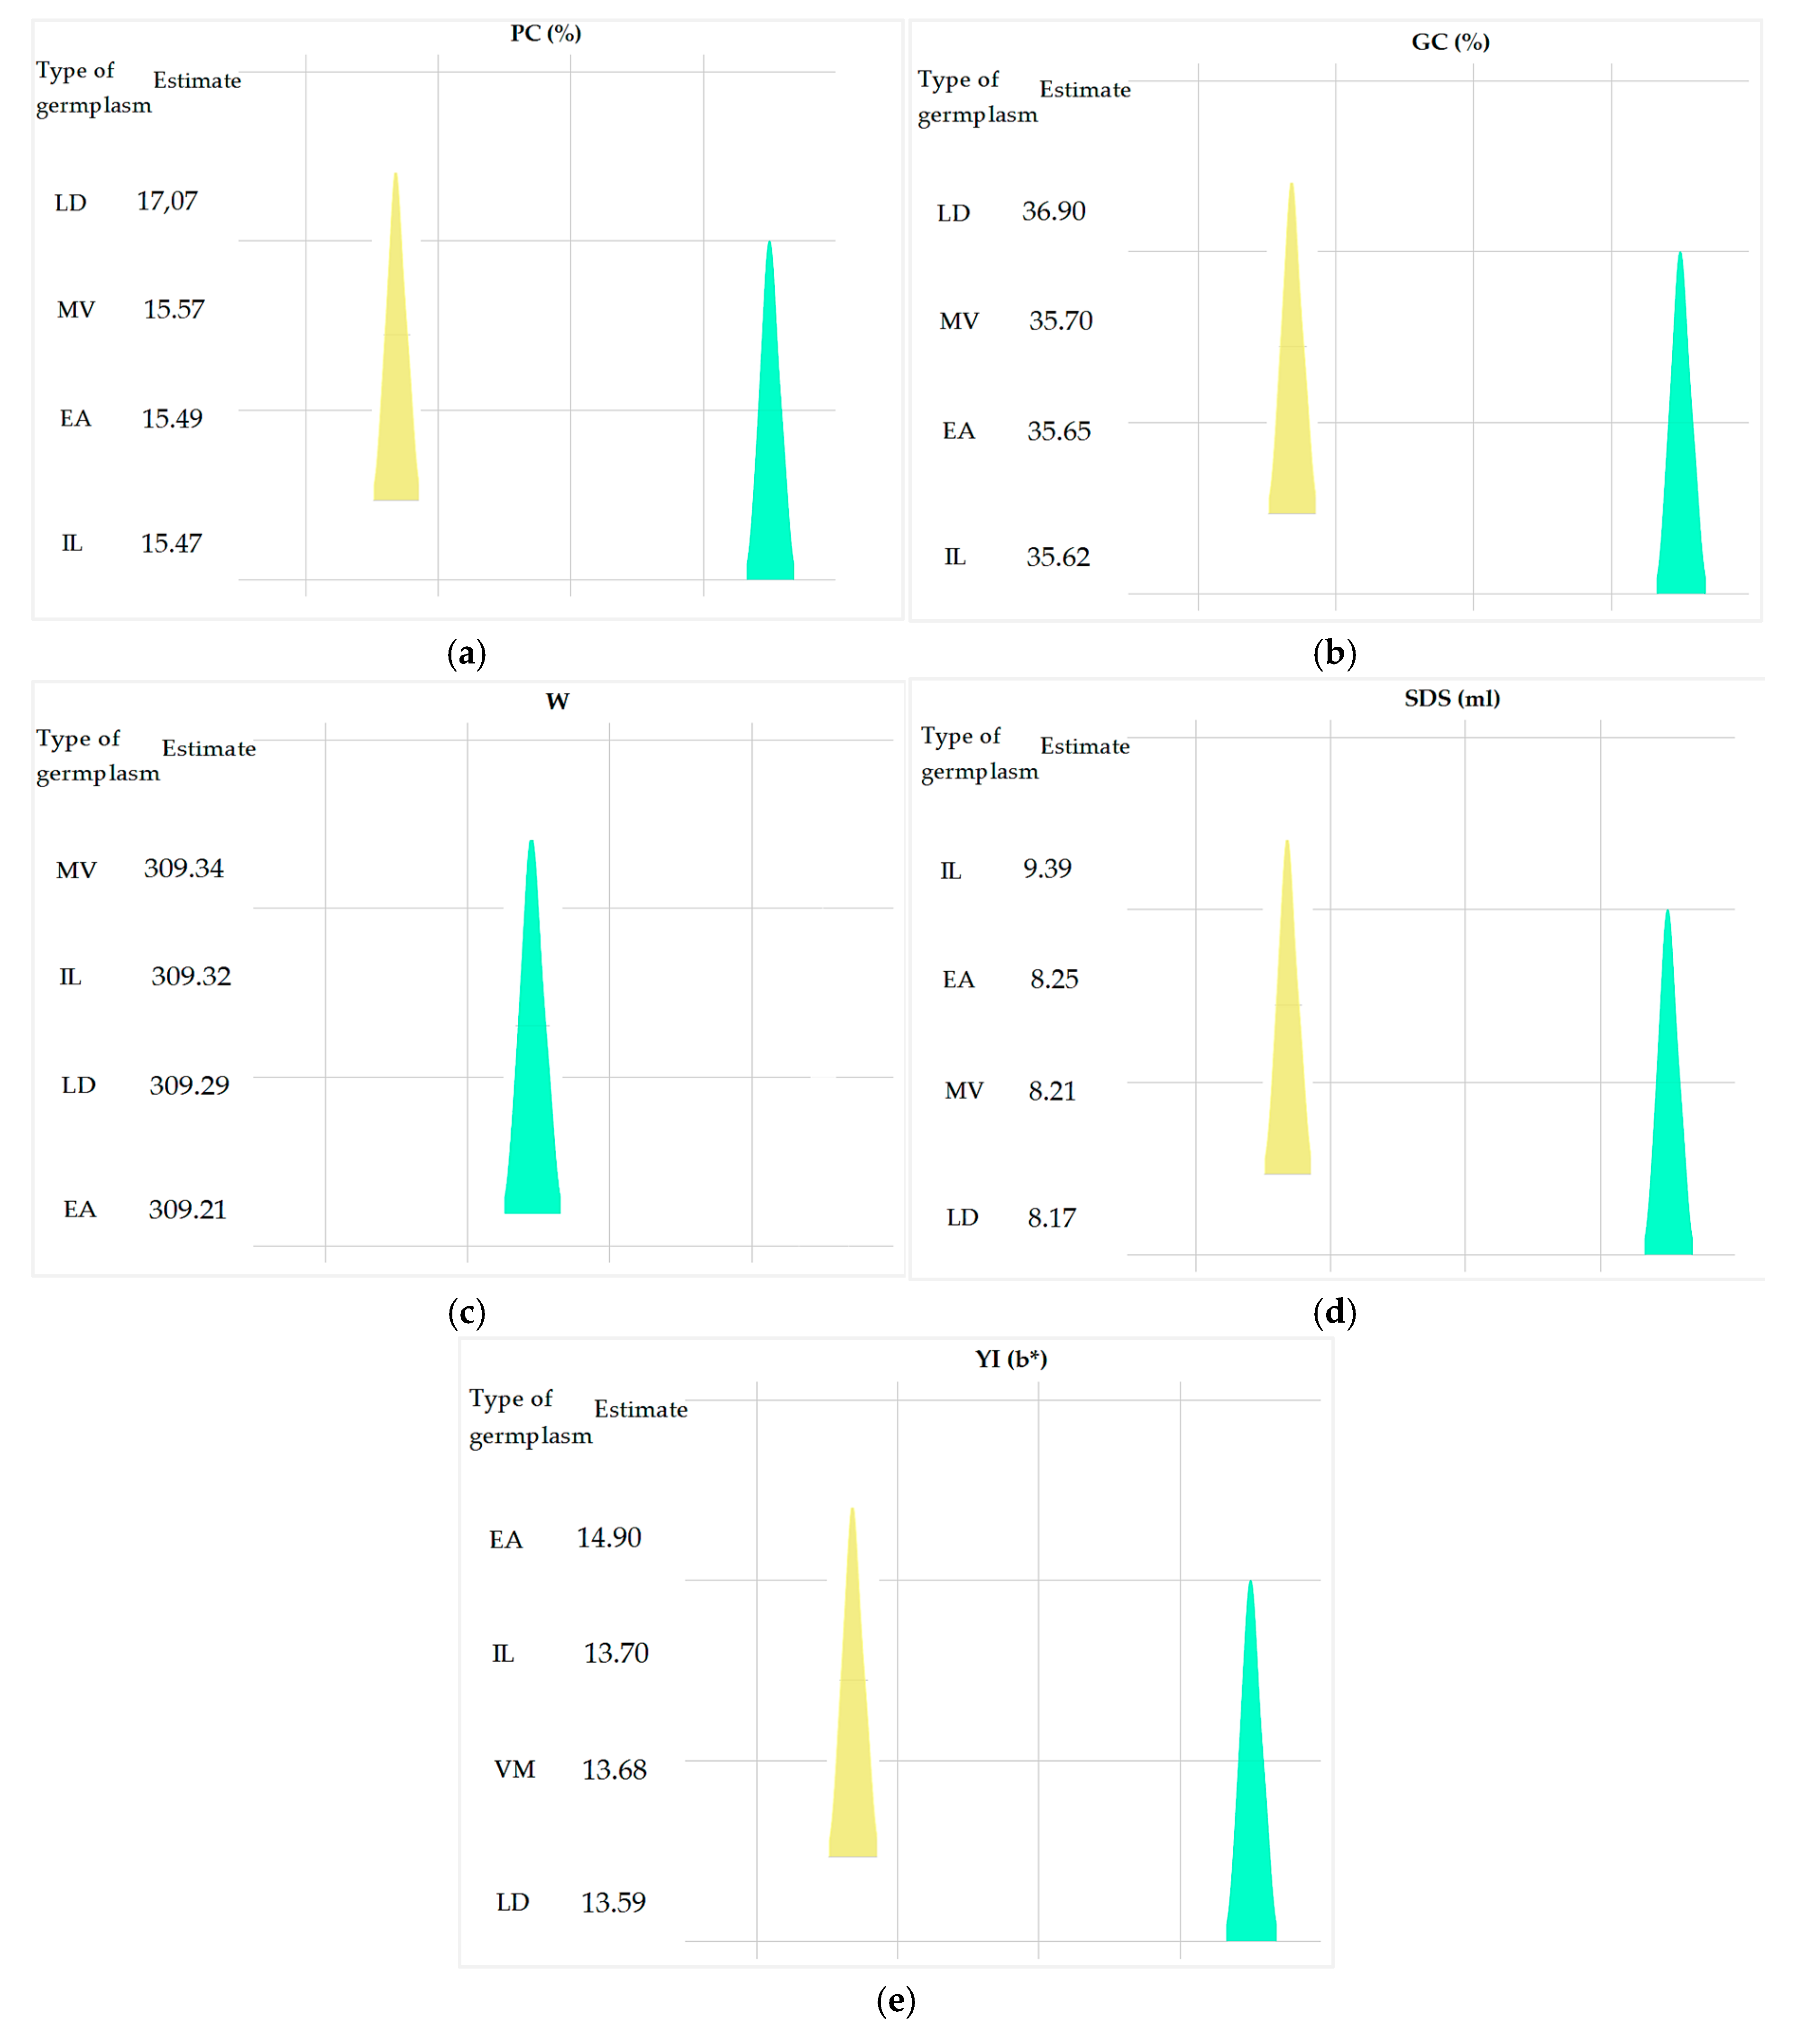
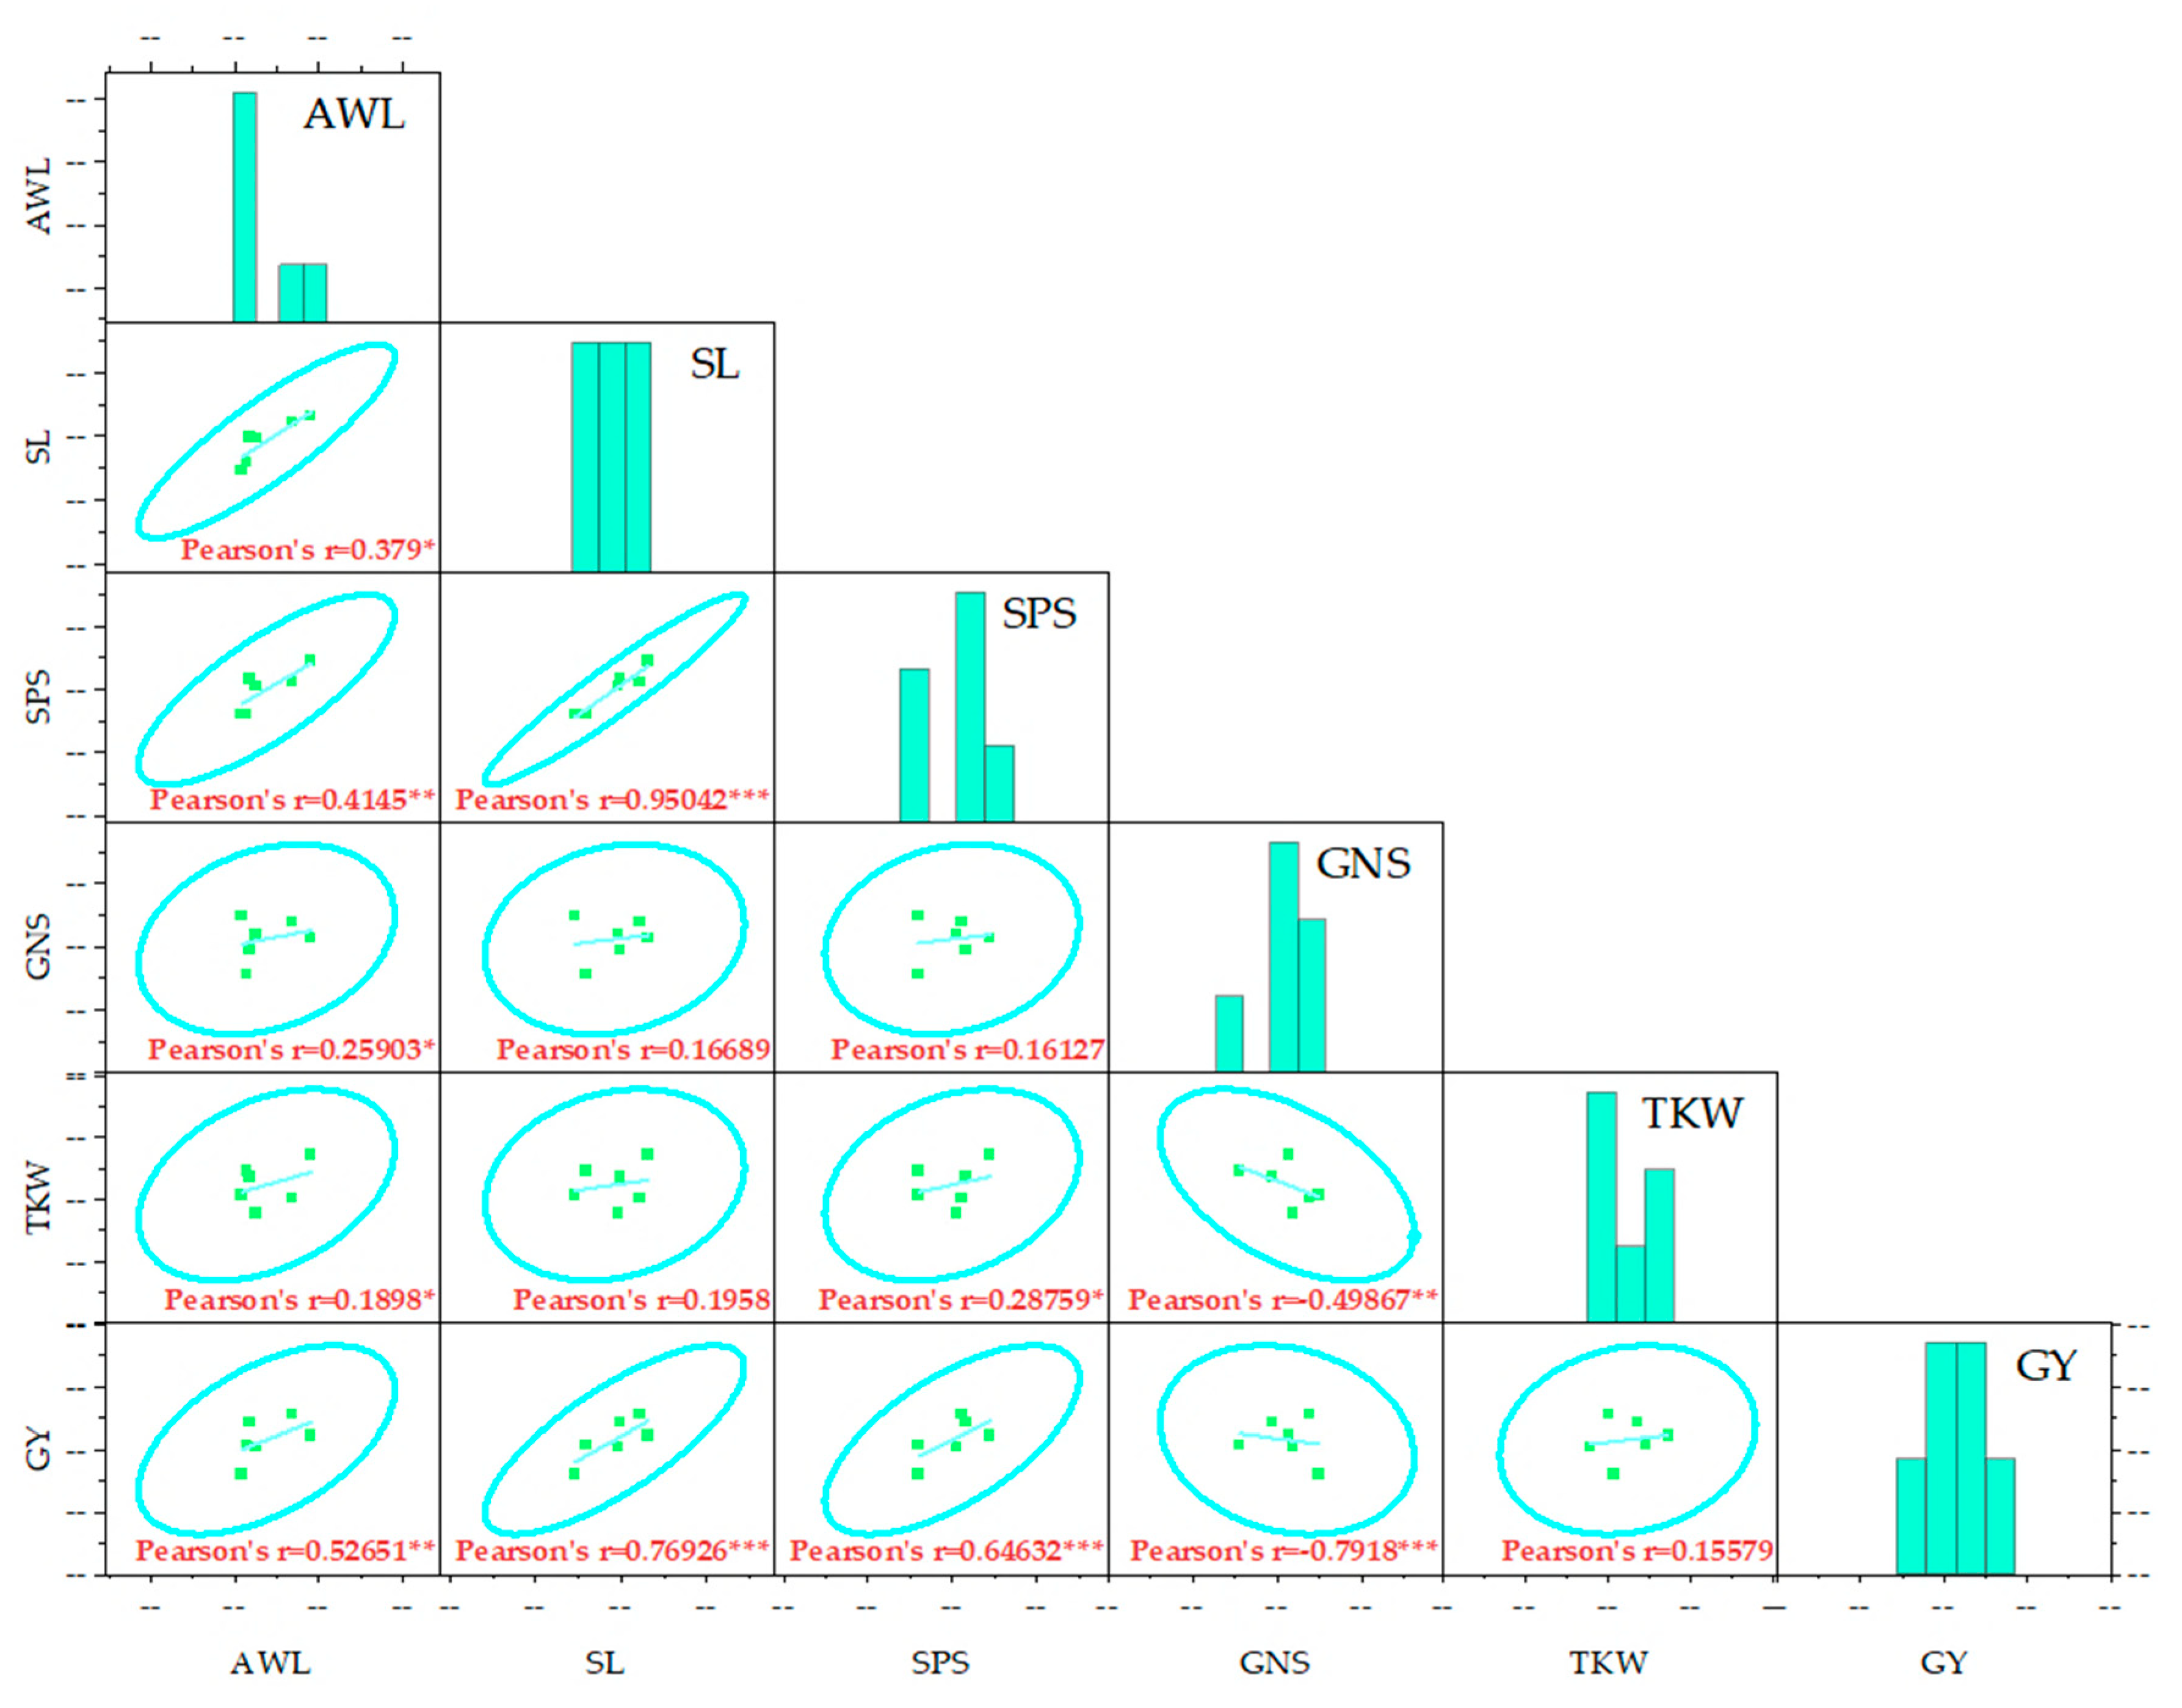
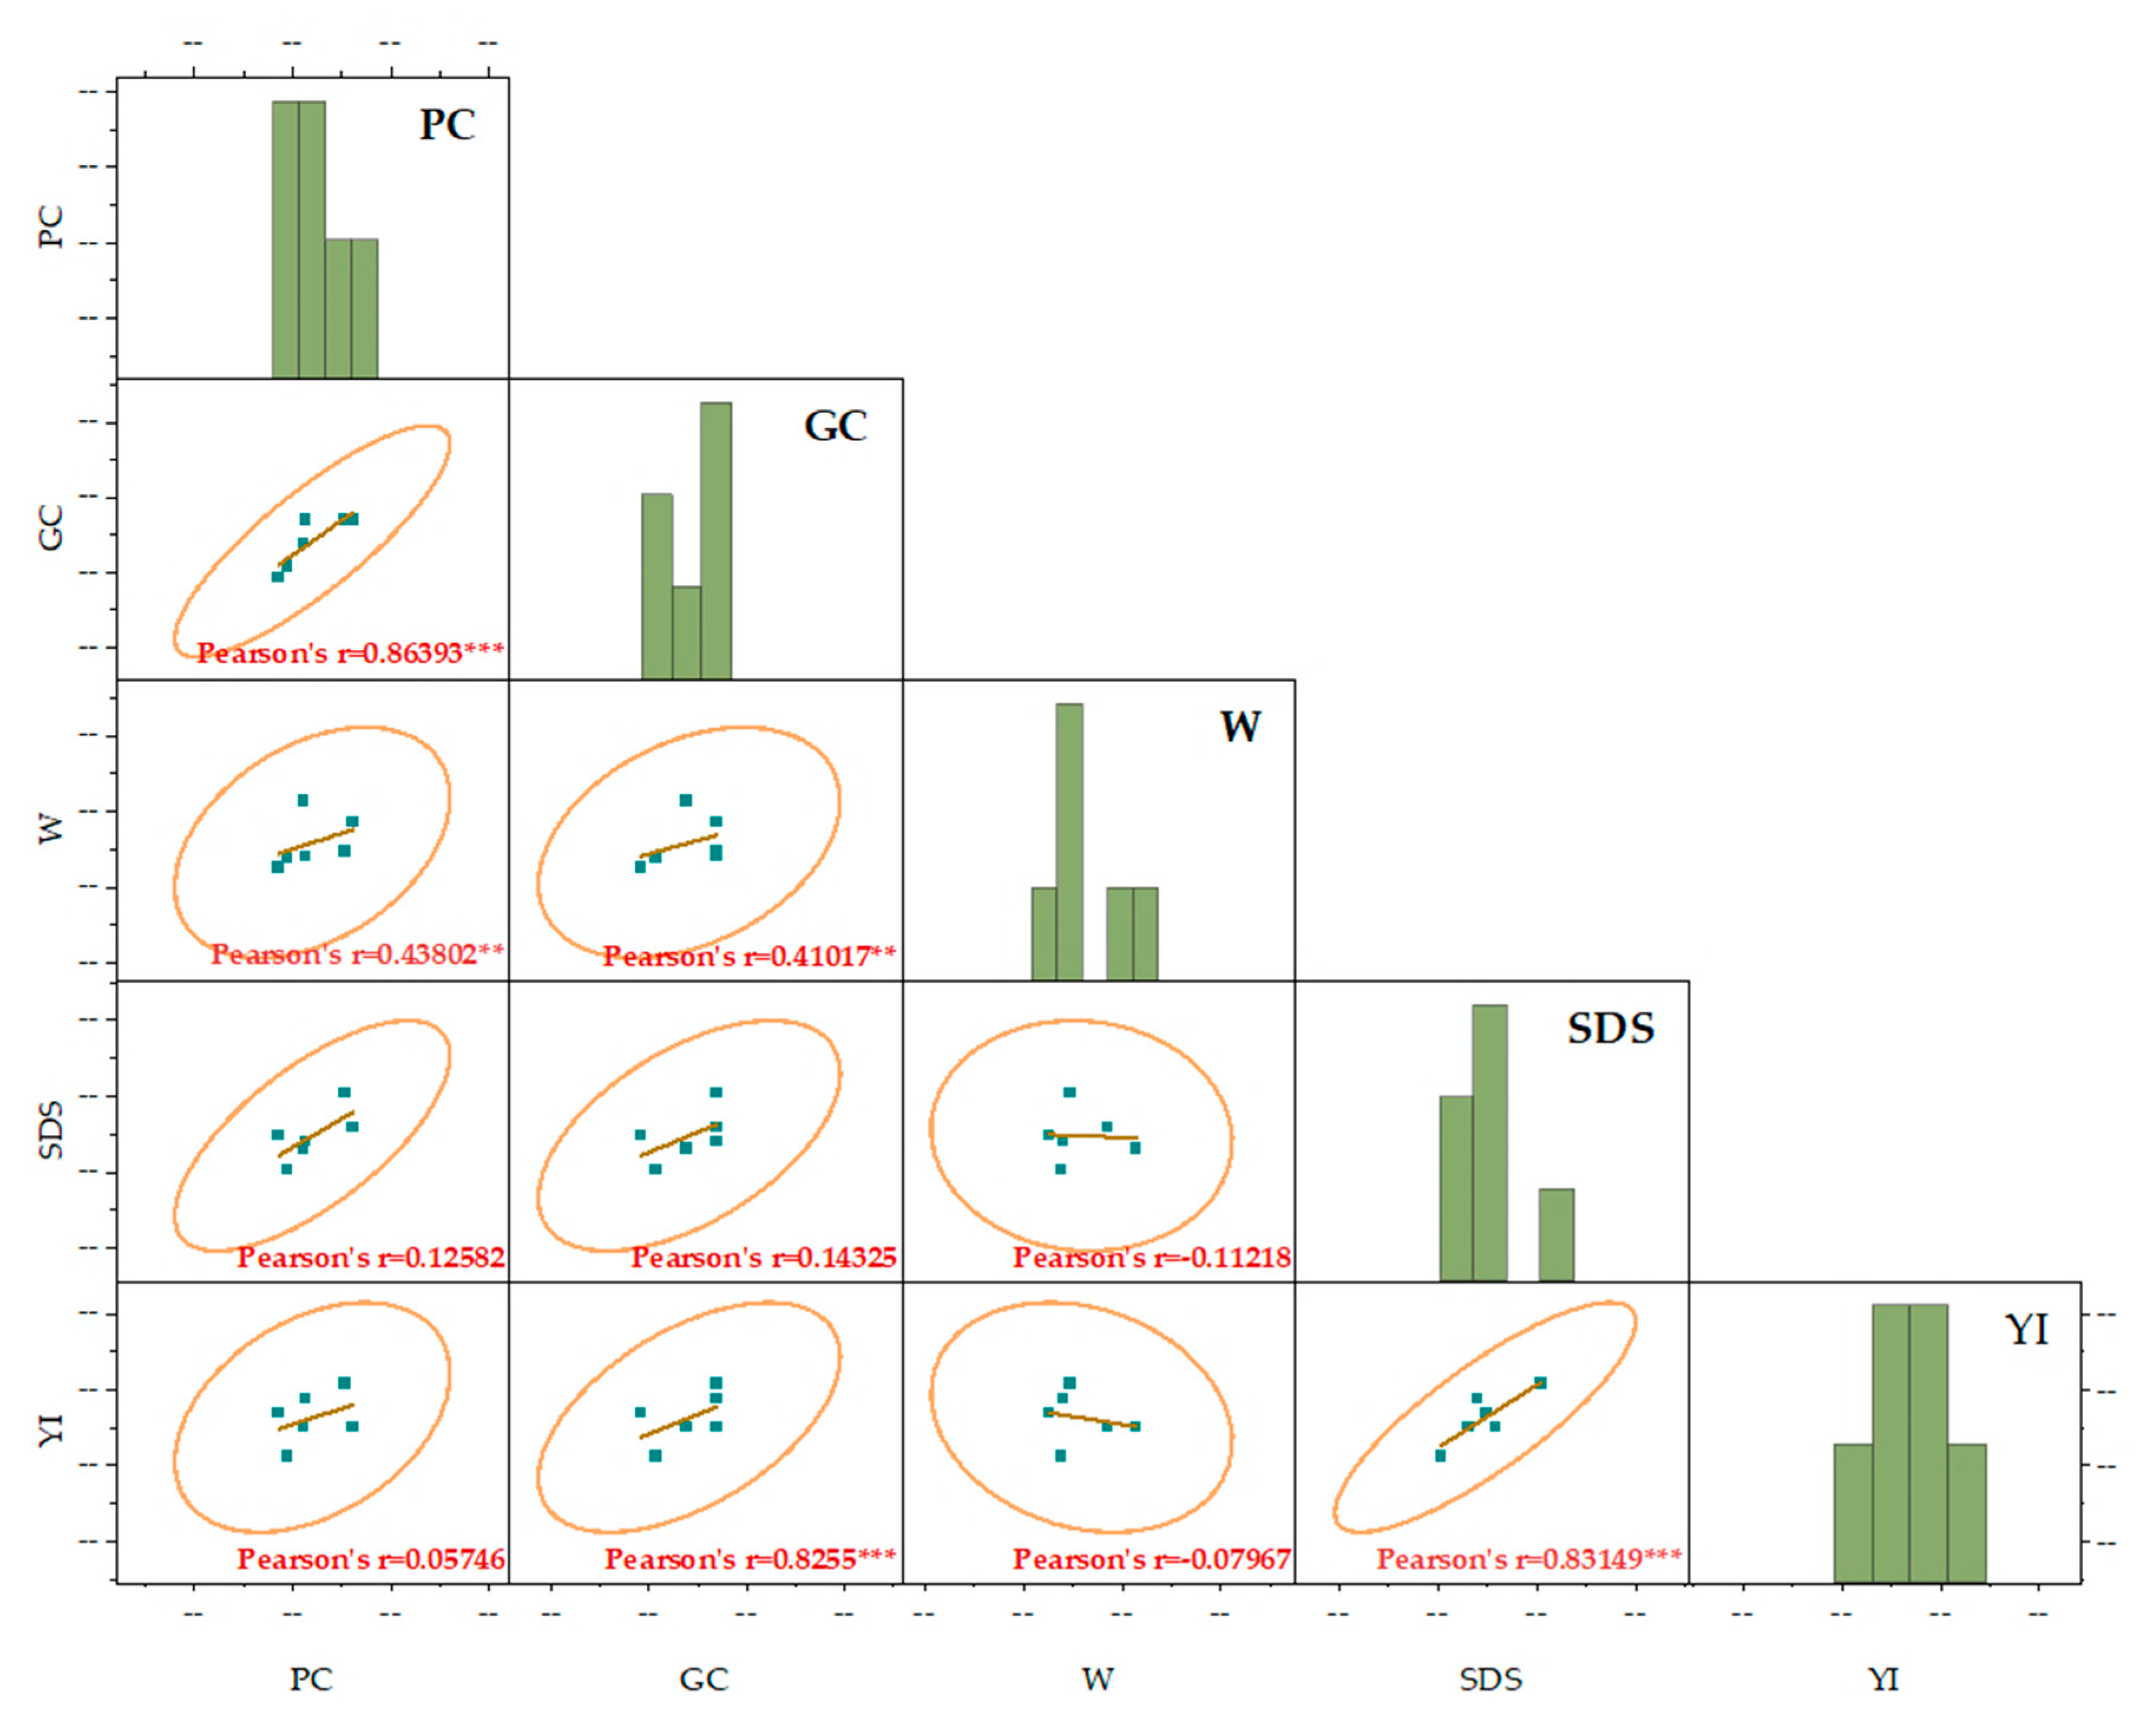
The productivity and resilience of durum wheat have been enhanced through the selection of accessions, optimizing agronomic and quality traits to address environmental challenges. This study investigates the inter-group genetic diversity of 219 durum wheat accessions, including 120 elite lines from a national breeding program, 63 international lines, 27 Moroccan varieties, and 9 landraces. Trials were conducted at the Jemâa Shaïm experimental station (INRA-Morocco) with an "Alpha lattice" design and two replications. Significant correlations were observed between spike length and number of spikelets (r = 0.950; p < 0.001), and between gluten and protein content (r = 0.863; p < 0.001). Principal component analysis (PCA) revealed that agro-morphological traits explained 77.12% of variability, while quality traits accounted for 95.54%. Elite lines showed a high yellow pigment index (14.90), important for wheat technological quality. Traditional landraces performed well in spike length (8.78 cm), thousand-grain weight (50.23 g), protein content (17.07%), and gluten content (36.90%). Moroccan varieties achieved a grain yield of 6.12 t/ha. International lines exhibited the highest SDS value (9.39 ml), indicating superior technological quality. These findings emphasize the importance of landraces, Moroccan varieties, and elite accessions for developing high-quality, high-yielding durum wheat varieties adaptable to challenging conditions, contributing significantly to productivity and sustainability.

Keywords: 
;  ;  ;  ;  ;  ;  ;  

1. Introduction

Agriculture plays a crucial role in improving food availability and achieving global food security [1,2,3]. Despite this, while there is widespread acknowledgment of the increasing global demand for food in the coming decades, uncertainties remain regarding the capacity of global agriculture to meet this demand through expanded food supply [4]. Enhancing food provision by increasing agricultural productivity and expanding the use of agricultural land seems to be a viable approach to addressing these challenges [5]. However, in developing countries with low incomes, the available technologies and knowledge may not be adequate to meet future food production needs [6,7]. Nevertheless,, this essential activity faces multiple challenges, including climate change-induced soil salinity, land degradation, and the depletion of water resources, all of which negatively impact crop yields and quality [8,9]. Among these challenges, water scarcity and recurrent droughts represent major threats, significantly limiting agricultural productivity, particularly in arid and semi-arid regions where water availability is a critical constraint to crop growth and yield [4]. These factors are especially concerning in areas like Jemaa Shaïm, where agriculture is a key economic and social activity.
Durum wheat (Triticum durum Desf., 2n = 4x = 28, AABB) is the cultivated form of T. turgidum, an allotetraploid species that is believed to have originated approximately five hundred thousand years ago [10,11,12]. In this context, durum wheat plays a strategic role as the main cereal crop cultivated in Mediterranean regions [13,14]. Although its global production accounts for less than 5% of total wheat production, it holds significant socio-economic importance in regions such as North Africa, the Middle East, and the Mediterranean basin, where it is both a crucial source of income for farmers and a staple food for millions of people [15,16]. In Morocco, this crop is particularly important due to its relative adaptability to harsh climatic conditions and its high economic value. However, abiotic constraints such as drought and salinity are increasingly threatening yields and grain quality, exacerbated by the effects of climate change [17,18,19,20].
The selection of high-yielding durum wheat germplasm should not rely solely on grain yield as a criterion [21,22]. Agro-morphological parameters and quality traits, such as awn length, spike length, grain weight, nutritional quality, and resistance to abiotic stresses, play a crucial role in identifying and improving high-performing varieties, particularly in environments characterized by climatic variability and abiotic constraints. These traits, often more heritable and stable than yield itself, enable more effective indirect selection, helping to overcome challenges associated with the polygenic complexity of grain yield and genotype × environment interactions [23,24]. Integrating these traits into breeding programs promotes a comprehensive approach that optimizes agronomic and qualitative performance while enhancing adaptability to specific agricultural systems.
The genetic diversity of durum wheat constitutes a vital resource for its improvement in the face of abiotic stresses. Local varieties and traditional populations, often underutilized, represent a valuable source of genes conferring increased tolerance to salinity and drought. Moreover, advances in marker-assisted selection and genomics now enable the identification of high-performing genotypes and accelerate the development of cultivars suited to semi-arid conditions. These tools also facilitate the selection of agro-morphological and quality traits, such as protein and gluten quality, which are essential for the food industry [25,26].
International collaborations, notably with CIMMYT (International Maize and Wheat Improvement Center) and ICARDA (International Center for Agricultural Research in the Dry Areas), have played a key role in introducing improved lines and providing access to diversified germplasm combining resilience and yield under abiotic stress conditions [27,28,29]. These strategic partnerships have facilitated the selection of durum wheat varieties adapted to local and regional conditions in Morocco, offering practical solutions to enhance sustainable agricultural production in semi-arid zones. Several Moroccan durum wheat varieties have been registered in the national catalog, ensuring their availability to local farmers while promoting continued yield improvements in the country. These varieties are selected not only for their adaptation to Morocco’s specific environmental conditions but also for their ability to maintain high grain quality, essential for the semolina and pasta industries [30,31]. The selection initiatives carried out by ICARDA in durum wheat aimed to develop genotypes capable of facing environmental challenges, particularly by optimizing grain and biomass yields, while ensuring stability under saline stress conditions. The breeding programs integrated both local varieties and derived pure lines to transfer salt tolerance traits into an already well-adapted germplasm. The characterization of landraces involved isolating individual lines from the mixtures grown locally. Seeds from the most performance lines were then multiplied and disseminated as new varieties, improving agronomic traits and resilience in challenging environments. [32,33,34].
Despite these advances, the genetic diversity of durum wheat remains insufficiently explored in certain regions, representing significant potential for discovering new germplasm suited to the constrained environments of semi-arid areas [35,36,37,38]. A better understanding of this diversity would effectively guide breeding programs to address the growing challenges of food security and agricultural sustainability.
This study aims to characterize the intra-class variability of agro-morphological and quality traits within a large collection of durum wheat, including elite accessions, international lines, Moroccan varieties, and foreign varieties. It also focuses on analyzing the genetic diversity of physico-chemical parameters that influence semolina and pasta quality. Con ducted at the Jemâa Shaim experimental site, the research seeks to identify the highest-performing germplasm in terms of both yield and quality, ultimately contributing to the development of resilient varieties and sustainable agricultural practices in semi-arid regions. To achieve these objectives, the study will: (1) analyze the genetic diversity of agro-morphological traits among groups within the durum wheat collection, (2) evaluate the genetic variation in physico-chemical characteristics affecting semolina and pasta quality across groups, (3) identify the most promising germplasm based on agro-morphological and quality traits, (4) apply multivariate statistical analyses, including ANOVA, Duncan test, correlation, and PCA, to distinguish and classify the top-performing groups for each parameter, and (5) provide recommendations to promote the adoption of high-performing germplasm and sustainable agricultural practices to enhance durum wheat productivity in semi-arid regions.

2. Results

2.1. Analysis of Variance

The results of the agro-morphological analysis of the different durum wheat germplasm types, presented in Table 1, reveal varying differences between the groups for the studied parameters. The analysis of variance (ANOVA) showed significant differences for certain traits, such as spike length (SL), thousand-kernel weight (TKW), and grain yield (GY), while other parameters, such as awn length (AWL), number of spikes per ear (SPS), and number of grains per spike (GNS), showed no notable differences. The comparison of means, conducted using Duncan’s test, highlights distinct trends between the groups, particularly for spike length, thousand-kernel weight, and grain yield, as illustrated in Figure 1.
The ANOVA revealed a significant difference in awn length (AWL) (P < 0.05*), with Duncan’s test indicating that the landraces, which exhibited the highest values (19.98 cm), formed a distinct class, whereas the other groups belonged to the same statistical category.
For spike length (SL), a significant difference was also observed (P < 0.05*), with landraces showing the highest values (8.78 cm), while the other groups did not differ significantly. Similarly, for thousand-grain weight (TKW), ANOVA detected a highly significant difference (P < 0.01), with this group achieving the highest value (50.23 g), while the remaining groups displayed comparable performances.
Regarding grain yield (GY), a significant difference was found (P < 0.05*), with Duncan’s test identifying Moroccan varieties as the most productive, reaching 6.12 t ha⁻¹, while no significant differences were noted among the other groups. Conversely, for the number of spikes per spike (SPS) and the number of grains per spike (GNS), no significant differences were detected (P > 0.05 ns), indicating homogeneity across all groups for these parameters.

2.2. ANOVA of Quality Parameters

According to the results of the analysis of variance (Table 2), the quality parameters show variability ranging from low to moderate among the four types of germplasms studied. Furthermore, the comparisons made using Duncan’s test are shown in Figure 2.
The ANOVA showed highly significant differences for protein content (PC) (P < 0.01*) and gluten content (GC) (P < 0.01*). Duncan’s test revealed that landraces exhibited the highest PC (17.07%), significantly surpassing all other groups, including Moroccan varieties, international lines, and elite accessions, which were grouped together in the same class. Similarly, landraces had the highest GC (36.90%), significantly outperforming the other germplasms, which showed similar values. For gluten strength (W), ANOVA indicated no significant differences (P > 0.05 ns), confirming homogeneity across all groups. However, for the sedimentation index (SDS), a significant difference was observed (P < 0.05*), with Duncan’s test showing that international lines had the highest SDS value (9.39 mL). Regarding the yellow index (YI), ANOVA revealed significant differences (P < 0.01), with Duncan’s test indicating that elite accessions had the highest yellow pigment index (14.90), significantly exceeding the other germplasms.

2.3. Relationships Between the Evaluated Parameters

2.3.1. Correlation Analysis of Various Agro-Morphological Parameters

A Pearson correlation matrix was constructed using the actual values of the selected agro-morphological parameters for statistical analysis, as shown in Figure 3. These parameters include awn length (AWL), spike length (SL), number of spikelets per spike (SPS), thousand grain weight (TGW), and grain yield (GY).
The correlation coefficient quantifies the degree of association or common variation between two descriptors. Correlation coefficients (r) close to +1 or −1 indicate strong correlations, while an r close to zero suggests a weak or nonexistent correlation. The sign of the coefficient indicates the type of association: negative (-) if the relationship is inverse and positive (+) if the relationship is direct. In general, correlations with r values greater than 0.5 are considered moderate to strong, while those between 0.2 and 0.5 are considered weak.
The correlation analysis between the main agro-morphological parameters and grain yield (GY) revealed varied associations among these traits (Figure 3). Worthy of note is the very highly significant positive correlation of GY with spike length (SL) (r = 0.76 ***; p < 0.001). GY also showed a highly significant positive correlation with awn length (AWL) (r = 0.526 **; p < 0.01). Another important result concerns the highly significant positive correlation between GY and the number of glumes per spike (SPS) (r = 0.646 ***; p < 0.001). However, no significant correlation was observed between GY and thousand kernel weight (TKW) (r = 0.155 ns; p > 0.05). The data regarding the SL measurements showed a very highly significant positive correlation with SPS (r = 0.950 ***; p < 0.001). Similarly, the data regarding AWL showed a significantly positive correlation with SPS (r = 0.414**; p < 0.01). The data regarding the grain number per spike (GNS) showed no significant correlation with SPS (r = 0.161 ns; p > 0.05) or with SL (r = 0.166 ns; p > 0.05). Worthy of note is the significantly negative correlation between TKW and GNS (r = -0.498 **; p < 0.01), further reinforced by the strong negative correlation between GY and GNS (r = -0.791; ***p < 0.001).

2.3.2. Correlation Analysis of Various Quality Parameters

From a technological quality perspective, the correlation analysis between the various parameters revealed several noteworthy relationships (Figure 4). Gluten content (GC) displayed a highly significant positive correlation with protein content (PC), with a correlation coefficient of (r=0.863***; p< 0.001), highlighting a strong association between these two parameters. The latter also showed a significant positive correlation with bread-making strength (W), as indicated by (r=0.410**; p< 0.01). Similarly, PC demonstrated a significant positive association with W, with (r=0.438**; p < 0.01), emphasizing the interdependence of these technological quality traits. However, no significant correlation was observed between PC and gluten strength (SDS) (r=0.125 ns; p> 0.05), nor between SDS and the yellow pigment index (YI) (r=0.143 ns; p> 0.05), suggesting an absence of meaningful associations between these parameters. Likewise, no relationship was found between SDS and W (r=−0.112 ns; p> 0.05) or between YI and W (r=−0.079 ns; p> 0.05).Finally, the analysis revealed highly significant positive correlations between GC and YI (r=0.825*** p<0.001), as well as between SDS and YI (r=0.831***; p< 0.001), indicating that higher GC and SDS are closely associated with increased yellow pigment content.

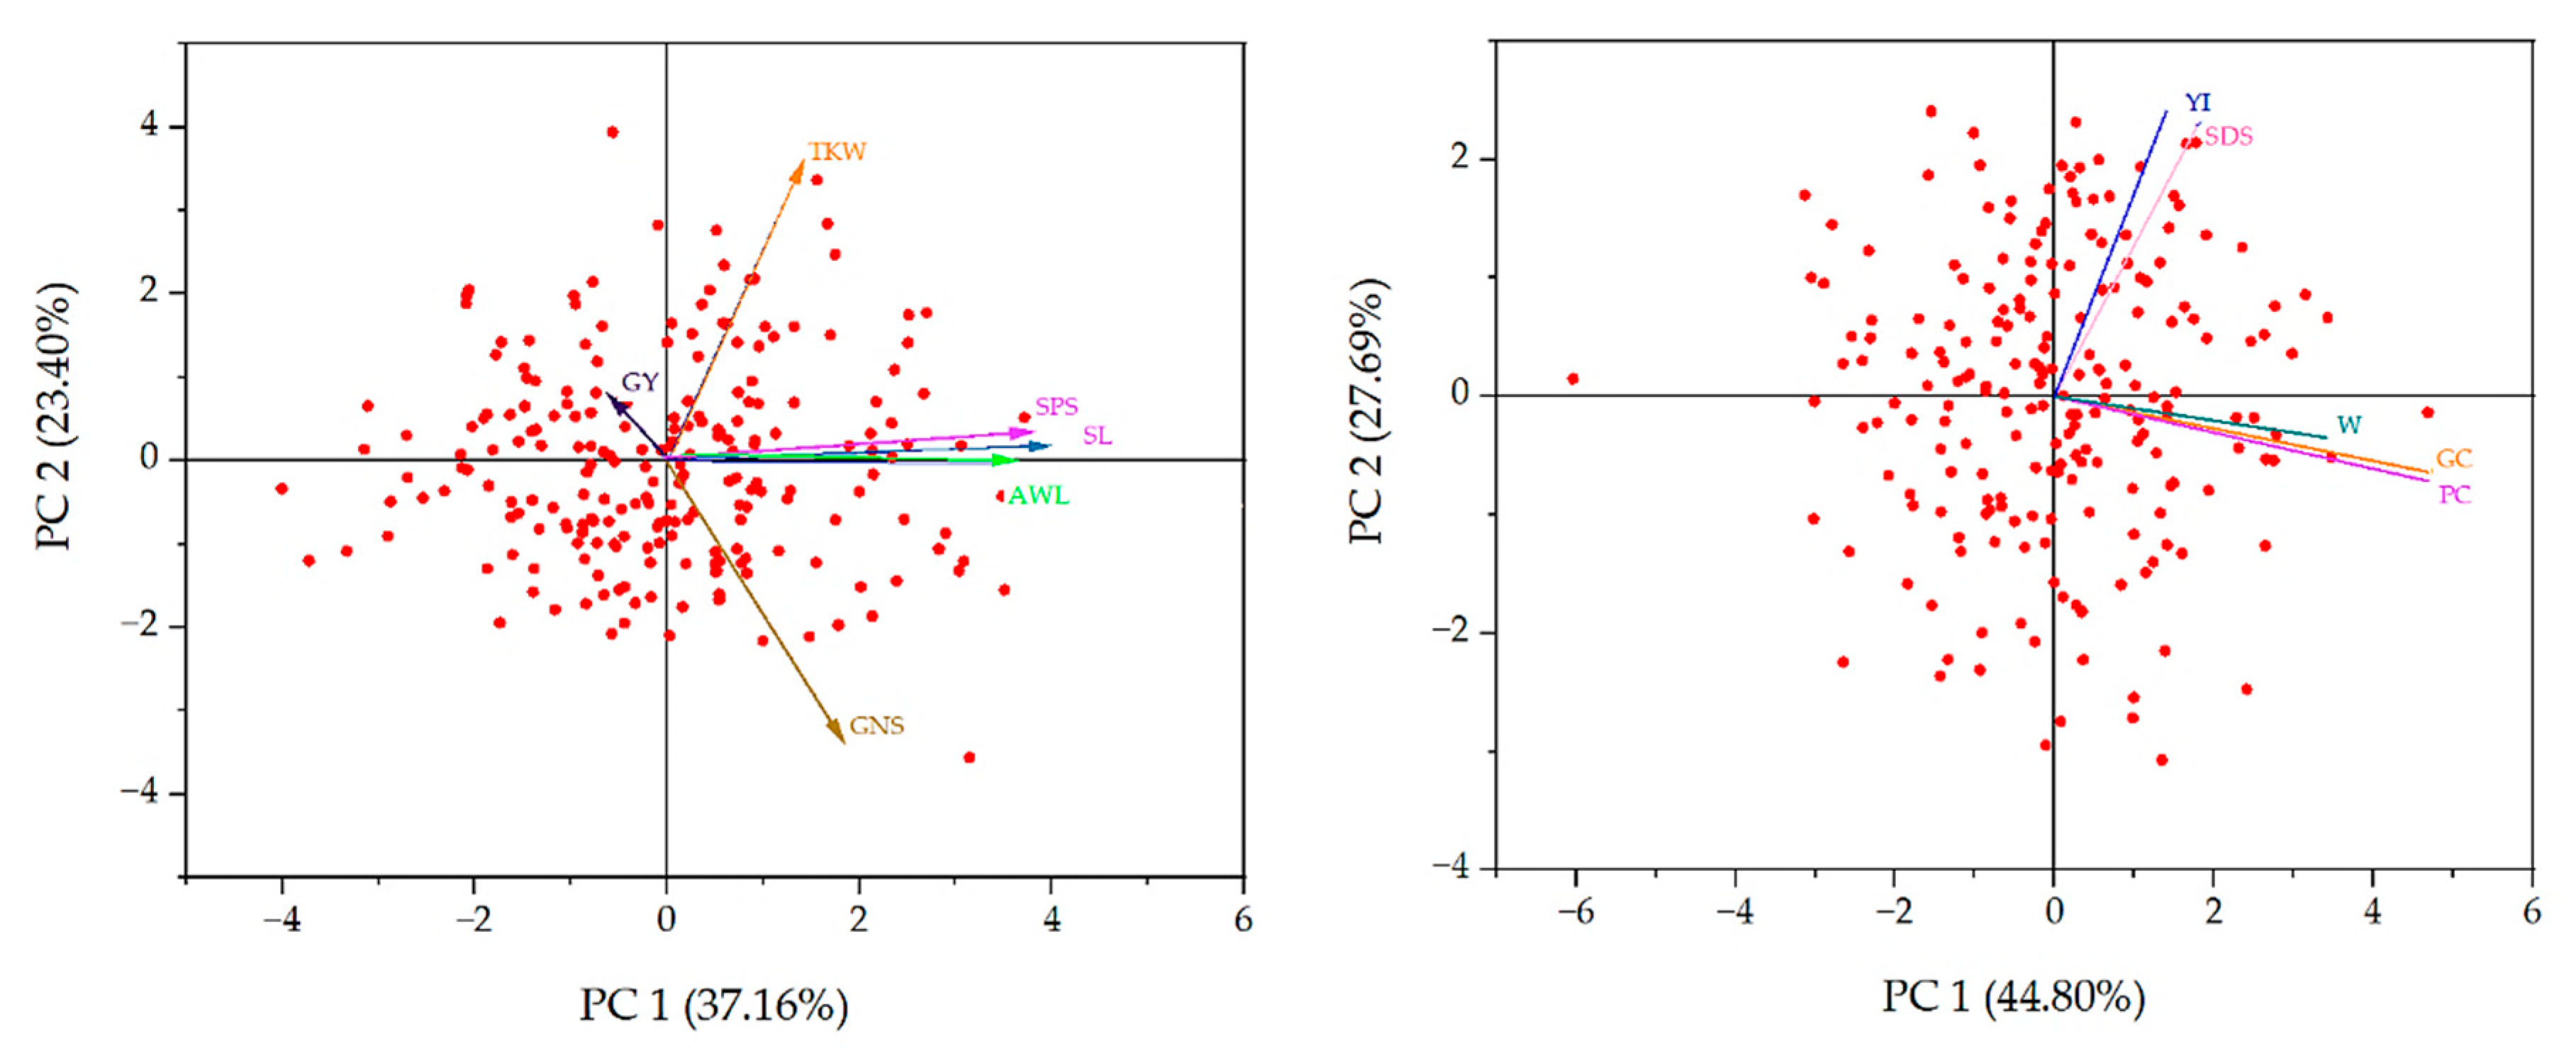
2.4. Principal Component Analysis

Principal component analysis (PCA) was conducted to examine the dispersion of the 225 genotypes in the collection and identify the agro-morphological and quality traits contributing to their structuring (Figure 5). The objective was to explore the genetic variability within the different categories of genetic resources, considering both the agro-morphological parameters and the quality traits. The first three principal components explained 37.16%, 23.40%, and 16.56% of the total variance, respectively, cumulatively accounting for 77.12% of the overall variance of agro-morphological parameters. The PCA revealed correlations among these traits and provided a better understanding of their contribution to genetic diversity. In particular, the vectors representing awn length (AWL) and spike length (SL) were very close, indicating a strong correlation between these two parameters (angle < 90°). In contrast, the vectors for thousand-kernel weight (TKW) and number of grains per spike (GNS) were opposite, suggesting an inverse relationship between these traits. Regarding the quality parameters, the first principal component (PC1) explained 44.80% of the variance, followed by PC2 (27.69%) and PC3 (23.05%), cumulatively accounting for 95.54% of the total variance for quality traits. A strong positive correlation was observed between protein content (PC), gluten strength (SDS), and bread-making strength (W), with vectors associated with these traits being very close.

3. Discussion

3.1. Description of the Variability in Agro-Morphological Parameters and Grain Quality Traits

The results of this study highlight significant agro-morphological variability and marked differences in quality traits among the studied durum wheat genotypes. agro-morphological parameters such as awn length (AWL), spike length (SL), number of spikelets per spike (SPS), number of grains per spike (GNS), thousand-grain weight (TGW), and grain yield (GY) exhibited significant variations, reflecting valuable genetic diversity. This diversity is accompanied by variations in key quality traits such as gluten content (GC), protein content (PC), dough strength (W), sedimentation capacity (SDS), and yellow index (YI), which are crucial for food product processing. Local landraces demonstrated exceptional performance, particularly in terms of spike length, thousand-grain weight, protein content, and gluten content. For instance, genotypes from these landraces showed a spike length (SL) of 8.78 cm, a thousand-grain weight (TGW) of 50.20 g, a protein content (PC) of 16.05%, and a gluten content (GC) of 36.89%. These traits are often associated with better adaptation to local environmental conditions, confirming the importance of these landraces as reservoirs of genetic diversity for breeding programs targeting arid regions.
Previous studies have demonstrated that landraces possess enhanced drought tolerance, enabling them to withstand water scarcity while maintaining stable yields even under adverse conditions. For example, wild wheat genotypes and landraces have shown strong drought avoidance and tolerance mechanisms, contributing positively to grain yield under drought stress [39]. Moreover, landraces have been recognized as valuable sources of genetic diversity, with the potential to improve stress resilience and yield stability through modern breeding techniques, including genomic approaches that unlock their full genetic potential [40]. This germplasm, composed of heterogeneous populations with high genetic diversity, exhibits remarkable adaptability to local environmental variations, particularly in the face of drought and heat stress, which are common in harsh environments. Wheat landraces have been cultivated for thousands of years under extreme conditions, and their genetic traits have been conserved, contributing significantly to their resilience in varying environments [36]. Cultivated over many generations, local landraces have retained traits that enhance their resilience in unfavorable environmental conditions, making them well-suited to low-input agricultural systems. Unlike modern varieties, which prioritize genetic uniformity and high yields, landraces offer moderate but reliable yields while also contributing to biodiversity conservation and ecosystem sustainability [41]. Among these traits, drought tolerance is particularly notable, as drought stress during grain filling can cause irreversible yield losses, underscoring the importance of tolerance mechanisms in maintaining productivity [42] Furthermore, this type of germplasm plays a crucial role in breeding programs, offering a valuable foundation for developing cultivars better suited to extreme environments [43,44]. By harnessing this genetic wealth, it is possible to improve yields under rain-fed conditions while enhancing crop resilience in arid and semi-arid zones [45]. These observations corroborate previous studies that emphasized the importance of wheat landraces in maintaining stable yields under environmental stress conditions. For instance, a study on Ethiopian durum wheat landraces revealed high genetic diversity among genotypes, with several showing high yields associated with phenotypic traits linked to grain quality and yield [46]. Local wheat landraces, well adapted to low-input farming systems, exhibit greater resilience to challenging climatic conditions. While their yield is generally lower than that of modern varieties under optimal conditions, some landraces achieve comparable performance, particularly in organic farming. Their stability under rainfed conditions and adaptability to Mediterranean environments make them valuable candidates for sustainable production systems [47,48]. In addition to the agro-morphological and genetic characteristics of local landraces, key agronomic traits such as thousand-kernel weight (TKW) are critical for evaluating grain yield. However, genetic improvements have primarily enhanced yield through an increase in the number of grains, with TKW playing a secondary, yet important role in determining final yield [49]. TKW is not only directly related to grain yield and milling quality but also influences seed vigor and growth, which in turn affect overall yield. Therefore, TKW serves as an essential indicator for assessing and optimizing wheat performance across diverse agricultural systems [50].
Alongside TKW, spike length (SL) is another significant agronomic parameter influencing wheat yield. SL directly impacts grain density and the number of grains per spike, thereby contributing to higher overall productivity. Longer spikes are generally associated with a greater number of grains, which translates into increased grain yield. Moreover, SL plays a crucial role in adapting wheat to water deficit conditions, enhancing the plant’s resilience to environmental stresses and ensuring better grain adaptation under unfavorable conditions [51]. Protein content is a pivotal determinant of durum wheat quality, particularly for pasta production, as it directly influences texture, elasticity, and cooking behavior. Durum wheat with a high protein content (≥13%, 11% dry matter) is preferred by pasta manufacturers due to its superior resistance to overcooking, optimal firmness, and reduced loss during cooking [52]. Studies have shown that pasta made from semolina with a higher protein content exhibits enhanced strength and elasticity, making it superior to pasta made from lower protein content semolina [53]. Additionally, Dexter and Matsuo [54] observed that increased protein content improves cooking quality, particularly in Canadian durum wheat cultivars, enhancing overcooking tolerance and improving texture and stability post-cooking [55]. Building on the importance of protein content, gluten, a key protein in wheat, plays a pivotal role in determining the suitability of flour for bread and pasta production. Wet gluten content serves as a critical indicator of dough behavior, influencing its elasticity and processability during baking. The quality and quantity of gluten, often measured by the gluten index, directly affect the texture and final quality of wheat-based products. Higher gluten content enhances dough’s viscoelastic properties, contributing to better product quality, including texture and stability, particularly in breadmaking [56]. The gluten index, which varies among wheat varieties, quantifies both gluten quantity and its viscoelastic properties, and has been shown to be an important factor in determining the quality of biscuits and other baked goods [57]. Furthermore, the viscoelastic properties of the dough, which are closely linked to grain protein levels, play a significant role in determining the quality of biscuits, particularly affecting texture and stability during baking [58].
The Moroccan elite genotypes stand out for their promising performance, particularly regarding quality traits such as a high yellow pigmentation index. This trait is vital for the pasta industry, as the yellow-amber color of semolina has become a key quality factor for durum wheat end products [59]. The yellow color is primarily due to carotenoid pigment content in the whole grain, commercially recognized as the yellow index (YI) in semolina [60]. Beyond their aesthetic role, carotenoids provide significant nutritional benefits, offering antioxidant properties that contribute to human health. A high level of yellow pigments is sought after to ensure optimal color and quality in pasta, which in turn influences both its commercial and nutritional value [61]. In addition to yellow pigments, the genetic diversity of durum wheat, particularly regarding glutenin alleles, plays a crucial role in determining gluten strength, which directly impacts pasta processing quality [62]. These carotenoids, primarily lutein and its fatty acid esters, are responsible for the characteristic color of durum wheat. Their presence and concentration are key indicators of grain visual quality and suitability for industrial processing, especially for pasta production, where a bright yellow color is highly preferred [63].
Remarkably, Moroccan varieties have demonstrated excellent performance in terms of yield, reaching up to 6.11 t/ha, even under prolonged water deficit conditions in the arid environment of Jemhâa Shaim. Compared to other germplasm types, these genotypes exhibited higher yields, confirming their resilience and ability to withstand water stress. Studies have shown that in arid regions like Jemhâa Shaim, durum wheat performance is strongly influenced by water scarcity and climate stress. In such conditions, selecting drought-tolerant genotypes is critical for ensuring stable production. Research by Daryanto et al.[64] emphasizes the global impact of drought on wheat production, illustrating the importance of selecting varieties adapted to these extreme environmental stresses [65]. Similarly, Aktaş [66] highlighted the significance of drought tolerance indices in identifying landraces and genotypes that can withstand such stress, particularly for wheat production in water-limited areas like Jemhâa Shaim. Durum wheat yield is not only vital for ensuring food security but also plays a central role in supporting the local agricultural economy, especially in Mediterranean regions, where the crop demonstrates significant resistance to climatic challenges [13]. In these environments, the ability of durum wheat genotypes to withstand climatic stresses directly influences their yield, making this crop a strategic asset for maintaining stable production, particularly in the face of climate change [16]. This is supported by findings from a study on drought-tolerant durum wheat genotypes, which underscore the importance of selecting varieties that can thrive under both stressed and non-stressed conditions across varying climatic scenarios [67]. Furthermore, in regions with arid climates, such as Jemhâa Shaim, selecting durum wheat genotypes adapted to these extreme environments is essential for ensuring stable production. These conclusions align with previous findings, which highlight that wheat genotypes capable of adapting to environmental stress conditions can offer higher yields and better performance, particularly in regions facing climatic challenges. In this context, Moroccan varieties have demonstrated strong adaptability to such conditions, further confirming their potential for future agricultural production and their role in ensuring stable yields under adverse environmental factors [68].

3.2. Relationship Between Agronomic Traits and Yield Components

The results of this study reveal significant and intricate relationships among various agronomic traits of durum wheat, emphasizing the critical role of specific characteristics in enhancing productivity. A positive correlation was identified between spike length (SL) and the number of spikelets per spike (SPS), suggesting that longer spikes can support more spikelets, which improves grain distribution and contributes to overall yield. Additionally, spike length was shown to be a key determinant of grain yield. Similarly, a positive relationship has been demonstrated between spike length and both the number of spikelets per spike (SPS) and the number of grains per spike (GNS), emphasizing the importance of these traits in driving productivity, especially under optimal resource management [69]. These findings align with the work of [70] who reported that spike length is a vital trait influencing grain yield, further reinforcing its significance in maximizing productivity. A moderate negative correlation was observed between the number of grains per spike (GNS) and the thousand-grain weight (TGW), indicating that an increase in the number of grains may reduce the individual grain weight. This phenomenon reflects increased competition for essential resources, such as water and nutrients, particularly under limiting conditions [71]. However, some studies have reported a positive correlation between these two parameters, which could be due to environmental factors or specific agricultural practices that favor both better grain development and optimal resource allocation for increased grain weight [72]. Moreover, durum wheat’s behavior varies depending on environmental conditions. When sown in semi-arid areas, it adopts physiological strategies different from those observed under supplemental irrigation conditions, which may also influence the relationship between the number of grains per spike and their weight [73].
The results of the correlation analysis between the different technological quality parameters of wheat revealed several interesting relationships. Notably, a strong correlation was observed between gluten strength and protein content, confirming previous studies that demonstrated protein content as a key factor in forming a high-quality gluten network. These findings are further supports by recent research [26,74], which highlighted a significant positive correlation between protein content and gluten content. These studies showed that high protein concentrations, particularly gluten, are essential for achieving an elastic and extensible dough, which are crucial characteristics for optimal breadmaking. From a technological perspective, a highly significant positive correlation was observed between protein content (PC), gluten content (GC), and bread-making strength (W). These results highlight the importance of high concentrations of protein, particularly gluten, in developing a gluten network that imparts optimal rheological properties to the dough, such as elasticity and extensibility, which are crucial for quality bread-making. These findings are consistent with the work, which demonstrated that PC is directly related to W, primarily through its role in gluten structure[75]. Furthermore, the study highlighted that high molecular weight glutenin subunits contribute significantly to dough resistance and overall quality, further reinforcing their impact on W [76,77].
The results obtained in this study are consistent with those of previous research, such as studies on durum wheat genotypes, where it was observed that gluten strength is more influenced by the specific composition of gluten subunits, rather than simply by the total gluten or protein content [78]. Although variations in gluten subunits have been correlated with dough strength, no direct link was found between the amount of gluten or proteins and gluten strength. These findings suggest that gluten strength may be more influenced by the structure and composition of the proteins, particularly the relative proportion of different fractions, rather than by their sheer quantity. This idea is further supported by the observations in the study of [79], which indicate that gluten strength seems to result from a complex interaction between gluten subunits, rather than from the total protein content.
A highly significant positive correlation was observed between gluten strength (measured by the SDS test) and the yellow pigment index in the durum wheat genotypes analyzed. This relationship highlights the crucial influence of gluten quality on the final product’s color, particularly for pasta. These results align with those of the study conducted by Kaur et al.[80], who also found a strong association between yellow pigment content and gluten quality in durum wheat varieties used for pasta production. Their study demonstrated that genotypes with higher yellow pigment content also exhibited better gluten quality, emphasizing the crucial role of protein composition in both the physical and visual quality of the final product. In addition,, the findings of the study by petter and shawry [81] further support this correlation by demonstrating that variations in the composition of gluten subunits significantly influence dough properties as well as its color. They observed that the proportion of certain gluten fractions, such as glutenin and gliadin proteins, was closely linked to dough quality, including its color. Additionally, they highlighted that the composition of gluten proteins, particularly the relative proportion of different fractions, plays a crucial role in the quality of durum wheat-based products, especially pasta, where color is a key factor in visual quality [82].

3.3. Principal Component Analysis (PCA)

The agro-morphological traits of the genotypes showed that the awn length (AWL) and spike length (SL) are strongly correlated, suggesting a possible genetic relationship between these two parameters. This observation implies that selecting for one of these traits could influence the other, as similar correlations were reported in previous studies [83]. in Moroccan durum wheat genotypes, where relationships between certain morphological traits were found to impact genetic diversity. Additionally, the inverse relationship between thousand-kernel weight (TKW) and number of grains per spike (GNS) was observed in this study. This inverse relationship aligns with the findings of Sourour et al.[84], who reported variation in these parameters among Tunisian durum wheat genotypes, highlighting the significance of these traits in phenotypic structuring. Regarding quality parameters, our results are consistent with those from a study that used PCA to distinguish genetic groups based on protein content and gluten strength in wheat, showing that these traits are crucial for predicting the quality of wheat-based products [85]. In accordance with this, protein content and gluten strength were found to be key factors influencing wheat quality in the multivariate analysis of genetic diversity in Ethiopian tetraploid wheat, confirming the relevance of these parameters for wheat genetic improvement [86].

4. Materials and Methods

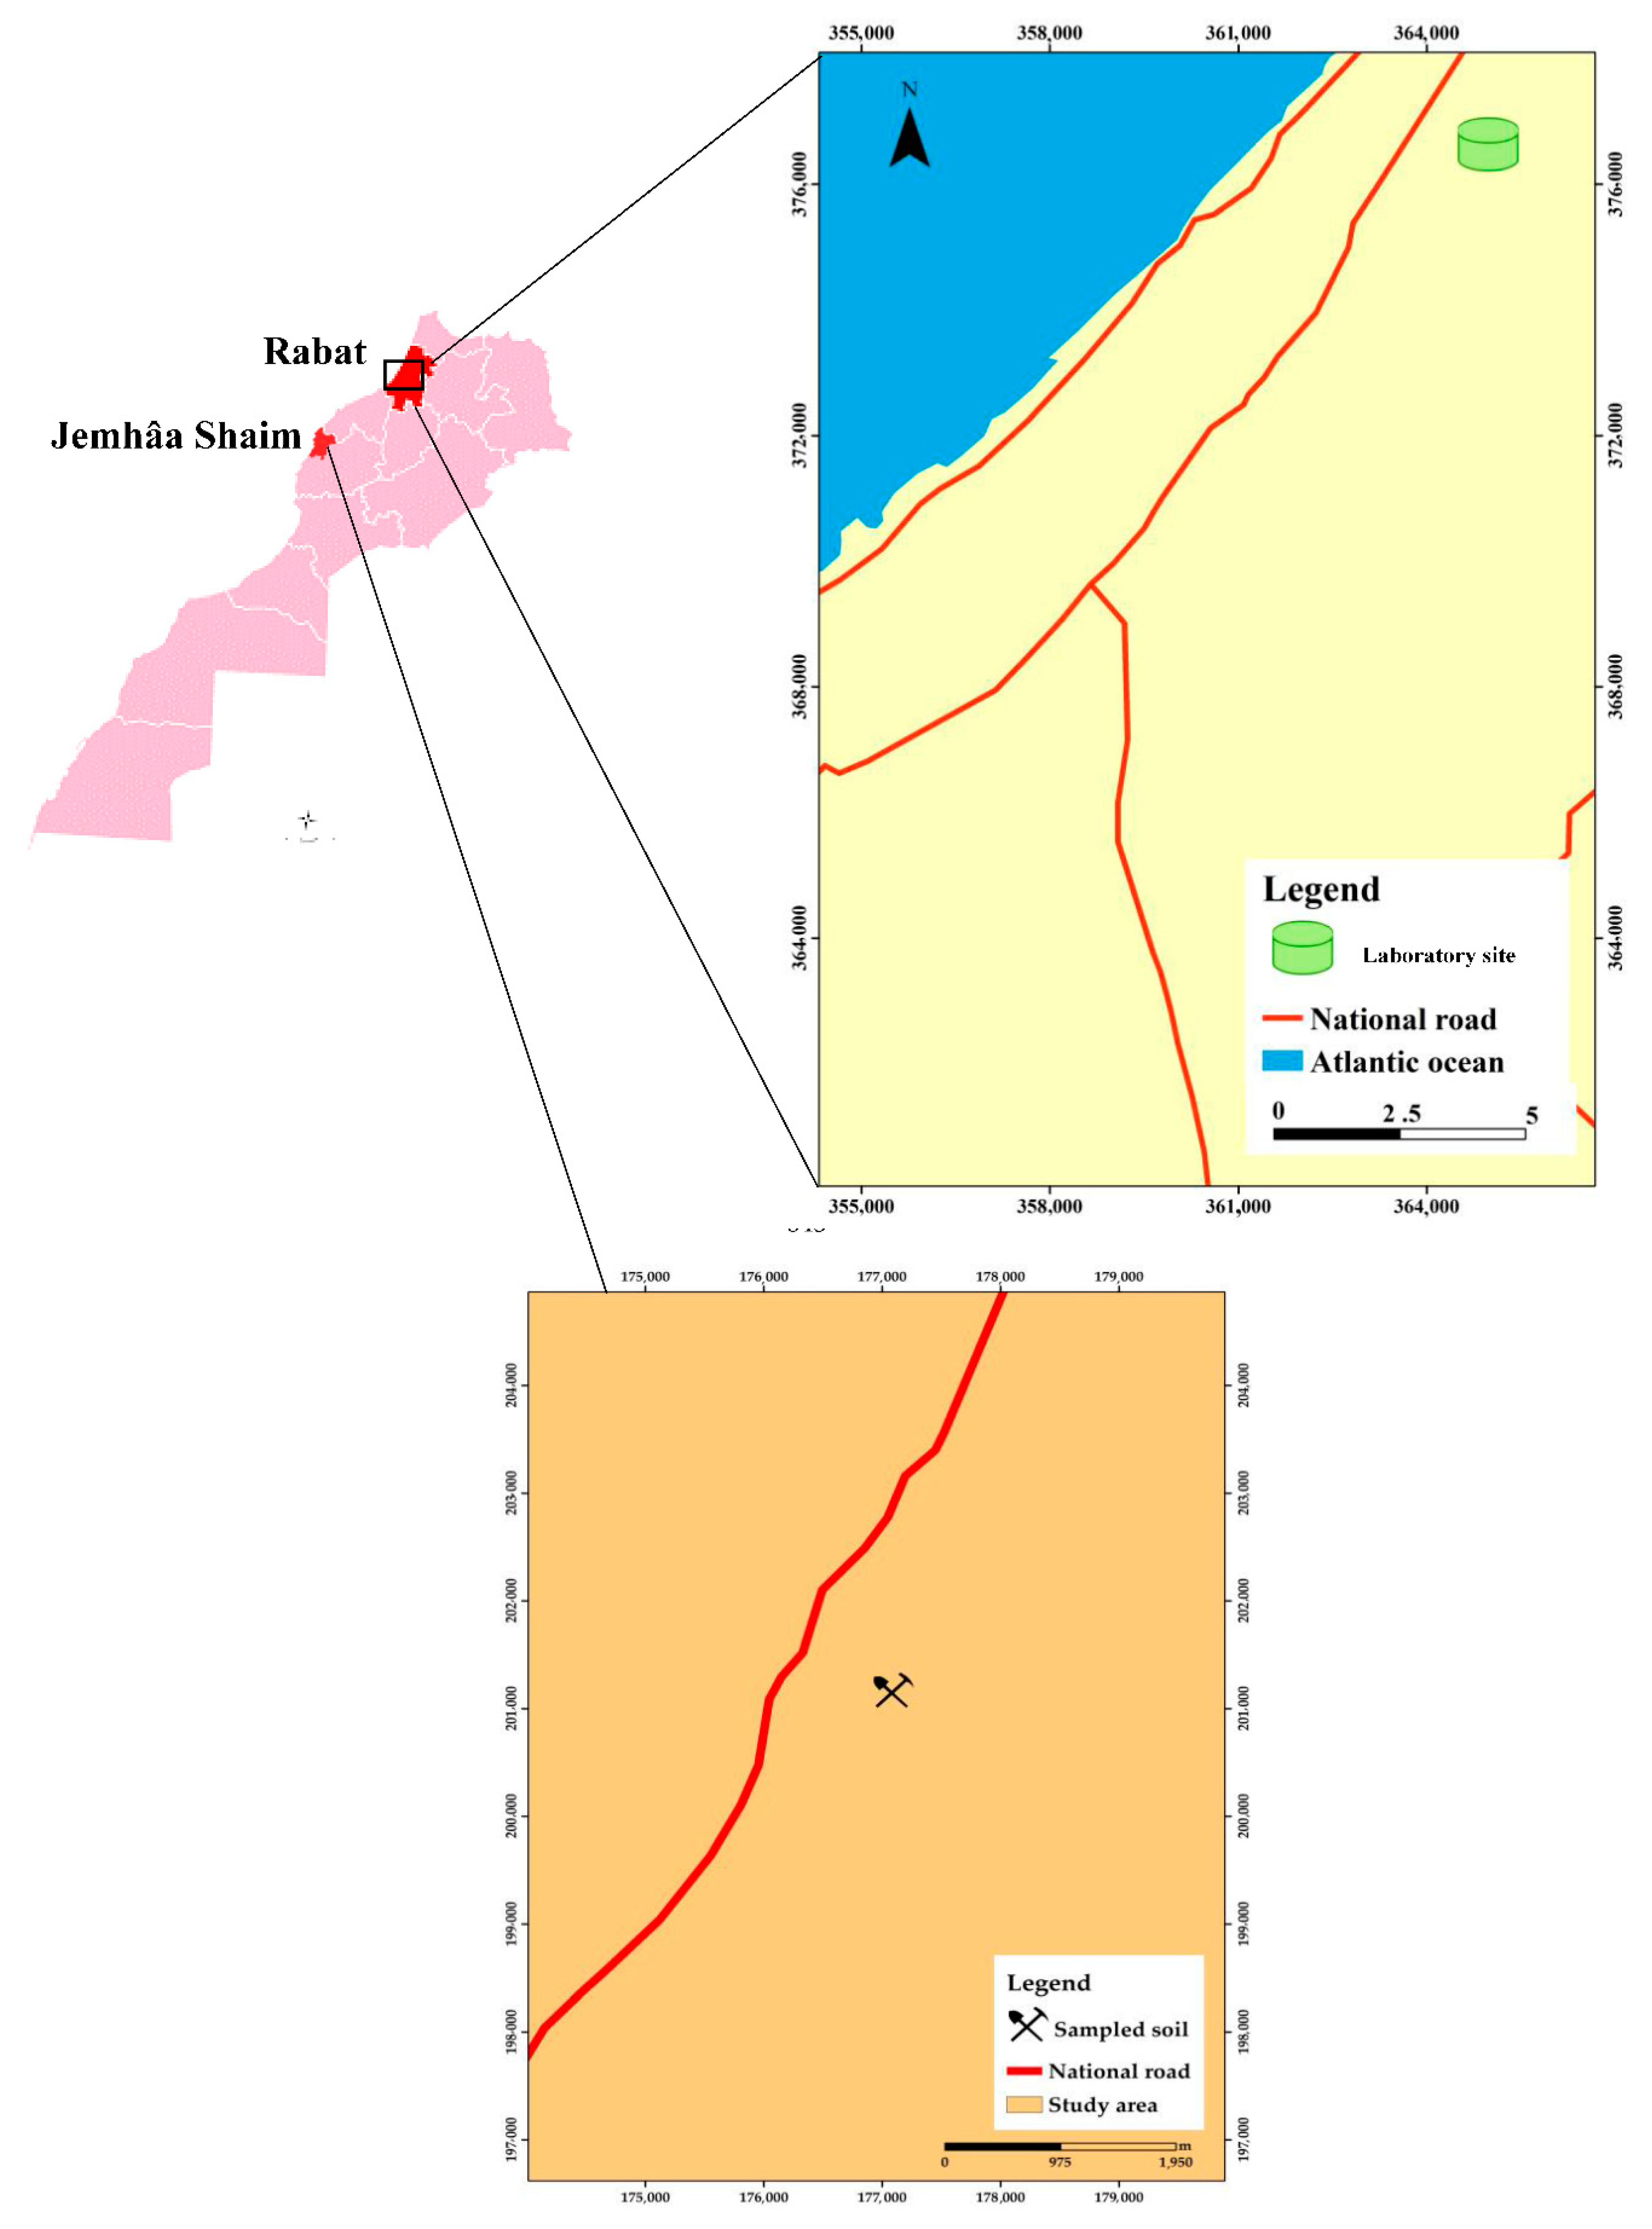
4.1. Experimental Site

The experiment was conducted at the Jemhâa Shaim experimental site, part of the Regional Center for Agricultural Research. Located 40 km from Safi, Morocco, the site covers an area of 320 hectares and is situated at an altitude of 168 m. The geographical coordinates of the site are latitude 32° 21′ 0″ N and longitude 8° 51′ 0″ W (Figure 6).
This site was selected for its representativeness of the agroecological conditions in the region, particularly its arid climate and soils suitable for agricultural trials. The climate is characterized by an average annual rainfall of 270 mm, with precipitation during the agricultural season ranging between 0 mm and 62.80 mm. The average annual temperatures vary between a minimum of 11.58 °C and a maximum of 21.04 °C. These conditions provide an ideal framework to evaluate crop performance under challenging environments. The soils at the site, primarily calcic cambisols, are typical of the agricultural zones in this region, making it a relevant location for agronomic trials. The agroecological zone is classified as dryland with a very short growing season, characterized by extreme drought and heat. Additionally, the site faces issues such as leaf rust and extreme infestations of Hessian fly, which further accentuate the environmental stress. These features enabled an in-depth study of crop growth during the experimental period (Figure 7).

4.2. Plant Material

The plant material used in this study consists of a set of 219 durum wheat (Triticum turgidum L. var. durum) accessions, selected based on their adaptability to local agro-ecological conditions and their potential for breeding programs. This collection is divided into five distinct groups, ensuring a diverse representation of geographic and genetic origins. The genotypes were classified as follows: 120 Moroccan lines from the national durum wheat breeding program, 63 international lines from CIMMYT, including 28 from the International Durum Screening Nursery program and 35 from the International Durum Yield Nursery program, 23 Moroccan varieties, 4 foreign varieties registered in the Moroccan national catalogue, obtained by institutions other than INRA but approved by the national registration system and 9 landraces.

4.3. Experimental Design

The experiments were conducted using an “Alpha lattice” experimental design with two replications. Each replication consists of 199 elementary plots. Each accession is sown in two 2-m-long rows spaced 30 cm apart, giving each elementary plot an area of 1.2 m². The spacing between plots is 1 m, while the distance between blocks is 2 m.

4.4. Agro-Morphological Characterization

The agro-morphological descriptors of five types of durum wheat germplasm were evaluated following the international standards defined by “Bioversity” [87].The measurements included awn length (AWL), spike length (SL), the number of spikelets per spike (SPS), the number of grains per spike (GNS), and thousand kernel weight (TKW). For awn length and spike length, three representative spikes were collected from each plot and measured using a ruler graduated in centimeters, with the awn length recorded from the insertion point at the spike base to its longest tip, and the spike length measured from the base to the top. The number of spikelets per spike was manually counted, and the spikes were gently rubbed by hand to separate the grains without damaging them. The number of grains per spike was determined using the Choppin Numigral counter, and grain weight was measured using a precision balance (Ohaus precision balance). The thousand- kernel weight (TKW) was calculated using the following equation:
T K W = T o t a l   g r a i n   w e i g h t × 1000 N u m b e r   o f   g r a i n s
After harvest, the grain weight for each elementary plot was measured, and the grain yield was calculated using the formula:
Grain   yield   ( t   ha - 1 ) = ( Grain   weight   per   plot   ( kg ) ) Plot   area   ( 1.2   m 2 ) × 100

4.5. Quality Parameters Characterization

4.5.1. Whole Grain-Based Parameters

The quality parameters of whole grains, including moisture content (MC), grain gluten content (GGC), grain protein content (GPC), and breadmaking strength (W), were determined using the Chopin spectrophotometer, Infraneo model, based on near-infrared spectroscopy (NIRS), as described in AOAC [88]. Cleaned and impurity-free whole grains were directly placed into the device’s measurement chamber, ensuring precise and non-destructive analysis of these essential traits. The spectrophotometer analyzes the grains by projecting a beam of infrared light onto their surface and measuring the reflected light. This method relies on the reflectance of radiation emitted at a specific wavelength in the visible or infrared spectrum. The chemical bonds present in the material (O-H, N-H, C-H) absorb at specific wavelengths corresponding to their vibration frequencies and the transition from a ground state to an excited state. These absorption frequencies collectively form the absorption spectrum. The instrument provides a spectrum within a wavelength range of 750 nm to 1100 nm, with a step size of 2 nm. Results for each parameter are generated automatically and displayed on the device interface. For the measured parameters, the device is pre-calibrated according to international standards: ISO 712:2009 for moisture content (MC), the Kjeldahl method for grain protein content (GPC), and ISO 21415-2:2015 for grain gluten content (GGC)[89,90].

4.5.2. Flour-Based Parameters

The milling is performed using the Cyclone Sample Mill laboratory grinder from UDY Corporation (Model: 3010-080P / 3010-081P), equipped with two sieves: a 0.5 mm mesh sieve for yellow index (YI) and moisture analyses, and a 1 mm mesh sieve for the sedimentation test. yellow pigment index (YI), and gluten strength (SDS) is determined using a physical method based on the color analysis of whole durum wheat flour with a colorimeter (CR-S Konica Minolta). The procedure involves filling a Petri dish with semolina as a control sample. Then, a Petri dish is filled with a non-compacted flour sub-sample, which is gently tapped to level the flour and eliminate any air pockets at the bottom of the dish. The dish is then placed in the appropriate area of the chromameter, calibrated, and the color indices are measured. The control sample is re-analyzed after every five measurements to ensure result reliability. The results are expressed in terms of luminosity (L*), brown index (a*), and yellow index (b*), according to the standards defined by the International Commission on Illumination (CIE). Color evaluation is mainly based on the measurement of the “L*” and “b*” components, while the brown index (a*) is calculated as 100—L*, and the yellow index corresponds to b* [91]. Gluten strength was determined by the SDS (Sodium Dodecyl Sulfate) sedimentation test, according to a Moroccan standard method (N.M.08.1.217, 1999), equivalent to the American Association for Cereal Chemistry (AACC 56–70) method. The principle of this test involves measuring the sedimentation volume formed after a series of stirrings and swelling of proteins, following an established international standard. For this test, 1 g of durum wheat flour is mixed with 8 mL of Reagent 1 in a 25 mL graduated test tube. The solution is manually stirred for 10 s to ensure homogenization. After starting the stopwatch, the sample is allowed to sediment for 4 min and 30 s, with a rapid agitation at 2 min and 30 s. At 4 min and 30 s, a final rapid agitation is performed, followed by the addition of 12 mL of SDS-lactic acid solution. The sample is then placed in a shaker (Vortex Genie 2, Scientific Industries, USA) for further homogenization. Finally, the sample is left to sediment, and the sedimentation volume is measured[92].

4.5.3. Data Analysis

The collected data were subjected to one-way analysis of variance (ANOVA) to assess the significant differences among the studied germplasm groups. Duncan’s test at a 5% significance level was used to compare the means and classify the different germplasm groups. The results of the one-way ANOVA highlighted significant genetic differences between the groups (inter-class), facilitating the selection of the most performant genotypes for each studied trait. Furthermore, correlation analyses and principal component analysis (PCA) were conducted to explore the relationships between the measured traits and their potential impact on yield. These analyses provided crucial insights into the interactions between different agro-morphological and quality traits and identified key parameters contributing to grain yield variability. The statistical analyses were performed using SPSS software (version 25).

5. Conclusions

This study analyzed the genetic and phenotypic diversity of 219 durum wheat accessions, representing various types of germplasm (elite accessions, international lines, Moroccan varieties, and local landraces). The main goal was to assess their performance in terms of agro-morphological traits and quality. The results revealed significant differences between the groups studied, highlighting considerable genetic variability that could be exploited in future breeding programs to improve durum wheat, especially in arid and semi-arid environments where growing conditions are often challenging. Local landraces particularly stood out for their performance across several quality criteria, making them highly promising for the development of high-quality durum wheat varieties. This group therefore represents a key genetic resource for creating varieties that meet market quality standards. International lines exhibited the highest sedimentation index (SDS). Genotypes from elite accessions were distinguished by a higher yellow index, highlighting their potential for cereal products that require superior visual quality, particularly for semolina or flour production. Statistical analyses confirmed the presence of significant genetic variability within the studied groups. Principal component analysis (PCA) showed that agro-morphological traits accounted for a large proportion of the total variability, while quality traits, such as protein and gluten content, also explained a significant part. This underscores the importance of qualitative traits in differentiating germplasm and their crucial role in developing durum wheat varieties that meet both agronomic conditions and food industry requirements.
The findings emphasize that the genetic and phenotypic diversity of durum wheat is a vital resource for its continuous improvement. Selecting genotypes that combine favorable agro-morphological traits with quality criteria could lead to the development of high-performing varieties suited to both agricultural and industrial needs. Furthermore, preserving this diversity is essential for ensuring the sustainability of wheat production in the face of climate change challenges and the growing demand for food. Future research should build on this analysis by considering inter-annual variations and integrating phenotypic approaches with genetic studies, such as the use of molecular markers, to better understand the genetic basis of variability and refine breeding strategies aimed at developing more resilient durum wheat varieties tailored to local conditions.

Author Contributions

Conceptualization, K.M.; methodology, K.M. and H.D.; software, K.M.; resources, K.M., H.S. and M.O.L; validation, K.M., H.D., D.H.,A.Z., and T.M.; formal analysis, K.M.,A.D., H.D., R.M. and A.Z.; writing—original draft preparation, K.M., D.H., H.D. and A.Z.; writing—review and editing, K.M., H.D., D.H., H.S and M.O.L; visualization, K.M. and A.Z.; supervision, D.H.,H.Y. and A.Z.; funding acquisition, R.M. All authors have read and agreed to the published version of the manuscript.

Funding

This research received no external funding.

Data Availability Statement

The data used in this study are available upon request. We encourage interested researchers to contact us for further information.

Acknowledgments

The authors extend their gratitude to those who contributed to this study, including the field sampling, laboratory analysis, and manuscript writing teams from the Process Engineering and Environment Laboratory at the National Institute of Agricultural Research (INRA) and the International Center for Agricultural Research in the Dry Areas (ICARDA) in Morocco. The authors would like to thank the “MCGP” project (INRA and ICARDA) for their financial and technical supports.

Conflicts of Interest

The authors declare no conflicts of interest.

References

  1. Smutka, L.; Steininger, M.; Miffek, O. World Agricultural Production and Consumption. AGRIS on-line Papers in Economics and Informatics 2009, 1. [Google Scholar]
  2. Smutka, L.; Steininger, M.; Maitah, M.; Škubna, O. The Czech Agrarian Foreign Trade—Ten Years after the EU Accession. In Agrarian Perspectives XXIV: Proceedings of the 24th International Scientific Conference; Glasgow, UK, 2015; pp. 385–392.
  3. Wegren, S.K.; Elvestad, C. Russia’s Food Self-Sufficiency and Food Security: An Assessment. Post-Communist Economies 2018, 1–23. [CrossRef]
  4. Cook, D.C.; Fraser, R.W.; Paini, D.R.; Warden, A.C.; Lonsdale, W.M.; De Barro, P.J. Biosecurity and Yield Improvement Technologies Are Strategic Complements in the Fight against Food Insecurity. PLoS ONE 2011, 6, e26084. [Google Scholar] [CrossRef] [PubMed]
  5. Stocking, M.A. Tropical Soils and Food Security: The Next 50 Years. Science 2003, 302, 1356–1359. [Google Scholar] [CrossRef]
  6. Pinstrup-Andersen, P.; Pandya-Lorch, R. Food Security and Sustainable Use of Natural Resources: A 2020 Vision. Ecological Economics 1998, 26, 1–10. [Google Scholar] [CrossRef]
  7. Anderson, T.R.; Slotkin, T.A. Maturation of the Adrenal Medulla--IV. Effects of Morphine. Biochem Pharmacol 1975, 24, 1469–1474. [Google Scholar] [CrossRef]
  8. Corwin, D.L. Climate Change Impacts on Soil Salinity in Agricultural Areas. European J Soil Science 2021, 72, 842–862. [Google Scholar] [CrossRef]
  9. Shrivastava, P.; Kumar, R. Soil Salinity: A Serious Environmental Issue and Plant Growth Promoting Bacteria as One of the Tools for Its Alleviation. Saudi Journal of Biological Sciences 2015, 22, 123–131. [Google Scholar] [CrossRef] [PubMed]
  10. Yen, C.; Yang, J. Biosystematics of Triticeae: Volume I. Triticum-Aegilops Complex; Springer Nature: Cham, Switzerland, 2020. [Google Scholar]
  11. Taylor, R.D.; Koo, W.W. 2015 Outlook of the U.S. and World Wheat Industries, 2015-2024. 2015. [Google Scholar] [CrossRef]
  12. Mcfadden, E.S.; Sears, E.R. THE ORIGIN OF TRITICUM SPELTA AND ITS FREE-THRESHING HEXAPLOID RELATIVES*. Journal of Heredity 1946, 37, 81–89. [Google Scholar] [CrossRef]
  13. Martínez-Moreno, F.; Ammar, K.; Solís, I. Global Changes in Cultivated Area and Breeding Activities of Durum Wheat from 1800 to Date: A Historical Review. Agronomy 2022, 12, 1135. [Google Scholar] [CrossRef]
  14. Xynias, I.N.; Mylonas, I.; Korpetis, E.G.; Ninou, E.; Tsaballa, A.; Avdikos, I.D.; Mavromatis, A.G. Durum Wheat Breeding in the Mediterranean Region: Current Status and Future Prospects. Agronomy 2020, 10, 432. [Google Scholar] [CrossRef]
  15. Graziano, S.; Marando, S.; Prandi, B.; Boukid, F.; Marmiroli, N.; Francia, E.; Pecchioni, N.; Sforza, S.; Visioli, G.; Gullì, M. Technological Quality and Nutritional Value of Two Durum Wheat Varieties Depend on Both Genetic and Environmental Factors. J. Agric. Food Chem. 2019, 67, 2384–2395. [Google Scholar] [CrossRef] [PubMed]
  16. Tidiane Sall, A.; Chiari, T.; Legesse, W.; Seid-Ahmed, K.; Ortiz, R.; Van Ginkel, M.; Bassi, F.M. Durum Wheat (Triticum Durum Desf.): Origin, Cultivation and Potential Expansion in Sub-Saharan Africa. Agronomy 2019, 9, 263. [Google Scholar] [CrossRef]
  17. Urbanavičiūtė, I.; Bonfiglioli, L.; Pagnotta, M.A. Diversity in Root Architecture of Durum Wheat at Stem Elongation under Drought Stress. Agronomy 2022, 12, 1329. [Google Scholar] [CrossRef]
  18. Rezzouk, F.Z.; Gracia-Romero, A.; Kefauver, S.C.; Nieto-Taladriz, M.T.; Serret, M.D.; Araus, J.L. Durum Wheat Ideotypes in Mediterranean Environments Differing in Water and Temperature Conditions. Agricultural Water Management 2022, 259, 107257. [Google Scholar] [CrossRef]
  19. Taghouti, M.; Bassi, F.M.; Nasrellah, N.; Amri, A.; Motawaj, J.; Nachit, M. ‘Nachit’, a Wild-relative-derived Durum Wheat Resilient to Climate Change in Morocco. J of Plant Registrations 2023, 17, 529–535. [Google Scholar] [CrossRef]
  20. Manhou, K.; Moussadek, R.; Yachou, H.; Zouahri, A.; Douaik, A.; Hilal, I.; Ghanimi, A.; Hmouni, D.; Dakak, H. Assessing the Impact of Saline Irrigation Water on Durum Wheat (Cv. Faraj) Grown on Sandy and Clay Soils. Agronomy 2024, 14, 2865. [Google Scholar] [CrossRef]
  21. Hannachi, S.; Steppe, K.; Eloudi, M.; Mechi, L.; Bahrini, I.; Van Labeke, M.-C. Salt Stress Induced Changes in Photosynthesis and Metabolic Profiles of One Tolerant (‘Bonica’) and One Sensitive (‘Black Beauty’) Eggplant Cultivars (Solanum Melongena L.). Plants 2022, 11, 590. [Google Scholar] [CrossRef]
  22. Rabti, A.; Mekaoussi, R.; Fellahi, Z.E.A.; Hannachi, A.; Benbelkacem, A.; Benmahammed, A.; Bouzerzour, H. Characterization of Old And Recent Durum Wheat [Triticum Turgidum (L.) Tell. Convar. Durum (Desf.) Mackey] Varieties Assessed under South Mediterranean Conditions. Egypt. J. Agron. 2020. [Google Scholar] [CrossRef]
  23. Fellahi, Z.E.A.; Hannachi, A.; Bouzerzour, H. Analysis of Direct and Indirect Selection and Indices in Bread Wheat (Triticum Aestivum L.) Segregating Progeny. International Journal of Agronomy 2018, 2018, 1–11. [Google Scholar] [CrossRef]
  24. Casagrande, C.R.; Mezzomo, H.C.; Silva, C.M.; Lima, G.W.; Souza, D.J.P.; Borém, A.; Nardino, M. Selection Indexes Based on Genotypic Values Applied to Brazilian Tropical Wheat Breeding. Agron. Sci. Biotechnol. 2022, 8, 1–16. [Google Scholar] [CrossRef]
  25. Galal, A.A.; Safhi, F.A.; El-Hity, M.A.; Kamara, M.M.; Gamal El-Din, E.M.; Rehan, M.; Farid, M.; Behiry, S.I.; El-Soda, M.; Mansour, E. Molecular Genetic Diversity of Local and Exotic Durum Wheat Genotypes and Their Combining Ability for Agronomic Traits under Water Deficit and Well-Watered Conditions. Life 2023, 13, 2293. [Google Scholar] [CrossRef]
  26. Kroupin, P.Yu.; Bespalova, L.A.; Kroupina, A.Yu.; Yanovsky, A.S.; Korobkova, V.A.; Ulyanov, D.S.; Karlov, G.I.; Divashuk, M.G. Association of High-Molecular-Weight Glutenin Subunits with Grain and Pasta Quality in Spring Durum Wheat (Triticum Turgidum Spp. Durum L.). Agronomy 2023, 13, 1510. [Google Scholar] [CrossRef]
  27. ICARDA (International Center for Agricultural Research in the Dry Areas) Morocco and ICARDA: Collaboration since 1977; 2005.
  28. International Center for Agricultural Research in the Dry Areas (ICARDA) ICARDA Annual Report; ICARDA: Aleppo, Syria, 1989.
  29. International Center for Agricultural Research in the Dry Areas (ICARDA) Landraces in Crop Breeding; ICARDA: Aleppo, Syria, 1996.
  30. Mona, T.; Nsarellah, N. ; F., G.; Atmane, R. Multi-Environment Assessment of the Impact of Genetic Improvement on Agronomic Performance and on Grain Quality Traits in Moroccan Durum Wheat Varieties of 1949 to 2017. 2017.
  31. Nsarellah, N.; Amamou, A.; Mona, T.; Annicchiarico, P. Adaptation of Moroccan Durum Wheat Varieties from Different Breeding Eras. Journal of Plant Breeding and Crop Science 2011, 3, 34–40. [Google Scholar]
  32. Broccanello, C.; Bellin, D.; DalCorso, G.; Furini, A.; Taranto, F. Genetic Approaches to Exploit Landraces for Improvement of Triticum Turgidum Ssp. Durum in the Age of Climate Change. Front. Plant Sci. 2023, 14, 1101271. [Google Scholar] [CrossRef] [PubMed]
  33. Katerji, N.; Van Hoorn, J.W.; Hamdy, A.; Mastrorilli, M.; Nachit, M.M.; Oweis, T. Salt Tolerance Analysis of Chickpea, Faba Bean and Durum Wheat Varieties. Agricultural Water Management 2005, 72, 195–207. [Google Scholar] [CrossRef]
  34. Peters Haugrud, A.R.; Achilli, A.L.; Martínez-Peña, R.; Klymiuk, V. Future of Durum Wheat Research and Breeding: Insights from Early Career Researchers. The Plant Genome 2025, 18, e20453. [Google Scholar] [CrossRef]
  35. Nazco, R.; Villegas, D.; Ammar, K.; Peña, R.J.; Moragues, M.; Royo, C. Can Mediterranean Durum Wheat Landraces Contribute to Improved Grain Quality Attributes in Modern Cultivars? Euphytica 2012, 185, 1–17. [Google Scholar] [CrossRef]
  36. Lopes, M.S.; El-Basyoni, I.; Baenziger, P.S.; Singh, S.; Royo, C.; Ozbek, K.; Aktas, H.; Ozer, E.; Ozdemir, F.; Manickavelu, A.; et al. Exploiting Genetic Diversity from Landraces in Wheat Breeding for Adaptation to Climate Change. EXBOTJ 2015, 66, 3477–3486. [Google Scholar] [CrossRef]
  37. Soriano, J.M.; Villegas, D.; Sorrells, M.E.; Royo, C. Durum Wheat Landraces from East and West Regions of the Mediterranean Basin Are Genetically Distinct for Yield Components and Phenology. Front. Plant Sci. 2018, 9, 80. [Google Scholar] [CrossRef]
  38. López-Bellido, L.; López-Bellido, R.J.; Redondo, R. Nitrogen Efficiency in Wheat under Rainfed Mediterranean Conditions as Affected by Split Nitrogen Application. Field Crops Research 2005, 94, 86–97. [Google Scholar] [CrossRef]
  39. Pantha, S.; Kilian, B.; Özkan, H.; Zeibig, F.; Frei, M. Physiological and Biochemical Changes Induced by Drought Stress during the Stem Elongation and Anthesis Stages in the Triticum Genus. Environmental and Experimental Botany 2024, 228, 106047. [Google Scholar] [CrossRef]
  40. Lazaridi, E.; Kapazoglou, A.; Gerakari, M.; Kleftogianni, K.; Passa, K.; Sarri, E.; Papasotiropoulos, V.; Tani, E.; Bebeli, P.J. Crop Landraces and Indigenous Varieties: A Valuable Source of Genes for Plant Breeding. Plants 2024, 13, 758. [Google Scholar] [CrossRef]
  41. Azeez, M.A.; Adubi, A.O.; Durodola, F.A. Landraces and Crop Genetic Improvement. In Rediscovery of Landraces as a Resource for the Future; Grillo, O., Ed.; InTech, 2018 ISBN 978-1-78923-724-5.
  42. Xu, Z.; Lai, X.; Ren, Y.; Yang, H.; Wang, H.; Wang, C.; Xia, J.; Wang, Z.; Yang, Z.; Geng, H.; et al. Impact of Drought Stress on Yield-Related Agronomic Traits of Different Genotypes in Spring Wheat. Agronomy 2023, 13, 2968. [Google Scholar] [CrossRef]
  43. Dwivedi, S.L.; Ceccarelli, S.; Blair, M.W.; Upadhyaya, H.D.; Are, A.K.; Ortiz, R. Landrace Germplasm for Improving Yield and Abiotic Stress Adaptation. Trends in Plant Science 2016, 21, 31–42. [Google Scholar] [CrossRef]
  44. Carranza-Gallego, G.; Guzmán, G.I.; Garcia-Ruíz, R.; González De Molina, M.; Aguilera, E. Addressing the Role of Landraces in the Sustainability of Mediterranean Agroecosystems. Sustainability 2019, 11, 6029. [Google Scholar] [CrossRef]
  45. Marone, D.; Russo, M.A.; Mores, A.; Ficco, D.B.M.; Laidò, G.; Mastrangelo, A.M.; Borrelli, G.M. Importance of Landraces in Cereal Breeding for Stress Tolerance. Plants 2021, 10, 1267. [Google Scholar] [CrossRef]
  46. Dagnaw, T.; Mulugeta, B.; Haileselassie, T.; Geleta, M.; Ortiz, R.; Tesfaye, K. Genetic Diversity of Durum Wheat (Triticum Turgidum L. Ssp. Durum, Desf) Germplasm as Revealed by Morphological and SSR Markers. Genes 2023, 14, 1155. [Google Scholar] [CrossRef]
  47. Scandurra, A.; Corinzia, S.A.; Caruso, P.; Cosentino, S.L.; Testa, G. Productivity of Wheat Landraces in Rainfed and Irrigated Conditions under Conventional and Organic Input in a Semiarid Mediterranean Environment. Agronomy 2024, 14, 2338. [Google Scholar] [CrossRef]
  48. Corinzia, S.A.; Caruso, P.; Scandurra, A.; Anastasi, U.; Cosentino, S.L.; Testa, G. Yield Response and Leaf Gas Exchange of Sicilian Wheat Landraces. Agronomy 2024, 14, 1038. [Google Scholar] [CrossRef]
  49. Slafer, G.A.; Andrade, F.H. Changes in Physiological Attributes of the Dry Matter Economy of Bread Wheat (Triticum Aestivum) through Genetic Improvement of Grain Yield Potential at Different Regions of the World: A Review. Euphytica 1991, 58, 37–49. [Google Scholar] [CrossRef]
  50. Marshall, D.; Mares, D.; Moss, H.; Ellison, F. Effects of Grain Shape and Size on Milling Yields in Wheat. II. Experimental Studies. Aust. J. Agric. Res. 1986, 37, 331. [Google Scholar] [CrossRef]
  51. Frantová, N.; Rábek, M.; Elzner, P.; Středa, T.; Jovanović, I.; Holková, L.; Martinek, P.; Smutná, P.; Prášil, I.T. Different Drought Tolerance Strategy of Wheat Varieties in Spike Architecture. Agronomy 2022, 12, 2328. [Google Scholar] [CrossRef]
  52. D’Egidio, M.G.; Mariani, B.M.; Nardi, S.; Novaro, P.; Cubadda, R. Chemical and Technological Variables and Their Relationships: A Predictive Equation for Pasta Cooking Quality. Cereal Chemistry 1990, 67, 275–281. [Google Scholar]
  53. Blanco, A.; Mangini, G.; Giancaspro, A.; Giove, S.; Colasuonno, P.; Simeone, R.; Signorile, A.; De Vita, P.; Mastrangelo, A.M.; Cattivelli, L.; et al. Relationships between Grain Protein Content and Grain Yield Components through Quantitative Trait Locus Analyses in a Recombinant Inbred Line Population Derived from Two Elite Durum Wheat Cultivars. Mol Breeding 2012, 30, 79–92. [Google Scholar] [CrossRef]
  54. Dexter, J.E.; Matsuo, R.R. INFLUENCE OF PROTEIN CONTENT ON SOME DURUM WHEAT QUALITY PARAMETERS. Can. J. Plant Sci. 1977, 57, 717–727. [Google Scholar] [CrossRef]
  55. Dexter, J.E.; Matsuo, R.R. Relationship between Durum Wheat Protein Properties and Pasta Dough Rheology and Spaghetti Cooking Quality. J Agric Food Chem 1980, 28, 899–902. [Google Scholar] [CrossRef]
  56. Beltrão Martins, R.; Nunes, M.C.; M. Ferreira, L.M.; A. Peres, J.; R. N. A. Barros, A.I.; Raymundo, A. Impact of Acorn Flour on Gluten-Free Dough Rheology Properties. Foods 2020, 9, 560. [CrossRef]
  57. Delcour, J.A.; Joye, I.J.; Pareyt, B.; Wilderjans, E.; Brijs, K.; Lagrain, B. Wheat Gluten Functionality as a Quality Determinant in Cereal-Based Food Products. Annu. Rev. Food Sci. Technol. 2012, 3, 469–492. [Google Scholar] [CrossRef]
  58. Mamat, H.; Hill, S.E. Effect of Fat Types on the Structural and Textural Properties of Dough and Semi-Sweet Biscuit. J Food Sci Technol 2014, 51, 1998–2005. [Google Scholar] [CrossRef]
  59. Ficco, D.B.M.; Mastrangelo, A.M.; Trono, D.; Borrelli, G.M.; De Vita, P.; Fares, C.; Beleggia, R.; Platani, C.; Papa, R. The Colours of Durum Wheat: A Review. Crop Pasture Sci. 2014, 65, 1. [Google Scholar] [CrossRef]
  60. Commission Internationale de l’Eclairage (CIE) Colorimetry; 2nd Edition.; Commission Internationale de l’Eclairage: Vienna, 1986.
  61. Sharma, C.; Kamle, M.; Kumar, P. Microbial-Derived Carotenoids and Their Health Benefits. Microbiology Research 2024, 15, 1670–1689. [Google Scholar] [CrossRef]
  62. Nazco, R.; Peña, R.J.; Ammar, K.; Villegas, D.; Crossa, J.; Moragues, M.; Royo, C. Variability in Glutenin Subunit Composition of Mediterranean Durum Wheat Germplasm and Its Relationship with Gluten strengthVariability. J. Agric. Sci. 2014, 152, 379–393. [Google Scholar] [CrossRef]
  63. Hentschel, V.; Kranl, K.; Hollmann, J.; Lindhauer, M.G.; Böhm, V.; Bitsch, R. Spectrophotometric Determination of Yellow Pigment Content and Evaluation of Carotenoids by High-Performance Liquid Chromatography in Durum Wheat Grain. J. Agric. Food Chem. 2002, 50, 6663–6668. [Google Scholar] [CrossRef] [PubMed]
  64. Daryanto, S.; Wang, L.; Jacinthe, P.-A. Global Synthesis of Drought Effects on Maize and Wheat Production. PLoS ONE 2016, 11, e0156362. [Google Scholar] [CrossRef]
  65. Wang, R.; Wang, Y.; Zhang, Z.; Pan, H.; Lan, L.; Huang, R.; Deng, X.; Peng, Y. Effects of Exponential N Application on Soil Exchangeable Base Cations and the Growth and Nutrient Contents of Clonal Chinese Fir Seedlings. Plants (Basel) 2023, 12, 851. [Google Scholar] [CrossRef]
  66. Aktaş, H. drought tolerance indices of selected landraces and bread wheat (triticum aestivum l.) genotypes derived from synthetic wheats. Appl Ecol Env Res 2016, 14, 177–189. [Google Scholar] [CrossRef]
  67. Mao, H.; Jiang, C.; Tang, C.; Nie, X.; Du, L.; Liu, Y.; Cheng, P.; Wu, Y.; Liu, H.; Kang, Z.; et al. Wheat Adaptation to Environmental Stresses under Climate Change: Molecular Basis and Genetic Improvement. Molecular Plant 2023, 16, 1564–1589. [Google Scholar] [CrossRef]
  68. Robles-Zazueta, C.A.; Crespo-Herrera, L.A.; Piñera-Chavez, F.J.; Rivera-Amado, C.; Aradottir, G.I. Climate Change Impacts on Crop Breeding: Targeting Interacting Biotic and Abiotic Stresses for Wheat Improvement. The Plant Genome 2024, 17, e20365. [Google Scholar] [CrossRef]
  69. Eltaher, S.; Sallam, A.; Emara, H.A.; Nower, A.A.; Salem, K.F.M.; Börner, A.; Baenziger, P.S.; Mourad, A.M.I. Genome-Wide Association Mapping Revealed SNP Alleles Associated with Spike Traits in Wheat. Agronomy 2022, 12, 1469. [Google Scholar] [CrossRef]
  70. Alemu, Y.A.; Anley, A.M.; Abebe, T.D. Genetic Variability and Association of Traits in Ethiopian Durum Wheat (Triticum Turgidium L. Var. Durum) Landraces at Dabat Research Station, North Gondar. Cogent Food & Agriculture 2020, 6, 1778604. [Google Scholar] [CrossRef]
  71. Boyer, J.S. Plant Productivity and Environment. Science 1982, 218, 443–448. [Google Scholar] [CrossRef] [PubMed]
  72. Bustos, D.V.; Hasan, A.K.; Reynolds, M.P.; Calderini, D.F. Combining High Grain Number and Weight through a DH-Population to Improve Grain Yield Potential of Wheat in High-Yielding Environments. Field Crops Research 2013, 145, 106–115. [Google Scholar] [CrossRef]
  73. Mohammadi, M.; Sharifi, P.; Karimizadeh, R.; Shefazadeh, M.K. Relationships between Grain Yield and Yield Components in Bread Wheat under Different Water Availability (Dryland and Supplemental Irrigation Conditions). Not Bot Hort Agrobot Cluj 2012, 40, 195. [Google Scholar] [CrossRef]
  74. Geisslitz, S.; Longin, C.F.H.; Scherf, K.A.; Koehler, P. Comparative Study on Gluten Protein Composition of Ancient (Einkorn, Emmer and Spelt) and Modern Wheat Species (Durum and Common Wheat). Foods 2019, 8, 409. [Google Scholar] [CrossRef]
  75. Sliwinski, E.L.; Kolster, P.; Prins, A.; Vliet, T. van On the Relationship between Gluten Protein Composition of Wheat Flours and Large-Deformation Properties of Their Doughs. Journal of Cereal Science 2004, 39, 247–264. [Google Scholar] [CrossRef]
  76. Marchetti, L.; Cardós, M.; Campaña, L.; Ferrero, C. Effect of Glutens of Different Quality on Dough Characteristics and Breadmaking Performance. LWT—Food Science and Technology 2012, 46, 224–231. [Google Scholar] [CrossRef]
  77. Carrillo, J.; Vazquez, J.; Orkellana, J. Relationship Between Gluten Strength and Glutenin Proteins in Durum Wheat Cultivars. Plant Breeding 2006, 104, 325–333. [Google Scholar] [CrossRef]
  78. Carrillo, J.M.; Vazquez, J.F.; Orkellana, J. Relationship Between Gluten Strength and Glutenin Proteins in Durum Wheat Cultivars. Plant Breeding 1990, 104, 325–333. [Google Scholar] [CrossRef]
  79. Al-Khayri, J.; Alshegaihi, R.; Mahgoub, El.; Mansour, E.; Atallah, O.; Sattar, M.; Al-Mssallem, M.; Alessa, F.; Aldaej, M.; Hassanin, A. Association of High and Low Molecular Weight Glutenin Subunits with Gluten Strength in Tetraploid Durum Wheat (Triticum Turgidum Spp. Durum L.). Plants 2023, 12, 1416. [Google Scholar] [CrossRef]
  80. Kaur, A.; Singh, N.; Kaur, S.; Katyal, M.; Virdi, A.S.; Kaur, D.; Ahlawat, A.K.; Singh, A.M. Relationship of Various Flour Properties with Noodle Making Characteristics among Durum Wheat Varieties. Food Chemistry 2015, 188, 517–526. [Google Scholar] [CrossRef]
  81. Nieto-Taladriz, M.T.; Perretant, M.R.; Rousset, M. Effect of Gliadins and HMW and LMW Subunits of Glutenin on Dough Properties in the F6 Recombinant Inbred Lines from a Bread Wheat Cross. Theoret. Appl. Genetics 1994, 88, 81–88. [Google Scholar] [CrossRef] [PubMed]
  82. Johnson, M.; Kumar, A.; Oladzad-Abbasabadi, A.; Salsman, E.; Aoun, M.; Manthey, F.A.; Elias, E.M. Association Mapping for 24 Traits Related to Protein Content, Gluten Strength, Color, Cooking, and Milling Quality Using Balanced and Unbalanced Data in Durum Wheat [Triticum Turgidum L. Var. Durum (Desf).]. Front. Genet. 2019, 10, 717. [Google Scholar] [CrossRef]
  83. Ahmadizadeh, M.; Valizadeh, M.; Shahbazy, H.; Zaefizadeh, M.; Habibpor, M. Morphological Diversity and Interrelationships Traits in Durum Wheat Landraces under Normal Irrigation and Drought Stress Conditions. Advances in Environmental Biology 2011, 5, 1934–1940. [Google Scholar]
  84. Sourour, A.; Chahine, K.; Youssef, T.; Olfa, S.; Hajer, S. Phenotypic Diversity of Tunisian Durum Wheat Landraces. African Crop Science Journal 2010, 18. [Google Scholar] [CrossRef]
  85. Panghal, A.; Chhikara, N.; Khatkar, B.S. Characterisation of Indian Wheat Varieties for Chapatti (Flat Bread) Quality. Journal of the Saudi Society of Agricultural Sciences 2019, 18, 107–111. [Google Scholar] [CrossRef]
  86. Hailu, F.; Merker, A.; Singh, H.; Belay, G.; Johansson, E. Multivariate Analysis of Diversity of Tetraploid Wheat Germplasm from Ethiopia. Genetic Resources and Crop Evolution 2006, 53, 1089–1098. [Google Scholar] [CrossRef]
  87. International Board for Plant Genetic Resources (IBPGR) Descriptors for Wheat (Revised); International Board for Plant Genetic Resources, 1985; p. 12 p.
  88. AOAC Association of Official Analytical Chemists Official Methods of Analysis of AOAC International; 20th ed.; AOAC International: Benjamin Franklin Station, Washington, DC, 2016.
  89. International Organization for Standardization Cereals and Cereal Products—Determination of Moisture Content (Reference Method) 2009.
  90. International Organization for Standardization Cereals and Cereal Products—Determination of the Gluten Content—Part 2: Spectrometric Method 2015.
  91. American Association of Cereal Chemists International (AACC) Approved Methods of the American Association of Cereal Chemists, 10th Ed.; AACC International.; St. Paul, MN, 2000.
  92. Santra, M.; Rao, V.S.; Tamhankar, S.A. Modification of AACC Procedure for Measuring β-Carotene in Early Generation Durum Wheat. Cereal Chem 2003, 80, 130–131. [Google Scholar] [CrossRef]
Figure 1. Variability of key agro-morphological parameters among different durum wheat typologies. (a) Awn length (AWL); (b) Spike length (SL); (c) Number of spikelets per spike (SPS); (d) Number of grains per spike (NGS); (e) Thousand- kernel weight (TKW); (f) Grain yield (GY). EA: Elite accessions, IL: International lines, MV: Moroccan varieties; LD: Landraces.
Preprints 150444 g001
Figure 2. (a) Protein content (PC); (b) gluten content (GC); (c) bread-making strength (W); (d) gluten strength (SDS); (e) yellow pigment index (YI); EA: elite accessions, IL: international lines, MV: Moroccan varieties; LD: landraces.
Preprints 150444 g002
Figure 3. Correlogram illustrating the correlation coefficients among agro-morphological parameters of durum wheat. AWL: awn length; SL: spike length; SPS: number of spikelets per spike; GNS: number of grains per spike; TKW: thousand-kernel weight; GY: grain yield. Values are indicated as follows: *p ≤ 0.05, **p ≤ 0.01, ***p ≤ 0.001.
Preprints 150444 g003
Figure 4. Correlogram illustrating the correlation coefficients among quality parameters of durum wheat. PC: protein content; GC: gluten content; W: bread-making strength; SDS: gluten strength; yellow pigment index. Values are indicated as follows: *p ≤ 0.05, **p ≤ 0.01, ***p ≤ 0.001.
Preprints 150444 g004
Figure 5. Principal component analysis of agro-morphological (left) and Quality (right) parameters. AWL): awn length; (SL): spike length; (SPS): number of spikelets per spike; (GNS): number of grains per spike; (TKW): thousand- kernel weight; (GY): grain yield; PC: protein content; (GC): gluten content; (W) bread-making strength; (SDS): gluten strength; (YI): yellow pigment index.
Preprints 150444 g005
Figure 6. Experimental Site and Analysis Location.
Preprints 150444 g006
Figure 7. Experimental Site and Analysis Location.
Preprints 150444 g007
Table 1. Analysis of variance (ANOVA) based on germplasm type for agro-morphological parameters.
Source of Variation Parameters Df SS MS p-value
AWL 4 5.58 9.93 < 0.05*
SL 4 6.10 1.55 < 0.05*
Inter-group SPS 4 1.92 0.48 > 0.05 ns
GNS 4 379.35 97.13 > 0.05 ns
TKW 4 559.12 136.56 < 0.01**
GY 4 13.67 3.58 < 0.05*
Df: Degree freedom, SS: Sum of squares, MS: Mean square, no significant: P > 0.05, Significant: P < 0.05, Highly significant: P < 0.01, and very highly significant: P < 0.001. awn length (AWL), spike length (SL), number spiklets per spike, number of grains per spike (GNS), thousand-kernel weight, Grain yield (GY).
Table 2. Analysis of variance (ANOVA) based on germplasm type for quality parameters.
Source of Variation Parameters Df SS MS P
Inter-group PC 4 9.56 2.37 < 0.01**
GC 4 64.92 16.23 < 0.01**
W 4 12686.25 3174.06 > 0.05 ns
SDS 4 21.22 5.59 < 0.05*
YI 4 5.37 1.39 < 0.01**
Df: degree freedom, SS: Sum of squares, MS: Mean square, Significant: P < 0.05, Highly significant: P < 0.01, and very highly significant: P < 0.001. protein content (PC), gluten content (GC), bread-making strength, gluten strength (SDS), yellow pigment index (YI).
Disclaimer/Publisher’s Note: The statements, opinions and data contained in all publications are solely those of the individual author(s) and contributor(s) and not of MDPI and/or the editor(s). MDPI and/or the editor(s) disclaim responsibility for any injury to people or property resulting from any ideas, methods, instructions or products referred to in the content.
Copyright: This open access article is published under a Creative Commons CC BY 4.0 license, which permit the free download, distribution, and reuse, provided that the author and preprint are cited in any reuse.

Downloads

56

Views

47

Comments

0

Subscription

Notify me about updates to this article or when a peer-reviewed version is published.

Email

Prerpints.org logo

Preprints.org is a free preprint server supported by MDPI in Basel, Switzerland.

Subscribe

© 2025 MDPI (Basel, Switzerland) unless otherwise stated