
Submitted:
01 March 2025
Posted:
03 March 2025
You are already at the latest version
Abstract
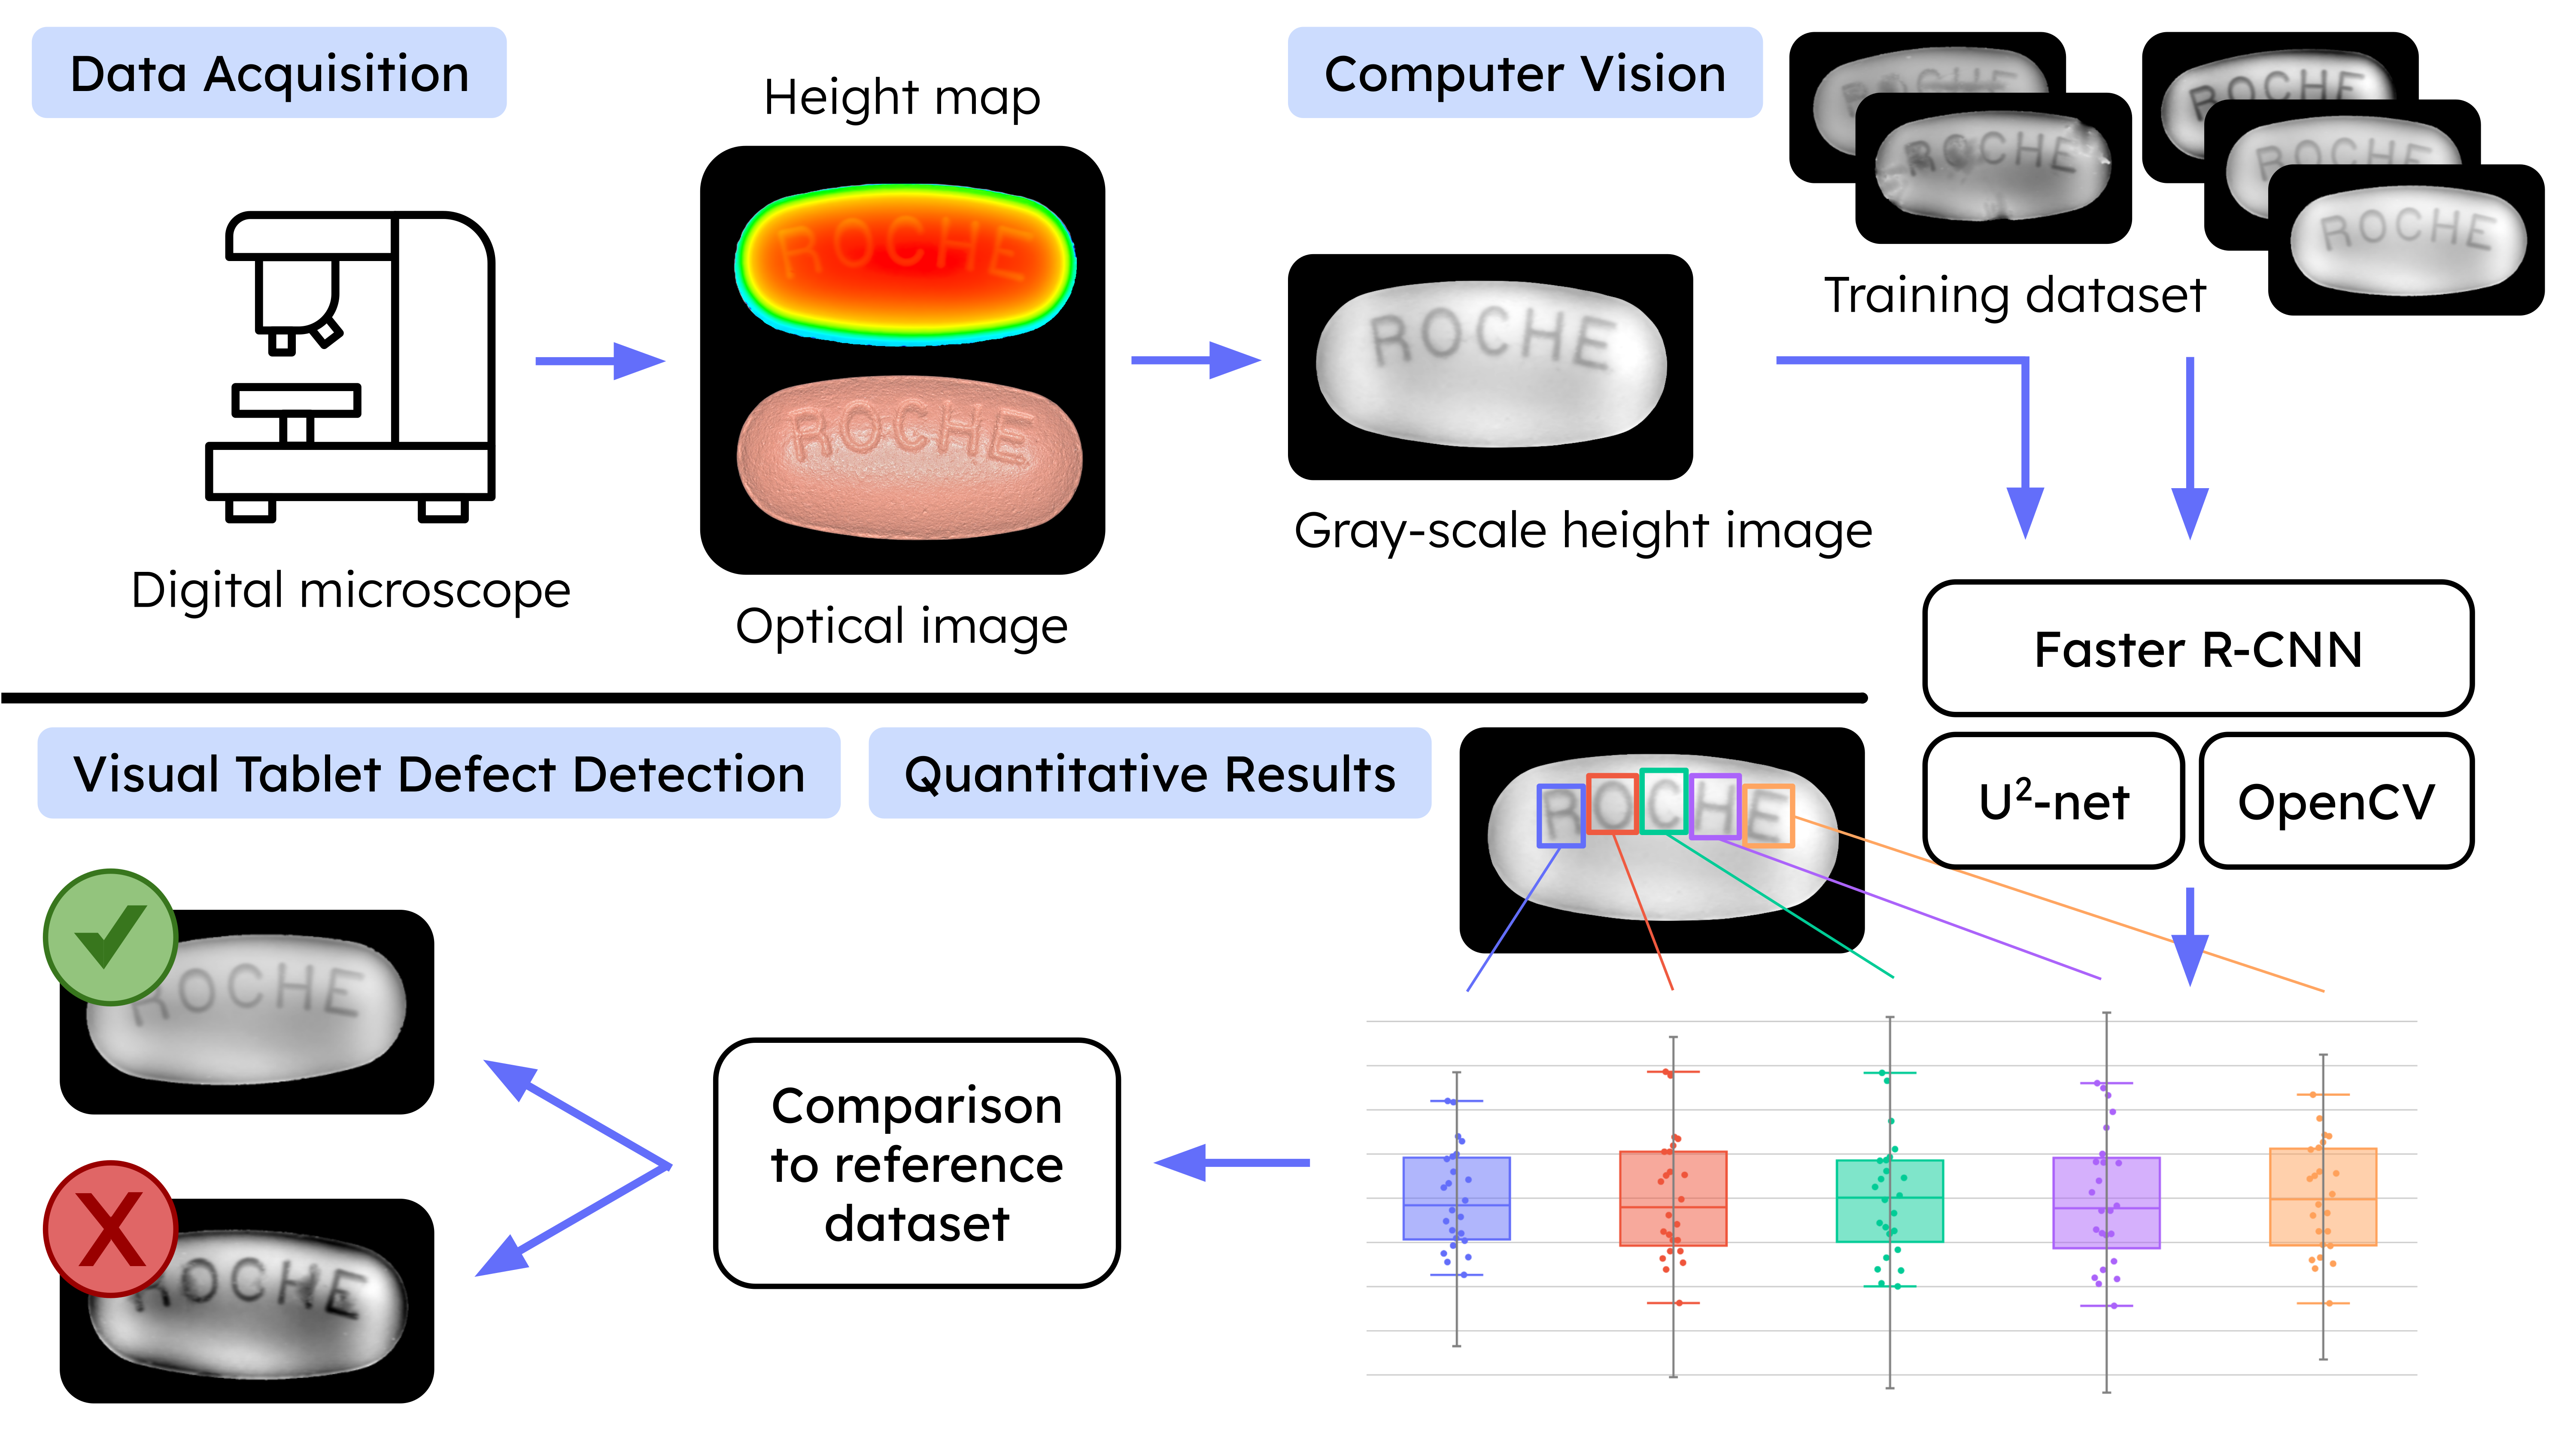
Tablet surface defects are typically controlled by visual inspection in pharmaceutical industry. This is an insufficient response variable for knowledge-based formulation and process development, and it results in a rather limited robustness of the control strategy. In this article, we present an analytical method for the quantitative characterization of visual tablet surface defects. The method involves analysis of the tablet surface by a digital microscope to obtain optical images and three-dimensional surface scans. Pre-processing procedures are applied for the simplification of the data to allow the detection of the imprint characters and tablet surface structures by a Faster R-CNN object detection model. Geometrical measured variables like perimeter and area were derived from the results of the object detection model and statistically analyzed for a selected number of tablets. The analysis allowed the development of product specific acceptance criteria by a small reference dataset, and the quantitative evaluation of sticking, picking, chipping and abrasion defects. The method showed high precision and sensitivity and demonstrated robust detection of visual tablet surface defects without false negative results. The image analysis was automated, and the developed algorithm can be operated by a simple routine on a standard computer in a few minutes. The method is suitable for industrial use and enables an advancement for industrial formulation and process development, while providing a novel opportunity for the quality control of visual tablet surface defects.
Keywords:
tablet visual inspection
; microscope surface scan
; debossing
; sticking and picking
; image analysis
; machine learning
; artificial intelligence
; quality control
1. Introduction
Tablets are one of the most common forms for medication on the market, including conventional immediate- and extended-release tablets, orally disintegrating tablets and chewable tablets [1,2]. This is mainly due to the convenience they represent for the patient and to the ease of development and manufacturing for the pharmaceutical industry. Other advantages like the small volumetric footprint and the stability of the solid dosage form are favorable features, especially in the context of self-medication. To help customers and professionals identify tablets over wide ranges of product lines; their shape, size, color, and imprints differ. This supports the prevention of medication errors by providing differentiation to the medicine [3,4]. Additionally, mechanical, stability and functional requirements make the formulation and process design choices crucial for pharmaceutical development.
The first step of tableting is to obtain a powder blend, by means of several techniques, depending on the active pharmaceutical ingredient and the excipients. Once this blend is obtained, the next step is to compress the blend with a multi-station rotary tablet press. At this stage, the tablets obtain their characteristic shape, size, and imprint; they are called tablet cores. Tablet cores are often film-coated to obtain the final product. Coating is mainly applied to adapt appearance but can also have additional functionalities, such as improvement of swallowability, palatability and smell, protection against oxidation and moisture, and control of dissolution. During these manufacturing processes, multiple defects can appear on the tablet’s surface.
The most frequent failure modes of the tablet cores are sticking and picking [5]. Sticking is a prevalent issue in formulation and process development, where the material adheres to the surfaces of manufacturing equipment, such as tablet press punches. This can result in tablets with rough surfaces or even undesirable indents on their surface, depending on the severity of the sticking. It may lead to inconsistent dosage forms as well as yield loss and waste. Additionally, if sticking occurs consecutively, it can jam the punch in the tablet press, resulting in continuously malformed tablets. Picking is more specific; it is a type of sticking that happens at the imprint characters. It refers to the issue where small amounts of formulation material adhere to the embossing of the characters on the tablet punches. Especially islands are concerned by this issue, for example the central part of an O character. Other failure modes include chipping and abrasion of the tablet core. Chipping occurs when a portion of the tablet’s side breaks off, while abrasion results in a rough surface. Both defects can arise from tablets falling and rubbing against, for example metallic surfaces. These issues differ from sticking and picking, which occur during the tableting process, whereas chipping and abrasion arise during further manufacturing and packaging. Examples of such failure modes can be seen in Figure 1. Visual tablet surface defects are a real threat to the confidence a patient gives to a medicine. Therefore, detecting these defects is crucial to ensure consistent quality. Most often, quality control is visually performed by a trained operator on a selected number of sample tablets per batch. This approach leads to multiple limitations. The main concern is the limited sample size for quality control, leading to a high probability of missing critical defects. Another concern is the qualitative assessment of such defects, i.e. each operator has its own appreciation for categorization whether a sample tablet does or doesn’t correspond to the reference tablet. This leads to instabilities in quality control and limited robustness of the control strategy. Additionally, the qualitative assessment makes it almost impossible to compare, learn and optimize the tablet formulation and manufacturing process during development.
With the rapid evolutions in the field of automated image processing, more interest is given into these solutions for quality control [6,7,8]. Multiple companies are already offering analytical machines enabling the detection of tablet surface defects, as for example Cognex Corp., Pharma Technology s.a. and Sensum d.o.o. [9,10,11]. These machines utilize computer vision and machine learning approaches for the analysis of tablet surfaces and are designed for large batches and high throughput production. Several studies have explored defect detection through machine learning based image processing, primarily focusing on optical image classification [12,13,14]. These studies demonstrate the capability of machine learning to evaluate tablet surfaces, ranging from coating defect detection to counterfeit identification. Pathak et al. [14] used for instance a convolutional neural network for the detection of surface defects in film-coated tablets. The model demonstrated an accuracy of 99.6% for chipped tablets and 99.4% for broken tablets using 25,200 images of tablets for model training.
The motivation of this study stems from the limitations of the current industrial practices for the assessment of tablet surface defects and the corresponding challenges for formulation and process development. This study presents a simple and pragmatic knowledge-based approach for the quantitative characterization of visual tablet surface defects using optical tablet images and deterministic computer vision algorithm and object detection models. These object detection models are built upon advanced architectures that utilize convolutional neural networks as main building blocks. The algorithm seeks to automatically detect visual tablet surface defects such as sticking, picking, chipping, and abrasion by leveraging a small, product specific reference dataset and quantitatively evaluating results against product specific acceptance criteria.
2. Materials and Methods
2.1. Materials
Throughout the study, tablets of varying types were analyzed, encompassing two main shapes: oblong and round. Their size can vary from 3 to 20 mm. Their surfaces are more or less curved and on one of them they presents a debossing of multiple character. Often the characters are R, O, C, H, E since the tablets come from development batches. One can note that this ROCHE debossing is not always the same, depending on the punches, the font, font size and orientation are different. In some cases however, the characters are different, with numbers for example, to indicate the dosage. Additionally, some tablets are coated with a different colors.
The microscope used for this study is the Keyence VR-3200. The main feature of this microscope is to deliver two distinct measurements. The first acquisition is an optical image taken with a lens and the second measurement is a height/depth map of the surface. Together this leads to a reconstructed 3D image. The optical image can be taken with different magnification intensities (12x, 25x and 38x). It also offers the possibility to perform stitching to reconstruct a bigger image. However, the height mapping has a fixed precision in term of pixel density, which corresponds to the 12x magnification. Nevertheless, three different measurement modes can be used for the height mapping, which take more or less time and mostly affect the precision of the measurement on the pixel level. The focus is calibrated by the user for every new measurement and guaranties that the optical image is sharp and that the height mapping is in range. The last important parameter to consider is the luminosity for the height mapping, depending on the set luminosity, some places of the measurement window are overexposed or underexposed leading to loss of height information in these regions.
The software of the microscope used in this analysis is the Keyence VR-3000 G2 Series Software in version 2.5.0.116. The latter enables multiple data output possibilities. Although the software can perform complex analyses, automating the analysis workflow using integrated functions is not considered to maintain versatility. Hence, only the raw data from the measurements are retrieved, the optical image is saved in a RGB .png file format and the three-dimensional surface scan data (height map) in a .csv file format containing the matrix of all measurement points. The resolution of the two output is the same, namely 1024 × 768, with perfect spatial pixel to pixel correspondence. An example of the data output is shown in Figure 2. An important feature of this microscope is the possibility to make multiple measurements in one run and to automatically save all the results to a folder. This is done by programming an inspection routine for each stage position and combining them into one unique inspection file. Once this routine is generated all the measurement settings are fixed, including luminosity, height mapping mode, high dynamic range image acquisition.
From the raw data in Figure 2b it is noticeable that the height data presents a good description of the surface. Even in the low contrast representation using a heat-map, the debossing is recognizable. Given this output the assumption made at this stage was to choose the height data as primary source for identifying defects like picking, sticking, chipping or abrasion. Undoubtedly, the optical image presented in Figure 2a offers a highly detailed representation of the surface. Notwithstanding, the characterization of structures in an optical image is inherently challenging due to the influence of parameters such as focus, color contrast, and shadowing on the magnified image of the tablet.
2.2. Background Suppression
First of all, one needs to isolate the main object of interest, namely the tablet. This means there needs to be a automatic way to separate the tablet from the background, and this on the two measurement outputs, the optical image and the height map. Two challenges emerged from this problematic. The first concerns the geometry of the tablet, since between different projects, the size and form of the tablets vary enormously. Furthermore, the tablets are not always perfectly placed in the middle of the measurement window. The second issue is that, depending on the tablet’s maximal height, the microscope can or can not measure the height of the background, leading to NaN (Not a Number) values around the tablet. Considering these instabilities, a mathematical solution like a height threshold or a geometric mask are not ideal. Moreover, the optical image seems to be more attractive to perform this differentiation since it has always a defined value for each pixel and one can achieve a high contrast with the background depending on the color of the holder. This led to investigate more sophisticated methods for automatic background suppression. In modern image processing software this feature is an important and very used tool. In the OpenCV library a lot of traditional algorithms are already integrated to perform this task. They use for example Local SVD binary patterns or Gaussian-mixture segmentation to differentiate between foreground and background. However, after testing these algorithms, their performance was found to be low. They suffered from a high sensibility to changes, like color or shape of the tablets. Ultimately this led to consider state-of-the-art solutions using pre-trained convolutionnal neural networks. The retained solution is U2-Net which is an open-source model for background subtraction [15]. It is featured in commercial image processing softwares like Pixelmator Pro. Additionally this study is developed fully in python which makes it easy to implement in the framework of this work. Once the binary mask is obtained with the U2-Net model, it can be applied on both of the two measurement outputs of the microscope. This is possible thanks to the fact that each pixel has a one-to-one spatial correspondence.
2.3. Tablet Support
The proposed workflow requires the capability to measure multiple tablets in an automated process. Therefore, a custom holder for multiple tablets has to be made. Other constraints had also to be taken into account while designing this support holder. Namely, to make the background subtraction as efficient as possible the holder has to exhibit a color contrast with the tablets. Also, the holder should be non-reflective since the height measurement procedure involves a surface scan with alternating light and dark spots. Finally, the holder should be able to host 24 tablets, which is the maximum simultaneous measurements the microscope can do, while fitting on the motorized microscope stage. Different plastic materials with different colors were tested to asses which one of them gave the best results. In the experimental stage tablets are mostly white or yellow, in rare cases they are red due to coating. Therefore, the color of the holder should be black for maximum contrast. The best results were given by the black and mat Onyx plastic from Markforged. This material is a Nylon plastic reinforced with carbon microfibers. The interesting feature of this material, with respect to this work, is the small reflectivity and mat finish, due to the carbon fibers. Additionally, different holders had to be printed to accept diverse tablet geometries. The round tablets can fit inside a universal sized holder. However, the oblong tablets are more likely to sit tilted inside the holder, especially, when they are too small. This led to the need of distinct sizes for oblong shaped tablets.
2.4. Flattening and Normalization
The processing in this section is only applied to the height map data. The goal is to simplify the data and to translate it to an actual interpretable image. Once the background is subtracted or masked, one is left with a data matrix representing the surface of the tablet. This data has to be normalized to enable efficient comparison and image conversion. Unfortunately, this step will cause loss of the exact height information since the real values will be transformed. Anyway, the most interesting part is the contrast, that is, the height difference between the different surface structures, so this loss of information is not significant. The subsequent transformation is the flattening of the surface. To achieve optimal contrast for the surface structure, especially given the tablet’s strong curvature, the surface is fitted using a degree 4 polynomial function. This transformation is implemented using the Python library scikit-learn (version 1.6.0). The resulting fit will then be subtracted to the original height to obtain the flattened surface. Afterwards, a second normalization is performed; the minimum height is set to the value 0 and the maximum to the value of 255. A linear operation maps all the remaining heights to the 254 remaining values. This corresponds to an 8-bit encoding as found in a grayscale image, enabling therefore to describe the height mapping data as an image representing the flattened surface of the tablet. This transformation is necessary since the common object detection neural networks need mandatorily images to work with. The second aspect is the data size reduction; the height data as a .csv file takes around 8 MB of storage where as the flattened gray-scale .png file takes only 80 KB. Moreover, the microscope outputs the exact pixel to length ratio that is needed to reconstruct the surface areas and lengths on the image. One potential drawback of this encoding is the small number of levels, one could think about encoding the image in 16-bit, ranging to 65536 shades of gray. However, after testing, this idea was abandoned due to lack of support from PyTorch (version 2.5.1) and OpenCV (version 4.10.0.84) for such image encodings.
2.5. Segmentation and Classification
Once this flattening is performed, the surface will count multiple features, such as letters, numbers and other defects. This leads to the core of the algorithm: object detection. During this step, characters and possible defects on the images are identified. The precise output of this step consists of a bounding box, a label and a detection score ranging from 0 to 1. The bounding box is a collection of pixel coordinates on the image, delineating a specific region. The label associated with the bounding box indicates the nature of the detected object, in this case the corresponding defect or character, and the detection score serves as a quantitative measure of confidence in the identification. Within the scope of this study, the analyzed tablet are always debossed. This approach allows to evaluate, during the development stage, whether picking is likely to occur if the tablet progresses to the production phase. Therefore, the algorithm should be able to detect the letters and numbers individually, to have the possibility to asses the quality of each structure independently over multiple tablets. For such a problem statement, the first algorithm class to come in mind is Optical Character Recognition (OCR) algorithms, like Tesseract OCR [16]. However, they suffer from a great weakness; they are really bad at detecting rotated characters. This is a major drawback since especially for round tablets, controlling the orientation when measuring is really difficult. Moreover, those algorithms are not able to detect defects like sticking, chipping and abrasion. Considering these difficulties the chosen solution is to train a custom trained object detection model to fulfill the desired application. This approach is based on machine learning and uses Convolutional Neural Networks (CNNs) to perform the object detection. Within this framework two task can be distinguished. The first one is segmentation, this task refers to the operation of detecting regions of interest in the image. The second task necessary for object detection is classification, where the regions detected previously are associated with a label corresponding to the most probable class of objects depending on the training data.
A variety of state-of-the-art models are available to do object detection on images, the three primary models used today are YOLO (You Only Look Once), SSD (Single Shot Detector) and Faster R-CNN . Each model features a unique architecture, offering different trade-offs in terms of complexity and accuracy. However, they all share the same foundational building block, which are CNNs. The latest version of YOLO is the most efficient model, it exhibits an impressive accuracy while running sufficiently fast to achieve real-time detection [17]. SSD and YOLO are both considered real-time detection networks, their speed is mainly due to the fact that they don’t separate segmentation and classification in two distinct networks. Regarding accuracy Faster R-CNN and YOLO are comparable. However, the machine learning frameworks used in this project, namely torchvision (version 0.20.1) and PyTorch (version 2.5.1) feature only the possibility to choose between SSD300 (300 stands for the input image size, 300x300) and Faster R-CNN. We selected Faster R-CNN model with a ResNet-50 backbone considering accuracy and integration into the algorithm. This architecture is based on the work of Ren et al. [18]. In this model, segmentation and classification are separated.
To train such a network, the first step is to adapt the size of the last layer, replacing the classifier head of the network to match the number of output neurons with the number of different output classes expected by the training data. Additionally, it is important to have a pre-trained network with a big image dataset as the large amount of parameters require large amounts of training data. In this case the COCO (Common Objects in COntext) image dataset, which counts 330K images and 1.5 million object instances, was used. This approach enables to train the network on a small number of examples while still having a very accurate detection. The next step is to full-parameter fine-tune the model on the new dataset. This means no neuronal layer is frozen and the model is allowed to adapt every one of its weights to better match the training data. This is especially important for the desired application since the training data is very different from the COCO image database. The training dataset was created by measuring a large amount of different tablets and to annotate the obtained gray-scale images. Here, annotating means the procedure of drawing bounding boxes on the image and labeling them manually. The key to have an accurate detection is to have high variety inside the dataset. This variety relies in the shapes, sizes, characters, coatings of the tablets as well as their orientation during measurements. To enhance the number of orientation and sizes it is possible to rotated and zoom the images after the measurement. The important part being to make sure that the bounding box is still valid after the transformation. In computer vision this procedure is called data augmentation. Additionally, some tablets were artificially degraded to obtain defect examples for the training. Regarding the labels, i.e. the different classes of objects, the most common debossing in the tablet development process is ROCHE or RE. Due to a high number of examples for these letters it was possible to classify them into two categories good or bad. This classification can help to identify letters that don’t correspond to the expected shape, and therefore represent an additional detection layer for picking. For example if the central island of the R is missing or a part of the E is not debossed properly. For the additional letters and numbers, the classification is independent from defects, meaning that they can only be detected as one class even if they present a non-conformal shape. This is mainly due to lack of example data. Finally, a defect class is created for every strange structure, such as sticking, chipping or abrasion defects observed on the training data. This class is not as well defined as the other classes since two defects are rarely identical. However, by broadening the definition for this specific class one expects the model to use it as an unknown structure classifier.
2.6. Quantification
Until now, the algorithm can identify the letters R, O, C, H, E and labels them as good or bad depending on the training data. However, this is not a true acceptance criterion; it has an inherent flaw, as it does not explain why the model chooses one class over another. To enhance the sensitivity of the analysis, the model should be fine-tuned with a new training set for each project. This dataset should include only one type of tablet and account for defective tablets as well. Moreover, this is only a discussion for ROCHE debossings the other characters are detected but not evaluated quality wise. To address this issue the python library OpenCV (version 4.10.0.84) will be used. The goal is to obtain quantities out of the previously detected characters. Since the object detection model indicates the coordinates of the bounding boxes as output, one could imagine a second algorithm that will extract the area of every character as well as the perimeter of its contour. This is solved by temporarily cropping the image and to consider only one bounding box at a time. Afterwards, one applies a Gaussian adaptive threshold to obtain a binary image of the character. This method is similar to a low pass filter for frequencies as it neglects slow changing pixels and thus filters out noise to only keep the character. Afterwards, a contour detection algorithm is applied. This function is already integrated into OpenCV and is based on the work of Suzuki and Be [19]. One examples of this procedure can be seen in Figure 3. The contour detection algorithm generates a hierarchy tree which allows to identify the confinement relationship between the different contours.
Additionally, it provides an option to extract the area and the perimeter of a given contour in number of pixels. To obtain the true character area, if an internal contour is detected, its area will be subtracted from the external contour area. Regarding the perimeter of the character, the operation is an addition instead of a subtraction.To obtain the character surface area and the character perimeter, one needs to multiply the precedent numbers by the pixel to length ratio. This value is given by the microscope and depends on the magnification. For the used magnification, namely 12x, the length of one pixel corresponds to 23.505 m.
Finally, all the external contours of the characters are drawn on the gray-scale image. The detected label and the calculated area are displayed next to the bounding box for easy comparison. The final result for one tablet can be seen in Figure 4b. Additionally to the letters this contour detection is also performed on the exterior border of the tablet. This enables to also have information about the overall size of the tablet. The tablet perimeter is obtained via this method on the gray-scale image. However, the tablet area is found to be more reliably measured on the optical image after thresholding. An example can be found in Figure 4a.
2.7. Tolerance Interval
2.7.1. Tolerance Interval for Tablet Characters
For every measured tablet one obtains the area and perimeter for each detected character. Hence, by performing a measurement on multiple tablets of the same kind, one is able to do a statistical analysis on the obtained values. The common way to deal with such data implies the use of a Tolerance Interval (TI). The utility of the TI lies in its ability to assert that at least a specified proportion p of the population, with a certain degree of confidence , resides within the given interval. This type of interval is particularly useful in manufacturing contexts, where a small sample must define the acceptance criteria for a virtually infinite number of future units. The critical distinction between a confidence interval and a TI pertains to the quantity that the interval bounds. In the case of a confidence interval, the objective is to estimate the bounds of the parameters of a given distribution, namely the mean and the standard deviation, based on a random sample. Conversely, a TI is used to bound a specified portion of future measurements. Additionally, a third type of interval exists, known as the prediction interval, which is differentiated from the TI by its purpose of setting predictions for a specific number of future samples. For further discussion it is critical to assume the data to follow a normal distribution. This assumption leads to a TI described by Equation 1 where is the sample mean, is the sample standard deviation and is the two-side k-factor [20]. With x being a new data-point.
Multiple approximations exists to calculate the k-factor, the most known and used one was derived by Howe [21], and is given by Equation 2, where is the critical value of the standard normal distribution and is the critical value of the chi-square distribution.
The result of this statistical analysis can be summarized on a chart containing box-plots for the data and the TI for each character. It is important to note that, to obtain the TI, the proportion p and the confidence need to be set by the user. An example of this chart is given in Figure 5, which is a result of an analysis performed on 24 identical oblong tablets.
On these box plots, the area is zero centered to better compare the different intervals. To avoid loss of information, the legend indicates the mean of the data-points, their standard deviation and also their number, i.e. the number of detected character. Otherwise, the box plots follow standard conventions. They represent the minimum, first quartile (Q1), median, third quartile (Q3), and maximum of a dataset. They use a box to indicate the interquartile range and "whiskers" to show the range outside the quartiles, with any outliers typically plotted as individual points. In the example of Figure 5, the area of the characters are very consistent over the multiple tablets. For each character the standard deviation is less than 0.015. Also, all characters have been detected 24 times meaning there seems to be no tablet with a picking defect. Even if some outliers to the box plots exist, all the area data-points are included in the TIs. Additionally, no defect was detected by the model meaning absence of sticking. Similar box plots are realized for the perimeter of each character. This facilitates more accurate picking detection by allowing for the control and comparison of each character’s perimeter and area against the different TIs. This can be further motivated by the fact that certain character with picking could present the same area as the standard one by having a slightly different shape.
2.7.2. Tolerance Interval for Tablet Body
The previous TIs are only meant to asses if picking is detected. For sticking, the algorithm fully relies on the capacity of the model to detect anomalies on the surface. However, for chipping, in addition to the detection of the model, other methods can be used to detect these defects. Based on the same principles as for the contour detection of characters, it is possible to make a contour detection of the tablet itself. This procedure can be done on the height gray-scale image as well as the optical image. Similar to the characteristic attributes for the character, this method extracts the area and perimeter of the entire tablet for both images. To ensure optimal stability in measurement accuracy, the selected characteristic attributes for further computation are the tablet area from the optical image and the tablet perimeter from the height gray-scale image. Additional TIs will then be computed for these attributes to assess the occurrence of chipping on the tablet, see Figure 6.
2.8. Process Flowchart
To summarize, the proposed algorithm recognizes characters on the surface of the tablet, while providing the area and perimeter of the latter, in order to identify picking. The tablet perimeter and tablet area are also extracted by means of contour detection, in order to identify chipping. Additionally, if an anomaly is detected on the surface, it will likely be classified as a defect by the object detection model. This is designed to identify the presence of sticking, chipping and abrasion. Finally, specifically for the R, O, C, H, E characters, the object detection model classifies them as good or bad depending on the examples provided during training. All these characteristic attributes can now be compiled together to obtain a categorization for the tablet, either ’Good’ or ’Suspicious’. The tablet is considered ’Suspicious’ when one or more characteristic attributes are not included in the TIs. Furthermore, the tablet is also considered ’Suspicious’ if the object detection model identifies a defect or any bad character. This final logic component is technically an OR gate, which will return ’Suspicious’ when at least one of the underlying algorithms is detecting an anomaly. The process flowchart for the proposed algorithm in operating mode can be found in Figure 7. Note that the flowchart is different when creating a reference measurement since the tablets are chosen to be visually pre-classified as ’Good’ by the operator. Therefore, the algorithm just needs to calculate the TIs for the different characteristic attributes.
3. Results
3.1. Precision
In order to further validate the results, it is important to verify the precision of the measurement in the acquisition stage. The procedure for this experiment is to perform two identical measurements on the microscope, meaning that no tablet is replaced or moved in between acquisitions. By comparing each individual data point for both measurements it is possible to conclude on the precision of the method. This is especially important to validate the use of TIs. To display the relationship between individual data points, multiple parity plots are generated. Each parity plot concerns one specific characteristic attribute. Figure 8 presents the parity plots for the character area’s. It shows a high consistency between the two measurements since nearly all the data points are on the diagonal representing the ideal parity. Notably, the perimeter of the characters is prone to more variability between the two measurements, as showed in Figure 9. This observation can be confirmed by the tablet area’s and tablet perimeter’s showed in Figure 10. To better quantify this variability is it possible to calculate the Normalized Root Mean Square Error (NRMSE) for each characteristic attribute; the values are shown in Table 1. The NRMSE value is 2 to 5 times larger for perimeter than for area validating the advantage of area over perimeter. Nevertheless, both attributes are important for detecting picking or chipping defects since the defects are random.
This precision evaluation demonstrated that the measured data exhibit sufficient consistency, allowing for confident use in evaluating the characteristic attributes of the tablet. Especially the measured area is very precise between the two measurements.
3.2. Case Studies
3.2.1. Defect Identification
To verify the capability to detect defects, the algorithm is faced with a new group of 24 tablet cores presenting defects. Every one of these tablets originate from the same batch but exhibit a high disparity in quality. Around half of the tablets present slight picking with one tablet out of four presenting a strong picking defect. They are not subject to chipping or sticking but some surfaces present abrasion. This will allow for an assessment of whether the area and perimeter detection on the characters, along with the calculated TI, is effectively identifying picking and to what extent. Furthermore, this procedure will also test the model’s sensitivity, as these tablets are not part of the training dataset for the Faster R-CNN object detection model. It should be noted that, in this case study, the TI is calculated over the current measurement and not a reference measurement.
The resulting box plots for this analysis are given in Figure 11. First of all one can see that there is a large difference in TI size for the different characters. This behavior can also be seen by the standard deviation that is two times bigger for O, C and H than for R and E. Since O, C and H are placed at the center of the debossing, it appears that the preferred picking location, on these tablets, seems to be in the center of the debossing rather than on the sides. In addition, two outliers to the TI can be identified. The O outlier corresponds to the tablet whose detection output is given in Figure 12a where as the C outlier is given in Figure 12b. Since these are ROCHE debossings, the model evaluate also their quality based on the training data. Notably, the two outlier were already detected as bad by the Faster R-CNN model. Furthermore, the model was able to identify additional picking on other characters even if the TI wasn’t exceeded. Such a behavior can be seen in Figure 12c, where every character’s area and perimeter is inside the TI even if the tablet presents picking which was detected by the model. This leads to the conclusion that the Faster R-CNN model is more sensitive to picking defects than the calculated TIs with the chosen parameter and . It relates to the fact that the model identifies the shape of the character and not just the area or the perimeter. Combining these two approaches can either confirm the results or extend them to avoid missing on picking events. Furthermore, for other characters than ROCHE it is important to have the acceptance criterion based on the TI since the training data wasn’t sufficient to make a distinction between good or bad characters. However, this can be easily implemented when an appropriate number of tablets with other characters is available.
The algorithm should also be unsensitive to tablets that are not presenting any picking, this can be verified in Figure 12d. The latter shows the detection output for a tablet corresponding to a good standard, where no area or perimeter exceeds the TI, neither does the Faster R-CNN model evaluate any character as bad. The outcome of this case study has shown that the algorithm is efficient to identify visual picking defects. They are identified either through the calculated TIs or by the Faster R-CNN object detection model. Each method offers distinct advantages, and when used synergistically, they can enhance the accuracy of defect identification.
3.2.2. Inter-Batch Assessment
In operating mode, the algorithm calculates a TI based on previous measurements to compare the current data with a reference. This reference should consist of at least 20 tablets, selected by the operator and visually pre-categorized as ’Good’, to ensure a sufficiently large reference size for the TIs to achieve reliable results. An example of the zero centered area with a reference tolerance interval is given in Figure 13. Notably, there is no outlier in this example meaning that the reference TI captures correctly the visually identified defects. However, this is an isolated experiment on a unique attribute, i.e. the character area. To test the efficiency of the proposed method for comparing multiple datasets using all acceptance criteria based on TIs, an experiment involving three batches is conducted. Each batch will serve as a reference not only for the other two batches but also for itself. The three batches are visually controlled to identify real visual defects, in order to compare the algorithm defect identification with the reality. The visual inspection identified picking defects in two out of the three batches, with no chipping detected. This leads to four possible classification displayed in a so-called confusion matrix. True positive meaning there is a visual defect on one tablet and it was correctly detected by the TIs. True negative meaning the tablets are visually ’Good’ and classified as such by the algorithm. False negative meaning a visual defect was undetected by the TIs. And finally false positive, when a defect is detected that don’t exist. Figure 14a presents the result of the verification procedure using a TI calculated at and . The first notable observation from Figure 14a is that real defects in these batches are consistently detected by the TIs, also called as true positives. However, there are a certain number of false positives detected in batches 1 and 3. The origin of these false positives in batch 1 is related to the acceptance criteria for chipping, namely the TIs of the tablet area and tablet perimeter.
In batch 3, the false positives are attributed to the picking acceptance criteria, namely the TIs of the character area and character perimeter. Furthermore, it is possible to make the same confusion matrix and changing the population proportion p to instead of , while keeping the confidence at . This will increase the size of the interval since theoretically a larger part of the population should be included. The resulting confusion matrix is presented in Figure 14b. The two confusion matrices exhibit the same number of True Positives, meaning that both TI parameters are reliable to detect picking events but the number of false positives is notably lower for . Hence, the preferred population parameter p is in order to limit the number of false positives. However, this choice is limited to the investigated tablet type because the scatter of the data points maybe different for other types of tablet with varying shape, size and characters. Nevertheless, the main takeaway of this case study is the successful identification of all visual defects present on the tablets, regardless of the reference batch or the selected interval parameters. While too many false positives are not ideal, the suspicious tablets will undergo a visual inspection where the operator can make the final decision. Importantly, no false negative tablets were detected, the latter are more problematic, as they are not intended to undergo a second inspection. It is possible to conclude that the calculated reference TIs exhibit high sensitivity in detecting picking defects. By coupling these acceptance criteria with the Faster R-CNN model classification for picking on ROCHE characters, a high level of confidence can be placed in the method’s picking detection.
4. Conclusions
In this study, a new measurement workflow and algorithm was developed to detect and quantify visual defects on tablets, specifically targeting sticking, picking, chipping, and abrasion defects. The algorithm uses the microscope’s ability to generate an optical image and a three-dimensional surface scan of the tablet. An inspection routine on the microscope software enabled us to automate the data acquisition for up to 24 tablets per run. Afterwards, the simplification of the output data of the microscope was done by using different procedures, involving a polynomial surface fit and a deep neural network for background subtraction. This enabled to generate a suitable input for a Faster R-CNN object detection model whose purpose is to detect characters and defects on the tablet’s surface. The model was one-time trained on a dataset of 608 images of tablet cores and film-coated tablets with different shapes, sizes, colors, orientations, and debossing’s. The model was able to detect the imprint characters as well as sticking, picking, chipping and abrasion with high sensitivity, even if they were rotated. Furthermore, the object detection model was then combined with a statistical analysis to create additional quantification of the characters for picking by means of measuring the character area and character perimeter. The same procedure is also applied to the tablet surface area and tablet surface perimeter in order to detect chipping defects. Statistical analysis enabled us to calculate Tolerance Intervals (TIs) on the different characteristic attributes of the tablets. These TIs combined with the Faster R-CNN object detection model set multiple acceptance criteria for tablets which are then applied to categorize as ‘Good’ or ‘Suspicious’. The method was evaluated and showed a high precision between two identical measurements. The algorithm was then evaluated on a new set of tablets containing some tablets with visually detectable defects and on an inter-batch assessment experiment. The results showed that the algorithm is able to detect sticking, picking, chipping and abrasion with a high sensitivity. The algorithm was also able to compare multiple datasets using TIs and to detect visual defects in a new batch of tablets without false negative results; demonstrating its suitability for comparison and quantitative evaluation of tablets from a new batch with data obtained from a reference batch. The algorithm was optimized for the operation by a simple routine with user interface accessible through a web browser. The resulting software is able to run on a standard computer with the ability to evaluate and report results of one run in less than two minutes. These characteristics and the flexibility to analyze small and large sample sizes, enables the industrial applicability of the workflow and algorithm for knowledge-based formulation and process development as well as for quality control with high robustness of the control strategy.
Author Contributions
Conceptualization, E.F., D.K., A.H., J.T. and M.J.; methodology, E.F. and M.J.; formal analysis, E.F.; investigation, E.F. and M.J.; data curation, E.F.; writing—original draft preparation, E.F. and M.J.; writing—review and editing, E.F., D.K., A.H., J.T. and M.J.; visualization, E.F.; super-vision, D.K, A.H., J.T. and M.J. All authors have read and agreed to the published version of the manuscript.
Funding
This research received no external funding.
Institutional Review Board Statement
Not applicable.
Informed Consent Statement
Not applicable.
Data Availability Statement
Data beyond the information within the article is unavailable due to confidentiality restrictions.
Acknowledgments
The authors would like to express their gratitude for experimental support to Thomas Buser, Matthias Marquardt, Carsten Winzenburg, Jürgen Hoerth, Patrice Buess, and for statistical support to Dr. Janine Burren, all associated with F. Hoffmann-La Roche Ltd.
Conflicts of Interest
All authors are the employees from F. Hoffmann-La Roche Ltd.
References
- Qiu, Y.; Chen, Y.; Zhang, G.G.Z.; Liu, L.; Porter, W. Developing Solid Oral Dosage Forms: Pharmaceutical Theory and Practice - 2nd edition; Academic Press, 2016.
- Zhong, H.; Chan, G.; Hu, Y.; Hu, H.; Ouyang, D. A Comprehensive Map of FDA-Approved Pharmaceutical Products. Pharmaceutics 2018, 10, 263. [Google Scholar] [CrossRef] [PubMed]
- Pekari, K.; Fürst, T.; Gössl, R.; Dudhedia, M.S.; Segretario, J.; Sommer, F.; Watson, P. The Score Card Approach: A First Step Toward an Evidence-based Differentiation Assessment for Tablets. Therapeutic Innovation & Regulatory Science 2016, 50, 204–212. [Google Scholar] [CrossRef]
- Research, C.f.D.E.a. Safety Considerations for Product Design to Minimize Medication Errors Guidance for Industry, 2016. Food and Drug Administration, Center for Drug Evaluation and Research.
- Chattoraj, S.; Daugherity, P.; McDermott, T.; Olsofsky, A.; Roth, W.J.; Tobyn, M. Sticking and Picking in Pharmaceutical Tablet Compression: An IQ Consortium Review. Journal of Pharmaceutical Sciences 2018, 107, 2267–2282. [Google Scholar] [CrossRef] [PubMed]
- Špiclin, Z.; Bukovec, M.; Pernuš, F.; Likar, B. Image registration for visual inspection of imprinted pharmaceutical tablets. Machine Vision and Applications 2011, 22, 197–206. [Google Scholar] [CrossRef]
- Barimani, S.; Šibanc, R.; Tomaževič, D.; Meier, R.; Kleinebudde, P. 100% visual inspection of tablets produced with continuous direct compression and coating. International Journal of Pharmaceutics 2022, 614, 121465. [Google Scholar] [CrossRef] [PubMed]
- Podrekar, G.; Tomaževič, D.; Likar, B.; Usenik, P. Model based visual inspection of pharmaceutical tablets with photometric stereo. In Proceedings of the 2017 Fifteenth IAPR International Conference on Machine Vision Applications (MVA), Nagoya, Japan; 2017. [Google Scholar] [CrossRef]
- Pharmatec - Tablet & Capsule Visual Inspection System. Available online: https://pharmatec.be/products/t-cvis-nsr-tablet-capsule-visual-inspection-system/. (accessed on day month year).
- Sensum - Computer Vision Systems. Available online: https://www.sensum.eu/. (accessed on day month year).
- Cognex - Machine Vision and Barcode Readers. Available online: https://www.cognex.com/. (accessed on day month year).
- Jung, C.R.; Ortiz, R.S.; Limberger, R.; Mayorga, P. A new methodology for detection of counterfeit Viagra® and Cialis® tablets by image processing and statistical analysis. Forensic Science International 2012, 216, 92–96. [Google Scholar] [CrossRef] [PubMed]
- Hirschberg, C.; Edinger, M.; Holmfred, E.; Rantanen, J.; Boetker, J. Image-Based Artificial Intelligence Methods for Product Control of Tablet Coating Quality. Pharmaceutics 2020, 12, 877. [Google Scholar] [CrossRef] [PubMed]
- Pathak, K.A.; Kafle, P.; Vikram, A. Deep learning-based defect detection in film-coated tablets using a convolutional neural network. International Journal of Pharmaceutics 2025, 671, 125220. [Google Scholar] [CrossRef] [PubMed]
- Qin, X.; Zhang, Z.; Huang, C.; Dehghan, M.; Zaiane, O.R.; Jagersand, M. U$⌃2$-Net: Going Deeper with Nested U-Structure for Salient Object Detection, 2022. arXiv:2005. 0900. [Google Scholar] [CrossRef]
- Smith, R. An Overview of the Tesseract OCR Engine. In Proceedings of the Ninth International Conference on Document Analysis and Recognition (ICDAR 2007), Vol. 2. 2007. [Google Scholar] [CrossRef]
- Bhavya Sree, B.; Yashwanth Bharadwaj, V.; Neelima, N. An Inter-Comparative Survey on State-of-the-Art Detectors—R-CNN, YOLO, and SSD. In Proceedings of the Intelligent Manufacturing and Energy Sustainability; Reddy, A.; Marla, D.; Favorskaya, M.N.; Satapathy, S.C., Eds., Singapore; 2021. [Google Scholar] [CrossRef]
- Ren, S.; He, K.; Girshick, R.; Sun, J. Faster R-CNN: Towards Real-Time Object Detection with Region Proposal Networks, 2016. arXiv:1506. 0149. [Google Scholar] [CrossRef]
- Suzuki, S.; Be, K. Topological structural analysis of digitized binary images by border following. Computer Vision, Graphics, and Image Processing 1985, 30, 32–46. [Google Scholar] [CrossRef]
- Witkovský, V. On the Exact Two-Sided Tolerance Intervals for Univariate Normal Distribution and Linear Regression. Austrian Journal of Statistics 2014, 43, 279–292. [Google Scholar] [CrossRef]
- Howe, W.G. Two-Sided Tolerance Limits for Normal Populations—Some Improvements. Journal of the American Statistical Association 1969, 64, 610–620. [Google Scholar] [CrossRef]
Figure 1.
Optical microscope images illustrating common tablet manufacturing defects. The concerned areas are indicated by the blue rectangle. (a) Chipping: Loss of material from the tablet edges. (b) Picking: defect related to the debossing. (c) Sticking or Abrasion: punch related defects or indented by transport and handling.
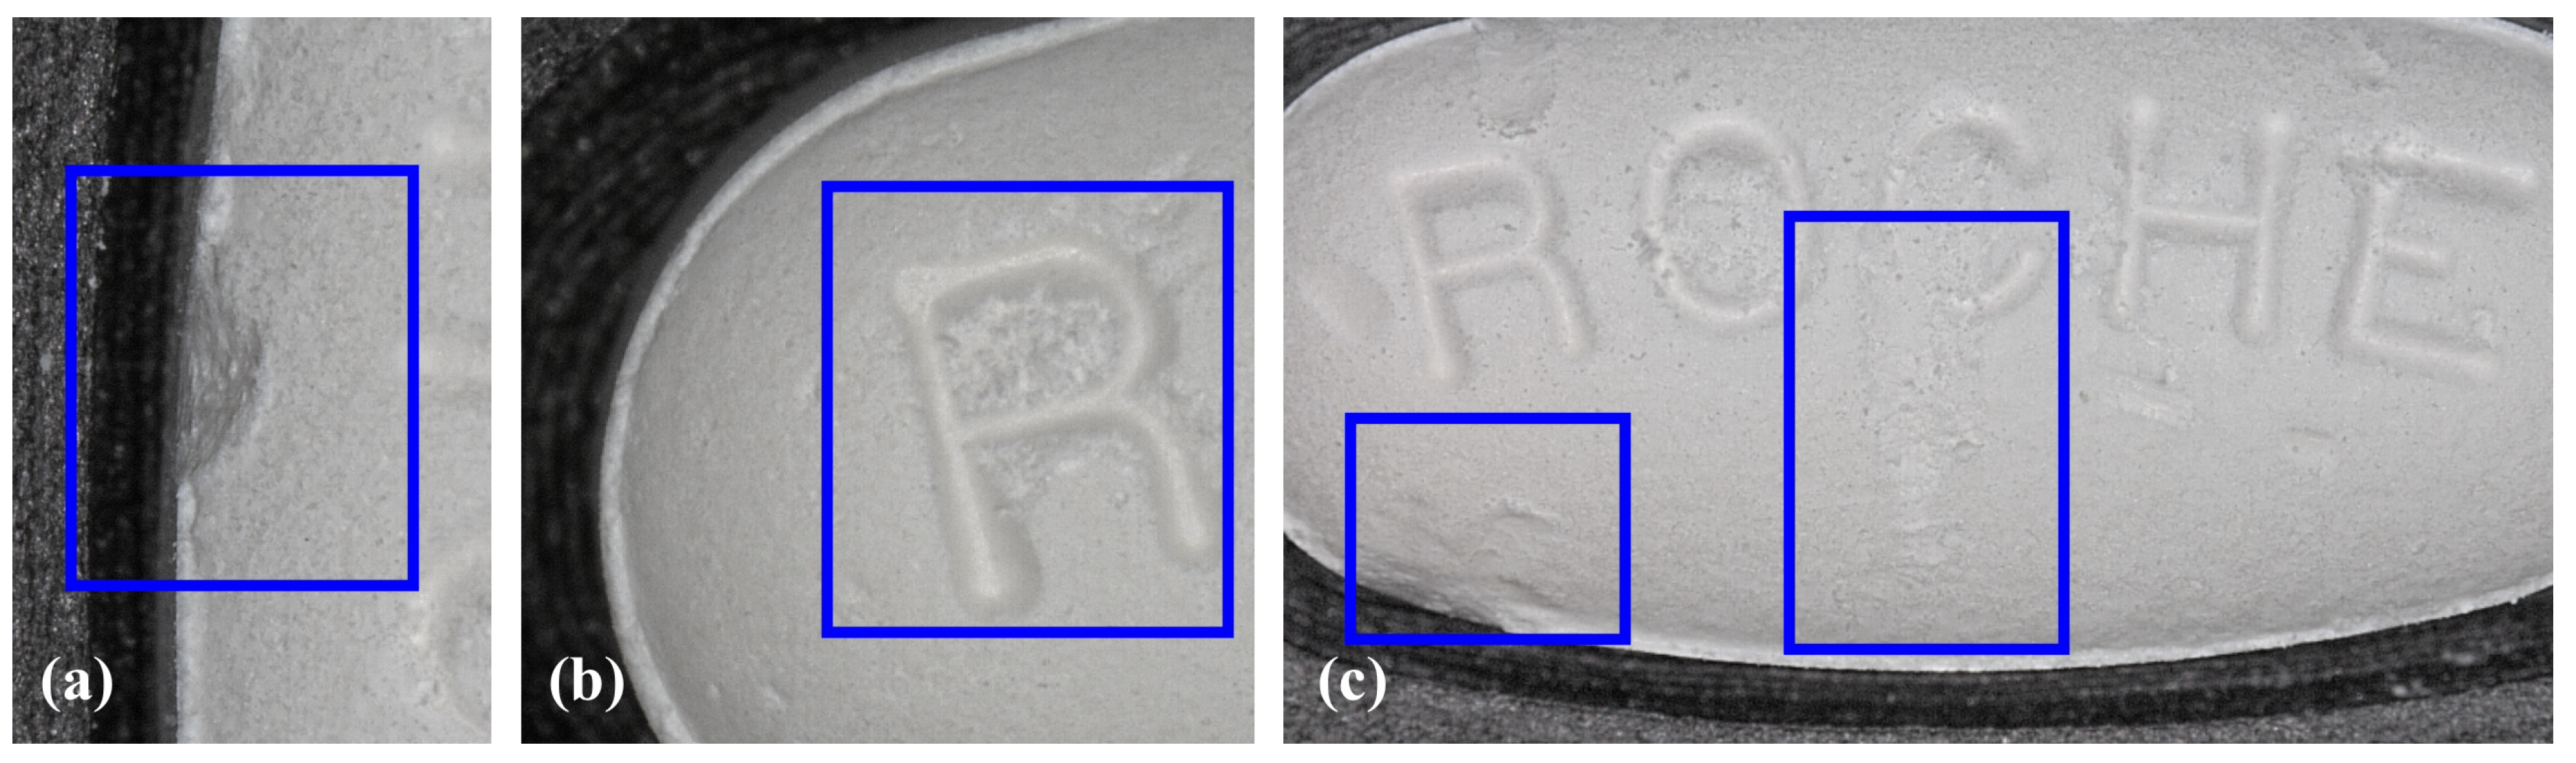
Figure 2.
Raw measurement output data of the microscope. (a) Optical image taken at minimal magnification (12x) with high dynamic range mode, meaning no part of the image should be over or under-illuminated. (b) Three-dimensional surface scan data (height map) displayed as a heat-map, the color-map varies from red to blue depending on height (red is high, blue is low).
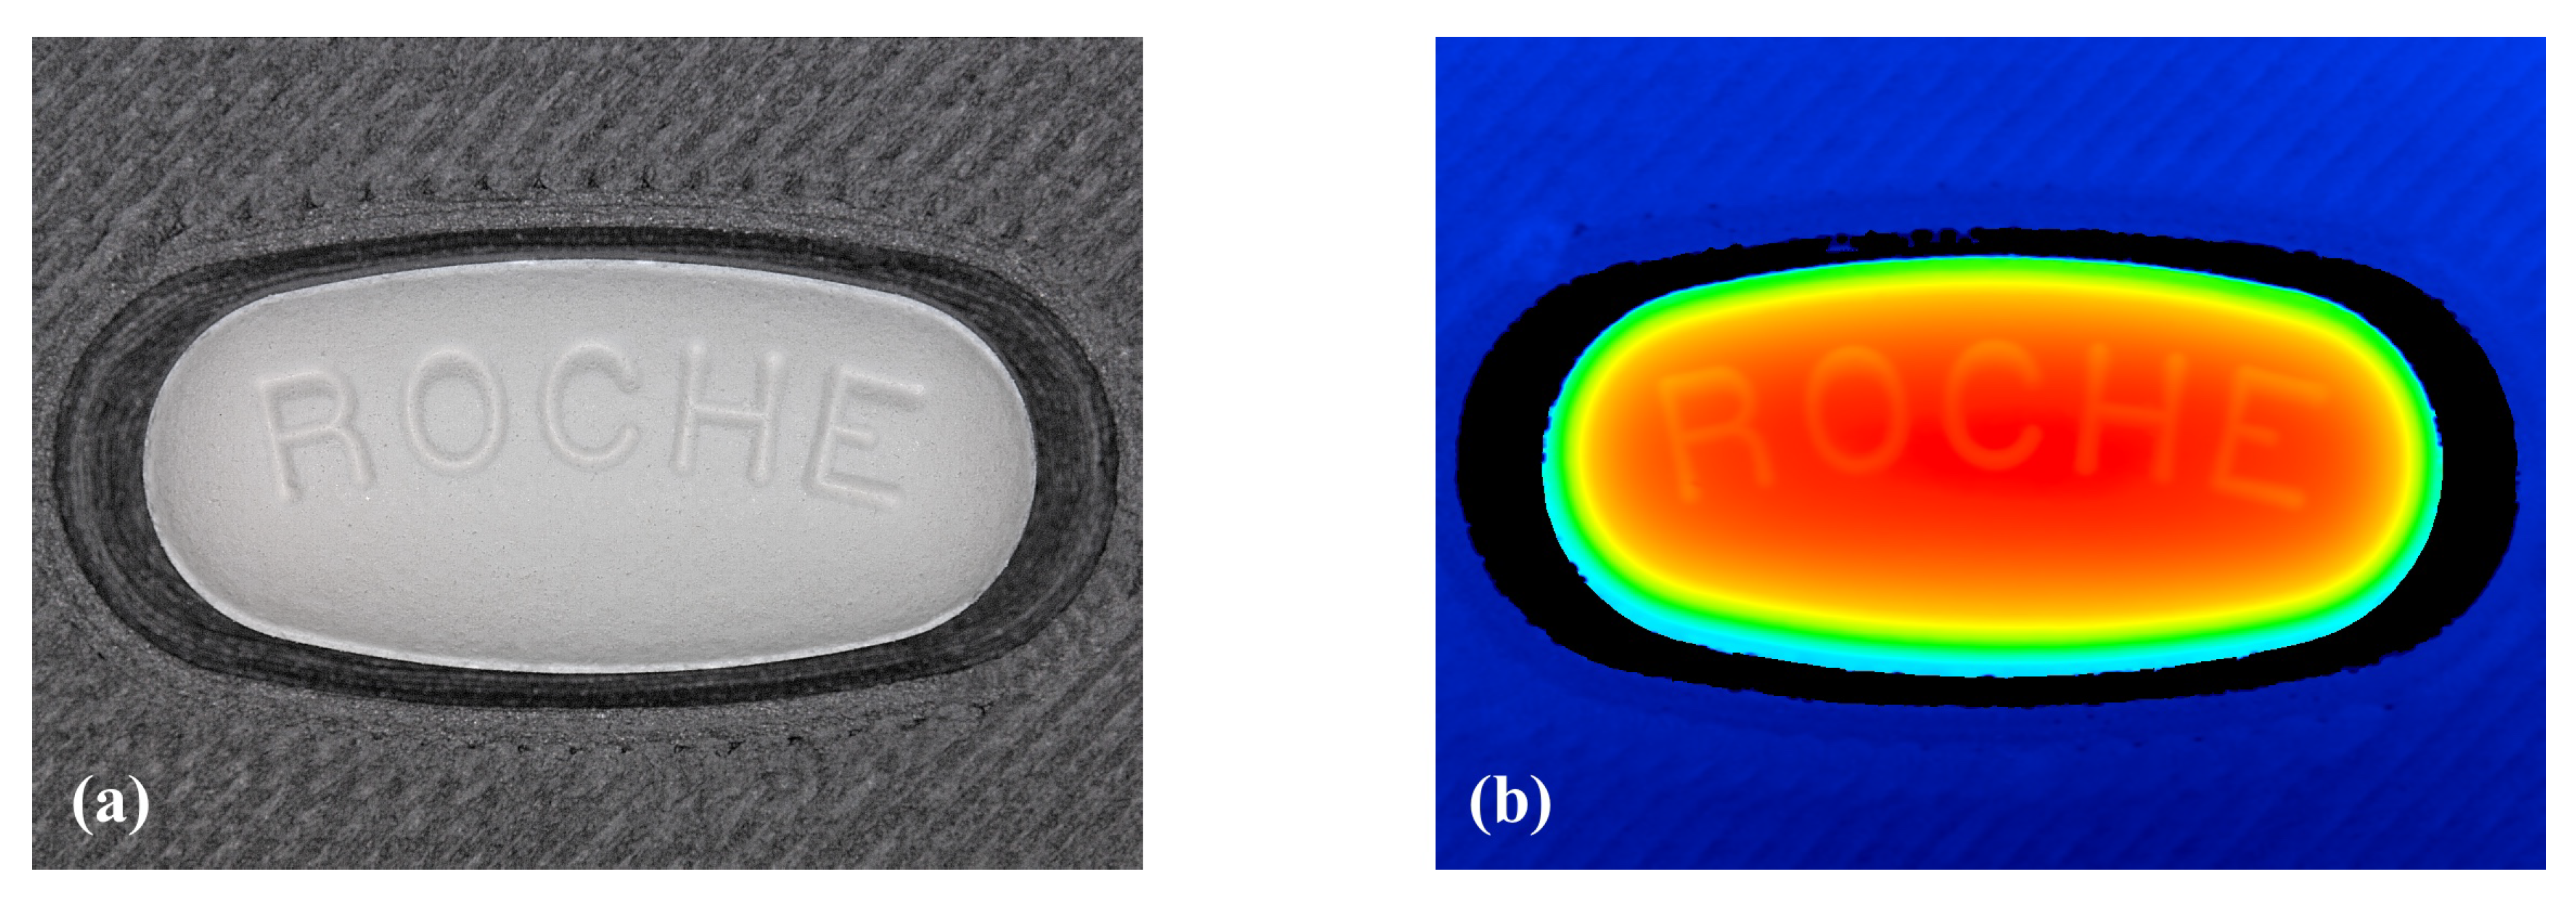
Figure 3.
Contour detection procedure on a R character bounding box. Displayed units are in pixels. (a) Cropped gray-scale image; (b) Gaussian adaptive threshold binary image; (c) Detected contours.
Figure 3.
Contour detection procedure on a R character bounding box. Displayed units are in pixels. (a) Cropped gray-scale image; (b) Gaussian adaptive threshold binary image; (c) Detected contours.
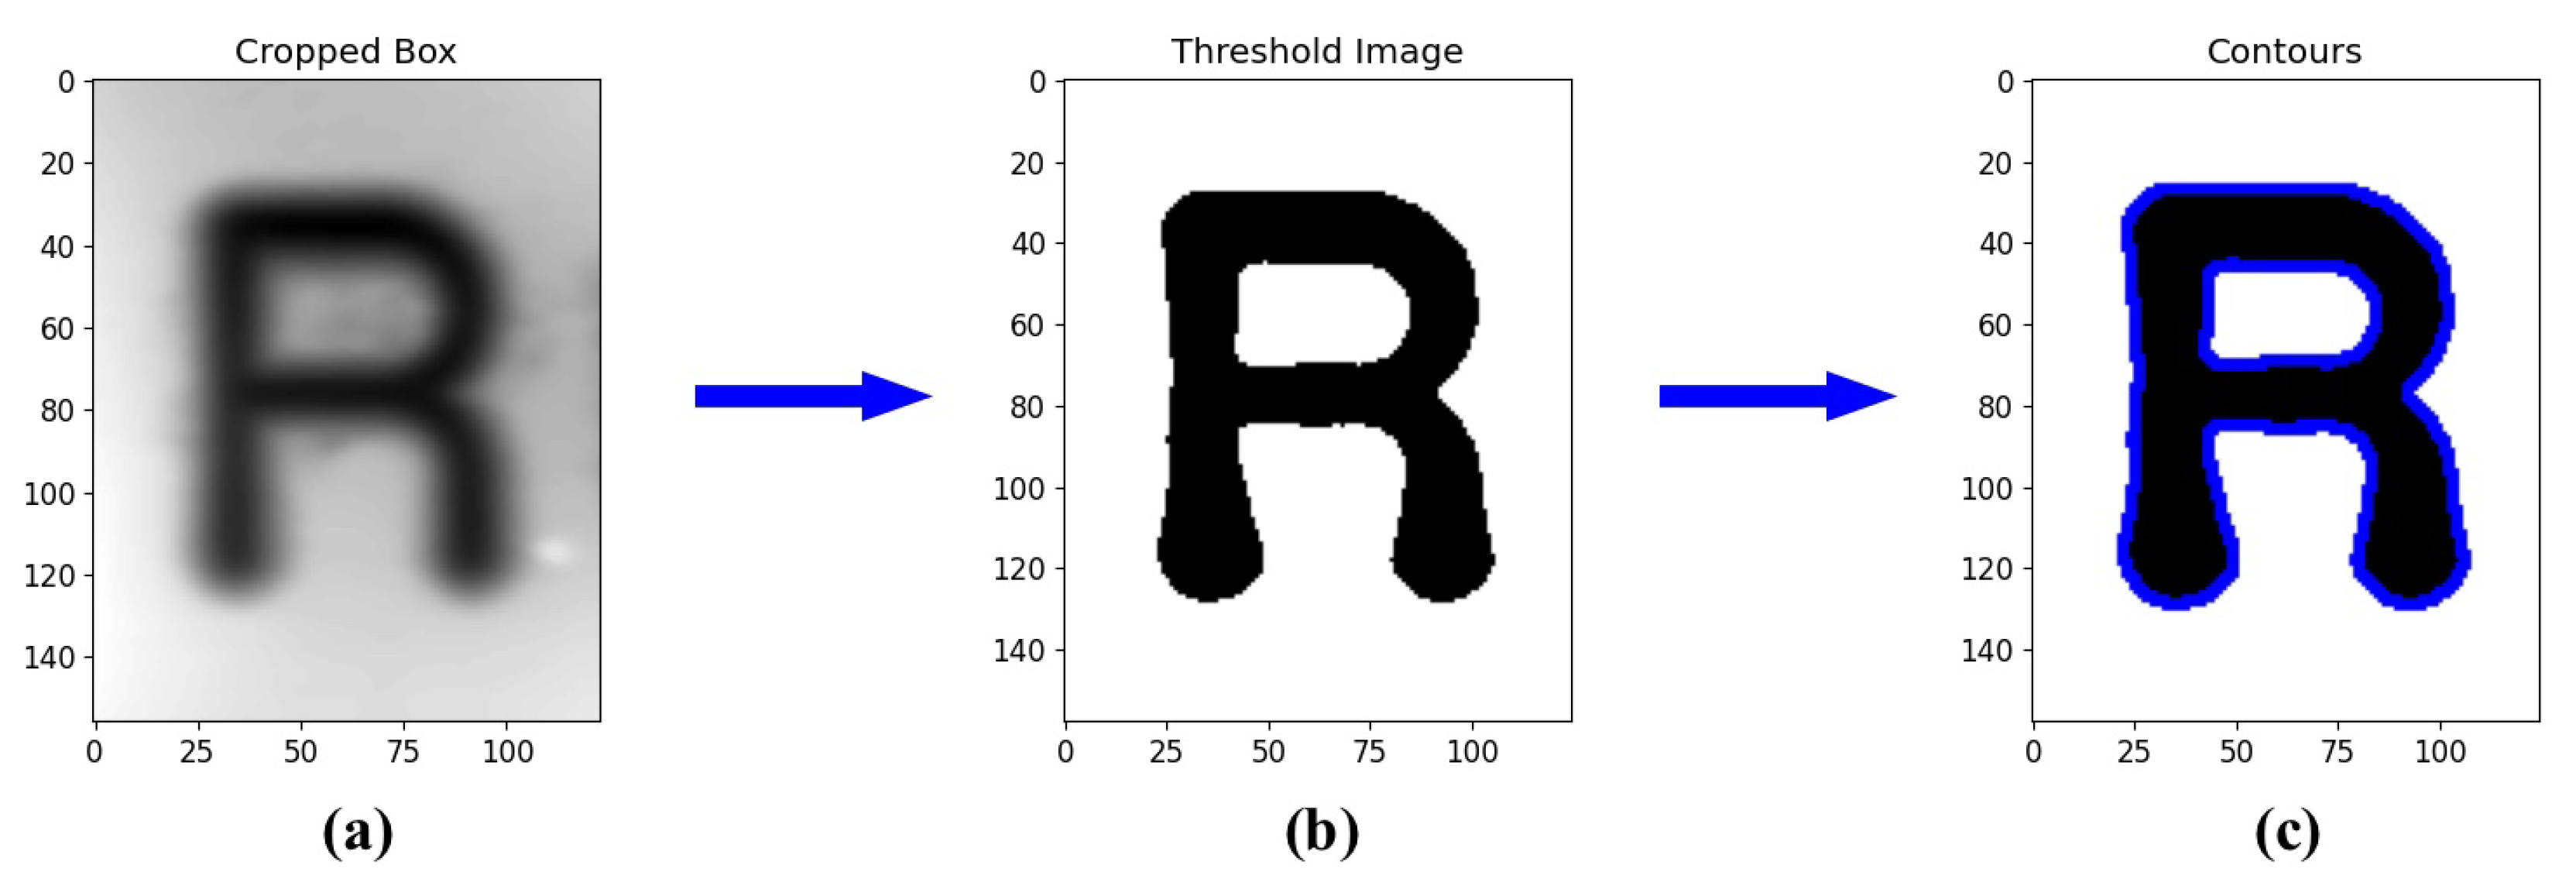
Figure 4.
Detection output for one generic tablet; after segmentation, classification and quantification. The area values in red are given in [mm2]. (a) Optical image. (b) Gray-scale height image. In blue the detected labels, i.e. the detected characters and the corresponding bounding boxes are displayed. The labels already classify the characters between the good or bad label based on training.
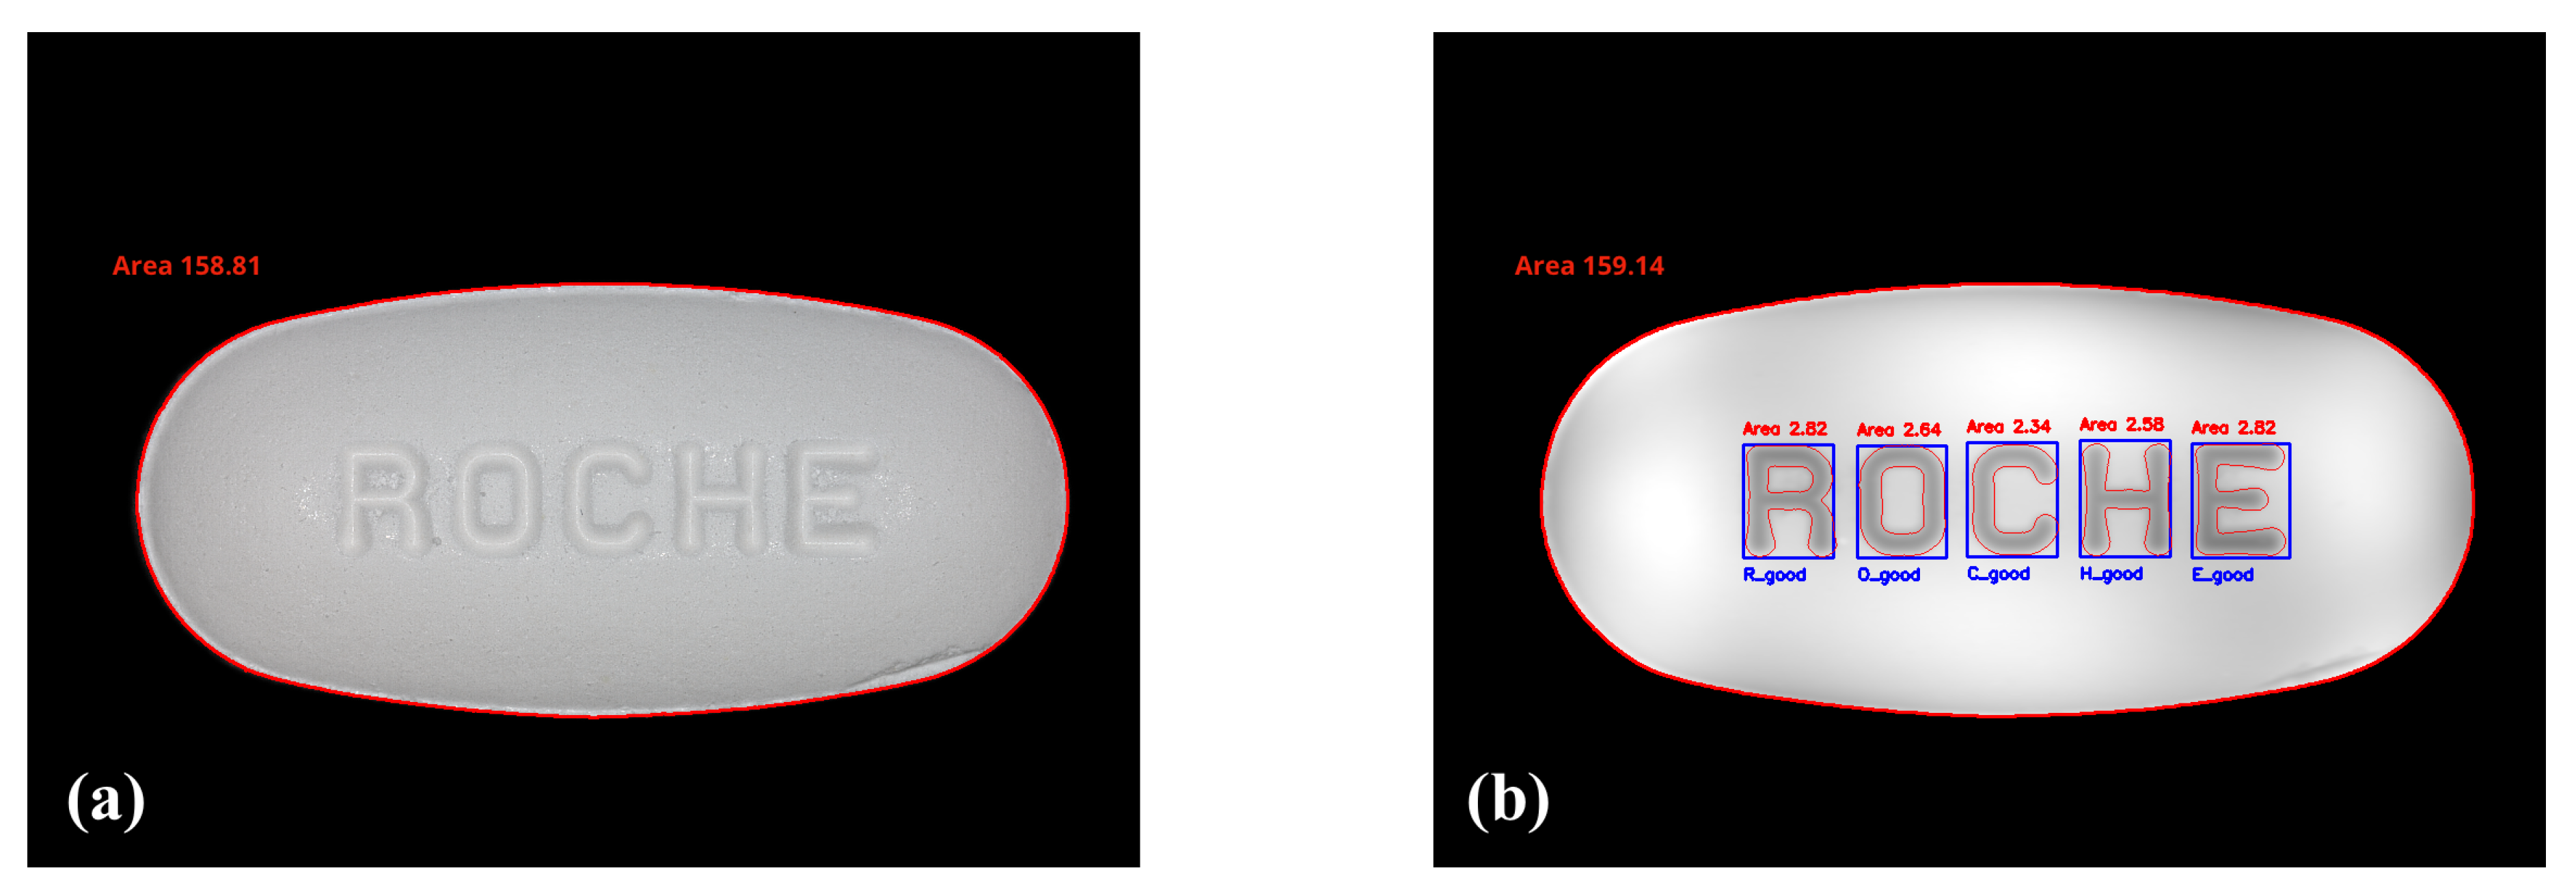
Figure 5.
Box plots of the zero centered area () for the R, O, C, H, E debossed characters on 24 oblong tablets. Additionally, the Tolerance Interval (gray) calculated on this dataset, containing of the population p with confidence , is displayed. The number of character recognized n, the mean area and the standard deviation for the different characters are indicated in the legend.
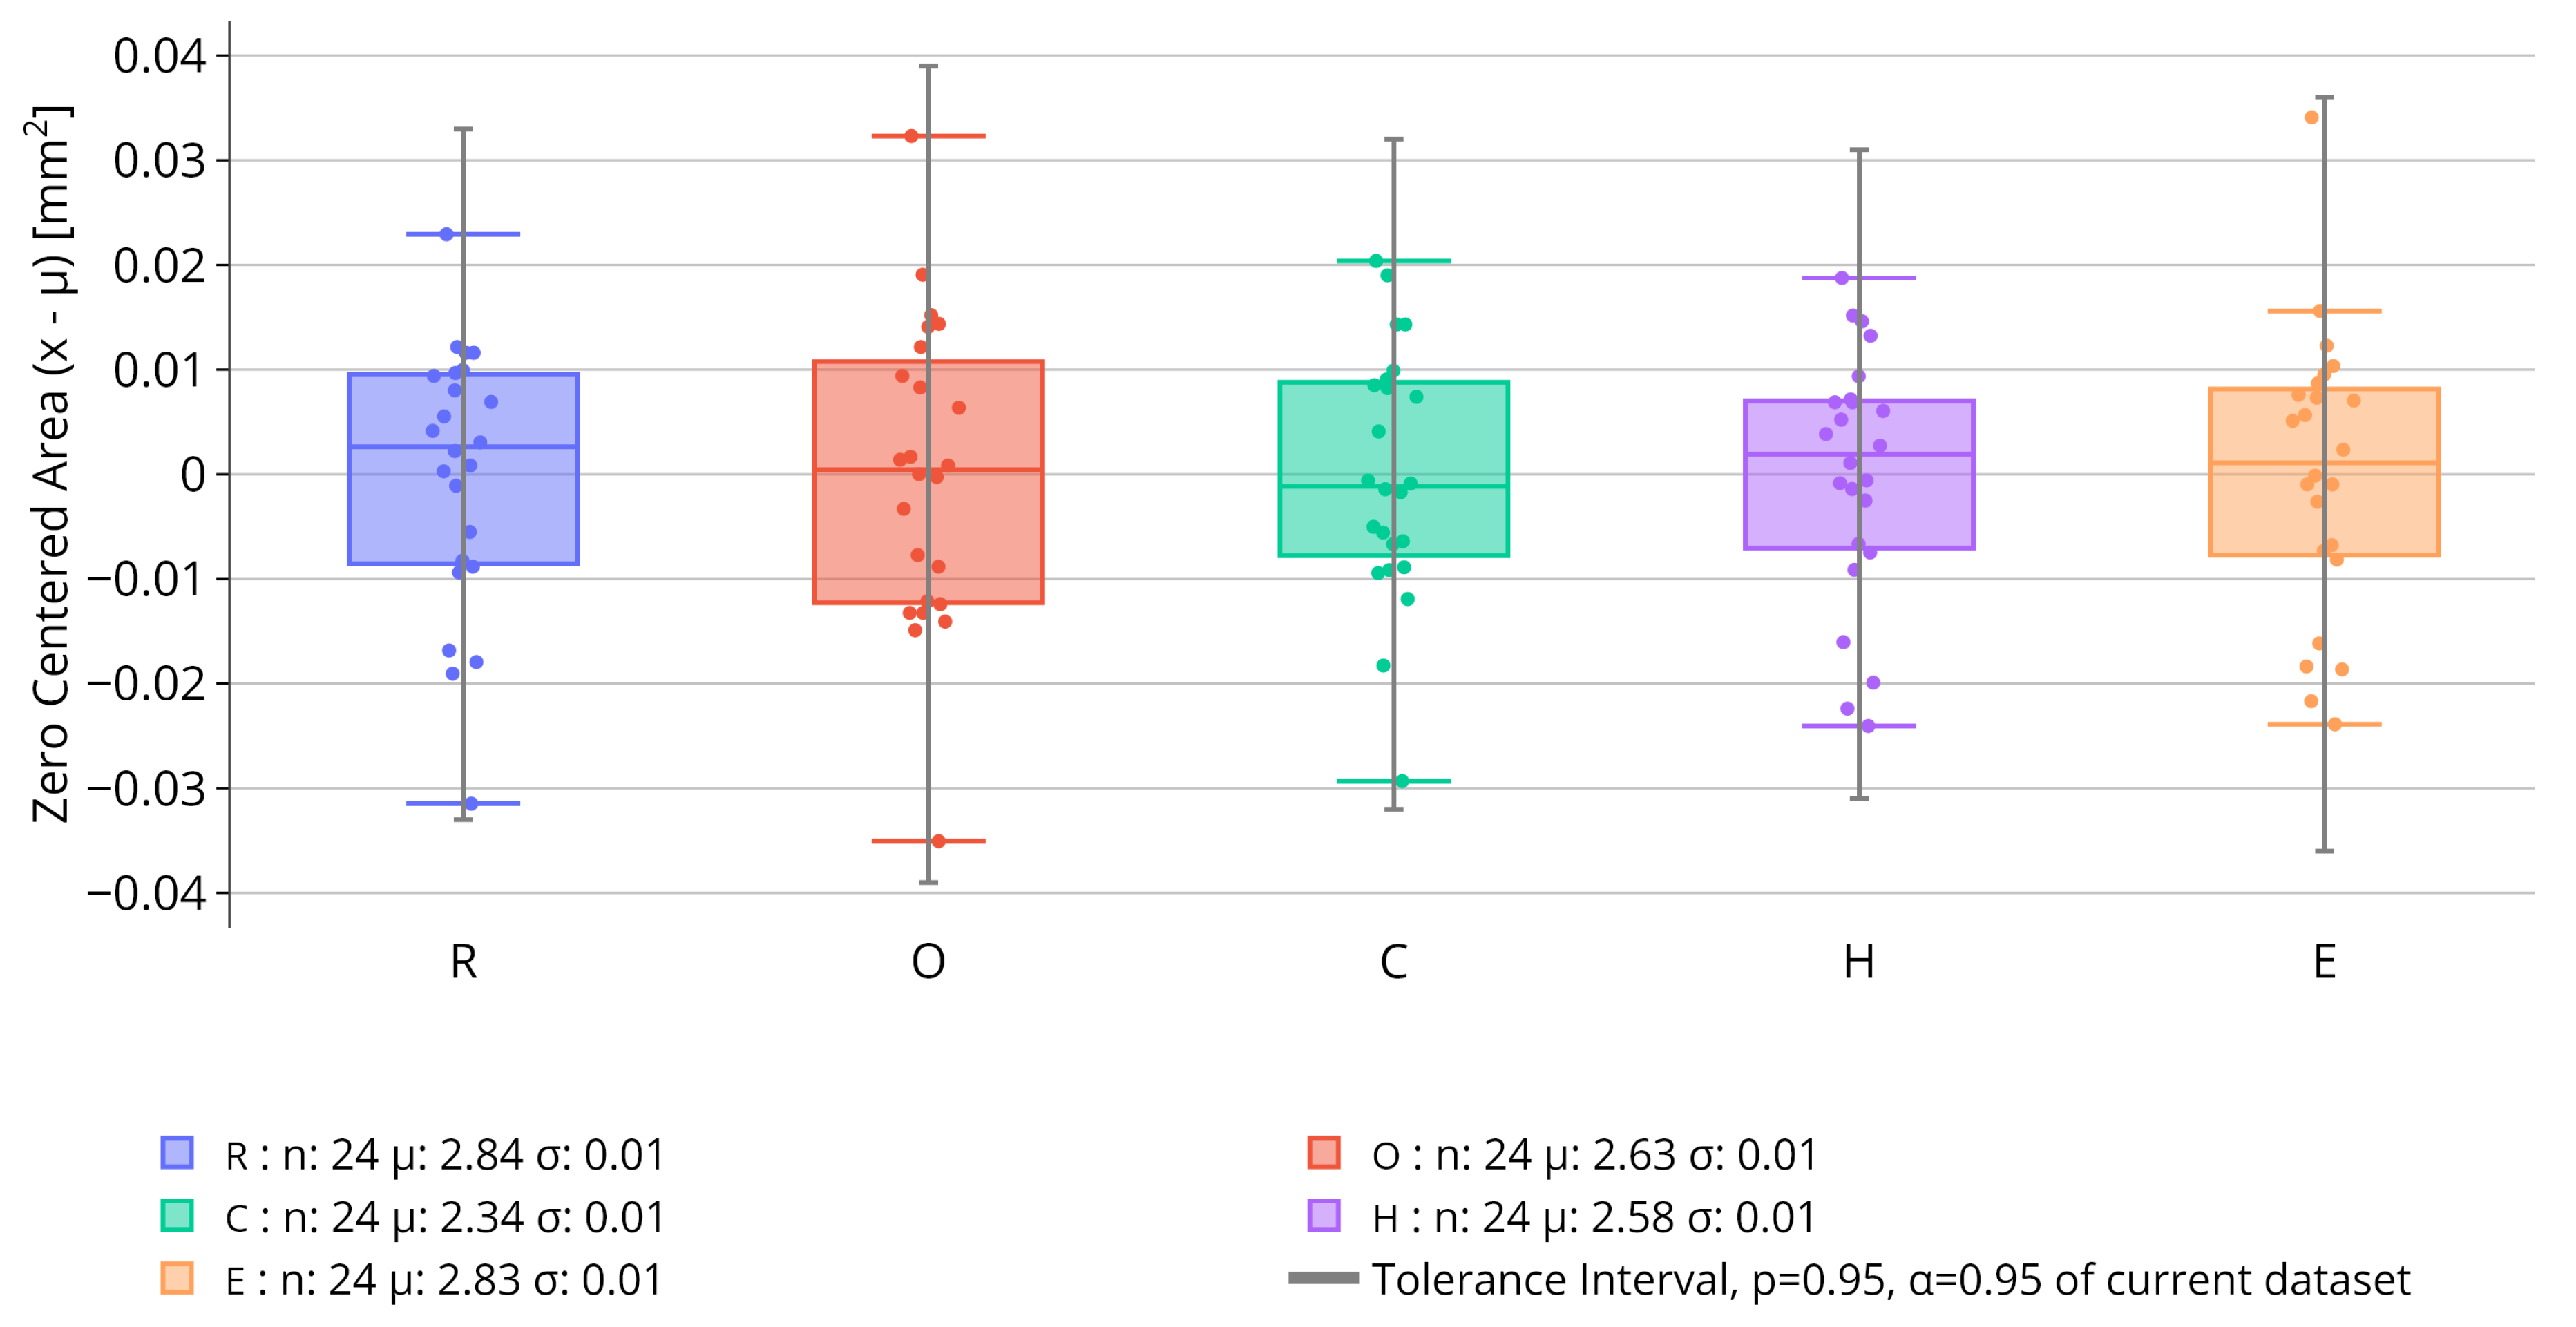
Figure 6.
Box plots of the tablet surface perimeter and tablet surface area on 24 oblong tablets. Additionally, the Tolerance Interval (gray) calculated on this dataset, containing of the population p with confidence , is displayed. The number of tablets recognized n, the mean area and the standard deviation for the characteristic attributes are indicated in the legend.
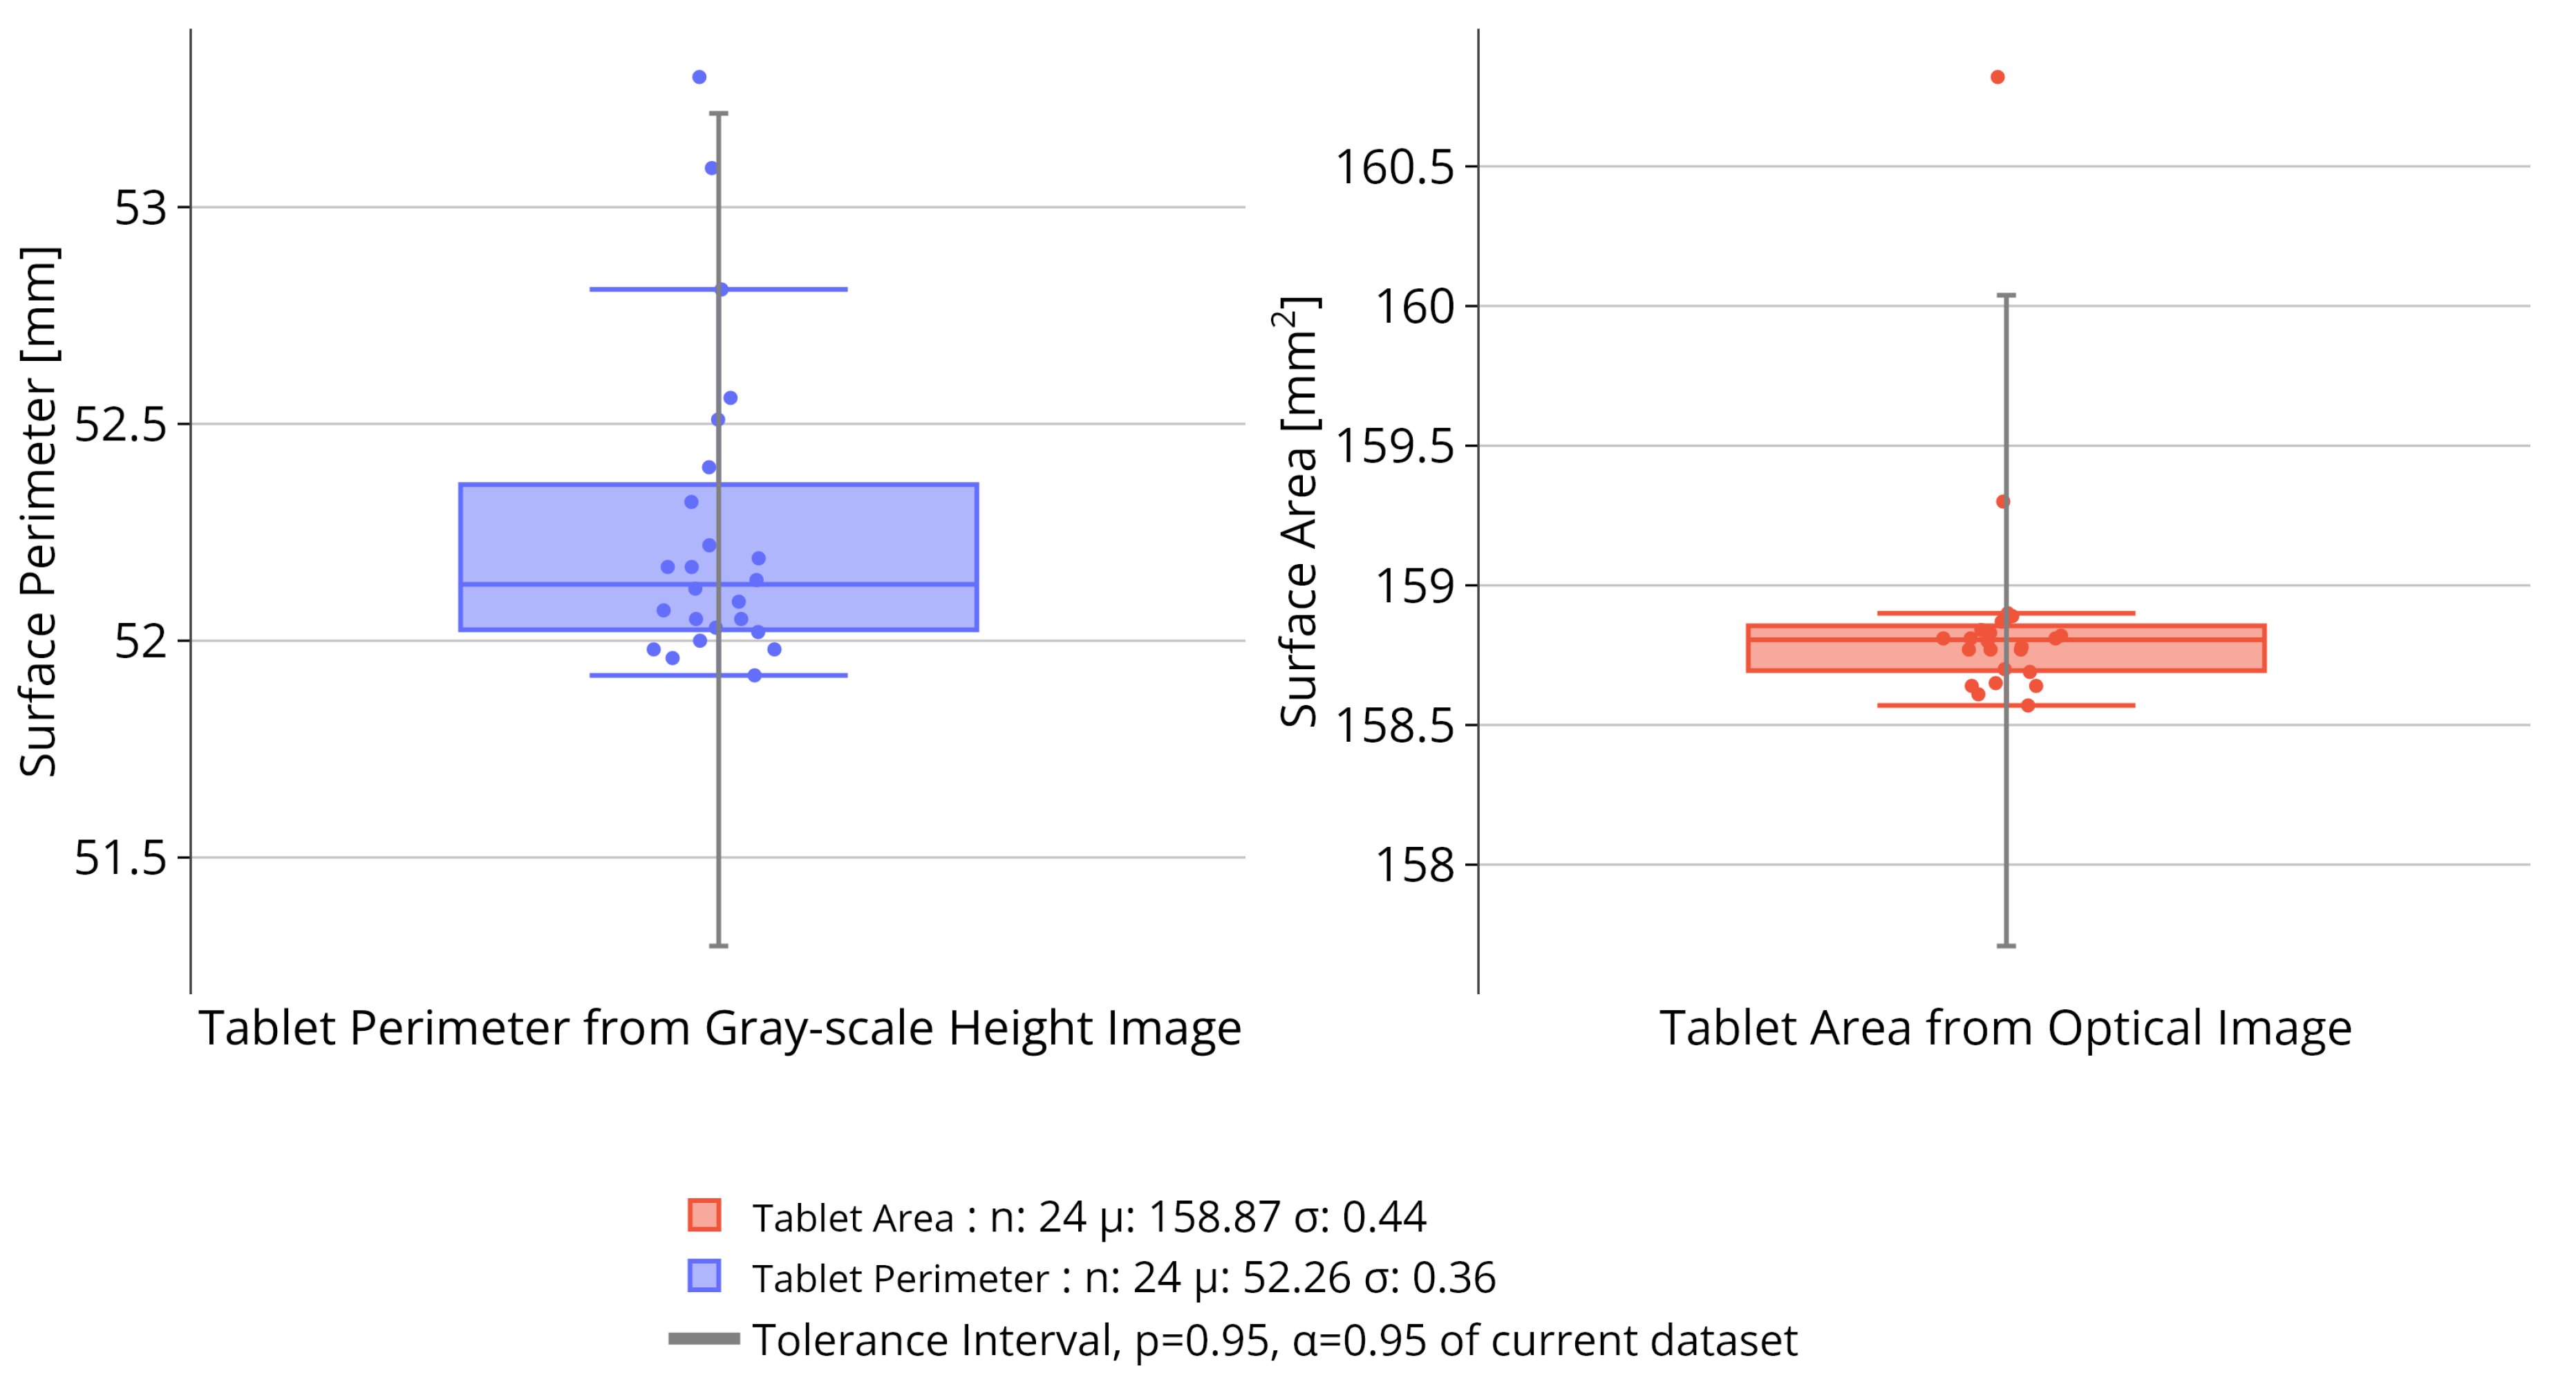
Figure 7.
Process flowchart of the developed algorithm in operating mode, including data-acquisition, pre-processing, analysis, quality assessment and reporting. The quality assessment is done with Acceptance Criteria (AC) based on Tolerance Intervals (TI) of a reference measurement and on a previously trained Faster R-CNN object detection model.
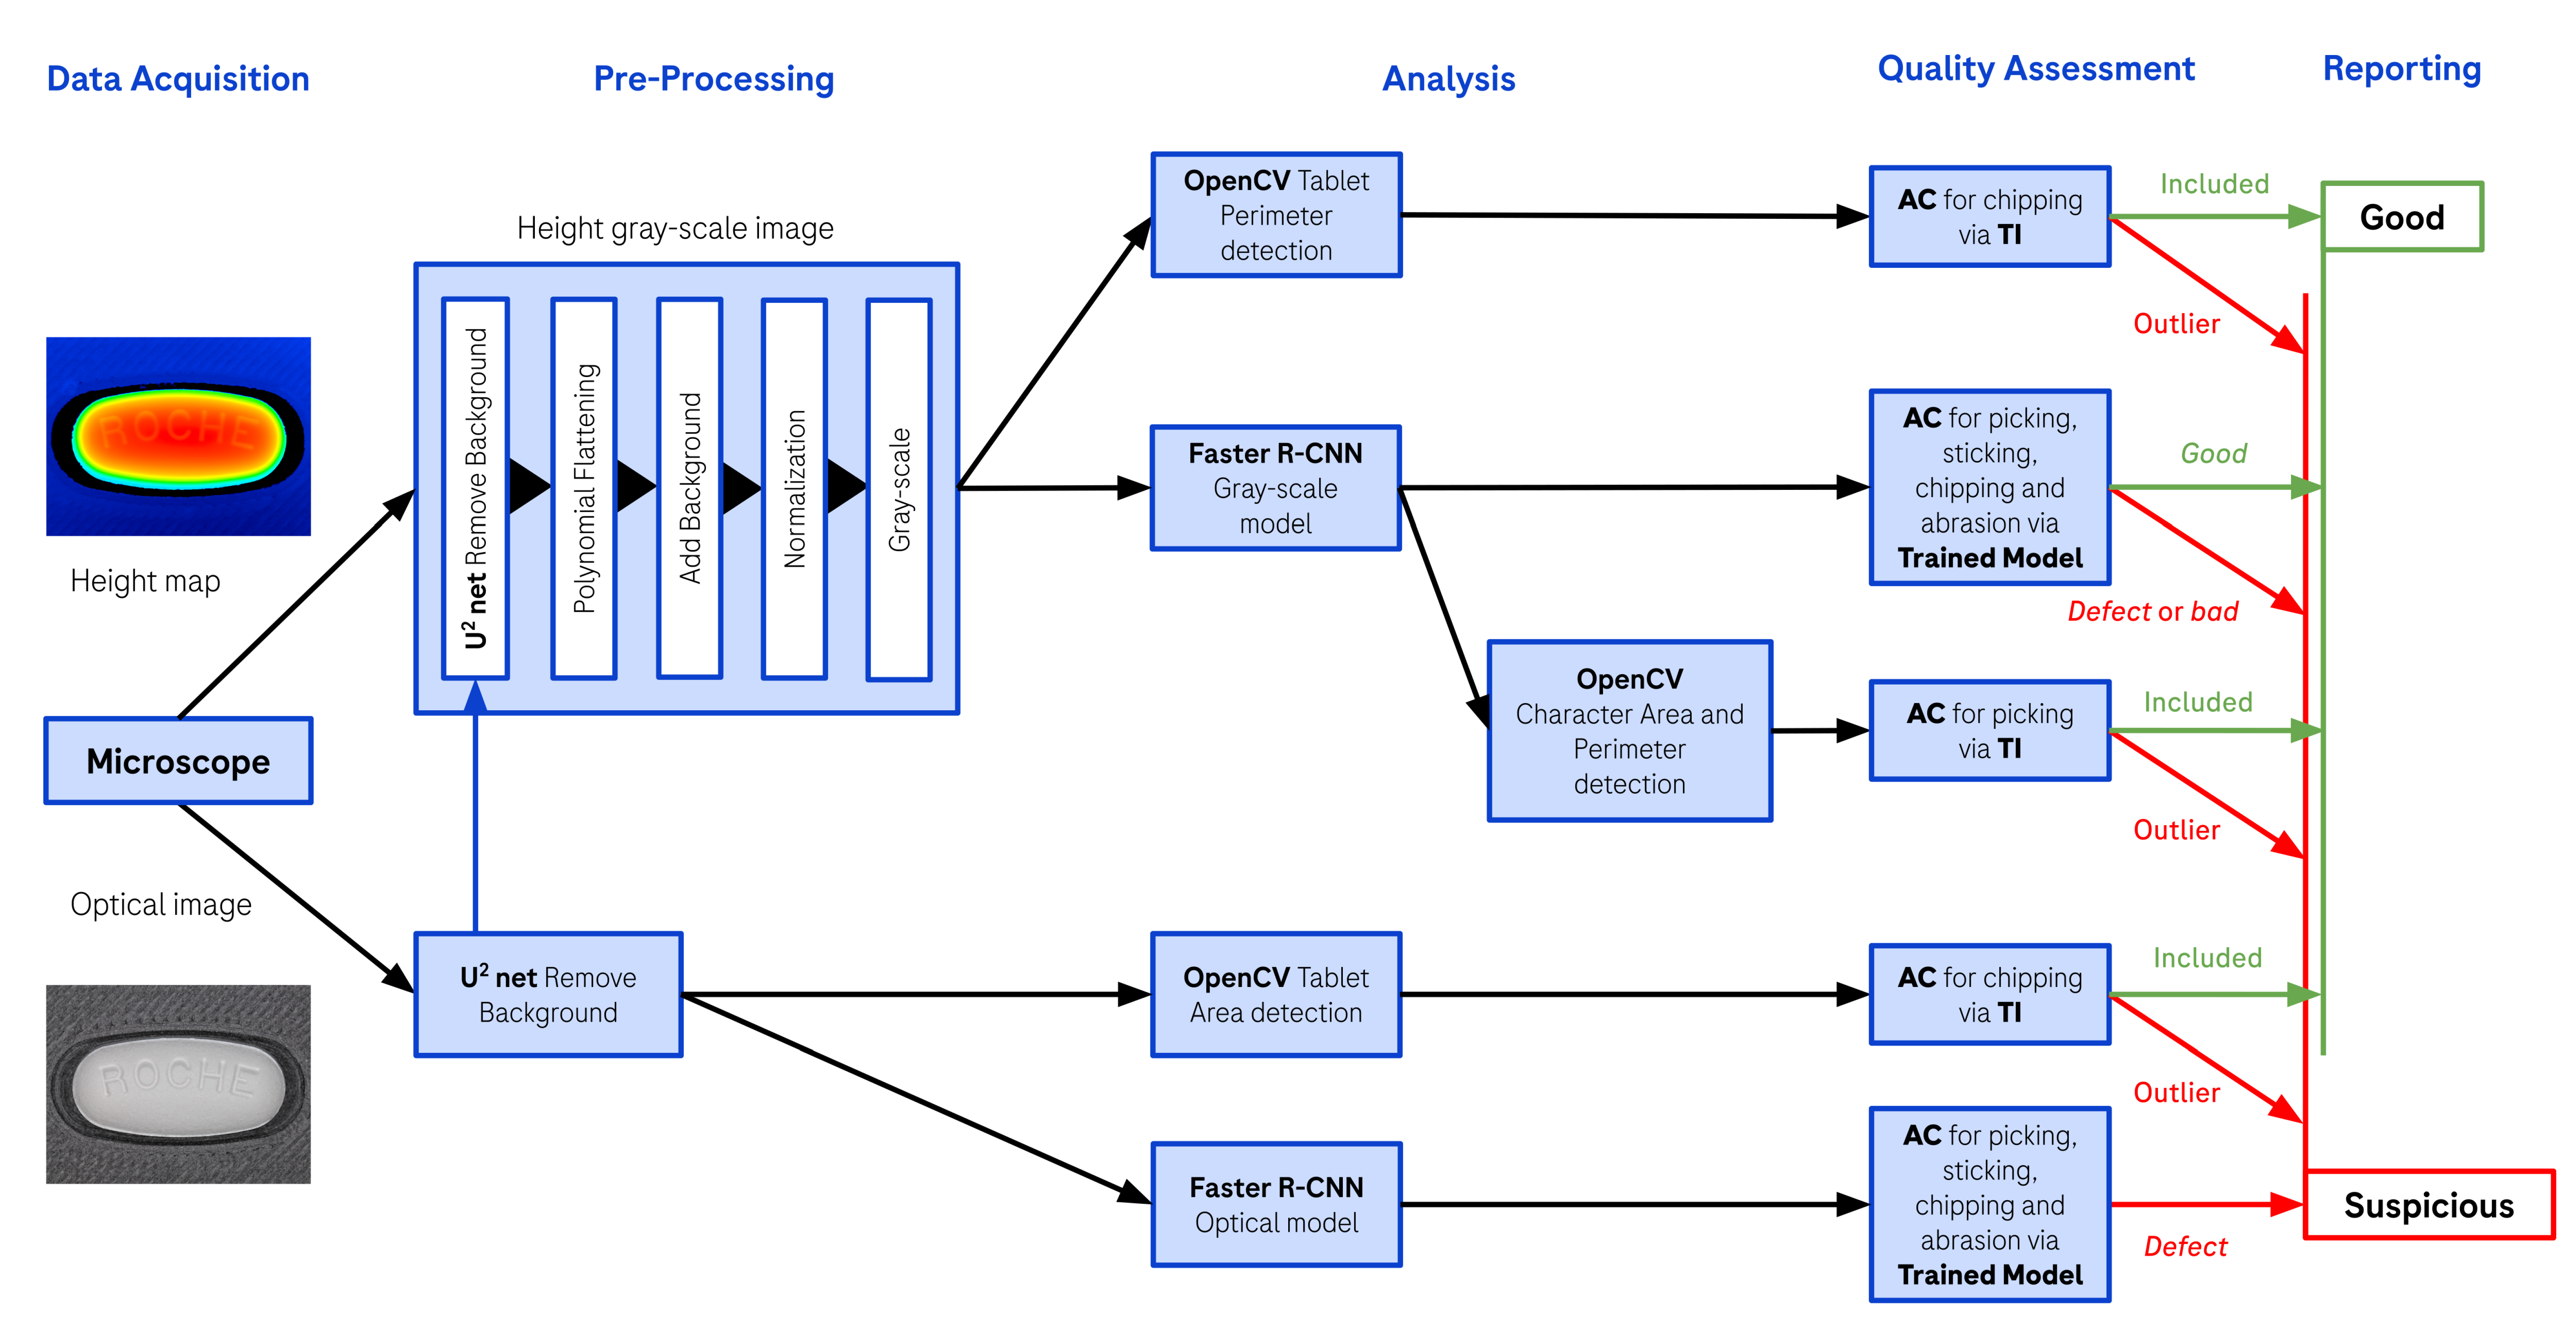
Figure 8.
Parity plot for the area of each character between two identical consecutive measurements of 15 tablets on the microscope. The dots are the individual data points and the central line represents the ideal parity.
Figure 8.
Parity plot for the area of each character between two identical consecutive measurements of 15 tablets on the microscope. The dots are the individual data points and the central line represents the ideal parity.
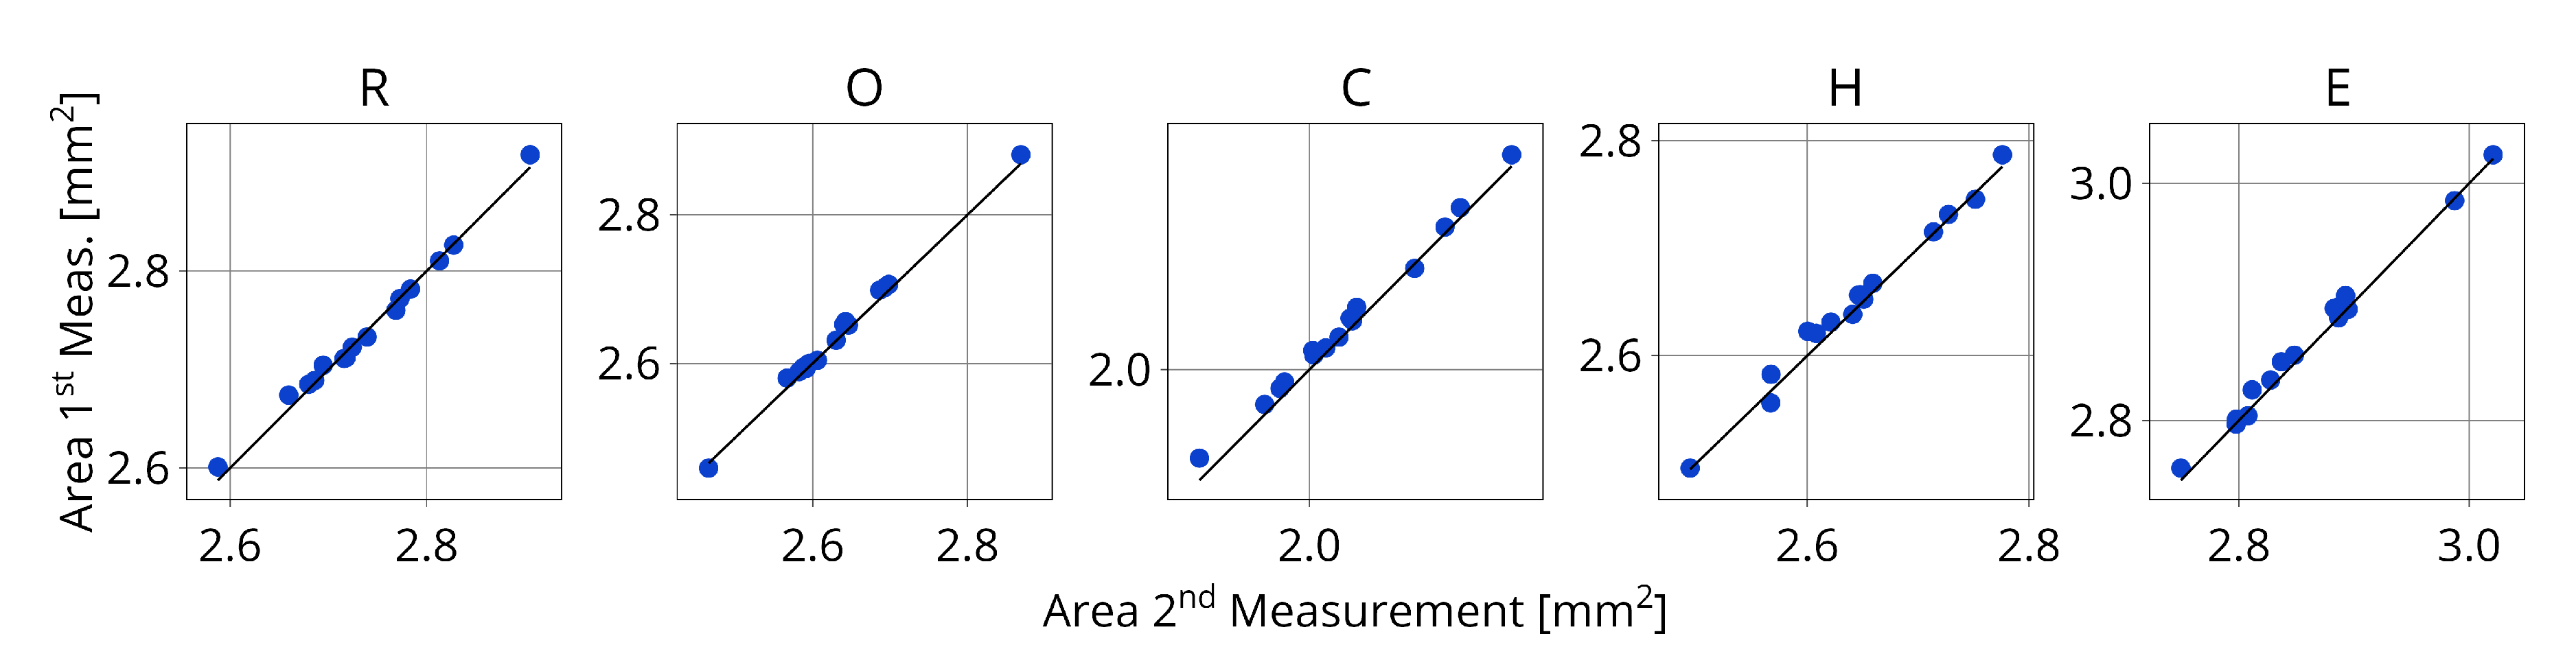
Figure 9.
Parity plot for the perimeter of each character between two identical consecutive measurements of 15 tablets on the microscope. The dots are the individual data points and the central line represents the ideal parity.
Figure 9.
Parity plot for the perimeter of each character between two identical consecutive measurements of 15 tablets on the microscope. The dots are the individual data points and the central line represents the ideal parity.
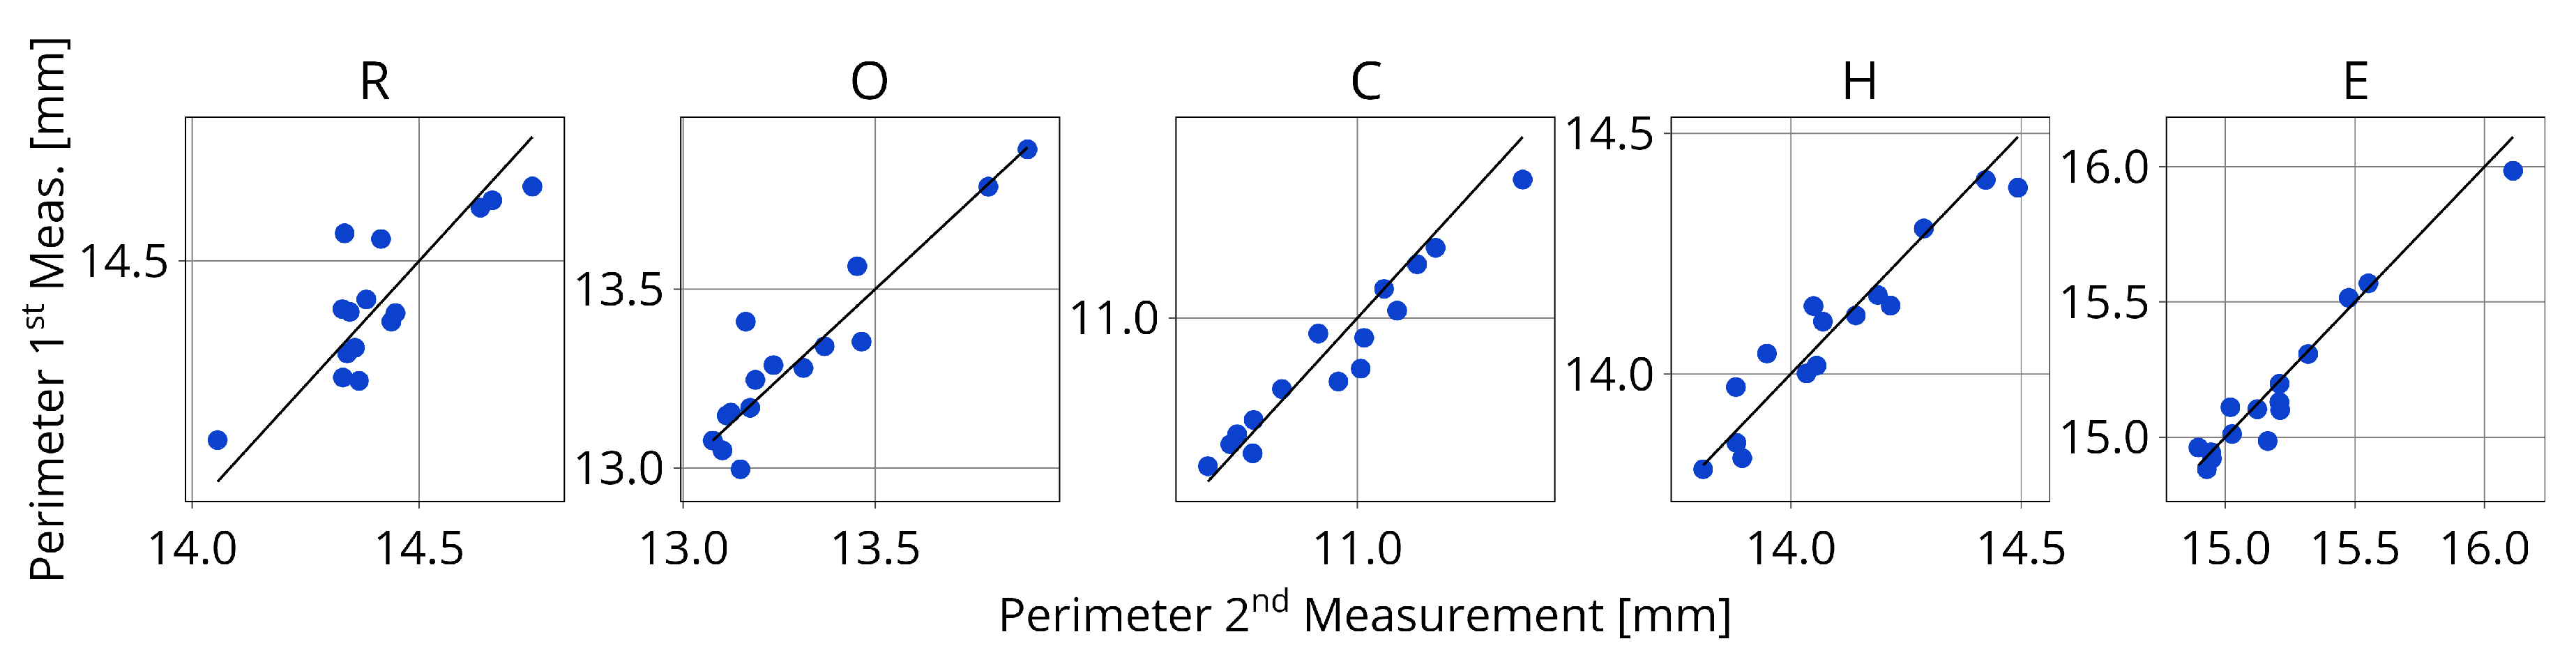
Figure 10.
Parity plot for the tablet perimeter and tablet surface area between two identical consecutive measurements of 15 tablets on the microscope. The dots are the individual data points and the central line represents the ideal parity.
Figure 10.
Parity plot for the tablet perimeter and tablet surface area between two identical consecutive measurements of 15 tablets on the microscope. The dots are the individual data points and the central line represents the ideal parity.
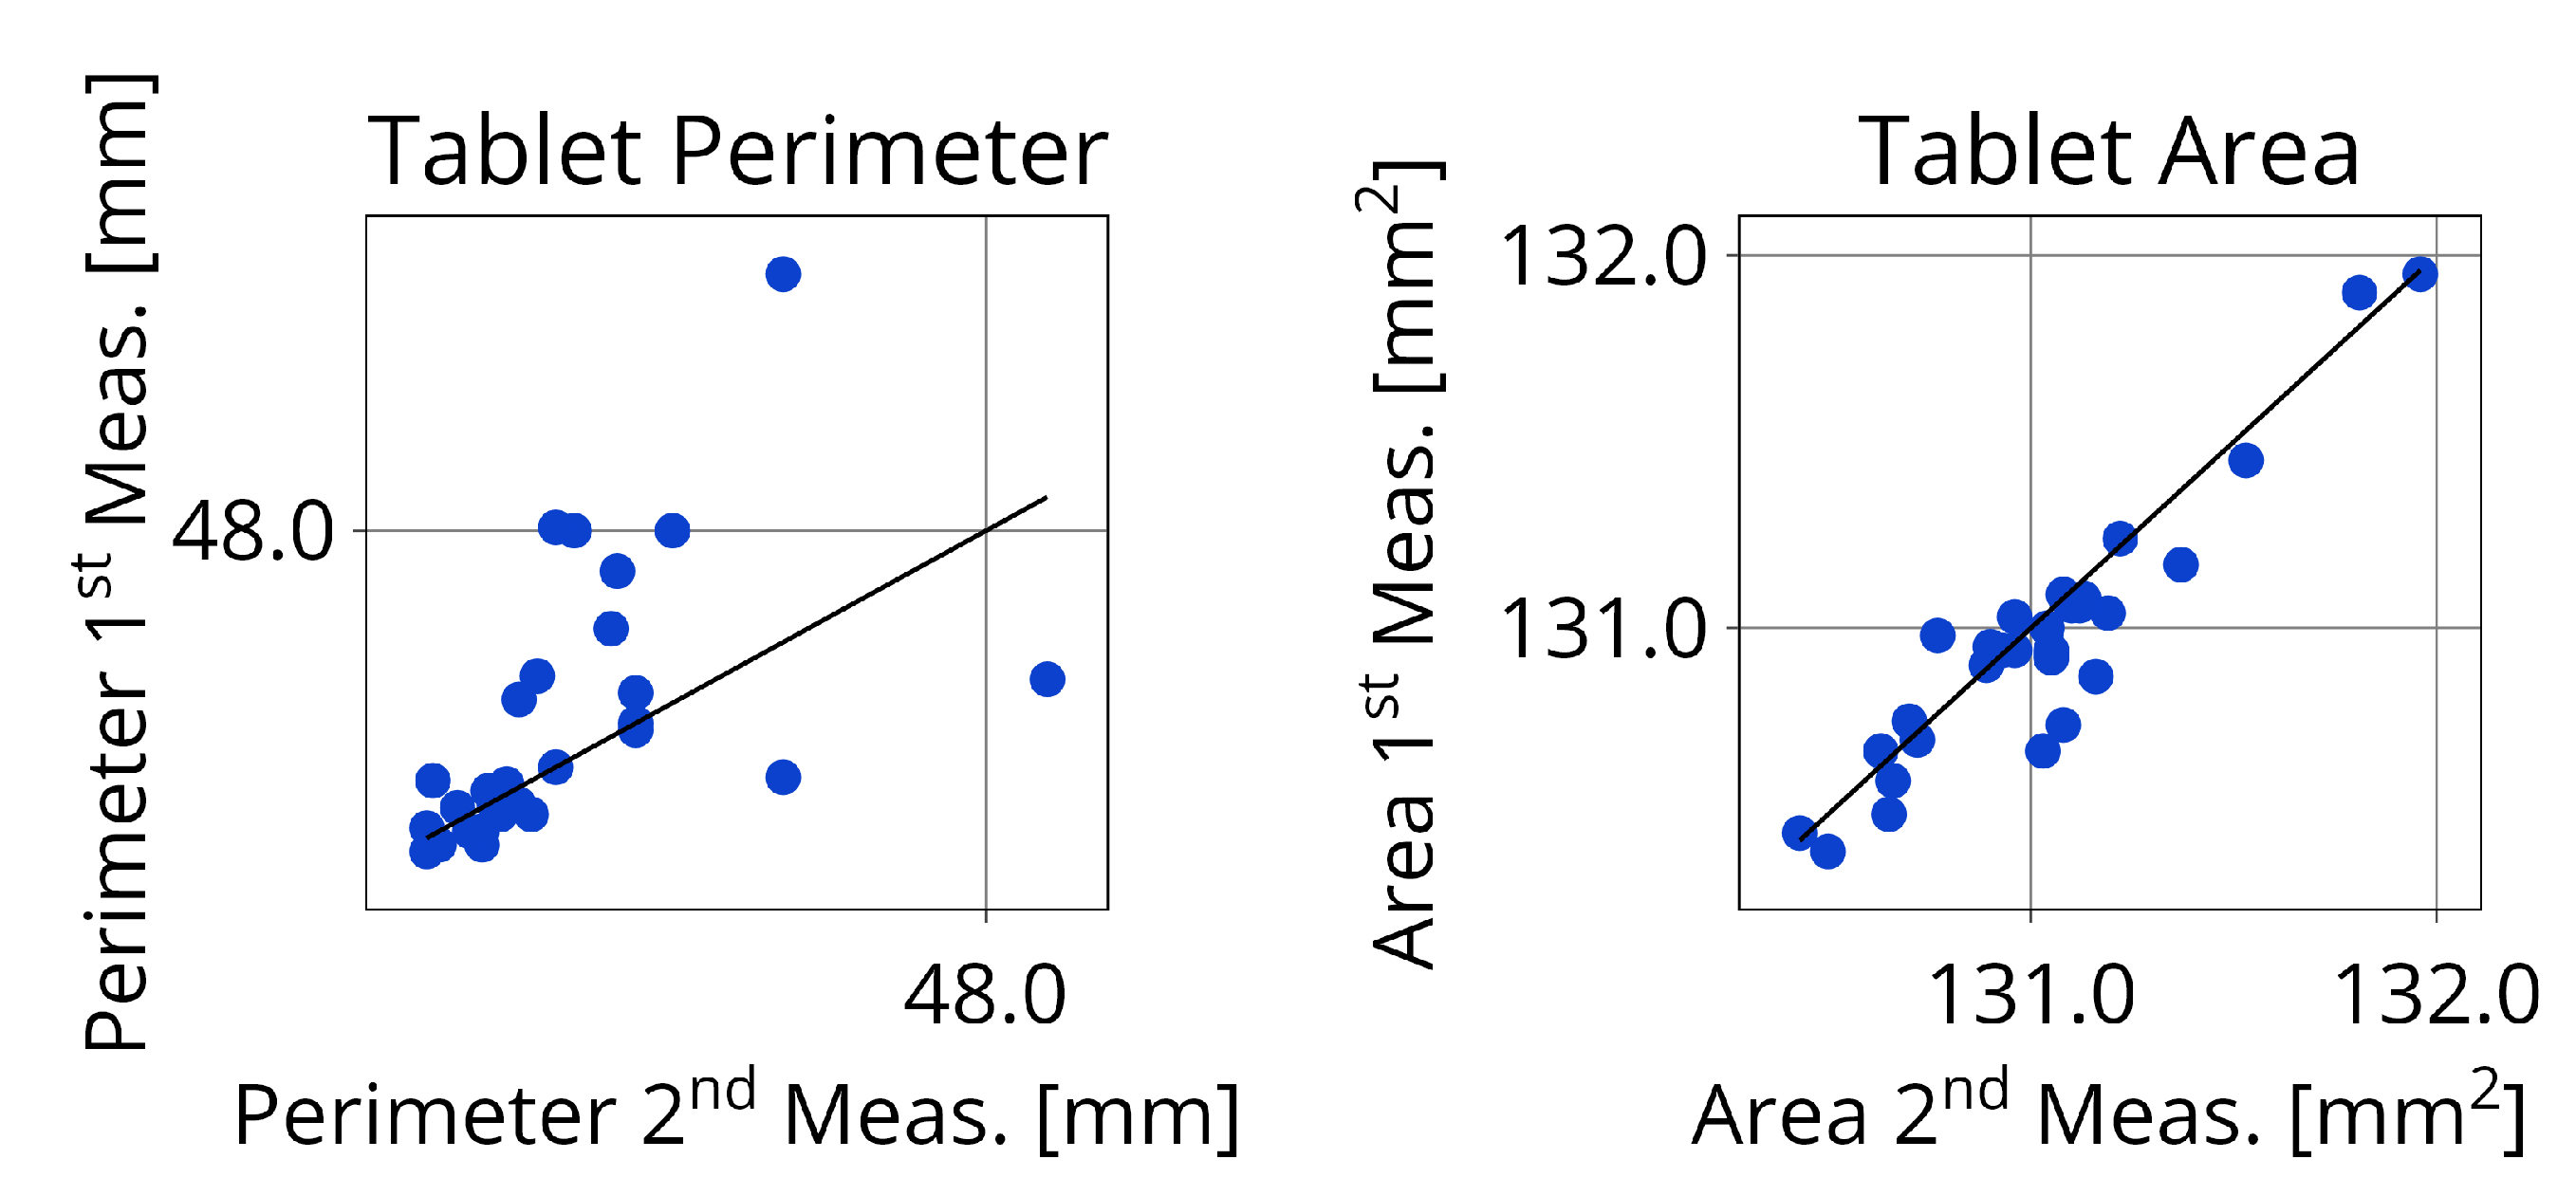
Figure 11.
Box plots of the zero centered perimeter () for the R, O, C, H, E debossed characters on 24 oblong tablets. Additionally, the Tolerance Interval (gray) calculated on this dataset, containing of the population p with confidence , is displayed. The number of character recognized n, the mean area and the standard deviation for the different characters are indicated in the legend.
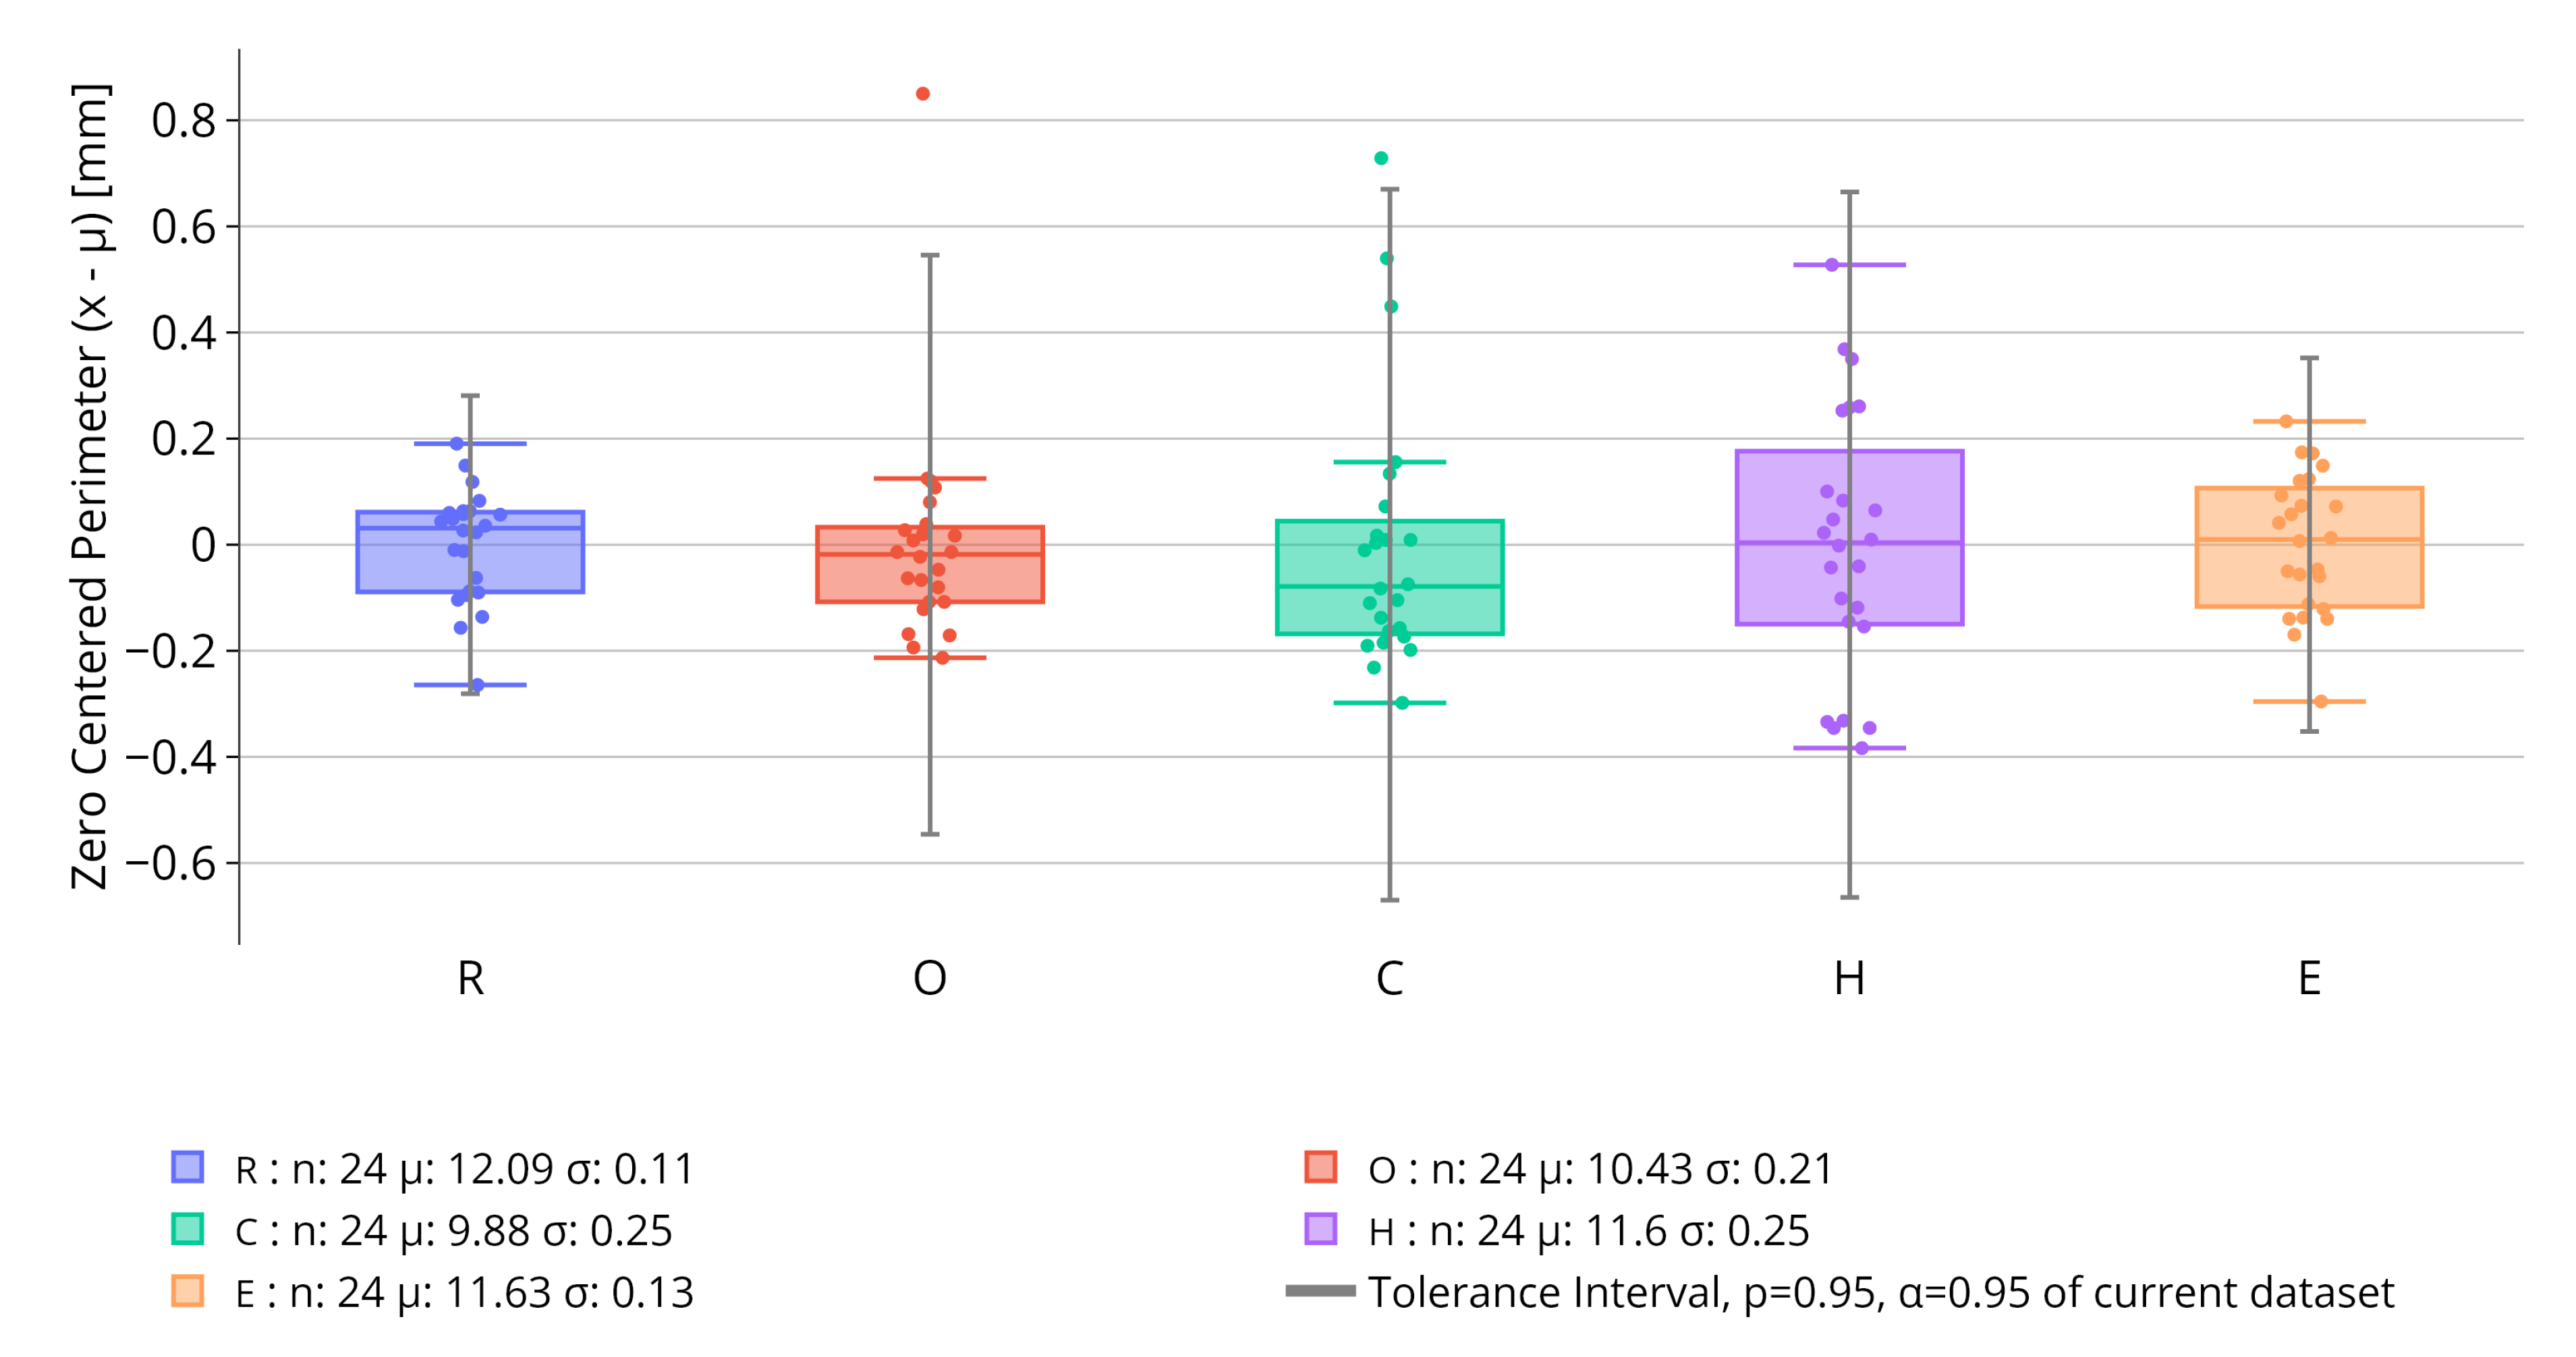
Figure 12.
Detection output for different oblong tablets with varying quality and defects; (a), (b), (c) were identified as ’Suspicious’ by the algorithm. (a) Slight picking is visible on the O, C, H and E, the detected area from the gray-scale height image confirms these defects. (b) Strong picking is visible for the O and C. (c) Strong picking on the center island of the R. (d) Tablet with no defect, evaluated as ’Good’ by the algorithm.
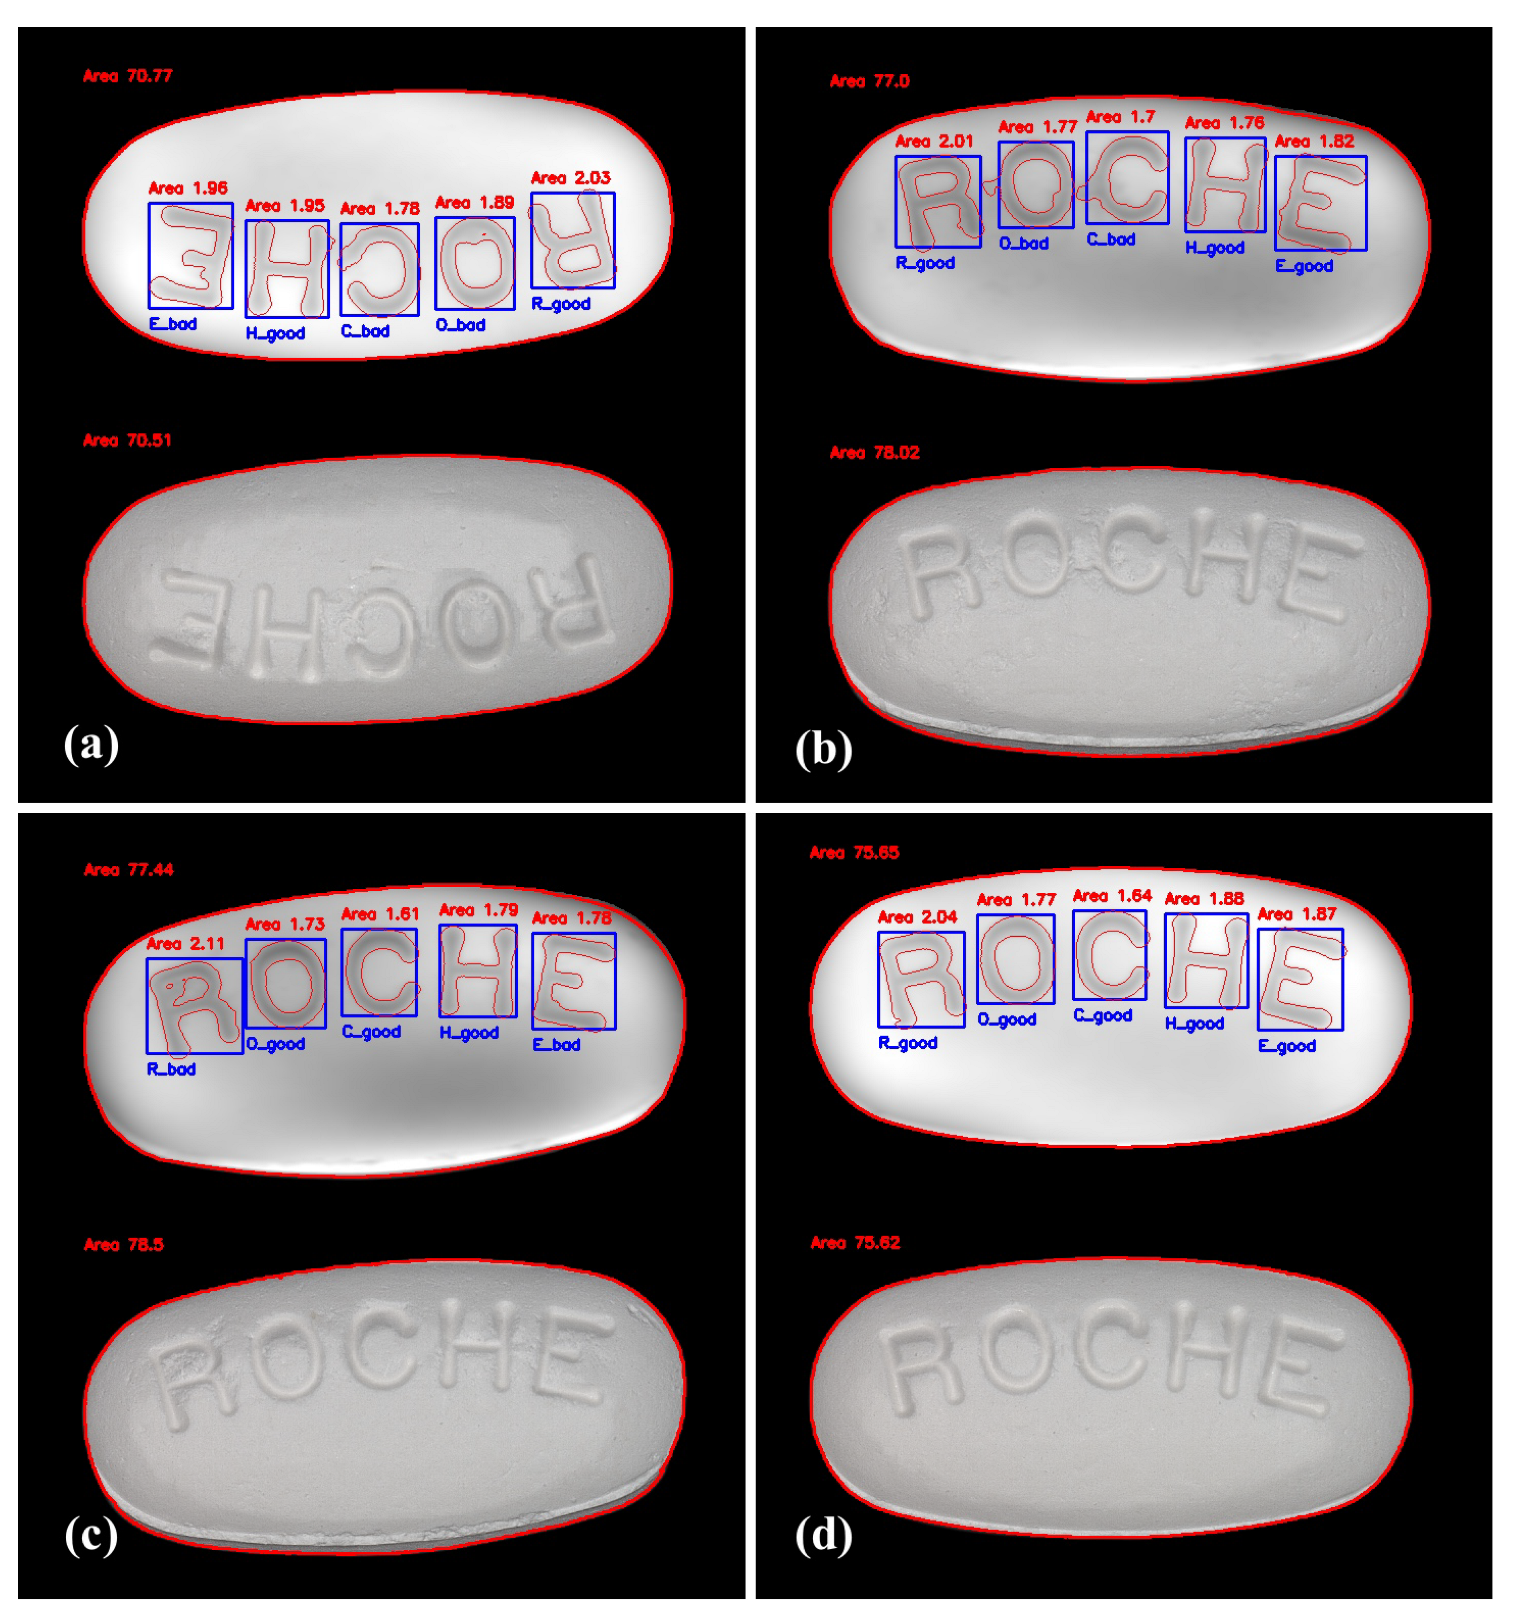
Figure 13.
Box plots of the zero centered area () for the R, O, C, H, E debossed characters on 24 oblong tablets from batch 2. Additionally, the Tolerance Interval (gray) calculated on a different dataset originating from batch 3, containing of the population p with confidence , is displayed. The number of character recognized n, the mean area and the standard deviation for the different characters are indicated in the legend.
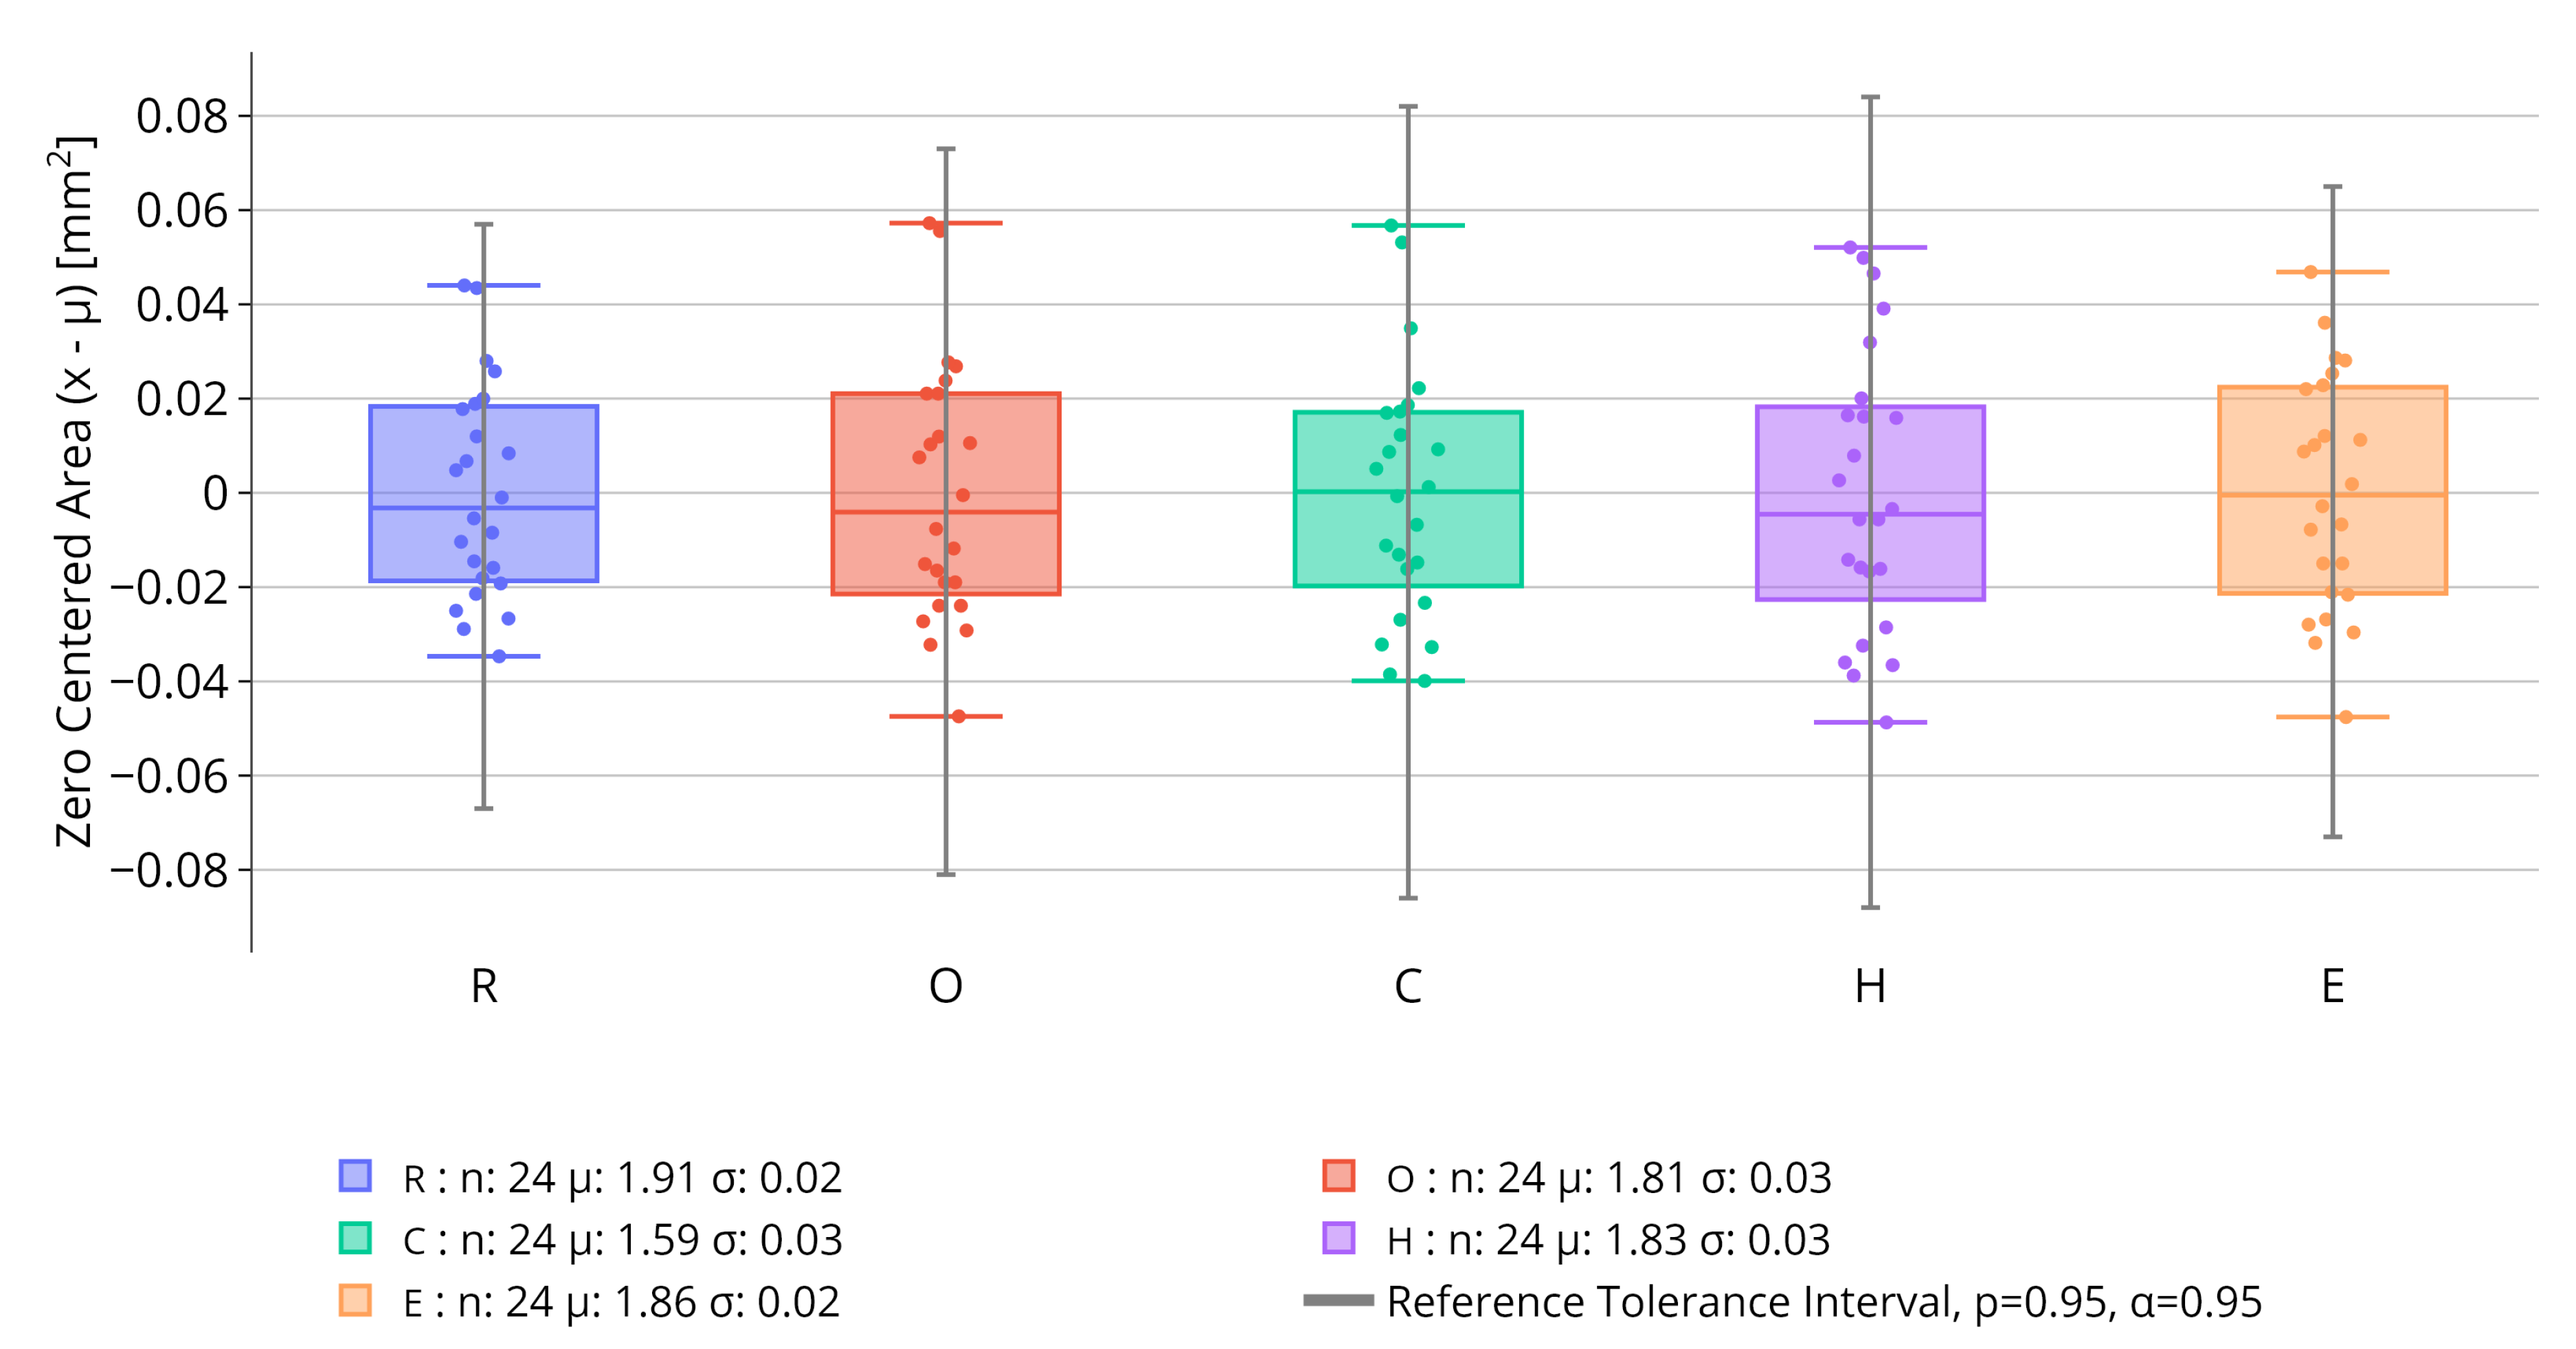
Figure 14.
Confusion matrices for three measurements conducted on batch 1 to 3. For different parameters used to calculate the Tolerance Intervals (TIs), specifically the population coverage p and a confidence level . The truth values, i.e. the real defects, are obtained via visual inspection of every tablet sampled from the different batches. The distinction is based exclusively on defects that are outlier to the TIs, calculated using measurement data from the three different batches. (a) and ; (b) and
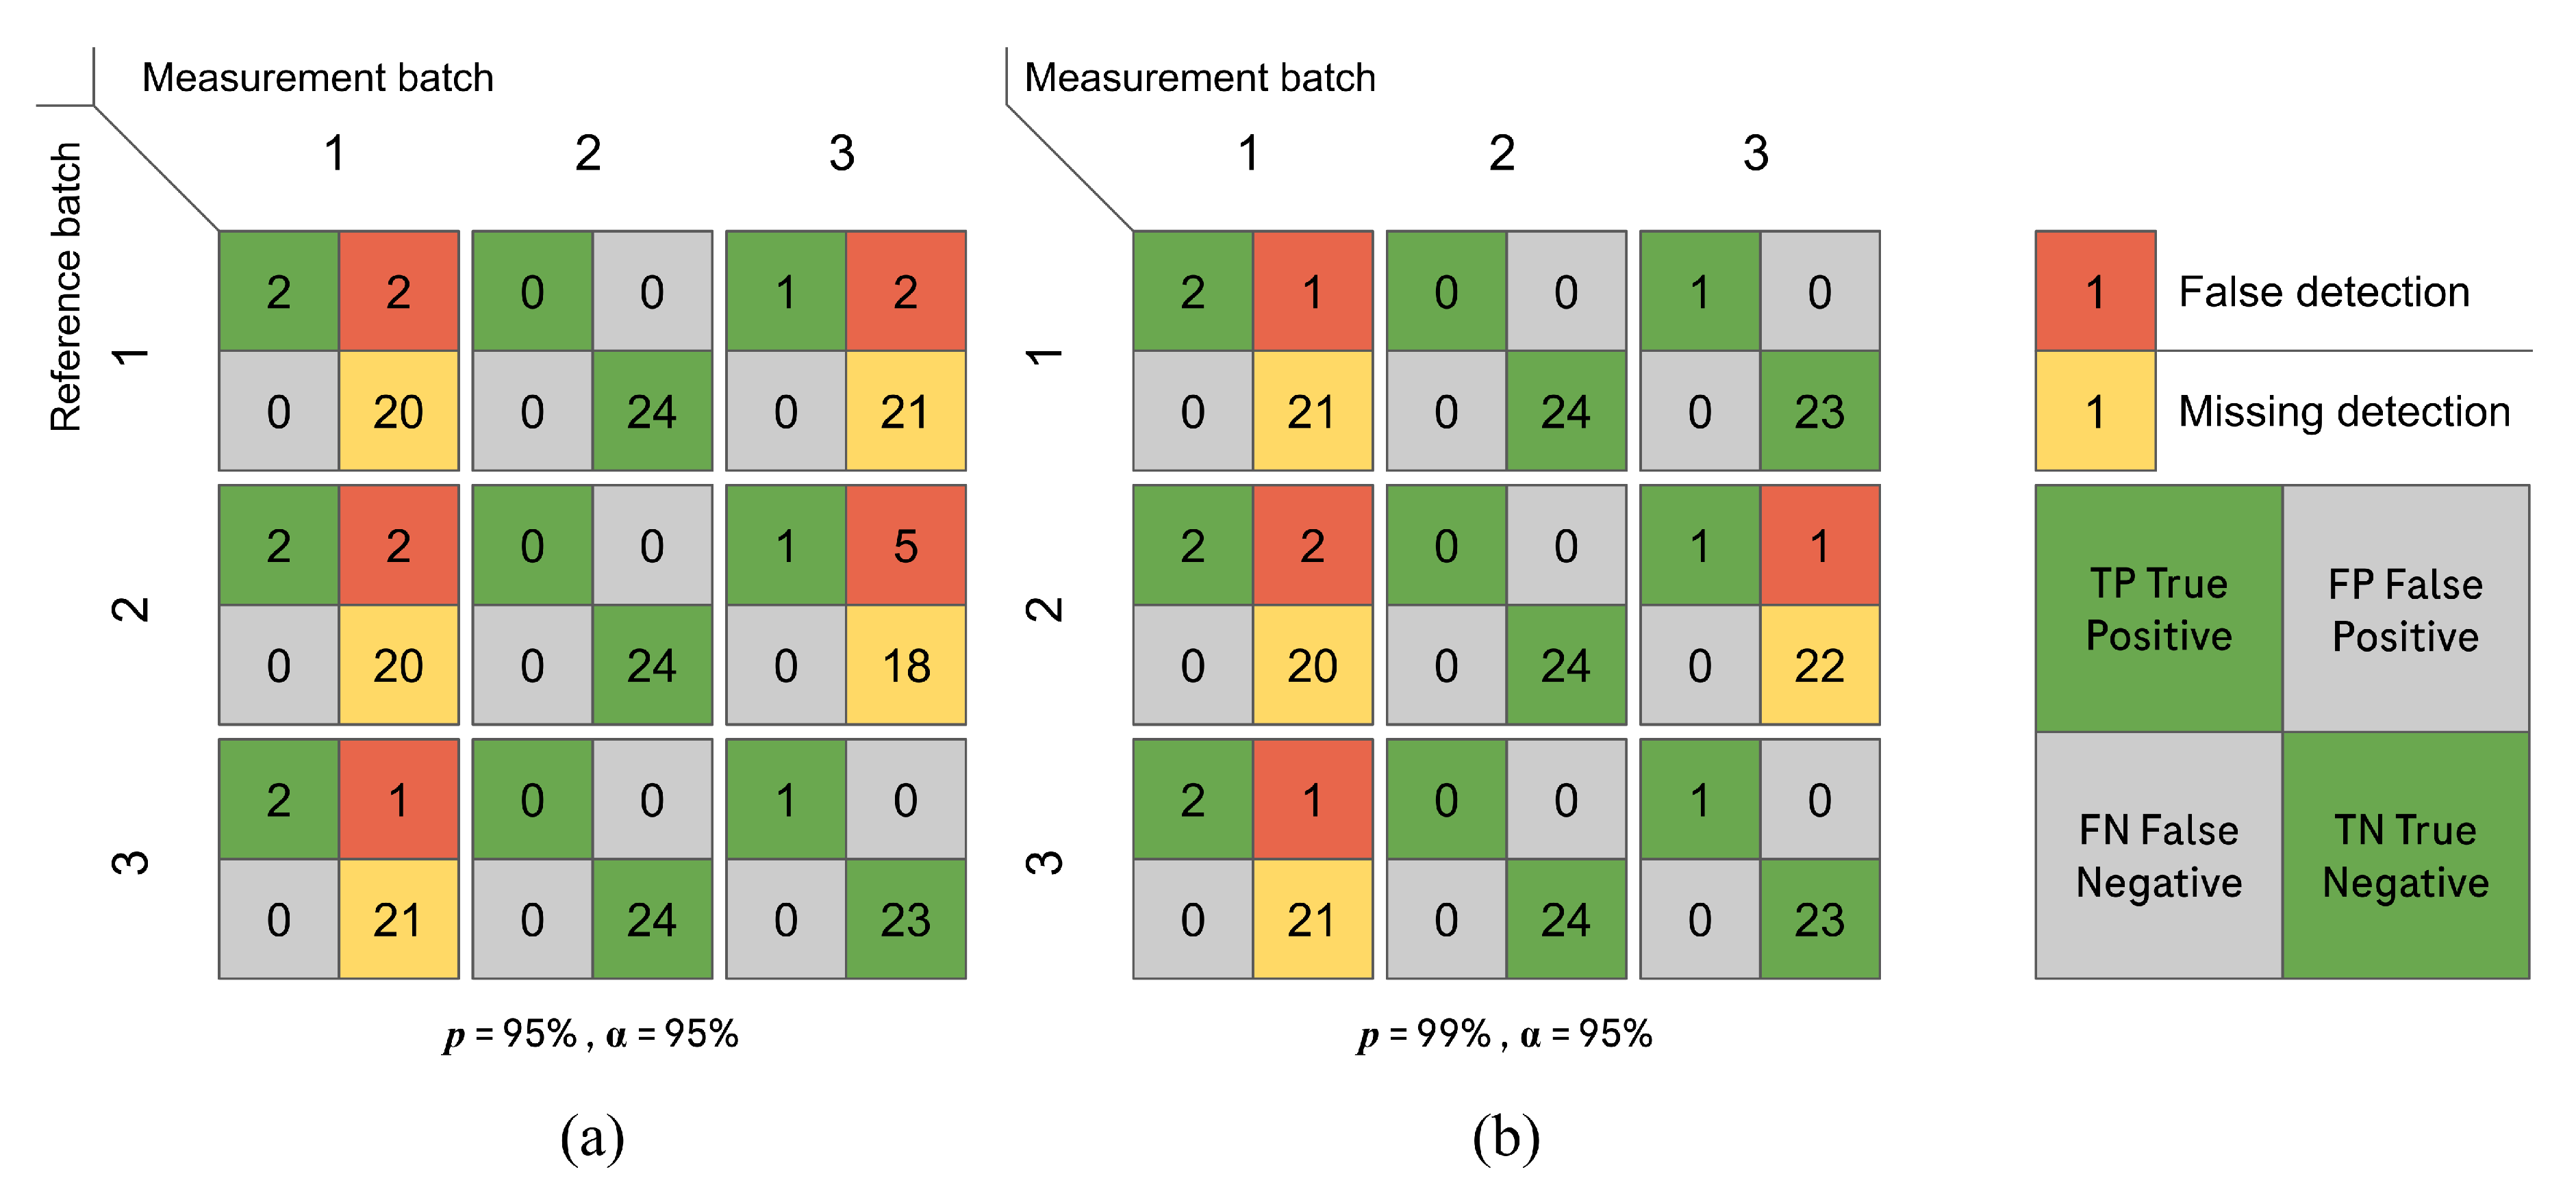

Table 1.
Normalized Root Mean Square Error (NRMSE) for the character perimeter, character area, tablet perimeter and tablet area between two identical consecutive measurements of 15 tablets on the microscope.
Table 1.
Normalized Root Mean Square Error (NRMSE) for the character perimeter, character area, tablet perimeter and tablet area between two identical consecutive measurements of 15 tablets on the microscope.
| Characters | Tablets | |||||
|---|---|---|---|---|---|---|
| R | O | C | H | E | ||
| NRMSE Perimeter () | 12.78 | 10.99 | 7.89 | 8.74 | 6.16 | 34.60 |
| NRMSE Area () | 2.39 | 2.15 | 3.60 | 3.63 | 2.98 | 8.88 |
Disclaimer/Publisher’s Note: The statements, opinions and data contained in all publications are solely those of the individual author(s) and contributor(s) and not of MDPI and/or the editor(s). MDPI and/or the editor(s) disclaim responsibility for any injury to people or property resulting from any ideas, methods, instructions or products referred to in the content. |
© 2025 by the authors. Licensee MDPI, Basel, Switzerland. This article is an open access article distributed under the terms and conditions of the Creative Commons Attribution (CC BY) license (http://creativecommons.org/licenses/by/4.0/).
Copyright: This open access article is published under a Creative Commons CC BY 4.0 license, which permit the free download, distribution, and reuse, provided that the author and preprint are cited in any reuse.


