
Submitted:
03 March 2025
Posted:
04 March 2025
You are already at the latest version
Abstract
Metastatic prostate cancer (mPCa) remains a significant global health concern and cause of cancer-related mortality in men. Advances in molecular profiling have illuminated the critical drivers of disease progression and therapeutic resistance, notably within the androgen receptor (AR) axis, DNA damage repair (DDR) pathways, and PI3K/AKT/mTOR network. Despite the established benefits of hormone therapy, chemotherapy, and bone-targeting agents, mPCa commonly evolves into a treatment-resistant state, typified by intrapatient heterogeneity and clonal evolution. Recent breakthroughs have highlighted the importance of identifying actionable genetic alterations such as BRCA2 or ATM defects that render tumors sensitive to poly-ADP ribose polymerase (PARP) inhibitors. Parallel efforts have refined imaging—particularly prostate-specific membrane antigen (PSMA) PET-CT—to detect and localize metastatic lesions with high sensitivity, thereby guiding patient selection for PSMA-targeted radioligand therapies (177Lu-PSMA, 225Ac-PSMA). Multi-omics innovations, including liquid biopsy technologies, enable real-time tracking of emergent AR splice variants (e.g., AR-V7) or reversion mutations, supporting adaptive therapy paradigms. Nonetheless, the complexity of mPCa necessitates combination strategies—for example, pairing AR inhibition with PI3K/AKT blockade or PARP inhibitors—to intercept tumor plasticity. Immuno-oncology approaches remain challenging in unselected patients; however, subsets with mismatch repair deficiency (MSI-high) or neuroendocrine phenotypes may benefit from immune checkpoint blockade or targeted epigenetic interventions. We present these pivotal advances and discuss how biomarker-guided integrative treatments can improve the management of mPCa.
Keywords:
1. Introduction
2. Molecular Pathophysiology of Metastatic Prostate Cancer
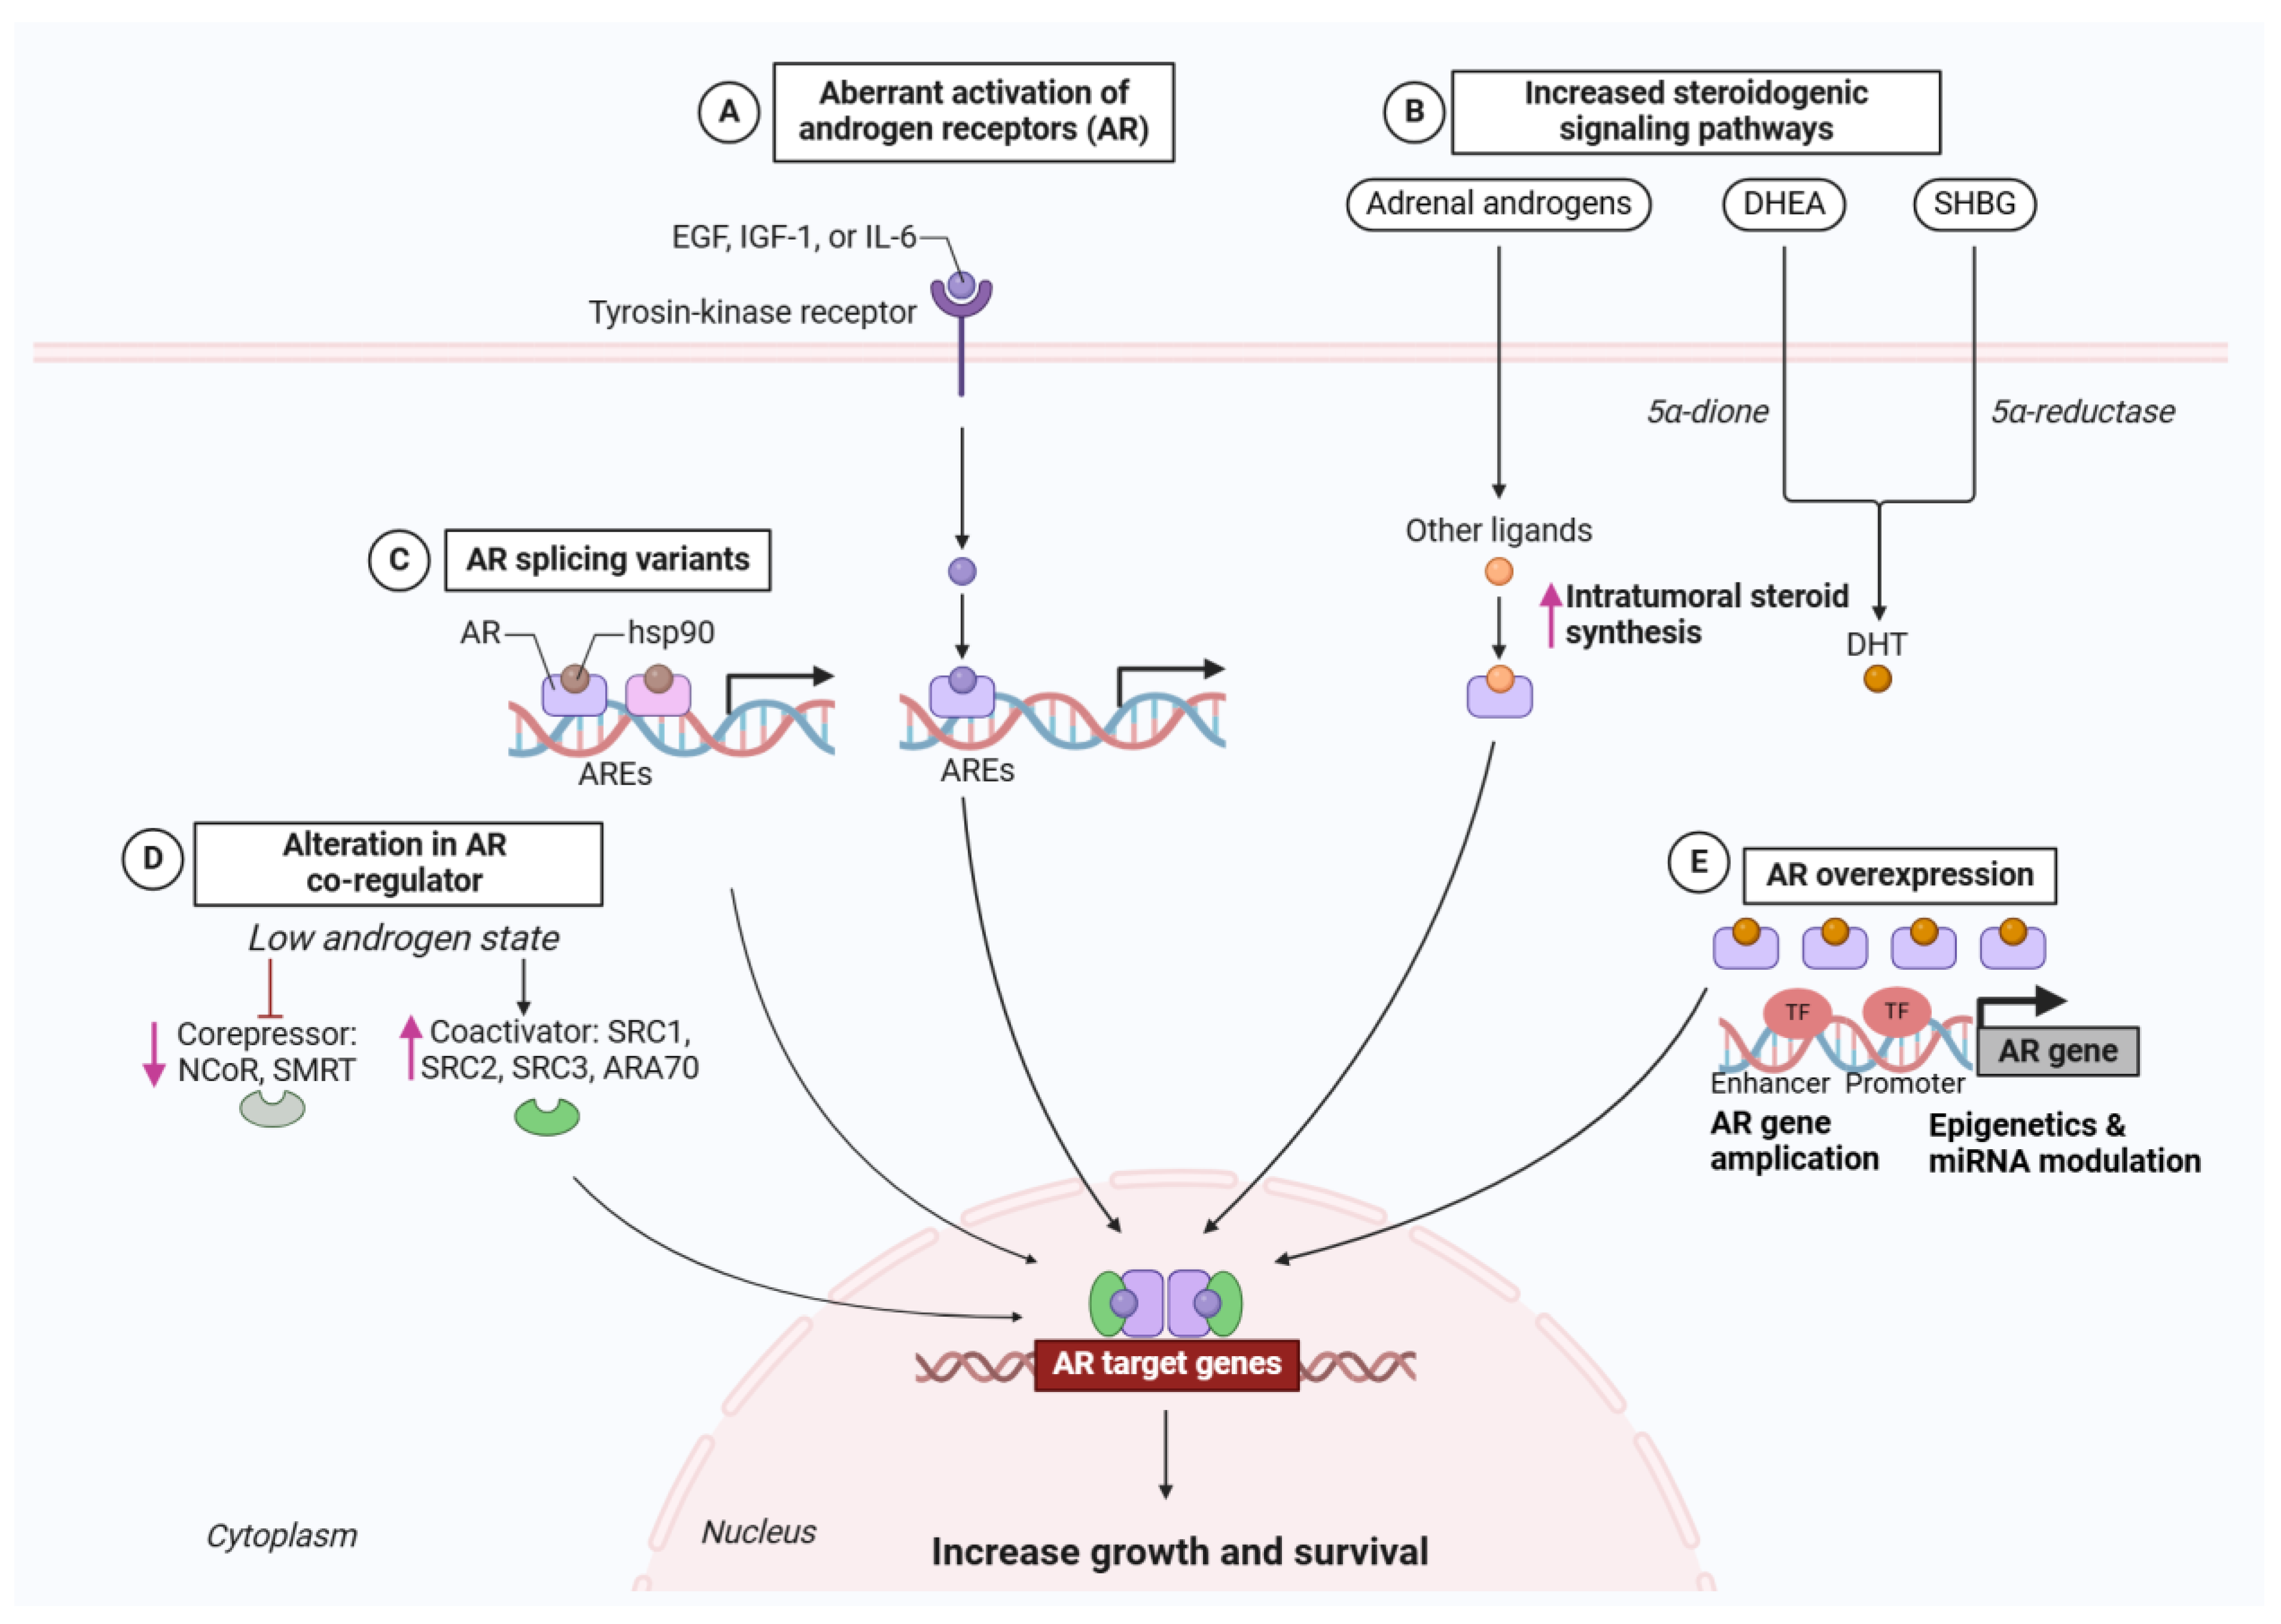
2.1. Centrality of the Androgen Receptor (AR) Axis
2.1.1. Historical Underpinnings and Core AR Functions
2.1.2. Routes to AR Reactivation Under Therapeutic Pressure
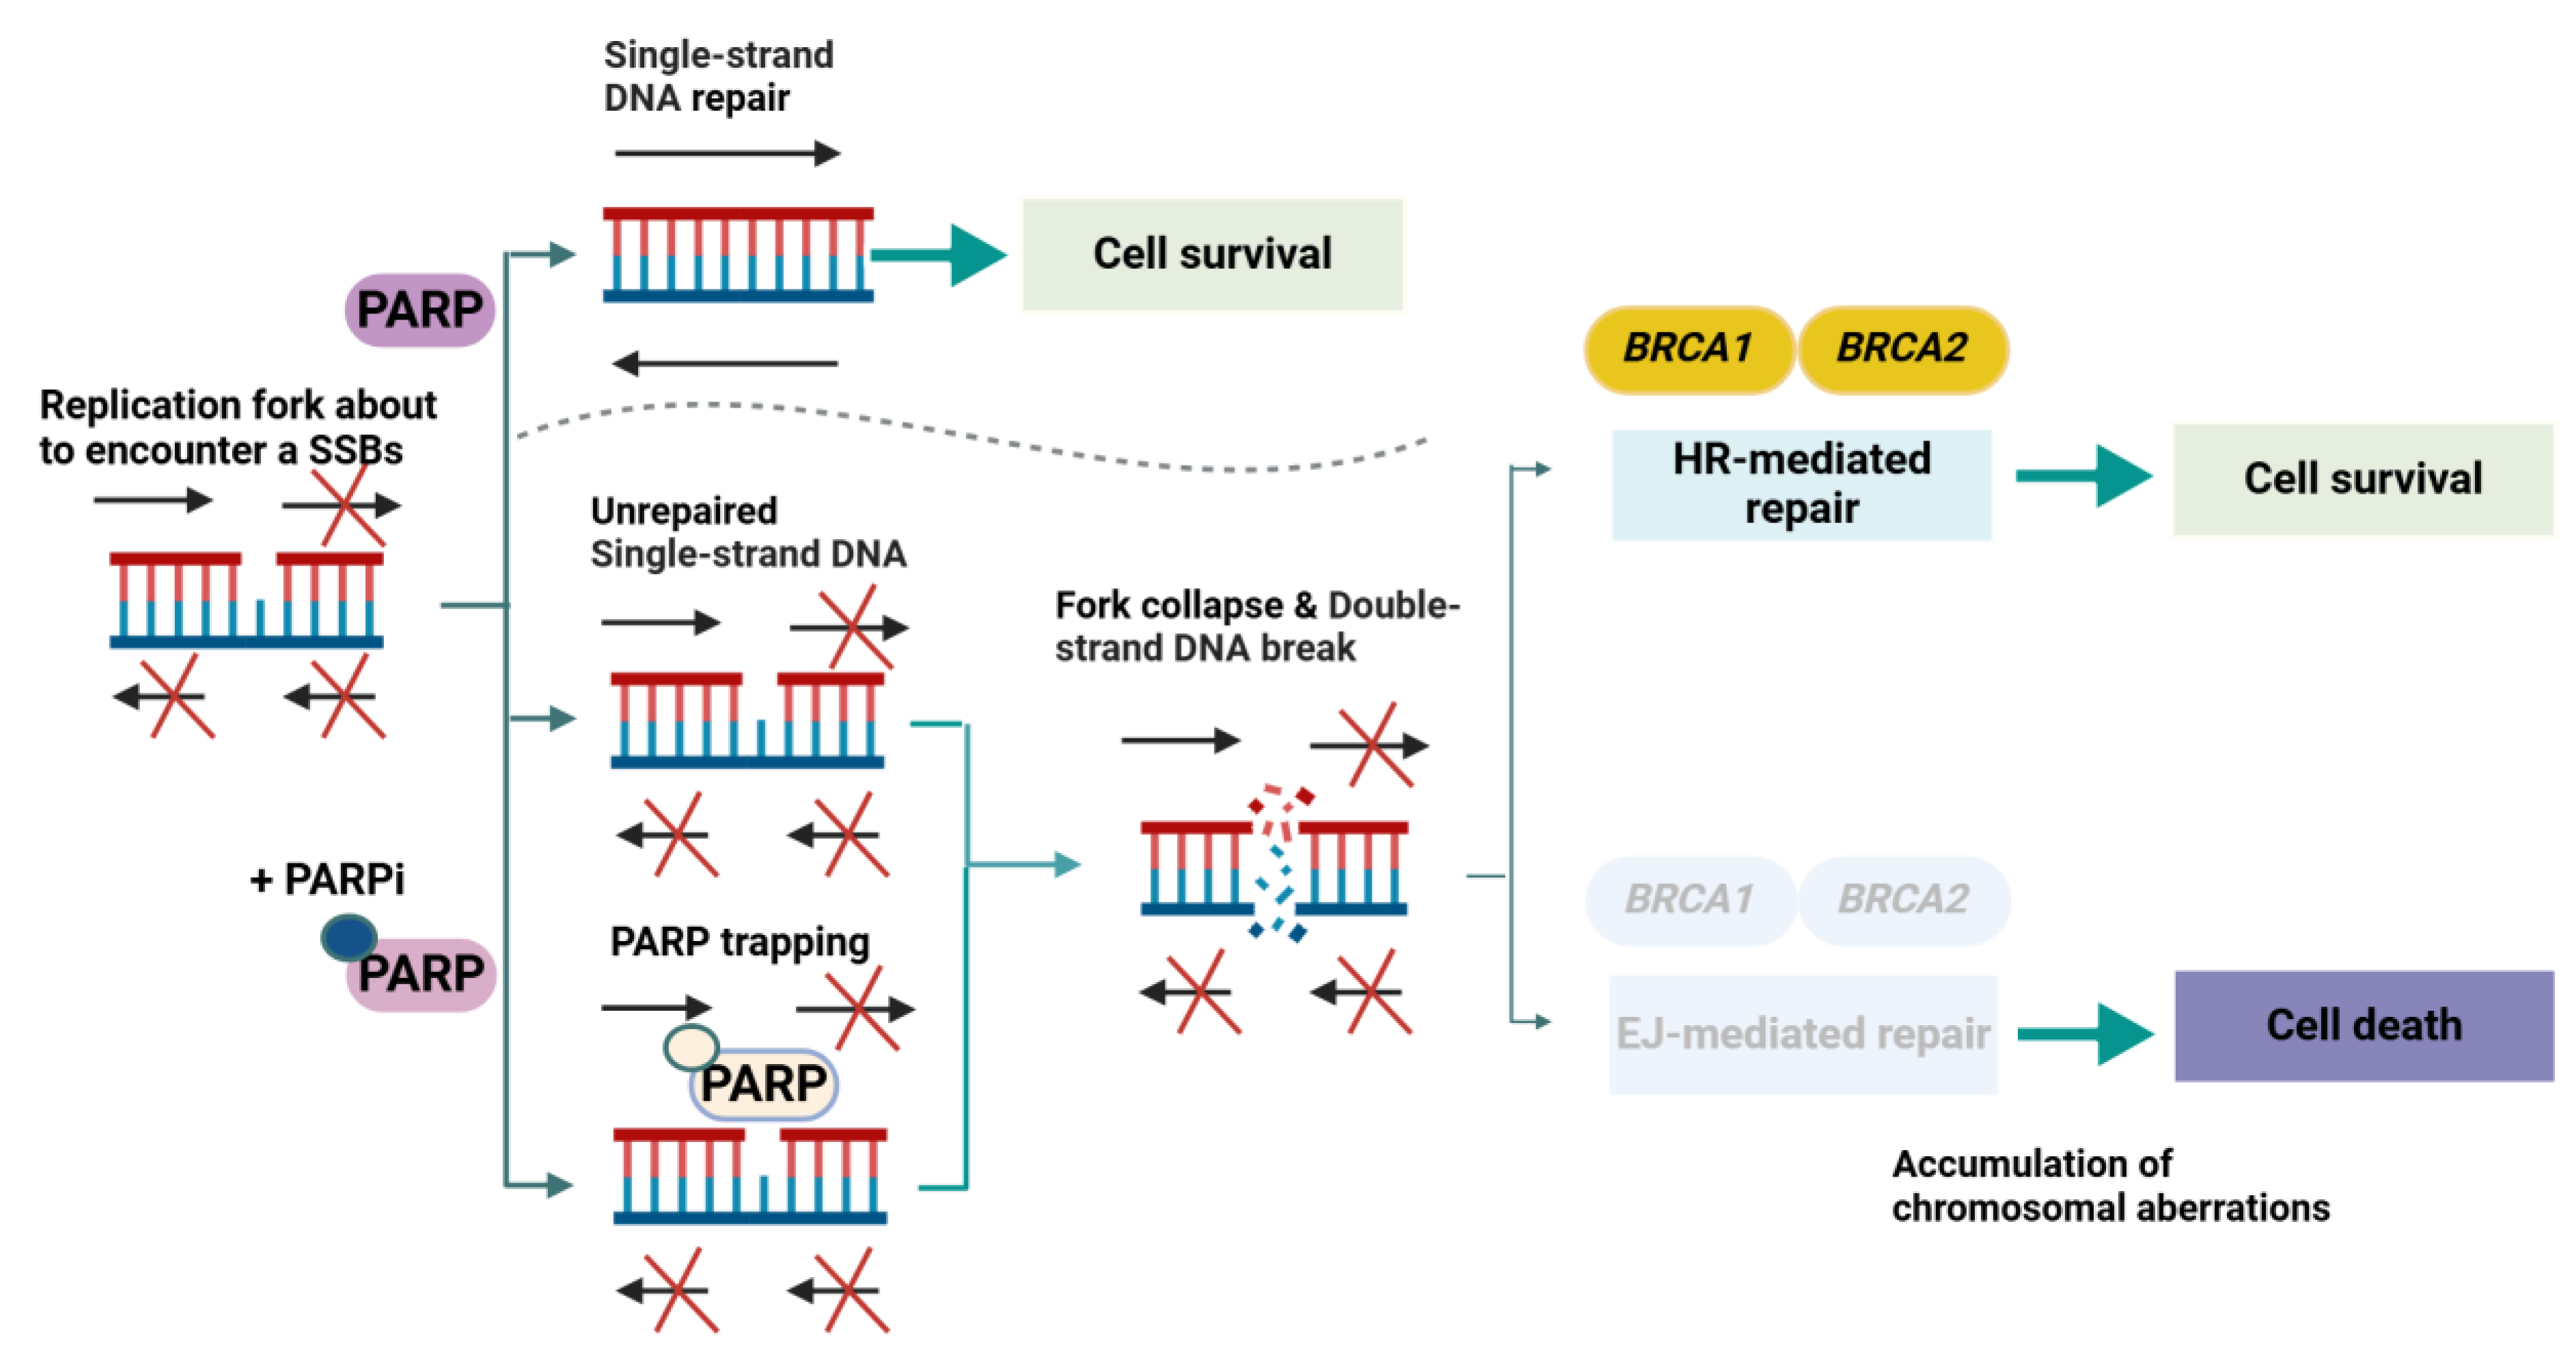
2.2. PARP Inhibitors and the Synthetic Lethality Paradigm (Molecular Pathophysiology Focus)
2.2.1. Historical Context and Foundational Insights
2.2.2. Core Molecular Mechanisms in Prostate Cancer
2.2.3. Adaptive and Resistance Mechanisms
2.2.4. Research Methodologies and Knowledge Gaps
2.2.5. Forward-Looking Perspectives in Molecular Pathophysiology
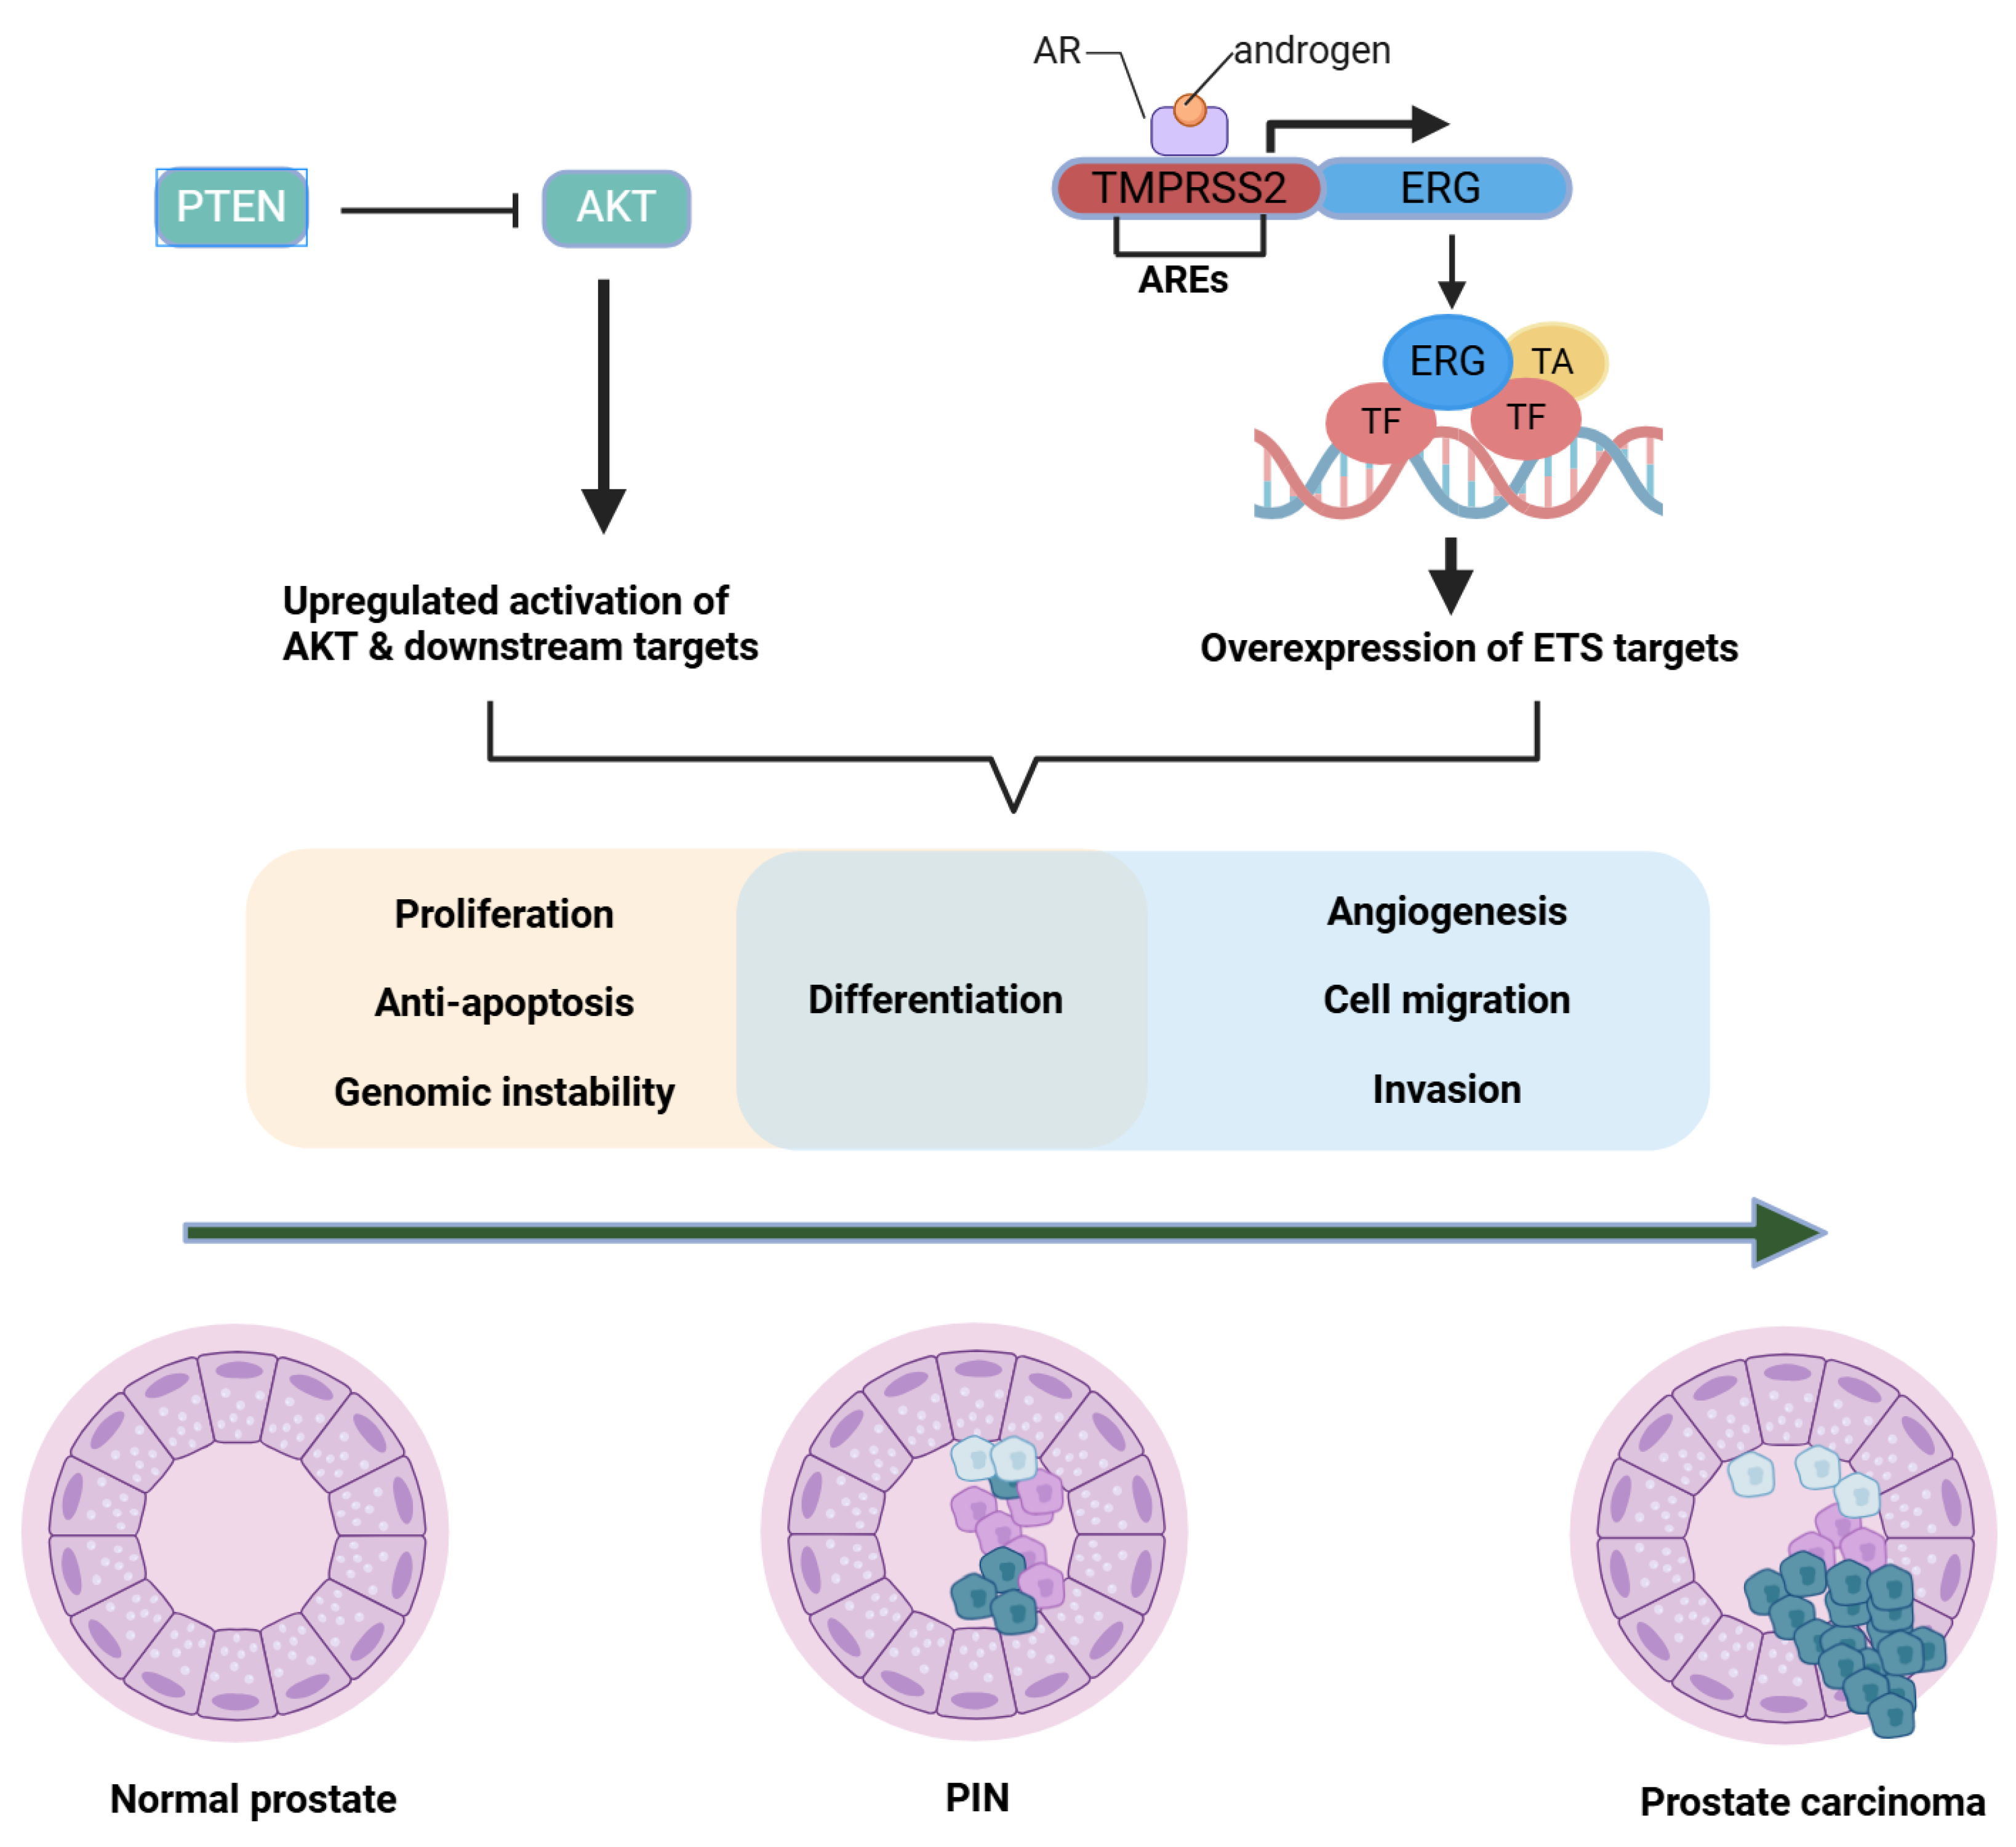
2.3. TMPRSS2-ERG Fusions and Oncogenic Transcription Factors (Molecular Pathophysiology Focus)
2.3.1. Historical to Current Understanding
2.3.2. Mechanistic Insights
2.3.3. Methodological Limitations
2.3.4. Clinical or Scientific Significance
2.3.5. Comparisons, Divergent Findings, and Future Outlook
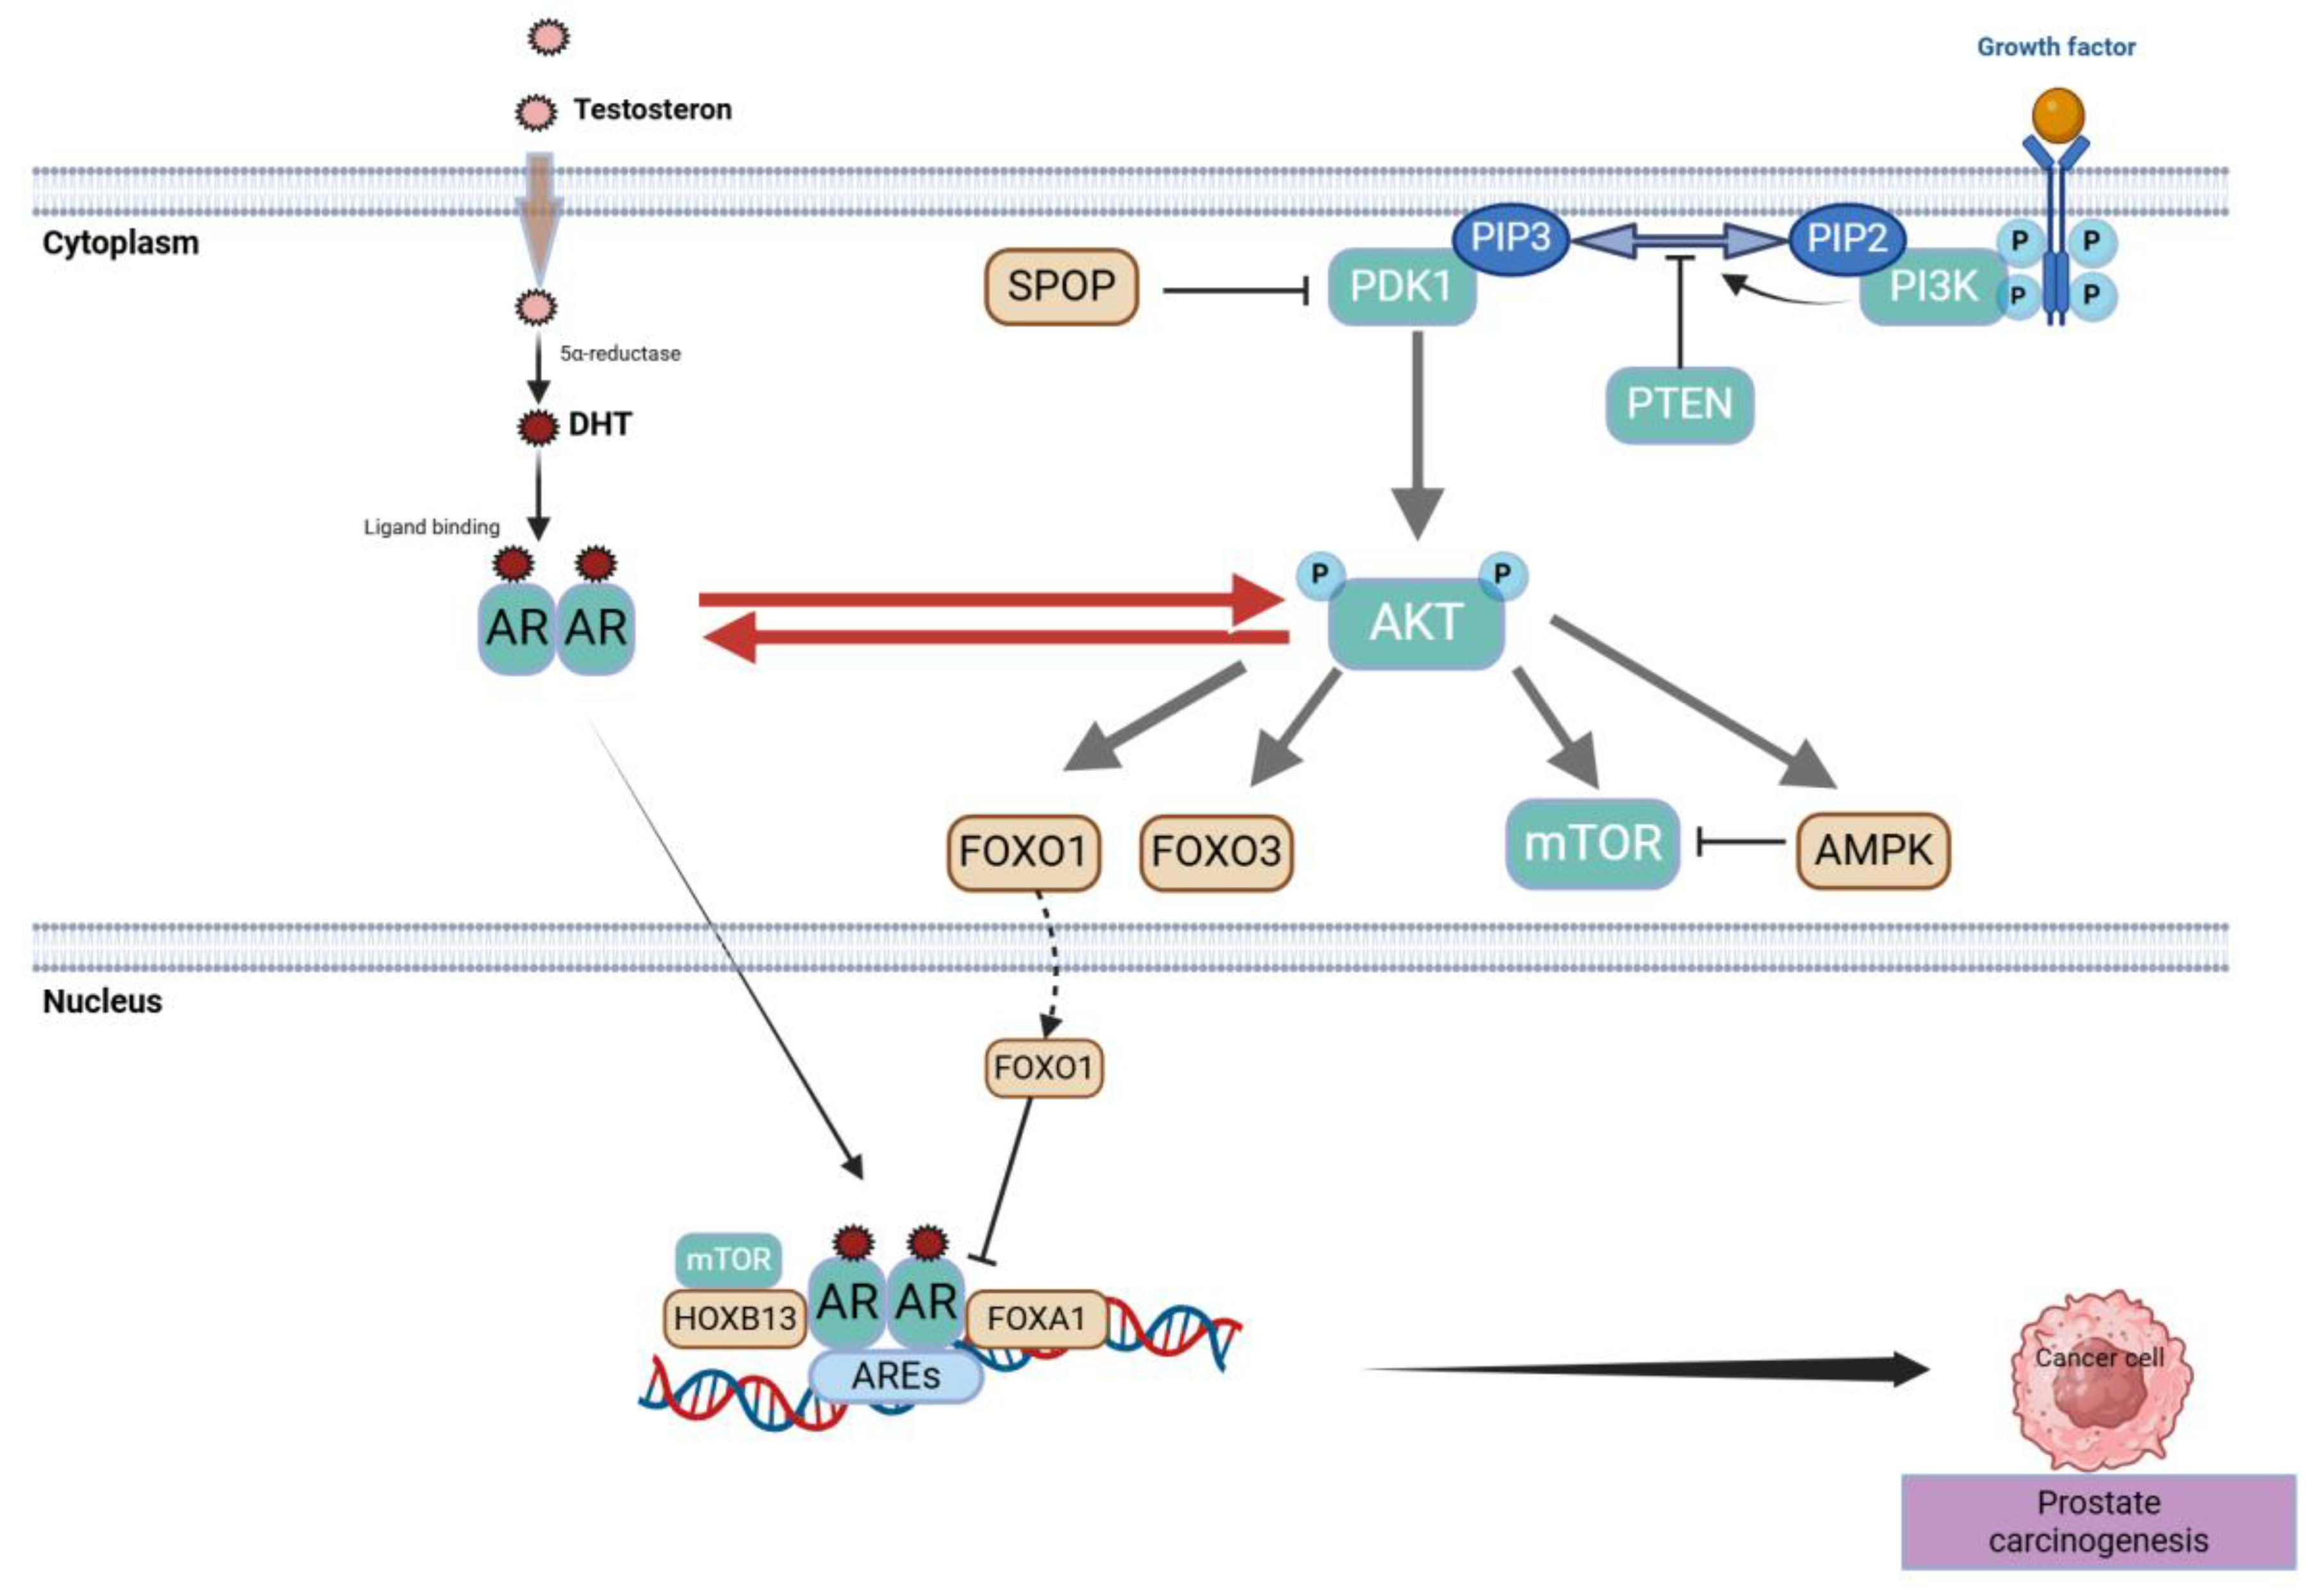
2.4. PTEN Loss, PI3K/AKT/mTOR Hyperactivation, and Crosstalk with AR (Molecular Pathophysiology Focus)
2.4.1. Historical to Current Perspective
2.4.2. Mechanistic Insights
2.4.3. Methodological Constraints
2.4.4. Clinical or Scientific Significance
2.4.5. Contrasting Evidence and Future Directions
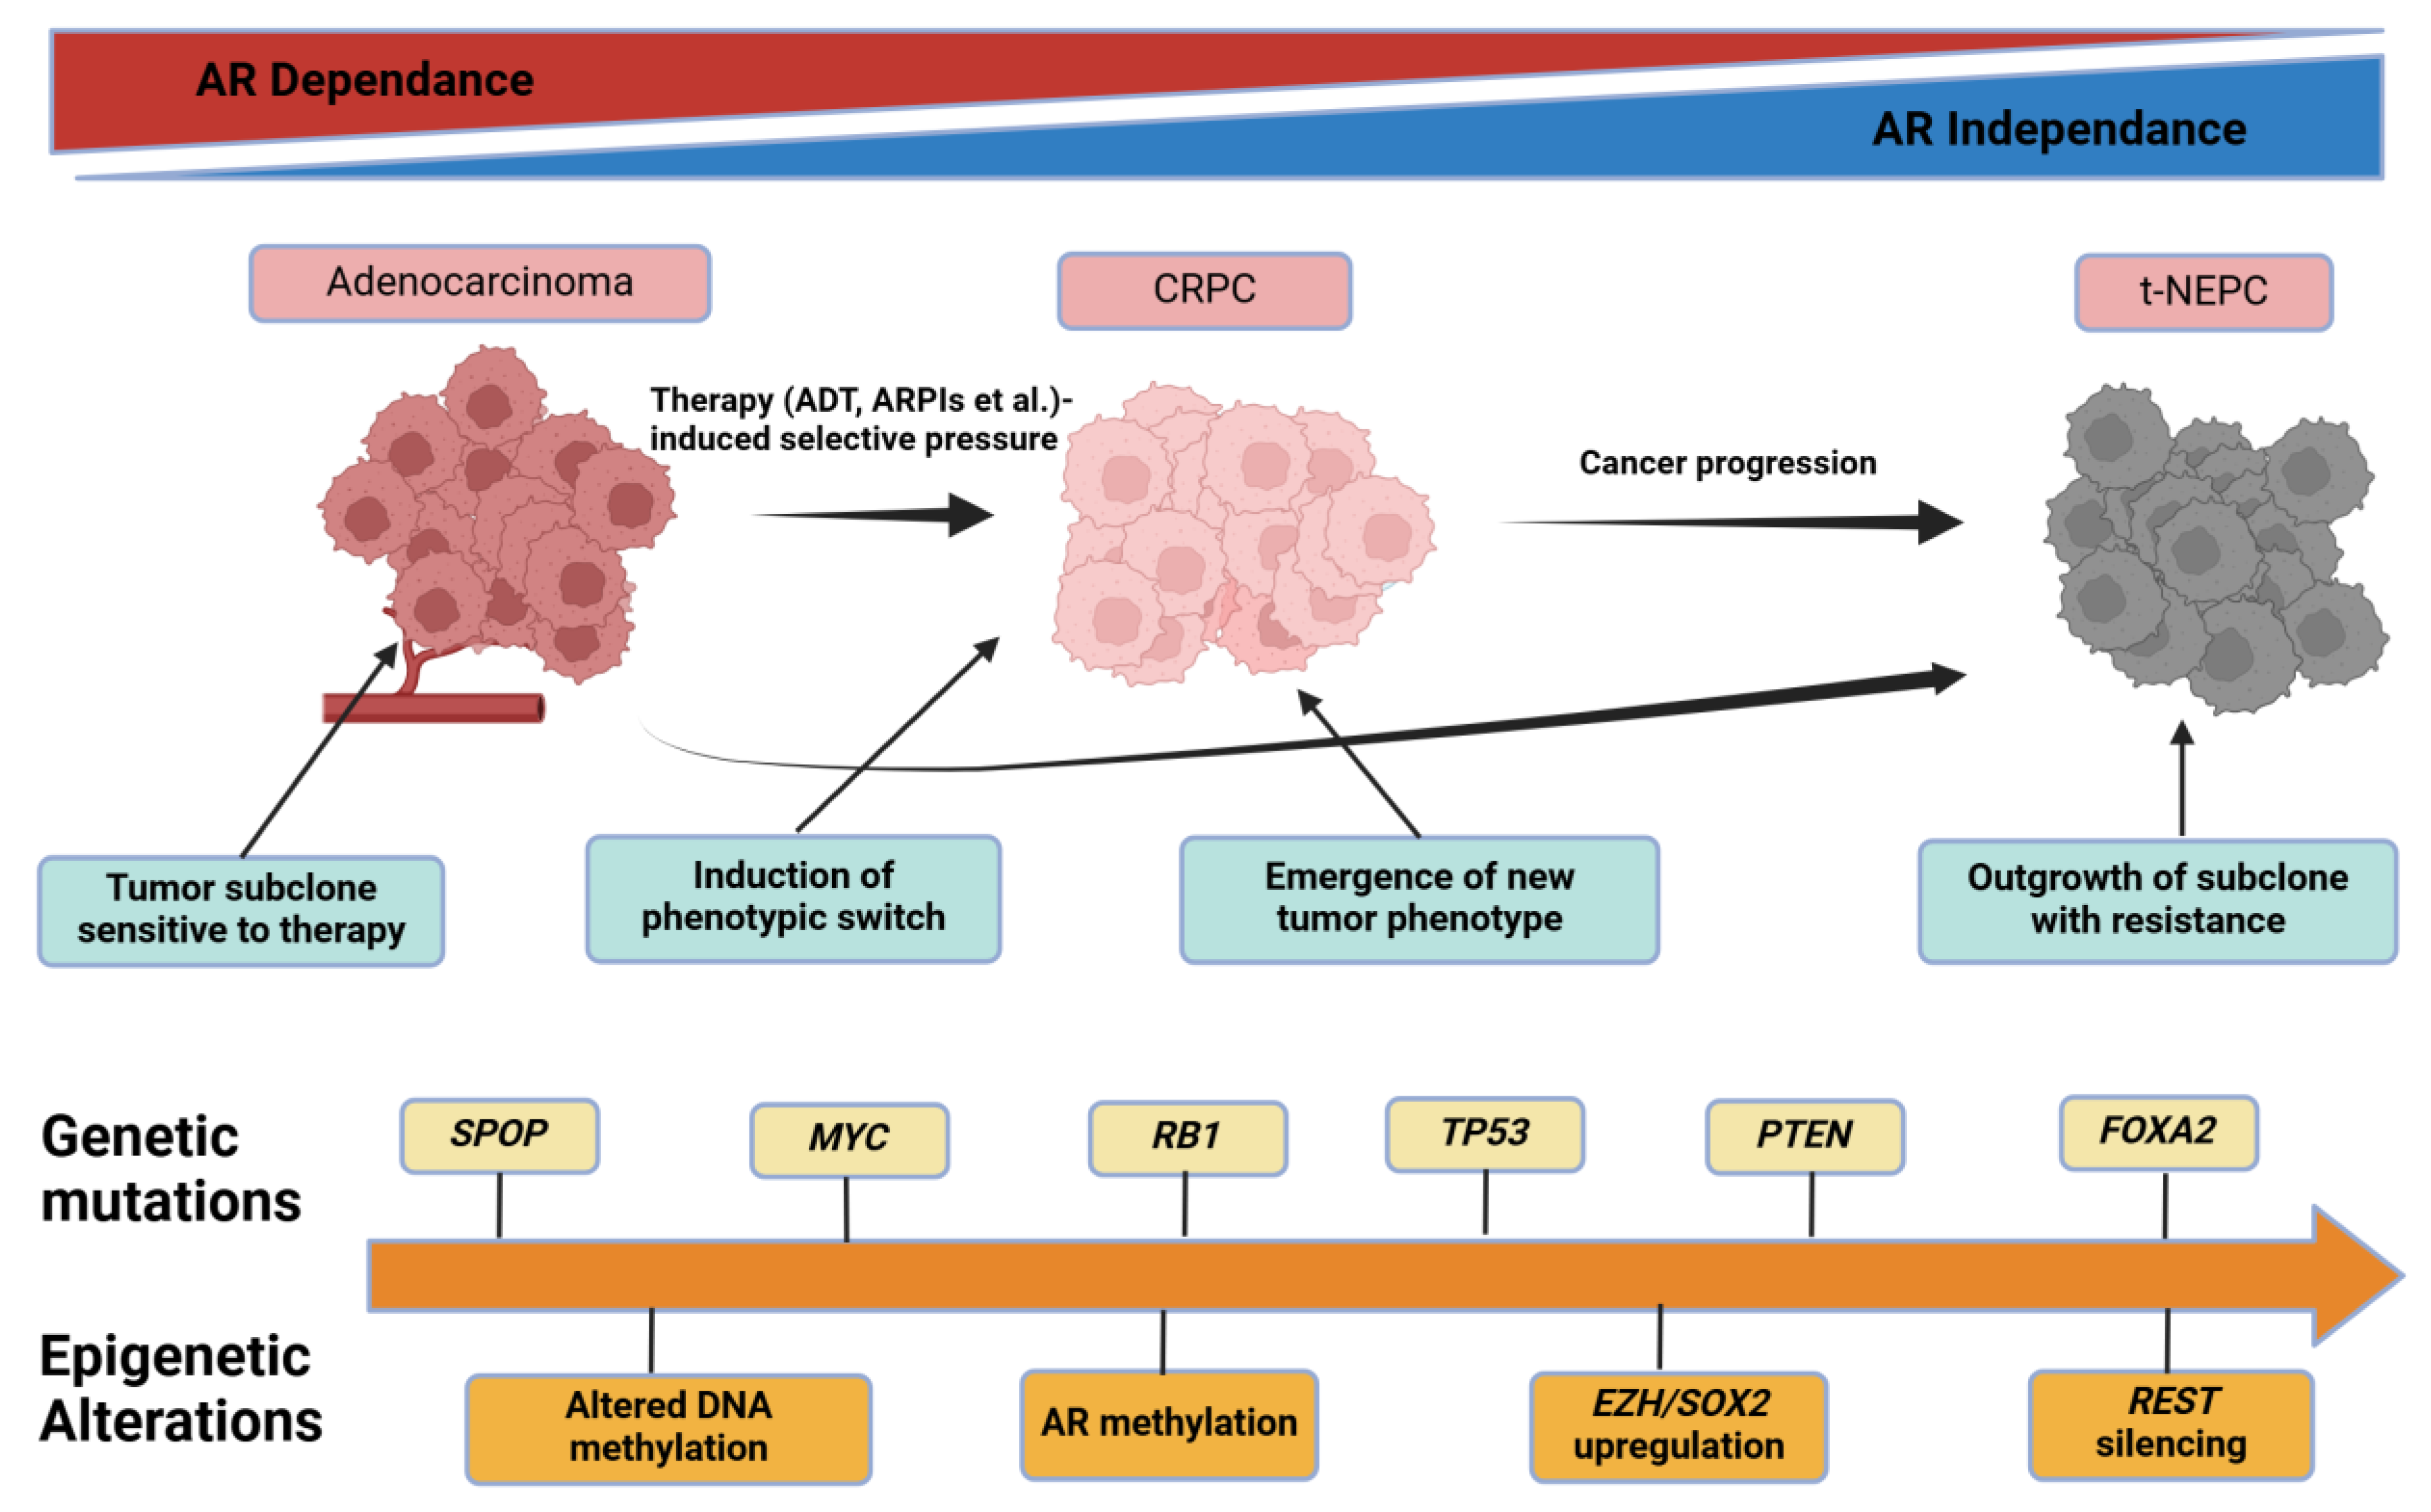
2.5. Tumor Heterogeneity, Clonal Evolution, and Lineage Plasticity
2.5.1. Historical to Current Understanding
2.5.2. Mechanistic Insights on Clonal Dynamics
2.5.3. Methodological Constraints
2.5.4. Clinical or Scientific Significance
2.5.5. Comparisons and Divergent Data
2.5.6. Future Outlook
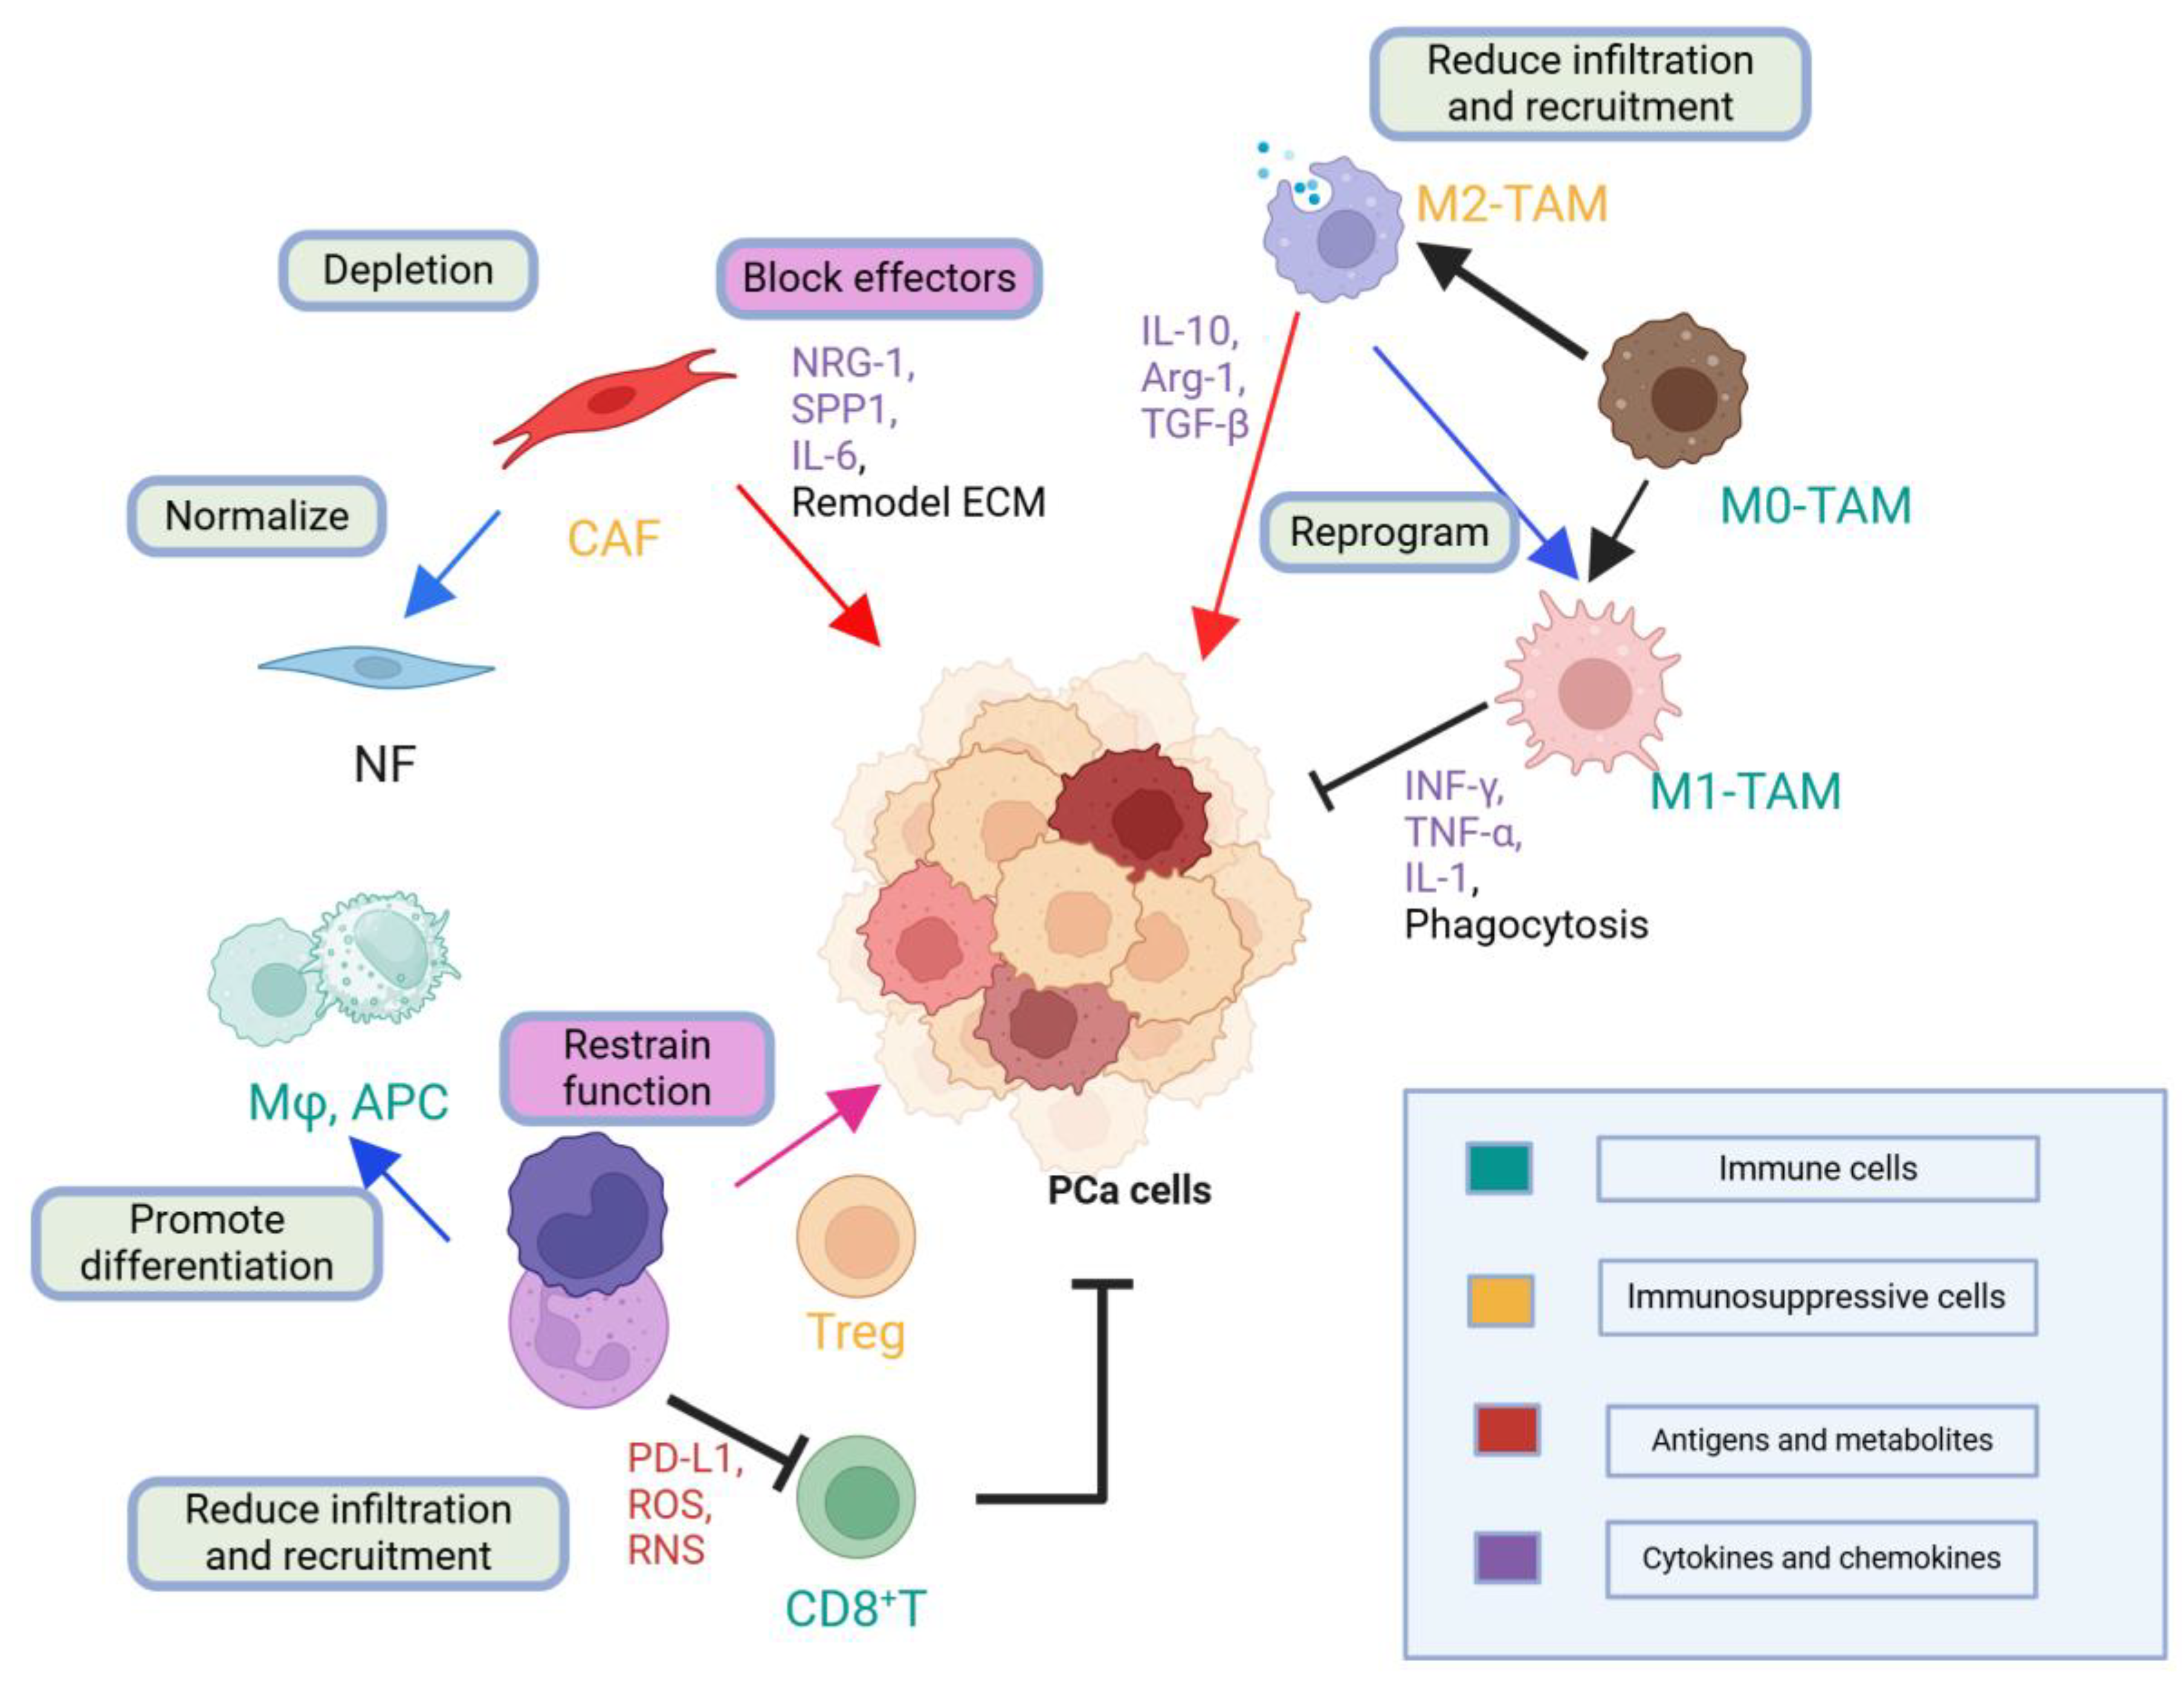
2.6. Tumor Microenvironment (TME) and Immune Dynamics (Molecular Pathophysiology Focus)
2.6.1. Historical to Current Understanding
2.6.2. Mechanistic Insights
2.6.3. Methodological Constraints
2.6.4. Clinical or Scientific Significance
2.6.5. Comparisons and Divergent Data
2.6.6. Future Outlook
3. Molecular Stratification and Diagnostic Advances
3.1. High-Resolution Molecular Profiling
3.2. Companion Diagnostics and Gene Panels
3.2.1. DDR-Focused Panels for PARP Inhibitor Selection
3.2.2. AR Variant Detection and PTEN/PI3K Panels
3.3. Advanced Imaging: PSMA PET-CT and Beyond
3.4. Liquid Biopsies in Metastatic Prostate Cancer
3.4.1. Historical Context and Technological Evolution
3.4.2. Methodological Approaches and Clinical Relevance
3.4.3. Critical Assessment and Significance
3.4.4. Methodological Challenges
3.4.5. Future Outlook
4. Targeted Therapeutic Approaches
4.1. AR Axis–Centric Treatments
4.2. DDR-Defect–Based Therapies: PARP Inhibitors and Beyond
4.3. Targeting PI3K/AKT/mTOR and WNT Pathways
4.4. Immuno-Oncology Approaches
4.5. PSMA-Targeted Radioligand Therapy
5. Conclusion and Future Perspectives
Author Contributions
Funding
Acknowledgments
Conflicts of Interest
Abbreviations
| mPCa | metastatic prostate cancer |
| AR | androgen receptor |
| DDR | DNA damage repair |
| PARP | poly-ADP ribose polymerase |
| PSMA | prostate-specific membrane antigen |
| PCa | prostate cancer |
| mCRPC | metastatic castration-resistant prostate cancer |
| TME | tumor microenvironment |
| NGS | next-generation sequencing |
| ADT | androgen deprivation therapy |
| DHT | testosterone–dihydrotestosterone |
| NTD | N-terminal transactivation domain |
| DBD | DNA-binding domain |
| LBD | ligand-binding domain |
| ARE | androgen response element |
| CRISPR | clustered regularly interspaced short palindromic repeats |
| PROTAC | proteolysis-targeting chimera |
| CAR-T | chimeric antigen receptor T |
| HR | homologous recombination |
| DSB | double-strand break |
| NHEJ | non-homologous end joining |
| EMT | epithelial–mesenchymal transition |
| PIP3 | phosphatidylinositol (3,4,5)-trisphosphate |
| t-NEPC | treatment-induced neuroendocrine prostate cancer |
| ctDNA | circulating tumor DNA |
| MDSC | myeloid-derived suppressor cell |
| TAM | tumor-associated macrophage |
| Treg | regulatory T cell |
| WES/WGS | whole-exome/genome sequencing |
| FAP | fibroblast activation protein |
| CTC | circulating tumor cell |
| cfDNA | cell-free DNA |
| t-NEPC | treatment-emergent neuroendocrine prostate cancer |
References
- Bergengren, O.; Pekala, K.R.; Matsoukas, K.; Fainberg, J.; Mungovan, S.F.; Bratt, O.; Bray, F.; Brawley, O.; Luckenbaugh, A.N.; Mucci, L.; et al. 2022 Update on Prostate Cancer Epidemiology and Risk Factors-A Systematic Review. Eur Urol 2023, 84, 191-206. [CrossRef]
- Lv, Z.; Wang, X.; Zhu, C.; Wang, K. The global status of research in prostate cancer bone metastasis: A bibliometric and visualized analysis. Frontiers in Medicine 2022, 9. [CrossRef]
- Chen, H.; Lyu, F.; Gao, X. Advances in ferroptosis for castration-resistant prostate cancer treatment: novel drug targets and combination therapy strategies. Prostate Cancer and Prostatic Diseases 2024. [CrossRef]
- Rawat, C.; Heemers, H.V. Alternative splicing in prostate cancer progression and therapeutic resistance. Oncogene 2024, 43, 1655-1668. [CrossRef]
- Mian, O.Y.; Tendulkar, R.D.; Abazeed, M.E. The evolving role of molecular profiling in prostate cancer: basal and luminal subtyping transcends tissue of origin. Translational Cancer Research 2017, S1441-S1445.
- Singhal, U.; Nallandhighal, S.; Tosoian, J.J.; Hu, K.; Pham, T.M.; Stangl-Kremser, J.; Liu, C.-J.; Karim, R.; Plouffe, K.R.; Morgan, T.M.; et al. Integrative multi-region molecular profiling of primary prostate cancer in men with synchronous lymph node metastasis. Nature Communications 2024, 15, 4341. [CrossRef]
- Taylor, A.K.; Kosoff, D.; Emamekhoo, H.; Lang, J.M.; Kyriakopoulos, C.E. PARP inhibitors in metastatic prostate cancer. Front Oncol 2023, 13, 1159557. [CrossRef]
- Kwon, W.-A. PARP Inhibitors in the Treatment of Prostate Cancer: From Scientific Rationale to Clinical Development. World J Mens Health 2024, 42, 290-303.
- Seed, G.; Beije, N.; Yuan, W.; Bertan, C.; Goodall, J.; Lundberg, A.; Tyler, M.; Figueiredo, I.; Pereira, R.; Baker, C.; et al. Elucidating acquired PARP inhibitor resistance in advanced prostate cancer. Cancer Cell 2024, 42, 2113-2123.e2114. [CrossRef]
- Sekine, Y.; Nakayama, H.; Miyazawa, Y.; Arai, S.; Koike, H.; Matsui, H.; Shibata, Y.; Ito, K.; Suzuki, K. Ratio of the expression levels of androgen receptor splice variant 7 to androgen receptor in castration refractory prostate cancer. Oncol Lett 2021, 22, 831. [CrossRef]
- Mena, E.; Lindenberg, L.; Choyke, P. The Impact of PSMA PET/CT Imaging in Prostate Cancer Radiation Treatment. Semin Nucl Med 2022, 52, 255-262. [CrossRef]
- Zhu, S.; Chen, J.; Zeng, H. Our Current Understanding of the Heterogeneity in Prostate Cancer and Renal Cell Carcinoma. J Clin Med 2023, 12. [CrossRef]
- Brady, L.; Kriner, M.; Coleman, I.; Morrissey, C.; Roudier, M.; True, L.D.; Gulati, R.; Plymate, S.R.; Zhou, Z.; Birditt, B.; et al. Inter- and intra-tumor heterogeneity of metastatic prostate cancer determined by digital spatial gene expression profiling. Nature Communications 2021, 12, 1426. [CrossRef]
- Woodcock, D.J.; Riabchenko, E.; Taavitsainen, S.; Kankainen, M.; Gundem, G.; Brewer, D.S.; Ellonen, P.; Lepistö, M.; Golubeva, Y.A.; Warner, A.C.; et al. Prostate cancer evolution from multilineage primary to single lineage metastases with implications for liquid biopsy. Nature Communications 2020, 11, 5070. [CrossRef]
- Bruni, S.; Mercogliano, M.F.; Mauro, F.L.; Cordo Russo, R.I.; Schillaci, R. Cancer immune exclusion: breaking the barricade for a successful immunotherapy. Front Oncol 2023, 13, 1135456. [CrossRef]
- Tiwari, A.; Oravecz, T.; Dillon, L.A.; Italiano, A.; Audoly, L.; Fridman, W.H.; Clifton, G.T. Towards a consensus definition of immune exclusion in cancer. Frontiers in Immunology 2023, 14. [CrossRef]
- Zhao, Y.; Shen, M.; Wu, L.; Yang, H.; Yao, Y.; Yang, Q.; Du, J.; Liu, L.; Li, Y.; Bai, Y. Stromal cells in the tumor microenvironment: accomplices of tumor progression? Cell Death & Disease 2023, 14, 587. [CrossRef]
- Clifton, G.T.; Rothenberg, M.; Ascierto, P.A.; Begley, G.; Cecchini, M.; Eder, J.P.; Ghiringhelli, F.; Italiano, A.; Kochetkova, M.; Li, R.; et al. Developing a definition of immune exclusion in cancer: results of a modified Delphi workshop. J Immunother Cancer 2023, 11. [CrossRef]
- Tang, T.; Huang, X.; Zhang, G.; Hong, Z.; Bai, X.; Liang, T. Advantages of targeting the tumor immune microenvironment over blocking immune checkpoint in cancer immunotherapy. Signal Transduction and Targeted Therapy 2021, 6, 72. [CrossRef]
- Kaizer, A.M.; Belli, H.M.; Ma, Z.; Nicklawsky, A.G.; Roberts, S.C.; Wild, J.; Wogu, A.F.; Xiao, M.; Sabo, R.T. Recent innovations in adaptive trial designs: A review of design opportunities in translational research. J Clin Transl Sci 2023, 7, e125. [CrossRef]
- Duan, X.-P.; Qin, B.-D.; Jiao, X.-D.; Liu, K.; Wang, Z.; Zang, Y.-S. New clinical trial design in precision medicine: discovery, development and direction. Signal Transduction and Targeted Therapy 2024, 9, 57. [CrossRef]
- Mirza, M.R.; Coleman, R.L.; González-Martín, A.; Moore, K.N.; Colombo, N.; Ray-Coquard, I.; Pignata, S. The forefront of ovarian cancer therapy: update on PARP inhibitors. Annals of Oncology 2020, 31, 1148-1159. [CrossRef]
- Tulpule, V.; Morrison, G.J.; Falcone, M.; Quinn, D.I.; Goldkorn, A. Integration of Liquid Biopsies in Clinical Management of Metastatic Prostate Cancer. Curr Oncol Rep 2022, 24, 1287-1298. [CrossRef]
- Trujillo, B.; Wu, A.; Wetterskog, D.; Attard, G. Blood-based liquid biopsies for prostate cancer: clinical opportunities and challenges. Br J Cancer 2022, 127, 1394-1402. [CrossRef]
- Benadada, F.; Saad, F.; Delouya, G.; Taussky, D. Charles Brenton Huggins: A historical review of the Nobel laureate’s pioneering discoveries. Cancer 2024, 130, 1019-1024. [CrossRef]
- He, Y.; Xu, W.; Xiao, Y.-T.; Huang, H.; Gu, D.; Ren, S. Targeting signaling pathways in prostate cancer: mechanisms and clinical trials. Signal Transduction and Targeted Therapy 2022, 7, 198. [CrossRef]
- Jacob, A.; Raj, R.; Allison, D.B.; Myint, Z.W. Androgen Receptor Signaling in Prostate Cancer and Therapeutic Strategies. Cancers (Basel) 2021, 13. [CrossRef]
- Ge, Q.; Li, J.; Yang, F.; Tian, X.; Zhang, M.; Hao, Z.; Liang, C.; Meng, J. Molecular classifications of prostate cancer: basis for individualized risk stratification and precision therapy. Ann Med 2023, 55, 2279235. [CrossRef]
- Li, C.; Cheng, D.; Li, P. Androgen receptor dynamics in prostate cancer: from disease progression to treatment resistance. Frontiers in Oncology 2025, 15. [CrossRef]
- Fujita, K.; Nonomura, N. Role of Androgen Receptor in Prostate Cancer: A Review. World J Mens Health 2019, 37, 288-295. [CrossRef]
- Watson, P.A.; Chen, Y.F.; Balbas, M.D.; Wongvipat, J.; Socci, N.D.; Viale, A.; Kim, K.; Sawyers, C.L. Constitutively active androgen receptor splice variants expressed in castration-resistant prostate cancer require full-length androgen receptor. Proceedings of the National Academy of Sciences 2010, 107, 16759-16765. [CrossRef]
- Moigne, R.L.; Mawji, N.R.; Banuelos, C.A.; Wang, J.; Jian, K.; Andersen, R.J.; Sadar, M.D.; Zhou, H.-J.; Virsik, P. Abstract 1292: A new generation of N-terminal domain androgen receptor inhibitors, with improved pharmaceutical properties, in castration-resistant prostate cancer models. Cancer Research 2019, 79, 1292-1292. [CrossRef]
- Hung, C.L.; Liu, H.H.; Fu, C.W.; Yeh, H.H.; Hu, T.L.; Kuo, Z.K.; Lin, Y.C.; Jhang, M.R.; Hwang, C.S.; Hsu, H.C.; et al. Targeting androgen receptor and the variants by an orally bioavailable Proteolysis Targeting Chimeras compound in castration resistant prostate cancer. EBioMedicine 2023, 90, 104500. [CrossRef]
- Gokbayrak, B.; Altintas, U.B.; Lingadahalli, S.; Morova, T.; Huang, C.-C.F.; Ersoy Fazlioglu, B.; Pak Lok Yu, I.; Kalkan, B.M.; Cejas, P.; Kung, S.H.Y.; et al. Identification of selective SWI/SNF dependencies in enzalutamide-resistant prostate cancer. Communications Biology 2025, 8, 169. [CrossRef]
- Wu, F.; Zhang, H.; Hao, M. Interactions between key genes and pathways in prostate cancer progression and therapy resistance. Frontiers in Oncology 2025, 15. [CrossRef]
- Zhou, L.; Zhang, C.; Zhang, Y.; Shi, C. Application of Organoid Models in Prostate Cancer Research. Frontiers in Oncology 2021, 11. [CrossRef]
- Fang, S.; Zhe, S.; Lin, H.-M.; Azad, A.A.; Fettke, H.; Kwan, E.M.; Horvath, L.; Mak, B.; Zheng, T.; Du, P.; et al. Multi-Omic Integration of Blood-Based Tumor-Associated Genomic and Lipidomic Profiles Using Machine Learning Models in Metastatic Prostate Cancer. JCO Clinical Cancer Informatics 2023, e2300057. [CrossRef]
- Ashworth, A.; Lord, C.J. Synthetic lethal therapies for cancer: what’s next after PARP inhibitors? Nat Rev Clin Oncol 2018, 15, 564-576. [CrossRef]
- Catalano, M.; Generali, D.; Gatti, M.; Riboli, B.; Paganini, L.; Nesi, G.; Roviello, G. DNA repair deficiency as circulating biomarker in prostate cancer. Frontiers in Oncology 2023, 13. [CrossRef]
- Gong, X.; Liu, C.; Tang, H.; Wu, S.; Yang, Q. Application and research progress of synthetic lethality in the development of anticancer therapeutic drugs. Frontiers in Oncology 2024, 14. [CrossRef]
- Lukashchuk, N.; Barnicle, A.; Adelman, C.A.; Armenia, J.; Kang, J.; Barrett, J.C.; Harrington, E.A. Impact of DNA damage repair alterations on prostate cancer progression and metastasis. Frontiers in Oncology 2023, 13. [CrossRef]
- Harrision, D.; Gravells, P.; Thompson, R.; Bryant, H.E. Poly(ADP-Ribose) Glycohydrolase (PARG) vs. Poly(ADP-Ribose) Polymerase (PARP) – Function in Genome Maintenance and Relevance of Inhibitors for Anti-cancer Therapy. Frontiers in Molecular Biosciences 2020, 7. [CrossRef]
- Lozano, R.; Castro, E.; Aragón, I.M.; Cendón, Y.; Cattrini, C.; López-Casas, P.P.; Olmos, D. Genetic aberrations in DNA repair pathways: a cornerstone of precision oncology in prostate cancer. British Journal of Cancer 2021, 124, 552-563. [CrossRef]
- Bhamidipati, D.; Haro-Silerio, J.I.; Yap, T.A.; Ngoi, N. PARP inhibitors: enhancing efficacy through rational combinations. British Journal of Cancer 2023, 129, 904-916. [CrossRef]
- Herberts, C.; Wyatt, A.W.; Nguyen, P.L.; Cheng, H.H. Genetic and Genomic Testing for Prostate Cancer: Beyond DNA Repair. American Society of Clinical Oncology Educational Book 2023, e390384. [CrossRef]
- Zhang, W.; van Gent, D.C.; Incrocci, L.; van Weerden, W.M.; Nonnekens, J. Role of the DNA damage response in prostate cancer formation, progression and treatment. Prostate Cancer Prostatic Dis 2020, 23, 24-37. [CrossRef]
- Qian, J.; Liao, G.; Chen, M.; Peng, R.-W.; Yan, X.; Du, J.; Huang, R.; Pan, M.; Lin, Y.; Gong, X.; et al. Advancing cancer therapy: new frontiers in targeting DNA damage response. Frontiers in Pharmacology 2024, 15. [CrossRef]
- Walmsley, C.S.; Jonsson, P.; Cheng, M.L.; McBride, S.; Kaeser, C.; Vargas, H.A.; Laudone, V.; Taylor, B.S.; Kappagantula, R.; Baez, P.; et al. Convergent evolution of BRCA2 reversion mutations under therapeutic pressure by PARP inhibition and platinum chemotherapy. npj Precision Oncology 2024, 8, 34. [CrossRef]
- St John, J.; Powell, K.; Conley-Lacomb, M.K.; Chinni, S.R. TMPRSS2-ERG Fusion Gene Expression in Prostate Tumor Cells and Its Clinical and Biological Significance in Prostate Cancer Progression. J Cancer Sci Ther 2012, 4, 94-101. [CrossRef]
- Lorenzin, F.; Demichelis, F. Past, Current, and Future Strategies to Target ERG Fusion-Positive Prostate Cancer. Cancers (Basel) 2022, 14. [CrossRef]
- Scaravilli, M.; Koivukoski, S.; Latonen, L. Androgen-Driven Fusion Genes and Chimeric Transcripts in Prostate Cancer. Frontiers in Cell and Developmental Biology 2021, 9. [CrossRef]
- van Dessel, L.F.; van Riet, J.; Smits, M.; Zhu, Y.; Hamberg, P.; van der Heijden, M.S.; Bergman, A.M.; van Oort, I.M.; de Wit, R.; Voest, E.E.; et al. The genomic landscape of metastatic castration-resistant prostate cancers reveals multiple distinct genotypes with potential clinical impact. Nature Communications 2019, 10, 5251. [CrossRef]
- He, J.; Zhang, C.; Ozkan, A.; Feng, T.; Duan, P.; Wang, S.; Yang, X.; Xie, J.; Liu, X. Patient-derived tumor models and their distinctive applications in personalized drug therapy. Mechanobiology in Medicine 2023, 1, 100014. [CrossRef]
- García-Perdomo, H.A.; Chaves, M.J.; Osorio, J.C.; Sanchez, A. Association between TMPRSS2:ERG fusion gene and the prostate cancer: systematic review and meta-analysis. Cent European J Urol 2018, 71, 410-419. [CrossRef]
- Adamo, P.; Ladomery, M.R. The oncogene ERG: a key factor in prostate cancer. Oncogene 2016, 35, 403-414. [CrossRef]
- Nam, R.K.; Sugar, L.; Yang, W.; Srivastava, S.; Klotz, L.H.; Yang, L.Y.; Stanimirovic, A.; Encioiu, E.; Neill, M.; Loblaw, D.A.; et al. Expression of the TMPRSS2:ERG fusion gene predicts cancer recurrence after surgery for localised prostate cancer. British Journal of Cancer 2007, 97, 1690-1695. [CrossRef]
- Turnham, D.J.; Bullock, N.; Dass, M.S.; Staffurth, J.N.; Pearson, H.B. The PTEN Conundrum: How to Target PTEN-Deficient Prostate Cancer. Cells 2020, 9. [CrossRef]
- Hashemi, M.; Taheriazam, A.; Daneii, P.; Hassanpour, A.; Kakavand, A.; Rezaei, S.; Hejazi, E.S.; Aboutalebi, M.; Gholamrezaie, H.; Saebfar, H.; et al. Targeting PI3K/Akt signaling in prostate cancer therapy. J Cell Commun Signal 2023, 17, 423-443. [CrossRef]
- Raith, F.; O’Donovan, D.H.; Lemos, C.; Politz, O.; Haendler, B. Addressing the Reciprocal Crosstalk between the AR and the PI3K/AKT/mTOR Signaling Pathways for Prostate Cancer Treatment. Int J Mol Sci 2023, 24. [CrossRef]
- Zhang, B.; Liu, M.; Mai, F.; Li, X.; Wang, W.; Huang, Q.; Du, X.; Ding, W.; Li, Y.; Barwick, B.G.; et al. Interruption of KLF5 acetylation promotes PTEN-deficient prostate cancer progression by reprogramming cancer-associated fibroblasts. J Clin Invest 2024, 134. [CrossRef]
- Gupta, S.; To, T.M.; Graf, R.; Kadel, E.E.; Reilly, N.; Albarmawi, H. Real-World Overall Survival and Treatment Patterns by <i>PTEN</i> Status in Metastatic Castration-Resistant Prostate Cancer. JCO Precision Oncology 2024, e2300562. [CrossRef]
- Shorning, B.Y.; Dass, M.S.; Smalley, M.J.; Pearson, H.B. The PI3K-AKT-mTOR Pathway and Prostate Cancer: At the Crossroads of AR, MAPK, and WNT Signaling. Int J Mol Sci 2020, 21. [CrossRef]
- Miller, K.A.; Degan, S.; Wang, Y.; Cohen, J.; Ku, S.Y.; Goodrich, D.W.; Gelman, I.H. PTEN-regulated PI3K-p110 and AKT isoform plasticity controls metastatic prostate cancer progression. Oncogene 2024, 43, 22-34. [CrossRef]
- Fernandez-Mateos, J.; Cresswell, G.D.; Trahearn, N.; Webb, K.; Sakr, C.; Lampis, A.; Stuttle, C.; Corbishley, C.M.; Stavrinides, V.; Zapata, L.; et al. Tumor evolution metrics predict recurrence beyond 10 years in locally advanced prostate cancer. Nature Cancer 2024, 5, 1334-1351. [CrossRef]
- Hasan, A.M.M.; Cremaschi, P.; Wetterskog, D.; Jayaram, A.; Wong, S.Q.; Williams, S.; Pasam, A.; Trigos, A.; Trujillo, B.; Grist, E.; et al. Copy number architectures define treatment-mediated selection of lethal prostate cancer clones. Nature Communications 2023, 14, 4823. [CrossRef]
- Imamura, J.; Ganguly, S.; Muskara, A.; Liao, R.S.; Nguyen, J.K.; Weight, C.; Wee, C.E.; Gupta, S.; Mian, O.Y. Lineage plasticity and treatment resistance in prostate cancer: the intersection of genetics, epigenetics, and evolution. Front Endocrinol (Lausanne) 2023, 14, 1191311. [CrossRef]
- Weber, Z.T.; Collier, K.A.; Tallman, D.; Forman, J.; Shukla, S.; Asad, S.; Rhoades, J.; Freeman, S.; Parsons, H.A.; Williams, N.O.; et al. Modeling clonal structure over narrow time frames via circulating tumor DNA in metastatic breast cancer. Genome Med 2021, 13, 89. [CrossRef]
- Hong, M.K.H.; Macintyre, G.; Wedge, D.C.; Van Loo, P.; Patel, K.; Lunke, S.; Alexandrov, L.B.; Sloggett, C.; Cmero, M.; Marass, F.; et al. Tracking the origins and drivers of subclonal metastatic expansion in prostate cancer. Nature Communications 2015, 6, 6605. [CrossRef]
- Ge, R.; Wang, Z.; Cheng, L. Tumor microenvironment heterogeneity an important mediator of prostate cancer progression and therapeutic resistance. NPJ Precis Oncol 2022, 6, 31. [CrossRef]
- Peter, M.R.; Bilenky, M.; Davies, A.; Isserlin, R.; Bader, G.D.; Fleshner, N.E.; Hirst, M.; Zoubeidi, A.; Bapat, B. Distinct DNA methylation patterns associated with treatment resistance in metastatic castration resistant prostate cancer. Scientific Reports 2021, 11, 6630. [CrossRef]
- Kumaraswamy, A.; Duan, Z.; Flores, D.; Zhang, C.; Sehrawat, A.; Hu, Y.M.; Swaim, O.A.; Rodansky, E.; Storck, W.K.; Kuleape, J.A.; et al. LSD1 promotes prostate cancer reprogramming by repressing TP53 signaling independently of its demethylase function. JCI Insight 2023, 8. [CrossRef]
- Koushyar, S.; Meniel, V.S.; Phesse, T.J.; Pearson, H.B. Exploring the Wnt Pathway as a Therapeutic Target for Prostate Cancer. Biomolecules 2022, 12. [CrossRef]
- Cha, Y.; Kim, S.; Han, S.W. Utilizing Plasma Circulating Tumor DNA Sequencing for Precision Medicine in the Management of Solid Cancers. Cancer Res Treat 2023, 55, 367-384. [CrossRef]
- Lin, M.; Sun, X.; Lv, L. New insights and options into the mechanisms and effects of combined targeted therapy and immunotherapy in prostate cancer. Mol Ther Oncolytics 2023, 29, 91-106. [CrossRef]
- Wang, H.-C.; Xia, R.; Chang, W.-H.; Hsu, S.-W.; Wu, C.-T.; Chen, C.-H.; Shih, T.-C. Improving cancer immunotherapy in prostate cancer by modulating T cell function through targeting the galectin-1. Frontiers in Immunology 2024, 15. [CrossRef]
- Ren, X.; Chen, X.; Zhang, X.; Jiang, S.; Zhang, T.; Li, G.; Lu, Z.; Zhang, D.; Wang, S.; Qin, C. Immune Microenvironment and Response in Prostate Cancer Using Large Population Cohorts. Frontiers in Immunology 2021, 12. [CrossRef]
- Hirz, T.; Mei, S.; Sarkar, H.; Kfoury, Y.; Wu, S.; Verhoeven, B.M.; Subtelny, A.O.; Zlatev, D.V.; Wszolek, M.W.; Salari, K.; et al. Dissecting the immune suppressive human prostate tumor microenvironment via integrated single-cell and spatial transcriptomic analyses. Nature Communications 2023, 14, 663. [CrossRef]
- Novysedlak, R.; Guney, M.; Al Khouri, M.; Bartolini, R.; Koumbas Foley, L.; Benesova, I.; Ozaniak, A.; Novak, V.; Vesely, S.; Pacas, P.; et al. The Immune Microenvironment in Prostate Cancer: A Comprehensive Review. Oncology 2024, 1-25. [CrossRef]
- van Genderen, M.N.G.; Kneppers, J.; Zaalberg, A.; Bekers, E.M.; Bergman, A.M.; Zwart, W.; Eduati, F. Agent-based modeling of the prostate tumor microenvironment uncovers spatial tumor growth constraints and immunomodulatory properties. npj Systems Biology and Applications 2024, 10, 20. [CrossRef]
- Stultz, J.; Fong, L. How to turn up the heat on the cold immune microenvironment of metastatic prostate cancer. Prostate Cancer and Prostatic Diseases 2021, 24, 697-717. [CrossRef]
- Angappulige, D.H.; Mahajan, N.P.; Mahajan, K. Epigenetic underpinnings of tumor-immune dynamics in prostate cancer immune suppression. Trends Cancer 2024, 10, 369-381. [CrossRef]
- Palano, M.T.; Gallazzi, M.; Cucchiara, M.; Dehò, F.; Capogrosso, P.; Bruno, A.; Mortara, L. The tumor innate immune microenvironment in prostate cancer: an overview of soluble factors and cellular effectors. Exploration of Targeted Anti-tumor Therapy 2022, 3, 694-718. [CrossRef]
- Stone, L. Singling out the immune-suppressive TME in prostate cancer. Nature Reviews Urology 2023, 20, 199-199. [CrossRef]
- Liang, H.; Liu, Y.; Guo, J.; Dou, M.; Zhang, X.; Hu, L.; Chen, J. Progression in immunotherapy for advanced prostate cancer. Front Oncol 2023, 13, 1126752. [CrossRef]
- Kobayashi, T.; Nagata, M.; Hachiya, T.; Wakita, H.; Ikehata, Y.; Takahashi, K.; China, T.; Shimizu, F.; Lu, J.; Jin, Y.; et al. Increased circulating polymorphonuclear myeloid-derived suppressor cells are associated with prognosis of metastatic castration-resistant prostate cancer. Frontiers in Immunology 2024, 15. [CrossRef]
- Lyu, A.; Fan, Z.; Clark, M.; Lea, A.; Luong, D.; Setayesh, A.; Starzinski, A.; Wolters, R.; Arias-Badia, M.; Allaire, K.; et al. Evolution of myeloid-mediated immunotherapy resistance in prostate cancer. Nature 2025, 637, 1207-1217. [CrossRef]
- Mateo, J.; Seed, G.; Bertan, C.; Rescigno, P.; Dolling, D.; Figueiredo, I.; Miranda, S.; Rodrigues, D.N.; Gurel, B.; Clarke, M. Genomics of lethal prostate cancer at diagnosis and castration resistance. The Journal of clinical investigation 2020, 130, 1743-1751.
- Sayegh, N.; Swami, U.; Agarwal, N. Recent Advances in the Management of Metastatic Prostate Cancer. JCO Oncology Practice 2022, 18, 45-55. [CrossRef]
- Robinson, D.; Van Allen, E.M.; Wu, Y.M.; Schultz, N.; Lonigro, R.J.; Mosquera, J.M.; Montgomery, B.; Taplin, M.E.; Pritchard, C.C.; Attard, G.; et al. Integrative clinical genomics of advanced prostate cancer. Cell 2015, 161, 1215-1228. [CrossRef]
- Ikeda, S.; Elkin, S.K.; Tomson, B.N.; Carter, J.L.; Kurzrock, R. Next-generation sequencing of prostate cancer: genomic and pathway alterations, potential actionability patterns, and relative rate of use of clinical-grade testing. Cancer Biol Ther 2019, 20, 219-226. [CrossRef]
- Quigley, D.A.; Dang, H.X.; Zhao, S.G.; Lloyd, P.; Aggarwal, R.; Alumkal, J.J.; Foye, A.; Kothari, V.; Perry, M.D.; Bailey, A.M.; et al. Genomic Hallmarks and Structural Variation in Metastatic Prostate Cancer. Cell 2018, 174, 758-769.e759. [CrossRef]
- Mizuno, K.; Beltran, H. Future directions for precision oncology in prostate cancer. Prostate 2022, 82 Suppl 1, S86-s96. [CrossRef]
- Hyman, D.M.; Taylor, B.S.; Baselga, J. Implementing Genome-Driven Oncology. Cell 2017, 168, 584-599. [CrossRef]
- Abida, W.; Cyrta, J.; Heller, G.; Prandi, D.; Armenia, J.; Coleman, I.; Cieslik, M.; Benelli, M.; Robinson, D.; Van Allen, E.M.; et al. Genomic correlates of clinical outcome in advanced prostate cancer. Proceedings of the National Academy of Sciences 2019, 116, 11428-11436. [CrossRef]
- Cabral, B.P.; Braga, L.A.M.; Syed-Abdul, S.; Mota, F.B. Future of Artificial Intelligence Applications in Cancer Care: A Global Cross-Sectional Survey of Researchers. Current Oncology 2023, 30, 3432-3446.
- Sowalsky, A.G.; Figueiredo, I.; Lis, R.T.; Coleman, I.; Gurel, B.; Bogdan, D.; Yuan, W.; Russo, J.W.; Bright, J.R.; Whitlock, N.C.; et al. Assessment of Androgen Receptor Splice Variant-7 as a Biomarker of Clinical Response in Castration-Sensitive Prostate Cancer. Clin Cancer Res 2022, 28, 3509-3525. [CrossRef]
- Zhuang, H.-H.; Qu, Q.; Teng, X.-Q.; Dai, Y.-H.; Qu, J. Superenhancers as master gene regulators and novel therapeutic targets in brain tumors. Experimental & Molecular Medicine 2023, 55, 290-303. [CrossRef]
- Song, H.; Weinstein, H.N.W.; Allegakoen, P.; Wadsworth, M.H.; Xie, J.; Yang, H.; Castro, E.A.; Lu, K.L.; Stohr, B.A.; Feng, F.Y.; et al. Single-cell analysis of human primary prostate cancer reveals the heterogeneity of tumor-associated epithelial cell states. Nature Communications 2022, 13, 141. [CrossRef]
- Ruprecht, N.A.; Kennedy, J.D.; Bansal, B.; Singhal, S.; Sens, D.; Maggio, A.; Doe, V.; Hawkins, D.; Campbel, R.; O’Connell, K.; et al. Transcriptomics and epigenetic data integration learning module on Google Cloud. Brief Bioinform 2024, 25. [CrossRef]
- Xu, J.; Yang, P.; Xue, S.; Sharma, B.; Sanchez-Martin, M.; Wang, F.; Beaty, K.A.; Dehan, E.; Parikh, B. Translating cancer genomics into precision medicine with artificial intelligence: applications, challenges and future perspectives. Hum Genet 2019, 138, 109-124. [CrossRef]
- Kiviaho, A.; Eerola, S.K.; Kallio, H.M.L.; Andersen, M.K.; Hoikka, M.; Tiihonen, A.M.; Salonen, I.; Spotbeen, X.; Giesen, A.; Parker, C.T.A.; et al. Single cell and spatial transcriptomics highlight the interaction of club-like cells with immunosuppressive myeloid cells in prostate cancer. Nature Communications 2024, 15, 9949. [CrossRef]
- Villette, C.C.; Dupuy, N.; Brightman, F.A.; Zimmermann, A.; Lignet, F.; Zenke, F.T.; Terranova, N.; Bolleddula, J.; El Bawab, S.; Chassagnole, C. Semi-mechanistic efficacy model for PARP + ATR inhibitors—application to rucaparib and talazoparib in combination with gartisertib in breast cancer PDXs. British Journal of Cancer 2025. [CrossRef]
- Ragupathi, A.; Singh, M.; Perez, A.M.; Zhang, D. Targeting the BRCA1/2 deficient cancer with PARP inhibitors: Clinical outcomes and mechanistic insights. Frontiers in Cell and Developmental Biology 2023, 11. [CrossRef]
- Miller, K.J.; Henry, I.; Maylin, Z.; Smith, C.; Arunachalam, E.; Pandha, H.; Asim, M. A compendium of Androgen Receptor Variant 7 target genes and their role in Castration Resistant Prostate Cancer. Frontiers in Oncology 2023, 13. [CrossRef]
- Fenton, S.E.; VanderWeeler, D.J.; Rebbeck, T.R.; Chen, D.L. Advancing Prostate Cancer Care: Treatment Approaches to Precision Medicine, Biomarker Innovations, and Equitable Access. American Society of Clinical Oncology Educational Book 2024, 44, e433138. [CrossRef]
- De Laere, B.; Oeyen, S.; Mayrhofer, M.; Whitington, T.; van Dam, P.J.; Van Oyen, P.; Ghysel, C.; Ampe, J.; Ost, P.; Demey, W.; et al. TP53 Outperforms Other Androgen Receptor Biomarkers to Predict Abiraterone or Enzalutamide Outcome in Metastatic Castration-Resistant Prostate Cancer. Clin Cancer Res 2019, 25, 1766-1773. [CrossRef]
- Bhat, A.A.; Nisar, S.; Mukherjee, S.; Saha, N.; Yarravarapu, N.; Lone, S.N.; Masoodi, T.; Chauhan, R.; Maacha, S.; Bagga, P.; et al. Integration of CRISPR/Cas9 with artificial intelligence for improved cancer therapeutics. J Transl Med 2022, 20, 534. [CrossRef]
- Sobhani, N.; Neeli, P.K.; D’Angelo, A.; Pittacolo, M.; Sirico, M.; Galli, I.C.; Roviello, G.; Nesi, G. AR-V7 in Metastatic Prostate Cancer: A Strategy beyond Redemption. Int J Mol Sci 2021, 22. [CrossRef]
- Xiang, R.R.; Lee, S.A.; Tyndall, C.F.; Bhatia, A.R.; Yin, J.; Singler, C.; Hauk, B.J.; Kipp, M.P.; Takeda, D.Y. CRISPR screening identifies regulators of enhancer-mediated androgen receptor transcription in advanced prostate cancer. Cell Rep 2025, 44, 115312. [CrossRef]
- Hofman, M.S.; Lawrentschuk, N.; Francis, R.J.; Tang, C.; Vela, I.; Thomas, P.; Rutherford, N.; Martin, J.M.; Frydenberg, M.; Shakher, R.; et al. Prostate-specific membrane antigen PET-CT in patients with high-risk prostate cancer before curative-intent surgery or radiotherapy (proPSMA): a prospective, randomised, multicentre study. Lancet 2020, 395, 1208-1216. [CrossRef]
- Fendler, W.P.; Calais, J.; Eiber, M.; Flavell, R.R.; Mishoe, A.; Feng, F.Y.; Nguyen, H.G.; Reiter, R.E.; Rettig, M.B.; Okamoto, S.; et al. Assessment of 68Ga-PSMA-11 PET Accuracy in Localizing Recurrent Prostate Cancer: A Prospective Single-Arm Clinical Trial. JAMA Oncol 2019, 5, 856-863. [CrossRef]
- Lawhn-Heath, C.; Flavell, R.R.; Behr, S.C.; Yohannan, T.; Greene, K.L.; Feng, F.; Carroll, P.R.; Hope, T.A. Single-Center Prospective Evaluation of (68)Ga-PSMA-11 PET in Biochemical Recurrence of Prostate Cancer. AJR Am J Roentgenol 2019, 213, 266-274. [CrossRef]
- Burnett, A.L.; Nyame, Y.A.; Mitchell, E. Disparities in prostate cancer. Journal of the National Medical Association 2023, 115, S38-S45. [CrossRef]
- Kratochwil, C.; Flechsig, P.; Lindner, T.; Abderrahim, L.; Altmann, A.; Mier, W.; Adeberg, S.; Rathke, H.; Röhrich, M.; Winter, H.; et al. (68)Ga-FAPI PET/CT: Tracer Uptake in 28 Different Kinds of Cancer. J Nucl Med 2019, 60, 801-805. [CrossRef]
- He, W.; Huang, W.; Zhang, L.; Wu, X.; Zhang, S.; Zhang, B. Radiogenomics: bridging the gap between imaging and genomics for precision oncology. MedComm (2020) 2024, 5, e722. [CrossRef]
- Afshar-Oromieh, A.; Hetzheim, H.; Kübler, W.; Kratochwil, C.; Giesel, F.L.; Hope, T.A.; Eder, M.; Eisenhut, M.; Kopka, K.; Haberkorn, U. Radiation dosimetry of (68)Ga-PSMA-11 (HBED-CC) and preliminary evaluation of optimal imaging timing. Eur J Nucl Med Mol Imaging 2016, 43, 1611-1620. [CrossRef]
- Parekh, V.; Jacobs, M.A. Radiomics: a new application from established techniques. Expert Rev Precis Med Drug Dev 2016, 1, 207-226. [CrossRef]
- von Stauffenberg, F.; Poyet, C.; Beintner-Skawran, S.; Maurer, A.; Schmid, F.A. Current Clinical Applications of PSMA-PET for Prostate Cancer Diagnosis, Staging, and Treatment. Cancers 2024, 16, 4263.
- Dorff, T.B.; Blanchard, M.S.; Adkins, L.N.; Luebbert, L.; Leggett, N.; Shishido, S.N.; Macias, A.; Del Real, M.M.; Dhapola, G.; Egelston, C.; et al. PSCA-CAR T cell therapy in metastatic castration-resistant prostate cancer: a phase 1 trial. Nature Medicine 2024, 30, 1636-1644. [CrossRef]
- Chehelgerdi, M.; Chehelgerdi, M.; Khorramian-Ghahfarokhi, M.; Shafieizadeh, M.; Mahmoudi, E.; Eskandari, F.; Rashidi, M.; Arshi, A.; Mokhtari-Farsani, A. Comprehensive review of CRISPR-based gene editing: mechanisms, challenges, and applications in cancer therapy. Molecular Cancer 2024, 23, 9. [CrossRef]
- Ozaki, Y.; Broughton, P.; Abdollahi, H.; Valafar, H.; Blenda, A.V. Integrating Omics Data and AI for Cancer Diagnosis and Prognosis. Cancers (Basel) 2024, 16. [CrossRef]
- Pantel, K.; Alix-Panabières, C. Liquid biopsy and minimal residual disease — latest advances and implications for cure. Nature Reviews Clinical Oncology 2019, 16, 409-424. [CrossRef]
- Gu, X.; Wei, S.; Lv, X. Circulating tumor cells: from new biological insights to clinical practice. Signal Transduction and Targeted Therapy 2024, 9, 226. [CrossRef]
- Urabe, F.; Sumiyoshi, T.; Tashiro, K.; Goto, T.; Kimura, T.; Kobayashi, T. Prostate cancer and liquid biopsies: Clinical applications and challenges. Int J Urol 2024, 31, 617-626. [CrossRef]
- Wang, X.; Wang, L.; Lin, H.; Zhu, Y.; Huang, D.; Lai, M.; Xi, X.; Huang, J.; Zhang, W.; Zhong, T. Research progress of CTC, ctDNA, and EVs in cancer liquid biopsy. Frontiers in Oncology 2024, 14. [CrossRef]
- Sartor, O. Circulating Tumor DNA Biomarkers for Response Assessment in Prostate Cancer. Clin Cancer Res 2023, 29, 2745-2747. [CrossRef]
- Liu, C.; Xia, C.; Xia, C. Biology and function of exosomes in tumor immunotherapy. Biomedicine & Pharmacotherapy 2023, 169, 115853. [CrossRef]
- Zheng, Z.; Li, J.; Liu, Y.; Shi, Z.; Xuan, Z.; Yang, K.; Xu, C.; Bai, Y.; Fu, M.; Xiao, Q.; et al. The Crucial Role of AR-V7 in Enzalutamide-Resistance of Castration-Resistant Prostate Cancer. Cancers 2022, 14, 4877.
- Crocetto, F.; Russo, G.; Di Zazzo, E.; Pisapia, P.; Mirto, B.F.; Palmieri, A.; Pepe, F.; Bellevicine, C.; Russo, A.; La Civita, E.; et al. Liquid Biopsy in Prostate Cancer Management-Current Challenges and Future Perspectives. Cancers (Basel) 2022, 14. [CrossRef]
- Liu, S.; Wang, J. Current and Future Perspectives of Cell-Free DNA in Liquid Biopsy. Curr Issues Mol Biol 2022, 44, 2695-2709. [CrossRef]
- Shih, Y.-C.T.; Pan, I.-W.; Teich, N. Global Challenges in Access to and Implementation of Precision Oncology: The Health Care Manager and Health Economist Perspective. American Society of Clinical Oncology Educational Book 2022, 429-437. [CrossRef]
- Lipkova, J.; Chen, R.J.; Chen, B.; Lu, M.Y.; Barbieri, M.; Shao, D.; Vaidya, A.J.; Chen, C.; Zhuang, L.; Williamson, D.F.K.; et al. Artificial intelligence for multimodal data integration in oncology. Cancer Cell 2022, 40, 1095-1110. [CrossRef]
- Li, J.; Wang, J.; Chen, Z. Emerging role of exosomes in cancer therapy: progress and challenges. Molecular Cancer 2025, 24, 13. [CrossRef]
- Ma, L.; Guo, H.; Zhao, Y.; Liu, Z.; Wang, C.; Bu, J.; Sun, T.; Wei, J. Liquid biopsy in cancer: current status, challenges and future prospects. Signal Transduction and Targeted Therapy 2024, 9, 336. [CrossRef]
- Bastos, D.A.; Soares, A.; Schutz, F.A.B.; Cronemberger, E.; de Almeida Luz, M.; Martins, S.; Muniz, D.Q.B.; Cárcano, F.M.; Smaletz, O.; Peixoto, F.A.; et al. Androgen Receptor Pathway Inhibitor Therapy for Advanced Prostate Cancer: Secondary Analysis of a Randomized Clinical Trial. JAMA Netw Open 2025, 8, e2454253. [CrossRef]
- Bourlon, M.T.; Valdez, P.; Castro, E. Development of PARP inhibitors in advanced prostate cancer. Therapeutic Advances in Medical Oncology 2024, 16, 17588359231221337. [CrossRef]
- GREWAL, K.; GREWAL, K.; TABBARA, I.A. PARP Inhibitors in Prostate Cancer. Anticancer Research 2021, 41, 551-556. [CrossRef]
- Chen, Q.H.; Munoz, E.; Ashong, D. Insight into Recent Advances in Degrading Androgen Receptor for Castration-Resistant Prostate Cancer. Cancers (Basel) 2024, 16. [CrossRef]
- Zhang, Y.; Ming, A.; Wang, J.; Chen, W.; Fang, Z. PROTACs targeting androgen receptor signaling: Potential therapeutic agents for castration-resistant prostate cancer. Pharmacological Research 2024, 205, 107234. [CrossRef]
- Merlin, J.P.J.; Abrahamse, H. Optimizing CRISPR/Cas9 precision: Mitigating off-target effects for safe integration with photodynamic and stem cell therapies in cancer treatment. Biomedicine & Pharmacotherapy 2024, 180, 117516. [CrossRef]
- Serrano, D.R.; Luciano, F.C.; Anaya, B.J.; Ongoren, B.; Kara, A.; Molina, G.; Ramirez, B.I.; Sánchez-Guirales, S.A.; Simon, J.A.; Tomietto, G.; et al. Artificial Intelligence (AI) Applications in Drug Discovery and Drug Delivery: Revolutionizing Personalized Medicine. Pharmaceutics 2024, 16. [CrossRef]
- Hamid, A.A.; Sayegh, N.; Tombal, B.; Hussain, M.; Sweeney, C.J.; Graff, J.N.; Agarwal, N. Metastatic Hormone-Sensitive Prostate Cancer: Toward an Era of Adaptive and Personalized Treatment. American Society of Clinical Oncology Educational Book 2023, e390166. [CrossRef]
- Nambiar, D.K.; Mishra, D.; Singh, R.P. Targeting DNA repair for cancer treatment: Lessons from PARP inhibitor trials. Oncol Res 2023, 31, 405-421. [CrossRef]
- Jain, R.; Kumar, A.; Sharma, A.; Sahoo, R.K.; Sharma, A.; Seth, A.; Nayak, B.; Shamim, S.A.; Kaushal, S.; Kp, H.; et al. Carboplatin in Patients With Metastatic Castration-Resistant Prostate Cancer Harboring Somatic or Germline Homologous Recombination Repair Gene Mutations: Phase II Single-Arm Trial. JMIR Res Protoc 2024, 13, e54086. [CrossRef]
- Gleave, M.; Belanger, E.; Scurll, J.; Oo, H.Z.; Nappi, L.; Beltran, H.; Wyatt, A.W.; Mannas, M.; Black, P.C.; Zoubeidi, A.; et al. Genomic alterations and their pathologic responses in high-risk localized prostate cancer (HRLPC) in subprotocol 1 of the Genomic Umbrella Neoadjuvant study (GUNS). Journal of Clinical Oncology 2025, 43, 403-403. [CrossRef]
- Azad, A.; Agarwal, N.; Armstrong, A.J.; Hellmis, E.; Schlürmann, F.; Sugimoto, M.; Ürün, Y.; Xing, N.; Aregay, M.; Lima, J.; et al. Phase III, double-blind, placebo-controlled, 2-cohort, randomized study of saruparib (AZD5305) in combination with androgen receptor pathway inhibitors in patients with metastatic hormone-sensitive prostate cancer with and without homologous recombination repair mutation (EvoPAR-Prostate01). Journal of Clinical Oncology 2025, 43, TPS279-TPS279. [CrossRef]
- Fizazi, K.; George, D.J.; Santis, M.D.; Clarke, N.; Fay, A.P.; Uemura, H.; Grinsted, L.; Rooney, C.; Verheijen, R.B.; Anjum, R.; et al. A phase III trial of capivasertib and abiraterone versus placebo and abiraterone in patients with <i>de novo</i> metastatic hormone-sensitive prostate cancer characterized by PTEN deficiency (CAPItello-281). Journal of Clinical Oncology 2021, 39, TPS178-TPS178. [CrossRef]
- Sweeney, C.; Bracarda, S.; Sternberg, C.N.; Chi, K.N.; Olmos, D.; Sandhu, S.; Massard, C.; Matsubara, N.; Alekseev, B.; Parnis, F.; et al. Ipatasertib plus abiraterone and prednisolone in metastatic castration-resistant prostate cancer (IPATential150): a multicentre, randomised, double-blind, phase 3 trial. Lancet 2021, 398, 131-142. [CrossRef]
- Akiyama, T.; Yasuda, T.; Uchihara, T.; Yasuda-Yoshihara, N.; Tan, B.J.Y.; Yonemura, A.; Semba, T.; Yamasaki, J.; Komohara, Y.; Ohnishi, K.; et al. Stromal Reprogramming through Dual PDGFRα/β Blockade Boosts the Efficacy of Anti–PD-1 Immunotherapy in Fibrotic Tumors. Cancer Research 2023, 83, 753-770. [CrossRef]
- Davies, A.; Zoubeidi, A.; Selth, L.A. The epigenetic and transcriptional landscape of neuroendocrine prostate cancer. Endocrine-Related Cancer 2020, 27, R35-R50. [CrossRef]
- Nguyen, C.B.; Reimers, M.A.; Perera, C.; Abida, W.; Chou, J.; Feng, F.Y.; Antonarakis, E.S.; McKay, R.R.; Pachynski, R.K.; Zhang, J.; et al. Evaluating Immune Checkpoint Blockade in Metastatic Castration-Resistant Prostate Cancers with Deleterious CDK12 Alterations in the Phase 2 IMPACT Trial. Clinical Cancer Research 2024, 30, 3200-3210. [CrossRef]
- Choudhury, A.D.; Kwak, L.; Cheung, A.; Allaire, K.M.; Marquez, J.; Yang, D.D.; Tripathi, A.; Kilar, J.M.; Flynn, M.; Maynard, B.; et al. Randomized Phase II Study Evaluating the Addition of Pembrolizumab to Radium-223 in Metastatic Castration-resistant Prostate Cancer. Cancer Immunology Research 2024, 12, 704-718. [CrossRef]
- Bhatia, V.; Kamat, N.V.; Pariva, T.E.; Wu, L.-T.; Tsao, A.; Sasaki, K.; Sun, H.; Javier, G.; Nutt, S.; Coleman, I.; et al. Targeting advanced prostate cancer with STEAP1 chimeric antigen receptor T cell and tumor-localized IL-12 immunotherapy. Nature Communications 2023, 14, 2041. [CrossRef]
- Zhao, L.; Pang, Y.; Zhou, Y.; Chen, J.; Fu, H.; Guo, W.; Xu, W.; Xue, X.; Su, G.; Sun, L.; et al. Antitumor efficacy and potential mechanism of FAP-targeted radioligand therapy combined with immune checkpoint blockade. Signal Transduction and Targeted Therapy 2024, 9, 142. [CrossRef]
- Handa, S.; Hans, B.; Goel, S.; Bashorun, H.O.; Dovey, Z.; Tewari, A. Immunotherapy in prostate cancer: current state and future perspectives. Ther Adv Urol 2020, 12, 1756287220951404. [CrossRef]
- Nakamura, H.; Arihara, Y.; Takada, K. Targeting STEAP1 as an anticancer strategy. Front Oncol 2023, 13, 1285661. [CrossRef]
- Kelly, W.K.; Danila, D.C.; Lin, C.C.; Lee, J.L.; Matsubara, N.; Ward, P.J.; Armstrong, A.J.; Pook, D.; Kim, M.; Dorff, T.B.; et al. Xaluritamig, a STEAP1 × CD3 XmAb 2+1 Immune Therapy for Metastatic Castration-Resistant Prostate Cancer: Results from Dose Exploration in a First-in-Human Study. Cancer Discov 2024, 14, 76-89. [CrossRef]
- Calais, J.; Murthy, V.; Voter, A.; Nguyen, K.; Allen-Auerbach, M.S.; Caputo, S.; Ledet, E.M.; Akerele, O.; Tuchayi, A.M.; Heath, C.L.; et al. Efficacy and toxicity of [<sup>177</sup>Lu]Lu-PSMA-617 for metastatic castration-resistant prostate cancer in a real-world setting: Results from the U.S. Expanded Access Program and comparisons with phase 3 VISION data. Journal of Clinical Oncology 2024, 42, e17061-e17061. [CrossRef]
- Besiroglu, H.; Kadihasanoglu, M. The Safety and Efficacy of Targeted Alpha Therapy, Ac-225 Prostate-Specific Membrane Antigen, in Patients With Metastatic Castration-Resistant Prostate Cancer: A Systematic Review and Meta-Analysis. Prostate 2025, e24857. [CrossRef]
- Morris, M.J.; Kiess, A.P.; Nordquist, L.; Gupta, S.; George, D.J.; Messmann, R.A.; Kantoff, P.W.; Nauseef, J.T.; Bander, N.H.; Antonarakis, E.S. CONVERGE-01: Dosimetry, randomized dose optimization, dose escalation, and efficacy of ac-225 rosopatamab tetraxetan in participants with PSMA-positive castration-resistant prostate cancer. Journal of Clinical Oncology 2025, 43, TPS289-TPS289. [CrossRef]
- ClinicalTrials.gov. Phase I/II Study of [225Ac]Ac-PSMA-R2 in PSMA-positive Prostate Cancer, With/Without Prior 177Lu-PSMA RLT. Identifier: NCT05983198. Updated (2025-01-31). Accessed 2025-02-28. Available from: https://clinicaltrials.gov/study/NCT05983198.
- Sandhu, S.; Subramaniam, S.; Hofman, M.S.; Stockler, M.R.; Martin, A.J.; Pokorski, I.; Goh, J.C.; Pattison, D.A.; Dhiantravan, N.; Gedye, C.; et al. Evolution: Phase II study of radionuclide <sup>177</sup>Lu-PSMA-617 therapy versus <sup>177</sup>Lu-PSMA-617 in combination with ipilimumab and nivolumab for men with metastatic castration-resistant prostate cancer (mCRPC.; ANZUP 2001). Journal of Clinical Oncology 2023, 41, TPS271-TPS271. [CrossRef]
- Kostos, L.K.; Buteau, J.P.; Yeung, T.; Xie, S.; Iulio, J.D.; Cardin, A.; Owen, K.; Fettke, H.; Chin, K.Y.; Emmerson, B.; et al. AlphaBet: A phase I/II trial evaluating the combination of radium-223 and [<sup>177</sup>Lu]Lu-PSMA-I&T in patients (pts) with metastatic castration-resistant prostate cancer (mCRPC). Journal of Clinical Oncology 2023, 41, TPS280-TPS280. [CrossRef]
- Ruigrok, E.A.M.; Verkaik, N.S.; de Blois, E.; de Ridder, C.; Stuurman, D.; Roobol, S.J.; Van Gent, D.C.; de Jong, M.; Van Weerden, W.M.; Nonnekens, J. Preclinical Assessment of the Combination of PSMA-Targeting Radionuclide Therapy with PARP Inhibitors for Prostate Cancer Treatment. Int J Mol Sci 2022, 23. [CrossRef]
- Giunta, E.F.; Brighi, N.; Gurioli, G.; Matteucci, F.; Paganelli, G.; De Giorgi, U. 177Lu-PSMA therapy in metastatic prostate cancer: An updated review of prognostic and predictive biomarkers. Cancer Treatment Reviews 2024, 125, 102699. [CrossRef]
- Perrone, E.; Giordano, A.; Calcagni, M.L.; Leccisotti, L.; Moretti, R.; Eismant, A.; Ghai, K.; Parkar, T.; Mishra, A.; Heidenreich, A.; et al. Long-Term Safety and Survival Outcomes of [(225)Ac]Ac-PSMA (Prostate-Specific Membrane Antigen) and [(225)Ac]Ac-/[(177)Lu]Lu-PSMA (TANDEM) Radioligand Therapy (PRLT) in Metastatic Castration-Resistant Prostate Cancer. Cancers (Basel) 2025, 17. [CrossRef]
- Wang, H.; Li, G.; Zhao, J.; Eiber, M.; Tian, R. Current status of PSMA-targeted imaging and therapy. Frontiers in Oncology 2024, 13. [CrossRef]
- Marshall, C.H.; Antonarakis, E.S. Emerging treatments for metastatic castration-resistant prostate cancer: Immunotherapy, PARP inhibitors, and PSMA-targeted approaches. Cancer Treatment and Research Communications 2020, 23, 100164. [CrossRef]
- Karimzadeh, A.; Lehnert, W.; Koehler, D.; Shenas, F.; Kisters, A.; Apostolova, I.; Klutmann, S.; Adam, G.; Sauer, M. Overview of selected completed prospective studies on PSMA-targeted radioligand therapy with [177Lu]Lu-PSMA-617 in metastatic castration-resistant prostate cancer. Rofo 2025. [CrossRef]
- Hachem, S.; Yehya, A.; El Masri, J.; Mavingire, N.; Johnson, J.R.; Dwead, A.M.; Kattour, N.; Bouchi, Y.; Kobeissy, F.; Rais-Bahrami, S.; et al. Contemporary Update on Clinical and Experimental Prostate Cancer Biomarkers: A Multi-Omics-Focused Approach to Detection and Risk Stratification. Biology (Basel) 2024, 13. [CrossRef]
- Bono, J.d.; Mateo, J.; Fizazi, K.; Saad, F.; Shore, N.; Sandhu, S.; Chi, K.N.; Sartor, O.; Agarwal, N.; Olmos, D.; et al. Olaparib for Metastatic Castration-Resistant Prostate Cancer. New England Journal of Medicine 2020, 382, 2091-2102. [CrossRef]
- Sartor, O.; Bono, J.d.; Chi, K.N.; Fizazi, K.; Herrmann, K.; Rahbar, K.; Tagawa, S.T.; Nordquist, L.T.; Vaishampayan, N.; El-Haddad, G.; et al. Lutetium-177–PSMA-617 for Metastatic Castration-Resistant Prostate Cancer. New England Journal of Medicine 2021, 385, 1091-1103. [CrossRef]
- Sharma, P.; Pachynski, R.K.; Narayan, V.; Fléchon, A.; Gravis, G.; Galsky, M.D.; Mahammedi, H.; Patnaik, A.; Subudhi, S.K.; Ciprotti, M.; et al. Nivolumab Plus Ipilimumab for Metastatic Castration-Resistant Prostate Cancer: Preliminary Analysis of Patients in the CheckMate 650 Trial. Cancer Cell 2020, 38, 489-499.e483. [CrossRef]
- Antonarakis, E.S.; Piulats, J.M.; Gross-Goupil, M.; Goh, J.; Ojamaa, K.; Hoimes, C.J.; Vaishampayan, U.; Berger, R.; Sezer, A.; Alanko, T.; et al. Pembrolizumab for Treatment-Refractory Metastatic Castration-Resistant Prostate Cancer: Multicohort, Open-Label Phase II KEYNOTE-199 Study. J Clin Oncol 2020, 38, 395-405. [CrossRef]
- Smith, M.R.; Saad, F.; Chowdhury, S.; Oudard, S.; Hadaschik, B.A.; Graff, J.N.; Olmos, D.; Mainwaring, P.N.; Lee, J.Y.; Uemura, H.; et al. Apalutamide and Overall Survival in Prostate Cancer. Eur Urol 2021, 79, 150-158. [CrossRef]


| Molecular Target or Genetic Alteration | Key Mechanism/Function | Clinical Features | Clinical Utility |
| AR Amplification / AR Splice Variants (e.g., AR-V7) | Sustained AR signaling under low-androgen conditions; ligand-independent activation | Poor response or resistance to AR-targeted therapies; commonly seen in mCRPC | Predicts resistance to enzalutamide or abiraterone; potential biomarker for treatment selection |
| PTEN Loss | Hyperactivation of the PI3K/AKT/mTOR pathway; cross-talk with AR signaling | Associated with high-grade tumors and aggressive clinical course | May guide PI3K/AKT/mTOR inhibitor-based combination trials; potential prognostic indicator |
| DDR Defects (e.g., BRCA2, ATM) | Impaired DNA repair and increased genomic instability; vulnerability to PARP inhibition | More aggressive behavior if untreated; better response to PARP inhibitors | Companion diagnostics for PARP inhibitors; synthetic lethality-based therapy targeting |
| TMPRSS2-ERG Fusion | ETS transcription factor (ERG) overexpression; promotes invasion, EMT, and genomic instability | High prevalence in localized prostate cancer; variable association with outcomes in mPCa | Potential prognostic marker in combination with other alterations (e.g., PTEN) |
| PI3K/AKT/mTOR Mutations | Aberrant cell proliferation and survival; metabolic reprogramming | Often co-occurs with AR pathway alterations; contributes to therapeutic resistance | Under investigation in clinical trials targeting AKT and mTOR; potential combination strategy with AR inhibitors |
| TP53 / RB1 Co-mutations | Disruption of cell-cycle checkpoints; may facilitate lineage plasticity or neuroendocrine differentiation | Common in advanced mPCa; associated with poor prognosis | Emerging biomarker for early switch to chemotherapy or combination therapies |
| Diagnostic Panel/Biomarker | Testing Method | Clinical Significance | Limitations/Considerations |
| DDR-Focused Panel (BRCA1/2, ATM, etc.) | - Targeted NGS or expanded gene panels - Germline vs. somatic testing |
- Identifies candidates for PARP inhibitors and platinum-based therapies - May inform familial genetic risk |
- Cost and limited access in some regions - May miss epigenetic alterations |
| AR Splice Variants (e.g., AR-V7) | - RT-PCR or ddPCR on CTCs - Tissue-based RNA assays |
- Predicts resistance to enzalutamide or abiraterone - Can guide switch to chemotherapy or other targeted agents |
- Variable sensitivity depending on assay - Not yet universally available or standardized |
| PTEN / PI3K / AKT | - IHC, FISH - Targeted sequencing for hotspot mutations |
- Potential biomarker for AKT/mTOR inhibitors - May correlate with disease aggressiveness |
- Limited predictive validation in some trials - Reimbursement issues in certain regions |
| TP53 / RB1 | - Targeted NGS or WES/WGS - IHC for protein loss |
- Associated with poor prognosis - May indicate early progression toward neuroendocrine differentiation |
- Rarely used in routine practice - Data interpretation can be complex (co-occurring events) |
| TMPRSS2-ERG Fusion | - FISH, RT-PCR, or RNA-seq | - Possible prognostic marker when combined with other aberrations (e.g., PTEN) | - Prognostic impact remains debated - May not be actionable with current therapies |
| Modality | Specimen Characteristics | Analytical Techniques | Clinical Applications | Advantages | Limitations |
| ctDNA | - Cell-free DNA fragments shed by tumor cells - Detected in plasma or serum |
- Targeted/Whole-Exome NGS - ddPCR |
- Real-time monitoring of tumor burden - Detection of actionable mutations (e.g., BRCA2) |
- Minimally invasive - Repeat sampling feasible - Reflects genomic heterogeneity |
- Low abundance in early disease - Sensitivity depends on tumor fraction - Assay costs and standardization issues |
| CTCs | - Intact, viable tumor cells in the bloodstream - May be enriched via immunomagnetic or size-based separation methods |
- Immunophenotyping - Single-cell genomics/transcriptomics |
- Prognostic biomarker (CTC count) - AR-V7 status for therapy guidance - Potential ex vivo drug testing |
- Allows morphological and molecular analyses - Provides insight into specific cell populations |
- Rare cells, labor-intensive- Limited sensitivity in low-volume disease - Heterogeneity among different CTC populations |
| Exosomes and Extracellular Vesicles | - Nano-scale vesicles containing proteins, RNA, and DNA - Released by tumor and stromal cells into bodily fluids |
- RNA-seq, proteomics - Nanoparticle tracking - Advanced mass spectrometry |
- May reveal early resistance signatures - Potential biomarkers for immune- and stromal interactions |
- Reflects active secretory pathways - Can capture tumor–stromal communication |
- Isolation protocols not standardized - Complexity of vesicle subtypes - Data interpretation is challenging |
| Treatment or Combination | Primary Target/Mechanism | Trial Phase | Patient Population | Key Outcomes | Current Status | Reference |
| Olaparib vs. Abiraterone/Enzalutamide (PROfound) | PARP inhibition (DDR deficiency) | Phase III | mCRPC with HRR gene alterations (e.g., BRCA1/2) | Improved radiographic PFS and OS in biomarker-selected patients | Approved for HRR-mutated mCRPC | [171] |
| Ipatasertib + Abiraterone (IPATential150) | AKT inhibitor + AR axis blockade | Phase III | mCRPC, particularly with PTEN loss | Prolonged PFS in the PTEN-loss subgroup | Ongoing or completed; subset analyses continuing | [148] |
| 177Lu-PSMA-617 + Standard of Care (VISION) | PSMA-targeted radioligand therapy | Phase III | Heavily pretreated mCRPC | Improved OS and PFS vs. standard care | Approved in multiple regions | [172] |
| Nivolumab + Ipilimumab (CheckMate 650) | Dual immune checkpoint blockade (PD-1, CTLA-4) | Phase II | mCRPC, previously treated | Moderate objective response; significant immune-related toxicity | Further refinement of combination strategies needed | [173] |
| Pembrolizumab (KEYNOTE-199) | PD-1 immune checkpoint blockade | Phase II | mCRPC with prior treatments | Modest response rates; better outcomes in MSI-H or DNA repair defects | Investigational in selected biomarker-defined subgroups | [174] |
| Apalutamide (SPARTAN) | Next-generation AR antagonist | Phase III | nmCRPC (non-metastatic CRPC) | Significantly improved metastasis-free survival (MFS) | Approved for nmCRPC | [175] |
Disclaimer/Publisher’s Note: The statements, opinions and data contained in all publications are solely those of the individual author(s) and contributor(s) and not of MDPI and/or the editor(s). MDPI and/or the editor(s) disclaim responsibility for any injury to people or property resulting from any ideas, methods, instructions or products referred to in the content. |
© 2025 by the authors. Licensee MDPI, Basel, Switzerland. This article is an open access article distributed under the terms and conditions of the Creative Commons Attribution (CC BY) license (http://creativecommons.org/licenses/by/4.0/).


