
Submitted:
05 March 2025
Posted:
07 March 2025
You are already at the latest version
Abstract
Epilepsy is a clinical diagnosis. In a patient suspected of epilepsy, the main contribution of routine EEG is to record interictal epileptiform discharges (IEDs) which include spikes, sharp waves, spike-and-wave discharges, sharp-and-wave discharges, and multiple spike-and-wave discharges. Studies show that the first routine EEG fails to record IEDs in approximately 47–50% of patients with epilepsy. When the clinical history strongly suggests epilepsy, but the first EEG fails to record IEDs, various measures can improve EEG performance, which is the subject of this review. Similarly, in cases of suspected epilepsy, magnetic resonance imaging (MRI) has become the imaging technique of choice to identify structural brain abnormalities. However, in a significant number of cases of clinically suspected epilepsy, MRI is interpreted as “normal” even when performed according to an epilepsy-specific protocol and when evaluated by a specialized MRI reader. In such cases, a comprehensive epilepsy-targeted MRI protocol is the key factor to identify, localize, and characterize an epileptogenic lesion. In this regard, the ILAE Neuroimaging Working Group recommends using the Harmonized Neuroimaging of Epilepsy Structural Sequences (HARNESS-MRI) protocol, among other additional imaging tools, to look for such a lesion; this will be also described in detail below.
Keywords:
Epilepsy
; Seizure
; Electroencephalogram (EEG)
; interictal epileptiform discharges (IEDs)
; EEG Measures to improve EEG yield
; Magnetic Resonance Imaging (MRI)
; Harmonized Neuroimaging of Epilepsy Structural Sequences“ MRI (HARNESS‐MRI)
1. Introduction
The electroencephalogram (EEG) is the most direct measure of electrical brain activity and the most specific test for evaluation of epilepsy. Patients most commonly receive a 20-minute routine EEG recorded from 19 scalp electrodes placed according to the 10-20 electrode placement. The routine EEG should include hyperventilation and intermittent photic stimulation. Ideally, waking, drowsiness, and sleep should be recorded. However, many individuals will not fall asleep during a 20-minute recording. The routine EEG is not expected to capture seizures, with the exception of generalized absence seizures, which are easily precipitated by hyperventilation in the untreated patient. In a patient with epilepsy, the main input of the routine EEG is to record interictal epileptiform discharges (IEDs), which include spikes, sharp waves, spike-and-wave discharges, and polyspike-and-wave discharges. In conjunction with the clinical history, the distribution of IEDs can help classify the epilepsy as focal or generalized, and can occasionally help diagnose the specific epileptic syndrome. The classification of the epilepsy and epileptic syndrome may have important therapeutic and prognostic implications. Rarely, the EEG may provide evidence for the etiology of epilepsy, such as with the recording of rhythmic IEDs in patients with focal cortical dysplasia. [Shakhatreh et al.2022]
A variety of normal variants are often mistaken for IEDs, and misinterpretation of the EEG is one of the most common reasons for overdiagnosis of epilepsy. Criteria that help in the identification of discharges as epileptiform include high voltage, a duration of 20-70 ms for spikes and 70–200 ms for sharp waves, an asymmetric biphasic or polyphasic morphology with a predominant negative component, and an aftergoing slow wave.
The first routine EEG fails to record IEDs in about 47-50% of patients with epilepsy. [Baldin et al.2014, Salinsky et al.1987] When the clinical history is strongly suggestive of epilepsy, but the first EEG fails to record IEDs, a variety of measures can improve the yield of the EEG, which is the focus of this review.
In addition, neuroimaging is the cornerstone for etiologic assessment of patients with epilepsy. Brain Magnetic Resonance Imaging (MRI) has evolved as the imaging technique of choice to identify structural brain abnormalities. However, in approximately 35% of patients with therapy refractory focal epilepsy, MRI will be considered “normal“ even when performed by an epilepsy specific protocol and when evaluated by a specialized reader .[Hainc et al.2022] False attribution of the label “nonlesional“ to the MR examination has considerable impact on subsequent assessment and management of patients with epilepsy. A negative brain MRI reduces the probability of a patient with focal epilepsy
- to be referred to an epilepsy center,
- to be recommended for surgery,
- to become seizure free following surgery.
In the following sections, we will describe a step by step assessment procedure in epilepsy patients with a negative MRI.
2. Methods
The focus of the current review is to discuss way(s) to improve the yield of the EEG and MRI of the head by using various electroencephalographic and MRI measures in patients in whom the first EEG and first MRI are normal and in whom the clinical history strongly suggests epilepsy. Prior to compilation of this article, a literature search was conducted in Pubmed in July-August-September 2024 for English-language publications .For the section “Electroencephalogram (EEG) to confirm clinical epilepsy diagnosis- options when the first EEG is normal “ we searched for the terms :
“Epilepsy “ or “seizures “ combined with : “EEG yield “, “EEG performance “,”repeat EEG” “EEG duration”, “Sleep EEG “, “EEG sleep deprivation”,”EEG sleep induction “, ”timing of EEG recording “, “EEG extra electrodes “ ,”EEG activating procedures”, “EEG photic stimulation” ,”EEG Hyperventilation” ,“ EEG Reflex precipitation of seizures”,” EEG activating medications” , “chloralhydrate”, “secobarbital”, “temazepam” ,” “Chlorpromazine” ,and ”clonidine “.For the section “Normal MRI in a patient with epilepsy - how to increase the yield?”, we searched for the terms: “Epilepsy “ or “seizures “ combined with :
“ standardized epilepsy protocol” ,”Harmonized Neuroimaging of Epilepsy Structural Sequences“ = ”HARNESS-MRI protocol”, “3T MRI“ ,“7T MRI“, “MR field strength“ , “FLAIR/T2 w sequences“ , “3D Magnetization prepared rapid gradient echo = MP RAGE sequences“, “susceptibility weighted imaging =SWI“, “Diffusion weighted imaging = DWI“ , and “intravenous Gd contrast administration“. Further key words searched for were targeted towards brain segmentation, postprocessing, and MR perfusion by using the term “Epilepsy “ in combination with: “brain MR segmentation“, “MR postprocessing by morphometric analysis“ ,“postprocessing by quantitative analysis of signal intensity” and “postprocessing by volumetry“, “postprocessing by 3D surface rendering technique” , “MR Fingerprinting“, and “MR perfusion”.
We also reviewed references cited in relevant publications . The articles cited are those that we considered of particular value for the purpose of this work. Whenever appropriate, we prioritized meta-analyses (not too many unfortunately!) and research published in the last 10 to 15 years.
3. Electroencephalogram (EEG) to Confirm Clinical Epilepsy Diagnosis- Options When the First EEG Is Normal
3.1. Repeat EEG Recordings, Longer EEG Duration
The EEG yield in patients with epilepsy can be improved with repeated/serial EEG recordings or with increased EEG duration. In 429 adult patients with epilepsy (focal in 95%), the capture of IEDs increased from 50% on the first EEG to 84% by the third, and 92% by the fourth EEG .[Salinsky et al.1987 ]There was little increase in yield with additional recordings. A similar retrospective study in 1078 EEGs of 373 patients reported epileptiform discharges in 38% of patients on the first EEG .[Doppelbauer et al.1993 ] The yield increased to 77% with repeated recordings, but there was little gain after the 5th recording. Among subjects with a single unprovoked seizure, the yield was 39% after the first EEG study and 68% after the third.[Baldin et al.2014]
The EEG yield can also be increased with prolonging the duration of an EEG. In a prospective observational study, 426 patients had IEDs recorded during an EEG that averaged 59.4 minutes .[Burkholder et al.2016] IEDs in 81 patients (19.1%) occurred only after the initial 30 minutes of recording. Extending the EEG from 30 minutes to 45 minutes or longer resulted in newly seen IEDs once in every 13 studies when the pretest probability of epilepsy was high .[Burkholder et al.2016] Another study retrospectively evaluated the yield of the first 20 minutes and the subsequent 4 hours of an EEG-video study in 179 consecutive patients .[Modur et al.2008] The initial 20-minute EEG was nondiagnostic in 130 patients (76%). Among these patients, the subsequent 4 hours of EEG-video were diagnostic in 41 patients (32%). The greatest yield of the additional recording was seen in patients with focal epilepsy: the initial 20-minute EEG recorded focal epileptiform abnormalities in 13 patients and the subsequent 4 hours yielded epileptiform abnormalities in an additional 24 patients. For generalized epilepsy the initial 20-minute recording helped support the diagnosis in 24 patients and the subsequent 4 hours supported the diagnosis in an additional 2 patients. The additional 4 hours also helped with the diagnosis of nonepileptic events. These events were captured in the first 20 minutes in 12 patients; the subsequent 4 hours captured a nonepileptic event in 18 additional patients .[Modur et al.2008]
Several studies have examined the latency to the first interictal epileptiform discharge in outpatient EEGs. In a study of 45 adult EEGs lasting at least 60 minutes (mean duration 187 minutes), and containing an IED, the initial IED occurred in the first 20 minutes in 53% and after 20 minutes in 47% of EEGs .[ Losey, Uber-Zak .2008] The mean time to the first IED was 32.8 minutes. The latency was longer in patients with temporal IEDs (56 minutes) than in patients with generalized IEDs (22 minutes). It should be noted that the 45 EEGs in this study represented only 26% of the extended EEGs that were evaluated; no IEDs were noted in the remaining 74% .[Losey,Uber-Zak .2008] Another study recorded 24-hour EEG in 200 mixed-age patients with epilepsy .[Badry,2013] IEDs were detected in 45% after 20 min, 55% after 1 h, 64% after 2 h, and 85% after 24 h. When longer duration EEG studies were evaluated, the latency to the first IED was longer. In a study of 4-day ambulatory EEG recordings in 180 adult patients with epilepsy, focal IEDs were seen in 130 and generalized IEDs in 50 patients .[Faulkner et al.2012]IEDs were recorded in 44% of patients within 4 h, 58% within 8 h, 85% within 24 h and 95% within 48 h of recording. The median latency to the first IED in the whole group was 316 min. In agreement with the prior study, IED latency was longer in focal epilepsy than in generalized epilepsy (576 vs 43 minutes). Interestingly, longer duration of epilepsy was associated with a longer latency to the first IED. Since the last 2 days of recording only added 5% of new IED capture, the authors suggested that a 48-hour recording was sufficient for classification in the majority of subjects .[Faulkner et al.2012] In a study that evaluated 24-hour EEG recordings after a first unprovoked seizure in 25 patients aged 15-59 years, 11 patients had IEDs, appearing after one hour of recording in 73%. The median latency to the first IED was 170 minutes .[Haddad et al.2021]
3.2. Sleep, Sleep Deprivation and Sleep Induction
Studies have consistently demonstrated that recording sleep is important to capture epileptiform discharges, particularly in focal epilepsy. One study of 129 patients aged 11-79 years with a normal waking EEG found that sleep EEG detected an abnormality in 41.8% .[Delil et al., 2015)] The yield of IEDs in sleep is greater with younger age.[Baldin et al., 2017] A pediatric study that stratified patients by referral diagnosis reported that if the EEG in waking failed to show any IEDs, 31% of sleep studies disclosed an additional yield .[Ontiveros et al., 2016] The additional yield of the sleep studies was particularly higher in patients referred for suspected benign epilepsy with centrotemporal spikes (BECTS- now called SELECTS) and patients referred for suspected electrical status epilepticus during slow-wave sleep (ESES).[Delil et al., 2015] In a study based on inpatient EEG monitoring ,71% of patients aged >10 years had their first IED in sleep .[Narayanan et al., 2008 ] In older children and adults, recording sleep is more important for focal epilepsy, and particularly temporal lobe epilepsy. An inpatient EEG-video study of 210 consecutive patients aged 38.6+/-13.9 years found that 63% of first IEDs occurred during sleep in patients with focal epilepsy, while 66% occurred in waking in patients with generalized epilepsy.[Werhahn et al., 2015] In 90 patients with temporal lobe epilepsy, two thirds of first IEDs occurred during sleep .[Werhahn et al., 2015]
One advantage of longer EEG recordings is that it allows sleep to be captured. There are also methods to achieve sleep in 20-30-minute routine EEG recordings. Sleep was more likely to be achieved in children if hyperventilation was performed early and photic stimulation at the end of the recording .[Kaleyias et al., 2006] Sleep may also be induced on shorter EEG recordings by sleep deprivation or sedation. A variety of agents have been used to induce sleep during EEGs in children. Sedation success/failure rates were similar between oral chloral hydrate, oral dexmedetomidine, oral hydroxyzine hydrochloride, and oral midazolam .[Fong et al., 2017]
Sleep deprivation is effective at inducing sleep, and may activate IEDs beyond its ability to induce sleep . [Fountain et al., 1998, Leach et al., 2006] In one study, patients aged 17-75 years with a clinical diagnosis of epilepsy, but with a normal or inconclusive first routine EEG underwent a second recording .[Roupakiotis et al., 2000] IEDs were recorded in 5/52 (9.6%) when the second EEG was a routine EEG and in 45/199 (22.6%) when the second EEG was sleep deprived. In another study of 20 patients aged 5-51 years with epilepsy who underwent a series of EEGs including routine, sedated and sleep deprived recordings, IEDs were recorded in 25% of routine, 50% of sedated and 80% of sleep deprivation records .[Rowan et al., 1982] It has even been suggested that the first diagnostic EEG study should be sleep deprived. Eighty five patients aged <35 years with possible new epilepsy (having experienced at least two bilateral tonic-clonic seizures) underwent three EEGs in random sequence, including a routine EEG, a sleep-deprived EEG, and an EEG with drug-induced sleep .[Leach et al., 2006) ] Among 36 patients with generalized spike-and-wave discharges, the sensitivity of the sleep deprived EEG was 92% compared to 58% for the drug-induced sleep EEG and 44% for the routine EEG. Ten patients (28%) only demonstrated IEDs after sleep deprivation. Among 15 patients with focal discharges, the sensitivity of the sleep deprived EEG was 73% as compared to 40% for the drug-induced sleep EEG and 27% for the routine EEG . Seven patients (47%) had IEDs seen only after sleep deprivation. In this study sleep deprivation was extreme, with no sleep and no food after 10 pm. Two patients had generalized tonic-clonic seizures after sleep deprivation. A more moderate sleep deprivation (for example going to bed an hour later and waking up an hour earlier) may be less likely to precipitate unwanted tonic-clonic seizures.
3.3. Timing of EEG Recording
The timing of the EEG may influence the EEG yield. Some forms of epilepsy have a circadian distribution of seizures as well as IEDs. For example, seizures as well as IEDs are more likely captured in the morning in patients with juvenile myoclonic epilepsy. One study recorded standard awake EEGs consecutively at 9 am and 3 pm in 29 patients with juvenile myoclonic epilepsy .[Labate et al., 2007] The morning EEG showed generalized IEDs and/or a photoparoxysmal response (PPR) in 20 patients (69%), 15 of whom had a normal afternoon recording. The afternoon EEG yield of IEDs and/or PPR was only 5/29 (17%).[Labate et al., 2007] Thus, in patients with suspected juvenile myoclonic epilepsy, a diagnostic EEG should be obtained in the morning, and if the first EEG was a normal afternoon EEG, a second EEG should be a morning EEG.
There is also evidence that the sooner an EEG is obtained after a seizure, the more likely it is to record epileptiform abnormalities. In a retrospective study of 170 adult patients who received an emergency EEG after a first unprovoked seizure, IEDs were identified in 34.1% of recordings.[Llaurado et al., 2020] A shorter latency from seizure to EEG was associated with a higher probability of finding epileptiform discharges. The highest probability of detecting an IED was within the first 16 h after seizure onset: IEDs were detected in 52.1% of recordings performed before versus 20.2% of those performed after that cut-off.[Llaurado et al., 2020] If the first EEG is normal and a second seizure occurs, the second EEG should be obtained within 16 hours from the seizure.
3.4. Extra Electrodes Outside 10-20 Electrode Array
Standard EEGs are usually performed using the 19 electrodes of the 10-20 electrode system. However, the 10-20 electrode array does not cover the basal aspect of the temporal lobes. Adding extra temporal electrodes may be helpful in improving temporal IED detection. Nasopharyngeal electrodes were used in the past and fell out of favor, although a recent study advocated their reconsideration .[Hwan Yim et al., 2021] Sphenoidal electrodes improved the detection of temporal IEDs [So et al., 1994, Sperling and Guina, 2003, Sperling et al., 1986] but their insertion can be painful and they are not appropriate for short-term outpatient EEG studies. The true anterior temporal electrodes which are positioned over the anterior temporal region also improved the detection of temporal IEDs .[Sperling and Engel, 1985]
More recently, a study investigated the additional yield of the 6 inferior temporal chain electrodes of the 10-20 electrode system, F9/10, T9/10, P9/10 .[Bach Justesen et al., 2018] Out of 70 patients with temporal IEDs, 54% of IEDs had a peak negativity in the inferior chain and 4% were only seen at the inferior chain .[Bach Justesen et al., 2018] The inferior temporal chain is now included in the standardized EEG array of the International Federation of Clinical Neurophysiology.[Seeck et al., 2017]
3.5. Interventions with Activation Procedures
Hyperventilation and intermittent photic stimulation are standard activation procedures in the routine EEG. Hyperventilation, usually for 3 minutes, is known to activate generalized absence seizures in the untreated child with childhood absence epilepsy. One recent study suggested that generalized absence seizures are more likely to be precipitated when hyperventilation is conducted in a sitting rather than supine position.[Rozenblat et al., 2020] The yield of hyperventilation can also be increased by prolonging its duration to 5 minutes.[Craciun et al., 2015] In a study of 877 mixed-age patients who hyperventilated for 5 minutes, 16% of seizures and 30% of interictal EEG abnormalities triggered by hyperventilation occurred during the last 2 minutes of hyperventilation, supporting the usefulness of prolonging hyperventilation for 5 minutes .[Craciun et al., 2015]
Intermittent photic stimulation can also be optimized for improving its yield as well as its safety .[Abou-Khalil et al., 2021, Kasteleijn-Nolst Trenite et al., 2012] In patients with suspected photosensitivity, intermittent photic stimulation should ideally be performed with 3 eye conditions: eyes closed, eyes open, and active eye closure (closing the eyes at the beginning of each stimulation). Active eye closure is often the most potent stimulus; it should be the default eye condition if only one eye condition is used. As mentioned above under timing of EEG, the yield of photic stimulation may also be greater in the morning.[Labate et al., 2007]
When reflex precipitation of seizures is reported, the stimulus may activate both seizures and IEDs. Every effort should be made to replicate the precipitating event during the EEG. This should be quite feasible when the reported precipitating trigger is flashing light (photosensitivity), patterns (pattern sensitivity), certain types of music, reading, eating, somatosensory or proprioceptive stimuli, or startle.
In patients with suspected idiopathic generalized epilepsy neuropsychological/cognitive tasks may activate IEDs in some patients while inhibiting IEDs in others. [Beniczky et al., 2012, Matsuoka et al., 2005, Matsuoka et al., 2000]They may be considered when the baseline EEG is normal. Cognitive tasks precipitated IEDs in 18 of 172 (10,4%) patients without abnormalities on awake EEG.[Matsuoka et al., 2000] Among patients with activation of IEDs by cognitive tasks, 95% had idiopathic generalized epilepsy (IGE), most commonly JME followed by juvenile absence epilepsy and epilepsy with tonic-clonic seizures alone.[Matsuoka et al., 2000] In a study of 50 patients with JME , IEDs were exclusively provoked by cognitive tasks in 4 of 50 (8%) patients.[Dhamija et al., 2018] The yield may be even higher in subjects with known reflex precipitation of seizures by cognitive tasks. In a study of 35 patients with epilepsy who reported cognitive functions as a reflex seizure stimulus, verbal and arithmetic tasks were administered during a standard awake EEG. IEDs were activated by a verbal task in 11.4% of patients and by an arithmetic task in 5.7%.[Bulus et al., 2022] All activated patients had IGE. Among 18 patients with normal baseline EEG, one patient demonstrated activation with both verbal and arithmetic tasks.
3.6. Activating Medications
As mentioned above, hypnotics administered during EEGs to induce sleep include chloralhydrate, secobarbital, temazepam. The administration of sedation has declined considerably in favor of sleep deprivation to induce sleep, partly because conscious sedation now requires monitoring of breathing and blood pressure by nursing staff.
Other medications were reported to activate IEDs when administered during an EEG. Intramuscular chlorpromazine, 50 mg, was administered to 41 adult patients with epilepsy and a normal interictal awake EEG.[Aguglia et al., 1994)] These patients also received a separate EEG with sleep deprivation. Chlorpromazine activated IEDs in 19/20 (95%) untreated patients and 13/21 (62%) treated patients. It was superior to sleep deprivation in untreated patients, activating IEDs in 7 patients who did not have IEDs on the sleep deprived EEG. All IEDs were recorded just before or after sleep onset. However, the superiority of chlorpromazine suggested an activating effect beyond its effect on sleep. There was no difference between chlorpromazine and sleep deprivation in treated patients. No IEDs were recorded with either activating procedure in 18 control subjects. [Aguglia et al., 1994]
Clonidine is another medication used for sedation, but which may also activate epileptiform activity. In a study comparing chloralhydrate and clonidine for sedation, 100 children were randomized to receive clonidine and 98 to receive chloralhydrate before undergoing EEGs. IEDs were reported in 14 children in the clonidine group and 3 children in the chloralhydrate group .[Ashrafi et al., 2020] There was no difference between the groups in reported focal IEDs. Premedication with oral clonidine followed by intravenous administration of methohexital has been used to activate IEDs in patients undergoing magnetoencephalography. Each was found to increase IEDs in the majority of patients.[Kirchberger et al., 1998]
4. Normal MRI in a Patient with Epilepsy - How to Increase the Yield?
The 2017 and 2022 ILAE epilepsy classification and update resulted in a 3-level approach by classifying disease into seizure type, epilepsy type, and the presence of an epilepsy syndrome .[Scheffer, 2017, Agarwal,2022] Clinical assessment and EEG monitoring are the mainstay of this classification.
In patients with clinical seizures, lesions identified by MRI often enable etiologic classification such as residues of infection, or trauma, glioneuronal tumours and vascular causes (eg ischemic infarction). Microbleeds and superficial siderosis may be indicative of cavernoma or amyloid angiopathy. Autoimmune disease such as limbic encephalitis and phakomatoses (tuberous sclerosis or Sturge Weber syndrome) exhibit a pathognomonic MR appearance and thus allow to direct further investigations to onconeural and neuronal surface antibodies and to genetic testing respectively. .
MR-negative epilepsy is defined as an electro-clinically verified epilepsy without a structural lesion on 3T MRI applied with an epilepsy specific protocol.
A normal MR exam is particularly challenging for surgery when semiology and EEG scalp recording are non-localizing as well. Epilepsy surgery requires a sound indication based on an electro-clinical focus, and a corresponding localization of an epileptogenic lesion. Following surgery, the odds of being seizure free were 2.7 times higher in patients with lesions related to the temporal lobe and by a factor of 2.5 in extratemporal locations. In other words, in patients with a “normal“ MRI, the chance of seizure freedom drops from 70% to 46%.[Téllez-Zentenoa et al. 2010]
Improved postsurgical seizure control in 75.0% of patients for temporal and in 61.5% for extratemporal lobe epilepsy has been reported when negative MR examinations were combined with subtraction ictal SPECT coregistered to MR imaging (SISCOM) and electric source imaging.[Czarnetzki et al. 2024]
In the following sections, we will describe a step by step assessment procedure in epilepsy patients with a negative MR.
4.1. Pathologies Likely to Be Missed on Brain MRI in Patients with Epilepsy
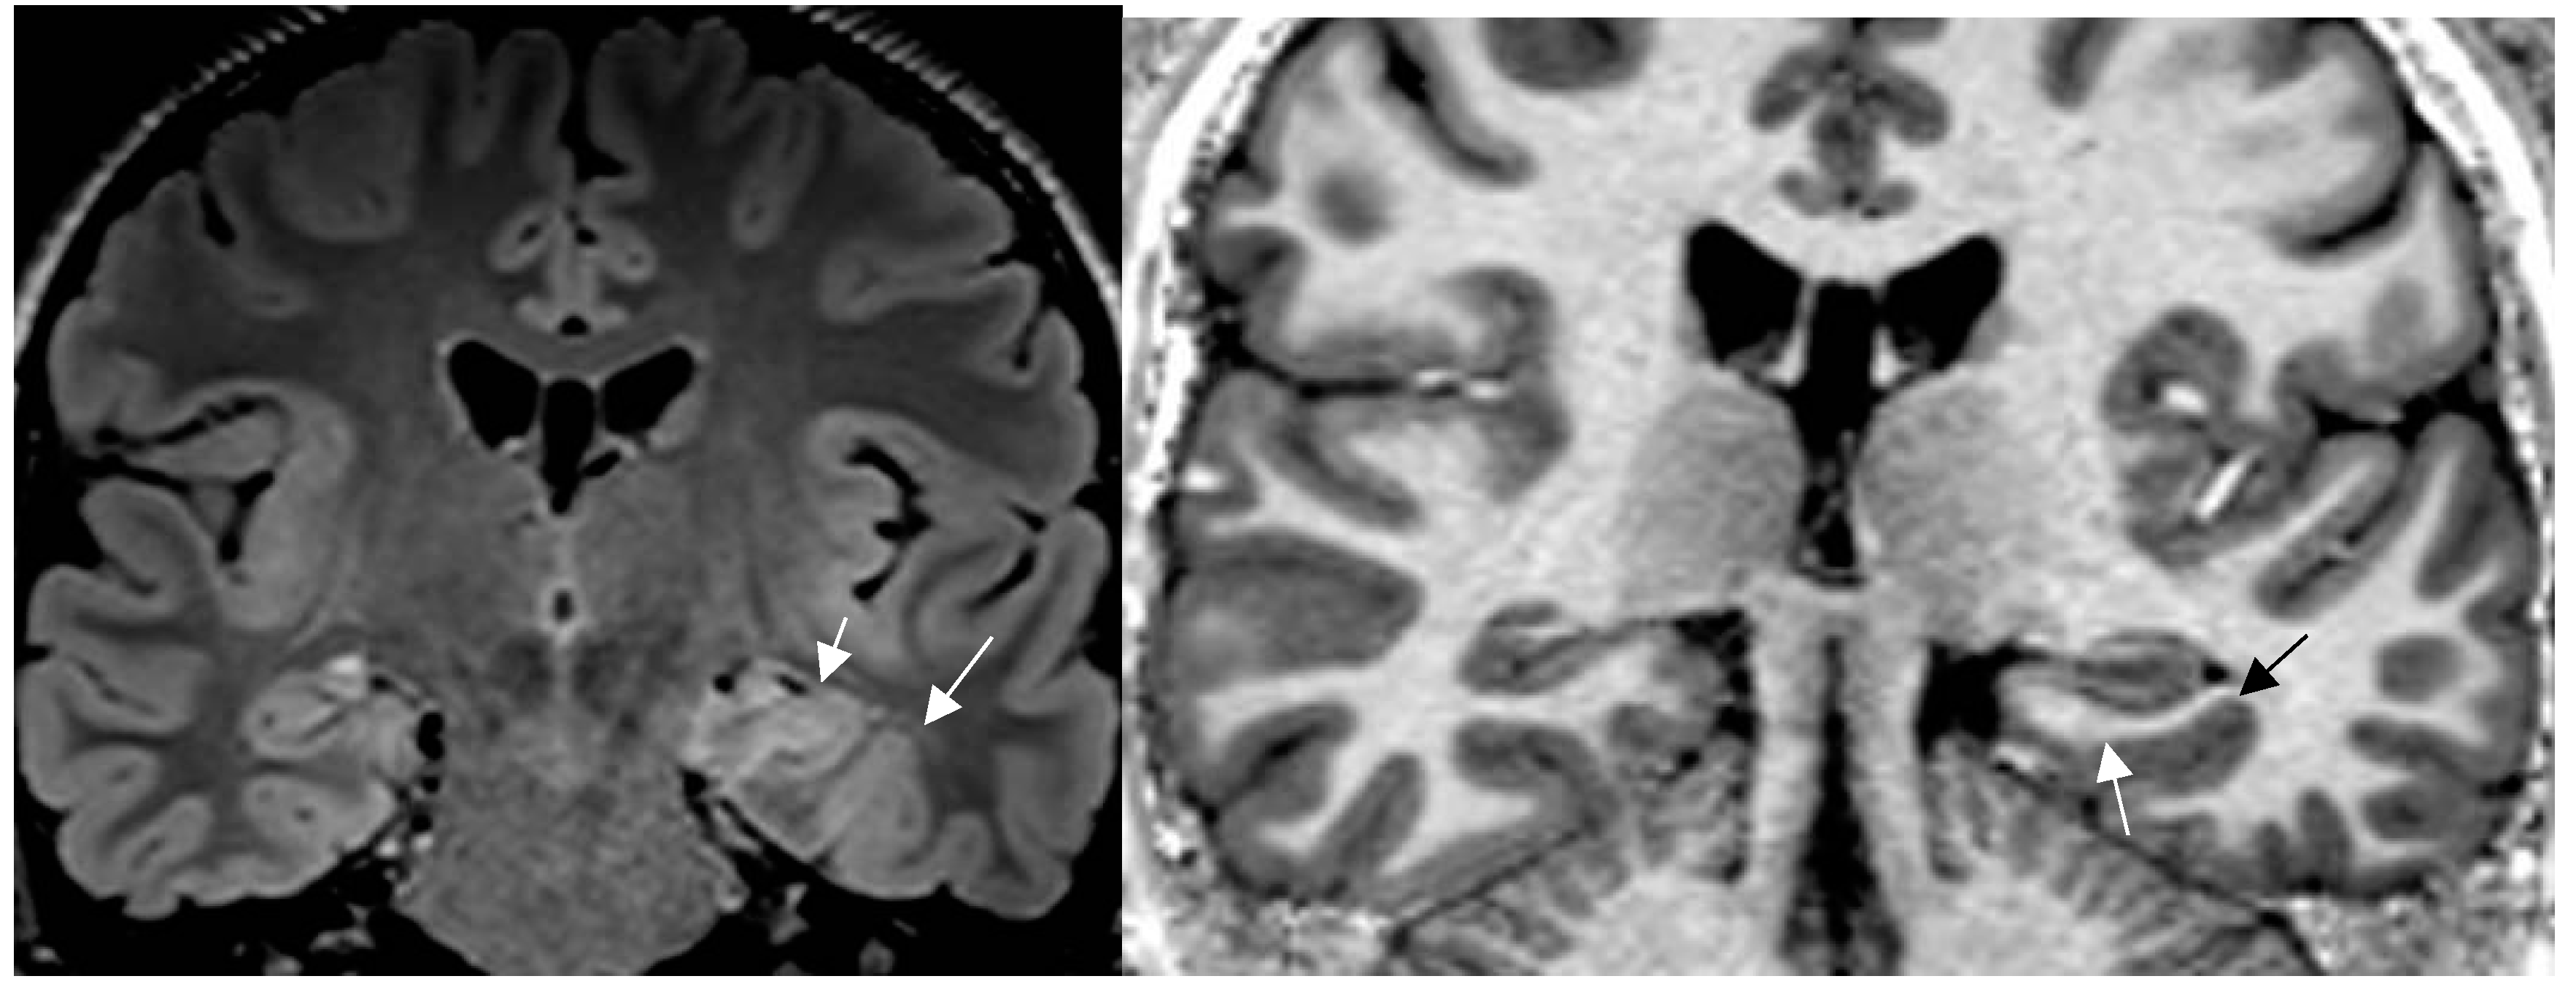
Postsurgical pathologic analysis of specimens of lesions missed by a “negative brain MRI” – even when performed by an epilepsy specific protocol - disclosed focal cortical dysplasia (FCD), hamartia, gliosis and hippocampal sclerosis as the most common entities (Figure 1).[Wang et al. 2013]
Figure 1.
a,b: Histologically confirmed FCD I depicted by abnormal deep and straight left collateral sulcus with slight blurring of gray white matter junction on FLAIR image (a) 1.7mm) and signal hyperintensity of cortical border. Reduction of adjacent parahippocampal white matter (white arrow on MP2RAGE sequence (b) slice thickness 0.9mm. The hippocampus displays mild signal increase on FLAIR image (without atrophy) as a sign of dual pathology. Both lesions were missed on prior 1.5 T examination in a patient with left temporal lobe epilepsy.[51] [all figures are authors own work.].
The 2022 updated classification of FCD by the ILAE task force therefore recommends a 4 layer integrated approach with explicit inclusion of histology and molecular-genetic testing, neuroimaging (MRI) as layer 3 and “layer 4“ merging into a diagnosis based on integration of the information gathered by layer 1-3 [Najm et al. 2022]
4.2. A standardized Epilepsy Specific Protocol Provides Superior Diagnostic Yield
A comprehensive epilepsy targeted MRI protocol is the key factor to identify, localize and characterize an epileptogenic lesion (Figure 1). The neuroimaging tasks force of the ILAE advises the “Harmonized Neuroimaging of Epilepsy Structural Sequences“ (HARNESS-MRI) protocol that encompasses 3 “core” sequences: iso-tropic, millimetric FLAIR and 3D T1 images and high-resolution 2D T2 sequences to be performed soon after the first seizure.[Bernasconi et al. 2019]
In a recent report from Egypt [Kishk et al. 2023] the authors describe an increase of causative lesions from 40 detected by a conventional MR protocol to 106 at high “cost-effectiveness based on the HARNESS protocol” . The impact of “access to detailed description of the electroclinical findings, including the semiology, suspected hemisphere/ lobe” as recommended by the ILAE task force was evidenced by an additional rise to 131 lesions identified during interdisciplinary board meetings. Small focal lesions, detection of gliosis and hippocampal sclerosis require a dedicated epilepsy specific protocol to be reliably depicted by MR.
In the setting of interval changes of seizure semiology and/or frequency, repetition of a dedicated MR protocol is recommended to evaluate for new or previously missed structural lesions .[Lee et al. 2020] Performing MRI with a standardized epilepsy specific protocol without or with contrast administration is in agreement with “The American College of Radiology Appropriateness Criteria” for “Variant 6 Known seizure disorder Surgical candidate or surgical planning“. American College of Radiology (ACR) criteria are evidence-based guidelines and reviewed annually by a multidisciplinary expert panel.
Despite the standardization achieved by the HARNESS protocol the addition of new sequences such as SWI, DWI, M2RRAGE and preferential application of 3D sequences as compared to 2D acquisition is an important step to further exploit morphological MRI at higher resolution and sensitivity.
An author proposal leading to an updated extension of the HARNESS protocol is provided in Table 2. [Table is authors own work]
4.3. Expert Readers Take Advantage of the Added Value of an Epilepsy Specific Protocol
In a prior study[Von Oertzen et al. 2002] and in a recent prospective evaluation of the HARNESS protocol [Vaudano et al. 2023 ] in 123 and 131 patients, the sensitivity of MRI was particularly enhanced by interpretation of experienced readers for the diagnosis of hippocampal sclerosis and focal cortical dysplasia as the previously most frequently missed entities in adults and children respectively. The combination of a dedicated MR and expert readers increased detection of hippocampal sclerosis from 18 to 45%, of focal lesions from 50 to 91%.[von Oertzen et al. 2002] Expert readers are more likely to recognize focal hippocampal sclerosis (Figure 2) and detect indirect associated signs such as atrophy of the ipsilateral fornix and mammillary body. Observations like the transmantle sign and subtle changes of adjacent white matter in focal cortical dysplasia, periventricular nodular and subcortical band heterotopia are challenging and less likely to be missed visually by an experienced reader.
Figure 2.
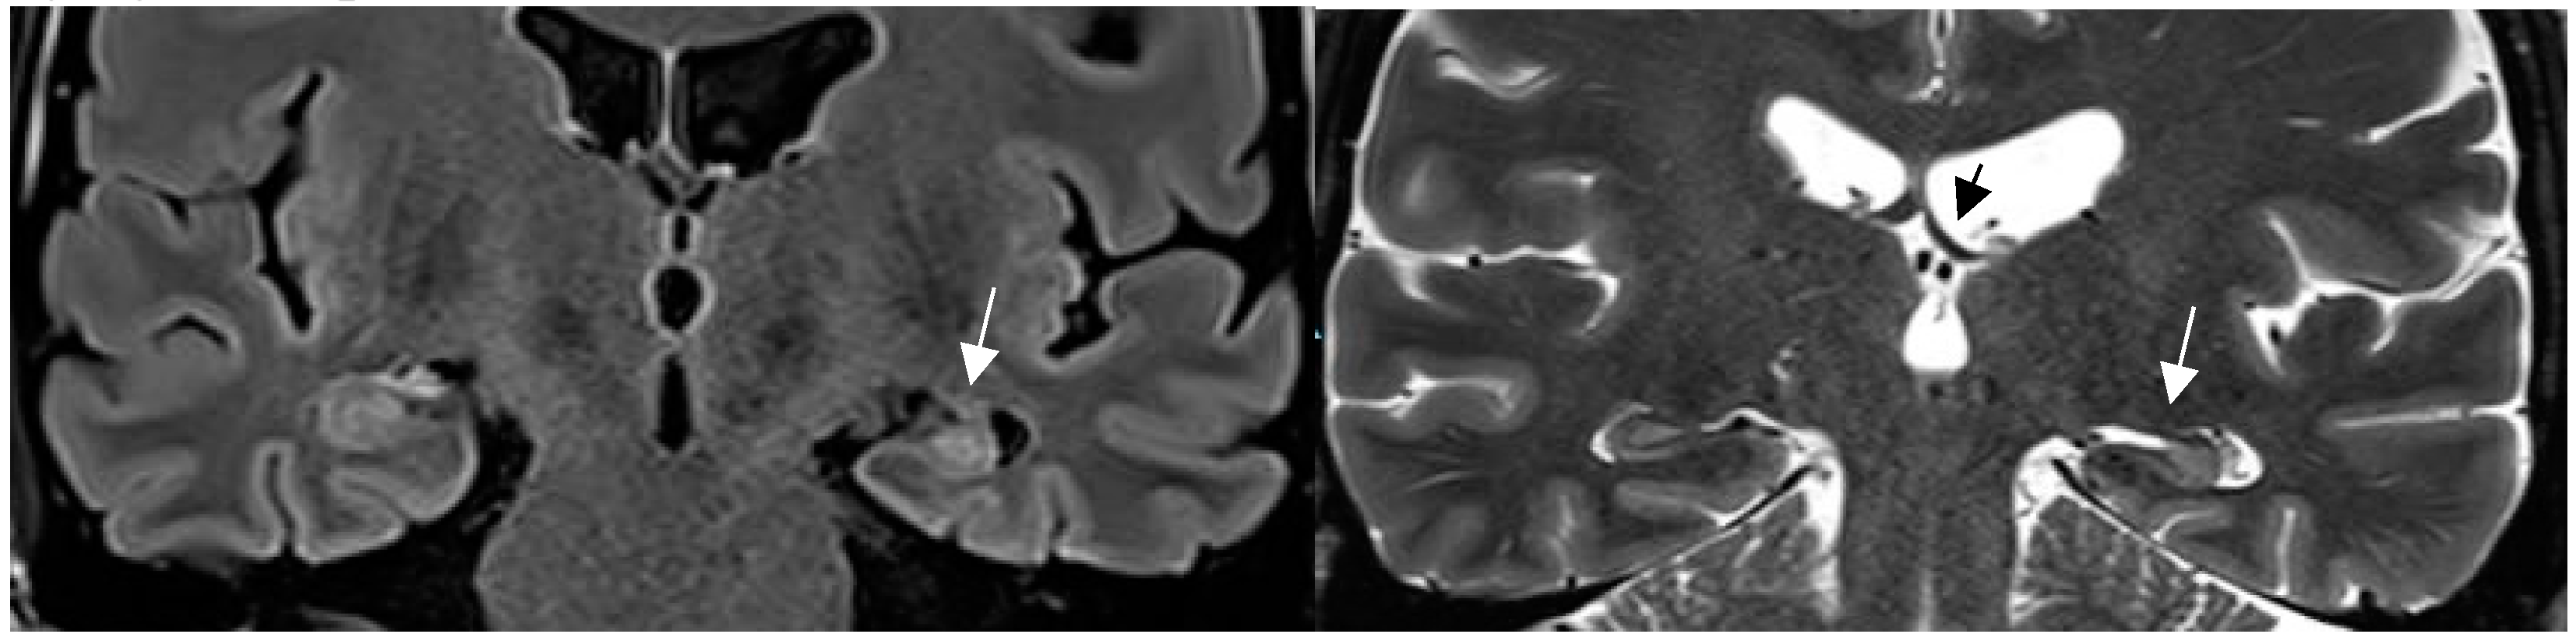
Hippocampal sclerosis depicted on coronal FLAIR (a) and T2 w sequence (white arrows ). (b). (1.7mm each) with volume reduction of the CA1-4 regions of the left hippocampus, FLAIR and T2 signal increase and slight atrophy of the left fornix (short black arrow in b). Marked volume reduction of left temporal lobe as evidenced by the lower position of the left Silvian fissure compared to the right side.[ figures are authors own work.].
Figure 2.
Hippocampal sclerosis depicted on coronal FLAIR (a) and T2 w sequence (white arrows ). (b). (1.7mm each) with volume reduction of the CA1-4 regions of the left hippocampus, FLAIR and T2 signal increase and slight atrophy of the left fornix (short black arrow in b). Marked volume reduction of left temporal lobe as evidenced by the lower position of the left Silvian fissure compared to the right side.[ figures are authors own work.].
4.4. Increased MRI Field Strength and Receive Coils Improve Lesion Recognition by Enhanced Signal and Spatial Resolution
In recent years MRI has faced substantial technological development related to the field strength of the magnet (eg 1.5 to 3T), the number of coil channels used to receive the signal from 32 to 64 channels. A factor that has increased the yield of MRI is the change of “standard“ field strength for brain MR from 1.5T to 3T. High field MR (3T) outperformed MRI at 1.5T field strength both in lesion detection and lesion characterization by a factor of 2.57 and 2.66 .[ Phal et al. 2008]In a meta-analysis, the pooled estimate of detection rate based on 5 studies was 18% (95% CI: 5-47%) for 3T in patients with prior negative 1T and 1.5T examinations respectively .[Rados et al.2022]
The comparable detection rate for 7T MRI was higher with 23% (95%-CI: 17-30%) analyzed from 7 studies. The authors admit that several factors of bias (patient selection, reference standard, information and applicability) pose a limit for an impartial comparison of the true yield of 7T field strength.
A sign specific for 7T only has been described related to FCD IIb, in whom the T2* sequence depicted an intracortical “black line“ in 5/6 patients that had not been visible on prior lower field MR imaging .[Bartolini et al. 2019)] Complete surgical removal of this black line resulted in seizure freedom in 4 of 5 patients while incomplete resection led to failure of seizure freedom in the remaining individual.
The ready availability of 3T MRI and the advantage of 3T MR field strength has been approved specifically for the assessment of children [Ahmed et al. 2018] and overall, in adult patients with epilepsy .[Hainc et al.2022, Vaudano et al. 2023]
A practical hint is increasing spatial resolution in a 3T field magnet by lowering slice thickness from 3mm to 2 -1.5mm for T2 sequences while maintaining signal intensity. This is enabled by application of a head coil with a high number of receive coils – eg 64 channel in a 3T field system (Figure 3). Sensitivity for lesion detection thus increased from 53.1% to 85.9% .[ Ahmed et al. 2018] The most common pathologies additionally encountered in this study were FCD, nonspecific gliosis and oligodendrogliosis.
Progressive substitution of 2D by 3D acquisition and thus lowering the slice thickness from 2-3mm slice to 0.9 -1mm is a considerable “yield gaining“ strategy. This increases visual conspicuity for small lesions but moreover enables advanced postprocessing of 3D data.
Figure 3.
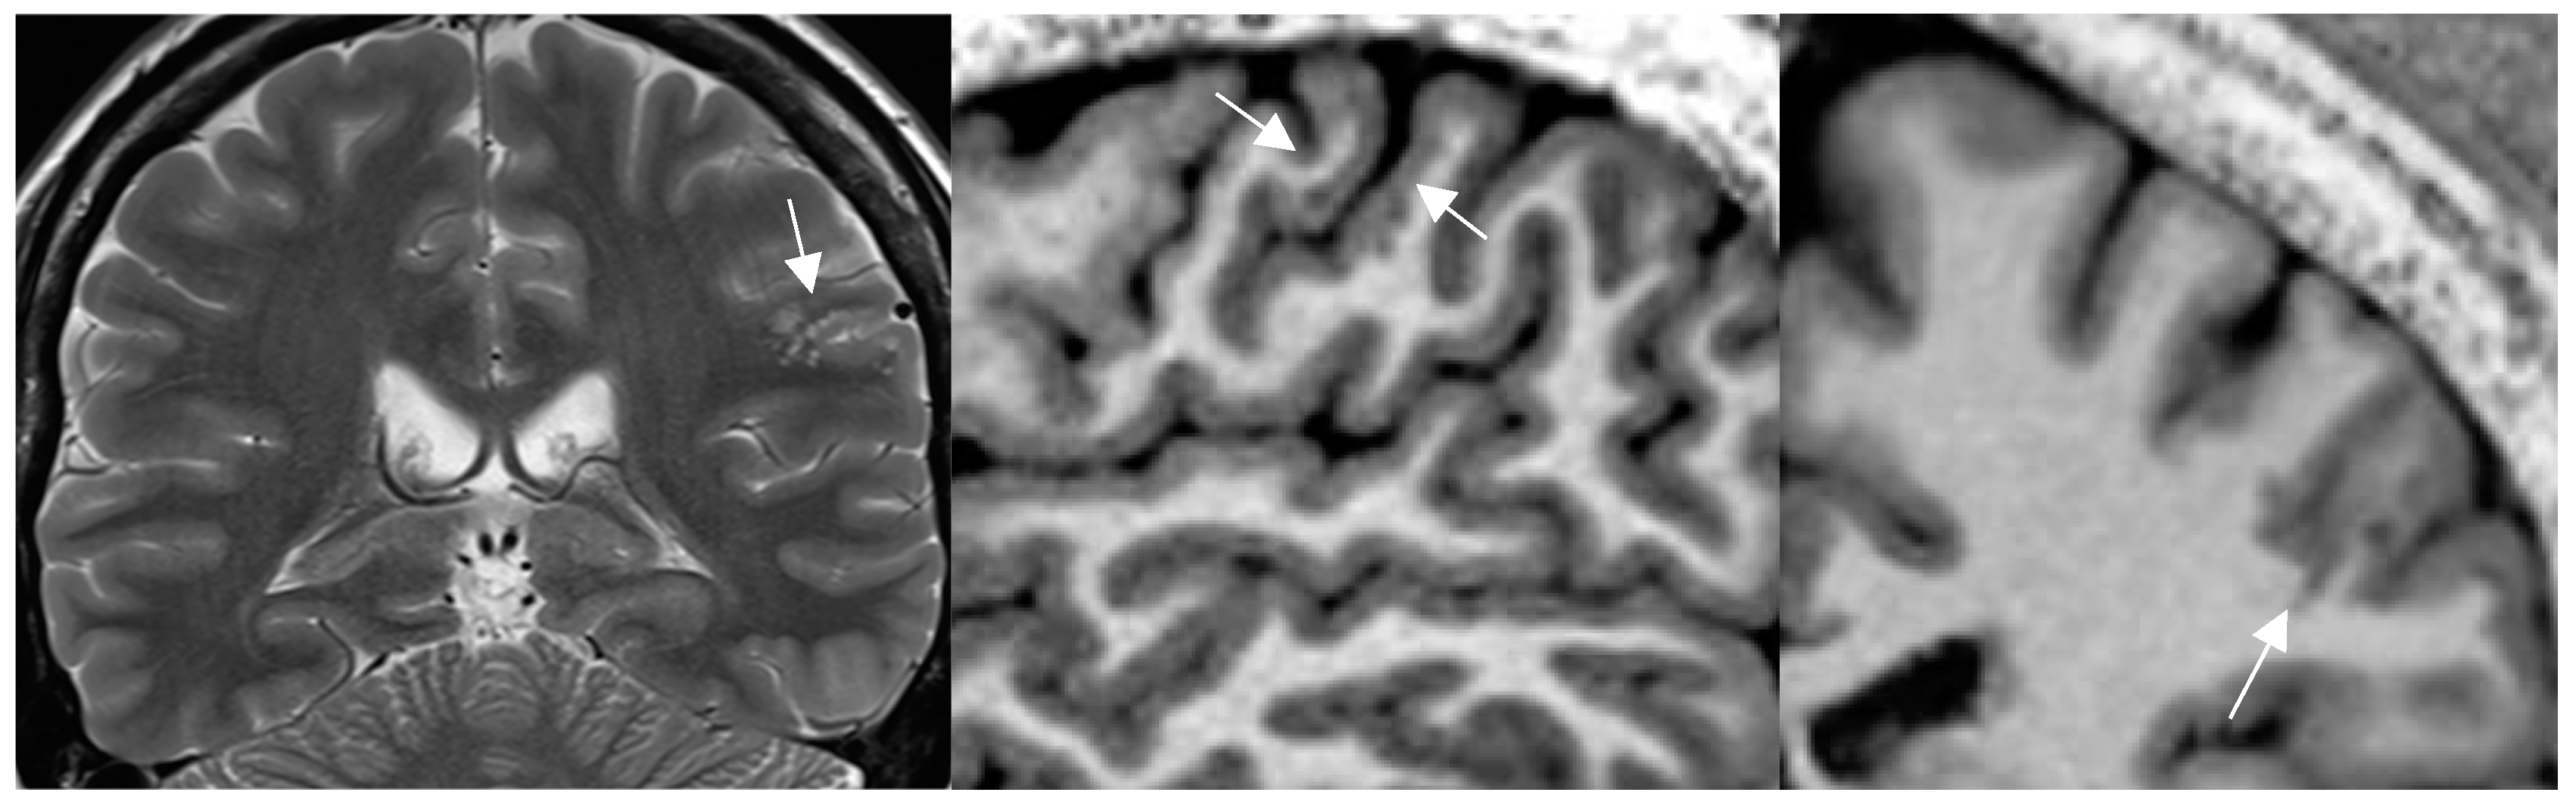
a-c mild malformation of cortical development along left central sulcus hardly depicted by slight cortical blurring and subcortical gliotic foci on 1.7mm coronal 2T w image (arrow in a)(a). Improved visualization of the mMCD on sagittal (b) and coronal (c) MP2RAGE sequence (0.9mm) with slight nodular irregularity of both cortical borders and focal subcortical extension (c) .[figures are authors own work ].
Figure 3.
a-c mild malformation of cortical development along left central sulcus hardly depicted by slight cortical blurring and subcortical gliotic foci on 1.7mm coronal 2T w image (arrow in a)(a). Improved visualization of the mMCD on sagittal (b) and coronal (c) MP2RAGE sequence (0.9mm) with slight nodular irregularity of both cortical borders and focal subcortical extension (c) .[figures are authors own work ].
Higher spatial resolution and superior gray- white matter discrimination facilitate fusion of MR with ictal-interictal SPECT (SISCOM), magnetencephalography (MEG) and PET and additionally enable data transfer for neuronavigation during epilepsy surgery.
4.5. New MR Sequences Display Tissue Properties for Improved Visualization of Lesions
Though not constituents of the core HARNESS protocol the addition of a susceptability weighted imaging (SWI) and diffusion weighted imaging (DWI) have acquired a status of “indispensable“ sequences for the assessment of patients with epilepsy. (see Table 2 )
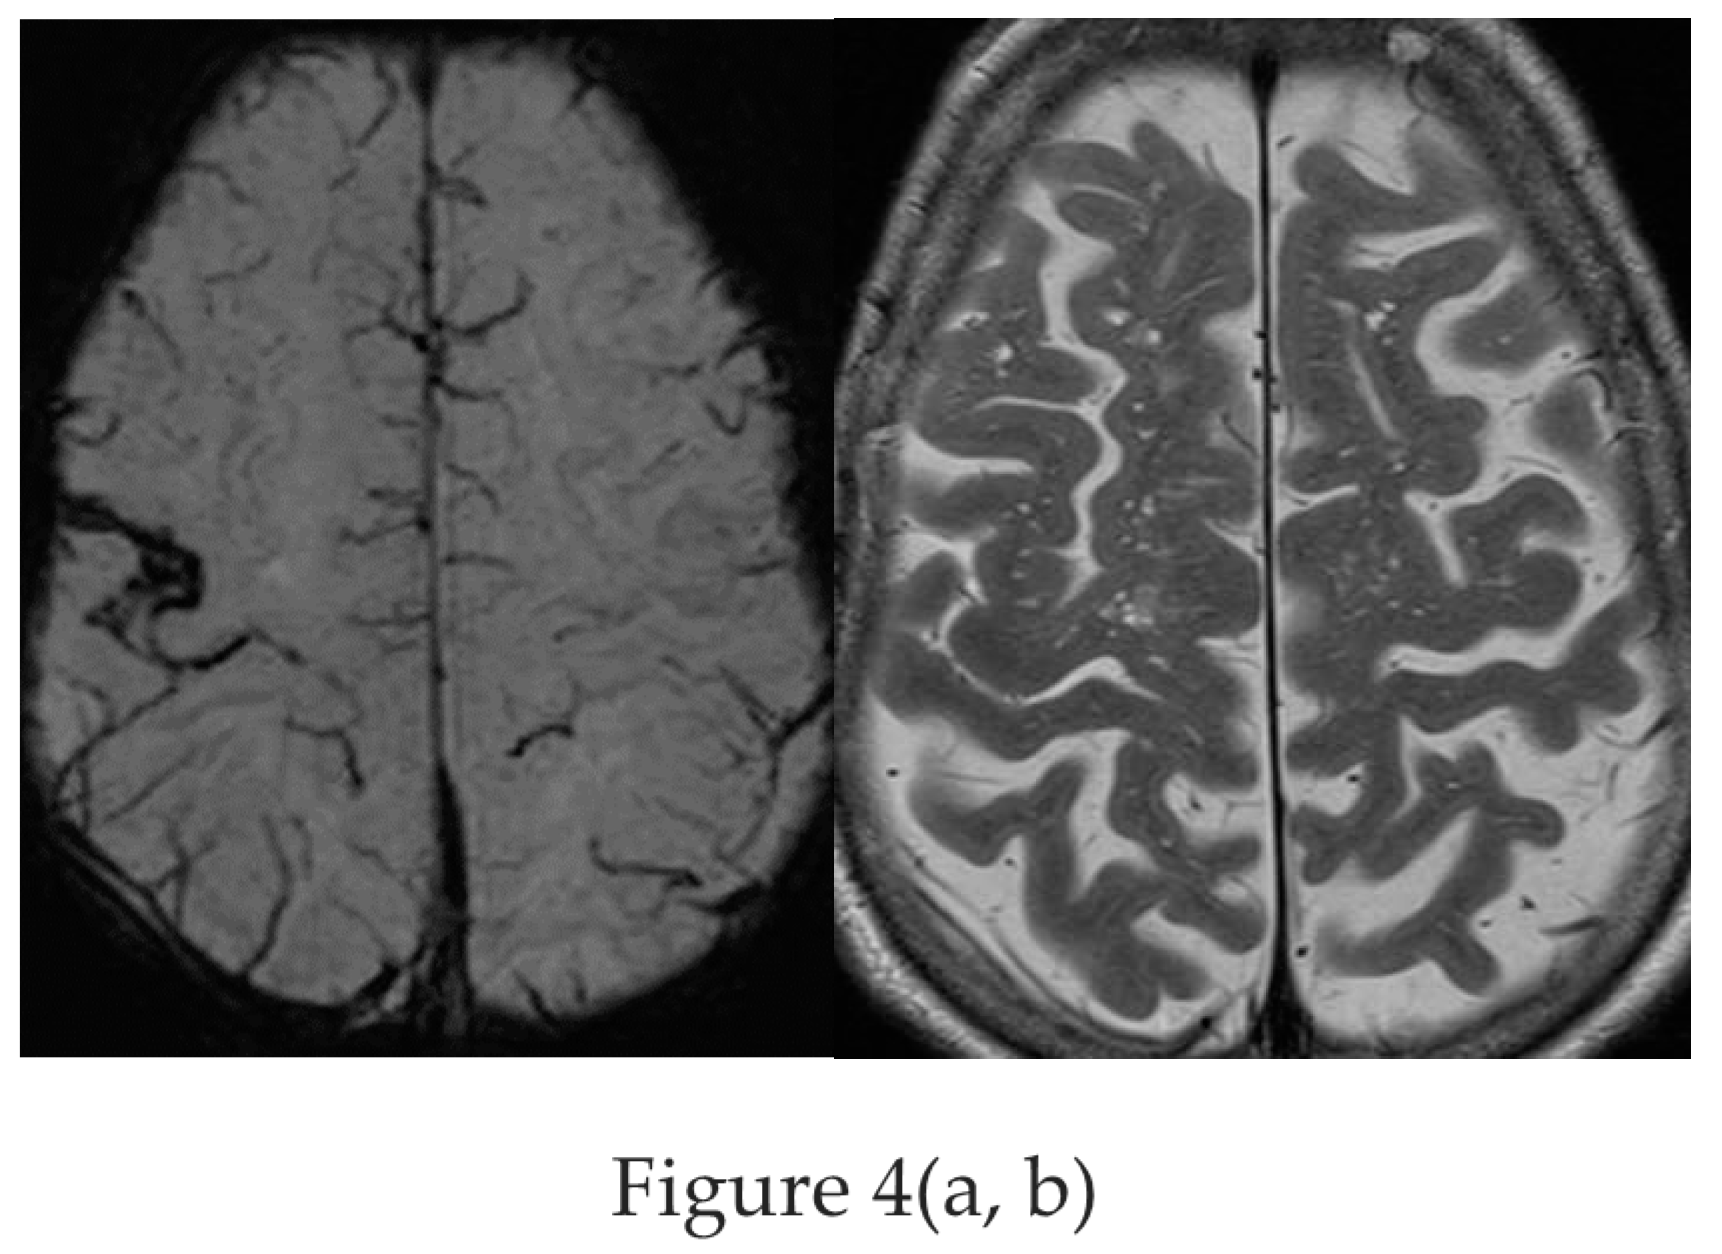
The SWI sequence depicts hemosiderin and calcification and thus renders visible cavernoma, cerebral and superficial siderosis as figureheads of cerebral amyloid angiopathy, posttraumatic or postsurgical siderosis (Figure 4).
Figure 4.
a,b : Amyloid angiopathy as evidenced by superficial siderosis within the right central sulcus on SWI sequence (a) invisible on the corresponding axial T2 w image (b) in a patient with focal left handed seizures [figures are authors own work].
Figure 4.
a,b : Amyloid angiopathy as evidenced by superficial siderosis within the right central sulcus on SWI sequence (a) invisible on the corresponding axial T2 w image (b) in a patient with focal left handed seizures [figures are authors own work].
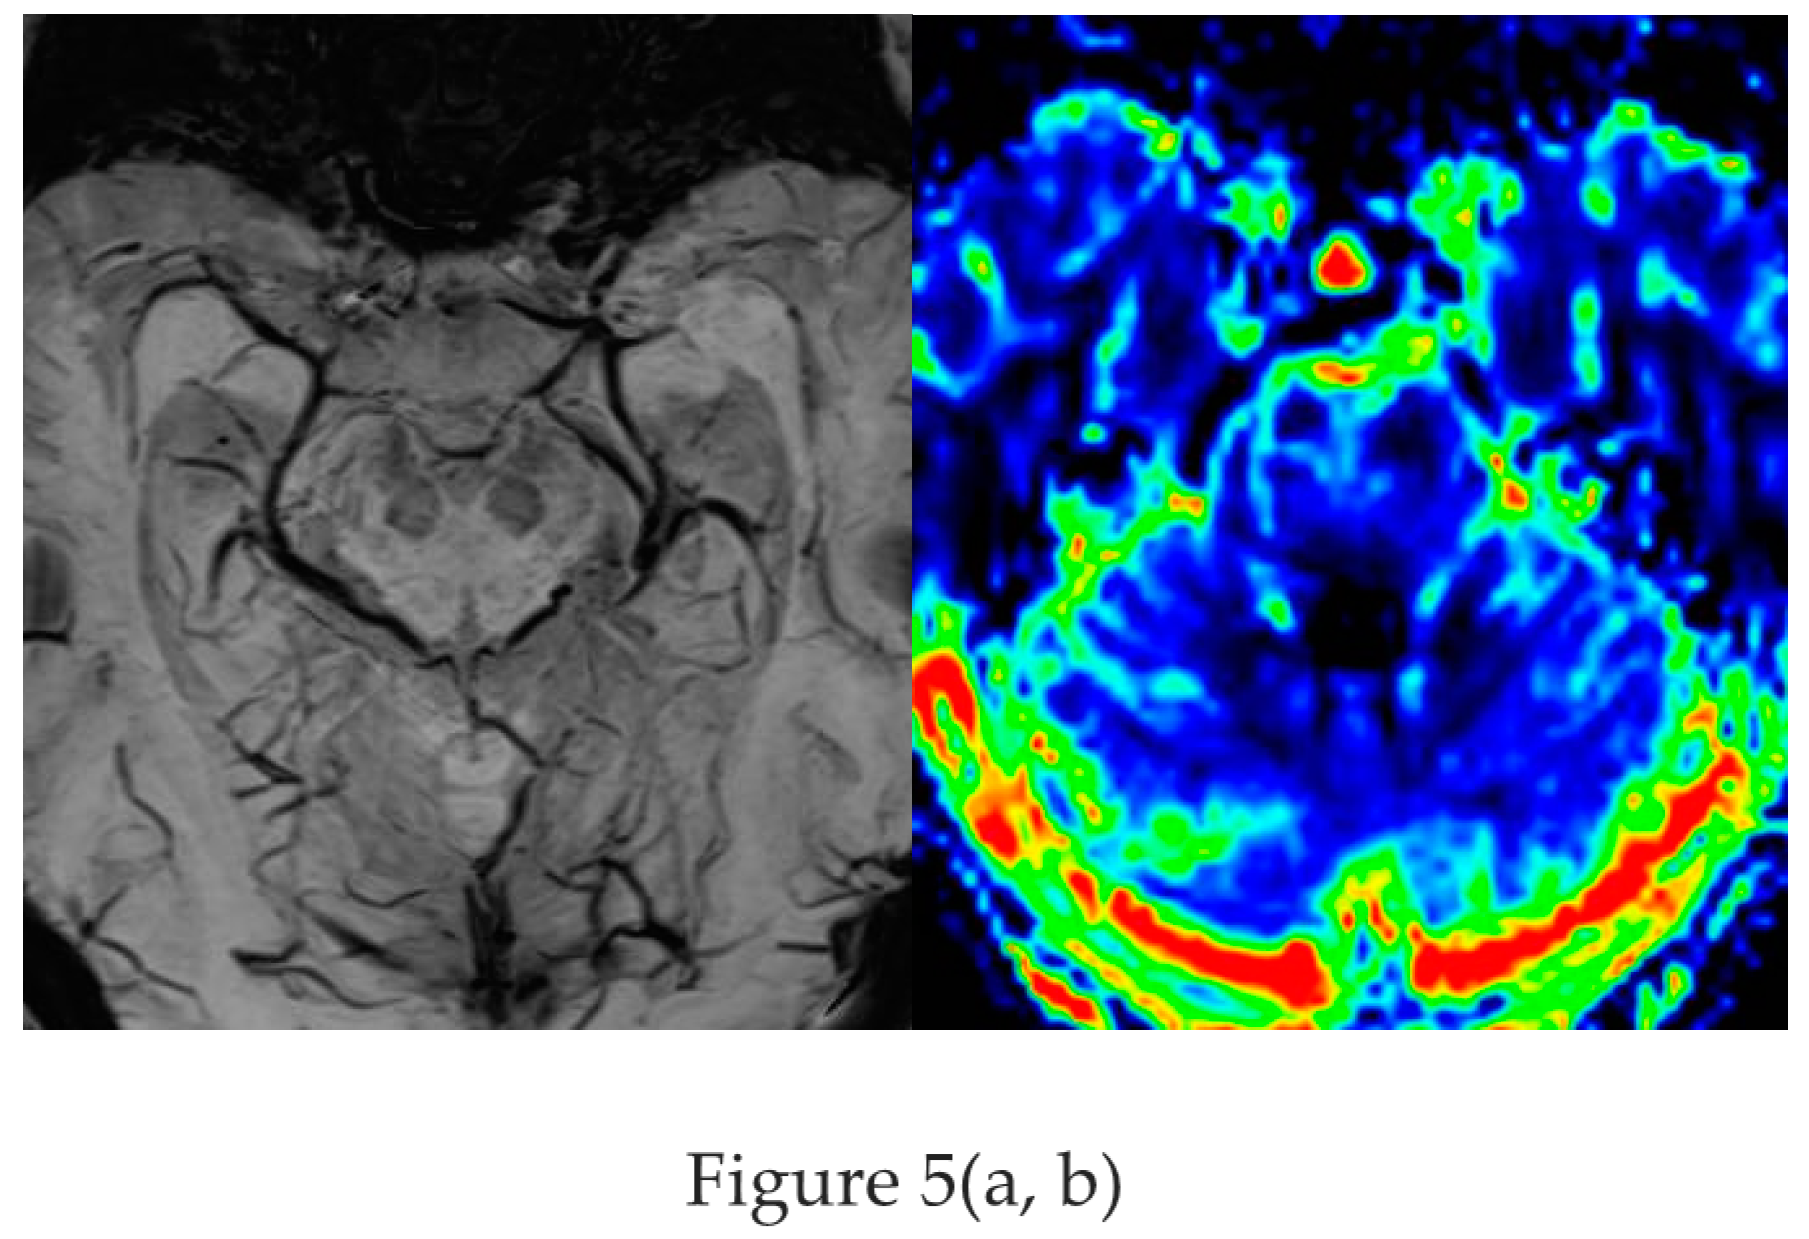
Based on the SWI sequence additional information was obtained in 13/59 (22%) of patients assessed by 1.5T MR [ Ranji-Burachaloo et al 2019]. A less recognized feature of the SWI sequence is the paramagnetic effect of deoxyhemoglobin as a surrogate marker of vessel calibre. Pseudonarrowing of vessels may serve as a sign of regional hyperperfusion (Figure 5) and thus indicate nonconvulsive status epilepticus .[ Aellen et al. 2014, Mariajoseph et al 2021 ]
Figure 5.
a,b : Nonconvulsive absence status with left sided pseudonarrowing of basal vein (arrow in a ) and hippocampal veins (arrowhead) visible on the opposite side and mesiotemporal hyperperfusion (CBF) indicated by left light green mesiotemporal hypervascularity (arrow in b) [figures are authors own work].
Ictal and postictal cytotoxic edema within gray matter of the cortex, the hippocampus, or pulvinar thalami is demonstrated as local gray matter swelling and commonly presents with reversible diffusion restriction on DWI.[Mariajoseph et al. 2021] DWI therefore aids to distinguish secondary postictal ischemic changes from primary pathologies such as gliosis, encephalitis and low grade long term epilepsy-associated brain tumors (LEAT).
Cortical epileptogenic lesions are often subtle. Sequences that enhance gray -white matter contrast such as the MP2RAGE sequence (see Figure 3b,c) – instead of the classical MPRAGE sequence- and the double inversion recovery sequence have contributed to improved detection of the recently defined mild malformations of cortical development, of FCD and intracortical low grade gliomas .[Wang et al.2020 ]
While sequence improvements have been directed to an increase of contrast between gray and white matter, the novel 3D edge-enhancing gradient echo (3D-EDGE) sequence [Middlebrooks et al. 2020] improves visualization of the gray-white boundary. Comparative higher contrast between the lesion and white matter of 98% to the gold standard FLAIR- (19%) and the MP2RAGE sequence (17%) is particularly promising to facilitate visual recognition of FCD I and IIa.
4.6. Postprocessing by Morphometric Analysis Improves Focal Lesion Detection Beyond Visual Analysis
While visual analysis alone based on higher signal and spatial resolution increases conspicuity of small pathologies, the combination with postprocessing techniques (normalization, segmentation, subtraction/division from a database of normal controls) and submission to a morphometric analysis program proved particularly beneficial to identify lesions that are beyond immediate visual recognition .[Demerath et al. 2022] The morphometric maps created within the “morphometry analysis program“ encompass the MRI hallmarks of focal cortical dysplasia: abnormal extension of gray into white matter and configuration of deepened sulci, abnormal thickening of the cortical ribbon, and blurring of the gray-white matter junction. These are used to create morphometric “extension“, “thickness“ and junction “maps“. The “combined map” represents the maximum z score of the three maps for each voxel but is still finally verified by visual analysis.
Figure 6.
Morphometric analysis by normalization, segmentation, and subtraction/division from a database of healthy controls results in the calculation of z score maps eg “extension: abnormal gyration /sulcation, location of gray matter (GM), “junction“: blurring of GM-WM border and “thickness“: cortical thickening in a patient with right frontal FCDIIb (see mprage T1, FLAIR z score).
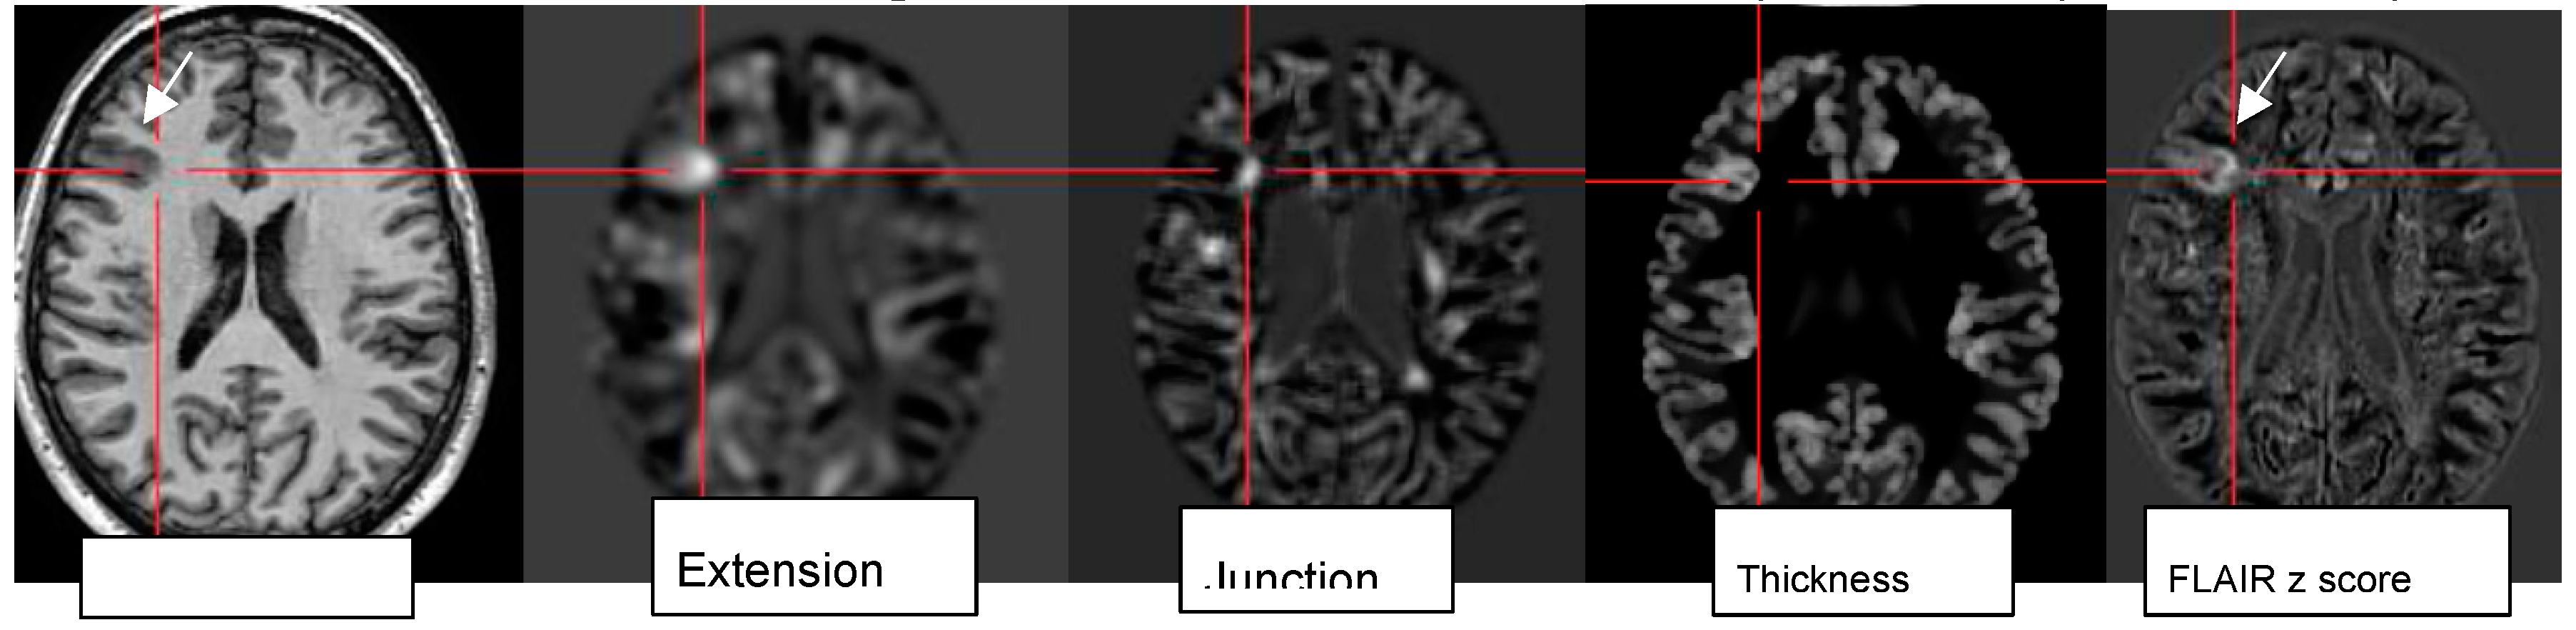
Lack of a lower threshold or cut-off for z-scores requires visual analysis of z score maps to highlight the abnormality individually preferentially on MPRAGE and FLAIR images . [figures are authors own work]
Rapid analysis of a 3D MP2RAGE dataset in conjunction to a side-by-side comparison to FLAIR sequences increases sensitivity and reduces false-positive findings by morphometry. The generation of probability maps for lesions such as FCD in the future will further benefit by integration of artificial neuronal networks .[Urbach et al. 2022]
4.7. Postprocessing by Quantitative Analysis of Signal Intensity, Volumetry Enhances Temporal Lesion Identification
Coronal high resolution T2 weighted sequences and 3D Flair sequences are “standard” constituents of an epilepsy specific protocol to render visible hippocampal sclerosis, FCD type II and areas of gliosis. Data postprocessing by “MRI quantification“ relates to calculation of Flair and T2 signal (relaxometry) of the hippocampus and within lesions within the temporal lobe and the quantification of hippocampus and amygdala, of temporal lobe and extratemporal and thalamus volumes (volumetry) (Figure 7).
Figure 7.
a,b: MR volumetry (a) and T2/FLAIR relaxometry (b) : right hippocampal abnormality histologically verified as hippocampal sclerosis and gliosis as evidenced by mild area decrease of right hippocampus (0.78 cm2 versus 0.90 cm2) and slight FLAIR signal elevation (245 vs 217) . Both findings were suspected visually but verified by postprocessing of volume and signal intensity [figures are authors own work].
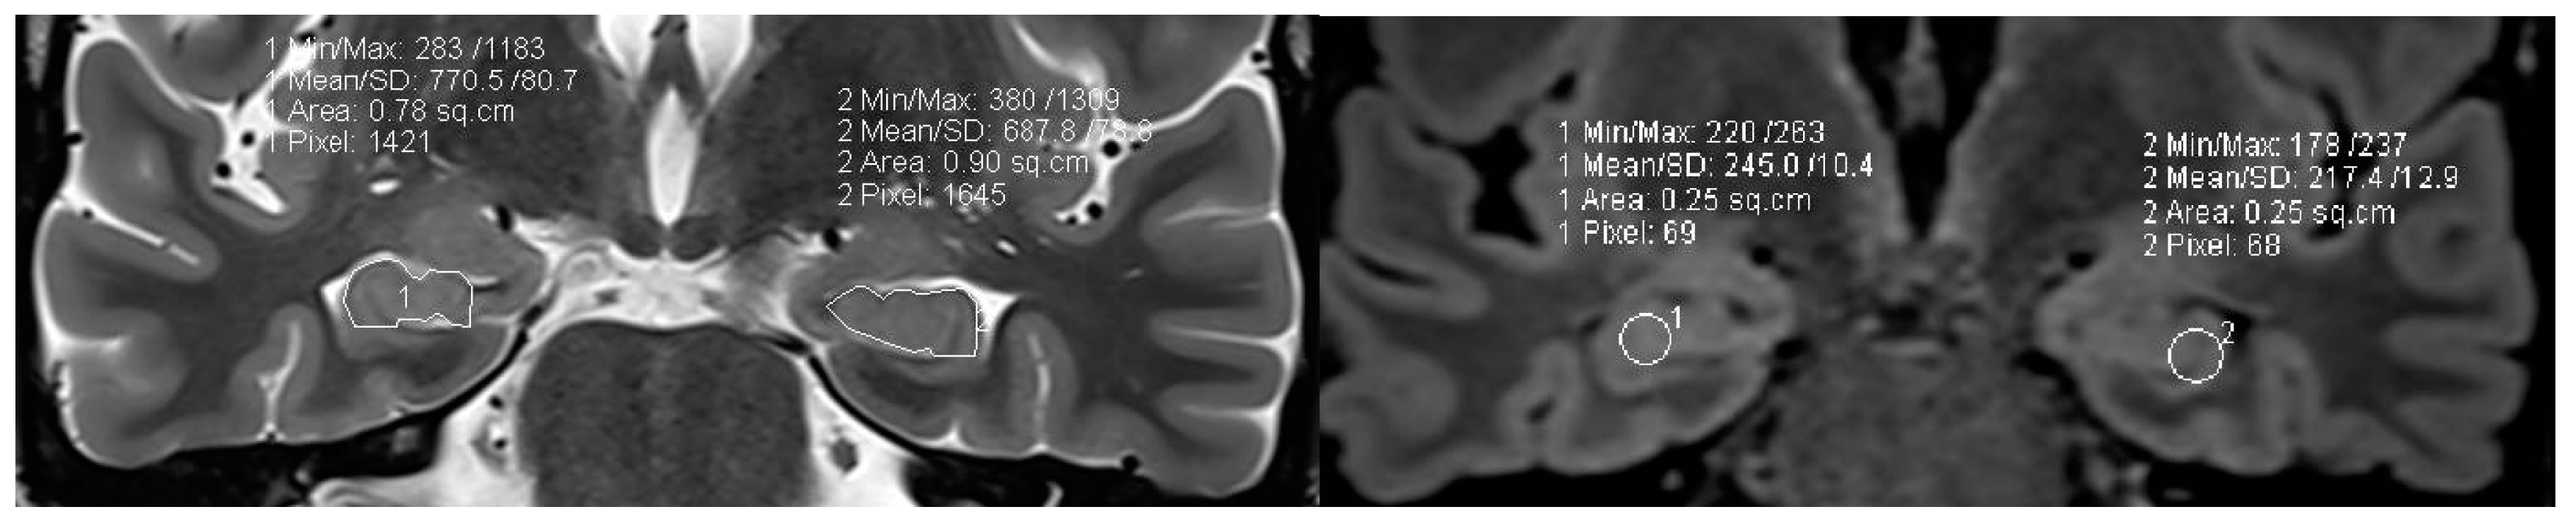
In 78 patients with temporal lobe epilepsy T2 relaxometry identified lesions in an additional 15 patients (19%) with visual normal MRI and volumetry further 10 cases (13%) of hippocampal sclerosis. The combination of T2 relaxometry and volumetry provided the highest yield with recognition of hippocampal sclerosis in 22 (28 %) patients with previous normal interpretations .[Coan et al. 2014] However contrary to hippocampal sclerosis, FCD type I lesions despite postprocessing still have a high association with MR interpretation as “nonlesional” .
4.8. Postprocessing by 3D Surface Rendering Technique to Improve Comprehension of Superficially Located Lesions
3D surface-based reconstruction encompasses postprocessing of cortical lesions and thus provides a visual depiction of the surface pattern of gyri and sulci (Figue 8).
Figure 8.
a,b: 3D surface-based reconstruction of cortical folds in left frontal FCD II depicted by a cortical dimple (arrow) on 3D surface based reconstruction (a). The underlying cause is a left frontal FCD (arrow) in an unsual combination with periventricular nodular heterotopia (arrowhead)(b). [figures are authors own work].
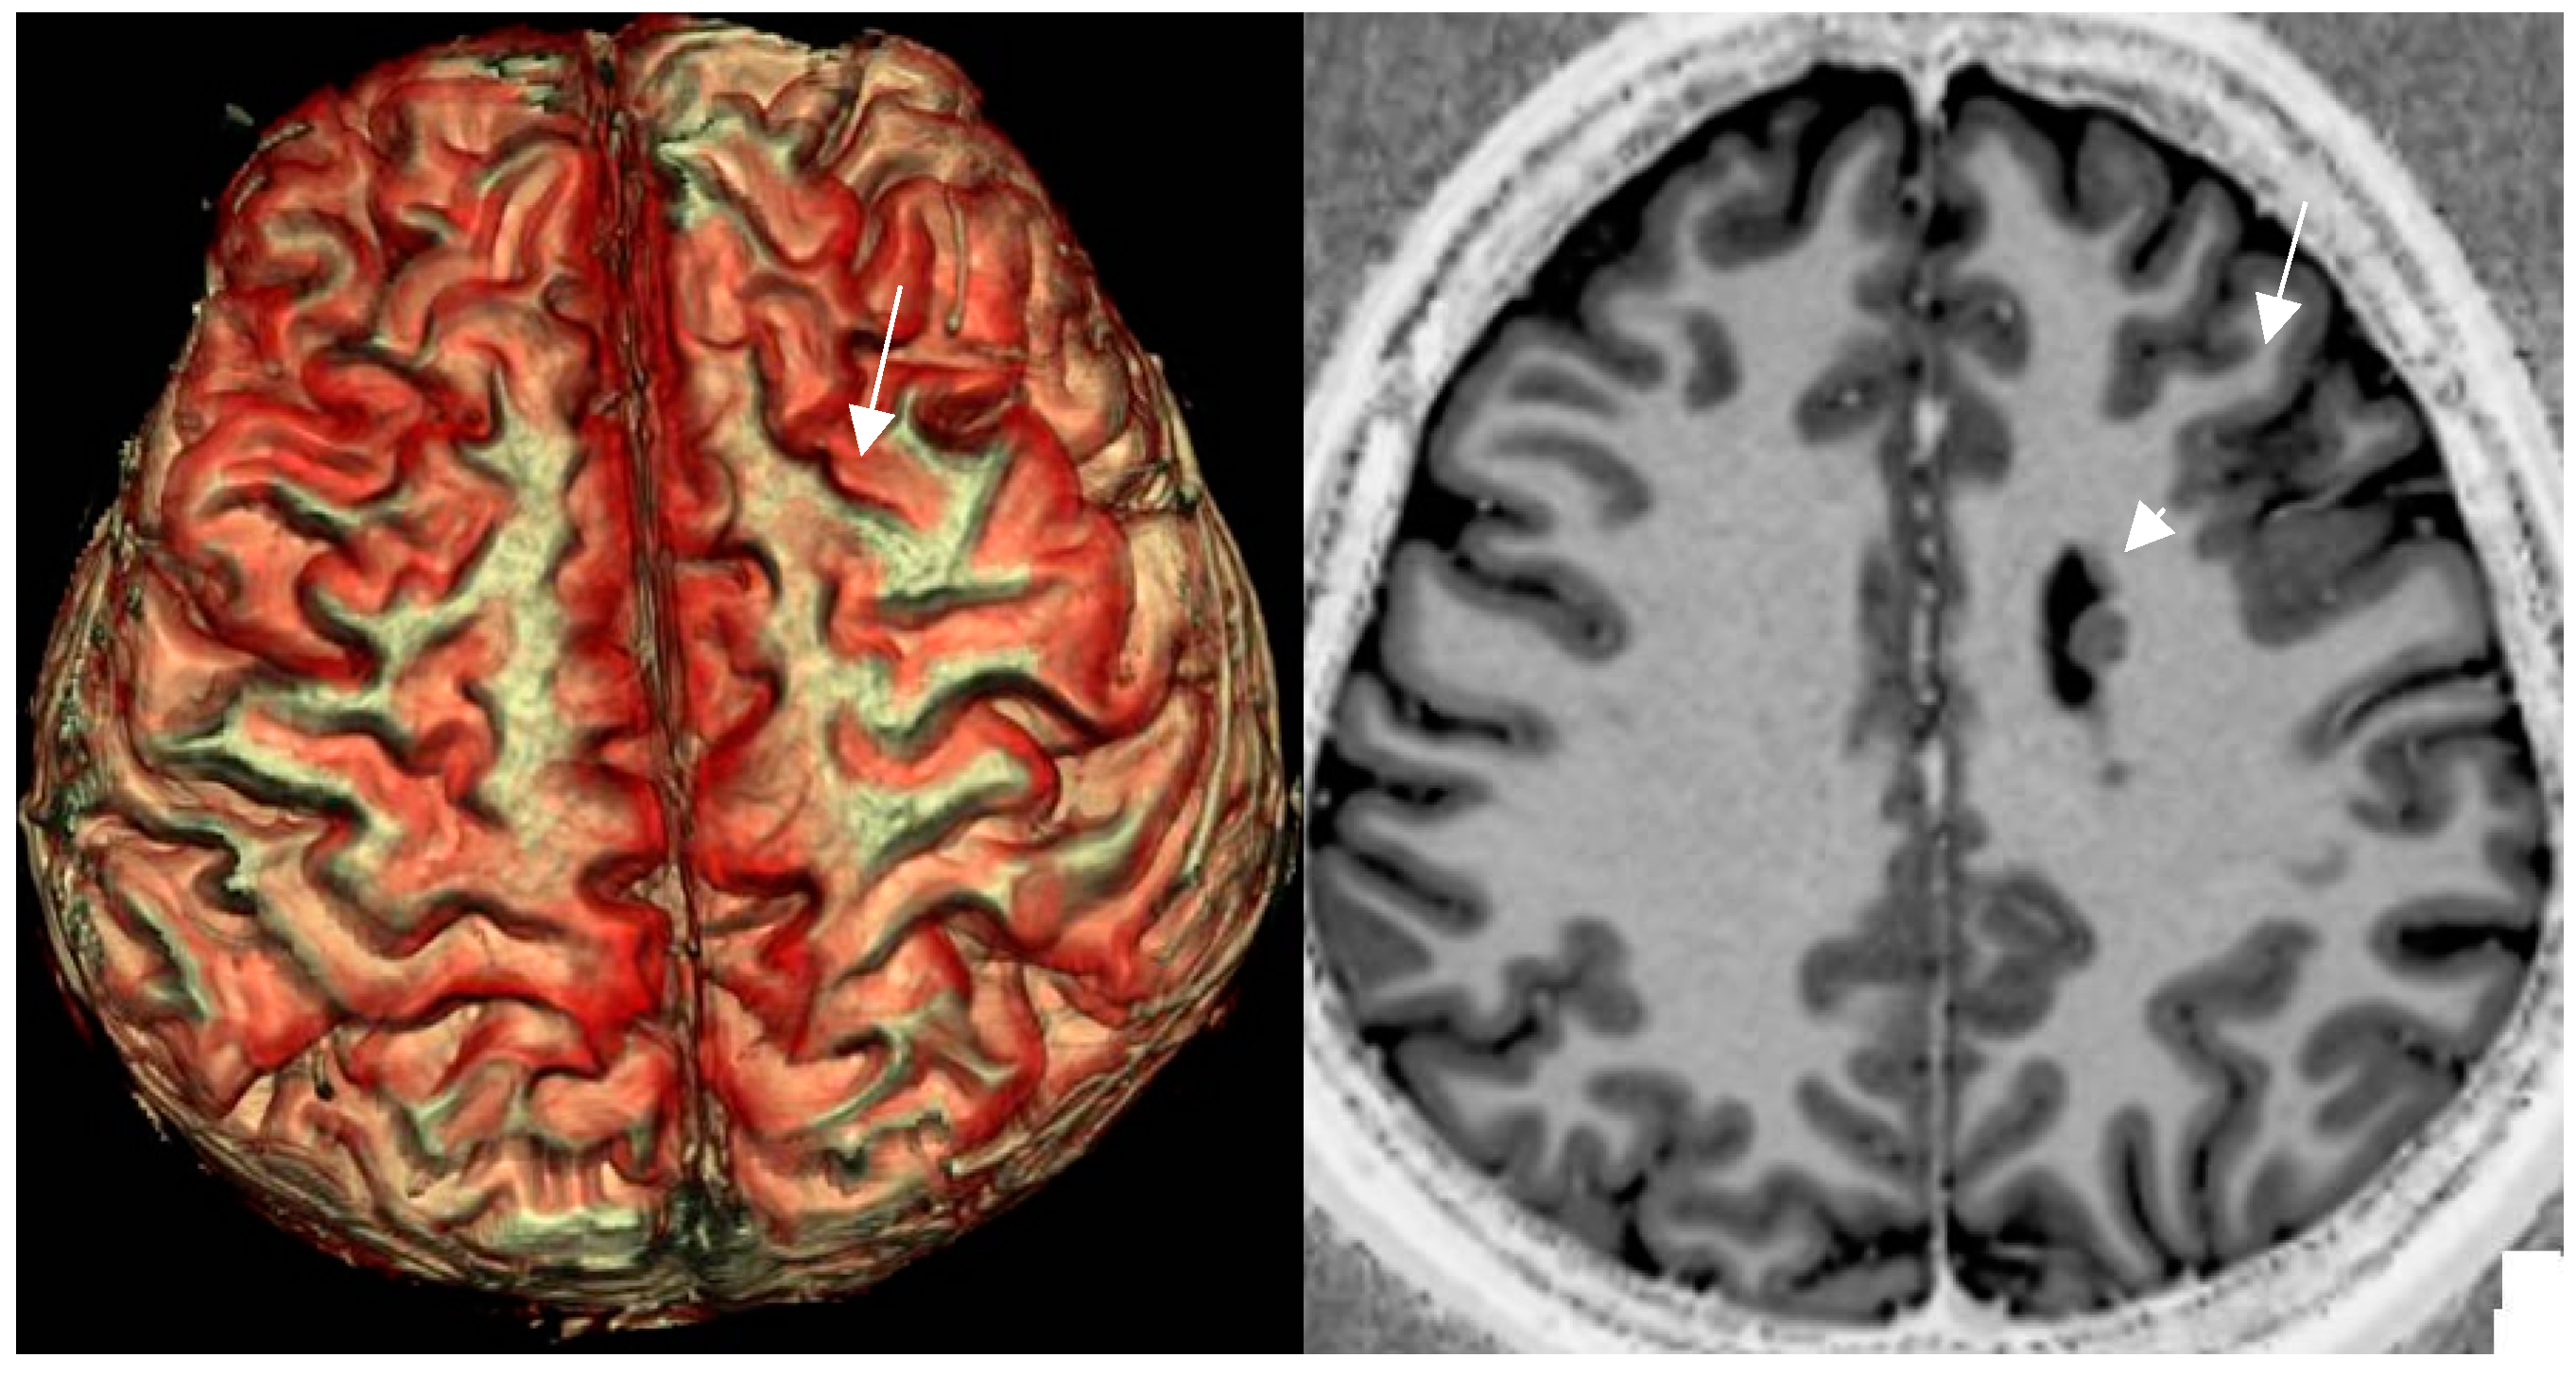
Though meant to improve presurgical comprehension rather than identification, the “power button sign“ shaped cortical configuration enabled additional detection of FCD in 6/13 patients with prior negative MRI (46%) .[Mellerio et al. 2015]
4.9. MR Fingerprinting Exploits Tissue Properties to Reflect “Activity“ of a Lesion
MR Fingerprinting is an evolving technique based on a single scan to cover the entire brain to assess multiple tissue properties by secondarily calculating T1, and T2 values and visualization of tissue structure in “tissue fraction maps”. MR “Fingerprinting“ was able to differentiate active/epileptic nodules from inactive ones in heterotopia and to identify the tubera with highest epileptogenicity in patients with tuberous sclerosis .[Ma et al. 2019]
4.10. MR Perfusion Exploits Blood Flow to Identify Interictal Laterality of a Focus
Accurately localizing the epileptogenic focus preoperatively in a nonlesional MR is the key to surgical success. MRI perfusion enables insights into blood flow and volume in patients with focal seizures. Seizures activity lead to an increase in local perfusion ( Figure 5b). Perfusion MR done with intravenous contrast administration is based on the dynamic susceptibility contrast (DSC) technique or maybe performed without iv Gadolinium contrast administration by “arterial spin labeling (ASL)“. Contrast enhanced DSC MRI is assessed by a gradient echo (GRE)-echo planar imaging (EPI) sequence during the first pass of a bolus dose of Gd (0.2 mmol/kg body weight). A comparative study between DSC and ASL non-contrast perfusion showed interictal cerebral blood flow to be significantly lower in patients with temporal lobe epilepsy by either technique compared to the contralateral (unaffected) side. The correlation coefficients between clinical laterality and perfusion were 0.86 for ASL and 0.83 for DSC technique .[Oner et al. 2015]
PET- MR is a hybrid technique that was used to interrogate perfusion by ASL MR technique and glucose metabolism (PET) in 20 patients with MR negative refractory focal epilepsy .[Galazzo et al. 2016] Concordance of ASL and 18F-FDG PET were excellent for lateralisation and good for localization of the epileptogenic focus.
4.11. Contrast Administration Is of Limited Gain with Respect to Lesion Detection But May Contribute to Characterization of an Abnormality
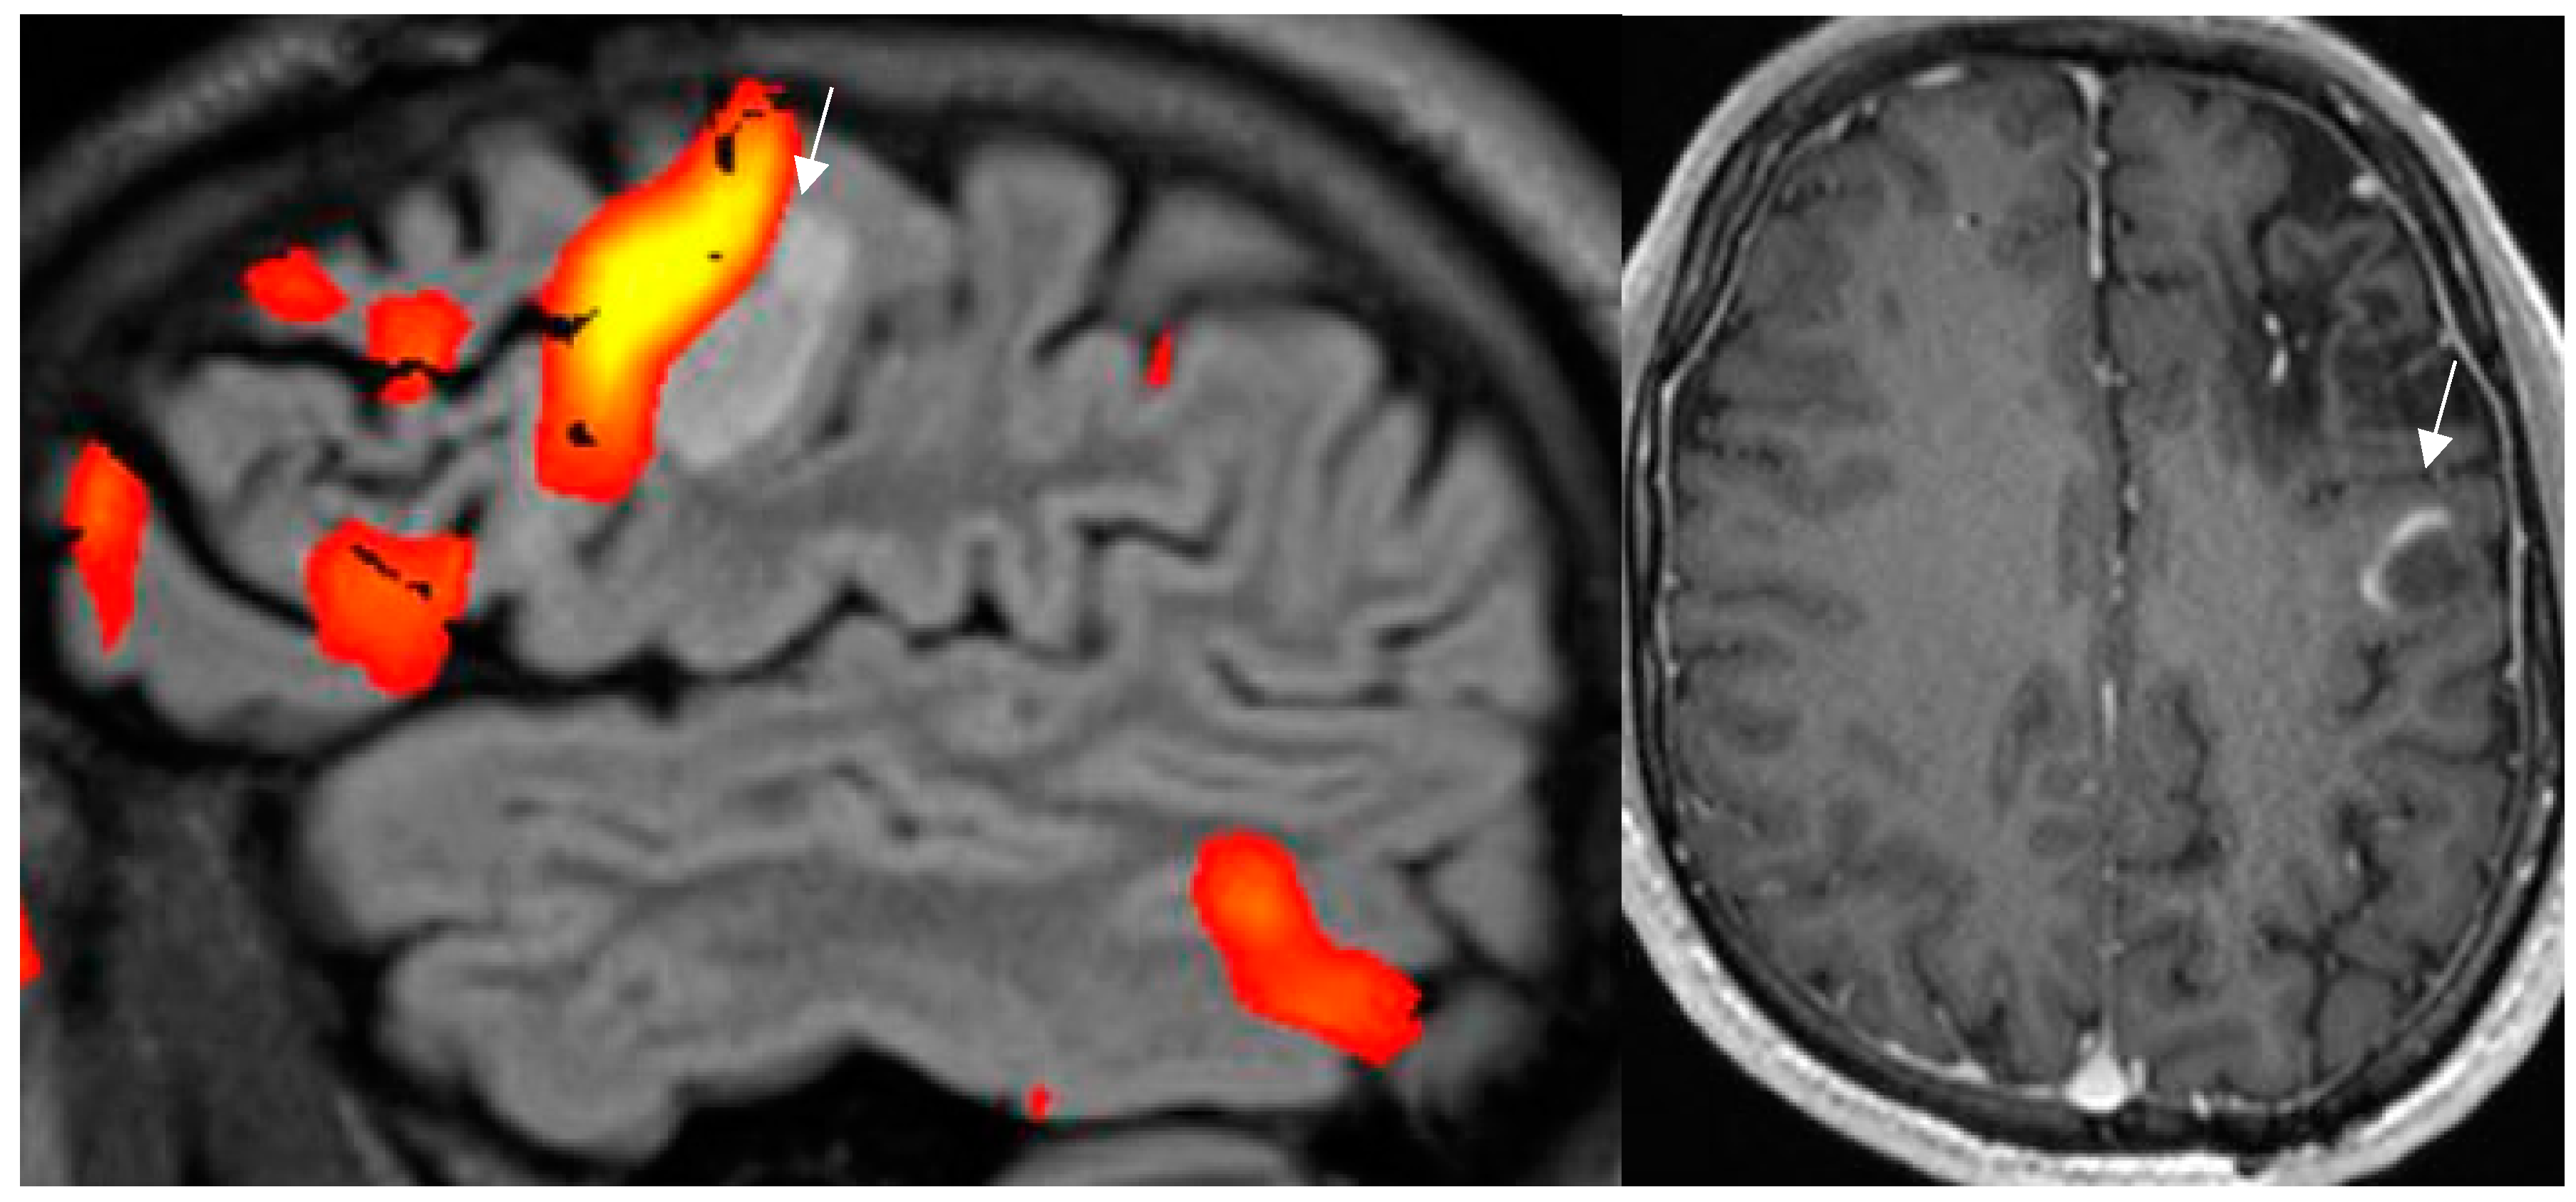
Intravenous administration of Gd based contrast agents in patients with epilepsy provides a low additional yield. In a study of 150 patients with focal epilepsy contrast uptake was present in 33 out of 69 patients (47.8%) . [Elster and W Mirza 1991] In fact, contrast enhancement revealed 2 additional lesions only (6.0%), that had passed unrecognized on nonenhanced sequences. The presence of contrast enhancement allowed to characterize lesions to better advantage and altered the diagnosis in 17 of 69 patients (24.6%). In patients who harbor a longterm epilepsy associated tumours (LEAT) or patients with increased frequency of seizures contrast administration may indicate a conversion of dignity of a preexisting lesion or the existence of a new abnormality (Figure 9 )
Figure 9.
a, b: “active “ tuber in a patient with known tuberous sclerosis following resection of a giant cell astrocytoma via a left frontal approach. New right focal motor seizures and transient speech arrest lead to functional MRI(a): left speech dominance and precentral hand activation during motor task. New contrast uptake is present on the axial mprage Gd enhanced sequence in the periphery of a left precentral tuber.(b)figures are authors own work].
In a recent study on the utility of iv Gd administration in MRI performed for the evaluation of acute onset pediatric seizures only 5% of cases retrospectively necessitated the use of contrast agent .[Andrijaukis et al. 2023] Sixty nine 69% of these lesions were classified as neoplastic, 31% had an immune/ infectious etiology. The authors esteem the use of intravenous Gd administration of “limited additive benefit“ in most cases.
The expert panel on neurological imaging .[Lee RK et al. 2020] in the “ACR Appropriateness Criteria® Seizures and Epilepsy“ recommends “MRI head without and with IV contrast or MRI head without IV contrast“ as being an appropriate and equivalent presurgical imaging approach for patients with known epilepsy.
4.12. New Entities: Knowledge Shapes Perception
Advances in MR imaging technique, postprocessing and the growing expertise of readers have reduced the number of normal MR examinations in patients with epilepsy. However, as “we see what we know“ learning and identification of previously unknown or “unrecognized“ pathologies play an important role in imaging interpretation.
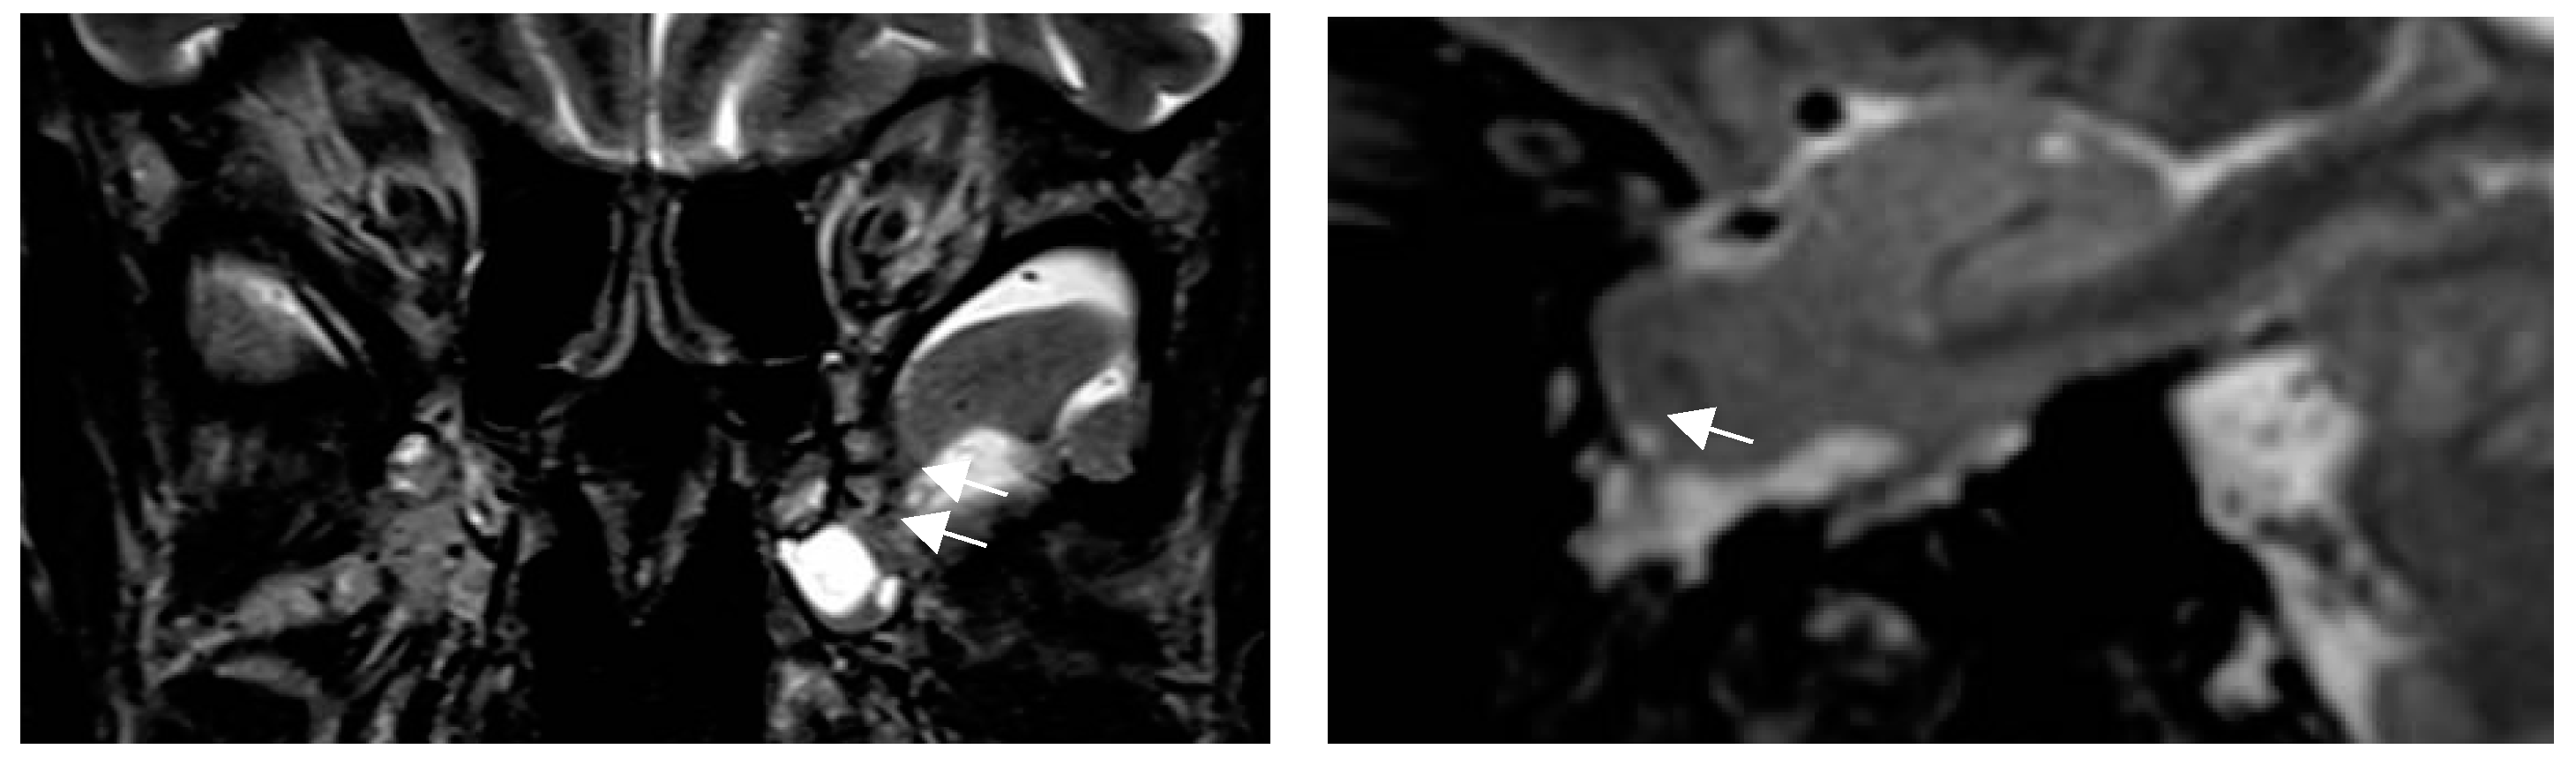
Anterior temporal encephaloceles are such lesions defined as brain herniation through small – commonly antero-inferior- middle cranial fossa skull base defects in patients with temporal lobe epilepsy. These encephaloceles are recognized by scrutinizing the cortex of the anterior temporal lobe on coronal T2/Flair MR sequences. When identified and resected , anterior temporal encephaloceles had an excellent postsurgical outcome defined as ILAE Class 1 or 2 achieved in 85% of 20 patients.[Samudra et al. 2022] The majority of these encephaloceles (20/37, 54%) however had passed unrecognized on initial image interpretation even by experienced readers (Figure 10 ).
Figure 10.
a,b: Temporal meningoencephalocele depicted by herniation of the left temporal pole into a small anterior skull base defect with resultant CSF entrapment below the middle cranial fossa floor (coronal T2 w image 1.7mm). A thin stalk of gliotic tissue connects to the left temporal pole (arrow in sag FLAIR 0.9mm).[figures are authors own work. ].
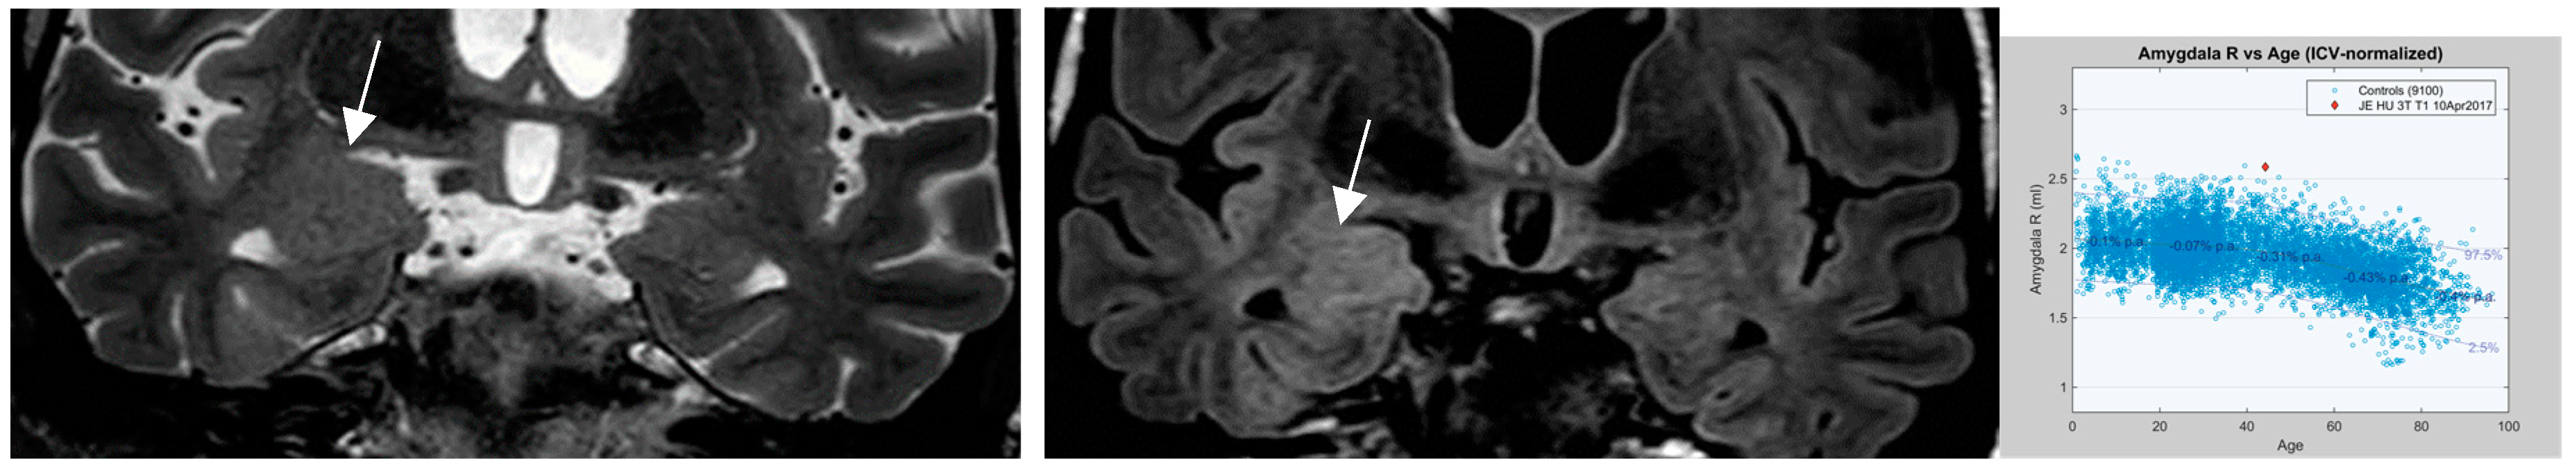
An additional entity that has increasingly attracted attention is nontumoral “amygdala enlargement” (Figure 11) . Amygdala enlargement has been reported in 12% of patients with mesial temporal lobe epilepsy (MTLE) detected by volumetry and T2 relaxometry in patients without visible MRI abnormalities .[Coan et al. 2013] The etiology may be heterogenous: secondary and reversible on MR in patients with adequate antiseizure medications (ASM) response but may be termed “primary” based on amygdala dysplasia in those patients with MR irreversible amygdala enlargement.
Figure 11.
a-c.: nontumoural “amygdala enlargement on coronal T2 (1.7mm and FLAIR sequence (0.9mm) with signal elevation on FLAIR (arrow in b), volume increase visually and markedly beyond 2nd standard deviation on volumetry c.[figures are authors own work. ].
Figure 11.
a-c.: nontumoural “amygdala enlargement on coronal T2 (1.7mm and FLAIR sequence (0.9mm) with signal elevation on FLAIR (arrow in b), volume increase visually and markedly beyond 2nd standard deviation on volumetry c.[figures are authors own work. ].
A continuing deficit in MR imaging identification of subtle lesions holds true for focal cortical dysplasia despite well-established MR criteria. Patients who harbor an electro-clinically identified focus are a promising group for re-evaluation of MRI. Adding a hypothesis on focus localization was a simple means to increase visual detection of focal cortical dysplasias from 22.7% to 36.4% .[Wehner et al. 2021]
Recent histopathologic developments as well as the results of molecular and genetic testing play an increasing role in the assessment of FCD particularly type II. It is essential therefore to follow these new observations and translate histologic and molecular testing results into imaging interpretation as indicated in the “4 level“ approach mentioned early on.
New molecular-genetic observations comprise mTOR pathway activation that defines FCD type II, hemimegalencephaly and tubera of tuberous sclerosis as a continuum of a shared genetic variant. SLC35A2 somatic mutations have recently been identified in “mild malformations of cortical development with oligodendroglial hyperplasia in epilepsy“ (MOGHE).[Barba et al. 2023]
Postsurgical review of brain MR in 12 patients with MOGHE disclosed findings similar to FCDIIa [Mendes-Coelho et al. 2021 ] such as focal mild cortical thickening in predominantly frontal 50%, temporal and multilobar 25% locations, gray-white matter junction blurring on T2/Flair sequences and a depression of the cortical gyrus with resultant widening of sulcus (cortical dimple) on 3D surface reconstructions.
Differentiating lesions that are sequela of a seizure or seizure status rather than causative maybe a challenge. A systematic review of 11 publications by Mariajoseph and collegues [ Mariajoseph et al. 2021 ] lists cortico-subcortical T2/Flair signal changes commonly with diffusion restriction, adjacent leptomenigeal Gd enhancement, involvement of hippocampus and splenium of corpus callosum by bright T2/Flair signal as the most frequent observations. Lesions tend to regress within a variable time interval as early as 5 days but may display prolonged resolution following status epilepticus .[Cianfoni et al. 2013]
Contrary to the bright T2/Flair signal mentioned above, low T2 white matter signal changes , the so-called “Dark White Matter“ sign has gained little attention in the context of epilepsy. In a systematic review on low T2/Flair white matter signal this sign was found to be indicative of nonketotic hyperosmolar hyperglycemia in 51.4% of patients with seizures .[ Magro et al. 2024] The dark white matter sign is commonly reversible when related to seizures but is not specific for epilepsy. This sign was also encountered in patients suffering from encephalitis, Moya Moya disease or subdural hematoma.
5. Conclusion
In a patient with a clinical diagnosis of epilepsy, but a normal EEG, there are a number of options to improve the yield of the next EEG study (Table 1). The next EEG recording should ideally include measures known to activate IEDs or optimized IED capture, including sleep deprivation, recording of sleep, prolonged EEG duration, prolonged hyperventilation to 5 minutes, optimized photic stimulation, addition of inferior temporal electrode chain. If JME is suspected the next EEG should be a morning EEG, with most of the recording after arousal from sleep. If reflex precipitation is reported, there should be an attempt to replicate the precipitating stimulus during the recording. If the patient is having recurrent seizure events with cyclical pattern, the next recording can be scheduled to coincide with the expected timing of events, and if not feasible, it should be arranged as soon as possible after the event, preferably within 16 hours.

| Measure | Comment |
|---|---|
| Repeat routine EEG |
|
| Longer EEG recording |
|
| Include sleep |
|
| Sleep deprivation |
|
| Optimize timing of EEG |
|
| Extra electrodes |
|
| Optimize hyperventilation |
|
| Optimize photic stimulation |
|
| Include reflex seizure precipitants during EEG |
|
Regarding neuroimaging, a nonlesional MR examination is a considerable obstacle for patients with epilepsy to gain a satisfactory postsurgical result (ILAE 1-2 ). Morphological MRI performed by an epilepsy specific protocol and interpreted by an expert reader is the mainstay of structural assessment of patients with focal epilepsy. MRI interpretation is best accomplished on a 3T magnet with a 32 to 64 channel receive head coil with knowledge of semiology, a focus hypothesis and EEG findings.
The core HARNESS protocol is recommended to be supplemented by diffusion weighted imaging, susceptibility weighted and MP2RAGE sequences (Table 2) to distinguish primary from secondary seizure induced pathologies, identify abnormalities related to iron deposition and calcification and to provide high resolution depiction of the cortex, subcortical and periventricular white matter. Quantitative MR assessment based on T2 and Flair signal intensity, volumetry and morphometric postprocessing of cortical thickness, extension of gyri and junction with adjacent white matter, increase detection of subtle malformations of cortical development, migration disorders and recognition of dual pathology.
Table 2.
Updated extended HARNESS Epilepsy specific protocol.[Table 2 is authors own work].
Table 2.
Updated extended HARNESS Epilepsy specific protocol.[Table 2 is authors own work].
| A : core sequences | B: additional sequences with evidence of gain |
| isotropic sagittal ≤ 1mm 3D T1 sequ. eg MPRAGE | isotropic sagittal ≤ 1mm 3D T1 IR sequ. eg MP2RAGE (may replace MPRAGE) |
| isotropic sagittal ≤ 1mm 3D FLAIR sequ. no interslice gap | axial hemosiderin sensitive susceptability weighted sequ. SWI displayed as MIP |
| high resolution (eg, 0.4 × 0.4 × < 2 mm) coronal 2D T2 images | diffusion weighted sequ. 2.5 - 3mm when deemed appropriate by change of semiology/seizure frequency ± MR lesion: |
| isotropic ≤ 1mm 3D T1 MPRAGE Gd enhanced (0.2mmol/KG) |
A stepwise approach by visual assessment of morphologic MR images, supplemented by morphometry and postprocessing, integration of molecular and genetic testing and histology within an interdisciplinary team rather than in “radiologic isolation” provides the highest diagnostic yield and a great chance to escape false designation of an MR examination as “nonlesional”.
Authors’ contributions
All authors contributed similarly to this manuscript.
Funding
This research did not receive any specific grant from funding agencies in the public, commercial, or not-for-profit sectors.
Acknowledgments
This review was presented at the 6th Qatar Virtual International Epilepsy Course, April 25th -27th, 2024 by the authors. We thank Hamad Medical Corporation Medical Education for supporting this event.
Conflicts of Interest
Boulenouar Mesraoua: Grant from Qatar National Research Fund (QNRF) and Hamad Medical Corporation Internal grant; Bassel Abou-khalil: Bassel Abou-Khalil: grants for research trials from Cerevel, Otsuka, SK Life Science, Inc., UCB Pharma, Xenon, Neuroelectrics, paid to Vanderbilt University Medical Center; Ali A. Asadi-Pooya: Honoraria from Cobel Daruo, Tekaje, Sanofi, Actoverco, and RaymandRad; Royalty: Oxford University Press (Book publication); Grant from the National Institute for Medical Research Development; Others :none.
References
- Abou-Khalil B, Spalice A, T. M. Maximizing EEG methodology in Photosensitivity: do’s and don’ts. In: Kasteleijn-Nolst Trenité D, editor. The importance of photosensitivity for Epilepsy: Springer; 2021. p. 349-59.
- Aellen J, Abela, E, Buerki SE, Kottke R, Springer E, Schindler K, Weisstanner C, El-Koussy M, Schroth G, Wiest R, Verma RK. Focal hemodynamic patterns of status epilepticus detected by susceptibility weighted imaging (SWI). Eur Radiol 2014 24:2980–2988. [CrossRef]
- Agarwal A, Bathla G, Soni N, Desai A, Middlebrooks E, Patel V, Gupta V, Vibhuteet P. Updates from the International League Against Epilepsy Classification of Epilepsy (2017) and Focal Cortical Dysplasias (2022): Imaging Phenotype and Genetic Characterization. [CrossRef]
- Aguglia U, Gambardella A, Le Piane E, De Sarro GB, Zappia M, Quattrone A. Chlorpromazine versus sleep deprivation in activation of EEG in adult-onset partial epilepsy. J Neurol 1994;241(10):605-10. [CrossRef]
- Ahmed R, Rubinger L, Cristina Go, Drake JM, Rutka JT, Snead OC, Widjaja E. Utility of additional dedicated high-resolution 3T MRI in children with medically refractory focal epilepsy. Epilepsy research 2018; 143:113-119. [CrossRef]
- Andrijauskis D, Woolf G, Kuehne A, Al-Dasuqi K, Silva CT, Payabvash S, Malhotra A. AJNR Am J Neuroradiol, 2023; 44 : 1208-1211. [CrossRef]
- Ashrafi MR, Mohebbi H, Mohamadi M, Azizi E, Zamani GR, Tavasoli A, et al. Clonidine Versus Chlo- ral Hydrate for Recording Sleep EEG in Children. Iran J Child Neurol 2020;14(1):85-92.
- Bach Justesen A, Eskelund Johansen AB, Martinussen NI, Wasserman D, Terney D, Meritam P, et al. Added clinical value of the inferior temporal EEG electrode chain. Clin Neurophysiol 2018;129(1):291-5. [CrossRef]
- Baldin E, Hauser WA, Buchhalter JR, Hesdorffer DC, Ottman R. Yield of epileptiform electroencepha- logram abnormalities in incident unprovoked seizures: a population-based study. Epilepsia 2014;55(9):1389-98. [CrossRef]
- Baldin E, Hauser WA, Buchhalter JR, Hesdorffer DC, Ottman R. Utility of EEG Activation Procedures in Epilepsy: A Population-Based Study. J Clin Neurophysiol 2017;34(6):512-9.
- Barba C, Blümcke I, Winawer MR et al. Clinical Features, Neuropathology, and Surgical Outcome in Patients With Refractory Epilepsy and Brain Somatic Variants in the SLC35A2 Gene. Neurology 2023;100 100 (5) e528-e542.
- Bartolini E, Cosottini M, Costagli M, Barba, L, Tassi R, Spreafico R, Garbelli L, Biagi A, Buccoliero F, Guerrini GR. Ultra-high-field targeted imaging of focal cortical dysplasia: the intracortical black line sign in type IIb. AJNR Am J Neuroradiol 2019;40:2137–42. [CrossRef]
- Beniczky S, Guaranha MS, Conradsen I, Singh MB, Rutar V, Lorber B, et al. Modulation of epileptiform EEG discharges in juvenile myoclonic epilepsy: an investigation of reflex epileptic traits. Epilepsia 2012;53(5):832-9. [CrossRef]
- Bernasconi A, Cendes F, Theodore WH, Gill RS, Koepp MJ, Hogan RE, Jackson GD, Federico P, Labate A, Vaudano AE Blümcke I, Ryvlin P, Bernasconi N.Recommendations for the use of structural magnetic resonance imaging in the care of patients with epilepsy: A consensus report from the International League Against Epilepsy Neuroimaging Task Force. Epilepsia 2019;60:1266-1272. [CrossRef]
- Bulus E, Abanoz Y, Gulen Abanoz Y, Yeni SN. The Effect of Cognitive Tasks During Electroenceph- alography Recording in Patients With Reflex Seizures. Clin EEG Neurosci 2022;53(1):54-60.
- Burkholder DB, Britton JW, Rajasekaran V, Fabris RR, Cherian PJ, Kelly-Williams KM, et al. Routine vs extended outpatient EEG for the detection of interictal epileptiform discharges. Neurology 2016;86(16):1524-30. [CrossRef]
- Cianfoni A . Caulo M , Cerase A et al. Seizure-induced brain lesions: A wide spectrum of variably reversible MRI abnormalities. Eur J Radiol 2013,11: 1964-1972.
- Coan AC Morita ME, de Campos DM, Yassuda CL, Cendes F. Amygdala enlargement in patients with mesial temporal lobe epilepsy without hippocampal sclerosis. Front Neurol. 2013;4:166-170.
- Coan AC, Kubota B, Bergo FPG, Campos BM, Cende F. 3T MRI Quantification of Hippocampal Volume and Signal in Mesial Temporal Lobe Epilepsy Improves Detection of Hippocampal Sclerosis AJNR 2014; 35:77–88.
- Craciun L, Varga ET, Mindruta I, Meritam P, Horvath Z, Terney D, et al. Diagnostic yield of five minutes compared to three minutes hyperventilation during electroencephalography. Seizure 2015;30:90-2. [CrossRef]
- Czarnetzki C, Spinelli, L, Huppertz HJ , Schaller K, Momjian S, Lobrinus J, Vargas MI, garibotto V, Vulliemoz S, Seeck M Yield of non-invasive imaging in MRI-negative focal epilepsy. J Neurol 2024; 271: 995–100. [CrossRef]
- Delil S, Senel GB, Demiray DY, Yeni N. The role of sleep electroencephalography in patients with new onset epilepsy. Seizure 2015;31:80-3. [CrossRef]
- Demerath Th, Kaller CP, Heers M, Staack A, Schwarzwald R, Kober T, Reisert M, Schulze-Bonhage A, Huppertz HJ, Urbach H. Fully automated detection of focal cortical dysplasia: Comparison of MPRAGE and MP2RAGE sequences. Epilepsia 2022; 63: , 1-258, 1-e34. [CrossRef]
- Dhamija K, Chaudhry N, Puri V. Modulation of epileptiform EEG discharges in patients with JME.
- Doppelbauer A, Zeitlhofer J, Zifko U, Baumgartner C, Mayr N, Deecke L. Occurrence of epileptiform activity in the routine EEG of epileptic patients. Acta Neurol Scand 1993;87(5):345-52. [CrossRef]
- Faulkner HJ, Arima H, Mohamed A. Latency to first interictal epileptiform discharge in epilepsy with outpatient ambulatory EEG. Clin Neurophysiol 2012;123(9):1732-5. [CrossRef]
- Fong CY,Tay CG,Ong LC,Lai NM.Chloral hydrate as sedating agent for neurodiagnostic procedure in children.Cochrane database Syst Rev 2017;11(11):CD011786.
- Fountain NB, Kim JS, Lee SI. Sleep deprivation activates epileptiform discharges independent of the activating effects of sleep. J Clin Neurophysiol 1998;15(1):69-75. [CrossRef]
- Galazzo IB, Mattoli MV, Pizzini FB, De Vita E, Barnes A, Duncan JS, Jäger HR, Golay X,Bomanji JB, Koepp M, Groves AM, Fraioli F. Cerebral metabolism and perfusion in MR-negative individuals with refractory focal epilepsy assessed by simultaneous acquisition of 18F-FDG PET and arterial spin labeling. NeuroImage Clinical, 2016; 11: 648-657. [CrossRef]
- Haddad N, Melikyan G, Alarcon G, Shaheen Y, Siddiqi M, Ali E, et al. 24-Hour video EEG in the evaluation of the first unprovoked seizure.Clin Neurophysiol Pract 2021;6:123-8. [CrossRef]
- Hainc N, McAndrews MP, Valiante T. Andrade DM, Wennberg R, Krings T.Imaging in medically refractory epilepsy at 3 Tesla: a 13-year tertiary adult epilepsy center experience. Insights into Imaging (2022)13:9. [CrossRef]
- Hwan Yim S, Ho Cho K, Ho Choi Y, Ihn Kim H, Cho YJ, Heo K. Nasopharyngeal electrodes in temporal lobe epilepsy: A reappraisal of their diagnostic utility. Clin Neurophysiol 2021;132(7):1741-51.
- Kaleyias J, Kothare SV, Pelkey M, Harrison G, Legido A, Khurana DS. Achieving sleep state during EEG in children :sequences of activating procedures .Clin Neurophysiol 2006;117(7):1582-4.
- Kasteleijn-Nolst Trenite D, Rubboli G, Hirsch E, Martins da Silva A, Seri S, Wilkins A, et al. Methodology of photic stimulation revisited : updated European algorithm for visual stimulation in the EEG laboratory. Epilepsia 2012;53 (1):16-24.
- Kirchberger K, Schmitt H, Hummel C, Peinemann A, Pauli E, Kettenmann B, Stefan H. Clonidine- and methohexital-induced epileptiform discharges detected by magnetoencephalography (MEG) in patients with localization-related epilepsies. Epilepsia 1998;39(10):1104-12. [CrossRef]
- Kishk NA Shamloul R, Moawad MK et al. Cost-effectiveness of HARNESS-MRI protocol in focal drug-resistant epilepsy in a limited-resources course- an Egyptian study. Clinical Neurology and Neurosurgery 2023; 233.
- Labate A, Ambrosio R, Gambardella A, Sturniolo M, Pucci F, Quattrone A. Usefulness of a morning routine EEG recording in patients with juvenile myoclonic epilepsy. Epilepsy Res 2007;77(1):17-21. [CrossRef]
- Leach JP, Stephen LJ, Salveta C, Brodie MJ. Which electroencephalography (EEG) for epilepsy? The relative usefulness of different EEG protocols in patients with possible epilepsy. J Neurol Neurosurg Psychiatry 2006;77(9):1040-2.
- Lee RK, Burns J, Ajam AA, Broder JS, Chakraborty S, Chong ST, Kendi AT, Ledbetter NL, Liebeskind DS, Pannell JS, Pollock JM, Rosenow JM, Shaines MD, Shih RY, Slavin K, Utukuri PS, Corey AS.Expert Panel on Neurological Imaging . ACR Appropriateness Criteria® Seizures and Epilepsy. Journal of the American College of Radiology, 2020 suppl. 17: S293-304. [CrossRef]
- Llaurado A, Santamarina E, Fonseca E, Olive M, Requena M, Sueiras M, et al. How soon should ur- gent EEG be performed following a first epileptic seizure? Epilepsy Behav 2020;111:107315.
- Losey TE, Uber-Zak L. Time to first interictal epileptiform discharge in extended recording EEGs. J Clin Neurophysiol 2008;25(6):357-60. [CrossRef]
- Ma D, Jones St E, Deshmane A, Sakaie K, Pierre EY, Larvie M, McGivney D, Blümcke I, Krishnan B, Lowe M, Gulani V, Najm I, Griswold MA, Wang I. Development of high-resolution 3D MR fingerprinting for detection and characterization of epileptic lesions. JMRI 2019; 49 1333-1346. [CrossRef]
- Magro D, Tosto F, Laterza V et al. The Dark side of the White Matter. Diffuse subcortical White matter hypointensity on T2/FLAIR: A systematic review of a frequently underrecognized sign.
- Mariajoseph F, Muthusamy S, Amokutowa S, Seneviratne U. Seizure-induced reversible MRI abnormalities in status epilepticus: A systematic review. Seizure 2021;92:166-173. [CrossRef]
- Matsuoka H, Takahashi T, Sasaki M, Matsumoto K, Yoshida S, Numachi Y, et al. Neuropsychological EEG activation in patients with epilepsy. Brain 2000;123 ( Pt 2):318-30. [CrossRef]
- Matsuoka H, Nakamura M, Ohno T, Shimabukuro J, Suzuki T, Numachi Y, Awata S. The role of cogni- tive-motor function in precipitation and inhibition of epileptic seizures. Epilepsia 2005;46 Suppl 1:17-20.
- Mellerio C,Roca P, Chassoux F, Daniere F, Cachia A, Lion St, Naggara O, devaux B, Meder JF, Oppenheim C. The Power Button Sign: A newly described central sulcal pattern on surface rendering MR Images of type 2 focal cortical dysplasia. Radiology 2015; 274: 500-507. [CrossRef]
- Mendes Coelho VC, Morita-Sherman M, Yasuda CL et al. Magnetic resonance imaging findings and clinical characteristics in mild malformation of cortical development with oligodendroglial hyperplasia and epilepsy in a predominantly adult cohort. Epilepsia 2021; 62 :1429-1441. [CrossRef]
- Middlebrooks EH, Lin C, Westerhold E, Okromelidze L, Vibhute P, Grewal SS, Gupta V. Improved detection of focal cortical dysplasia using a novel 3D imaging sequence: Edge-Enhancing Gradient Echo (3D-EDGE) MRI. NeuroImage: Clinical 2020; 28: 10244. [CrossRef]
- Modur PN, Rigdon B. Diagnostic yield of sequential routine EEG and extended outpatient video-EEG monitoring. Clin Neurophysiol 2008;119(1):190-6. [CrossRef]
- Narayanan JT, Labar DR, Schaul N. Latency to first spike in the EEG of epilepsy patients. Seizure 2008;17(1):34-41. [CrossRef]
- Oner AY, Eryurt B, Ucar M, Capraz I, Kurt G, Bilir E, Tali T. pASL versus DSC perfusion MRI in lateralizing temporal lobe epilepsy. Acta Radiologica. 2015;56:477-481.
- Ontiveros S, Novy J, Jequier-Gygax M, Rossetti AO. Yield of Outpatient Sleep EEG for Epileptiform Alterations' Detection in Children. J Clin Neurophysiol 2016;33(1):72-5.
- Phal PM, Usmanov A, Nesbit GM, Anderson JC, Spencer D, Wang P, Helwig PA, Roberts C, Hamilton BE. Qualitative Comparison of 3-T and 1.5-T MRI in the Evaluation of Epilepsy AJR 2008; 191:890–895.
- Rados M , Mouthaan B, Barsi P, Carmichael D, Heckemann RA, Kelemen A, Kobulashivili T, Kuchukhidze G, Marusic P, Minkin K, Tisdall M, Trinka E, Veersema T, Vos SB, Wagner J, Braun K, van Eijsden P. Diagnostic value of MRI in the presurgical evaluation of patients with epilepsy: influence of field strength and sequence selection: a systematic review and meta-analysis from the E-PILEPSY Consortium. Epileptic Disorders 2022; 24: 323-342.
- Ranji-Burachaloo S, Sarraf P, Rahimian E, Shakiba S, Javadian N, Faraji P, Tafakhor A. The Role of Susceptibility-Weighted Imaging and Dedicated MRI Protocols in the Diagnostic Evaluation of Patients with Drug-Resistant Epilepsy. Arch Neurosci. 2019.
- Roupakiotis SC, Gatzonis SD, Triantafyllou N, Mantouvalos V, Chioni A, Zournas C, Siafakas A. The usefulness of sleep and sleep deprivation as activating methods in electroencephalographic recording: contribution to a long-standing discussion. Seizure 2000;9(8):580-4.
- Rowan AJ, Veldhuisen RJ, Nagelkerke NJ. Comparative evaluation of sleep deprivation and sedated sleep EEGs as diagnostic aids in epilepsy. Electroencephalogr Clin Neurophysiol 1982;54(4):357-64.
- Rozenblat T, Kraus D, Mahajnah M, Goldberg-Stern H, Watemberg N. Absence seizure provocation during routine EEG: Does position of the child during hyperventilation affect the diagnostic yield? Seizure 2020;79:86-9.
- Salinsky M, Kanter R, Dasheiff RM. Effectiveness of multiple EEGs in supporting the diagnosis of epilepsy: an operational curve. Epilepsia 1987;28(4):331-4.
- Samudra N, Armour E, Gonzalez H et al. Epilepsy with anterior temporal encephaloceles: Baseline characteristics,post-surgical outcomes, and comparison to mesial temporal sclerosis Epilepsy & Behavior 2023; 139. [CrossRef]
- Scheffer IE, Berkovic S, Capovilla G,Conolly MB, French J, Guilhoto L, Hirsch E, Jain S, mathern GW, Moshe SL, Nordli DR, Perucca E, Tomson T, Wiebe S, Zhang Y-H, Zuberiet SM. ILAE classification of the epilepsies: position paper of the ILAE Commission for Classification and Terminology. Epilepsia 2017;58:512–21.
- Seeck M, Koessler L, Bast T, Leijten F, Michel C, Baumgartner C, et al. The standardized EEG electrode array of the IFCN. Clin Neurophysiol 2017;128(10):2070-7.
- Shakhatreh L, Janmohamed M, Baker AA, Willard A, Laing J, Rychkova M, et al. Interictal and seizure-onset EEG patterns in malformations of cortical development: A systematic review. Neurobiol Dis 2022;174:105863.
- So EL, Ruggles KH, Ahmann PA, Trudeau P, Weatherford K. Yield of sphenoidal recording in sleep- deprived outpatients. J Clin Neurophysiol 1994;11(2):226-30.
- Sperling MR, Engel J, Jr. Electroencephalographic recording from the temporal lobes: a comparison of ear, anterior temporal, and nasopharyngeal electrodes. Ann Neurol 1985;17(5):510-3.
- Sperling MR, Mendius JR, Engel J, Jr. Mesial temporal spikes: a simultaneous comparison of sphe- noidal, nasopharyngeal, and ear electrodes. Epilepsia 1986;27(1):81-6.
- Sperling MR, Guina L. The necessity for sphenoidal electrodes in the presurgical evaluation of tem- poral lobe epilepsy: pro position. J Clin Neurophysiol 2003;20(5):299-304.
- Téllez-Zentenoa JF, Lizbeth Hernández Ronquillo L, Moien-Afshari F, Wiebe S. Surgical outcomes in lesional and non-lesional epilepsy: A systematic review and meta-analysis. Epilepsy Research 2010; 89: 310—318.
- Urbach H,Heers M, Altenmüller DM, Schulze-Bonhage A, Staack AM, Bast T, reisert M, Schwarzwald R, kaller C, Huppertz HJ, Demerath T. “Within a minute” detection of focal cortical dysplasia. Diagnostic Neuroradiology 2022; 64: 715-726.
- Vaudano AE Ballerini A, Zucchini F, Micalizz E, Scolastico S, Talami F, Giovannini G, Pugnaghi M, Orlando N, Biagioli, N, Cioclu MC, Vallone St, Genovese M, Todeschini A, Cavalleri F, Malagoli M, Meletti St. Impact of an optimized epilepsy surgery imaging protocol for focal epilepsy: A monocentric prospective study. Epileptic Disorders 2023;25 :45-46.
- von Oertzen J, Urbach H, Jungbluth S, M Kurthen M, Reuber M, Fernandez G, Elger CE. Standard magnetic resonance imaging is inadequate for patients with refractory focal epilepsy. J Neurol Neurosurg Psychiatry 2002;73:643–647.
- Wang ZI, Alexopoulos AV, Jones St E, Jaisani Z, Najm IM, Prayson RA. The pathology of magnetic-resonance-imaging-negative epilepsy. Mod Pathol Off J U S Can Acad Pathol Inc 2013;26:1051–8.
- Wang ZI, Bernasconi A, Bernhardt B, Blumenfeldt H, Cendes F, Chinvarun Y, Jackson G, Morgan V, Rampp St, Vaudano AE, Federico P. MRI essentials in epileptology: a review from the ILAE Imaging Taskforce. Epileptic Disorders 2020; 22: 42 -437.
- Wehner T, Weckesser PH, Schulz St. et al. Factors influencing the detection of treatable epileptogenic lesions on MRI. A randomized prospective study. Neurol. Res. Pract. 3, 41 (2021).
- Werhahn KJ, Hartl E, Hamann K, Breimhorst M, Noachtar S. Latency of interictal epileptiform dis- charges in long-term EEG recordings in epilepsy patients. Seizure 2015;29:20-5.
Disclaimer/Publisher’s Note: The statements, opinions and data contained in all publications are solely those of the individual author(s) and contributor(s) and not of MDPI and/or the editor(s). MDPI and/or the editor(s) disclaim responsibility for any injury to people or property resulting from any ideas, methods, instructions or products referred to in the content. |
© 2025 by the authors. Licensee MDPI, Basel, Switzerland. This article is an open access article distributed under the terms and conditions of the Creative Commons Attribution (CC BY) license (http://creativecommons.org/licenses/by/4.0/).
Copyright: This open access article is published under a Creative Commons CC BY 4.0 license, which permit the free download, distribution, and reuse, provided that the author and preprint are cited in any reuse.


