
Submitted:
07 March 2025
Posted:
07 March 2025
You are already at the latest version
Abstract
In port management, the integration of Geographic Information Systems (GIS) is es-sential for geospatial analysis in a complex environment shaped by digitalisation and the energy transition. This study conducts a systematic analysis of GIS integration in the maritime-port sector. Bibliometric analysis using bibliometrix (R) reveals an annual growth of 8.59% in scientific publications over the past decade, with a focus on environmental monitoring, machine learning, and digitalisation. Although the adoption of SDI and GIS is growing, their use remains predominantly limited to visualisation and monitoring by stakeholders, with challenges in interoperability and collaborative data management. The main research trends include the integration of GIS with machine learning, advanced spatial applications in maritime technologies, and the development of spatial analyses integrated with artificial intelligence. Among the emerging trends, research shows an increasing focus on sustainability, environmental monitoring, and innovative management systems. These findings suggest that research is centred on the development of technology and innovation to mitigate climate change, while seeking to advance new paradigms for the management of maritime and port spaces.
Keywords:
Geographic Information System
; systematic review
; maritime management
1. Introduction
Maritime transportation, responsible for over 80% of global trade in 2022, is a strategic sector that demands constant monitoring of cargo, passenger, and tourism activities by stakeholders [1]. In the maritime environment, management and control are conducted through digital port management systems that can integrate information from terrestrial, maritime, aerial sensors, and satellites. In this context, Geographic Information Systems (GIS) have been widely used to enhance management systems and collaborative platforms, increasing port visibility, reliability, and efficiency, promoting regulatory compliance and transparency, which results in competitive advantage [1,2,3]. GIS is fundamental in collecting and processing heterogeneous data in real-time to optimize operations, monitor traffic, coastal development, security, and environmental protection. The integration of GIS in spatial data infrastructures, WebGIS, interactive maps, and monitoring dashboards is one of the ways to ensure interoperability and transparency among stakeholders.
In the maritime sector, GIS has evolved beyond being just a visualisation resource, mapping tool, or navigability analysis system. This tool has expanded its capacity to simultaneously integrate and share multiple resources and heterogeneous data used by various stakeholders [4]. In the literature, GIS has been applied to optimise diverse areas, such as maritime spatial planning (MSP) to enhance facilities and key asset management, navigation safety, environmental protection, combating piracy and terrorism, and economic efficiency [5,6,7]. With geospatial analysis tools combined with a comprehensive geographic visualisation interface, maritime GIS facilitates port infrastructure planning, special economic zone administration, and the integration of crucial data, such as vessel tracking [8], navigation routes [9], including the TurboRouter system, use in fleet route planning with a generic GIS approach [10], real-time maritime traffic control [11,12], container monitoring [13,14,15], security [16,17], maritime ecosystem protection [18,19], bathymetry [20], weather conditions [21], port management decision-making [22,23], and also through the adoption of new trends such as smartport, greenport, smartberth, and digital twins [24,25]. With advances in energy transition and digitalisation optimising stakeholder decision-making, maritime GIS enables the simulation of future scenarios, supporting renewable energy integration projects and carbon footprint management, fundamental elements for building smart ports [26,27].
GIS can provide a broad and integrated geovisualisation of port dynamics, ranging from inventory control, interface functions, navigation to analytical activities such as monitoring and operational optimization of logistics and intermodal activities [4]. Monitoring and analysing information in the maritime context can integrate various data sources through Port Community Systems (PCS) [28], such as data from AIS (Automatic Identification System) [29], ECDIS (Electronic Chart Display and Information System) [30], MDA (Maritime Domain Awareness) and MSIL (Maritime Situational Indication Linkage) [31]. In the online Maritime Information System (MIS), for example, users can obtain information from various sources, such as Electronic Navigational Charts (ENC)/Digital Navigational Chart (DNC), C-Map server, Global Climate Observing System (GCOS), the Global Ocean Observing System (GOOS) and the Global Terrestrial Observing System (GTOS) [32]. These monitoring systems operate under the supervision of global entities such as the World Meteorological Organisation (WMO), UNESCO's Intergovernmental Oceanographic Commission (IOC), the United Nations Environment Programme (UNEP) and the International Council for Science (ICSU) [32]. In this sense, the use of GIS resources to promote transparency in the management of port activities has emerged as a collective demand, being perceived as an ethical and political need associated with goals such as responsibility, inclusion, legitimacy, substantiation, efficient governance and socially responsible impacts.
The value of geographic information has grown due to advances in remote sensing, telecommunications, and global positioning systems, which, integrated with the internet, facilitate the sharing of spatial data in real time or through large central databases [16,33]. In ports, which deal with large volumes of geolocated information, this represents a challenge in the analysis of large-scale geodata [34]. To manage this complexity, one solution is to adopt a Spatial Data Infrastructure (SDI), which facilitates efficient access, use, and management of geospatial data between organisations and users, supporting decision-making and planning [35,36]. Known as marine SDI, this system facilitates data management, analysis, and interoperability, with web-based functionalities, enabling fast and accurate decisions by Port Authorities in real time [37,38]. The digital transition and Industry 4.0 changes are also putting pressure on ports to digitise themselves in order to face competitiveness, environmental management, and traffic challenges [39], since everything that happens in a port is related to a specific geographical location. Despite advances, port management systems still face difficulties in geospatial integration, especially in communicating and sharing data in real time, which limits efficient data filtering and decision-making with cartographic tools [40].
Proposed initiatives such as Erasmus SmartPort Rotterdam [41], and smartport at the Port of Hamburg (Germany) [42], the Nexus project at the Port of Sines in Portugal [43], the optimised management of maritime calls at the Port of Tangier [44], and the implementation of Digital Twin for all activities taking place in the Barcelona port area, demonstrate the growing interest in developing innovative solutions for the port community in academia and in practice. These transformations have introduced new ways of managing port systems, which encompass concepts such as smart port [45], smart berth [46], and green port [25]. Digital transformation in the maritime sector encompasses the digitisation of physical assets and their integration with the internet, using advanced technologies such as blockchain [47], the Internet of Things (IoT) [48], Digital Twins [49], Human-Machine Interfaces and Cyber-Physical Systems (CPS) [50]. These innovations enable real-time visualisation, the automation of port operations, and quasi-autonomous decision-making based on big data analysis [45]. When well managed by collaborative and marine SDI systems, diverse data can be accessed by a wide range of users. However, information sharing faces challenges due to the fragmentation and complexity of marine data and observations at different scales [38]. Despite the advantages of new technologies, their adoption is not uniform among global ports, reflecting inequalities in the technological infrastructures of different regions. These barriers make it difficult to optimise transport infrastructure, port performance, safety, and reduce congestion and environmental impacts [51].
Faced with this challenge, this study conducted a systematic literature review to identify the main applications of SDI and GIS in the maritime-port sector. The research fills an important gap by analysing publications on the implementation of these tools in the management and monitoring of maritime operations. The study aims to understand trends in port geovisualisation, assessing the quality and accessibility of geospatial data, and revealing their implications for governance and communication in the sector, considering both academic and practical perspectives.
2. Materials and Methods
2.1. Bibliometric method
To analyse large volumes of data in literature reviews, the bibliometric method has gained popularity among researchers as an effective tool [52]. The development of bibliometric software, such as Bibliometrix (R package), along with access to comprehensive scientific databases, such as Web of Science (WoS) and Scopus, have enabled more robust and comprehensive systematic reviews. These tools allow researchers to identify patterns, trends and insights more efficiently, as well as to evaluate evidence based on predefined criteria [53,54]. In other words, the systematic approach allows for the identification of a broad set of relevant publications and facilitates the careful selection of a subset of papers that meet specific parameters. In this sense, the analyses derived from this methodology provide a solid basis for guiding future research, identifying gaps in current knowledge and promising areas for further research [54].
The bibliometric analysis was conducted in five main stages that include the definition of the research questions; search and collection in databases using key terms; analysis of relevant documents; visualization and interpretation based on predetermined criteria [55,56] as shown in Figure 1.
2.1.1. Step 1: Search strategy
In bibliometric analysis, the design of the study and the identification of the search terms are fundamental steps, allowing extensive scientific knowledge to be examined through qualitative and quantitative analysis without influencing the results [57,58]. In this context, this methodology was applied to identify relevant keywords and periodicals related to the applications of geographic components in the maritime sector.
The systematic review of the databases sought to identify general trends in publications related to the application of GIS in maritime logistics, management and port operations, as well as to identify existing knowledge gaps. One way to develop a bibliometric analysis is by defining key questions that determine the formulation of the research objective [59]. The questions contribute to appropriate search strategies and concentrate the published evidence to structure the systematic review. To this purpose, a key question was developed, covering the main aspects of the set of keywords used in the searches across the Web of Science (WOS) databases [60] and Scopus [61].
To support the development of the state of the art and the future perspectives of the application of GIS in the maritime sector, as well as in electronic port management systems, the question that guided the study was:
- Key question: “In the maritime-port logistics interface, how are Spatial Data Infrastructures (SDI) and Geographic Information Systems (GIS) integrated into collaborative geovisualization platforms?”. In a systemic review, the key question aims to provide a holistic understanding of the theoretical, practical aspects and ideas of the application of GIS in the monitoring, sensing and analysis of maritime spatial management, to support researchers and experts in identifying future research directions.
2.1.2. Step 2: Data collection
In this second phase, the scientific databases to be consulted were defined. In the systematic review process, the scientific databases Web of Science (WoS) from Clarivate Analytics and Scopus from Elsevier were used. The Web of Science (WoS) and Scopus databases were selected for this bibliometric analysis due to their complementary characteristics. WoS, a pioneer in bibliometric analysis since 1900, stands out for the scope and impact of its publications [62,63]. Scopus, the largest database of peer-reviewed abstracts and citations, covers multiple areas of knowledge with more than 20,000 journals [64]. This methodological approach opted to combine both databases for greater analysis completeness in order to identify research gaps and inform future research, as recommended [54,65,66].
Based on recent systematic review studies [67,68,69] we adopted a Boolean equation with specific inclusion criteria for the filtering process in the databases. To ensure transparency and replicability, we delimited the search period to 10 years, including publications between January 1, 2014 and December 22, 2024. In addition, the time restriction covers the most recent and relevant publications on the topic, considering the rapid evolution of GIS technologies and spatial data infrastructures in the port context. In this period, the search for publications in WOS was based on the keywords included in the title, abstract and keywords of the publications, defined by the advanced search and using the Topic option (Searches title, abstract, keyword plus, and author keyword). The advanced search in Scopus also respected the same time restriction criteria and was carried out using the title, abstract and keywords fields (TITLE-ABS-KEY). The search was delimited to include only publications from 2014 onwards, applying the filter “AND PUBYEAR AFT 2014” to the base query.
The systematic identification strategy was developed based on keywords, focusing on the central research question. In the databases, the identification structure was organised into four main keyword groups to comprehensively and systematically cover the topic. The first group focused on geospatial technologies, including fundamental terms such as spatial data infrastructure and geographic information systems, such as “spatial data infrastructure”, “marine sdi”, “geogra* information system”, “gis*” or “geospatial data integration”. The second group addresses the port and maritime context, subdivided into three categories: main terms related to ports, concepts of smart ports, and specific elements of port operations such as “seaport”, “port”, “smart”, “green”, “intelligent”, “automated”, and “port*”, “maritime*”, “logistic*”, “terminal*”, “ship*”, “vessel*”, “berth*”, “container*”. The third group covered technological aspects, with a focus on interoperability, visualization and digital platforms using the keywords “interoperability”, “visualiz*”, “stakeholder*”, “open data”, “digital*”, “web” and “map”, “service”, “gis”, “based gis”. Finally, the fourth group covered tools and data, including elements such as “map*”, “dataset”, “tool”, “ais”, “iot”. This hierarchical organization allows for a systematic search that combines geospatial, maritime, technological and tooling aspects, ensuring the retrieval of publications relevant to the study of the application of GIS and spatial data infrastructures in seaports. The four groups were connected by the logical operator AND, ensuring that the publications identified simultaneously addressed geospatial, maritime, technological and tooling aspects. Within each group, the keywords were separated by the logical operator OR, allowing a variety of related terms to be included which increased the scope of the search. The use of asterisks (*) after a keyword made it possible to include variations of the terms to broaden the scope of the search. This systematic structure contributes to a comprehensive search of the most relevant publications for the study of the application of GIS and spatial data infrastructures in seaports.
The first criterion was to select only publications in English, considering its predominance in international scientific literature and its role as a global scientific language. The second criterion was limited to including documents classified as 'article' and 'review article', as these categories are uniformly available in both databases and represent substantial, peer-reviewed scientific contributions [70]. In order to refine the results in the WOS and Scopus databases, a limitation by research area was applied, excluding fields not pertinent to maritime GIS and SDI, such as biomedical sciences, medicine, veterinary science, psychology and related areas. This process made it possible to concentrate the analysis on publications effectively related to the scope of the research. The search in the selected databases identified 687 research works, 399 in WOS and 288 in Scopus (Table 1). Table 1 shows the Boolean equation and the inclusion criteria applied to each database.
2.1.3. Step 3: Data analysis
In the third phase of the study, a descriptive bibliometric analysis was carried out on the 687 publications discovered, with the support of the open source statistical software R (version 4.4.2). The files exported in BibTeX format (.bib) were checked for duplicates (identifying 150 publication) and consolidated into a single database, which was then converted into .xlsx format in RStudio (version 2023.03.1). This compilation and standardization of the data made it easier to load and process the Biblioshiny interactive application, which is available for free via the Bibliometrix package, version 4.1 (http://www.bibliometrix.org, accessed on 28 December 2024).
The Bibliometrix package is equipped with a set of scientometric tools developed specifically to identify patterns and perform an initial evaluation and screening of articles in a bibliometric analysis [71]. The package includes an application developed in Shiny, which offers a point-and-click graphical interface that provides advanced visualization and quantitative analysis capabilities for scientific data, making it easier to understand trends in a field of research [72,73]. This feature is particularly useful for users interested in exploring the tool without the need for programming knowledge in the R language. In the literature, the Biblioshiny application is widely used in bibliometric studies due to its usability, agility and ability to analyze large volumes of data, overcoming traditional manual review methods [74,75,76,77,78,79].
In this study, a total of 530 documents were imported into the Biblioshiny application for analysis. The main metrics evaluated were used to answer the research questions in a global way through the main information, annual scientific production, keyword co-occurrence networks, citation networks, production by country, thematic maps, thematic evolution maps [80]. The integration of these methodological tools made it possible to systematically visualize the scientific panorama, revealing not only the current scenario, but also the main strands of research and emerging challenges in the application of geographic components in the maritime sector.
Although Biblioshiny helps to filter articles based on initial criteria, the refinement and final selection of articles for inclusion in a systematic review usually requires more detailed manual analysis. This is because the Biblioshiny application requires complete sets of mandatory metadata from the Web of Science (WoS) or Scopus [81]. Files exported from reference managers, such as .bib, .ris, .csv and .txt, are not compatible with the tool due to the lack of metadata standardization, which generates execution errors and makes more detailed analyses of publications impossible [81]. To this end, the database of 534 documents was imported into the Zotero 7.0.7 reference manager.
In systemic review articles, several authors use the Preferred Reporting Items for Systematic reviews and Metanalysis (PRISMA) [82], due to its clear structure and ease of application, especially for the careful selection of articles to be included in the review [83]. In this study, we adapted the PRISMA methodology to answer the key research question presented in section 2.1.1 In this sense, the systematic review and meta-analysis in scoping reviews (PRISMA-SCR) methodology was applied to carry out a robust search of the database [84]. The application of the search strategy resulted in a sample of 78 scientific articles. In addition, three complementary sources from the websites of international organisations were consulted to support the analysis. The steps carried out in PRISMA-SCR allow future research to be replicated and updated [85] as shown in the PRISMA-SCR flowchart (Figure 2).
2.1.4. Data Visualization
The integration of these methodological tools enabled a systematic visualization of the scientific landscape, revealing not only the current scenario but also the main research trends and emerging challenges in the application of geographic components in the maritime-port sector. Using Bibliometrix, descriptive metrics were extracted from the database to analyze various aspects of the literature. The key information obtained includes data types, document content, authors and their collaborations, and document types. The number of documents and citations per year proved valuable in identifying research progress in our field of study and determining the most relevant journals in the subject area.
The analysis methodology also consists of identifying knowledge structures through visualization techniques such as word clouds, thematic maps, tree maps, three-field maps, and network analysis. For the keyword analysis using tree maps and word clouds, the choice of author keywords was preferred as they represent the terms that researchers considered most relevant and representative of their work. The analysis of international collaborations between authors was crucial in identifying the main re-search hubs and understanding how research on this topic has been distributed glob-ally. Based on a geographic file generated by the R package biblioshiny, the mapping of these collaboration networks enabled the visualization of not only the number of publications per country but also the connections established between different nations, revealing the most influential centers and strategic partnerships in the field's scientific production.
Finally, an analysis of key themes and trends throughout the studied decade was conducted. Following the methodology described by [86,87,88], Callon et al. [86], Cobo et al. [87], and Meyer et al. [88], thematic maps were developed to visualize research topics. These maps are constructed as bi-dimensional graphs based on two fundamental parameters: centrality and density. Centrality, expressed on the x-axis-horizontal, denotes the level of engagement of a particular cluster of networks compared to other clusters, thus showing the importance of the research topic. Density measures the intensity within a cluster network as an indication of the developing stage of the subject, and it is plotted on the vertical axis (y). These two dimensions give important insights about each cluster's significance and cohesion [86]. In the thematic map, each topic cluster is depicted by a bubble with a different color representing different clusters. The thematic map can be divided into quadrants to indicate the stage and characteristic research theme [87]. The first quadrant in this sense is that is considered the central and developed, which becomes the motor themes that are defined as high centrality and density. These refer to research topics that are already established in the field. The second quadrant, de-scribed as 'peripheral and developed,' includes paper-studying issues where perhaps emerging promising questions for research need to be flagged as potential motor themes in the future or as transfer points between networks of different yet connected forms. The third quadrant will include areas pertaining to a topic already established in the literature, and periphery, fourth quadrant will identify newly forthcoming research topics or ones that alternatively are fading out in the research field [87].
2.1.5. Step 4. Interpretation
The concluding phase necessitated a comprehensive interpretative examination of the bibliometric findings. The processing of data unveiled thematic structures, chrono-logical patterns, and knowledge aggregates within the investigated field. The identification of these structures facilitated the delineation of the principal themes of the scholarly works, the emergence of topics that signify novel research frontiers, and the evolutionary pathways illustrating the progression of themes over time [89].
The interpretation amalgamated quantitative bibliometric indicators with targeted qualitative analysis. While computational methodologies facilitated the preliminary data extraction and processing throughout stages 2-4, the conclusive analysis de-manded human expertise to effectively contextualize the findings. This interpretative effort transcended mere numerical metrics, aiming to comprehend the conceptual interconnections among various thematic clusters, as well as the identification of potential deficiencies and avenues for future research opportunities.
3. Results
3.1. Bibliometric analysis
In this section, we present the main results of the bibliometric analysis, developed using the bibliometrix/biblioshiny package, which provided a comprehensive view of the scientific landscape and research trends on the application of GIS in the port and maritime sectors. The analysis of the situation in the field of research studied covered four fundamental aspects: (1) the descriptive statistics of publications, providing an overview of the data set; with the evolution of annual scientific production, demonstrating the temporal trends of publication and the distribution of articles by scientific journals, identifying the main dissemination vehicles; (2) authors' keywords; (3) the global distribution of publications and the visualization of international collaboration networks between countries, highlighting the main research centers and their interactions; and (4) the thematic evolution of the field, revealing the main trends and changes in the areas of interest over time.
3.1.1. Descriptive bibliometric analysis
A descriptive analysis of the 530 documents published between 2014 and 2024 revealed a significant growth trend in scientific production in the field of GIS applications, techniques and tools in the maritime-port sector. Table 2 shows an increase in scientific production with an average annual growth rate of 8.59%, reflecting the interest and relevance of GIS technologies in the maritime sector.
3.1.2. Distribution of annual documents and citations
In this study, the 350 documents found were distributed among 514 articles (89.7%), 10 reviews (2.9%) and 6 early access (1.7%). The analysis revealed 2,205 researchers involved in scientific production, with a Collaboration Index (CI) of 4.83 authors per jointly-authored or co-authored article, showing a strong preference for collaborative work over individual publications. International partnerships accounted for 24.72% of collaborations, showing significant transnational cooperation in the development of maritime GIS research. Over the course of ten years, there has been an upward trend in scientific production in the area, with an annual average of 48.82 publications, reaching a peak of 68 documents in the 2021-2022 biennium. The significant growth in scientific publications over the last decade highlights the growing importance of integrating GIS into maritime-port management. This evolution has provided significant advances not only for the scientific community, but also for various sectors of the port complex, providing a solid scientific basis for the development of public policies and technological innovations in the sector.
In terms of academic impact, in 2016 it stood out with the highest citation average of 16.1, followed by a significant decline in subsequent years, reaching just 2.0 citations in 2023 and 0.6 in 2024. The reduction in citation averages can be attributed to the specificity of the area of study, considering that the integration of GIS in port and maritime environments constitutes a highly specialized domain at the intersection between geospatial technologies and port operations. The intrinsic complexity of the sector requires expertise in both geographic systems and port operations, the barriers to accessing port data, often considered strategic or confidential by port authorities, the concentration of research in a few centers specializing in maritime studies, and the limited number of professionals working simultaneously in the areas of geotechnology and port management. This represents a significant barrier to the development of comprehensive research in this field. These factors can restrict the number of researchers and institutions capable of developing studies in this area. This challenge highlights the importance of new research that can fill this knowledge gap. Figure 3 illustrates the evolution of annual scientific publications and the average citation of articles per year.
3.1.3. Most influential journals
In the distribution by scientific journals, five journals concentrate 47.8% of the publications, with Remote Sensing, specializing in remote sensing and terrestrial observation, coastal monitoring (15.2%); Environmental Earth Sciences, focused on earth sciences and environmental impacts (9.8%); ISPRS International Journal of Geo-Information, dedicated to geographic information systems and geomatics (8.7%); Natural Hazards, focused on studies of risks and natural disasters (8.2%); and Sustainability, with an emphasis on sustainable development and environmental management (6.0%). Figure 4 shows the distribution of the number of documents published among the top 20 peer-reviewed journals.
3.1.4. Authors' keywords
This section presents an analysis of the correlations between keywords per author extracted from databases on geographic information systems in the maritime-port sector. Mapping these keywords made it possible to identify the main research trends in the area, reveal possible research gaps and point to future research. For a more meaningful analysis, synonymous keywords were grouped together, for example, the keyword “gis” encompassed the group of terms “geographic information”, “geographic information systems”, “geographic information system”, “geographic information system (gis)”, “geographic information systems (gis)”, “qgis”, “ppgis”, “arcgis”, “geographical information system”, and “geographical information systems”. The list of synonyms was imported in .txt format into Bibliometrix's Text Editing option panel. This standardization was essential to avoid terminological dispersion, allowing similar or related terms to be identified and categorized. This grouping facilitated an understanding of the trends and thematic relations addressed in the literature.
GIS appeared as a central axis in the tree map of the 20 most frequent keywords used by authors, considering the grouping of synonyms into a single keyword. Among the most mentioned keywords are 'GIS', 'remote sensing' and 'machine learning', which together account for 47% of the occurrences in the literature analyzed. The keyword 'stakeholders' is in 14th place (2%), while 'seaport', 'optimization', 'public participation', 'environmental protection', and 'internet' occupy the last five positions with an occurrence of 1% respectively (Figure 5). In this search for publications related to the use of spatial data infrastructures in the maritime-port sector, we found a low relevance of this keyword, which was not identified in any publication considered significant.
The global analysis of the 350 documents, using the authors' keyword cloud, reveals the significant application of GIS in the maritime-port context (Figure 6). GIS stands out mainly in four fundamental aspects such as spatial analysis, environmental monitoring, remote sensing and data management.
In this context, GIS stands out as a versatile and consolidated tool, being widely used in geospatial management and analysis, ranging from basic mapping to complex modeling of coastal scenarios. The keyword “Remote Sensing”, which encompasses image analysis techniques such as satellites, LiDAR and digital elevation models, can be used for detecting vessels, monitoring maritime pollution and classifying images. The “Spatial Analysis” grouping highlights the application of spatial planning and cartography, which includes web mapping (WebGIS) and spatial forecasting, allowing an integrated approach to geographical analysis.
The “Machine Learning” group focuses on advanced techniques such as artificial neural networks (ANN), random forest (RF) and deep learning, which are essential for predictive analysis and the automation of complex big data analysis processes. “Analytical Methods includes algorithms such as the Analytical Hierarchy Process (AHP) and fuzzy logic, often used in numerical modeling and quantitative analysis. The “Evaluation Methods” include methods such as validation by ROC curves and bivariate models, guaranteeing greater precision in analysis and forecasts. These methods are particularly useful in “Environmental Monitoring” studies, which address issues such as climate change, coastal erosion and ecosystem monitoring, as well as linking to “Environmental Protection” strategies focused on biodiversity conservation and water quality management.
In the “Risk Assessment” field, the studies focus on risk assessments associated with landslides, coastal hazards and susceptibility to natural disasters, while the “Sustainability” cluster explores topics such as renewable energy, circular economy and sustainable development, highlighting green solutions in the maritime-port sector. The “Stakeholder” group highlights the importance of information management and decision support to engage different stakeholders in maritime projects. In the technological sphere, the “Big Data” and “Digital” group addresses topics such as digital twins, IoT and data mining, driving technological innovation in the sector. The keywords in the “Data Visualization” group focus on the presentation of information through 3D visualizations and localization, improving the interpretation of complex data. The “Management System” keyword cluster discusses the use of integrated systems and technologies such as cloud computing for process management and decision support, especially in maritime contexts. The “Internet” keyword group connects digital applications and website selection, while the “Maritime” grouping encompasses maritime spatial planning, safety and accidents, emphasizing the impact of sea level changes and the importance of bathymetry. Finally, the “Seaports” group directly addresses port infrastructure, logistics and the management of ports and terminals, which are fundamental to global maritime trade.
3.1.5. Mapping scientific collaboration between countries
Analysis of the geographical distribution of the 350 publications showed the consolidated leadership of China, the United States and India in the development of research in GIS applied to the maritime sector, with 336 (23.7%), 236 (16.6%) and 145 (10.2%) documents, respectively. These three nations account for 50.7% of the scientific production among the top 20 countries, consolidating themselves as research centers in GIS applied to the port and maritime sector. Among the top 20 countries, developed countries occupy a larger proportion and have a strong research impact in the field of GIS application in the maritime-port sector. A map shown in Figure 7 identifies the collaboration between the main countries and the total number of publications on the scope of our study. The connection lines express the connection between two or more countries, indicating the status of collaboration between them. The scale of cooperation is represented by the thickness of the line and different shades of blue, with the darkest shades being the strongest cooperation and the lightest blue the weakest. The USA, China, India, Australia, Canada, and the countries of Western and Eastern Europe showed in-depth cooperation and exchange between researchers. These results show that GIS technology has revolutionized the maritime industry in various areas such as maritime logistics through intelligent location systems, digital map visualization, environmental monitoring, water quality and environmental impacts, vessel tracking, nautical weather forecasting, assisted navigation and port management, among others.
3.1.6. Evolution of the main themes and trends
The GIS applications evolution in the maritime-port sector was mapped using a Sankey chart, which illustrates the evolution of keywords in studies related to the maritime and port sector from 2014 to 2024 (Figure 8). The analysis in the Bibliometrix software was segmented into four key periods using three cut-off points: 2018, 2020 and 2022. In addition, the standard parameters used were a word count of 250 words, a minimum frequency of five occurrences per thousand documents, weighting based on the inclusion index per occurrence, a minimum weight of 0.1, assignment of three labels per group and implementation of the WalkTrap algorithm for clustering.
From 2019 to 2020, this analysis highlighted that GIS has continued to hold a prominent position in the research, marrying previously separated themes from 2014-2018, which were about big data analysis, an integrated management sys-tem, and advanced analytical methods. This technological convergence has solidi-fied the decision-making processes of the stakeholders in the maritime-port sector. The time was also marked by the intensification of digitalization in the maritime domain and meant the extension of the use of newly emerging technologies such as IoT and digital twins, which represents a watershed moment in technological transfer and supporting spatial planning and safety practices. Investigations be-tween 2021 and 2022 were intensified into GIS and spatial analysis in the mari-time-port sector and reflected new trends expected in 2023-2024, focusing more on data visualization in response to the demand for making complex information user-friendly. Sustainability, therefore, came out of this last period as the developing priority addressing the further shift of the sector into the more sustainable prac-tices paradigm change, exhibited, for example, through energy transition and green ports, smart ports. Also, actors were kept significant through the whole pe-riod, emphasizing the role of information management and the importance of the involvement of various actors in decision making.
In Figure 9, we present a strategic diagram illustrating the evolution of research topics within the scope of the study, focusing on the most recent period (2023-2024). The analysis was conducted by applying a clustering algorithm to the authors' keyword network, enabling the identification and characterization of the main themes in the field. The strategic diagram positions the topics based on their importance (centrality) and their level of development (density) in the thematic network.
The first quadrant showing essential topics (Q1) contains a cluster of GIS, machine learning, and maritime applications. The location of this cluster argues that these technologies are not central only to the area but also developed strongly within themselves, revealing the direction of integrated spatial analysis and artificial in-telligence in the maritime sector. In the quadrant of developed, yet isolated themes (Q2), themes toward stakeholders and environmental aspects are found. Such positioning can be inferred to mean that, while these themes are well developed internally, they are sporadic in their connection with other research fields. This may reflect an emerging but still focused concern about the impacts of cli-mate change and the alteration of paradigms in the management and planning of maritime and port spaces. Among the basic and transversal themes (Q3), one finds data visualization, and this indicates it is one of those foundational yet multi-faced spheres such as applied research with all work in the area. Lastly, there are in the emerging themes quadrant (Q4) discussions related to sustainability, environmental monitoring, and management systems. These themes are posi-tioned that even if they do matter, their value is still in a phase of development and consolidation within the research field, revealing a huge potential for future development in these areas for the maritime sector.
4. Discussion
In this section, we analyse studies on the integration of spatial technologies in the maritime-port sector, focusing on the implementation of SDI and GIS for the integration and visualisation of geospatial data. We also address the feasibility and limitations of these technologies in geovisualisation platforms and advanced monitoring systems, with a view to supporting integrated decision-making between stakeholders.
4.1. Thematic Analysis
4.1.1. Spatial data interoperability infrastructures
The Marine SDI is a framework for integrating spatial data from maritime and coastal environments, which, through standard practices, protocols, and specifications, provides stakeholders with access to a unified platform for data storage and processing [90]. Whether in port and navigation management or Marine Spatial Planning (MSP), the Marine SDI supports modern ocean governance, promotes interoperability between systems, and optimises information management by facilitating evidence-based decision-making [90]. This infrastructure is distinguished by its ability to continuously monitor both natural processes and anthropogenic activities in coastal and marine zones, utilising advanced digital technologies to create a management model that is more responsive and adaptive to environmental and social changes [91]. The mitigation pressures on marine and coastal environments requires accessible and intuitive tools for making high-quality spatial data available to both managers and the general public [92].
In the literature, SDI has been applied along the coast of Greece as an alternative solution for the efficient organisation and distribution of geospatial information via the web [92]. Similarly, in Greece, MSP has been studied based on the implementation of an approach called SMEP (Smart Marine Ecosystem-based Planning), which integrates SDI to promote more dynamic and participatory marine governance [91]. The authors have developed a Marine SDI, establishing practical guidelines for its implementation in the context of marine spatial planning. Within the SDI, GIS has played a crucial role in spatial data management and analysis, particularly in ensuring data interoperability relevant to the implementation of the International Hydrographic Organisation's S-100 data model, supporting governance policies and strategies related to the use and conservation of marine data, and enabling data visualisation and access [91].
In the European Union, the Infrastructure for Spatial Information in the European Community (INSPIRE) Directive establishes a framework for sharing spatial environmental data. Through this SDI, the exchange of geographic information is standardised among public institutions. This initiative has democratised access to spatial data across Europe and has played a crucial role in developing evidence-based cross-border policies [93]. The use of spatial data related to maritime activities and the marine environment is a fundamental component of the MSP process, as it is incorporated into the INSPIRE framework and must be shared across European SDIs [94].
Studies on detectable marine spatial data in Ireland's MSP [95], evaluation of the effectiveness of the INSPIRE Directive in sharing marine data that supports MSP [94], risk and vulnerability assessment of coastal regions to hurricanes [96], water chemistry analysis in European sea basins [97], and the mapping of underwater cultural heritage [98], were carried out on the basis of the INSPIRE extension. Other studies, have investigated the applicability of the SDI concept, developed by INSPIRE, to maritime navigation [99]. One of the main applications of GIS was in the management of spatial information, with the aim of improving the safety and efficiency of maritime navigation. A comparative analysis of the geoportals of Poland (Geoportal 2) and Italy (Il Nuovo Visualizzatore-Geoportale Nazionale), which include the maritime geographic component, was carried out in relation to the INSPIRE Directive. The authors found that geoportals are of good quality from an organisational, technical, and legal perspective, but face limitations related to data fragmentation and harmonization, which prevent full interoperability in the European SDI [100]. Although currently available data are not sufficient to fully support European MSP processes, the implementation of INSPIRE is expected to increase data availability and interoperability in the coming years [94]. Sharing maritime spatial plans through national SDIs can lead to better planning outcomes and avoid data update issues [94].
The adoption of open data platforms is another way of ensuring the interoperability of geographic data between stakeholders. The United Nations Guide to Global Geospatial Information Management Standards (UNGGIM) is an essential framework for promoting the harmonised use of geospatial information across different sectors and countries. This guide provides standards and best practices that favour the interoperability, accessibility and effective use of geospatial data globally [101]. The Open Geospatial Consortium (OGC) standards play an important role in creating a cohesive global geospatial framework by enabling the efficient exchange of data and promoting interoperability between systems and platforms [102]. Collaboration between the UNGGIM, INSPIRE and OGC standards forms the basis for an interconnected geospatial ecosystem, overcoming geographical and institutional barriers [102]. This standards network and guidelines is fundamental to a geospatial landscape that supports sustainable development and empowers decision-makers to tackle complex global challenges [101].
Web GIS has also been used in the maritime context as a platform for sharing geographic information. WebGIS uses web technology for communication between a server and a client, accompanied by an interface that allows users to visualise, integrate, process and analyse geospatial data [103]. Maps can be shared between different users and organisations using a computer and a web browser or application [104,105]. These platforms can be developed in various environments, with ArcGIS Online, Carto, Mapbox and GIS Cloud among the most widely used [106]. In Greece, an ArcGIS-designed web-GIS application was integrated with an Electronic Shore Awareness of Vessel Emergencies (ES.AVE) platform to generate public awareness on land about maritime pollution [107]. In Poland, for example, the marine cadastre was composed entirely of geographic data integrated and disseminated via GeoServer [108].
Fernández et al. [109] and Fernández et al. [110] stand out as pioneering contributions to the integration of GIS into port data management platforms. The integration of web-based GIS systems with open-source computer architecture was essential for optimising various operations, such as real-time monitoring of operations, data visualisation, management of large volumes of information and support for strategic decision-making [109]. The GIS integrated with the Future Internet Platform (FIWARE) in the Port of Las Palmas de Gran Canaria, using Big Data and IoT to optimise data management and improve decision-making in operations. SmartPort, developed with FIWARE, uses the Glob3 Mobile (G3M) framework for interactive three-dimensional visualisation of port data in real time [110]. Other authors such as Markris et al. [111] developed an Operational Forecasting Platform (OFP) in web-GIS (Accu-Waves) for monitoring and forecasting waves and sea conditions in 50 international ports. The platform offers interactive GIS maps accessible to vessels, with forecasts updated every three hours and a three-day forecast for port basins [111]. Web-GIS integrate geospatial data into management systems, meteorology, maritime sensors and ship traffic information, which enables more dynamic port management. However, each web-GIS can have limitations, such as unstable versions, limited support, costs, restricted free access, functionalities, popularity and visualisation quality (easy-to-use and customisable maps).
Although there are many research initiatives on the use of SDI in the maritime sector, specific studies on the development of SDI in port management systems and applications of geographic components to support decision-making are relatively limited. In particular, there is little research into the systematic analysis of GIS functionalities in port contexts, the categorisation and evaluation of geographic datasets used in port management, the effective sharing of this information with port users and the integration of these elements into geographic information databases specific to port environments.
4.1.2. GIS in the maritime sector
In the analysis of the maritime-port spatial context, recent studies highlight the fundamental role of GIS in optimising logistics chains and improving strategic decision-making processes, allowing for the integrated visualisation of geospatial variables that are critical to operational efficiency. Given the complexity of contemporary port management, the use of GIS has been recognised for its potential to improve data visualisation and management [112,113,114], port infrastructure monitoring and management [110,115], real-time monitoring and risk assessment [109,116,117], traffic control [118,119,120,121], management of port facilities and operations [121,123], maritime transport pollution impact assessment [124,125,126,127], maritime security and geopolitical conflicts [128,129], and labour abuses [130].
In the maritime-port interface, several studies have explored innovative solutions for visualising, manipulating and managing spatial data. Kalyvas et al. [131] conducted a study to gather official sources of online geospatial data for GIS applications in the maritime context, with a focus on free, high-quality resources for research, development and education. Among the 19 classes of maritime geospatial data evaluated, around 96.3 per cent of the datasets are freely available [131]. The study identified several main applications, such as support for the maritime industry, environmental monitoring, ship tracking, nautical meteorological forecasting, navigation aid systems, port information and naval cartographic data. The SeaCharts, an open source Python API designed for accessible and simplified visualisation and manipulation of Electronic Navigational Charts (ENC) along the Norwegian coast [113]. The API allows programmable access to spatial data, improving autonomous navigation and decision-making by optimising GIS functionalities. SeaCharts offers 2D functionalities such as polygon manipulation on depth data, interactive control and simulation (route planning, collision avoidance and risk analysis) and route optimisation for autonomous and remotely controlled vessels [113]. In addition, a GIS system was used to manage electronic navigation service data, based on OHI's S-100 model. The system efficiently organises and shares large volumes of geographic data between ships and land-based facilities, optimising performance through indexed data collections [112].
In maritime traffic monitoring by autonomous and interactive systems, GIS was applied in the development of an autonomous software tool that supports Relative Movement Analysis (REMO) of AIS data in real time [114]. The GIS was used to build REMO matrices and visualise movement patterns, helping operators to control maritime traffic. In the Ship Navigation Information Service System (SNISS), the GIS was used a real-time visualisation platform for the Northeast Passage Route (NEP) in the Arctic [120]. Using 3D GIS and Big Earth Data on the Cesium platform, SNISS provides intelligent and interactive navigation analyses by processing sea ice and weather data in real time to optimise routes [120]. Based on the Visual Basic platform, a study was conducted to integrate ship traffic data, maritime accidents and environmental facts in the Port of Kaohsiung, Taiwan [119]. GIS was used to map and analyse accidents, helping to identify high-risk areas. The analysis revealed that almost half of the accidents occurred within port waters, with a higher concentration in the channel, anchorage area and outside the port. GIS has also been used to analyse the hinterland of ports for container transport [119]. In Indian ports, GIS integrated into management systems has made it possible to spatially visualise container flows and the relationships between ports, types of cargo and values, revealing spatial patterns and homogeneous regional groups that are important for logistics planning [118].
In the planning and management of coastal zones, GIS has been consolidated as an integrative tool, especially through the Public Participation GIS (PPGIS) modality. An example of this application can be seen in Norway, where data from the PPGIS online platform revealed that the majority of participants expressed a preference for reducing salmon aquaculture, while remaining neutral towards other forms of aquaculture [132]. In the Kimberley region, Australia, the implementation of a PPGIS system was useful for mapping spatial values and preferences in marine and coastal areas, demonstrating the versatility of this tool in identifying coastal vulnerability to climate change and priority areas for conservation [133]. PPGIS has also been important for promoting community resilience along the Gulf of Mexico, highlighting how these tools can raise awareness of environmental risks and facilitate the development of adaptive strategies for the preservation of natural and cultural resources [134]. On the other hand, PPGIS, through the InterACT methodology, has improved port planning in Naples, providing strategic support to the Port Authority with a spatial analysis platform that promotes collaboration between stakeholders [135]. The differential of this approach lies in the integration of Information and Communication Technologies (ICTs) that offer an intuitive interface for visualising spatial data, enhancing the preservation of cultural heritage and revolutionising decision-making in environmental planning processes and the revitalisation of port-city interfaces [135].
GIS has been widely used in environmental monitoring to assess the impacts of marine pollution, such as biodiversity protection, air emissions analysis and oil spill detection. In a geographically weighted regression (GWR) model, GIS was used to assess the impact of nitrogen dioxide (NO₂) emissions in the Red Sea [124]. Using data from the Trop NO₂ VCD instrument and the OMI Level-3 NO₂ Daily Aura Data (OMNO2d) product, the study demonstrated the effectiveness of GIS and satellite data for emissions analysis. The one km² spatial grid created in the GIS allowed detailed analysis of the distribution of emissions and proximity to international routes and seaports using Euclidean distance weighting techniques [124].
A GIS-based model was developed to assess air quality (NOx) and dugong habitat conservation in the Strait of Malacca, between Malaysia and Sumatra. The model made it possible to visualise the impact of shipping, estimate the proximity of routes to habitat areas and assess pollution risks. The GIS also helped to simulate sustainable shipping scenarios [126]. Kao et al. [127] developed the Ship Emission Scenario Simulation Model (SESSM), which integrates AIS, ship emission models and GIS to map and assess ship emissions in real time, explore mitigation scenarios and perform spatial analyses, such as speed reduction buffering and emissions simulation in the port of Keelung, Taiwan. In Egypt, an open-source GIS model was used to monitor oil spills, integrating Sentinel-1 Synthetic Aperture Radar (SAR) data to provide near-real-time detection alerts [125]. The model identified oil spill patches of various sizes, covering approximately 2,000 km², and monitored large coastal areas. Integration with maritime traffic databases made it possible to link pollution to specific vessels, facilitating identification of those responsible and early warning.
The global maritime sector faces complex challenges, including security issues, geopolitical concerns and human rights matters. Some studies highlight the crucial role of GIS in monitoring and analysing these problems [128,129,136]. In China, an intelligent algorithm based on GIS optimised maritime traffic safety in the Bohai Sea, calculating relative positions and probabilities of encounters between vessels. This system, grounded in a traffic simulation model, enables efficient management of maritime transport through scenario analysis [136]. Based on a spatial analysis, data from the Global Integrated Shipping Information System (GISIS) were used to assess maritime accidents between 2010 and 2019, applying advanced techniques such as density mapping and hotspot analysis [128]. In conflict contexts, QGIS was used as a visual tool to assess the impact of war on the Al Hudaydah container terminal in Yemen, revealing that some ports still lack reliable information to monitor port activities [129]. On the other hand, GIS AIS and GIS data were useful for mapping the movement of fishing vessels in Taiwan, aiming to identify situations of forced labour and labour abuses [130]. However, the dependence on voluntary transmissions and issues such as the use of flags of convenience and intentional deactivation of transponders compromised the accuracy of the data obtained [130].
In the maritime-port context, future research prospects point to the development of more integrated and autonomous systems, with an emphasis on real-time analysis and the processing of large volumes of data. The improvement of tools such as PPGIS for public participation, intelligent algorithms for maritime traffic management and models for environmental monitoring represent promising fields. At the same time, there is a need to overcome technical limitations such as excessive computational time, problems of scale and spatial resolution, as well as improving data reliability in complex situations such as conflicts, when there are inconsistent voluntary transmissions or the protection of human life. Future studies should also focus on integrating GIS with other emerging technologies such as artificial intelligence and machine learning to enhance pattern detection, risk prediction and route optimisation, always considering ethical and cybersecurity issues in the collection and processing of maritime geospatial data.
4.1.3. Implementation of digital technologies and artificial intelligence
Digital transformation integrates technology and digitalisation with the internet, requiring cultural and business changes to meet regulations, increase efficiency and generate value [137,138]. Although digitalisation in the supply chain averages 43% [139], COVID-19 has accelerated this transition and boosted the market for digital solutions [140]. In the maritime-port sector, GIS has evolved with Industry 4.0, replacing traditional processes with intelligent port architecture, which is essential for the sustainable development of modern ports [137].
In this phase of digital transition, Building Information Modelling (BIM) and Digital Twin technologies, as well as software such as ArcGIS Online, QGIS, Infomap, Walktrap and Gephi, have benefited from the integration of GIS in the analysis of multiple data sets for visualisation and modelling in the maritime sector [141,142]. These tools extend their analytical capabilities and ensure greater accuracy in the representation of complex port infrastructures. Other technological concepts, such as the Internet of Things (IoT), Artificial Intelligence (AI), Machine Learning (ML) and cloud platforms, have also driven improvements in data processing, decision-making, automation, security and real-time monitoring in smart ports. IoT integration technologies have improved efficiency, automation and co-connectivity in the maritime sector. IoT has been used in Maritime Monitoring System (MMS) models for maritime traffic management in Exclusive Economic Zones (EEZ) [143], in satellite communication for monitoring and tracking refrigerated containers [144], and in analysing security threats and vulnerabilities in port environments [145,146], reviewed the application of IoT in the maritime sector, and concluded that the Fourth Industrial Revolution, driven by IoT, AI, Big Data Analytics and Cloud Computing, has significantly reshaped the industry. The trends point to improvements in data quality, greater information security, optimisation of maritime operations, advances in interoperability and the integration of AI and ML for prediction and automation. With the advance of AI, ML is gaining reliability among stakeholders because it is a tool capable of communicating with various types of devices and data types (interoperability) in a port environment [147]. An ML is capable of processing large volumes of data and multiple variables simultaneously, based on learning, making it an essential tool for analysing spatial data [148].
In particular, ML has established itself in the literature as a transformative tool for the maritime-port industry, offering innovative solutions for analysing complexity in management and creating significant opportunities for optimising productivity, operational efficiency and sustainability in the sector. When integrated with GIS, these technologies have proven to be a trend in various areas of port operations. In analysing and predicting vessel trajectories, for example, Alizadeh et al. [149], implemented multiple models, including Point-based similarity search prediction (PSSP), Trajectory-based similarity search prediction (TSSP) and LSTM-based prediction (TSSPL), demonstrating the effectiveness of different predictive techniques. Ship movement can also be predicted using AIS geographic data and very high frequency (VHF) technology, providing a robust monitoring system [150].
In ship classification and hinterland analysis, Huang et al. [151] achieved 97% accuracy in ship classification using XGBoost and Random Forest (RF) algorithms in the Changhua Wind Farm Channel, which is essential for identifying abnormal ship behaviour. A multi-layered decision tree model was also used to analyse the interior of major Indian ports, integrating GIS visualisations and data extraction methods to better understand the interactions between production centres and physical spaces [118]. The decision tree model, due to its non-parametric nature, was effective in handling various types of variables and data distributions. To achieve the Sustainable Development Goals in the Logistics 4.0 era, GIS contributed to the assessment of operational dynamics of maritime supply chains in Vietnam [152]. When using artificial neural networks integrated with geographic data converted into GIS, the ANN3 model showed superior performance with a Root Mean Squared Percentage Error (RMSPE) of 16.1%, a Mean Percentage Error (MPE) of 1.15% and a MAPE of 7.03%. The discrete event simulation (DES) revealed variations in transport and storage costs between the models, indicating opportunities for optimising delivery times and inventory management.
In the evaluation of port performance, studies conducted at the Port of Dongjiakou, China, showed that applying an integrated grey prediction model, combined with spatial autocorrelation models and GIS, enhanced the understanding of the relationship between the port and regional economic development [153]. The developed model not only spatially correlates complex data but also establishes new paradigms for green port planning, prioritising tailored solutions that take local specificities into account and promote sustainable economic development [153]. In predicting port congestion, a deep learning model with long short-term memory (LSTM), using AIS data provided accurate predictions for operational planning [154]. At the Port of Colombo, GPS data from lorries revealed that regulating arrival patterns can optimise the utilisation of port infrastructure, improve traffic performance and reduce congestion [155]. In developing an intelligent system for port logistics, a multi-agent simulation and reinforcement learning were used, with ArcGIS geoprocessing and Tabu search algorithms [156]. The two-week simulation showed a significant reduction in transport costs and distance travelled, as well as increased lorry utilisation through resource sharing [156].
In maritime logistics, GIS were used to analyze the resilience of port networks, focusing on transport alliances in the global maritime container network (GMCN) [157]. The study demonstrated that GIS are effective tools in the spatial visualization of possible disruptions in the maritime network, allowing stakeholders to make anticipatory decisions through the identification of critical nodes, simulation of interruption scenarios, and prioritization of strategic investments [157]. Such measures can ensure operational integrity during crises and improve response to emerging risks. Based on an ML model, using LSTM, a recurrent neural network (RNN), to predict three weeks in advance the weekly movement of dry bulk cargo in ports [158]. The model demonstrated high accuracy (approximately 10% MAPE) in forecasting iron ore exports from Australian and Brazilian ports in the second half of 2019, using geographic data from AIS. The model maintained its effectiveness even during the instability of the COVID-19 pandemic [158].
In maritime surveillance, a WebGIS interface was developed to monitor illegal vessels using data from the Sentinel-1 satellite, optical images from EROS-B, and GEC-level images from Cosmo-SkyMed (CSK). Vessel classification was performed using the K-NN (K-nearest neighbours) classifier, which proved effective in detecting the analysed vessels [159]. A WebGIS interface integrated with the OSIRIS system was used to assess maritime traffic using remote sensing data [160]. Vessel classification, performed with the RF algorithm, achieved an overall accuracy of 64%. Performance improved significantly with data from the Cosmo-SkyMed and TerraSAR-X satellites due to their higher SAR resolution [160].
In the area of maritime collision prediction and analysis, various studies such as Rawson et al. [161] developed risk models using RF algorithms to predict critical passing distances between vessels under multiple conditions. In a subsequent study, Rawson et al. [162] expanded the research by applying XGBoost and RF algorithms for spatial modelling of collision risk. Complementarily, another study by Rawson et al. [163] implemented the Discrete Global Grid System (DGGS) for managing large volumes of heterogeneous data, including vessel traffic, metoceanographic and bathymetric data, demonstrating computational advantages in accident prediction. On the other hand, ML can assist in predicting incidents in extreme weather conditions. Rawson et al. [164] developed predictive models to monitor ship safety during these events, specifically during the US Atlantic hurricane season. Using Support Vector Machines (SVM), the model achieved a Recall of 95% and Precision of 92%. GIS has also been employed for crisis management as was done for the Port of Jazan, Saudi Arabia. On the other hand, an integrative model combining the fuzzy hierarchical analysis process with the emotional artificial neural network (FAHP-EANN) allowed for a holistic assessment of port risks through a risk zoning map [165]. This system made it possible to identify critical areas for decision-making and preventive planning.
In marine ecosystem monitoring, a review examined the use of remote sensing and machine learning to identify oil spills. The integration of GIS as a platform remains a significant challenge [166], and there is no consensus on the best techniques and algorithms for detection. Additionally, factors such as sensor characteristics, weather conditions, and analysis methodologies can significantly impact model performance [166]. Najafizadegan et al. [167] developed a comparative approach using SVM, RF and Convolutional Neural Network (CNN) to detect, track and analyse oil spills in the Persian Gulf with Sentinel-1 SAR data. The results showed that the CNN model obtained the highest accuracy (95.8%), outperforming RF (86.0%) and SVM (78.9%), highlighting the potential of machine learning (ML) techniques for environmental monitoring and rapid response to oil spills. The other study on interpolation methods to create Digital Depth Models (DDMs) on bathymetric surfaces, evaluating deterministic interpolators (Inverse Distance Weighting - IDW), probabilistic (Universal Kriging and Fixed Rank Kriging - FRK) and ML-based methods (Random Forest - RF, Gradient Boosting Machines - GBM and Support Vector Machines - SVM) [168]. The results showed that Universal Kriging had the best overall performance, whilst RF outperformed GBM and SVM among ML methods. FRK, despite having the worst performance, was computationally viable.
According to the World Economic Forum [169], despite the great potential for digitalisation in supply chains, 90% of sector leaders face a talent deficit to achieve their digital transformation goals. The integration of GIS with ML emerges as an emerging trend in the maritime-port sector, presenting positive results in areas such as vessel trajectory prediction, port congestion management, ship classification and environmental monitoring. Models such as LSTM, RF, XGBoost and neural networks have achieved good accuracy, improving productivity and sustainability in the sector. However, data heterogeneity and lack of consensus on the ideal model still represent challenges, mainly due to the diversity of data sources and spatial variables. The complete integration of port and maritime management with GIS remains a complex challenge that demands more research.
4.1.4. Challenges and Trends in Maritime Information System Management
The literature analysis highlights the challenges in maritime information system management, particularly regarding data quality, information security, and adaptation to technological innovations. Although SDIs and GIS are essential for efficiently managing large volumes of data, there is a gap in the development of integrated solutions that promote transparency and sharing among maritime-port sector stakeholders. Future trends indicate the development of tools better adapted to stakeholder needs, aiming to improve port management efficiency and drive digital transformation in logistics and transportation sectors. This also contributes to environmental sustainability, optimizing processes and promoting more robust decision-making, essential for the modernization and global competitiveness of the port sector.
The implementation of a Marine SDI in the Aegean Archipelago (Greece) faced challenges due to difficulties in collecting and homogenizing inter-organisational data, aggravated by the lack of metadata and data inconsistencies. This was attributed to the low level of adoption of the INSPIRE Directive, compromising the quality of information for MSP [92]. The THAL CHOR 2 project also faced problems related to updating and providing high-quality data within the timeframe, essential for Marine SDI acceptance. In developing a webGIS application for MSP, the main limitations were restricted stakeholder participation, lack of data, and high costs for relocating activities, in addition to internal tensions generated by communication with stakeholders [104]. Nevertheless, webGIS tools have the potential to strengthen the participation of managers and decision-makers, aligning with the recommendations of the European Commission technical study [104].
Commercial platforms such as ArcGIS Server and GeoMedia WebMap face interoperability limitations due to the diversity of geospatial models and representations [170]. Data sharing is hindered by a lack of knowledge about existing datasets, intellectual property issues, pricing, and deficiencies in metadata [171]. Incompatibility between systems, the absence of incentives, and the lack of adequate guidelines for integrating different types of data amplify these challenges. Additionally, obstacles such as organisational resistance and technical limitations complicate the implementation of these platforms. Gourmelon et al. [172] emphasise that the integration of GIS with traditional maritime monitoring systems requires a redesign to improve operational efficiency, especially in big data management and the development of dynamic and interactive platforms.
An additional challenge is the manipulation of real-time data, including storage, modelling, analysis and visualisation, due to architectures not optimised for dynamic phenomena [33,173,174]. The implementation of geospatial data in the maritime sector also varies according to the specific digitalisation objectives and timelines of each port [175]. The literature highlights that the effective implementation of GIS depends on access to robust databases, essential for the development of applications that integrate geospatial information. This integration allows corporate data to be converted into georeferenced layers, enabling advanced spatial analyses through interactive digital maps, transforming how organisations and stakeholders visualise and interpret their strategic information.
The implementation of GIS in port monitoring sensors faces challenges such as the complexity of representing and analysing multidimensional data in real-time, integrating heterogeneous information from different sensors, and dealing with scalability limitations in processing large volumes of data. Additionally, hardware and software constraints affect costs and infrastructure, while interoperability problems with other systems and the need for technical training of users hinder its adoption [109]. Fernández et al. [110], when developing a big data management platform with FIWARE, identified limitations in reliability, scalability, and speed of data processing to support the user interface. However, the authors projected future improvements in data transfer rates and usability, in addition to implementing advanced features such as forecasting systems and automatic control, leveraging the existing database [110]. The GIS-based intelligent algorithm for maritime traffic modelling required high computational power, resulting in slow execution of the agent-based simulation model [136]. The integration of geospatial technologies, while improving data management and port operational efficiency, faces cybersecurity challenges, especially when incorporating artificial intelligence in international operations. Vulnerabilities include communication system breaches and sensor manipulation, aggravated by the lack of standardised legal frameworks for autonomous operations across different jurisdictions, which demands solutions for regulatory navigation, cyber security, and adequate infrastructure [176].
The GIS also has limitations in container terminals, especially regarding the capture of cargo mobility and content [129]. The research demonstrated that GIS was primarily restricted to spatial occupation analysis, allowing geographical comparisons, but not enabling direct analyses in terms of TEUs (Twenty-foot Equivalent Units). The researchers concluded that the effectiveness of GIS is intrinsically conditioned by the availability and quality of input data, such as high-resolution satellite images and accurate navigation information. On the other hand, complementary studies by Chou et al. [119] revealed that the integration of different types of geospatial data presents additional challenges, being highly dependent on external data, such as AIS. This dependence hindered a comprehensive risk assessment in maritime accident studies, while the necessary categorisation and simplification of information resulted in loss of detail. In these applications, GIS demonstrated greater efficiency in analysing historical patterns than in predicting future accidents [119]. Additionally, the difficulty in integrating complex environmental data, such as meteorological and oceanographic factors, considerably limited the accuracy of port risk analyses.
The effective visualisation of data was another identified obstacle. Maritime traffic control operators need to interpret multiple simultaneous vessel movements, requiring clear and intuitive visual representations. Although AIS data is available in real-time, its integration with meteorological and topographical information could enrich the understanding of navigation conditions and maritime safety [114]. Similarly, 3D route analysis faced difficulties in integrating sea ice data in irregular grids, which cannot be displayed directly on 3D GIS platforms such as Cesium [120]. The diversity of formats and resolutions of these data made analysis and visualisation difficult, and the high processing required by Big Earth Data imposed barriers to real-time navigation. Additionally, 2D maps proved inadequate for the Arctic due to area distortions and navigation difficulties. The 3D GIS of the SNISS platform was essential for optimising routes with cloud computing support [120].
In the assessment of NO₂ impacts from the maritime sector, obtaining precise geospatial data was an obstacle, especially in remote areas with limited data coverage. The applied models required specific technical skills, making the integration of different sources complex [124]. Similarly, in the analysis of ship emissions, the need for updated data, adequate technical training and the inability of GIS to consider dynamic factors, such as operational costs and real-time weather conditions, were significant limitations [127]. Likewise, monitoring based on Sentinel-1 SAR data also presented restrictions. Despite the ability to detect oil spills, its effectiveness was reduced in adverse conditions, such as, fog and darkness, requiring integration with other information sources, such as maritime traffic data [125].
Despite advances in the integration of GIS in maritime data management systems, the complexity of maritime information systems still hampers improvements in data analysis quality, security and adaptation to technological innovations. There are limitations in areas such as accessibility, visualisation and manipulation of spatial data, in addition to the lack of updated and reliable information. The development of efficient SDI and GIS is essential to expand access to and use of large volumes of data, but the literature shows little application in the maritime-port sector, especially in collaborative and integrative software for information transparency among stakeholders. Moreover, legal and operational restrictions limit the effectiveness of these tools, highlighting the need for technological and methodological advances to optimise the monitoring of maritime activities. The literature points to a growing trend of GIS integration in management platforms, aligning with the energy and digital transition, which strengthens the development of innovative solutions that meet stakeholder needs, boosting efficiency, safety, and decision-making with environmental sustainability in the logistics, transport and mobility sectors.
5. Conclusions
The bibliometric analysis, conducted on scientific articles from the last decade concerning GIS and SDI in the maritime-port sector, provided a comprehensive overview of the main application areas of GIS. The study revealed an annual growth rate of 8.59% in publications, highlighting the implementation of GIS as an emerging trend to optimise operations and safety. Research has focused on areas such as environmental monitoring, machine learning, remote sensing data analysis, visualisation, management, risk assessment, and stakeholder engagement. Since 2022, the topics of spatial analysis, data visualisation, and sustainability, with an emphasis on energy and digital transition, have been the primary research focuses, reflecting the interest of the involved stakeholders.
The thematic evolution in the maritime-port sector shows that the implementation of emerging technologies and sustainability are advancing together to meet the growing demand for digitalisation and optimisation of port management. Keywords such as GIS, "machine learning," and "maritime" stand out as main themes, reflecting high relevance and development, which indicates their priority. Meanwhile, terms like "sustainability," "environmental monitoring," and "management system" are fundamental, remaining as essential themes. "Spatial analysis" and "optimisation" have lower centrality and are still developing. Although "stakeholders" and "environmental" are specialised niches, this classification may indicate an opportunity for further research focused on stakeholder needs, suggesting areas that could be further explored.
The bibliometric analysis revealed that, despite its strategic relevance, the implementation of Marine SDI remains limited, particularly in terms of its potential for interoperability and integrated data analysis. GIS has been underutilised, primarily employed for visualisation and monitoring, with few studies exploring its integration into collaborative data management platforms. Although essential for various applications in the maritime industry, such as ship monitoring, global accidents, and impact assessments, the potential of GIS is not being fully leveraged in port data management.
Future research should focus on the same topic as this article, but with a comprehensive assessment of the management and sharing of geospatial information between seaports and the external community. The careful analysis of the level of transparency and accessibility of information is intended to investigate the strategic challenges inherent in the voluntary provision of geospatial datasets. The proposal provides an understanding of the different hierarchical levels of visualisation of geographic components that exist between the general public and internal port stakeholders. In this context, port websites will be examined as initial focal points of information access, enabling an in-depth analysis of how these digital platforms can be strategically utilised to promote institutional transparency. The initiative of sharing geospatial information with external communities represents a fundamental strategy that transcends merely operational aspects. Such an approach demonstrates significant potential to optimise port asset management, expand organisational transparency levels, contribute to environmental sustainability strategies, and maximise value for stakeholders and society in general.
Author Contributions
C.I. and M.T.F.B. provided the initial concept, research design, data collection, and analysis approach and wrote the manuscript. C.I and F.R.F.C. helped with data collection and analysis approach. C.I. and M.T.F.B helped revise the manuscript. All authors have read and agreed to the published version of the manuscript.
Funding
This work is funded by the Agenda “NEXUS—Pacto de Inovação—Transição Verde e Digital para Transportes, Logística e Mobilidade”, financed by the Portuguese Recovery and Resilience Plan (PRR), under no. C645112083-00000059 (investment project no. 53).
Data Availability Statement
The original contributions presented in the study are included in the article, further inquiries can be directed to the corresponding author.
Acknowledgments
We express our sincere gratitude to the Administração dos Portos de Sines e do Algarve (APS) for providing access to the necessary data and to the NEXUS Agenda for ena-bling our participation in this significant project.
Conflicts of Interest
The authors declare no conflicts of interest.
References
- United Nations. Global Maritime Trade Could Suffer Biggest Decline in Decades in 2023. Available online: https://news.un.org/en/ (accessed on 26 December 2024).
- Wu, F.; Bai, J.; Zhu, B.; Ma, W.; Sun, J.; Zheng, G. Reviewing Geo-Information Science for Port Information Management in China. In Proc. ICTIS 2013: Improving Multimodal Transp. Syst.—Information, Safety, and Integration, Chengdu, China, 2013; American Society of Civil Engineers: Reston, VA, USA, 2013; pp. 2139-2145. [CrossRef]
- Ray, Cyril; Dréo, Richard; Camossi, Elena; Jousselme, Anne-Laure; Iphar, Clément. Heterogeneous Integrated Dataset for Maritime Intelligence, Surveillance, and Recon-naissance. Data Brief 2019, 25, 104141. [CrossRef]
- Zrodowski, C.; Kniat, A.; Pyszko, R. Geographic Information System (GIS) Tools for Aiding Development of Inland Waterways Fleet. Pol. Marit. Res. 2006, 13(S2), 102–112. Available online: https://journal.mostwiedzy.pl/pmr/article/view/1269 (accessed on 12 November 2024).
- McCabe, R.; Flynn, B. Under the radar: Ireland, maritime security capacity, and the governance of subsea infrastructure. Eur. Secur. 2023, 33, 324–344. [CrossRef]
- Ovando, Daniel; Bradley, Darcy; Burns, Echelle; Thomas, Lennon; Thorson, James T. Simulating Benefits, Costs and Trade-offs of Spatial Management in Marine Social-ecological Systems. Fish Fish. 2023. [CrossRef]
- Bonnevie, Ida Maria; Hansen, Henning Sten; Schrøder, Lise. SEANERGY - A Spatial Tool to Facilitate the Increase of Synergies and to Minimise Conflicts Between Human Uses at Sea. Environ. Model. Softw. 2020. [CrossRef]
- Kao, Sheng-Long; Chang, Ki-Yin; Hsu, Tai-Wen. A Marine GIS-based Alert System to Prevent Vessels Collision with Offshore Platforms. J. Mar. Sci. Technol. 2021. [CrossRef]
- Wang, Lipeng; Zhang, Zhi; Zhu, Qidan; Ma, Shan. Ship Route Planning Based on Dou-ble-Cycling Genetic Algorithm Considering Ship Maneuverability Constraint. IEEE Ac-cess 2020. [CrossRef]
- Fagerholt, Kjetil; Lindstad, Haakon. TurboRouter: An Interactive Optimization-Based Decision Support System for Ship Routing and Scheduling. Mar. Econ. Logist. 2007, 9, 214-233. [CrossRef]
- Dong, Z.; Zhou, Y.; Bao, X. A Short-Term Vessel Traffic Flow Prediction Based on a DBO-LSTM Model. Sustainability. 2024, 16, 5499. [CrossRef]
- Huang, I.-L.; Lee, M.-C.; Chang, L.; Huang, J.-C. Development and Application of an Advanced Automatic Identification System (AIS)-Based Ship Trajectory Extraction Framework for Maritime Traffic Analysis. J. Mar. Sci. Eng. 2024, 12, 1672. [CrossRef]
- Veldman, S.; Buckmann, E. A model on container port competition : an application for the West European container hub-ports. Marit. Econ. Logist. 2003, 5, 3–22. [CrossRef]
- Benedecti, R.C.; Silva, V.M.D.; da Costa, G.A.A. Integrated simulation of an inland container terminal and waterway service for enhancing the maritime supply chain connectivity between Joinville and Itapoá Port. Lat. Am. Transp. Stud. 2024, 2, 100019. [CrossRef]
- Önden, İ.; Pamucar, D.; Deveci, M.; As, Y.; Birol, B.; Yıldız, F.Ş. Prioritization of transfer centers using GIS and fuzzy Dombi Bonferroni weighted Assessment (DOBAS) model. Expert Syst. Appl. 2024, 238, 121827. [CrossRef]
- Claramunt, C.; Devogele, T.; Fournier, S.; Noyon, V.; Petit, M.; Ray, C. Maritime GIS: From monitoring to simulation systems. In Information Fusion and Geographic Information Systems, Lecture Notes in Geoinformation and Cartography; Popovich, V.V., Schrenk, M., Korolenko, K.V., Eds.; Springer: Berlin/Heidelberg, Germany, 2007; pp. 34–44. [CrossRef]
- Chen, Q.; Zhang, H.; Lau, Y.-Y.; Liu, K.; Ng, A.K.Y.; Chen, W.; Liao, Q.; Dulebenets, M.A. A Geographic Information System (GIS)-Based Investigation of Spatiotemporal Characteristics of Pirate Attacks in the Maritime Industry. J. Mar. Sci. Eng. 2023, 11, 2295. [CrossRef]
- Halder, B.; Juneng, L.; Abdul Maulud, K.N.; et al. Remote Sensing-Based Decadal Landform Monitoring in Island Ecosystem. J. Coast. Conserv. 2024, 28, 74. [CrossRef]
- Guo, Z.; Qiao, Y.; Umprasoet, W.; Sun, Y.; Plathong, S.; Jantharakhantee, C.; Zhang, Z. Integrating Issue-Oriented Solution of Marine Spatial Planning (MSP): A Case Study of Koh Sichang in Thailand. Ocean Coast. Manag. 2024, 258, 107381. [CrossRef]
- Huang, Z.; Nanson, R.A.; McNeil, M.; Wenderlich, M.; Gafeira, J.; Post, A.L.; Nichol, S.L. Rule-Based Semi-Automated Tools for Mapping Seabed Morphology from Bathymetry Data. Front. Mar. Sci. 2023. [CrossRef]
- Parra, L. Remote Sensing and GIS in Environmental Monitoring. Appl. Sci. 2022, 12, 8045. [CrossRef]
- Photis, M.; Panayides, M.; Song, D.-W. Port Integration in Global Supply Chains: Measures and Implications for Maritime Logistics. Int. J. Logist. Res. Appl. 2009, 12, 133–145. [CrossRef]
- Manikandan, J.; Mangaiyarkarasi, V.; Mahalakshmi, S.; Sandhiya, Karthigeyan, G.; Var-sha, G. Development of an Integrated Water Body Surveillance System for Environmen-tal Monitoring and Resource Management. Proceedings of IC3IoT. 2024. 1–5. doi:10.1109/ic3iot60841.2024.10550378.
- Huang, I.-L.; Lee, M.-C.; Chang, L.; Huang, J.-C. Development and Application of an Advanced Automatic Identification System (AIS)-Based Ship Trajectory Extraction Framework for Maritime Traffic Analysis. J. Mar. Sci. Eng. 2024, 12, 1672. [CrossRef]
- Zhang, Z.; Song, C.; Zhang, J.; Chen, Z.; Liu, M.; Aziz, F.; Yap, P.S. Digitalization and Innovation in Green Ports: A Review of Current Issues, Contributions and the Way Forward in Promoting Sustainable Ports and Maritime Logistics. Sci. Total Environ. 2024, 912, 169075. [CrossRef]
- Hasan, K.R.; Zhang, W.; Shi, W. A Sustainable Port-Hinterland Container Transport System: The Simulation-Based Scenarios for CO2 Emission Reduction. Sustainability. 2023, 15, 9444. [CrossRef]
- Buonomano, A.; Del Papa, G.; Giuzio, G.F.; Palombo, A.; Russo, G. Future Pathways for Decarbonization and Energy Efficiency of Ports: Modelling and Optimization as Sustainable Energy Hubs. J. Clean. Prod. 2023, 420, 138389. [CrossRef]
- Sarabia-Jácome, D.; Palau, C.E.; Esteve, M.; Boronat, F. Seaport Data Space for Improving Logistic Maritime Operations. IEEE Access. 2020, 8, 4372–4382. [CrossRef]
- Marine Traffic – AIS Data. Available online: https://www.marinetraffic.com/ (accessed on 30 April 2024).
- ECDIS. Maritime Navigation Specialists. Available online: https://ecdis.org/ (accessed on 30 April 2024).
- MDA. Situational Indication Linkages. Available online: https://www.msil.go.jp/msil/htm/main.html?Lang=1 (accessed on 30 April 2024).
- Lam, S.Y.W.; Yip, T.L. The Role of Geomatics Engineering in Establishing the Marine Information System for Maritime Management. Marit. Policy Manag. 2008, 35(1), 53–60. [CrossRef]
- Schmidt, S.; Maudire, G.; Nys, C.; Sudre, J.; Harscoat, V.; Dibarboure, G.; Huynh, F. Streamlining Data and Service Centers for Easier Access to Data and Analytical Services: The Strategy of ODATIS as the Gateway to French Marine Data. Front. Mar. Sci. 2020. 7:548126,1-10. [CrossRef]
- Emani, C.K.; Cullot, N.; Nicolle, C. Big Data Understandable: A Survey. Comput. Sci. Rev. 2015, 17, 70–81. [CrossRef]
- Tavra, M.; Jajac, N.; Cetl, V. Marine Spatial Data Infrastructure Development Framework: Croatia Case Study. ISPRS Int. J. Geo-Inf. 2017, 6, 117. [CrossRef]
- Scarlat, C.; Ioanid, A.; Andrei, N. Use of the Geospatial Technologies and Its Implications in the Maritime Transport and Logistics. Int. Marit. Transp. Logist. J. 2023, 12, 19–30. [CrossRef]
- Fernández, P.; Santana, J.M.; Ortega, S.; Trujillo, A.; Suárez, J.P.; Domínguez, C.; Santana, J.; Sánchez, A. SmartPort: A Platform for Sensor Data Monitoring in a Seaport Based on FIWARE. Sensors. 2016, 16, 417. [CrossRef]
- Thomas, R.; Idol, T. Development of Spatial Data Infrastructures for Marine Data Management; OGC-IHO Marine SDI Concept Development Study (CDS). Available online: https://repository.oceanbestpractices.org/handle/11329/1551 (accessed on 30 April 2024).
- Lu, B.; Xu, X. Digital Transformation and Port Operations: Optimal Investment Under Incomplete Information. Transp. Policy. 2024, 151, 134–146. [CrossRef]
- Lytra, I.; Vidal, M.-E.; Orlandi, F.; Attard, J. A Big Data Architecture for Managing Oceans of Data and Maritime Applications. Proc. ICE/ITMC 2017. 2017, 1216–1226. [CrossRef]
- Erasmus University. SmartPort. Available online: http://www.erim.eur.nl/research/centres/smart-port/ (accessed on 30 April 2024).
- Hamburg Port Authority. SmartPORT Logistics. Available online: http://www.hamburg-port-authority.de/en/smartport/logistics/ (accessed on 30 April 2024).
- Nexus Lab. Nexus Agenda Project. Available online: https://nexuslab.pt/ (accessed on 30 April 2024).
- Tanger Med Port Authority. Vessel Reception Services. Available online: https://www.tangermedport.com/en/service/vessel-reception/ (accessed on 30 April 2024).
- Paraskevas, A.; Madas, M.; Zeimpekis, V.; Fouskas, K. Smart Ports in Industry 4.0: A Systematic Literature Review. Logistics 2024, 8, 28. [CrossRef]
- Jiang, M.; Feng, J.; Zhou, J.; Zhou, L.; Ma, F.; Wu, G.; Zhang, Y. Multi-Terminal Berth and Quay Crane Joint Scheduling in Container Ports Considering Carbon Cost. Sustainability. 2023, 15, 5018. [CrossRef]
- Farah, M.B.; Ahmed, Y.; Mahmoud, H.; Shah, S.A.; Al-Kadri, M.O.; Taramonli, S.; Bellekens, X.; Abozariba, R.; Idrissi, M.; Aneiba, A. A survey on blockchain technology in the maritime industry: Challenges and future perspectives. Future Gener. Comput. Syst. 2024, 157, 618–637. [CrossRef]
- Bashir, K.; Rawat, D.B.; Wu, J.; Imran, M.A. Guest Editorial: Security, Reliability, and Safety in IoT-Enabled Maritime Transportation Systems. IEEE Trans. Intell. Transp. Syst. 2023, 24, 2275–2281. [CrossRef]
- Zeneli, M.; Marinova, G. Navigating the Future: Digital Twin in Maritime Industry. In Proceedings of the 2024 International Conference on Broadband Communications for Next Generation Networks and Multimedia Applications (CoBCom). 2024,1–6. [CrossRef]
- Kavallieratos, G.; Diamantopoulou, V.; Katsikas, S.K. Shipping 4.0: Security Requirements for the Cyber-Enabled Ship. IEEE Trans. Ind. Inform. 2020, 16(10), 6617–6625. [CrossRef]
- Wang, K.; Hu, Q.; Zhou, M.; Zun, Z.; Qian, X. Multi-Aspect Applications and Development Challenges of Digital Twin-Driven Management in Global Smart Ports. Case Stud. Transp. Policy. 2021, 9, 1298–1312. [CrossRef]
- Donthu, N.; Kumar, S.; Mukherjee, D.; Pandey, D.; Weng, M.L. How to Conduct a Bibliometric Analysis: An Overview and Guidelines. J. Bus. Res. 2021, 133, 285–296. [CrossRef]
- Denyer, D.; Tranfield, D. Producing a systematic review. In The Sage Handbook of Organizational Research Methods; Buchanan, D., Bryman, A., Eds.; Sage Publications Ltd.: London, UK, 2009 ; pp. 671–689. Available online:https://books.google.com.br/books?hl=ptPT&lr=&id=vVs2EoDjm78C&oi=fnd&pg=PP1&dq=In+The+Sage+Handbook+of+Organizational+Research+Methods&ots=8S17tOPDUJ&sig=vKV7t8ZfSWr3FlEXcUbnMVJLphU (accessed on 30 April 2024).
- Pranckutė, R. Web of Science (WoS) and Scopus: The Titans of Bibliographic Information in Today’s Academic World. Publications. 2021, 9, 12. [CrossRef]
- Aria, M.; Cuccurullo, C. Bibliometrix: An R-Tool for Comprehensive Science Mapping Analysis. J. Informetrics. 2017, 11(4), 959–975. [CrossRef]
- Ampah, J.D.; Yusuf, A.A.; Afrane, S.; Jin, C.; Liu, H. Reviewing Two Decades of Cleaner Alternative Marine Fuels: Towards IMO's Decarbonization of the Maritime Transport Sector. J. Clean. Prod. 2021, 320, 128871. [CrossRef]
- Gutiérrez-Salcedo, M.; Martínez, M.Á.; Moral-Muñoz, J.A.; Herrera-Viedma, E.; Cobo, M.J. Some Bibliometric Procedures for Analyzing and Evaluating Research Fields. Appl. Intell. 2018, 48, 1275–1287. [CrossRef]
- Moshiul, A.M.; Mohammad, R.; Hira, F.A.; Maarop, N. Alternative Marine Fuel Research Advances and Future Trends: A Bibliometric Knowledge Mapping Approach. Sustainability. 2022, 14, 4947. [CrossRef]
- Linnenluecke, M.K.; Marrone, M.; Singh, A.K. Conducting Systematic Literature Reviews and Bibliometric Analyses. Aust. J. Manag. 2020, 45(2), 175–194. [CrossRef]
- Web of Science – WoS. WoS Search. Available online: https://www.webofscience.com/ (accessed on 23 December 2024).
- Scopus. Scopus Search. Available online: https://www.sciencedirect.com/ (accessed on 23 December 2024).
- Chadegani, A.A.; Salehi, H.; Md Yunus, M.M.; Farhadi, H.; Fooladi, M.; Farhadi, M.; Ale Ebrahim, N. A Comparison between Two Main Academic Literature Collections: Web of Science and Scopus Databases. Asian Soc. Sci. 2013, 9, 18–26. http://dx.doi.org/10.5539/ass.v9n5p18.
- Mingers, J.; Leydesdorff, L. A Review of Theory and Practice in Scientometrics. Eur. J. Oper. Res. 2015, 246, 1–19. [CrossRef]
- Fahimnia, B.; Sarkis, J.; Davarzani, H. Green Supply Chain Management: A Review and Bibliometric Analysis. Int. J. Prod. Econ. 2015, 162, 101–114. [CrossRef]
- Tranfield, D.; Denyer, D.; Smart, P. Towards a Methodology for Developing Evidence-Informed Management Knowledge by Means of Systematic Review. Br. J. Manag. 2003, 14, 207–222.
- Mongeon, P.; Paul-Hus, A. The Journal Coverage of Web of Science and Scopus: A Comparative Analysis. Scientometrics. 2016, 106, 213–228. [CrossRef]
- Santos, J.S.d.; Parise, C.K.; Duarte, L.; Teodoro, A.C. Bibliometric Analysis of Global Research on Port Infrastructure Vulnerability to Climate Change (2012–2023): Key Indices, Influential Contributions, and Future Directions. Sustainability. 2024, 16, 8622. [CrossRef]
- Barianaki, E.; Kyvelou, S.S.; Ierapetritis, D.G. How to Incorporate Cultural Values and Heritage in Maritime Spatial Planning: A Systematic Review. Heritage. 2024, 7, 380–411. [CrossRef]
- Jović, M.; Tijan, E.; Brčić, D.; Pucihar, A. Digitalization in Maritime Transport and Seaports: Bibliometric, Content and Thematic Analysis. J. Mar. Sci. Eng. 2022, 10, 486. [CrossRef]
- Morales-Alarcón, C.H.; Bodero-Poveda, E.; Villa-Yánez, H.M.; Buñay-Guisñan, P.A. Blockchain and Its Application in the Peer Review of Scientific Works: A Systematic Review. Publications. 2024, 12, 40. [CrossRef]
- Bibliometrix. Bibliometrix Home. Available online: https://www.bibliometrix.org/home/ (accessed on 26 December 2024).
- Moral-Muñoz, J.; Herrera-Viedma, E.; Santisteban-Espejo, A.; Cobo, M. Software Tools for Conducting Bibliometric Analysis in Science: An Up-to-Date Review. Prof. Inf. 2020, 29, e290103. [CrossRef]
- McLaren, C.D.; Bruner, M.W. Citation Network Analysis. Int. Rev. Sport Exerc. Psychol. 2022, 15, 179–198. [CrossRef]
- Caputo, A.; Kargina, M. A User-Friendly Method to Merge Scopus and Web of Science Data During Bibliometric Analysis. J. Mark. Anal. 2022, 10, 82–88. [CrossRef]
- Kumar, R.; Rani, S.; Awadh, M.A. Exploring the Application Sphere of the Internet of Things in Industry 4.0: A Review, Bibliometric and Content Analysis. Sensors. 2022, 22, 4276. [CrossRef]
- Thangavel, P.; Chandra, B. Two Decades of M-Commerce Consumer Research: A Bibliometric Analysis Using R Biblioshiny. Sustainability. 2023, 15, 11835. [CrossRef]
- Sheela, S.; Alsmady, A.A.; Tanaraj, K.; Izani, I. Navigating the Future: Blockchain’s Impact on Accounting and Auditing Practices. Sustainability. 2023, 15, 16887. [CrossRef]
- David, L.O.; Nwulu, N.; Aigbavboa, C.; Adepoju, O. Towards Global Water Security: The Role of Cleaner Production. Clean. Eng. Technol. 2023, 10, 100695. [CrossRef]
- Alka, T.A.; Raman, R.; Suresh, M. Research Trends in Innovation Ecosystem and Circular Economy. Discov. Sustain. 2024, 5, 323. [CrossRef]
- Silva, M.d.S.T.; de Oliveira, V.M.; Correia, S.É.N. Scientific Mapping in Scopus with Biblioshiny: A Bibliometric Analysis of Organizational Tensions. Context. Rev. Contemp. Econ. Gestão. 2022, 20, 54–71.
- Bibliometrix. Frequently Asked Questions. Available online: https://www.bibliometrix.org/home/index.php/faq# (accessed on 30 December 2024).
- Systematic Reviews and Meta-Analyses (PRISMA). PRISMA Statement. Available online: https://www.prisma-statement.org/ (accessed on 26 December 2024).
- Yusop, S.R.M.; Rasul, M.S.; Mohamad Yasin, R.; Hashim, H.U.; Jalaludin, N.A. An Assessment Approaches and Learning Outcomes in Technical and Vocational Education: A Systematic Review Using PRISMA. Sustainability. 2022, 14, 5225. [CrossRef]
- Moher, D.; Shamseer, L.; Clarke, M.; et al. Preferred Reporting Items for Systematic Review and Meta-Analysis Protocols (PRISMA-P) 2015 Statement. Syst. Rev. 2015, 4, 1. [CrossRef]
- Page, M.J.; McKenzie, J.E.; Bossuyt, P.M.; Boutron, I.; Hoffmann, T.C.; Mulrow, C.D.; et al. The PRISMA 2020 Statement: An Updated Guideline for Reporting Systematic Reviews. The BMJ. 2021, 372, n71. [CrossRef]
- Callon, M.; Courtial, J.P.; Laville, F. Co-Word Analysis as a Tool for Describing the Network of Interactions Between Basic and Technological Research: The Case of Polymer Chemistry. Scientometrics. 1991, 22, 155–205. [CrossRef]
- Cobo, M.J.; López-Herrera, A.G.; Herrera-Viedma, E.; Herrera, F. An Approach for Detecting, Quantifying, and Visualizing the Evolution of a Research Field: A Practical Application to the Fuzzy Sets Theory Field. J. Informetr. 2011, 5, 146–166. [CrossRef]
- Meyer, N.; Ben Said, F.; Alkathiri, N.A.; et al. A Scientometric Analysis of Entrepreneurial and the Digital Economy Scholarship: State of the Art and an Agenda for Future Research. J. Innov. Entrep. 2023, 12, 70. [CrossRef]
- Szomszor, M.; Adams, J.; Fry, R.; Gebert, C.; Pendlebury, D.A.; Potter, R.W.K.; Rogers, G. Interpreting Bibliometric Data. Front. Res. Metr. Anal. 2021, 5, 628703. [CrossRef]
- O’Connor, H.M.; Cooper, J.A.G. Coastal and Marine Management–Navigating Islands of Data. Mar. Policy. 2024, 169, 106279. [CrossRef]
- Contarinis, S.; Nakos, B.; Pallikaris, A. Introducing Smart Marine Ecosystem-Based Planning (SMEP)—How SMEP Can Drive Marine Spatial Planning Strategy and Its Implementation in Greece. Geomatics. 2022, 2, 197–220. [CrossRef]
- Vaitis, M.; Kopsachilis, V.; Tataris, G.; Michalakis, V.I.; Pavlogeorgatos, G. The Development of a Spatial Data Infrastructure to Support Marine Spatial Planning in Greece. Ocean Coast. Manag. 2022, 218, 106025. [CrossRef]
- European Commission. INSPIRE Knowledge Base. Available online: https://knowledge-base.inspire.ec.europa.eu/overview_en (accessed on 26 December 2024).
- Abramic, A.; Bigagli, E.; Barale, V.; Assouline, M.; Lorenzo-Alonso, A.; Norton, C. Maritime Spatial Planning Supported by Infrastructure for Spatial Information in Europe (INSPIRE). Ocean Coast. Manag. 2018, 152, 23–36. [CrossRef]
- O’Connor, H.M.; Cooper, J.A.G. On the Centrality of Tenure in Spatial Data Systems for Coastal/Marine Management: International Exemplars versus Emerging Practice in Ireland. Ocean Coast. Manag. 2024, 257, 1–17. [CrossRef]
- Taramelli, A.; Valentini, E.; Sterlacchini, S. A GIS-Based Approach for Hurricane Hazard and Vulnerability Assessment in the Cayman Islands. Ocean Coast. Manag. 2015, 108, 116–130. [CrossRef]
- Giorgetti, A.; Partescano, E.; Barth, A.; Buga, L.; Gatti, J.; Giorgi, G.; Wenzer, M. EMODnet Chemistry Spatial Data Infrastructure for Marine Observations and Related Information. Ocean Coast. Manag. 2018, 166, 9–17. [CrossRef]
- Mamode, S.A.; Runghen, H.; Munnaroo, S.; Bissessur, D.; Coopen, P.; von Arnim, Y.; Badal, R. Mapping of Underwater Cultural Heritage: The Geophysical Survey and Data Management of HMS Sirius Shipwreck. In OCEANS 2022-Chennai; IEEE. 2022; 1–7. [CrossRef]
- Kazimierski, W. On Using Spatial Data Infrastructure Concept for Exchange of Navigational Information on Ships. In Proceedings of the 2017 Baltic Geodetic Congress (Geomatics); IEEE. 2017; pp. 267–272. [CrossRef]
- Ogryzek, M.; Tarantino, E.; Rząsa, K. Infrastructure of the Spatial Information in the European Community (INSPIRE) Based on Examples of Italy and Poland. ISPRS Int. J. Geo-Inf. 2020, 9, 755. [CrossRef]
- UN-GGIM. Standards Guide. Available online: https://standards.unggim.ogc.org/index.php (accessed on 12 January 2024).
- Open Geospatial Consortium. Home. Available online: https://www.ogc.org/ (accessed on 12 January 2024).
- Agrawal, S.; Gupta, R.D. Web GIS and Its Architecture: A Review. Arab. J. Geosci. 2017, 10, 518. [CrossRef]
- Patera, A.; Pataki, Z.; Kitsiou, D. Development of a WebGIS Application to Assess Conflicting Activities in the Framework of Marine Spatial Planning. J. Mar. Sci. Eng. 2022, 10, 389. [CrossRef]
- Ichimura, Y.; Dalaklis, D.; Kitada, M.; Christodoulou, A. Shipping in the Era of Digitalization: Mapping the Future Strategic Plans of Major Maritime Commercial Actors. Digit. Bus. 2022, 2, 100022. [CrossRef]
- Fast, V.; Hossain, F. An Alternative to Desktop GIS? Evaluating the Cartographic and Analytical Capabilities of WebGIS Platforms for Teaching. Cartogr. J. 2020, 57, 175–186. [CrossRef]
- Thanopoulou, H.; Patera, A.; Moresis, O.; Georgoulis, G.; Lioumi, V.; Kanavos, A.; Papadimitriou, O.; Zervakis, V.; Dagkinis, I. Supporting Informed Public Reactions to Shipping Incidents with Oil Spill Potential: An Innovative Electronic Platform. Sustainability. 2023, 15, 15035. [CrossRef]
- Dawidowicz, A.; Kulawiak, M. The Potential of Web-GIS and Geovisual Analytics in the Context of Marine Cadastre. Surv. Rev. 2017, 50, 501–512. [CrossRef]
- Fernández, P.; Santana, J.M.; Ortega, S.; Trujillo, A.; Suárez, J.P.; Santana, J.A.; Domínguez, C. Web-Based GIS Through a Big Data Open-Source Computer Architecture for Real-Time Monitoring Sensors of a Seaport. In The Rise of Big Spatial Data; Springer. 2017; pp. 41–53. [CrossRef]
- Fernández, P.; Suárez, J.P.; Trujillo, A.; Domínguez, C.; Santana, J.M. 3D-Monitoring Big Geo Data on a Seaport Infrastructure Based on FIWARE. J. Geogr. Syst. 2018, 20, 139–157. [CrossRef]
- Makris, C.; Papadimitriou, A.; Baltikas, V.; Spiliopoulos, G.; Kontos, Y.; Metallinos, A.; Androulidakis, Y.; Chondros, M.; Klonaris, G.; Malliouri, D.; et al. Validation and Application of the Accu-Waves Operational Platform for Wave Forecasts at Ports. J. Mar. Sci. Eng. 2024, 12, 220. [CrossRef]
- Park, D.; Park, S. E-Navigation-Supporting Data Management System for Variant S-100-Based Data. Multimed. Tools Appl. 2015, 74, 6573–6588. [CrossRef]
- Johansen, T.; Blindheim, S.; Torben, T.R.; Utne, I.B.; Johansen, T.A.; Sørensen, A.J. Development and Testing of a Risk-Based Control System for Autonomous Ships. Reliab. Eng. Syst. Saf. 2023, 234, 109195. [CrossRef]
- Ban, H.; Kim, H.J. Analysis and Visualization of Vessels’ Relative Motion (REMO). ISPRS Int. J. Geo-Inf. 2023, 12, 115. [CrossRef]
- Tsaimou, C.N.; Sartampakos, P.; Tsoukala, V.K. UAV-Driven Approach for Assisting Structural Health Monitoring of Port Infrastructure. Struct. Infrastruct. Eng. 2023. 1-20. [CrossRef]
- Li, M.; Mou, J.; Chen, P.; Chen, L.; van Gelder, P.H.A.J.M. Real-Time Collision Risk-Based Safety Management for Vessel Traffic in Busy Ports and Waterways. Ocean Coast. Manag. 2023, 234, 106471. [CrossRef]
- Ma, Q.; Tang, H.; Liu, C.; Zhang, M.; Zhang, D.; Liu, Z.; Zhang, L. A Big Data Analytics Method for the Evaluation of Maritime Traffic Safety Using Automatic Identification System Data. Ocean Coast. Manag. 2024, 251, 107077. [CrossRef]
- Thill, J.-C.; Venkitasubramanian, K. Multi-Layered Hinterland Classification of Indian Ports of Containerized Cargoes Using GIS Visualization and Decision Tree Analysis. Marit. Econ. Logist. 2014, 17, 265–291. [CrossRef]
- Chou, C.-C.; Wang, C.-N.; Hsu, H.-P.; Ding, J.-F.; Tseng, W.-J.; Yeh, C.-Y. Integrating AIS, GIS, and E-Chart to Analyze the Shipping Traffic and Marine Accidents at the Kaohsiung Port. J. Mar. Sci. Eng. 2022, 10, 1543. [CrossRef]
- Wu, A.; Che, T.; Li, X.; Zhu, X. A Ship Navigation Information Service System for the Arctic Northeast Passage Using 3D GIS Based on Big Earth Data. Big Earth Data. 2022, 6, 453–479. [CrossRef]
- Karountzos, O.; Kagkelis, G.; Kepaptsoglou, K. A Decision Support GIS Framework for Establishing Zero-Emission Maritime Networks: The Case of the Greek Coastal Shipping Network. J. Geovisualization Spat. Anal. 2023, 7, 16. [CrossRef]
- Agostinelli, S.; Cumo, F.; Nezhad, M.M.; Orsini, G.; Piras, G. Renewable Energy System Controlled by Open-Source Tools and Digital Twin Model: Zero Energy Port Area in Italy. Energies. 2022, 15, 1817. [CrossRef]
- Edih, U.O.; Faghawari, N.; Agboro, D.O. Port Operation’s Efficiency and Revenue Generation in Global Maritime Trade: Implications for National Growth and Development in Nigeria. J. Money Bus. 2023, 3, 184–196. [CrossRef]
- Alahmadi, S.; Al-Ahmadi, K.; Almeshari, M. Spatial Variation in the Association between NO₂ Concentrations and Shipping Emissions in the Red Sea. Sci. Total Environ. 2019, 676, 131–143. [CrossRef]
- El-Magd, I.A.; Mohamed, Z.; Elham, M.A.; Abdulaziz, M.A. An Open-Source Approach for Near-Real-Time Mapping of Oil Spills along the Mediterranean Coast of Egypt. Remote Sens. 2021, 13, 2733. [CrossRef]
- Hadipour, M.; Morteza, N.; Mokhtar, M.; Ern, L.K. Geospatial Analyzing of Straits Shipping Paths for Integration of Air Quality and Marine Wildlife Conservation. J. Wildl. Biodivers. 2021, 5, 63–80. [CrossRef]
- Kao, S.L.; Chung, W.C.; Chen, C.W. AIS-Based Scenario Simulation for the Control and Improvement of Ship Emissions in Ports. J. Mar. Sci. Eng. 2022, 10, 129. [CrossRef]
- Wang, H.; Liu, Z.; Liu, Z.; Wang, X.; Wang, J. GIS-Based Analysis on the Spatial Patterns of Global Maritime Accidents. Ocean Eng. 2022, 245, 110569. [CrossRef]
- Guiziou, F.H. Assessing the Effects of a War on a Container Terminal: Lessons from Al Hudaydah, Yemen. TransNav. 2024, 18, 195–204. [CrossRef]
- Rudolph, T.A. Seeing Like an Algorithm: The Limits of Using Remote Sensing to Link Vessel Movements with Worker Abuse at Sea. Marit. Stud. 2024, 23, 13. [CrossRef]
- Kalyvas, C.; Kokkos, A.; Tzouramanis, T. A Survey of Official Online Sources of High-Quality Free-of-Charge Geospatial Data for Maritime Geographic Information Systems Applications. Inf. Syst. 2017, 65, 36–51. [CrossRef]
- Salminen, E.A.; Murguzur, F.J.A.; Ollus, V.M.S.; Engen, S.; Hausner, V.H. Using Public Participation GIS (PPGIS) to Relate Local Concerns over Growth in Tourism and Aquaculture to Integrated Coastal Zone Management in the Tromsø Region, Norway. Ocean Coast. Manag. 2025, 261, 107510. [CrossRef]
- Brown, G.; Strickland-Munro, J.; Kobryn, H.; Moore, S.A. Stakeholder Analysis for Marine Conservation Planning Using Public Participation GIS. Appl. Geogr. 2016, 67, 77–93. [CrossRef]
- Morse, W.C.; Cox, C.; Anderson, C.J. Using Public Participation Geographic Information Systems (PPGIS) to Identify Valued Landscapes Vulnerable to Sea Level Rise. Sustainability. 2020, 12, 6711. [CrossRef]
- Ettorre, B.; Daldanise, G.; Giovene di Girasole, E.; Clemente, M. Co-Planning Port–City 2030: The InterACT Approach as a Booster for Port–City Sustainable Development. Sustainability. 2023, 15, 15641. [CrossRef]
- Zhao, M.; Yao, X.; Sun, J.; Zhang, S.; Bai, J. GIS-Based Simulation Methodology for Evaluating Ship Encounters Probability to Improve Maritime Traffic Safety. IEEE Trans. Intell. Transp. Syst. 2019, 20, 323–337. [CrossRef]
- Min, H. Developing a Smart Port Architecture and Essential Elements in the Era of Industry 4.0. Marit. Econ. Logist. 2022, 24, 189–207. [CrossRef]
- Alcatel-Lucent Enterprise. Smart Ports and Logistics Solutions. Alcatel-Lucent Enterprise. Available online: https://www.al-enterprise.com/en/industries/transportation/ports (accessed on 12 January 2024).
- McKinsey & Company, 2017. The case for digital reinvention. Available online: https://www.mckinsey.com/capabilities/mckinsey-digital/our-insights/the-case-for-digital-reinvention (accessed 12 January 2024).
- Grzelakowski, A.S. The COVID 19 Pandemic–Challenges for Maritime Transport and Global Logistics Supply Chains. TransNav. 2022, 16, 71–77. [CrossRef]
- Xia, H.; Liu, Z.; Efremochkina, M.; Liu, X.; Lin, C. Study on City Digital Twin Technologies for Sustainable Smart City Design: A Review and Bibliometric Analysis of Geographic Information System and Building Information Modeling Integration. Sustain. Cities Soc. 2022, 84, 104009. [CrossRef]
- Neugebauer, J.; Heilig, L.; Voß, S. Digital Twins in the Context of Seaports and Terminal Facilities. Flex. Serv. Manuf. J. 2024, 36, 821–917. [CrossRef]
- Freire, W.P.; Melo, W.S., Jr.; do Nascimento, V.D.; Nascimento, P.R.M.; de Sá, A.O. Towards a Secure and Scalable Maritime Monitoring System Using Blockchain and Low-Cost IoT Technology. Sensors 2022, 22, 4895. [CrossRef]
- Monzon Baeza, V.; Ortiz, F.; Herrero Garcia, S.; Lagunas, E. Comunicações aprimoradas em sistemas de IoT baseados em satélite para dar suporte a serviços de transporte marítimo. Sensors. 2022, 22, 6450. [CrossRef]
- Argyriou, I.; Tsoutsos, T. Avaliação de entidades críticas: gerenciamento de risco para dispositivos de IoT em portos. J. Mar. Sci. Eng. 2024, 12, 1593. [CrossRef]
- Durlik, I.; Miller, T.; Cembrowska-Lech, D.; Krzemińska, A.; Złoczowska, E.; Nowak, A. Navigating the Sea of Data: A Comprehensive Review on Data Analysis in Maritime IoT Applications. Appl. Sci. 2023, 13, 9742. [CrossRef]
- Diaz, R.; Ungo, R.; Smith, K.; Haghnegahdar, L.; Singh, B.; Phuong, T. Applications of AI/ML in Maritime Cyber Supply Chains. Procedia Comput. Sci. 2024, 232, 3247–3257. [CrossRef]
- Zhou, X. Spatial Risk Assessment of Maritime Transportation in Offshore Waters of China Using Machine Learning and Geospatial Big Data. Ocean Coast. Manag. 2024, 247, 106934. [CrossRef]
- Alizadeh, D.; Alesheikh, A.A.; Sharif, M. Vessel Trajectory Prediction Using Historical Automatic Identification System Data. J. Navig. 2020, 1, 1–19. [CrossRef]
- Last, P.; Bahlke, C.; Hering-Bertram, M.; Linsen, L. Comprehensive Analysis of Automatic Identification System (AIS) Data in Regard to Vessel Movement Prediction. J. Navig. 2014, 67, 791–809. [CrossRef]
- Huang, I.-L.; Lee, M.-C.; Nieh, C.-Y.; Huang, J.-C. Ship Classification Based on AIS Data and Machine Learning Methods. Electronics. 2024, 13, 98. [CrossRef]
- Le, L.T. Discovering Supply Chain Operation Towards Sustainability Using Machine Learning and DES Techniques: A Case Study in Vietnam Seafood. Marit. Bus. Rev. 2024, 9, 243–262. [CrossRef]
- Zhuang, X.; Li, W.; Xu, Y. Port Planning and Sustainable Development Based on Prediction Modelling of Port Throughput: A Case Study of the Deep-Water Dongjiakou Port. Sustainability. 2022, 14, 4276. [CrossRef]
- Peng, W.; Bai, X.; Yang, D.; Yuen, K.F.; Wu, J. A Deep Learning Approach for Port Congestion Estimation and Prediction. Marit. Policy Manag. 2023, 50, 835–860. [CrossRef]
- Thennakoon, K.; Bandaranayake, N.; Kiridena, S.; Kulatunga, A.K. Quantification of Landside Congestion in Ports: An Analysis Based on GPS Data. J. South Asian Logist. Transp. 2024, 4, 1. [CrossRef]
- Irannezhad, E.; Prato, C.G.; Hickman, M. An Intelligent Decision Support System Prototype for Hinterland Port Logistics. Decis. Support Syst. 2020, 130, 113227. [CrossRef]
- Novaes Mathias, T.; Sugimura, Y.; Kawasaki, T.; Akakura, Y. Topological Resilience of Shipping Alliances in Maritime Transportation Networks. Logistics. 2025, 9, 6. [CrossRef]
- Nakashima, M.; Shibasaki, R. Can AIS Data Improve the Short-Term Forecast of Weekly Dry Bulk Cargo Port Throughput? A Machine-Learning Approach. Marit. Policy Manag. 2023, 51, 1788–1804. [CrossRef]
- Reggiannini, M.; Righi, M.; Tampucci, M.; Lo Duca, A.; Bacciu, C.; Bedini, L.; D’Errico, A.; Di Paola, C.; Marchetti, A.; Martinelli, M.; et al. Remote Sensing for Maritime Prompt Monitoring. J. Mar. Sci. Eng. 2019, 7, 202. [CrossRef]
- Reggiannini, M.; Salerno, E.; Bacciu, C.; D’Errico, A.; Lo Duca, A.; Marchetti, A.; Martinelli, M.; Mercurio, C.; Mistretta, A.; Righi, M.; et al. Remote Sensing for Maritime Traffic Understanding. Remote Sens. 2024, 16, 557. [CrossRef]
- a_Rawson, A.; Brito, M. Developing Contextually Aware Ship Domains Using Machine Learning. J. Navig. 2021, 74, 515–532. [CrossRef]
- b_Rawson, A.; Brito, M.; Sabeur, Z. Spatial Modeling of Maritime Risk Using Machine Learning. Risk Anal. 2022, 42, 2291–2311. [CrossRef]
- c_Rawson, A.; Sabeur, Z.; Brito, M. Intelligent Geospatial Maritime Risk Analytics Using the Discrete Global Grid System. Big Earth Data. 2021, 6, 294–322. [CrossRef]
- d_Rawson, A.; Brito, M.; Sabeur, Z.; Tran-Thanh, L. A Machine Learning Approach for Monitoring Ship Safety in Extreme Weather Events. Safety Sci. 2021, 141, 105336. [CrossRef]
- Alshareef, M.H.; Aljahdali, B.M.; Alghanmi, A.F.; Sulaimani, H.T. Spatial Analysis and Risk Evaluation for Port Crisis Management Using Integrated Soft Computing and GIS-Based Models: A Case Study of Jazan Port, Saudi Arabia. Sustainability. 2024, 16, 5131. [CrossRef]
- Temitope Yekeen, S.; Balogun, A.-L. Advances in Remote Sensing Technology, Machine Learning and Deep Learning for Marine Oil Spill Detection, Prediction and Vulnerability Assessment. Remote Sens. 2020, 12, 3416. [CrossRef]
- Najafizadegan, S.; Danesh-Yazdi, M. Variable-Complexity Machine Learning Models for Large-Scale Oil Spill Detection: The Case of Persian Gulf. Mar. Pollut. Bull. 2023, 195, 115459. [CrossRef]
- de Andrade, L.C.; Veloso, G.V.; Ferreira, I.O. Comparison of Deterministic, Probabilistic and Machine Learning-Based Methods for Bathymetric Surface Modeling. Model. Earth Syst. Environ. 2025, 11, 1–16. [CrossRef]
- World Economic Forum. Leveraging digital tools in the age of supply chain disruption. Available online: https://www.weforum.org/stories/2025/01/supply-chain-disruption-digital-winners-losers/ (accessed on 26 January 2025).
- Zhang, C.; Zhao, T.; Li, W. Geospatial Data Interoperability, Geography Markup Language (GML), Scalable Vector Graphics (SVG), and Geospatial Web Services. In Geospatial Semantic Web; Springer, Cham. 2015. [CrossRef]
- Durlik, I.; Miller, T.; Cembrowska-Lech, D.; Krzemińska, A.; Złoczowska, E.; Nowak, A. Navigating the Sea of Data: A Comprehensive Review on Data Analysis in Maritime IoT Applications. Appl. Sci. 2023, 13, 9742. [CrossRef]
- Gourmelon, F.; Le Guyader, D.; Fontenelle, G. A Dynamic GIS as an Efficient Tool for Integrated Coastal Zone Management. ISPRS Int. J. Geo-Inf. 2014, 3, 391–407. [CrossRef]
- Hatlas-Sowinska, P.; Wielgosz, M. Ontology-Based Approach in Solving Collision Situations at Sea. Ocean Eng. 2022, 260, 111941. [CrossRef]
- Zhou, C.; Wen, K.; Zhao, J.; Bian, Z.; Lu, T.; Ko Ko Latt, M.; Wang, C. Ontology-Based Method for Identifying Abnormal Ship Behavior: A Navigation Rule Perspective. J. Mar. Sci. Eng. 2024, 12, 881. [CrossRef]
- Pagano, P.; Antonelli, S.; Tardo, A. C-Ports: A Proposal for a Comprehensive Standardization and Implementation Plan of Digital Services Offered by the “Port of the Future.” Comput. Ind. 2022, 134, 103556. [CrossRef]
- Andrei, N.; Scarlat, C.; Ioanid, A. Transforming E-Commerce Logistics: Sustainable Practices through Autonomous Maritime and Last-Mile Transportation Solutions. Logistics. 2024, 8, 71. [CrossRef]
Figure 1.
Methodological stage.
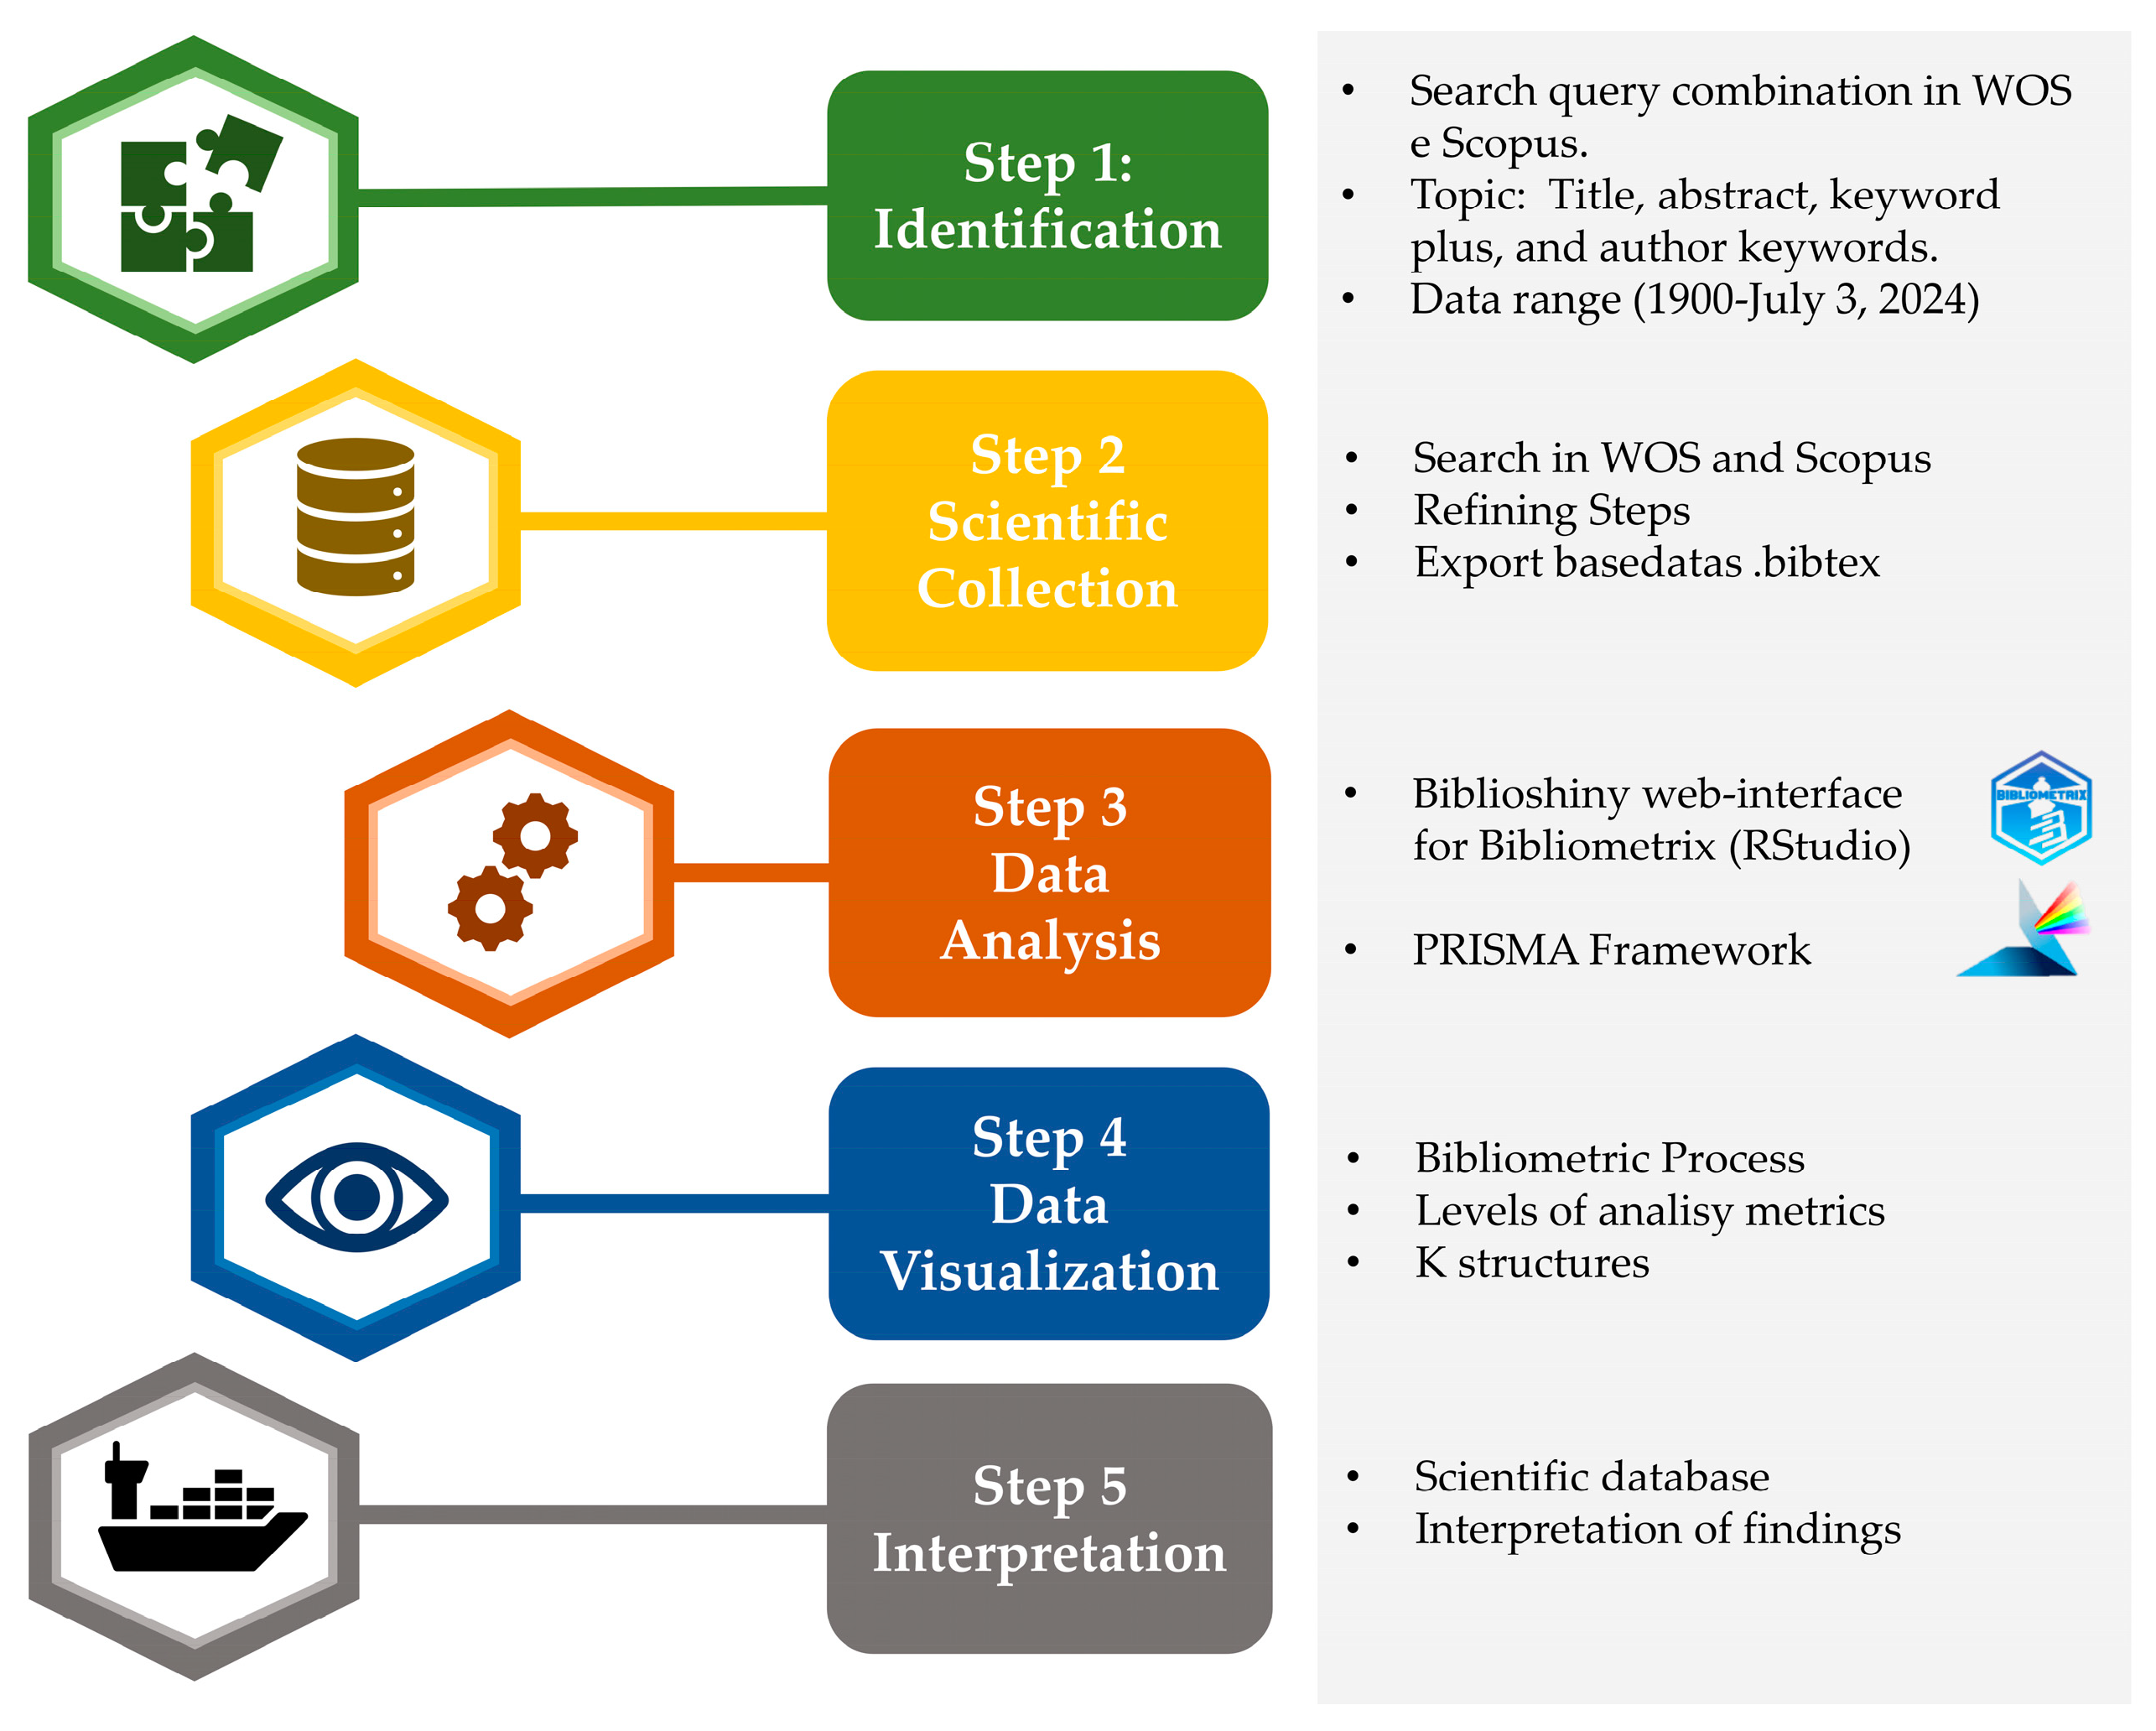
Figure 2.
Literature review methodology phases based on the PRISMA-SCR review.
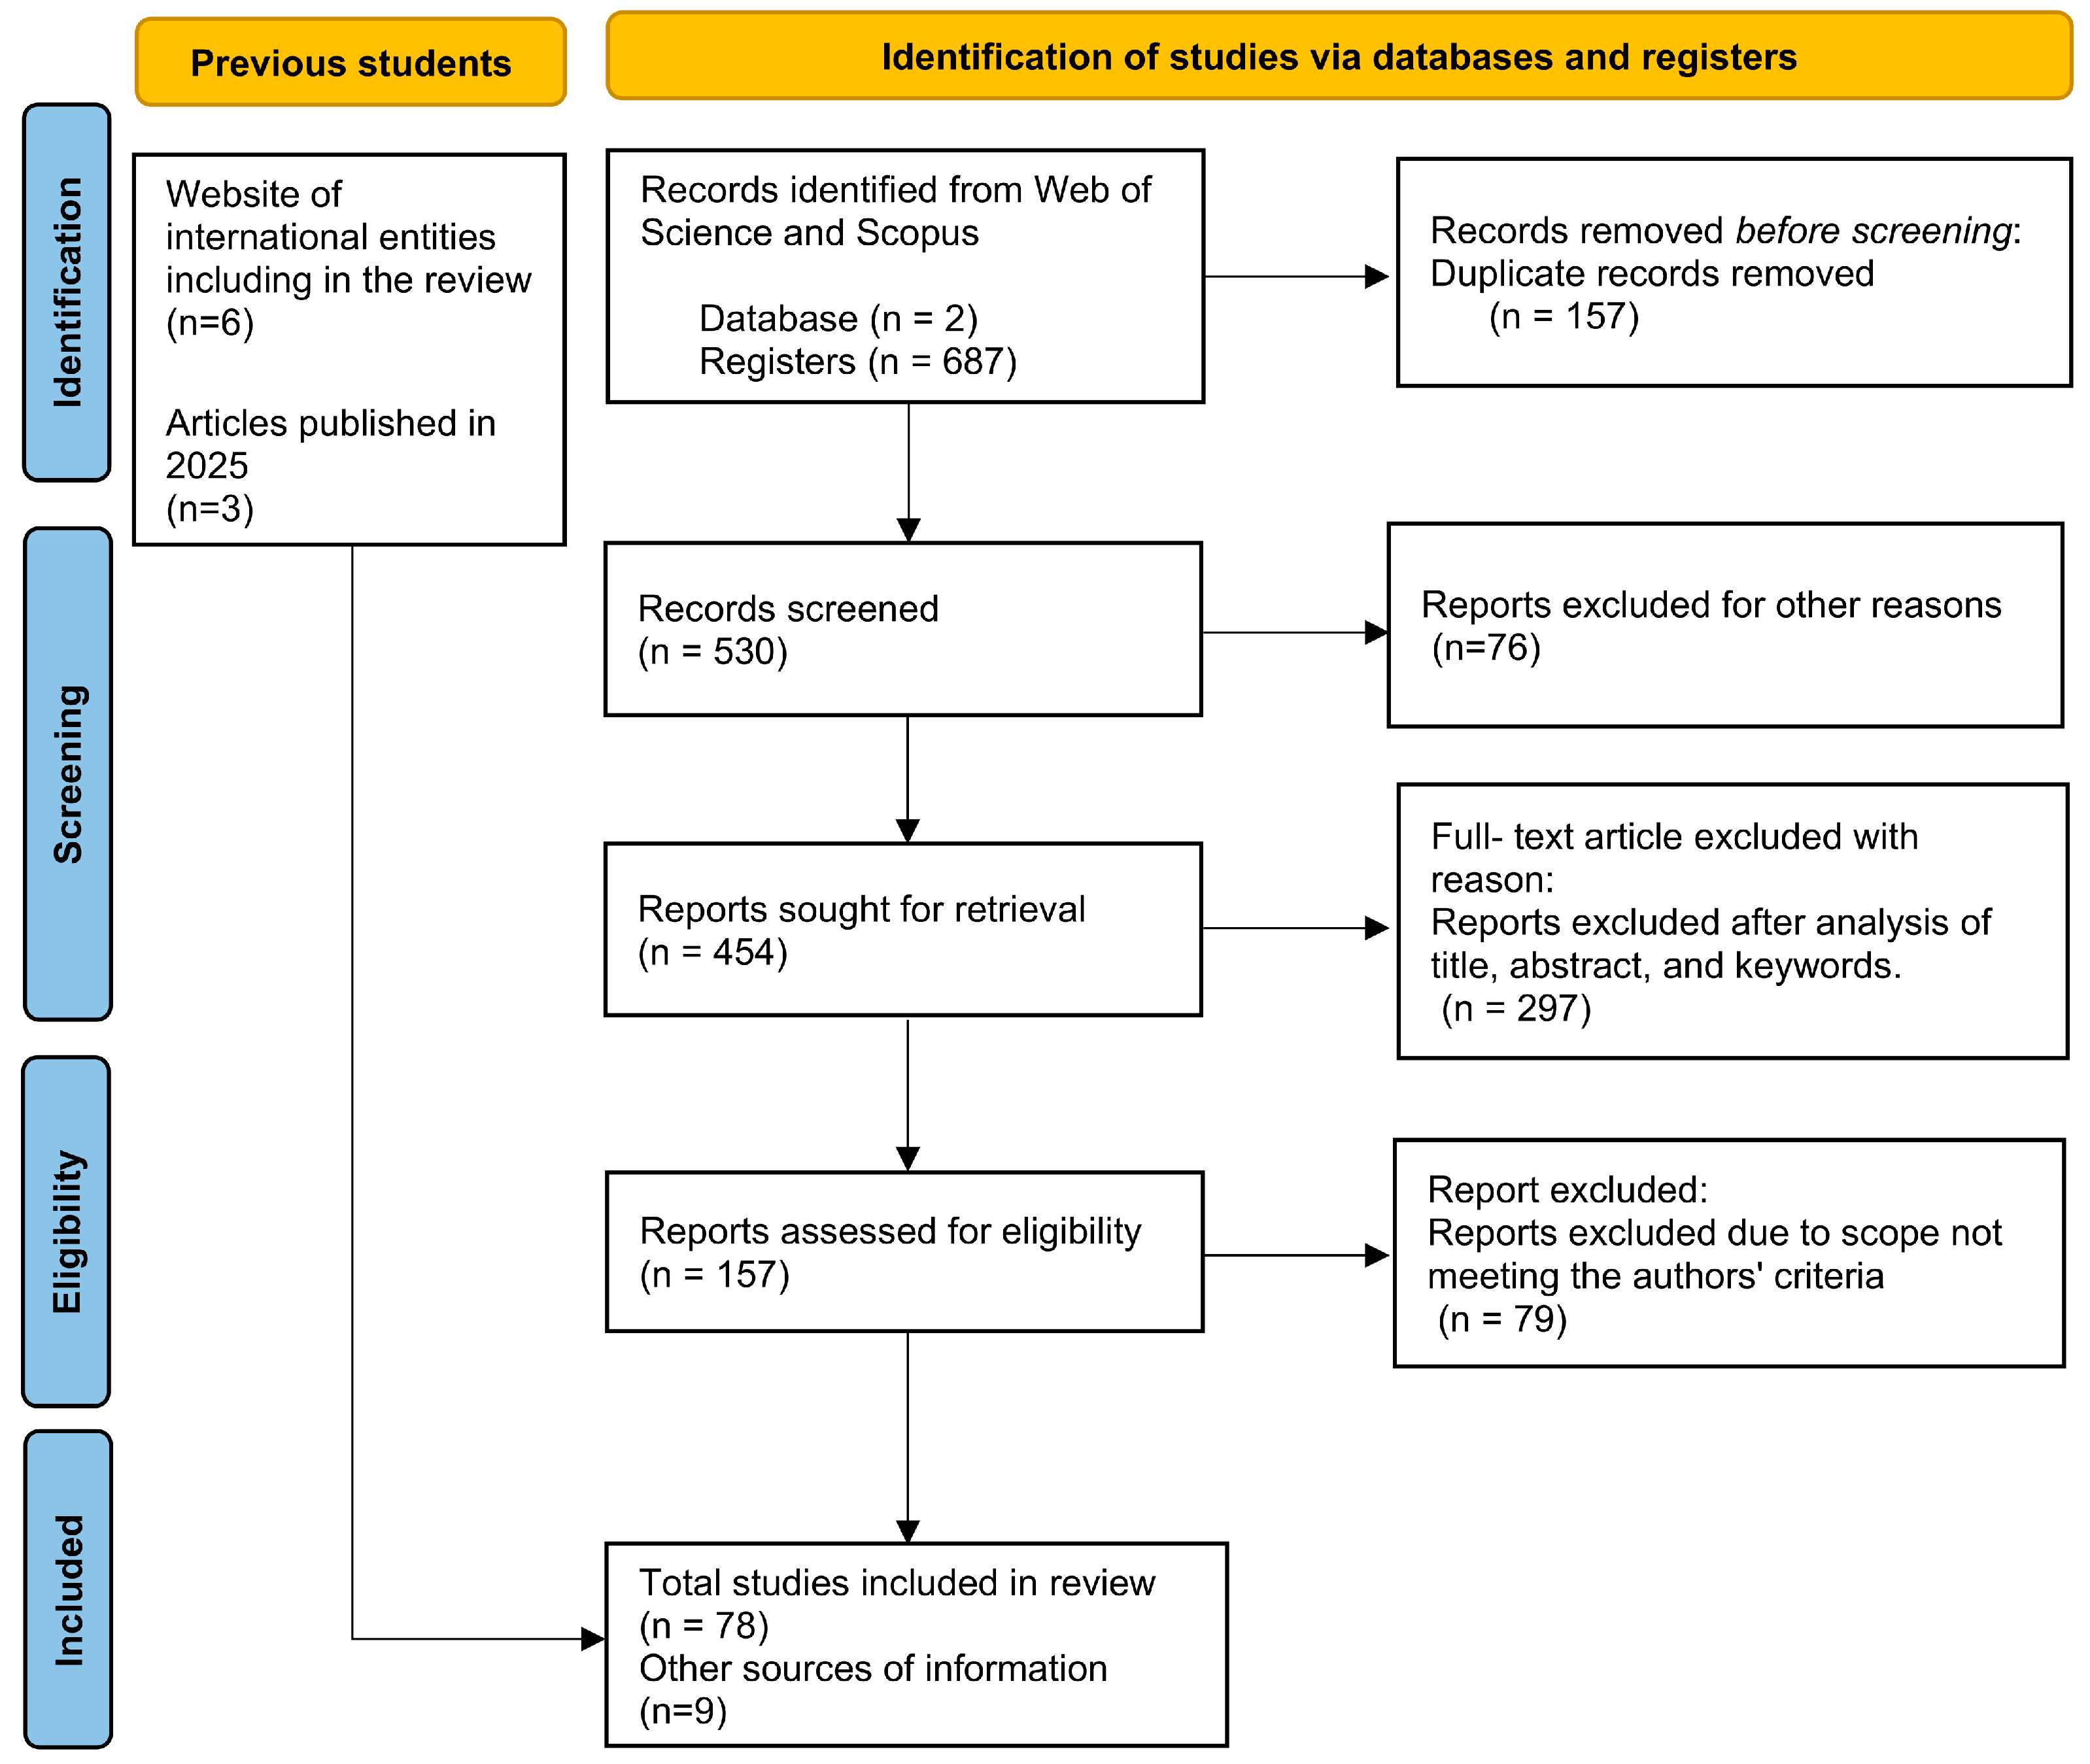
Figure 3.
Distribution of annual scientific publications and average article citation per year. Source: Authors’ elaboration using Bibliometrix and Biblioshiny R packages.
Figure 3.
Distribution of annual scientific publications and average article citation per year. Source: Authors’ elaboration using Bibliometrix and Biblioshiny R packages.
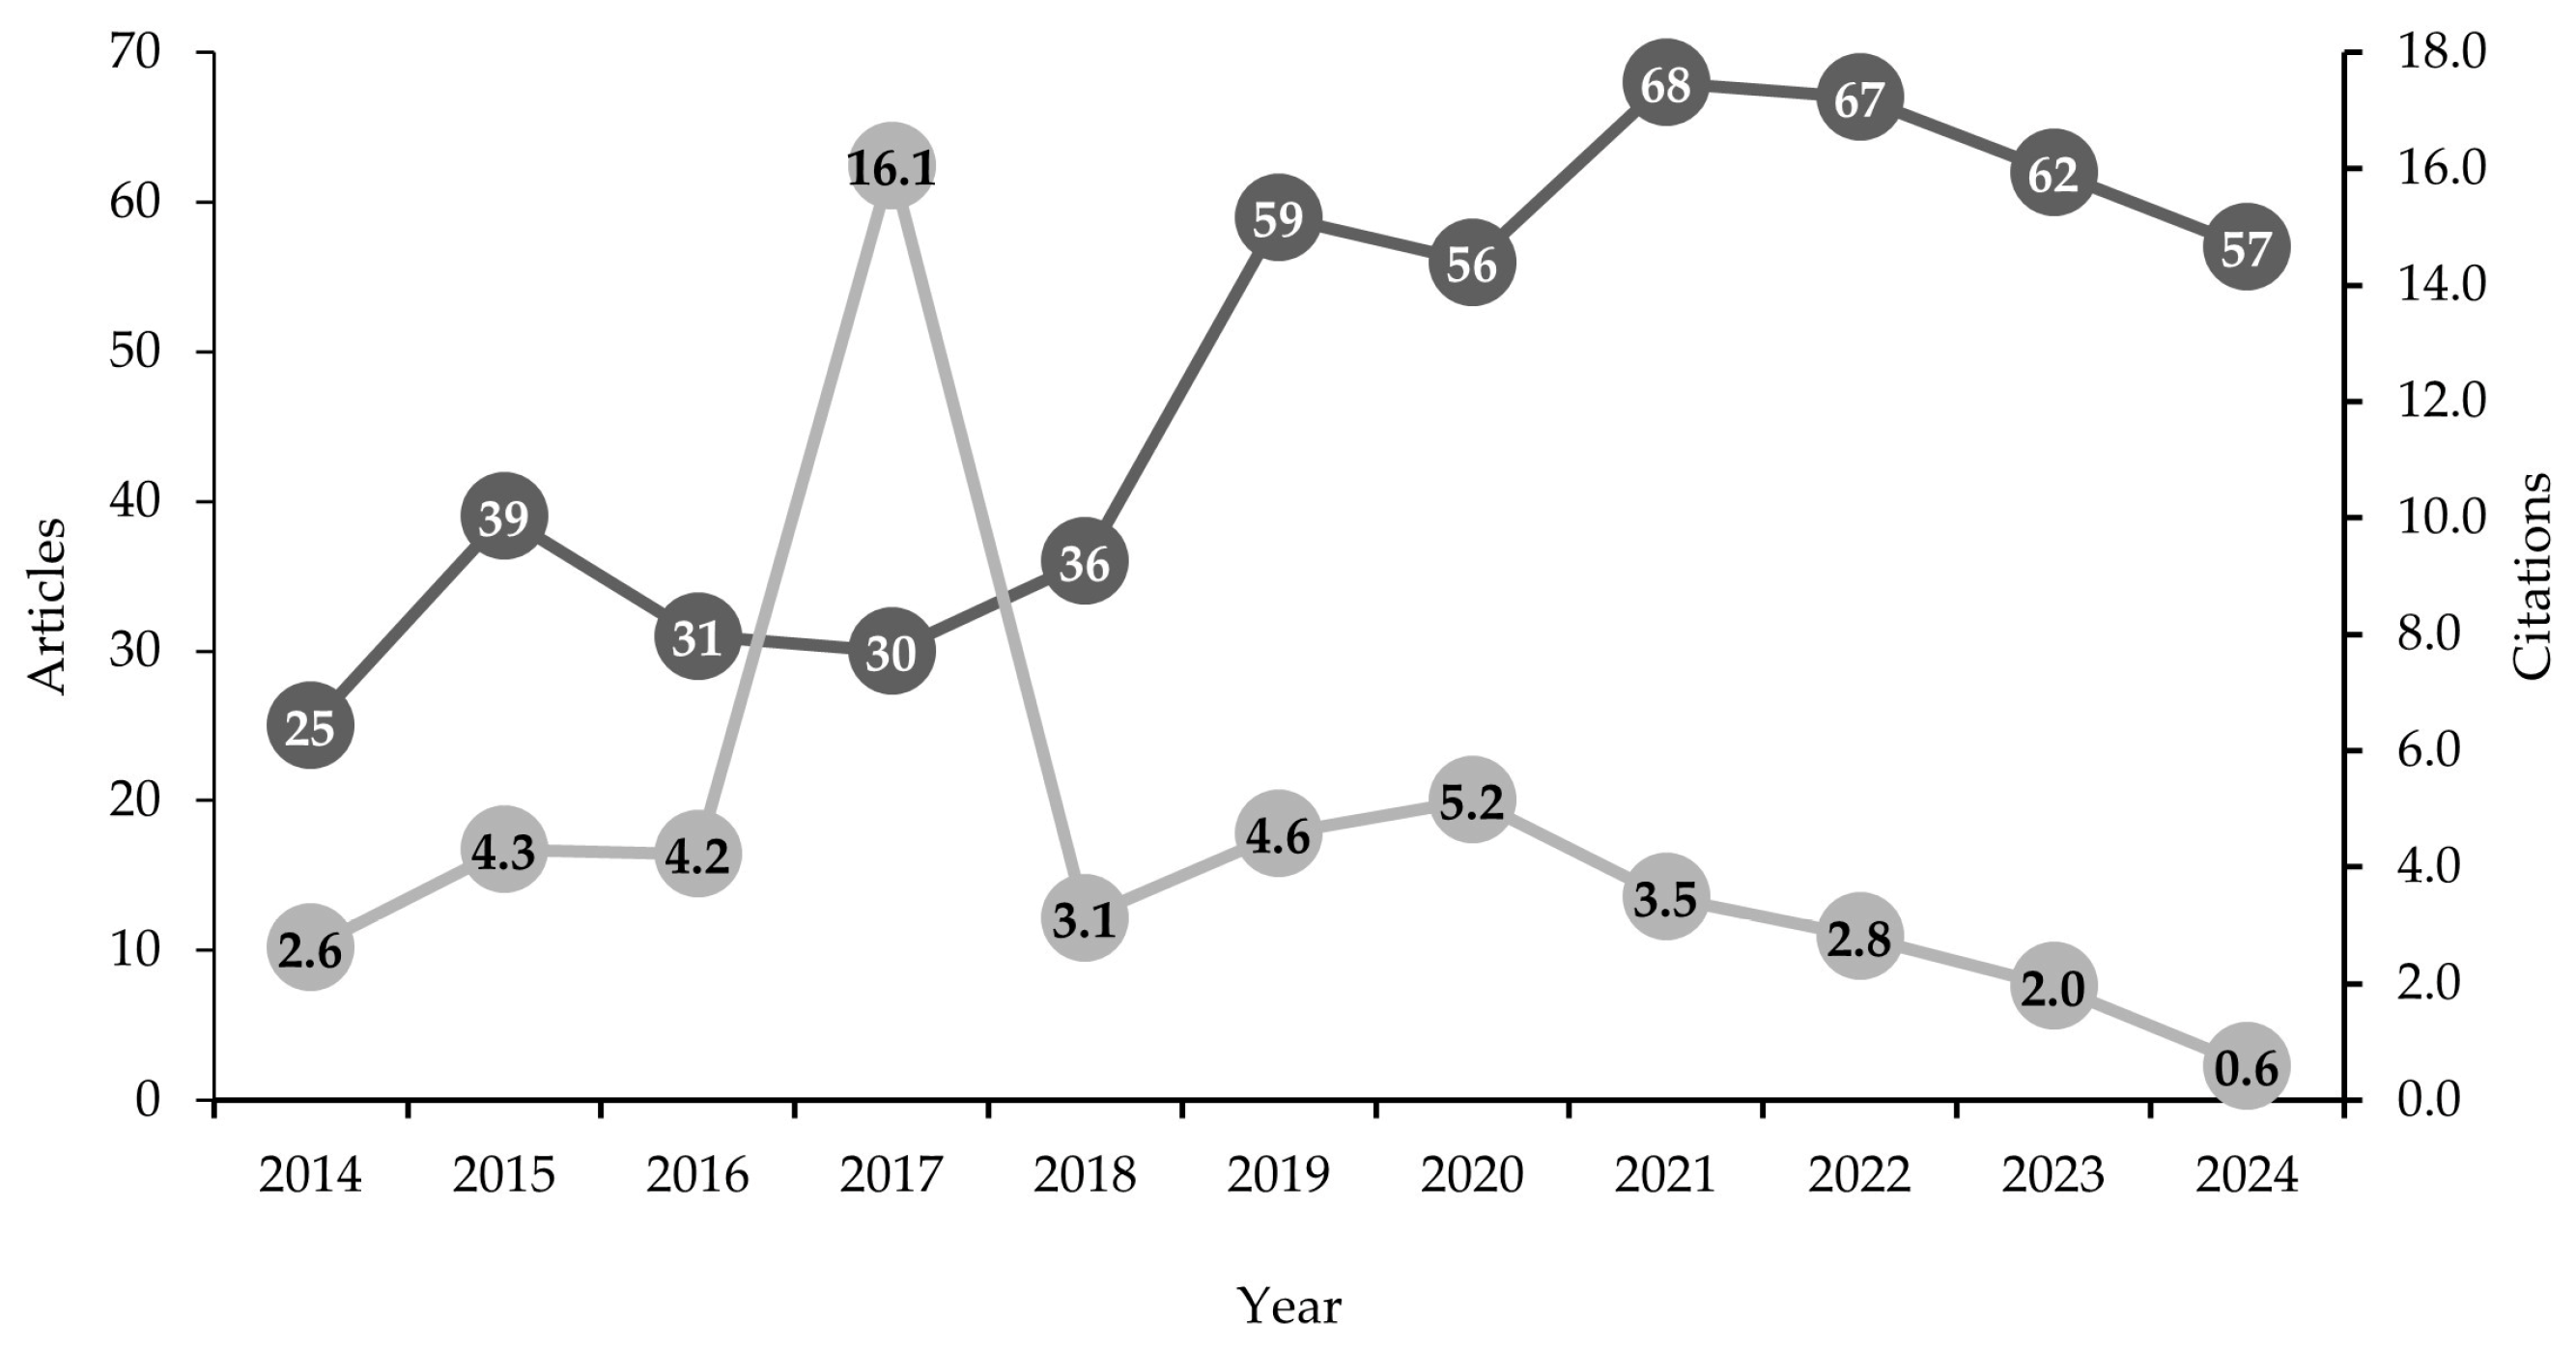
Figure 4.
The top twenty scientific journals. Source: Authors’ elaboration using Bibliometrix and Biblioshiny R packages.
Figure 4.
The top twenty scientific journals. Source: Authors’ elaboration using Bibliometrix and Biblioshiny R packages.
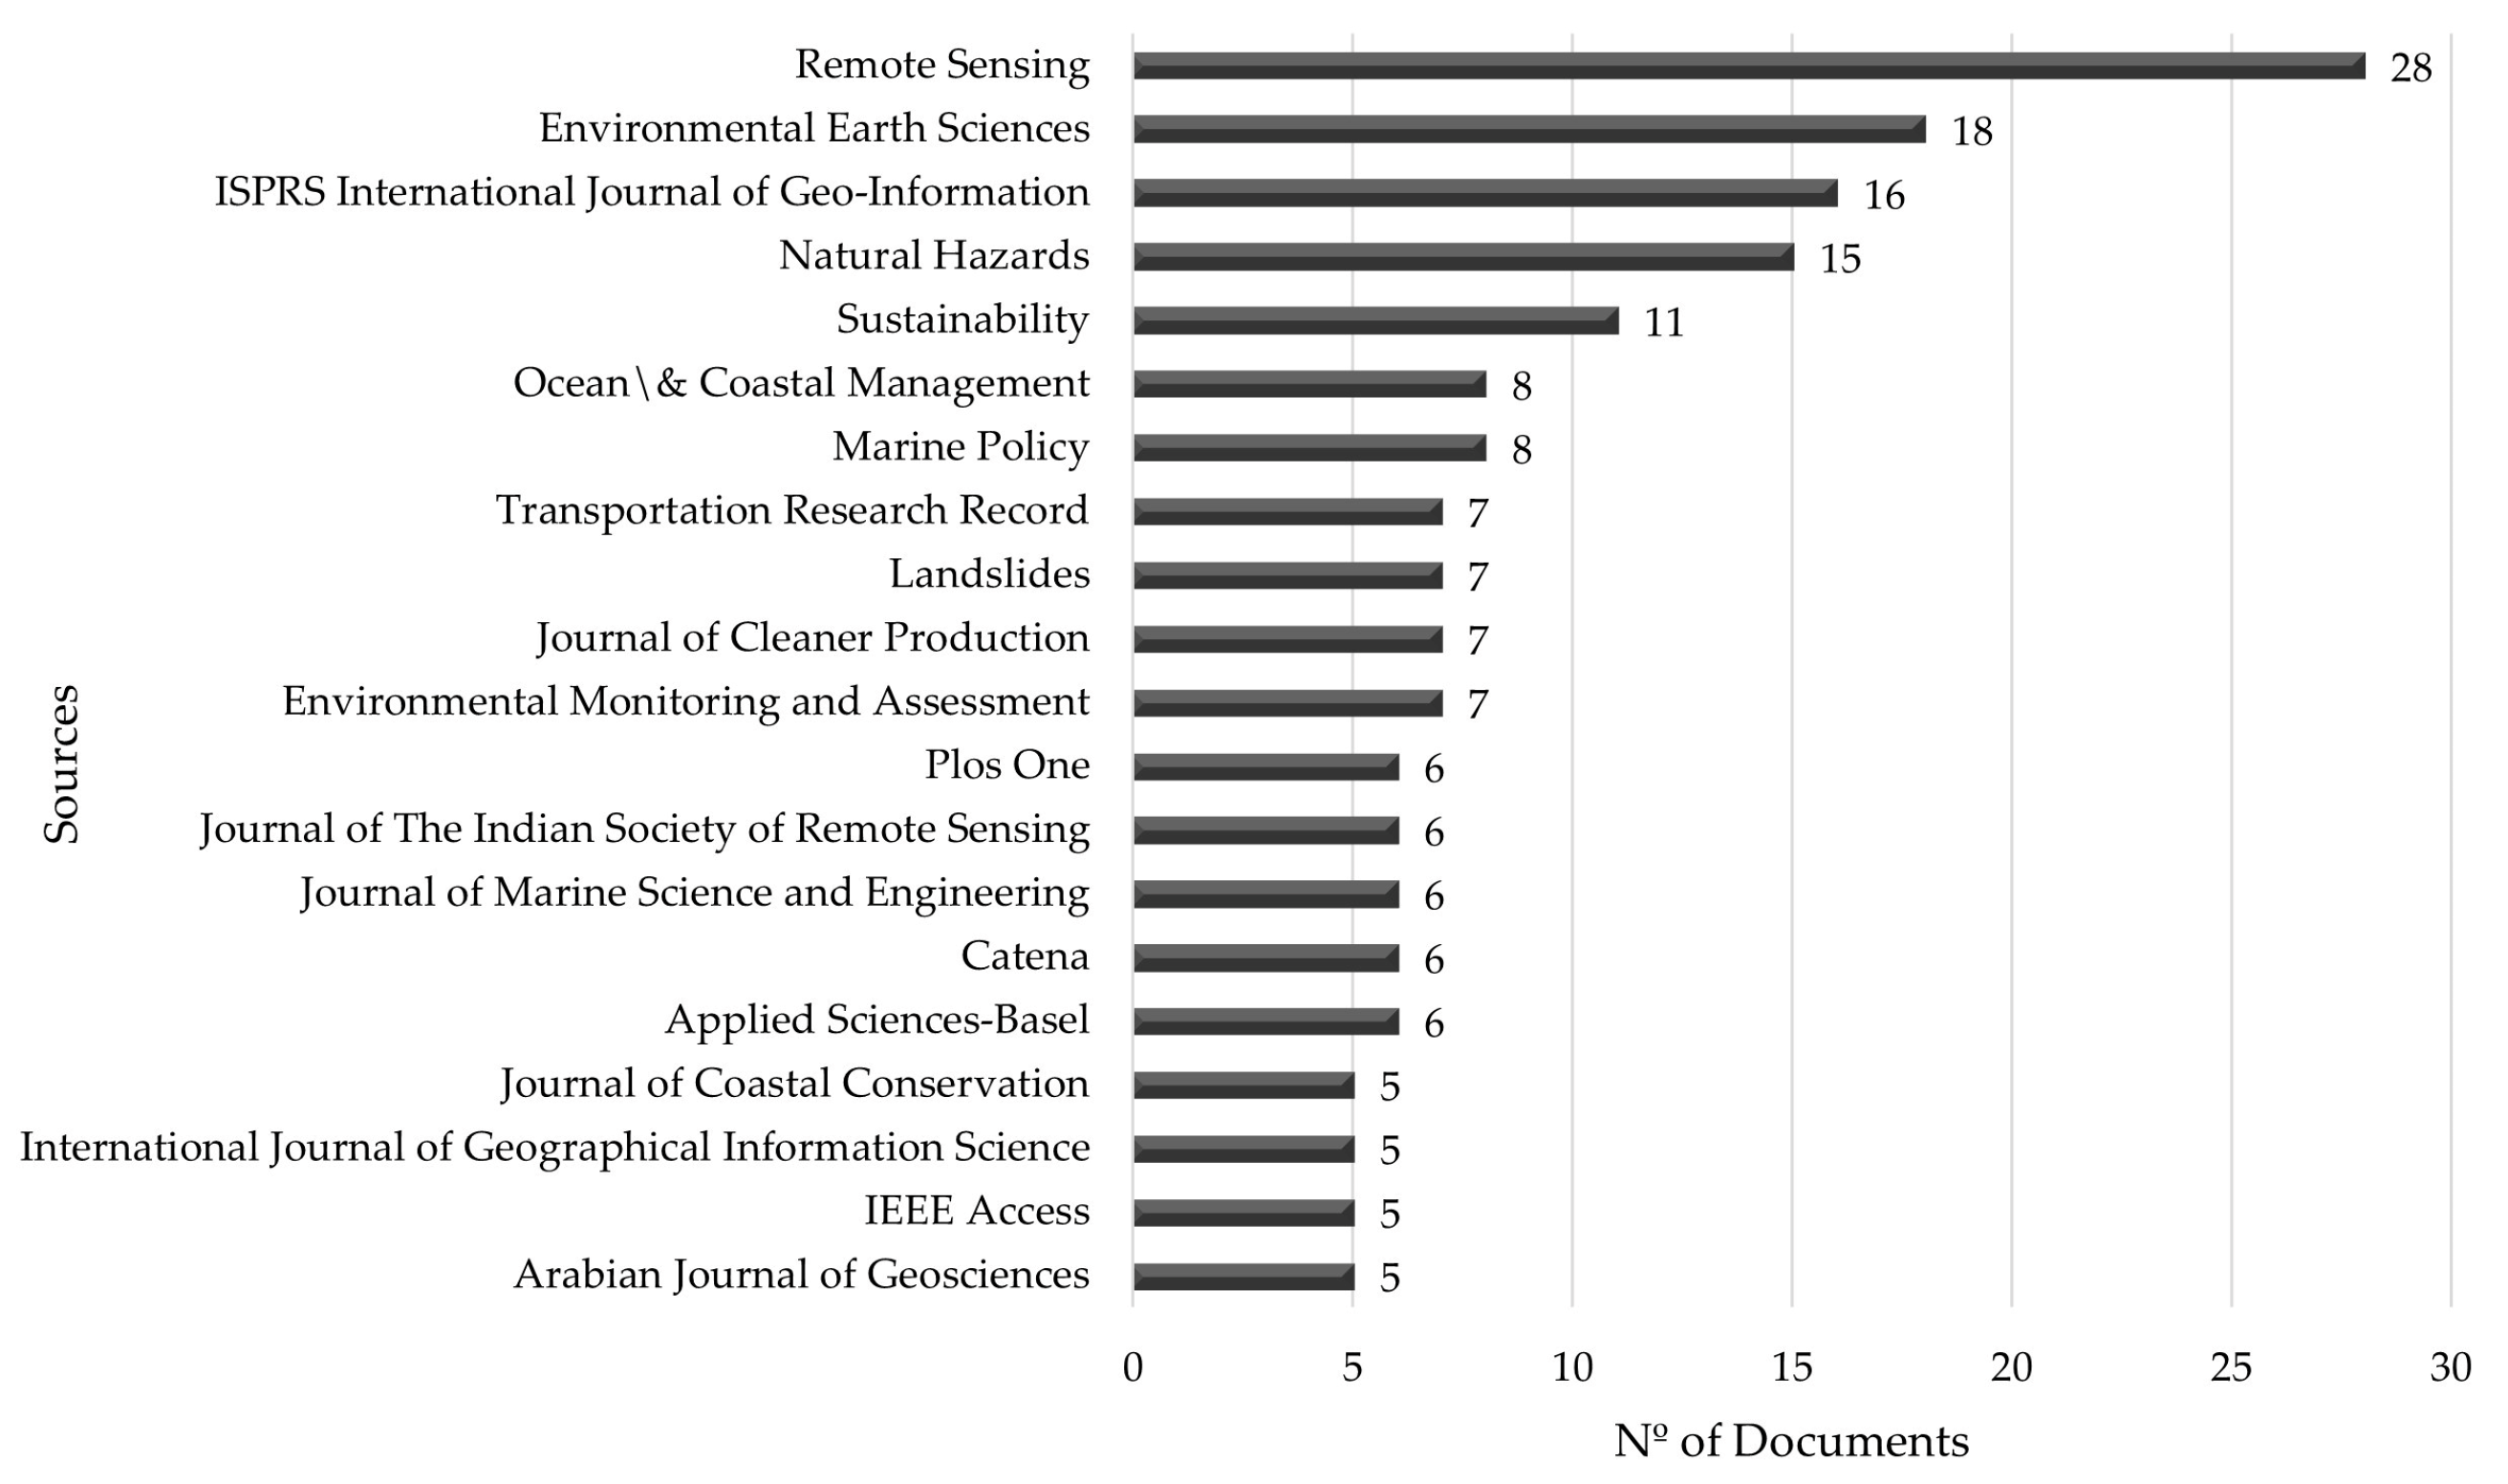
Figure 5.
The 20 most frequent authors' keywords. Source: Authors’ elaboration using Bibliometrix and Biblioshiny R packages.
Figure 5.
The 20 most frequent authors' keywords. Source: Authors’ elaboration using Bibliometrix and Biblioshiny R packages.
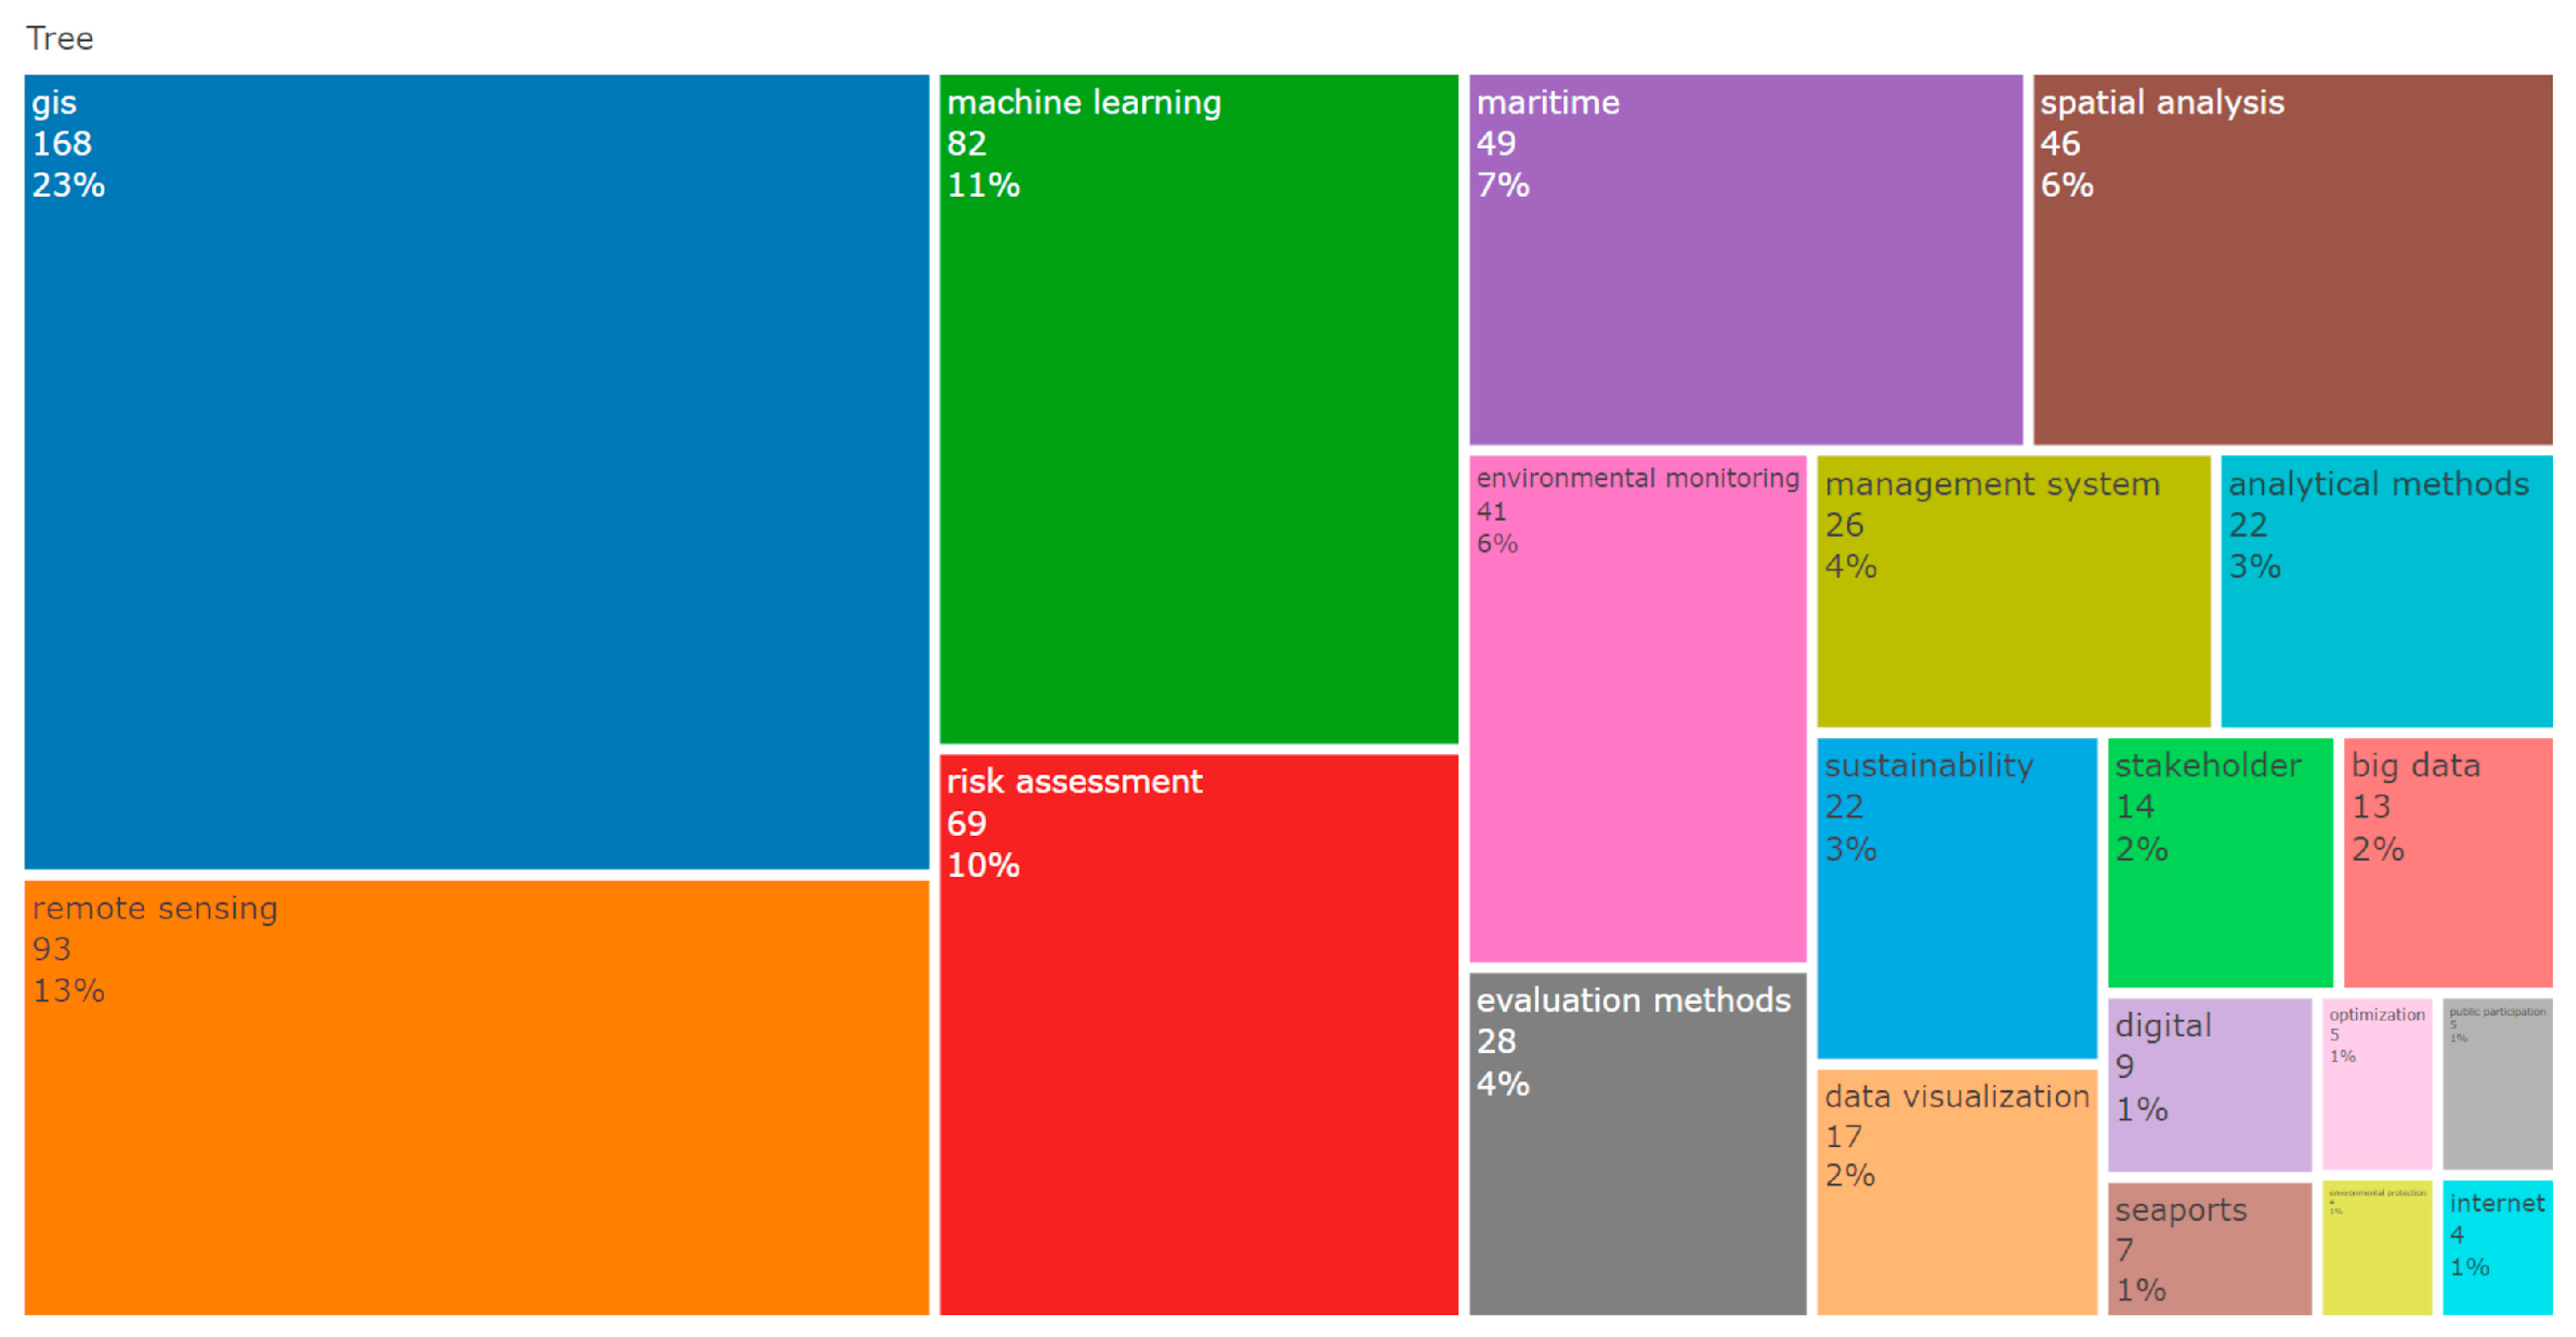
Figure 6.
Authors' keyword cloud. Source: Authors’ elaboration using Bibliometrix and Biblioshiny R packages.
Figure 6.
Authors' keyword cloud. Source: Authors’ elaboration using Bibliometrix and Biblioshiny R packages.
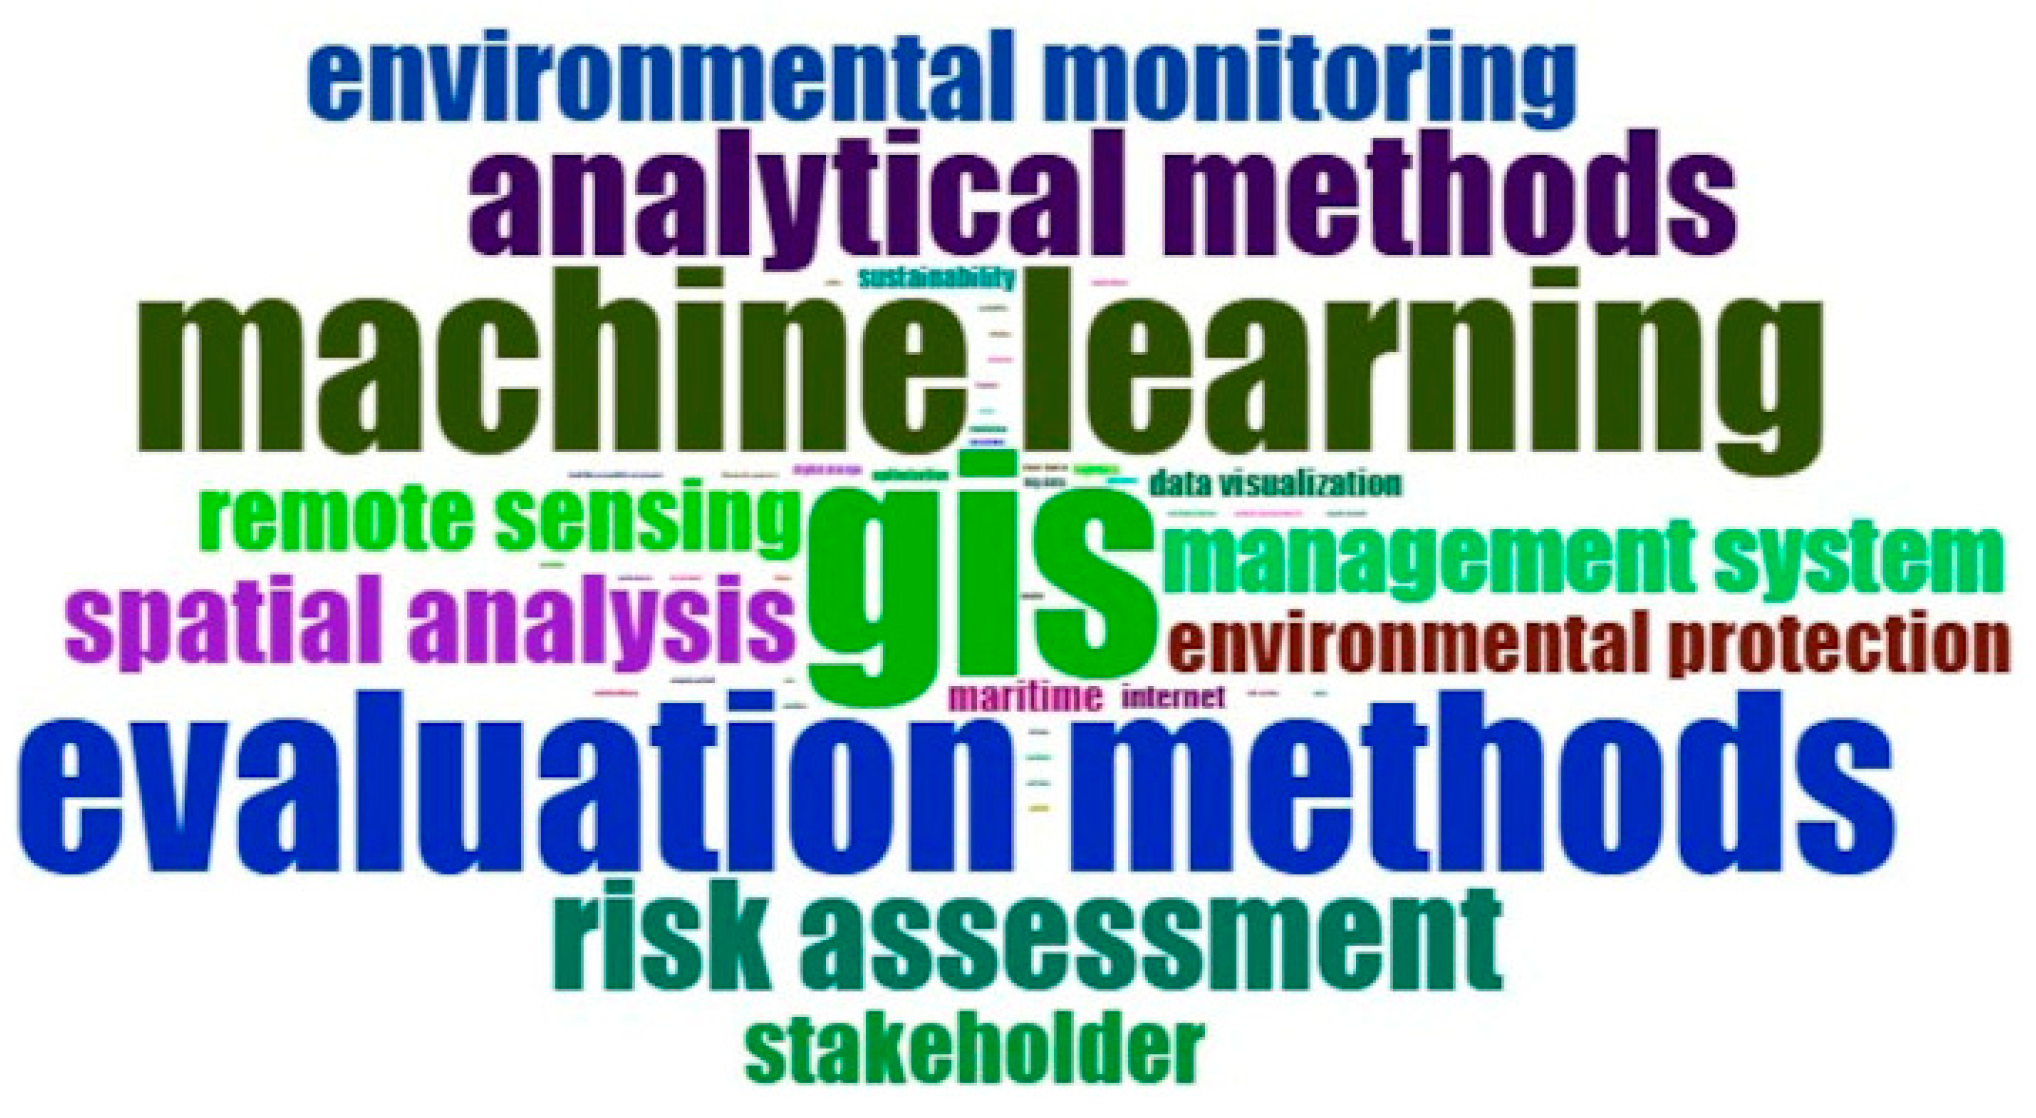
Figure 7.
Global distribution of published articles and visualization of international collaboration networks across countries. Source: Authors’ elaboration using Bibliometrix and Biblioshiny R packages.
Figure 7.
Global distribution of published articles and visualization of international collaboration networks across countries. Source: Authors’ elaboration using Bibliometrix and Biblioshiny R packages.
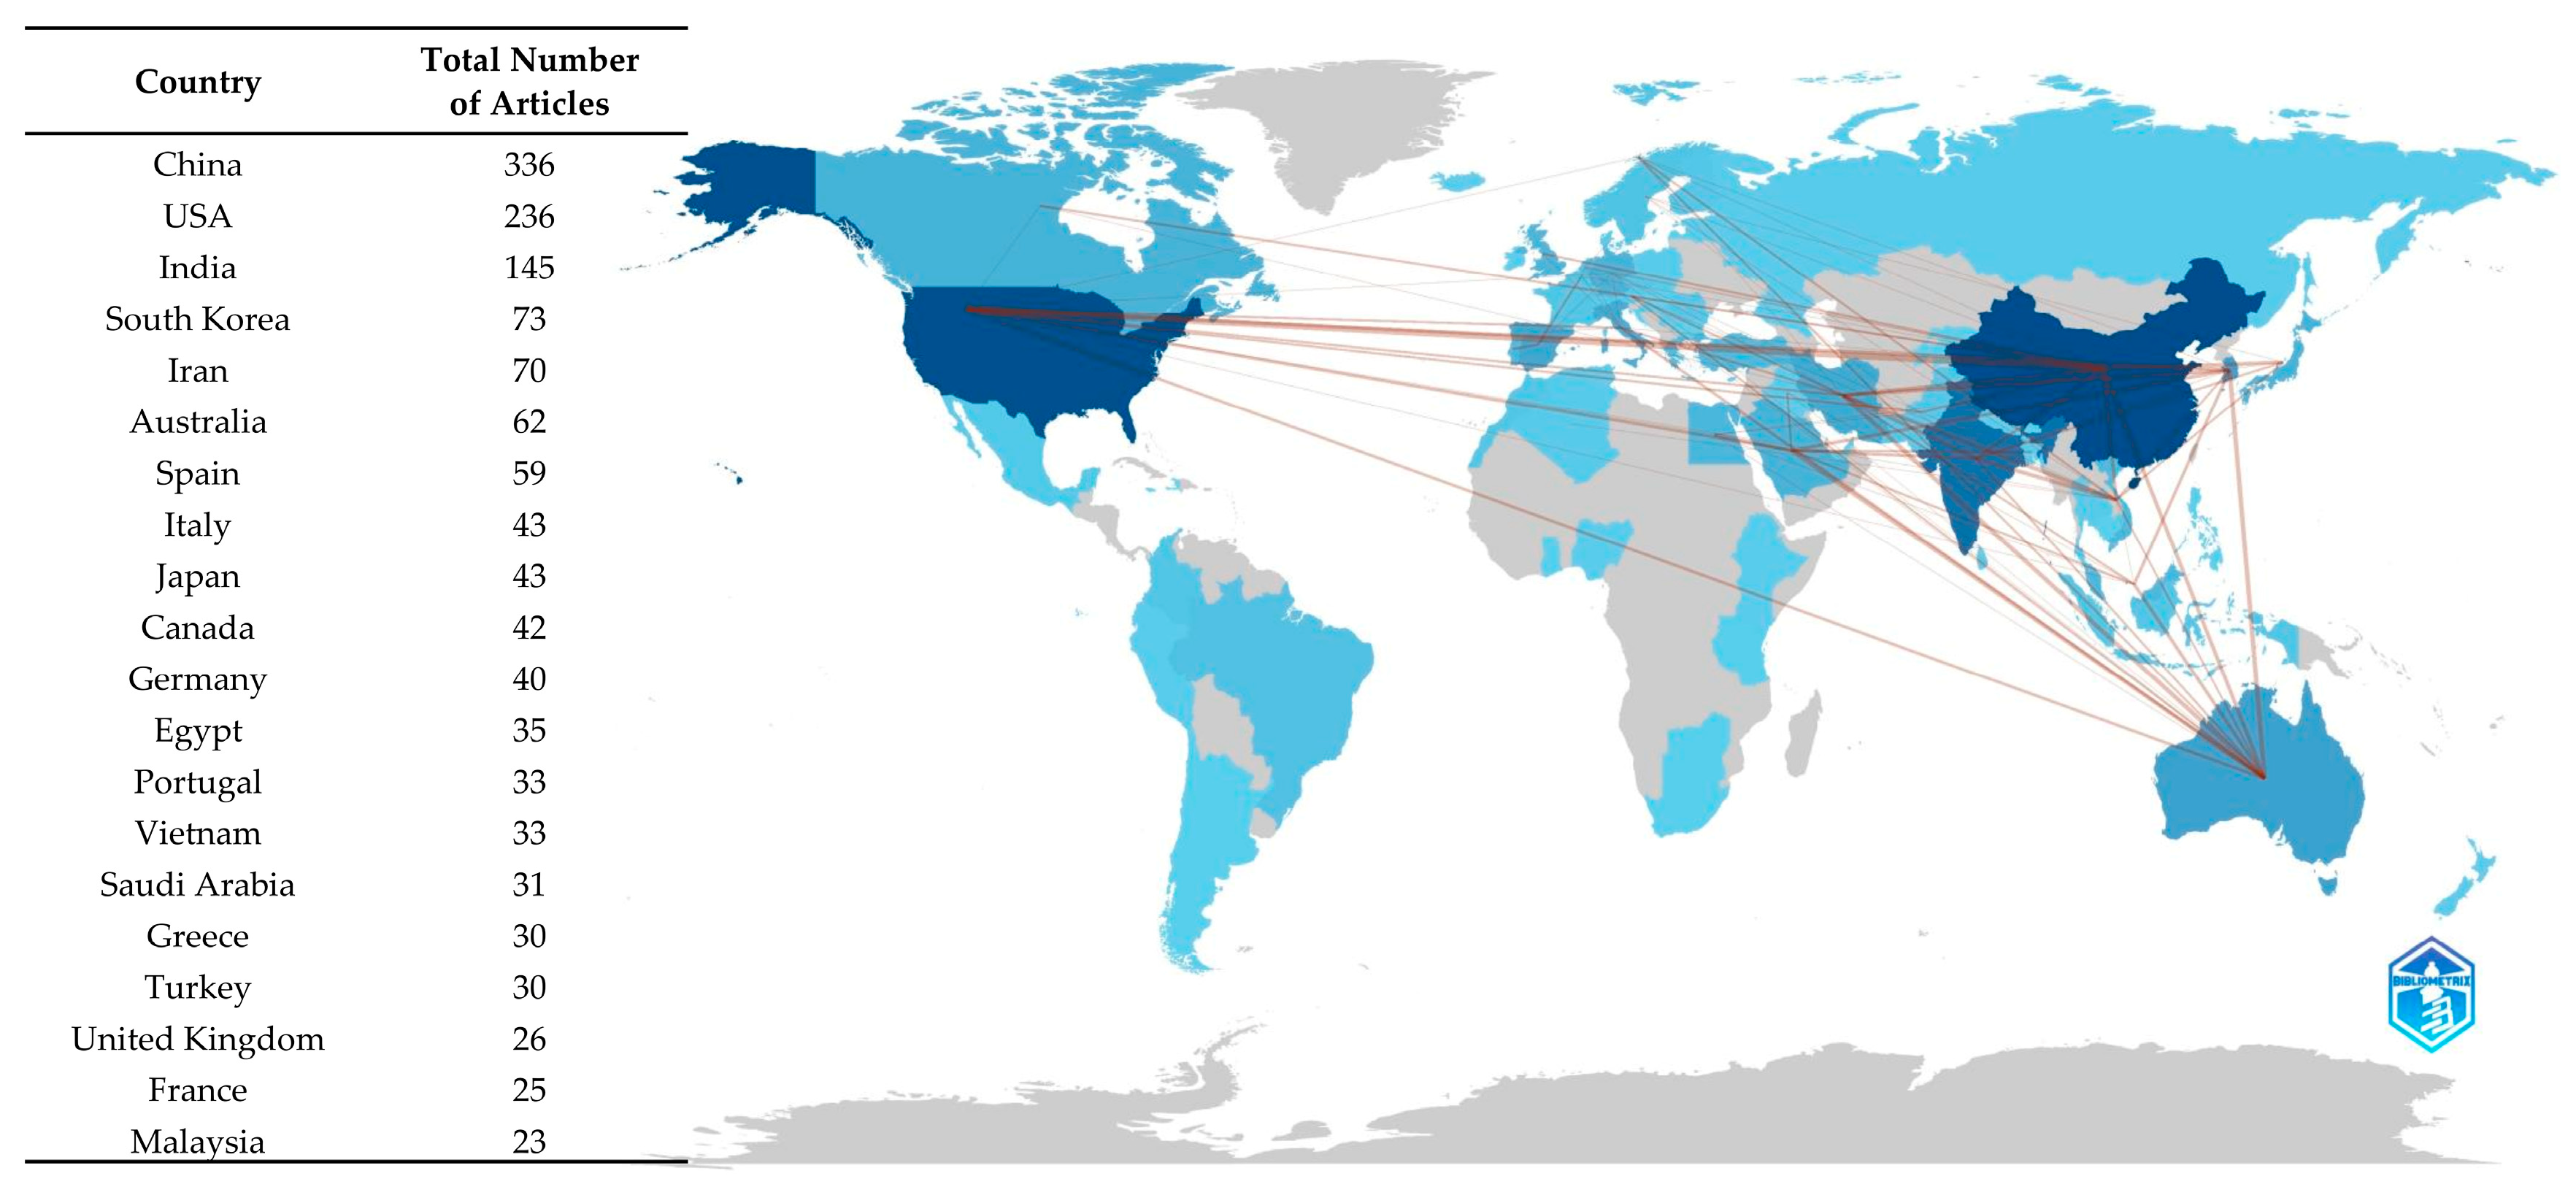
Figure 8.
Thematic evolution of research. Source: Authors’ elaboration using Bibliometrix and Biblioshiny R packages.
Figure 8.
Thematic evolution of research. Source: Authors’ elaboration using Bibliometrix and Biblioshiny R packages.
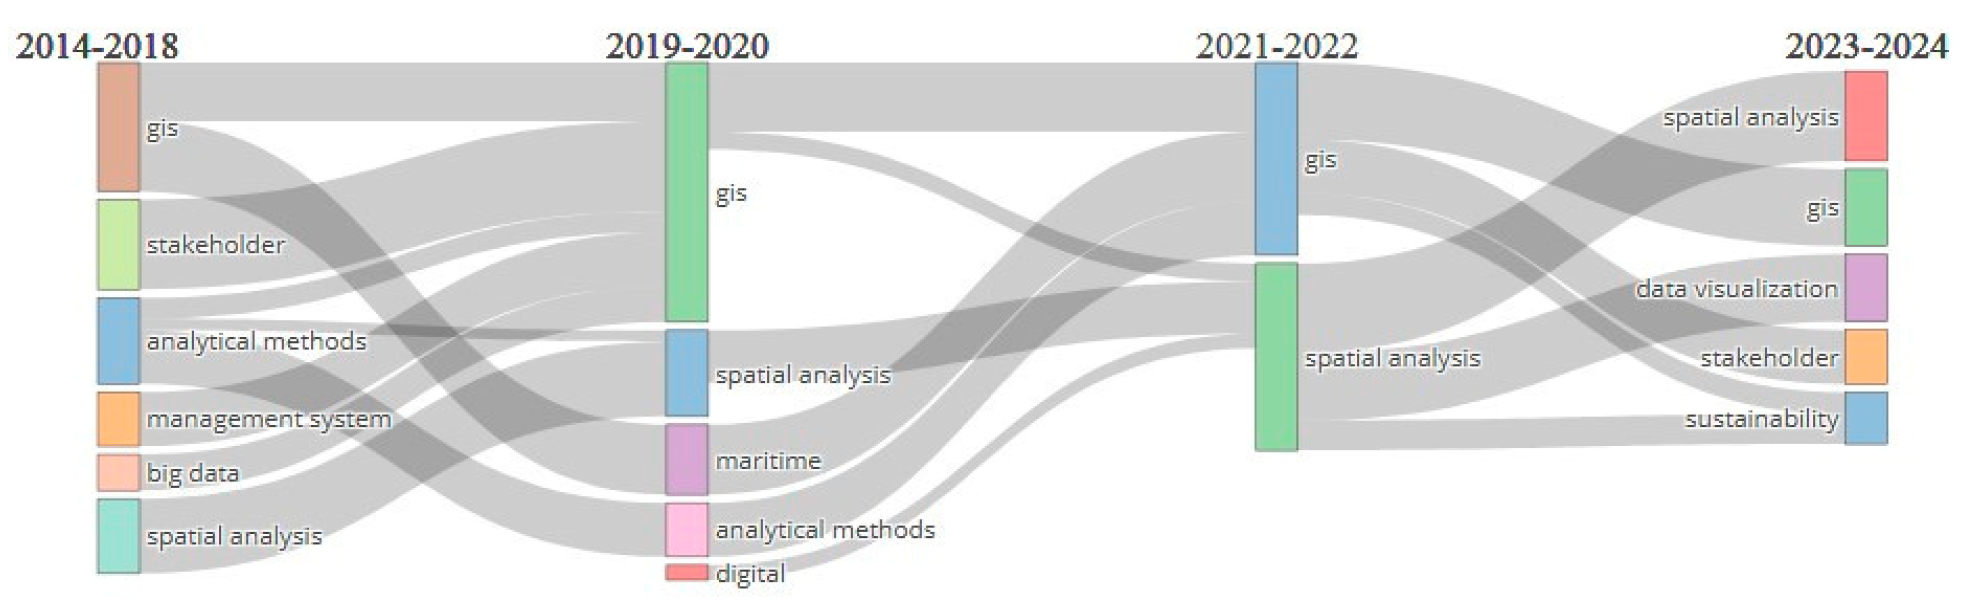
Figure 9.
Thematic evolution from 2023 to 2024. Source: Authors’ elaboration using Bibliometrix and Biblioshiny R packages.
Figure 9.
Thematic evolution from 2023 to 2024. Source: Authors’ elaboration using Bibliometrix and Biblioshiny R packages.
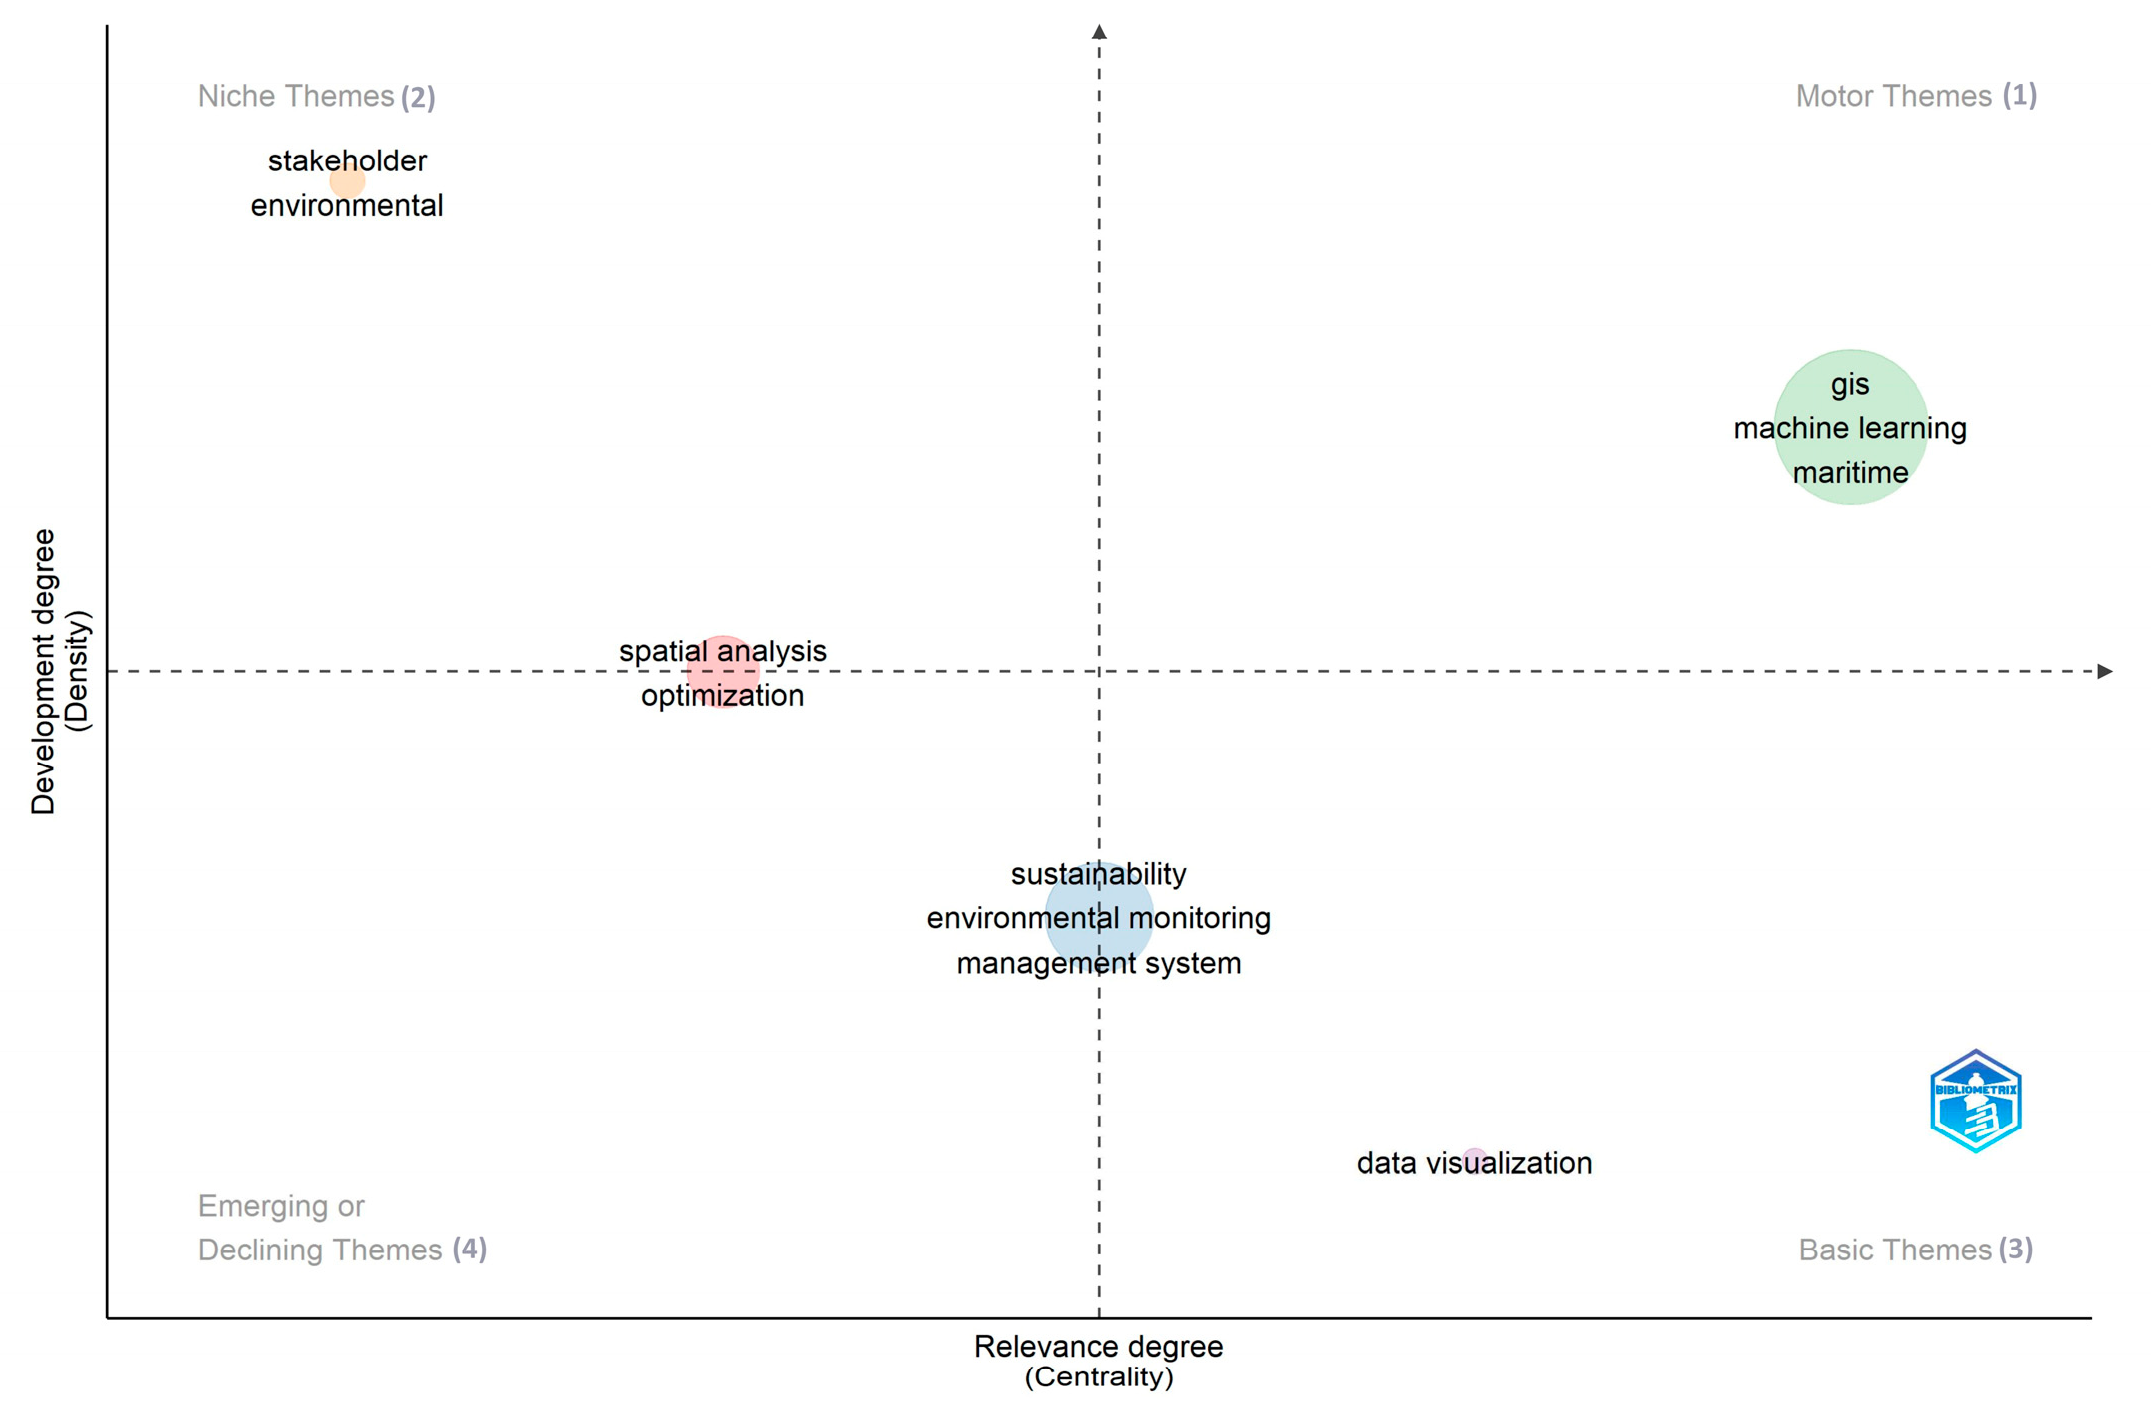

Table 1.
Inclusion criteria in the WOS and Scopus.
| Screening | WOS | Scopus |
| Final Boolean Equation | TS=((("spatial data infrastructure" OR "marine sdi" OR "geogra* information system" OR "gis*" OR "geospatial data integration") AND ("seaport" OR "port" OR (("smart" OR "green" OR "intelligent" OR "automated ") AND "port*") OR "maritime*" OR "logistic*" OR "terminal*" OR "ship*" OR "vessel*" OR "berth*" OR "container*") AND ("interoperability" OR "visualiz*" OR "open data" OR "digital*" OR ("web" AND ("map" OR "service" OR "gis" OR "based gis")) AND ( "map*" OR "dataset" OR "tool" OR "ais" OR "iot")))) | TITLE-ABS-KEY (("spatial data infrastructure" OR "marine sdi" OR "geogra* information system" OR "gis*" OR "geospatial data integration") AND ("seaport" OR "port" OR (("smart" OR "green" OR "intelligent" OR "automated ") AND "port*") OR "maritime*" OR "logistic*" OR "terminal*" OR "ship*" OR "vessel*" OR "berth*" OR "container*") AND ("interoperability" OR "visualiz*" OR "stakeholder*" OR "open data" OR "digital*" OR ("web" AND ("map" OR "service" OR "gis" OR "based gis")) AND ( "map*" OR "dataset" OR "tool" OR "ais" OR "iot"))) AND PUBYEAR AFT 2014 |
| Languages | English | English |
| Document Types | Articles and Review Article | Articles and Review Article |
| Research Areas | Environmental Sciences Ecology, Engineering, Water Resources, Remote Sensing, Computer Science, Imaging Science Photographic Technology, Science Technology Other Topics, Meteorology Atmospheric Sciences, Oceanography, Geography, Transportation, Marine Freshwater Biology, Biodiversity Conservation, Energy Fuels, Operations Research Management Science. | Environmental Science, Earth and Planetary Sciences, Engineering, Agricultural and Biological Sciences, Computer Science, Energy, Business, Management and Accounting, Decision Sciences e Multidisciplinary. |
Table 2.
Main information elaborated using the Bibliometrix and Biblioshiny R packages.
| Type | Description | Results |
| Main information about data | ||
| Period | Years of publication | 2014:2024 |
| Sources (Journals, Books, etc) | Frequency distribution of sources as journals | 279 |
| Documents | Total number of documents | 530 |
| Annual Growth Rate % | Average number of annual growth | 8.59 |
| Document Average Age | Average age of the document | 5.14 |
| Average citations per doc | Average total number of citations per document | 28.65 |
| References | Total number of references or citations | 0 |
| Document contents | ||
| Keywords Plus (ID) | Total number of phrases that frequently appear in the title of an article’s references | 2429 |
| Author's Keywords (DE) | Total number of keywords | 2194 |
| Authors | ||
| Authors | Total number of authors | 2205 |
| Authors of single-authored docs | Number of single authors per article | 26 |
| Authors collaboration | ||
| Single-authored docs | Number of documents written by a single author | 26 |
| Co-Authors per Doc | Average number of co-authors in each document | 4.72 |
| International co-authorships % | Average number of international co-authorships | 24.72 |
| Document types | ||
| Article | Number of articles | 514 |
| Article; early access | Number of early access articles | 6 |
| Review | Number of review articles | 10 |
Disclaimer/Publisher’s Note: The statements, opinions and data contained in all publications are solely those of the individual author(s) and contributor(s) and not of MDPI and/or the editor(s). MDPI and/or the editor(s) disclaim responsibility for any injury to people or property resulting from any ideas, methods, instructions or products referred to in the content. |
© 2025 by the authors. Licensee MDPI, Basel, Switzerland. This article is an open access article distributed under the terms and conditions of the Creative Commons Attribution (CC BY) license (http://creativecommons.org/licenses/by/4.0/).
Copyright: This open access article is published under a Creative Commons CC BY 4.0 license, which permit the free download, distribution, and reuse, provided that the author and preprint are cited in any reuse.


