
Submitted:
10 March 2025
Posted:
11 March 2025
You are already at the latest version
Abstract
Background/Objectives: Quantitative Sensory Testing (QST) is one of the most reliable methods for assessing Fibromyalgia Syndrome (FMS). Despite its importance, there are still controversies regarding the correct interpretation of evoked responses, as they may vary depending on the protocol, individual characteristics, disease severity, and other factors. This study aims to examine how QST has been applied as an outcome measure in FMS. Methods: We considered three databases (Medline, Embase, and Web of Science) until June 2024. From a total of 2,512 studies, 126 (39 RCTs and 87 non-RCTs) were selected for full reading after assessment for risk of bias and eligibility criteria. These criteria included at least one type of QST and a clear diagnosis of fibromyalgia (FMS). Results: Results highlighted a lack of standardization in QST, as no reported protocols were followed and there was no specific number of tender points tested for FMS. Additionally, there was inconsistency in the selection of sites and types of tests conducted. Conclusions: This heterogeneity in methodology may affect the comparability and interpretation of results, underscoring the urgent need for standardized guidelines for conducting QST in fibromyalgia studies. A clear understanding of how QST has been measured could prompt a reevaluation of current approaches to FMS assessment, leading to more accurate interpretations and, ultimately, improved management of this complex condition. Keywords: quantitative sensory testing; fibromyalgia; pain measurement; CPM; temporal summation; sensory function.
Keywords:
quantitative sensory testing
; fibromyalgia
; pain measurement
; CPM
; temporal summation
; sensory function
1. Introduction
Characterized as a widespread chronic pain syndrome, Fibromyalgia Syndrome (FMS) has a complex multifactorial etiopathogenesis that remains not fully understood." [1,2] and affects 3 to 6% of global population [3]. FMS is often associated with impairments in mental health and quality of life [4,5,6,7].
Since 1980, various FMS diagnostic criteria have been developed to reduce subjective clinical judgment, most notably the American College of Rheumatology (ACR), which consider FMS diagnosis as a combined score of the Widespread Pain Index (WPI) and Symptom Severity Scale (SSS) [5]. In this context, Quantitative Sensory Testing (QST) has emerged to improve the precision of sensory deficit detection in FMS by assessing pain thresholds through a combination of static and dynamic protocols that allows the assessment of pain thresholds through isolated stimuli, measuring hyperalgesia or hypoalgesia in specific areas and the perception of pain.
QST is based on measurements of responses to calibrated, graded innocuous or noxious stimuli (generally mechanical or thermal) [8,9,10]. Despite its potential, its implementation can be complex due to cost and protocol selection [11,12]. In FMS, QST protocol variability combined with individual differences and comorbidities, can hinder the interpretation of evoked responses [13]. This lack of standardization impedes understanding, comparison of studies, and development of effective diagnostic and therapeutic strategies [10].
Equivalent difficulties have been observed in other chronic pain conditions, already postulated for previous reviews [14,15]. In brief, the use of QST for painful experiences demonstrated the need for a more standardized approach [14,15]. QST standardization issues, including test site variability and inconsistent definitions, have been reported in other chronic pain conditions like knee osteoarthritis [16] and pediatric populations [17], highlighting the need for consistent protocols to improve reproducibility and clinical applicability [17]. This heterogeneity compromises QST's potential in chronic pain research, including fibromyalgia [18].
Therefore, despite favorable evidence for QST application, there are no previous studies debating the implications of QST protocols in FMS. In this sense, this scoping review aims to clarify the complexities and variations inherent in QST methodologies in FMS. By examining QST protocols and identifying factors that influence their reliability as outcome measures, we believe it will be possible to develop more effective approaches for fibromyalgia syndrome (FMS).
2. Materials and Methods
This scoping review protocol was developed based on the Preferred Reporting Items for Systematic Reviews and Metanalysis Extension for Scoping Reviews, PRISMA-ScR [19] (Suppl. Material 1). The protocol was previously registered (DOI 10.17605/OSF.IO/UN69V).
2.1. Eligibility Criteria
This study considered studies where participants were adults, both sexes, aged 18+ with a clear diagnosis of Fibromyalgia Syndrome- FMS considering any of the ACR criteria. As we are looking for Quantitative Sensory Testing-QST measurement, studies with at least one measure of pain threshold or sensitivity (any study design), were selected. We excluded studies if they had less than 50% of the participants with FMS. Duplicates, reviews, and commentaries on findings from other studies or documents that were not the primary research (for example, conference abstracts) were also excluded.
2.2. Search
This review extracted studies from the following databases: Pubmed (n=508), Embase (n=817), and Web of Science (n=1187). We replicated the primary database search terms (Pubmed) for the others (see Supplementary Material 2). The search was not limited by language or year. The search was made up to June 31, 2024.
2.3. Selection of Sources of Evidence and Critical Appraisal
The quality of the included studies was assessed by two independent reviewers (AMC and VAS), and disagreements will be solved by a third reviewer (MGS). For the RCTs, the ROB 2 tool was used, and for the non-RCTs, the STROBE (see Suppl. Material 3 and 4).
2.4. Data Charting Process
The Rayyan software [20] was used to select studies by title and abstract. It was made by two independent reviewers (AMC and VAS) based on our previously established inclusion/exclusion criteria. The third reviewer (MGS) remained on standby if needed. After a full reading, data were extracted from papers by AMC and VAS using an extraction table developed by the reviewers, independently. In cases where it is not possible, we search for the data protocol or other similar studies made by the author/group, in order to clarify the information. In our study, it was not necessary to consult the authors.
2.5. Data items and Synthesis of Results
For extraction, we considered the study design, quality of the study, sample characteristics, age, sex, distribution, inclusion criteria, diagnosis, type of QST (static or dynamic), and methods applied by the studies. We also got information from other measurements and main conclusions. The data was tabulated and presented in a narrative way, answering the research objectives.
3. Results
The search (up to June 2024) yielded 2512 records, of which 1542 remained after duplicate removal. Following title/abstract screening and full-text review, 126 studies (39 RCTs, 87 non-RCTs) were included (Figure 1). Most participants were women aged 40-59. Participant characteristics (age, gender, study design, diagnostic criteria, QST) are shown in Table 1.
3.1. Quality Assessment
Only studies classified as having a low risk of bias or some concerns were considered, and 30(76.9%) RCTs and 59(67.81%) non RCT’s studies met this criterion. RCT limitations involved lack of information regarding the original protocol and data analysis plan (Supplementary Material 3). In terms of nonRCTs, limitations were related to sample (i.e., recruitment, inclusion, sample size calculation), generalizability and insufficient information regarding sample size and bias (Supplementary Material 4).
3.2. Narrative Synthesis of Quantitative Sensory Testing Methods
A total of 42.9% of studies included both static and dynamic QST assessments, offering a comprehensive approach to sensory evaluation. (Table 2). For those, we divided our results considering both assessments.
3.3. Static QST
Static QST methods comprised 76% of all assessments. Pressure pain thresholds/tolerances (PPTh/PPT) were the most frequently measured (n=84), predominantly at 18 tender points (n=24), hands (n=17), trapezius (n=8), and forearm (n=5), using primarily the Somac algometer (n=54). Mechanical detection/pain thresholds/sensitivity (MDTh/MPTh/MPS, n=10) were assessed mainly at the forearm (n=3) and hands (n=4), often with Von Frey monofilaments (n=5). Thermal pain thresholds/tolerances (TPTh/TPT, n=36) were typically measured at hands (n=9) and forearm (n=7), often with the TSA II Medoc.
3.4. Dynamic QST
Dynamic QST methods constituted 24% of assessments. Temporal Summation (TS, n=15) was primarily assessed at hands (n=7) and forearm (n=4). Conditioned Pain Modulation (CPM, n=26) was frequently tested at forearm (n=12) and hands (n=4), using PPT as the test stimulus and a cold water immersion as the conditioned stimulus.
4. Discussion
This scoping review examined how QST is used in FMS, a complex condition with widespread pain and variable symptom presentation, that per se makes diagnosis and measurement challenging[11,12]. While QST offers a potential surrogate measure to improve pain assessment reliability and validity, and understand neuropathic pain[4,21], this review revealed important methodological issues.
Although static QST is prevalent, variations in body location, stimulus duration, and intensity may affect results. González-Álvarez (2024) demonstrated PPT and CPM variability across test points, reflecting altered pain modulation in FMS. Given the diffuse pain and altered sensation characteristic of FMS, QST at remote sites may reinforce information regarding the central nervous system. The NeuPSIG consensus[10] reinforces the use of multiple test sites, or preferably standardizing test locations in order to improve the accuracy and interpretation by reducing variability and potentially revealing more consistent patterns of somatosensory dysfunction in FMS.
Given the scarcity of studies measuring QST both before and after interventions, QST stability in FMS remains poorly understood. No consistent information regarding the presence of other symptoms was controlled (e.g., sleep disturbances and other non-physical symptoms), neither the impact of psychological factors, the presence of psychopathology or neuropathic pain conditions[14,16]. There is an amount of literature available claiming for a more controlled information of those variables, once they are related to the severity of this disease[5,6,7]. Further research should explore how internal and external factors contribute to FMS progression[22]. Consequently, despite efforts to minimize bias, the generalizability of findings remains limited due to substantial methodological variation.
The diversity in test locations—from high muscle areas (e.g., trapezius, deltoid) to minimal muscle sites (e.g., wrist, thumbnail)—further adds to this heterogeneity. This inconsistency could limit the synthesis of findings across studies and impact the reliability of QST as a biomarker in FMS. Standardization in test locations and stimuli parameters could facilitate future meta-analyses and enhance the clinical applicability of QST.
Furthermore, QST modality definitions might be implicit. For example, while TS and CPM are often used as measures of central sensitization, they also involve the peripheral nervous system – the parameters of the sensitization analysis must be defined to each study. Additional limitations include variability in test parameters (number of tests, duration, rest intervals, stimulus intensity/increment) and equipment. Despite recommended protocols, application remains uncommon, hindering full standardization in this review.
Each of these factors can introduce variations between studies; despite there being recommended standardized protocols and methods, our findings show that their application is not yet common. In our review, even when controlling this information, it was not possible to standardize fully across studies.
Finally, as a strength, this is one of the first studies to recruit the state of art by considering QST measures in FMS. We hope that this scoping review might be able to summarize the need for a more standardized approach to measuring FMS, particularly considering the complex and unpredictable nature of endogenous pain inhibition mechanisms.
5. Conclusions
While promising for FMS assessment, QST's potential is hampered by significant lack of information regarding its validity and reliability. Future research should stratify studies by treatment modality (e.g., pharmacological vs. neuromodulatory) to elucidate treatment-specific effects and optimize patient care. Addressing these gaps promises to significantly advance FMS understanding and improve patient outcomes.
Supplementary Materials
The following supporting information can be downloaded at the website of this paper posted on Preprints.org.
Author Contributions
Author Contributions: Conceptualization, Adriana Munhoz Carneiro and Valquíria Aparecida da Silva; methodology, Adriana Munhoz Carneiro and Valquíria Aparecida da Silva; software, not applicable; validation, Adriana Munhoz Carneiro, Valquíria Aparecida da Silva, and Marina de Góes Salvetti; formal analysis, Adriana Munhoz Carneiro and Valquíria Aparecida da Silva; investigation, Adriana Munhoz Carneiro and Valquíria Aparecida da Silva; resources, Adriana Munhoz Carneiro; data curation, Adriana Munhoz Carneiro and Valquíria Aparecida da Silva; writing—original draft preparation, Adriana Munhoz Carneiro and Valquíria Aparecida da Silva; writing—review and editing, Adriana Munhoz Carneiro, Valquíria Aparecida da Silva, Marina de Góes Salvetti, and Camila Squarzoni Dale; visualization, Adriana Munhoz Carneiro and Valquíria Aparecida da Silva; supervision, Marina de Góes Salvetti and Camila Squarzoni Dale; project administration, Adriana Munhoz Carneiro. All authors have read and agreed to the published version of the manuscript.
Funding
This research received no external funding.
Institutional Review Board Statement
Not applicable.
Informed Consent Statement
Not applicable.
Data Availability Statement
Not applicable.
Conflicts of Interest
The authors declare no conflicts of interest
Abbreviations
The following abbreviations are used in this manuscript:
| FMS | Fibromyalgia Syndrome |
| QST | Quantitative Sensory Testing |
| ACR | American College of Rheumatology |
| VAS | Visual Analog Scale |
| PPTh/PPT | Pressure Pain Threshold/Tolerance |
| MDTh/MPTh/MPS | Mechanical Detection/Pain Thresholds/Sensitivity |
| TPTh/TPT | Thermal Pain Threshold/Tolerance |
| TS | Temporal Summation |
| CPM | Conditioned Pain Modulation |
| RCT | Randomized Controlled Trial |
| ROB 2 | Risk of Bias Tool 2 |
| PRISMA-ScR | Preferred Reporting Items for Systematic Reviews and Meta-Analyses Extension for Scoping Reviews |
References
- D’Agnelli, S.; Arendt-Nielsen, L.; Gerra, M.C.; Zatorri, K.; Boggiani, L.; Baciarello, M.; Bignami, E. Fibromyalgia: Genetics and Epigenetics Insights May Provide the Basis for the Development of Diagnostic Biomarkers. Mol. Pain 2019, 15, 1744806918819944. [Google Scholar] [PubMed]
- Mueller, C.; Fang, Y.-H.D.; Jones, C.; McConathy, J.E.; Raman, F.; Lapi, S.E.; Younger, J.W. Evidence of Neuroinflammation in Fibromyalgia Syndrome: A [ 18 F]DPA-714 Positron Emission Tomography Study. Pain 2023, 164, 2285–2295. [Google Scholar] [PubMed]
- Mulder, B. Fibromyalgia Prevalence Available online:. Available online: https://www.fmaware.org/fibromyalgia-prevalence/ (accessed on 24 April 2024).
- Siracusa, R.; Paola, R.D.; Cuzzocrea, S.; Impellizzeri, D. Fibromyalgia: Pathogenesis, Mechanisms, Diagnosis and Treatment Options Update. Int. J. Mol. Sci. 2021, 22. [Google Scholar] [CrossRef]
- Wolfe, F.; Clauw, D.J.; Fitzcharles, M.-A.; Goldenberg, D.L.; Katz, R.S.; Mease, P.; Russell, A.S.; Russell, I.J.; Winfield, J.B.; Yunus, M.B. The American College of Rheumatology Preliminary Diagnostic Criteria for Fibromyalgia and Measurement of Symptom Severity. Arthritis Care Res. 2010, 62, 600–610. [Google Scholar]
- Beiner, E.; Lucas, V.; Reichert, J.; Buhai, D.-V.; Jesinghaus, M.; Vock, S.; Drusko, A.; Baumeister, D.; Eich, W.; Friederich, H.-C.; et al. Stress Biomarkers in Individuals with Fibromyalgia Syndrome: A Systematic Review with Meta-Analysis. Pain 2023, 164, 1416–1427. [Google Scholar]
- Bair, M.J.; Krebs, E.E. Fibromyalgia. Ann. Intern. Med. 2020, 172, ITC33–ITC48. [Google Scholar]
- Arendt-Nielsen, L.; Graven-Nielsen, T. Translational Musculoskeletal Pain Research. Best Pract. Res. Clin. Rheumatol. 2011, 25, 209–226. [Google Scholar]
- Georgopoulos, V.; Akin-Akinyosoye, K.; Zhang, W.; McWilliams, D.F.; Hendrick, P.; Walsh, D.A. Quantitative Sensory Testing and Predicting Outcomes for Musculoskeletal Pain, Disability, and Negative Affect: A Systematic Review and Meta-Analysis. Pain 2019, 160, 1920–1932. [Google Scholar]
- Backonja, M.M.; Attal, N.; Baron, R.; Bouhassira, D.; Drangholt, M.; Dyck, P.J.; Edwards, R.R.; Freeman, R.; Gracely, R.; Haanpaa, M.H.; et al. Value of Quantitative Sensory Testing in Neurological and Pain Disorders: NeuPSIG Consensus. Pain 2013, 154, 1807–1819. [Google Scholar]
- da Silva, L.A.; Kazyiama, H.H.S.; Teixeira, M.J.; de Siqueira, S.R.D.T. Quantitative Sensory Testing in Fibromyalgia and Hemisensory Syndrome: Comparison with Controls. Rheumatol. Int. 2013, 33, 2009–2017. [Google Scholar]
- Hurtig, I.M.; Raak, R.I.; Kendall, S.A.; Gerdle, B.; Wahren, L.K. Quantitative Sensory Testing in Fibromyalgia Patients and in Healthy Subjects: Identification of Subgroups. Clin. J. Pain 2001, 17, 316–322. [Google Scholar] [PubMed]
- Schmelz, M. What Can We Learn from the Failure of Quantitative Sensory Testing? Pain 2021, 162, 663–664. [Google Scholar] [PubMed]
- Arendt-Nielsen, L.; Yarnitsky, D. Experimental and Clinical Applications of Quantitative Sensory Testing Applied to Skin, Muscles and Viscera. J. Pain 2009, 10, 556–572. [Google Scholar] [PubMed]
- Backonja, M.-M.; Walk, D.; Edwards, R.R.; Sehgal, N.; Moeller-Bertram, T.; Wasan, A.; Irving, G.; Argoff, C.; Wallace, M. Quantitative Sensory Testing in Measurement of Neuropathic Pain Phenomena and Other Sensory Abnormalities. Clin. J. Pain 2009, 25, 641–647. [Google Scholar]
- Rankin, J.; Rudy-Froese, B.; Hoyt, C.; Ramsahoi, K.; Gareau, L.; Howatt, W.; Carlesso, L. Quantitative Sensory Testing Protocols to Evaluate Central and Peripheral Sensitization in Knee OA: A Scoping Review. Pain Med. 2022, 23, 526–557. [Google Scholar]
- Tutelman, P.R.; MacKenzie, N.E.; Chambers, C.T.; Coffman, S.; Cornelissen, L.; Cormier, B.; Higgins, K.S.; Phinney, J.; Blankenburg, M.; Walker, S. Quantitative Sensory Testing for Assessment of Somatosensory Function in Children and Adolescents: A Scoping Review. Pain Rep 2024, 9, e1151. [Google Scholar]
- Rolke, R.; Magerl, W.; Campbell, K.A.; Schalber, C.; Caspari, S.; Birklein, F.; Treede, R.-D. Quantitative Sensory Testing: A Comprehensive Protocol for Clinical Trials. Eur J Pain 2006, 10, 77–88. [Google Scholar]
- Tricco, A.C.; Lillie, E.; Zarin, W.; O’Brien, K.K.; Colquhoun, H.; Levac, D.; Moher, D.; Peters, M.D.J.; Horsley, T.; Weeks, L.; et al. PRISMA Extension for Scoping Reviews (PRISMA-ScR): Checklist and Explanation. Ann. Intern. Med. 2018, 169, 467–473. [Google Scholar]
- Ouzzani, M.; Hammady, H.; Fedorowicz, Z.; Elmagarmid, A. Rayyan-a Web and Mobile App for Systematic Reviews. Syst Rev 2016, 5, 210. [Google Scholar]
- Mücke, M.; Cuhls, H.; Radbruch, L.; Baron, R.; Maier, C.; Tölle, T.; Treede, R.-D.; Rolke, R. Quantitative Sensory Testing (QST). English Version. Schmerz 2021, 35, 153–160. [Google Scholar]
- Rehm, S.; Sachau, J.; Hellriegel, J.; Forstenpointner, J.; Børsting Jacobsen, H.; Harten, P.; Gierthmühlen, J.; Baron, R. Pain Matters for Central Sensitization: Sensory and Psychological Parameters in Patients with Fibromyalgia Syndrome. Pain Rep 2021, 6, e901. [Google Scholar]
Figure 1.
Study flow chart.
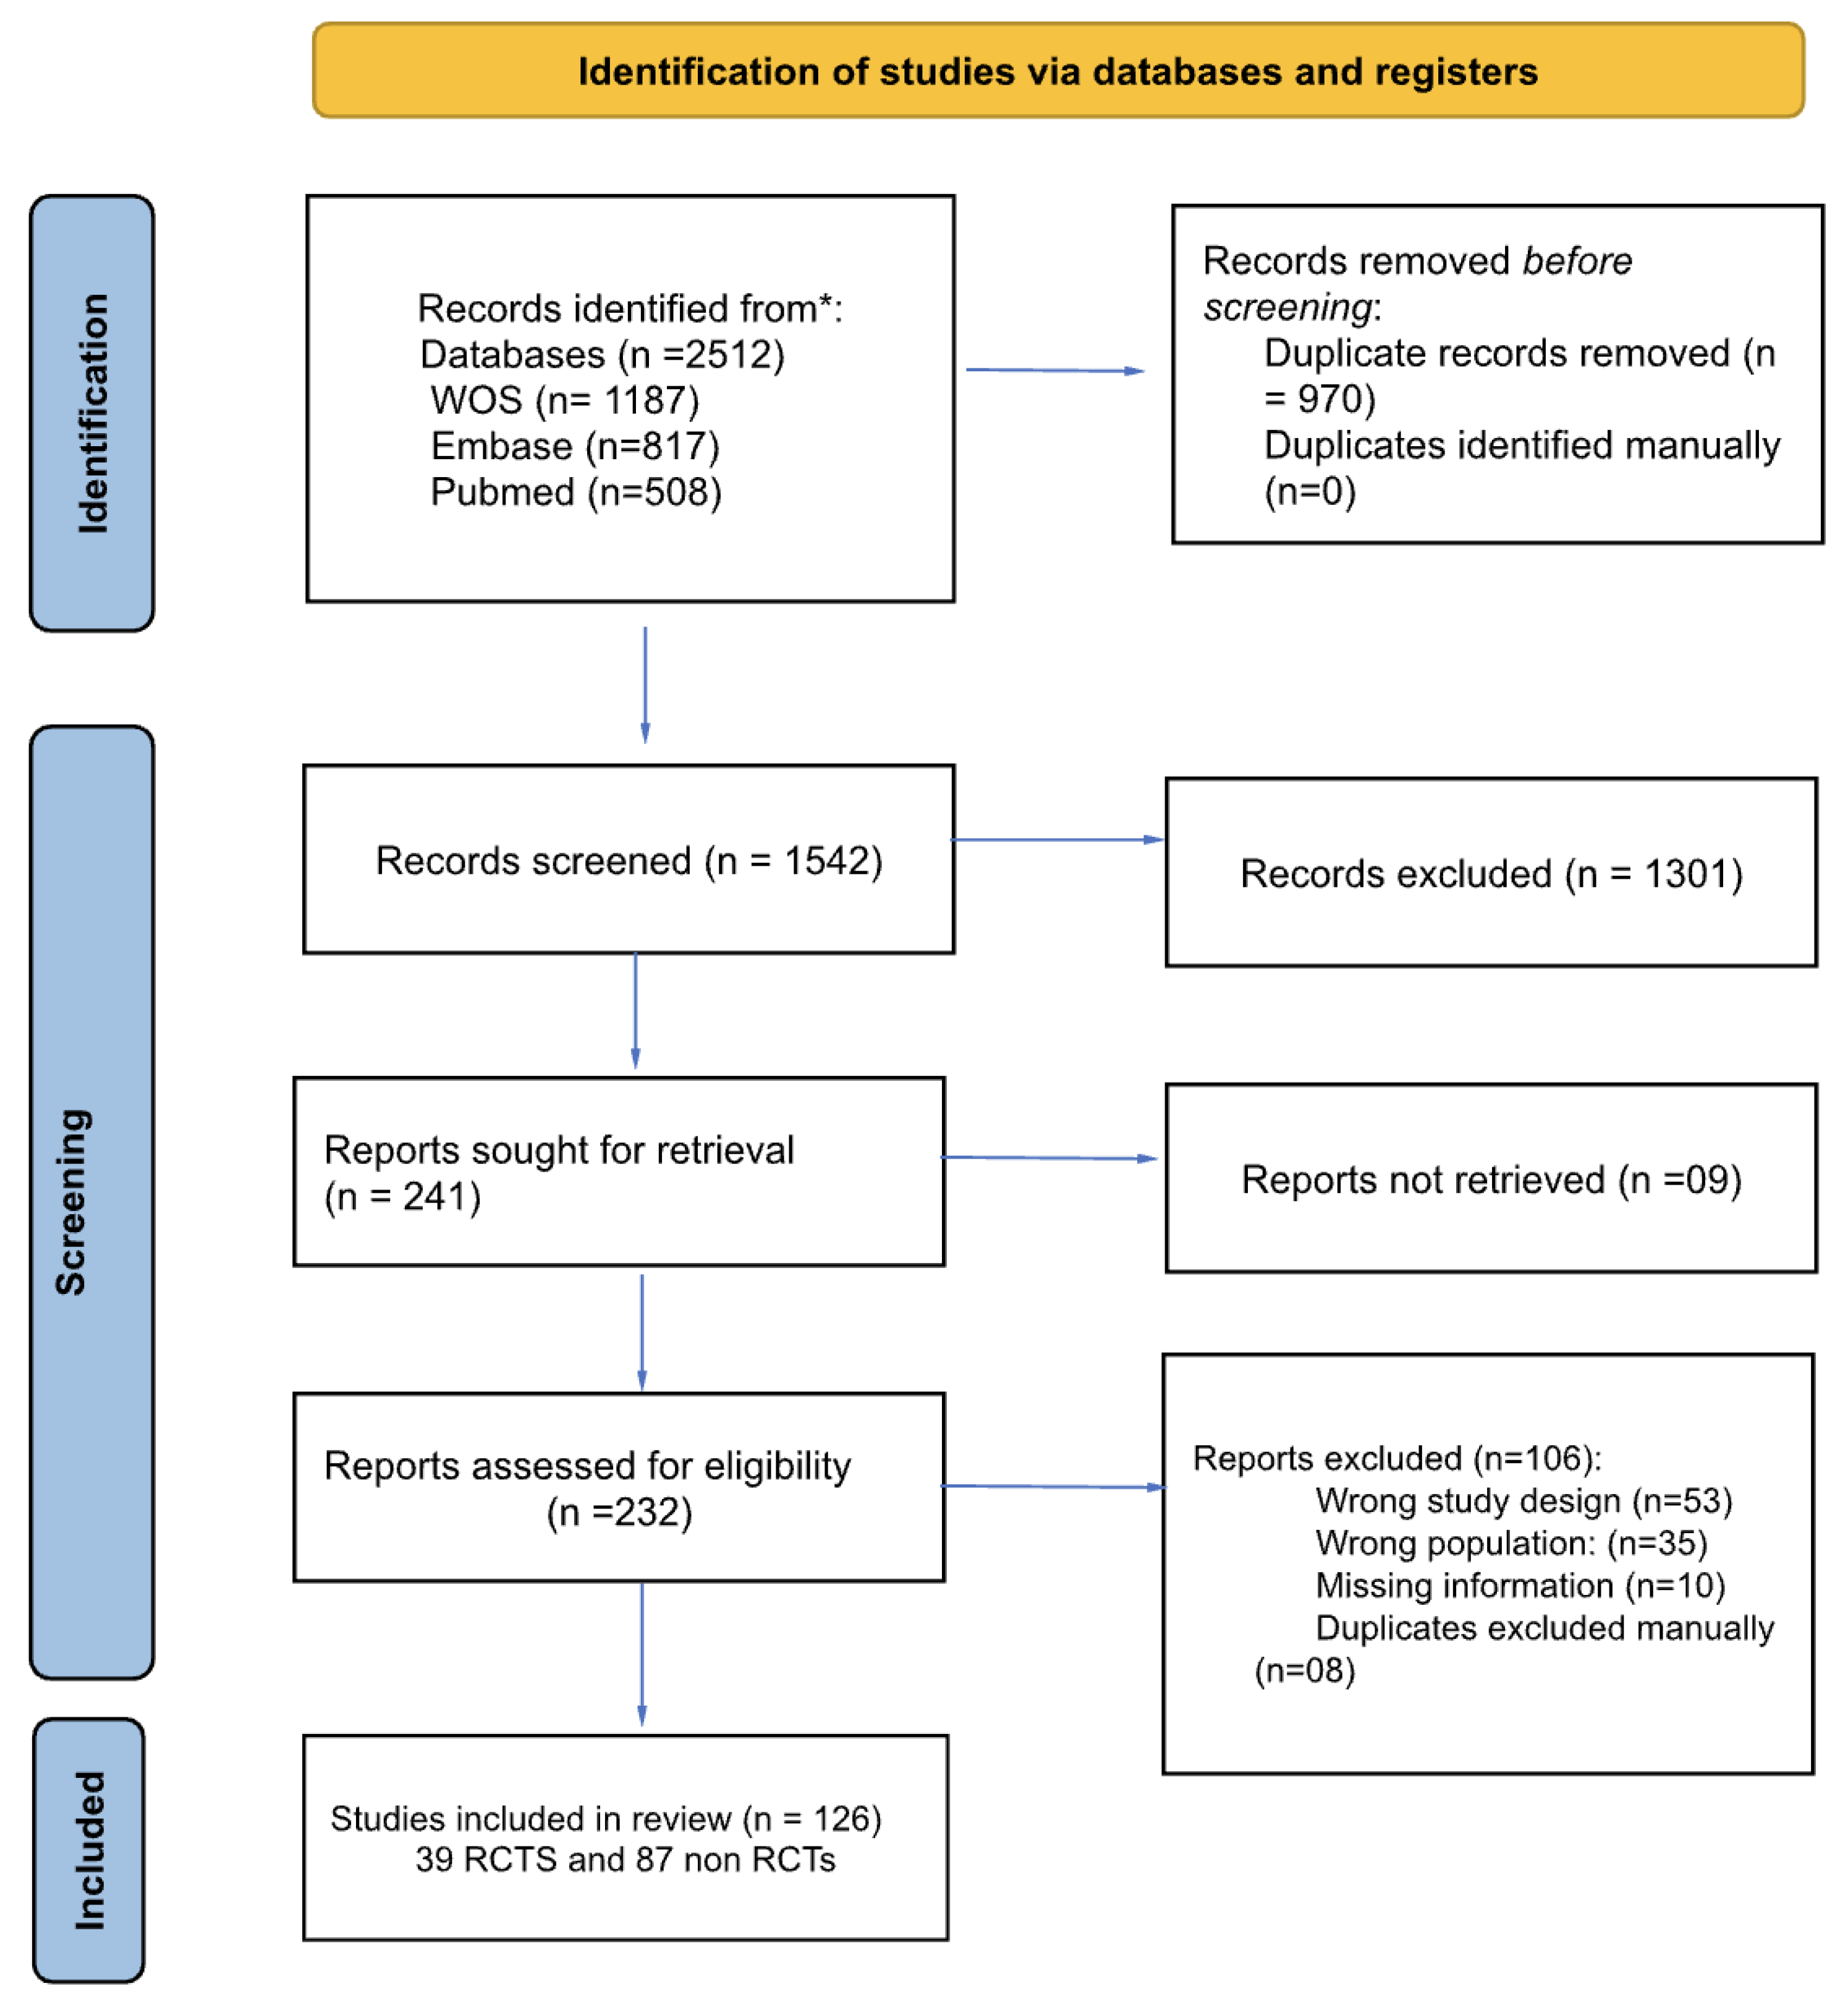

Table 1.
Characterization of the studies using QST methods in patients with FMS from the retrieved studies (n= 126).
Table 1.
Characterization of the studies using QST methods in patients with FMS from the retrieved studies (n= 126).
| Author, Year | Design | ACR Diagnostic Criteria |
Arms | Total Females (%) |
Age Mean (SD) | QST Static |
QST Dynamic |
|---|---|---|---|---|---|---|---|
| Sorensen, 1995 | Non RCT | 1990 | 3 | 100 | 47.5 (7.5) | Yes | No |
| Kosek, 1997 | Non RCT | 1990 | 2 | 100 | 42.5 (28.5) | Yes | No |
| Ernberg, 1997 | Non RCT | 1990 | 2 | 92 | 48.5 (14.3) | Yes | No |
| Hurtig, 2001 | Non RCT | 1990 | 2 | 100 | 43 (37.9) | Yes | No |
| Price, 2002 | Non RCT | 1990 | 2 | 100 | 45.5 (12.5) | No | Yes |
| Desmeules, 2003 | Non RCT | 1990 | 2 | 88 | 48.3 (10.3) | Yes | No |
| Staud, 2003 | Non RCT | 1990 | 1 | 87.3 | 49.9 (10.4) | No | Yes |
| Ernberg, 2003 | Non RCT | 1990 | 2 | 92 | 48.5 (14.3) | Yes | No |
| Kendall, 2003 | Non RCT | 1990 | 3 | 100 | 43.6 (7.3) | Yes | No |
| Yildiz, 2004 | RCT | 1990 | 2 | 70 | 40.1 (4.7) | Yes | No |
| Staud, 2004 | Non RCT | 1990 | 2 | 100 | 42.9 (13.04) | Yes | No |
| Staud, 2004 | Non RCT | 1990 | 1 | 94.6 | 49.6 (11.5) | Yes | No |
| Giesecke, 2005 | Non RCT | 1990 | 2 | 62.3 | 40.2 (9) | Yes | No |
| Montoya, 2005 | Non RCT | 1990 | 2 | 100 | 51.6 (5.9) | Yes | No |
| Staud, 2005 | Non RCT | 1990 | 2 | 100 | 47.05 (8.7) | Yes | No |
| Geisser, 2007 | Non RCT | 1990 | 3 | 100 | 39.6 ( 9.2) | Yes | No |
| Jespersen, 2007 | Non RCT | 1990 | 2 | 100 | 47 (6.08) | Yes | No |
| Smith, 2008 | Non RCT | 1990 | 2 | 100 | 48 (6.8) | Yes | No |
| Targino, 2008 | RCT | 1990 | 2 | 100 | 51.6 (11.07) | Yes | No |
| Diers, 2008 | Non RCT | 1990 | 2 | 86.7 | 50.4(9.5) | Yes | No |
| Staud, 2008 | Non RCT | 1990 | 2 | 100 | 43.15 (9) | No | Yes |
| Suman, 2009 | Non RCT | 1990 | 2 | 100 | 44.8 (11.7) | Yes | No |
| Ge, 2009 | Non RCT | 1990 | 2 | 100 | 53 (2.4) | Yes | No |
| Stening, 2010 | RCT | 1990 | 2 | 100 | 54.3 (3.4) | Yes | No |
| Nelson, 2010 | RCT | 1990 | 2 | 100 | 51.7 (10.3) | Yes | No |
| Tastekin, 2010 | Non RCT | 1990 | 2 | 100 | 42.7 (6.7) | Yes | No |
| de Bruijn, 2011 | Non RCT | 1990 | 1 | 100 | 37.3 (7.7) | Yes | No |
| Hassett, 2012 | Non RCT | 1990 | 2 | 100 | 41.1 (10.8) | Yes | No |
| Martínez-Jauand, 2012 | Non RCT | 1990 | 2 | 100 | 50.5 (9.4) | Yes | No |
| Paul-Savoie, 2012 | Non RCT | 1990 | 2 | 100 | 49.8 (9.3) | Yes | Yes |
| Hargrove, 2012 | RCT | 1990 | 2 | 92.2 | 52.6 (3.1) | Yes | No |
| Hooten, 2012 | RCT | 1990 | 2 | 90.3 | 46.5 (10.8) | Yes | No |
| Hassett, 2012 | Non RCT | 1990 | 2 | 100 | 38.8 (11.7) | Yes | No |
| Castro-Sanchez, 2012 | Non RCT | 1990 | 2 | 50 | 52 (5.5) | Yes | No |
| Burgmer, 2012 | Non RCT | 1990 | 2 | 100 | 52.59 (7.95) | Yes | No |
| Van Oosterwijck, 2013 | RCT |
1990 |
2 | 80 | 45.8 (10.9) | Yes | No |
| Üçeyler, 2013 | Non RCT | 1990 | 2 | 91.42 | 56.4 (28.9) | Yes | No |
| Crettaz, 2013 | Non RCT | 1990 | 2 | 100 | 40.2 (9.2) | Yes | Yes |
| Da Silva, 2013 | Non RCT | 1990 | 2 | 96 | 49.9 (14.5) | Yes | Yes |
| Casanueva, 2013 | RCT | 1990 | 2 | 100 | 53.7 (10.8) | Yes | No |
| Belenguer-Prieto, 2013 | Non RCT | 1990 | 2 | 96.7 | 50.8 (7.8) | Yes | No |
| Staud, 2014 | RCT | 1990 | 3 | 100 | 45.8 (14.8) | Yes | No |
| Bokarewa, 2014 | Non RCT | 1990 | 3 | 100 | 51 (2.5) | Yes | No |
| Castro-Sanchez, 2014 | RCT | 1990 | 2 | 54 | 53.5(7.5) | Yes | No |
| Staud, 2014 | Non RCT | 1990 | 2 | 100 | 45.8 (14.8) | Yes | No |
| Vandenbroucke, 2014 | Non RCT | 2010 | 2 | 94.8 | 39 (11.7) | Yes | No |
| Staud, 2015 | RCT | 1990 | 2 | 91.80 | 47.2 (12) | Yes | No |
| Qin, 2015 | Non RCT | 1990 | 2 | 86.05 | 45(9.5) | Yes | No |
| Soriano-Maldonado, 2015 | Non RCT | 1990 | 1 | 100 | 48.3 (7.8) | Yes | No |
| Kin, 2015 | Non RCT | 2010 | 2 | 84 | 44,6 (13.08) | Yes | No |
| Zamuner, 2015 | Non RCT | 1990 | 2 | 100 | 47.07 (7) | Yes | No |
| Efrati, 2015 | RCT | 1990 | 2 | 100 | 49.2 (11) | Yes | No |
| Oudejans, 2016 | RCT | 1990 | 1 | 92.31 | 39.2 (60.1) | Yes | Yes |
| Potvin, 2016 | Non RCT | 1990 | 2 | 93.41 | 49.5 (8.2) | Yes | Yes |
| Schoen, 2016 | Non RCT | 1990 | 2 | 100 | 42.7 (10.8) | Yes | Yes |
| Barbero, 2017 | Non RCT | 1990/2010 | 1 | 100 | 49.5 (8.1) | Yes | No |
| Forti, 2016 | Non RCT | 1990 | 2 | 100 | 48.9 (7.2) | Yes | No |
| Gomez-Perretta, 2016 | Non RCT | 1990 | 2 | 100 | 46.2 (10.5) | Yes | No |
| Saral, 2016 | RCT | 1990 | 3 | 100 | 41.7 (7.7) | Yes | No |
| Mendonça, 2016 | RCT | 2010 | 3 | 97.8 | 19.5 (8.19) | Yes | No |
| Luciano, 2016 | RCT | 1990 | 1 | 100 | 57.28 (8.81) | Yes | No |
| Gerhardta, 2017 | Non RCT | 1990 | 3 | 72.88 | 56.8 (10) | Yes | Yes |
| de la Coba, 2017 | Non RCT | 1990 | 2 | 100 | 53.09 (9.38) | No | Yes |
| Freitas, 2017 | Non RCT | 1990 | 2 | 100 | 53.03(10.2) | Yes | No |
| Baumueller, 2017 | RCT | 1990 | 2 | 100 | 55.6 (6.1) | Yes | No |
| Harper, 2018 | Non RCT | 1990 | 2 | 100 | 40.7 (11.2) | No | Yes |
| Pickering, 2018 | RCT | 2010 | 2 | 100 | 46.7 (10.6) | Yes | Yes |
| Merriwether, 2018 | Non RCT | 1990 | 1 | 100 | 49.3 (11.5) | Yes | Yes |
| Wodehouse, 2018 | Non RCT | 1990/2010 | 1 | 92.8 | 46.7(10.5) | Yes | Yes |
| Albers, 2018 | RCT | 1990 | 3 | 100 | 55.4 (11.9) | Yes | No |
| Galvez-Sanchez, 2018 | Non RCT | 2010 | 2 | 100 | 49.02(8.2) | Yes | No |
| Eken, 2018 | Non RCT | 1990 | 2 | 94 | 36.9 (7.5) | Yes | No |
| de la Coba, 2018 | Non RCT | 1990 | 2 | 100 | 53.09 (10.4) | No | Yes |
| Evdokimov, 2019 | Non RCT | 1990/2010 | 2 | 100 | 52 (15.8) | Yes | Yes |
| Brietzke, 2019 | Non RCT | 2010 | 2 | 100 | 42.2 (7.1) | Yes | Yes |
| Amer-Cuenca, 2019 | RCT | 1990/2010 | 4 | 100 | 53.2 (9) | Yes | Yes |
| Donk, 2019 | RCT | 2010 | 2 | 94.1 | 44.5 (22.6) | Yes | Yes |
| Andrade, 2019 | RCT | 1990 | 2 | 100 | 51.9 (8) | Yes | No |
| Udina-Cortés, 2020 | RCT | 2010 | 2 | 100 | 52 (8.8) | Yes | Yes |
| Uygur-Kucukseymena, 2020 | Non RCT | 2010 | 1 | 88.5 | 53(13.52) | No | Yes |
| Kaziyama, 2020 | Non RCT | 2010 | 2 | 100 | 44.4 (6.3) | Yes | No |
| Pickering, 2020 | Non RCT | 2016 | 2 | 100 | 51 (9.6) | Yes | No |
| Sarmento, 2020 | RCT | 2010 | 2 | 100 | 48.8 (11.4) | Yes | No |
| Yuan, 2020 | Non RCT | 1990 | 2 | 97 | 51.07 (8.16) | Yes | No |
| Han, 2020 | Non RCT | 2010 | 2 | 97 | 52 (8.74) | Yes | No |
| Izquierdo-Alventosa, 2020 | RCT | 2016 | 2 | 100 | 54 (7.9) | Yes | No |
| Rehm, 2021 | Non RCT | 1990 | 1 | 95.5 | 50.4 (9.6) | Yes | No |
| Falaguera-Vera, 2020 | Non RCT | 1990/2010 | 2 | 100 | 55.6 (7.2) | Yes | No |
| Staud, 2021 | Non RCT | 1990 | 2 | 100 | 48 (11.9) | Yes | No |
| Jamison, 2021 | RCT | 2010 | 2 | 100 | 50.4 (13.5) | Yes | Yes |
| Jamison, 2021 | RCT | 2010 | 2 | 93.3 | 50.3 (13.5) | Yes | Yes |
| Soldatelli, 2021 | Non RCT | 2010/2016 | 2 | 100 | 49.3 (8.6) | Yes | Yes |
| Karamanlioglu, 2021 | RCT | 2010 | 2 | 100 | 43.7 (8.1) | Yes | No |
| Izquierdo-Alventosa, 2021 | RCT | 2016 | 3 | 100 | 52.8 (8.2) | Yes | No |
| Van Campen, 2021 | Non RCT | 2010 | 3 | 100 | 39.6 (12.3) | Yes | Yes |
| Weber, 2022 | Non RCT | 2016 | 2 | 81 | 49.9 (8.4) | Yes | Yes |
| Pacheco-Barrios, 2022 | Non RCT | 2010 | 1 | 86.21 | 47.6 (11.5) | Yes | Yes |
| De Paula, 2022 | RCT | 2016 | 4 | 100 | 49.3 (2.1) | Yes | Yes |
| Tour, 2022 | Non RCT | 1990 | 2 | 100 | 47.5 (7.8) | Yes | Yes |
| Serrano, 2022 | Non RCT | 2016 | 2 | 100 | 48.2 (9.8) | Yes | Yes |
| Alsouhibani, 2022 | RCT | 2010 | 2 | 88.4 | 49.8 (14.4) | Yes | Yes |
| Franco, 2022 | Non RCT | 2016 | 2 | 100 | 49.9 (10) | No | Yes |
| Samartin-Veiga, 2022 | RCT | 2010 | 4 | 100 | 50.2 (8.7) | Yes | No |
| Lin, 2022 | RCT | 2016 | 2 | 100 | 48.5 (13.02) | Yes | No |
| Castelo-Branco, 2022 | Non RCT | 2010 | 4 | 87.8 | 48.8 (10.1) | No | Yes |
| Berwick, 2022 | Non RCT | 1990/2010 | 90 | 49.4 (10.6) | Yes | No | |
| Fanton, 2022 | Non RCT | 1990/2010 | 100 | 47.6 (7.7) | Yes | No | |
| Ablin, 2023 | RCT | 2016 | 2 | 79.3 | 45.1 (12.3) | Yes | Yes |
| Berardi, 2023 | RCT | 1990 | 4 | 100 | 48.7 (11.7) | Yes | Yes |
| Cigaran-Mendez, 2023 | Non RCT | 1990/2010 | 2 | 100 | 52.5(11) | Yes | Yes |
| Soldatelli, 2023 | Non RCT | 1990 | 2 | 100 | 49.6 (7.7) | No | Yes |
| Leone, 2023 | Non RCT | 2016 | 3 | 88.30 | 49.1 (11.7) | Yes | Yes |
| Bao, 2023 | RCT | 2016 | 3 | 100 | 43.6 (14.3) | No | Yes |
| Kumar, 2023 | Non RCT | 2010 | 1 | 100 | 35.1 (8.9) | Yes | No |
| Tapia-Haro, 2023 | Non RCT | 2010 | 1 | 100 | 56.06 (6.41) | Yes | No |
| Sanzo, 2024 | RCT | 2010 | 2 | 100 | 52.07(2.28) | Yes | Yes |
| Baumler, 2024 | Non RCT | 2010/2016 | 2 | 100 | 54.9(13.02) | Yes | No |
| Neira, 2024 | Non RCT | 1990/2010 | 2 | 100 | 50 (9) | Yes | No |
| Marshall, 2024 | Non RCT | 2016 | 3 | 93 | 45.4 (15.0) | Yes | No |
| Boussi-Gross, 2024 | RCT | 2016 | 2 | 100 | 33.3 (5.9) | Yes | Yes |
| Coupel, 2024 | Non RCT | 2010 | 2 | 98.2 | 50.91 (10.04) | Yes | No |
| Berardi, 2024 | RCT | 1990 | 4 | 100 | 49.05 (11.6) | Yes | Yes |
| Aoe, 2024 | Non RCT | 2016 | 2 | 90 | 42.4 (11.1) | Yes | No |
| Castelo-Branco, 2024 | Non RCT | 2010 | 1 | 86.5 | 48.08 (11.12) | No | Yes |
| Gil-Ugidos, 2024 | Non RCT | 2010 | 1 | 100 | 56.06 (6.41) | Yes | No |
| Gungormus,2024 | RCT | 2016 | 2 | 100 | 54.5 (7.5) | Yes | Yes |
American College of Rheumatology (ACR), Standard Deviation (SD), Quantitative Sensory Testing (QST).
Table 2.
Summary of Static and Dynamic Quantitative Sensory Testing Across Body Locations.
| Test Category | Testing Location | Test Category | Testing Location |
|---|---|---|---|
|
Static Quantitative Sensory Testing |
Dynamic Quantitative Sensory Testing |
||
| Mechanical Detection, Pain threshold or Mechanical Pain Sensitivity |
Forearm n=3Hands n=4Variable n=3 | Windup and Temporal Summation - Mechanical or Thermal | Forearm n=4 Hands n=7 Foots n=1 Variable n=3 |
| Pressure Pain Threshold (PPT) | Forearm n=5 Hands n=17 Trapezius n=8 18 tender points n=24 Variable n=30 |
Conditioned Pain Modulation (CPM) | Forearm n=12 Hands n=4 Foots n=2 Variable n=8 |
| Cold Pain Threshold or Cold Pain Tolerance | Forearm n=2 Hands n=9 Variable n=5 |
||
| Heat Pain Threshold or Tolerance | Forearm n=7 Hands n=6 Variable n=7 |
This table presents a summary of key findings from quantitative sensory testing, with a particular emphasis on the primary body locations targeted in these assessments. The left section of the table summarizes static sensory tests, such as mechanical and thermal detection/pain thresholds and pressure pain thresholds, while the right section focuses on dynamic sensory tests, including temporal summation and conditioned pain modulation. It should be noted that the referenced numbers correspond to studies that provide further detail on the test results for each specified location.
Disclaimer/Publisher’s Note: The statements, opinions and data contained in all publications are solely those of the individual author(s) and contributor(s) and not of MDPI and/or the editor(s). MDPI and/or the editor(s) disclaim responsibility for any injury to people or property resulting from any ideas, methods, instructions or products referred to in the content. |
© 2025 by the authors. Licensee MDPI, Basel, Switzerland. This article is an open access article distributed under the terms and conditions of the Creative Commons Attribution (CC BY) license (http://creativecommons.org/licenses/by/4.0/).
Copyright: This open access article is published under a Creative Commons CC BY 4.0 license, which permit the free download, distribution, and reuse, provided that the author and preprint are cited in any reuse.


