
Submitted:
11 March 2025
Posted:
12 March 2025
You are already at the latest version
Abstract
The Aral Sea Basin in Central Asia is the site of one of the world's greatest man-made disasters. Although irrigation has been developed since ancient times, massive water withdrawals since the second half of the twentieth century appear to have irreversibly dried up the Aral Sea and disrupted the flow of the Amu Darya and Syr Darya rivers. This study reviews the use of satellite data over the last sixty years, using peer-reviewed papers available on Scopus. The focus is on geoscientific aspects such as atmosphere, water resources, geology and geological hazards. The main sensors used were Terra-MODIS, NOAA-AVHRR or the Landsat series. Some types of data have been little used, such as radar data, US or Soviet archives and very high resolution data such as OrbView-3. Remote sensing data provide an indispensable archive for monitoring the drying up of the Aral Sea, once the fourth largest continental body of water. However, less than 8% of publications dealing with the Aral region use remote sensing. Sentinel-2 data are used to illustrate the construction of the Qosh Tepa Canal in Afghanistan, and in particular the problem of water leakage, which is emblematic of the regional dysfunction of water management.
Keywords:
remote sensing
; Central Asia
; water
; irrigation
; climate change
; Qosh Tepa Canal
1. Introduction
The Aral Sea disaster is one of the most spectacular manifestations of human impact on the environment [1,2,3,4,5,6,7]. The region provides a compelling case for examining the consequences of water-related development interventions and their impact on human population, settlement and migration [8,9]. Before 1960, the Aral Sea was a vast expanse of salt water covering approximately 68,000 km², the fourth largest continental body of water (Figure 1). The term 'Aral Sea' would therefore be more appropriate than 'Aral Lake'. In 1870 and 1895, the surface area was of the same order of magnitude, estimated at 65,781 km² and 67,769 km² respectively [10,11]. The endoreic depression, with its 1,100 km3 of water, was fed by the Amu Darya and Syr Darya, two rivers originating in the Pamir and Tien Shan, respectively (Figure 1). As early as the end of the 19th century, scientists pointed to the vulnerability of the Aral Sea and the risk of its drying up, as the Amu Darya and Syr Darya basins "showed clear signs of gradual drying up over their entire surface" [10]. The area was mapped by Russian military topographers after the conquest of Central Asia in the late 19th century. Most of the major work began after the Russian Revolution. The priority was to create a modern irrigation network in the Amu Darya delta (Khorezm region). The Syr Darya was not developed at that time, except in the upper Fergana Valley. In the upstream part of the basin, work began on the tributaries of the Amu Darya and Syr Darya to produce hydroelectric power and irrigate land that had been fertile in ancient times. These works, which drew little water from the main rivers, had no real impact on the Aral Sea. The major changes that led to the Aral Sea disaster occurred mainly in the period after the Second World War, when major works were carried out in the Khorezm, with the creation of a new regional capital at Nukus. The various developments led to the complete irrigation of the Fergana, the Tashkent region, the Ili valley in the Tien Shan mountains of Kyrgyzstan and the Zeravshan valley. The Kara Kum Canal (KKC, Figure 1) was built between 1954 and 1988 to serve the cotton monoculture heavily promoted by the Soviet Union and to provide a major source of water for Ashgabat, the capital of Turkmenistan. After the heavy rains of the 1950s, water withdrawals from the major rivers became unsustainable for the Aral Sea basin. Excessive use of river water resources for irrigation has led to severe losses of natural ecosystems in the delta regions, such as riparian forests and wetlands, and the drying up of the terminal lake.
Since the 1960s, the surface area and volume of water in the Aral Sea has been steadily decreasing [12], while the salinity of the water has increased significantly [13]. The average annual flow of the Amu Darya and the Syr Darya into the Aral Sea was 56 km3 in the 1950s, which was reduced to less than 10 km3 in 2002. It is clear that the Soviet Union’s disastrous management of irrigation is the main cause of the problem [14,15,16,17,18,19,20,21,22]. However, this does not negate the fact that climate change is particularly acute in this region, making attempts to solve the problem much more difficult [23,24,25,26,27]. Since the collapse of the Soviet Union in 1991, the Central Asian countries of Kazakhstan, Kyrgyzstan, Tajikistan, Turkmenistan and Uzbekistan have faced a range of problems, including soil salinisation, rising water tables in heavily irrigated areas and the abandonment of land that has become infertile. Numerous studies have already shown the negative effects of insufficiently diversified and adapted agriculture and the low water use efficiency associated with the dilapidated irrigation system and reduced agricultural diversification.
2. Methods
The Erasmus+ programme "Strengthening Higher Education in the Water Sector for Climate Resilience and Security in Central Asia (HWCA)" is part of the European Union's Green Deal. The Green Deal recognises that climate change and environmental degradation pose an existential threat to Europe and the world. The main objective is to contribute to the training of a new generation of Central Asian experts ready to tackle the challenges facing the water sector. 17 universities and research institutes (4 from Europe, 13 from Central Asia) are participating in the programme.
Remote sensing information has become essential for land monitoring and management [28]. As early as 1987, a special issue of the Soviet scientific journal Problemy Osvoeniya Pustyn (Problems of Desert Development) was devoted to remote sensing applications and model development in Central Asia. In this context, it seemed important to produce an up-to-date summary of the use of different types of satellite data for the various environmental problems that arise at the scale of a vast watershed such as the Aral Sea Basin (ASB). The focus is on the geoscientific aspects, i.e. water resources, the nature of soils and bedrock, and the associated risks such as floods, desertification, landslides, earthquakes, and the atmosphere (temperature, precipitation, dust). Land cover, land use, crop type differentiation, vegetation assessment, locust infestation mapping or abandonment mapping are all excluded from the study. This approach has rarely been considered [29,30,31]. A review of scientific publications dealing with remote sensing applications for agricultural monitoring in ASB was carried out by Conrad et al [21] and part of their methodology was adopted in our approach. Similarly, a review of remote sensing applications for landslides in Central Asia has been carried out [32]. It should also be noted that the development of remote sensing from space, dating back to the 1960s, coincided with the Aral Sea disaster, which has been and continues to be monitored by the different generations of satellite data.
The literature search was mainly based on the Scopus database (https://www.scopus. com) from 1977 to 2024. A comparison with the Web of Science was made, but without significant differences, as only international peer-reviewed articles were included, following international standards for publication. Only a small number of specific titles were cited in publications of lower impact. In a first step, the search was performed using two terms related to (i) remote sensing (RS), (ii) Aral. The search for these terms included title, abstract and keywords. It should be noted that only 8% of the articles on the Aral Sea consider a remote sensing approach. A first set of 171 titles was identified. Supplementary references were selected using the names of the countries in the ASB instead of 'Aral' (Kazakhstan, Kyrgyzstan, Tajikistan, Turkmenistan, Uzbekistan or Central Asia). We identified 473 titles with Kazakhstan, 184 titles with Uzbekistan, 132 titles with Kyrgyzstan, 74 titles with Turkmenistan, 71 titles with Tajikistan and 746 titles with Central Asia. Some of these titles do not meet our requirements and concern biology, renewable energy, urban planning or pure agronomy.
The review also aims to define the role of remote sensing in the main thematic applications, particularly in terms of data (scale, revisit time, spatial and spectral resolution, etc.), methods, integration into models or association with exogenous data. It has also allowed us to observe the evolution of the use of satellite data over the last 60 years and to identify a number of research directions that could be explored in the future.
3. Study Area
The ASB in Central Asia covers an area of about 1.7 million km² and includes the new states of Kazakhstan, Kyrgyzstan, Tajikistan, Turkmenistan and Uzbekistan created after the collapse of the Soviet Union in 1991. The region has a population of 75 million, with a very uneven geographical distribution, 45% of whom live in Uzbekistan (34 million). The ASB is shared by most of Tajikistan (99% of the land area), Turkmenistan (95%) and Uzbekistan (95%), the Osh, Jalal-Abad and Naryn provinces of Kyrgyzstan (59%), the Kyzylorda and South Kazakhstan provinces of Kazakhstan (13%), the northern and north-eastern provinces of Afghanistan (38%) and a small part of Iran. Geoscientific challenges are located in the downstream countries of Uzbekistan, Kazakhstan and Turkmenistan (water availability, irrigation, disappearance of the Aral Sea, etc.) or in the upstream countries of Kyrgyzstan and Tajikistan (glacier melt, landslides, seismicity, hydropower plants, etc.).
The ASB has a wide range of topography, with mainly flat plains and deserts (about 40%) in the Turan lowlands of Kyzyl Kum (Black Desert) and Kara Kum (Red Desert), high mountains at the western end of the Himalayas in the south-eastern part of the ASB (about 30%), and hills and small mountains in the transition zone (about 30%). Altitude ranges from −15 m (bottom of the Aral Sea) to 7,495 m (peak of Ismail Samani, Tajikistan). The main water sources are two rivers. The Amu Darya and the upstream Vakhsh and Panj rivers (1 million km²) originate from the glaciers of the Pamir and Hindu Kush (Tajikistan and Afghanistan). The Syr Darya and its main upstream tributary, the Naryn, originate from the glaciers of the Tien Shan in central and western Kyrgyzstan (0.5 million km²). The ASB also includes the Tedzhen and Murghab rivers (0.2 million km²), both of which originate in Afghanistan and flow into Turkmenistan, where they are lost in the sands of the Kara Kum.
The mountains to the south-east prevent moisture-rich winds from the south from reaching the landlocked interior of Central Asia. As a result, precipitation is low and erratic over much of Central Asia, particularly towards the Aral Sea where high solar radiation leads to low humidity and arid conditions [33]. Therefore, the climate of the ASB is arid to semi-arid and mainly BWk (cold desert in Köppen terminology) and BSk (cold steppe) [27,34,35]. In recent decades, it has been characterised by an increase in mean annual temperature, precipitation and potential evapotranspiration [36,37], especially in the high mountain ranges [38]. All simulations indicate a warming trend, with snowmelt in the upper reaches leading to increased runoff and more floods and landslides.
The geological evolution of the area has been described by many authors [39,40,41,42,43,44]. Geodynamically, the ASB lies at the boundary between the Central Asian Orogenic Belt in the north (mainly southern Kazakhstan, northern Uzbekistan and Kyrgyzstan) and the Kara-Kum Craton and the Tethysides in the south (Turkmenistan, southern Uzbekistan, Tajikistan). After the closure of the Paleotethys, the so-called Amu Darya Basin was deposited from the Middle Jurassic to the Tertiary [45]. The main aquifers are within the Cretaceous strata, mainly the Upper Cretaceous in the Aral Sea area and the Lower Cretaceous in the Kara Kum (Shatlyk aquifer), but this permeable unit is generally better known for its natural gas reserves than for its water supply potential [33,41,46]. The Aral Sea occupies a large depression formed during Cenozoic tectonic events over 3 million years ago. The depression was formed during the Quaternary by rivers flowing from the mountain belts. The Amu Darya and Syr Darya have fed the Caspian Sea several times since at least the middle Pliocene. Over the past three decades, core material has been studied in more detail to identify 'sea level' oscillations as the Aral responded to local climate forcing [47]. It has been established that the climate during the last glacial period (22,000-11,700 BP) was drier than today. During this time, the Aral Depression received very limited amounts of water from the Turgay area to the north. The Aral Sea was a very small body of water, and Lake Sarykamish was completely dry. From 11,700 BP to 9000 BP, the climate changed from warm/wet to cold/dry conditions [12]. At this time, the Aral Sea was only fed by the Syr Darya, which flowed to the east, which explains why the deepest part of the Aral Sea depression is in the western part of the basin. The Amu Darya flowed into the Sarykamish depression. After the deglaciation (< 9000 BP), the flow of the Amu Darya increased considerably, probably reaching 200 km3.yr-1. This was accompanied by a large amount of sediment that filled the depression between the Aral Sea and Lake Sarykamish, and then possibly into the Uzboy Channel to the Caspian Sea. The water discharge had decreased to about 90 km3.yr-1 and the Aral Depression became endorheic around 7000 BP [41]. The modern Amu Darya delta was formed during this period. Between 5000 and 2000 BP, the period was characterised by high water levels, probably interrupted around 3600 BP when gypsum marked a short recession. Archaeological studies of irrigation during the Bronze Age (3000-4000 BP) indicate that irrigation along the Amu Darya and the Khorezm delta began around 3900 BP, with a peak of activity between 2400 BP and 1600 BP. In the case of the Syr Darya, irrigation activity began much later (900 BP and the occurrence of transmission losses due to medieval diversions of the course of the Syr Darya has been suggested as the main cause of the Aral Sea’s retreat [48]. The last regression event during 1200-1300 AD resulted in water levels lower than those at the beginning of the 21st century [49]. The drying up of the Aral Sea since the early 1960s leads to the classical evaporitic sequence characterised by carbonate deposits in the eastern area, gypsum in the distal south-eastern part of the depression and terrigenous deposits around the water body. This phenomenon was studied in particular by Soviet scientists between 1977 and 1985 [40].
The erosive action of the winds, which transported particles torn from the basin to the south and south-west, led to the deposition of loess, a loose rock that is highly fertile. Sandy or salty soils (e.g. Solonchak) are all poor, with little structure. They are not suitable for agriculture, which partly explains the difficulties and limitations of development. The flooded banks of the Aral basin are the source of saline dust storms, which are traumatic for people, land and water. In this context, the Amu Darya delta is a privileged zone, the most fertile in Uzbekistan, where wind currents blowing from the north (a source of nutrients) meet the fluvial silt of the Amu Darya, the origin of Khorezm's historical prosperity [50].
4. Remote Sensing Based Results
4.1. Precipitation and Temperature
The two main parameters to be described for the study of desertification processes are precipitation, i.e. the amount of rainfall, and temperature. Remote sensing is all the more important when in-situ data are diffuse and chronicles are unreliable. In general, MODIS MOD11 surface temperature products show good agreement with in-situ data, perform better than other products and are a good proxy for air temperature [51]. An interesting synthesis for Central Asia, including China's Xinjiang, covers the period 1980-2015 [52]. The meteorological data come from the National Oceanic and Atmospheric Administration (NOAA) Global Meteorological Station. Multi-source remote sensing data, mainly Landsat TM and ETM+, complemented by high-resolution imagery from Google Earth, were used to study land change, mainly with Normalised Difference Vegetation Index (NDVI) maps. Temperature and precipitation in Central Asia have changed significantly over the period, with the largest temperature increases occurring over the Turgay Plateau in Kazakhstan (Figure 1). Precipitation has also increased, particularly in the upstream countries (Kyrgyzstan and Tajikistan), but has decreased in eastern Kazakhstan and western Xinjiang. Annual precipitation has been highly variable, with the minimum annual average precipitation recorded in 1983 (179.5 mm). Average annual precipitation in Central Asia was higher in 1995-2013 than in 1980-1993. In 1994, abrupt changes in temperature and precipitation were observed across Central Asia.
Jin et al. [20] found that the surface temperature of the Aral Kum increased by up to 1°C during the day and decreased by 0.5°C during the night due to land surface changes observed in MODIS data, resulting in a widening of the diurnal temperature range (period 1960-2015). The same authors used data from the Tropical Rainfall Measuring Mission (TRMM) and Clouds and the Earth's Radiant Energy System (CERES), later based on Terra, Aqua, Suomi-NPP and NOAA-20. They pointed out that the increasing trends of both precipitation and cloud fraction over the Aral are opposite to the decreasing trends of precipitation observed at the surface by [13]. A possible reason for the opposite trends is the bias in the satellite retrievals due to the neglect of the shrinking Aral Sea-induced surface albedo changes, which were fixed instead of using dynamic values in the retrieval methods. If this is true, the decreasing cloud fraction should have some effect on the increasing daytime and decreasing nighttime temperatures over the Aral Sea. For the period 1981-2001, Nezlin and Kostianoy [53] highlighted a high correlation between precipitation data from the Global Precipitation Climatology Centre (GPCC) and NDVI from NOAA-AVHRR (Advanced Very High Resolution Radiometer) over the northern Aral Sea, in the upper and middle reaches of the Syr Darya, and in the area north of the Syr Darya. At the same time, no correlations were found between precipitation and the vegetation index to the southeast of the Aral Sea, especially along the lower reaches of the Amu Darya. The authors suggest that rain and snow water do not accumulate in the soil and do not support vegetation development.
To understand the changes in land surface temperature, [54] used the MODIS land surface temperature (LST) product (MOD11C2) with an 8-day temporal resolution. To analyse changes in evapotranspiration, they used the MODIS evapotranspiration (ET) product (MOD16A2) with monthly temporal resolution. Finally, they used the land cover type product (MCD12C1) to analyse the observed changes. They found that most of the changes occurred in Kazakhstan and Uzbekistan, while Turkmenistan, Kyrgyzstan and Turkmenistan appeared to be more stable. The observed changes were due to a combination of anthropogenic changes and weather effects. For example, changes in crop type south of the Aral Sea were manifested as increases in vegetation indices but decreases in evapotranspiration due to a shift from cotton to wheat.
4.2. Water Surface
Remote sensing data are particularly well suited to assessing the surface area of large lakes such as the Aral Sea. High and medium resolution imagery is required for an accurate assessment. Images from Corona-type satellites (KH series) have been available since the 1960s, but were classified until 1995. As a result, they have been little used in publications and mainly used locally (see below). The Landsat series is the most widely used. Landsat images have been available since 1972 for the MSS sensor on board Landsat 1 to 3 (80 m spatial resolution) and were used in the 1970s to estimate the surface area of the Aral Sea [29]. The successors to MSS are the Thematic Mapper (TM), Enhanced Thematic Mapper (ETM+) and Optical Land Image (OLI) sensors on board Landsat 4 to 9, all with 30 m spatial resolution [55,56]. For example, Tao et al. [57] used Landsat 7 and 8 OLI imagery to estimate the surface area of the four remaining sub-lakes in the Aral region between 2002 and 2018. Other satellites mentioned in the literature were launched in subsequent years, such as the NOAA-AVHRR series since 1978 [58], the Soviet RESURS-01 satellite since 1985 with the Multispectral VNIR radiometer (MSU-SK, this sensor has similar spectral bands to Landsat MSS) combined with data from the Salyut-4 orbital station [59], and Terra-MODIS, operational since February 2000 [20,58]. Zhou et al. have made extensive use of these high spatial resolution data to map water bodies and river widths in several areas of the ASB [60]. Lakes are sometimes defined visually, but generally a ratio is used to highlight water bodies. The most commonly used are the Normalised Difference Water Index (NDWI) and the NDVI. For example, Deliry et al. [56] model the temporal and surface temperature changes of the Aral Sea over the period 1986-2017 using Landsat-5, 7 or 8 data. To achieve the research objectives, the NDWI was chosen to extract and quantify the water surface changes, while the surface temperature values were calculated using the thermal bands to investigate the land and water surface temperature changes. The results showed a significant decrease in the surface area of the Aral Sea (from 44,164 km2 in 1986 to 9,772 km2 in 2017) (see also Figure 2) and a significant increase in the summer land surface temperature (~ 12°C). As mentioned above, NOAA-AVHRR for the period 1981-2000 and Terra or Aqua-MODIS for the period 2000-present are the most commonly used mid-scale data. An original study was carried out using both types of imagery to derive the extent of water bodies over the period 1986 to 2012 [61]. Annual changes were examined using the months of April, July and September as input data. They confirm the significant reduction of the Aral Sea in all seasons, but also for shallow natural lakes in northern Kazakhstan, far from the ASB, while other mountain lakes in the same area have remained stable. The validation was based on high-resolution Landsat imagery.
As a synthesis, Figure 2 shows the evolution of water surface area between 1960 and the present from different sources. The decrease is regular, as indicated by the r² of the linear trend curve of 0.97. During the first period (1960-1980), only the east coast of the Aral Sea showed a global decrease. At the same time, the islands in the sea grew and merged with the surrounding land (from north to south): Kokaral Island joined the NW coast in the mid-1960s, Barsakelmes Island in the late 1990s, and Vozrozdeniya Island in August 2001. The northern Aral Sea, known as the Little Aral Sea, was isolated as early as 1987, and the Kokaral dike across the Berg Strait was completed in 2005 to prevent water from the north spilling over to the south. Between May 2014 and February 2015, the Eastern Aral experienced a first episode of drying. This area will dry out completely from June 2019. Three large water bodies remain: the North (or Small) Aral Sea, which has remained relatively stable since 2022 (about 3,100 km²), the Western Aral Sea, which continues to lose surface area (about 1,900 km²), and Lake Barsakelmes (250 km²), which is expected to dry up completely in the summer of 2024. The total surface area of the water bodies is 5,250 km², or 8% of the original surface area.
4.3. Water Surface Altimetry
Researchers have studied satellite radar altimetry data as a contributor to surface elevation variability [63,64,65]. The main radar altimetry satellites used for studies in the Aral Sea basin are, in chronological order: GEOS-3 (1975-1979), Seasat (1978), Geosat (1985-1986), Topex-Poseidon (1992-2005), Jason-1 (2001-2013), Jason-2 (2008-2019), Cryosat-2 (2010-present), Jason-3 (2016-present), Sentinel-6 (2020-present). The main altimetry satellites cross the Aral Sea from the south-west to the north-east with an identical ground track, allowing sea level heights to be calculated. Shi et al. studied a 21-year chronicle (1993-2014) of Topex-Poseidon, Jason-1 and Jason-2 altimetry data [62]. The surface was also monitored with optical data using a NOAA-AVHRR chronicle from 1981 to 2014. The coverage maps since 1981 show a steady decline of the Aral Sea. The authors found a rising water level in 2005-2006, when a dam was built between the northern and south-eastern Aral Sea in 2005. In another case, water levels were estimated in combination with shoreline changes from Landsat imagery (TM and ETM+) [66]. ICESat (Ice, Cloud and land Elevation SATellite) was the first satellite lidar to provide water surface independent of radar altimetry and in situ measurements. Unfortunately, it only operated from 2003 to 2010 and only 2-3 times per year over continental lakes, with few applications to Central Asia [67]. ICESat-2, launched in 2018 in combination with Cryosat-2 (radar interferometry), shows that the combination of the two satellites can provide a more accurate study of the water level of Lake Issyk Kul, showing a higher consistency with in situ data [68]. Finally, it should be noted that Lake Issyk Kul serves as a permanent calibration and validation site for altimetry satellites such as Jason 3 and Sentinel-3 [69].
4.4. Water Volume of the Water Bodies and Irrigation Systems
The studies of the surface, altimetry and bathymetry of the Aral Sea have also made it possible to estimate the volume of the Aral Sea at different times, particularly in relation to the flow of the two main rivers and precipitation. All studies show that if the surface area is divided by 10 between 1960 and 2020, the volume will be divided by 100. Runoff decreased from 20.6 km3 in 2003 to 4.5 km3 in 2010 and precipitation decreased from 9.4 km3 in 1960 to 3 km3 in 2010. Subsequently, the estimated water salinity ranged from 10.6 g/L in 1960 to 122.5 g/L in 2009, close to the observed values (10 and 120, respectively) [13]. Increased precipitation and glacial meltwater in the upstream part of the basin could not compensate for the water loss of the Aral Sea [70]. This later study is based on NDVI from a long-term satellite data chronicle from MODIS (2000-2018) and in particular MOD02QKM products. Landsat ETM+ images for 2002, 2007 and 2012 and OLI images for 2017 were used as validation data. The authors used MODIS products (MOD13Q1, MOD13C2, MOD11C3) and focused on a short period from 2000 to 2015, during which the lake surface decreased (from 32,000 to 10,000 km², see also Figure 2) due to a decrease in water storage in the ASB. Environmental changes such as drier soils, less vegetation, decreasing cloud cover and precipitation, and more severe and frequent dust storms are also highlighted. As mentioned above, there is a widening of the diurnal temperature range [20].
Between 1993 and 2017, the Southern Aral Sea lost about 195 km3 of water, accompanied by a decrease in lake size, an acceleration in actual evapotranspiration (AET), and an increase in sea surface temperature (SST) [71]. The authors proposed that the Western Aral Sea could disappear by almost 2032 on the current trend (almost −2.7 km3/yr-1). The same authors found a decrease in terrestrial water storage (TWS) in the Amu Darya delta region, mainly due to an increase in water mass in the central part of the Amu Darya basin, probably due to increased infiltration with the deterioration of the canal system. This assumption cannot be validated due to lack of field data, but is supported by the decrease in ET and NDVI in the region with the increase in TWS. A local study in the Amu Darya Delta based on the Surface Energy Balance Algorithm for Land (SEBAL) model was conducted by Liu et al. [72]. Landsat TM, ETM+ and OLI images were used to extract some parameters (e.g. NDVI). They found that in wet years, irrigation water can replenish groundwater and thus indirectly feed the southern Aral Sea; in dry years, groundwater meets crop evaporation needs, but even upstream groundwater needs to be recharged. In the absence of field monitoring, remote sensing studies based on NOAA-AVHRR allow the identification of leakage in natural and human systems. Significant groundwater leakage has been identified along the entire coastline [73]. The same authors, using oxygen and hydrogen isotope snapshots, found that groundwater discharge is a major contributor to the lake in spring and autumn. In the Lebap province of Turkmenistan, water losses along irrigation canals were detected by a gap between cotton ET calculated from satellite imagery and crop water demand [74]. Field validation was supported by very high resolution Quickbird imagery.
The Gravity Recovery and Climate Experiment (GRACE) mission consisted of two satellites (GRACE-1 and 2) that made detailed measurements of the Earth's gravity field. It ran from 2002 to 2018 and allowed the vertical change in water mass over large river basins to be estimated. The measurement is not based on electromagnetic waves, but on a microwave ranging system. A reference already cited shows a successful comparison of the changes. The latter are determined from satellite altimetry combined with the use of Landsat imagery, which provides images of temporal coastline variations and gravity data with GRACE [66]. The authors highlight a progressive drying up until early 2009, followed by an abrupt increase in water in 2009-2010 due to an exceptional discharge of the Amu Darya. Several publications illustrate the contribution of GRACE gravity data in the Aral Sea region [20,65,71,75]. Estimates from 2003 to 2012 show that up to 14 km3 of equivalent water mass was lost from the basin annually from 2002 to 2013 [65]. Changes in GRACE liquid water equivalent thickness (LWET) have been used to indicate changes in surface and groundwater due to irrigation activities [20]. Changes in terrestrial water storage (TWS) observed by the GRACE mission from the Aral Sea region can infer water levels in the eastern Aral Sea with good accuracy from altimetry observations [71]. Shi et al. [75] used the GRACE dataset to extract the equivalent water height (EWH). They also discuss purely methodological aspects, highlighting the difficulties associated with data pre-processing. No published results were found using the Gravity Field and Steady-state Ocean Circulation Explorer (GOCE), which operated between 2009 and 2013.
4.5. Snow and Ice
The Tien Shan and Pamir regions are the main source of water for ASB, potentially stored in the form of glaciers. Using ICESat and GRACE data, Gardelle et al. found that Pamir glaciers had a slightly positive mass budget between 1999 and 2011 [76]. They proposed to extend the famous Karakoram anomaly to a Pamir-Karakoram anomaly. However, recent studies using archived KH-4 and KH-9 data found negative mass budgets in the central and northern Tien Shan and eastern Pamir, even in regions where glaciers were previously in equilibrium with the climate, with an increase in summer temperature explaining the long-term trend in mass loss [38].
For snow cover, specific studies have been carried out using the medium resolution VIIRS instruments on board Suomi NPP combined with the higher resolution of Landsat 8 OLI [77]. The authors found that Landsat 8 OLI avoids the saturation problems common to Landsat 1-7 in the visible wavelengths and re-evaluated previous assessments using data from earlier Landsat sensors. They also confirmed that the VIIRS instruments can be a suitable replacement when the MODIS sensors reach the end of their life. To link the TOPEX/Poseidon results to historical observations ending in the mid-1980s, long time series of passive microwave data from SMMR onboard NIMBUS-7 and SSM/I onboard DMSP (Defence Meteorological Satellite Program) sensors starting in 1978 were analysed [78]. Good agreement between historical and satellite data was found, with significant spatial and temporal variability in ice conditions and a marked decrease in both duration of the ice season and ice extent during the winters 1998/1999-2001/2002. In the upper Syr Darya catchment (Tien Shan), a time series analysis of daily MODIS snow cover products and in situ data shows a decrease in spring snow cover duration of −0.53 to −0.73 days per year over the 22-year period (2000-2022) [79].
Glacial lakes are a very important category of water bodies in mountainous areas. A multi-temporal lake inventory has been produced based on archival data of 1968 Corona imagery compared with more recent ASTER and Landsat 7 imagery [80]. 1642 lakes were mapped in the headwaters of the Amu Darya in the Pamir and Hindu Kush, of which 652 are glacial lakes. Between 1968 and 2009, a highly significant increase in glacial lakes was observed, while the average size of other lake types (erosion or debris dam lakes) remained constant [80].
4.6. Geology
Some pioneering work was done by Soviet scientists using Soviet satellite imagery. There was even a special study between 1974 and 1980 [81]. One paper describes the implausible water diversion project to transfer water from Siberian rivers to the Aral [82], a project abandoned in 1986. Unfortunately, thematic or methodological elements related to remote sensing are almost non-existent in most of the articles, for example in the interesting studies of Lake Sarykamish [83,84,85], a lake that grew in size as irrigation became more important in the Khorezm region. Water discharge in the Aral Sea has been studied using thermal infrared data [86]. Large-scale geological mapping supported by modern remote sensing is rare, particularly in Central Asia. However, there are some interesting approaches in the field of very high resolution digital elevation models (DEMs), such as those obtained at 2 m resolution from Pleiades data in the Alatau range (Kazakh Tien Shan) [87]. The applications are mainly in the area of active faults, which are of great regional importance due to the highly seismic nature of the Tien Shan and the surrounding areas. Another paper in the same region refers to the use of a 3 m resolution digital elevation model (DEM) from Spot 6 data [88]. This later study uses much more satellite data, including a 1969 Corona image showing that the Big Almaty canal was built on an active fault and its associated scarp. The ASTER sensor on board Terra provided interesting DEM, but it is also known for mineral exploration using the shortwave infrared (SWIR) part of the spectrum (no longer available as of April 2008). No published application in Central Asia could be found, although these data have been used successfully on the Chinese side of the Tien Shan [89]. While remote sensing data are currently little used for geological and mining prospecting, they are widely used to manage the associated risks. In Kyrgyzstan, the two largest gold mines have been monitored using satellite data, in particular the Kumtor mine [90], which has been known to suffer from various hazards since its discovery in 1978 (accidental spillage from a cyanide truck, partial destruction by a melting glacier). At Taldybulak Levoberezhny, the second largest gold mine in Kyrgyzstan, Landsat TM/OLI imagery and nighttime light (DMPS) data have been processed for remote monitoring at various stages of development to enhance the rational development of mineral resources [91]. In the petroleum industry, He et al. [92] identified two methane (CH4) plumes near a gas compressor station in Turkmenistan. They used the Tropospheric Monitoring Instrument (TROPOMI) on board Sentinel-5 and the SWIR band of Sentinel-2 (S2 band 12). Results from Sanchez-Garcia et al. [93] have shown the good performance of WorldView-3 for CH4 mapping, also using the SWIR band (WV3 band 7).
Using an automated lineament detection method performed on Landsat 8 data, [94] found a rapid increase in lineament density 20 days before an earthquake, reaching a maximum about 4 days before the earthquake, and then decreasing 16 days after the earthquake. In the very important area of seismic precursors, it is worth mentioning a recent paper analysing potential anomalous signals associated with earthquake activity using the large-scale Advanced Microwave Scanning Radiometer 2 (AMSR2) instrument, on board the Japanese Space Exploration Agency’s Global Change Observation Mission 1st-Water (GCOM-W1) satellite. Increased microwave radiation was observed within a week of two earthquakes in the Tien Shan (2024) and Pamir (2023) [95]. The idea that some strong earthquakes may be accompanied by IR radiation flux anomalies originated in the USSR in the 1980s. The most prominent example is the Ghazli earthquake of 19 March 1984 (magnitude 7.2), in Uzbekistan [96]. A positive anomaly of exceptional intensity was detected 8 days before the main shock using NOAA-AVHRR data. Although various explanations have been proposed, such as interactions between gas emissions, relative humidity, and water vapour, no recent application to Central Asian countries has been identified.
4.7. Salinisation (Minerals and Soils)
As it dried up, the Aral Sea gave way to extensive evaporite formations consisting of halite, gypsum and other minerals. Geochemical studies are common (e.g., [97,98,99,100]), but no specific remote sensing study of the evaporite surfaces was found. However, radar and laser altimetry combined with MODIS imagery have been used to determine the direction of water flow through the Kulandy Strait, which connected the East Aral Sea to the West Aral Sea [67]. This was a key area for understanding the distribution of mirabilite (Na2SO4−10H2O), gypsum (CaSO4−2H2O), epsomite (MgSO4) and halite (NaCl) deposits. It is worth mentioning an interesting study based on the extraction of mineral surface backscattering from Sentinel-1 radar data [101]. The results of the desertification classification showed that more than 68% of the arid area of the Aral Sea suffers from varying degrees of desertification.
Akramkhanov et al. correlated salinity data from two farms in Urgench (Khorezm) with NDVI, Transformed Normalised Difference Vegetation Indices (TNDVI) and additional indices such as Soil Adjusted Vegetation Index (SAVI) and Ratio Vegetation Index (RVI). The indices were calculated from a single Landsat 7 image and show a correct correlation with the salinity field measurement. As the indices are mainly an indication of vegetation, the correlation suggests that salinity has a significant effect on plant growth [102]. The Markov cellular automata technique applied to Landsat imagery revealed further desertification of the landscape, with potential expansion of saline soils and bare areas in the former Aral Sea region. At the same time, the vegetation cover of the region showed an increase, which was interpreted as a good signal of ecological recovery [55]. Using different soil salinity indices, the highly and extremely saline areas were located in the northeastern part of the Eastern Aral Sea and the western part of Vozrozhdeniya Island, respectively, and were the main source of salt-dust storms [103].
4.8. Dust
One of the main consequences of the Aral Sea disaster is the appearance of large mineral surfaces, which are the source of sometimes large dust storms. Mineral dust can play an important role in climate forcing by altering the radiation balance, as dust is responsible for high aerosol concentrations in the atmosphere. The first dust storm was recorded by the Meteor and NOAA satellites in the spring of 1975 [104]. In 1982, also using satellite imagery, the second significant dust source area was observed around the dry seabed of the island of Vozrozdeniya, covering an area of 2000 km². In 1989, satellite imagery revealed a third, smaller (200 km²) dust source on the northwestern side of the sea [105].
Persistent dust activity has been detected at the southern and south-eastern ends of the Aral Sea in the Turan lowlands [106]. The most intense regional activity was centred over the Kara-Bogaz Salt Lake, a lagoon-like embayment that was formerly a gulf of the Caspian Sea and is now isolated from the sea by an artificial dam during 1980-1992. The authors used the NIMBUS 7 TOMS instrument, which was designed to provide global estimates of total column ozone using backscattered UV radiance. Using the 8-day MOD09A1 surface reflectance product from the MODIS sensor, complemented by Landsat 5 and 7 data, Löw et al. found that the drying of the Aral Sea accelerated between 2004 and 2008 [107]. The area of sandy surfaces and saline soils, which have the greatest potential to generate dust and salt storms, increased by more than 36%. In the Aral Kum, soil desalination was found to occur within 4-8 years. Dust originating from the area south of the Aral Sea, combined with dust transported from the Tigris and Euphrates region in Iraq, resulted in high dust concentrations in the southern Caspian Sea region affected by a major cyclone in 2009 [108].
In recent decades, the Aral Kum covering the former Aral Sea has become the new ''hotspot'' in the region [109,110]. Dust storms and their source areas have been studied using NOAA AVHRR, TOMS and OMI data. The northeastern part of the Aral Kum Desert appears to be one of the most active dust sources in the region. Recent studies have focused on the relationship between wind and erosion. The Soil Wind Erosion Potential (SWEP) was estimated from remote sensing data (mainly MODIS), climate assimilation data and other geospatial data. SWEP was calculated on a monthly basis for the period 2000-2019, covering Central Asia with a spatial resolution of 500 metres [111]. The results show that the mean SWEP is in good agreement with the ground-based Dust Storm Index (DSI), the satellite-based Aerosol Optical Depth (AOD) and the Absorbing Aerosol Index (AAI). The erosion of the Aral Kum was estimated to be about 47 kg.m-2.yr-1.
4.9. Landslides
Landslides are a very important hazard in the mountainous areas of the ASB. Kyrgyzstan, Tajikistan and, to a lesser extent, Uzbekistan are the main countries affected. In Tajikistan alone, more than 1,000 people were killed in 3,460 emergencies between 1996 and 2018 [112]. Landslides can be divided into two main categories: earthquake-induced landslides and rainfall-induced landslides. Remote sensing is particularly well suited for local studies of landslides, especially when it is combined with field observations [113]. Very high resolution (< 2 m) satellite data and accurate digital terrain models are required. Radar and optical data can be used successfully, as recently demonstrated [114] in the emblematic case of Lake Sarez in eastern Tajikistan, which was affected by a major landslide in 1911. The area remains under observation because of two zones of instability near the Usoy dam. Images from Spot-6 and Spot-7 were used for the optical data and Sentinel-1 for the InSAR approach. Sentinel-2 (pixel size 10 m) and an ALOS-PALSAR DEM (pixel size 12.5 m) have been combined to produce a landslide inventory in the Hissar-Allay region of western Tajikistan [112]. In this case, DEM analysis cannot be used for small landslides, and very high resolution images from Google Earth were used to label rockfalls and shallow landslides.
In Kyrgyzstan, many studies have focused on the eastern margin of the Fergana basin e.g., [115]. As early as 2005, methodological studies in the area of the Upper Maili Suu River Basin focused on the potential of satellite remote sensing data from various optical (Landsat-TM, Landsat-ETM+, ASTER, MOMS-2P) and radar (ERS-1/2) systems to provide an improved knowledge base for hazard assessment [116]. More recently, Ozturk et al. [117] compared a landslide inventory in the form of a historical inventory originally covering the entire Tien Shan with their own inventory. It consisted of landslide objects in the form of polygons semi-automatically derived from time series of optical satellite remote sensing data RapidEye, covering the period between 2009 and 2017. By analysing temporal changes in NDVI, Iron Index and relief-oriented parameters (slope inclination, relief position) in a rule-based approach combining pixel- and object-based analyses, they conclude that the use of landslide toe areas may be sufficient for this particular model and may be useful where landslide scars are vague or hidden. In 2015, Teshebaeva et al. [118] conducted an interferometric analysis using Differential Synthetic Aperture Radar (D-SAR) to detect slow-moving, deep-seated landslides in close association with lithology near the town of Uzgen. They highlighted a strong correlation between deformation peaks and precipitation, and revealed the continuous activity that affects the slope of the landslides. They used an Advanced Land Observing Satellite Phased Array type L-band SAR (ALOS PALSAR) dataset. Although L-band radar sensors have a longer wavelength that partially penetrates surface vegetation, their temporal resolution of 46 days is not favourable. Other authors [119] processed the C-band Sentinel-1 satellite images and combined them with optical data. In spring 2017, Kyrgyzstan suffered significant losses due to a massive landslide activation event, which also reactivated two of the largest deep-seated mass movements of the former Mailuu-Suu mining area - the Koytash and Tektonik landslides. The study consisted of using optical and radar satellite data to highlight deformation zones and identify displacements prior to the collapse of the Koytash landslide and the more superficial deformation of the Tektonik landslide. For the former in particular, comparison of 2011 and 2017 digital elevation models (based on satellite and unmanned aerial vehicle (UAV) imagery, respectively) highlights areas of depletion and accumulation in the scarp and near the toe, respectively. D-SAR interferometric analysis identified slow displacements in the months prior to reactivation in April 2017, indicating long-term slip activity of the Koytash landslide and the Tektonic landslide. Optical data were used for NDVI, specifically two Pleiades-1A images (pre- and post-landslide) with a spatial resolution of 0.5 m. Recently, Wang et al. [120] used Sentinel-1 data and developed an unsupervised multivariate transform-based deep learning model to automatically and efficiently estimate landslide occurrence times using multivariate SAR-derived parameter time series analysis. They focused on the Kugart landslide and the Jalgyz-Jangak landslide, both active in 2018. The results suggest the potential of SAR data, when used in conjunction with optical data.
Landslides along the Chirchiq River in Uzbekistan were studied using very high resolution GeoEye 1 data in combination with DEMs extracted from stereoscopic WorlView data and ASTER GDTEM [121]. Along the western coast of the Aral Sea in Uzbekistan, Aslan et al. identified a slow-moving landslide revealed by Sentinel-1 interferometric time series. This landslide is controlled by the lithological sequence and local faulting, and may be caused by long-term sea-level decline [122].
4.10. Flooding
The critical period for floods in Central Asia is spring and summer, as the rivers have a clear fluvial-nival regime. As temperatures in the mountain ranges are expected to continue to rise, a further advance of the spring flood and a reduction in runoff are likely, requiring coordinated management of water resources, particularly in the Syr Darya basin [79]. In this case, the MODIS daily snow cover product M*D10A1 is used to determine the snow cover duration and the exact dates of snow onset and snow melt. Flood damage assessment in Central Asia using remotely sensed data is poorly illustrated. The catastrophic dam failure of the Sardoba reservoir (Uzbekistan) in May 2020 was investigated using Sentinel-1 and Sentinel-2 [123]. The Soil & Water Assessment Tool (SWAT) is a small watershed to river basin scale model. It was used to simulate surface and groundwater quality and quantity and to predict environmental impacts in the Aktash River basin in Uzbekistan. The MODIS evapotranspiration/latent heat flux product (MOD16A2) was used as a proxy for field measurements [124].
4.11. Glacial Lake Outburst Floods (GLOFs)
A special case of high mountain landslides are glacial lake outburst floods (GLOFs) and associated debris flows. GLOFs peaked in the 1970s, when strong positive temperature anomalies and glacier melt were observed [125]. One of the first attempts to apply lake outburst potential and hazard assessment of mountain lakes was carried out in Uzbekistan using WorldView 2, IKONOS and SPOT 5 satellite imagery [126]. In the Tajik Pamir, Mergili and Schneider [127] studied the village of Dasht (Shakhdara Valley), which was affected by a GLOF in August 2002. A lake with a surface area of 37,000 m² suddenly released an estimated volume of 320,000 m3 of water. Multi-temporal analysis of Landsat imagery showed that the lake had existed for less than two years before draining. All lakes in the area were mapped for three time windows: 1968 (Corona imagery), 2001/2002 (ASTER and pan-sharpened Landsat ETM+ imagery) and 2007/2008 (ASTER imagery). The authors identified two major limiting factors for regional-scale lake outburst hazard analyses: the lack of detailed geological information and information on seepage through the dam, particularly sediment consolidation. Satellite imagery and digital elevation models only provide information on surface features and patterns and do not provide insight into the subsurface. On 8 July 1998, the deadliest GLOF in Central Asia for at least a century occurred in the Shakhimardan area of Kyrgyzstan, but most of the 100 victims were killed in the local Uzbek enclave. Using remote sensing (mainly Sentinel-2 imagery), it has been shown that the lake at the origin of the event appeared in the 1960s and has been periodically drained [128]. The authors point out some limitations of the very high resolution imagery, such as Ikonos, as they did not provide the nadir view. Erokhin et al. [129] studied the Teztor lake complex in northern Kyrgyzstan, which was affected by a GLOF in 1953. Five high-resolution aerial and satellite images (available from Google Earth and aerial archives) were analysed for the period between 1962 and 2014. The analysis was complemented by topographic maps, helicopter photos taken in the months before and after the 2012 event, and historical data (oblique views and previous field surveys). The authors also analysed meteorological parameters and found that the 2012 GLOF was caused by a combination of intense precipitation in the days preceding the event and a rapid rise in air temperature. Shangguan et al. studied Lake Merzbacher in eastern Kyrgyzstan, a glacial lake located in the upper reaches of the Aksu River [130]. They used DEM data to determine the extent of the lake and its storage capacity. The originality of the approach is the use of multi-source DEMs obtained from KH-9 (1974), SRTM (2000), ALOS (2006) and Spot (2008). They proposed that the GLOFs of Lake Merzbacher were triggered by a gradual increase in summer air temperature and by variability in water supply due to variability in precipitation. A multi-source remote sensing study based mainly on Corona 4H-4B, Landsat MSS or ETM+ and Aster [131] indicates an increasing number and area of glacial lakes in the northern Tien Shan region, Kazakhstan and Kyrgyzstan, some of which have medium to high outburst potential. The NDWI is used to detect the water bodies. Daiyrov et al. [132] focused on the Toguz-Bulak glacial lake in the Teskey mountain range, Kyrgyzstan, with a large dataset including Corona 4H-4A, Landsat-5 TM, Landsat-7 ETM+, Landsat-8 OLI, Sentinel-2, ALOS-PRISM, ALOS-2, and others. Analysis of satellite images for the years 2010-2019 showed that the lake appeared in June and disappeared in September each year. Daiyrov et al. [133] extended the study to the entire Kyrgyz and Teskey Ranges, where most glacial lakes that could cause an outburst flood are small. Using Sentinel-2 (10 m) and PlanetScope (3 m), they identified a total of 800 glacial lakes, of which 242 showed significant variations in area, and 46 were new glacial lakes, five of which were rapidly expanding. In the Ala-Archa and Alamedin valleys of the Kyrgyz Range, a 10 m spatial resolution DEM generated from Sentinel-1 imagery was used to define catchment areas [134]. The originality is to combine the interpretation of available aerial and satellite imagery since 1960 with growth ring records of trees affected by extreme events to obtain a chronology of GLOFs back to the second half of the 19th century. In the same region, Meyrat et al. have recently proposed a simulation of GLOFs using WorldView data to extract high-resolution DEMs [135].
5. Discussion
5.1. Numerical Overview
The list of selected publications shows different scales of application. These range from the global to the local. (1) The regional scale, i.e. the ASB or the five countries of Central Asia, sometimes supplemented by the Chinese Xinjiang or the Ili River Basin, and rarely northern Afghanistan; these studies cover about 1 to 2 million km². It can be estimated that only 10% of the selected articles have a regional scope, covering the entire study area (ASB). These articles generally consider climatic parameters (temperature, precipitation) or the hydrographic network as a whole. (2) The national level, represented by national inventories (100,000 to 1 million km²); this level is mainly used for risk assessment and is used in only 5% of the publications. (3) The provincial level, covering a region (e.g. Khorezm in Uzbekistan or Lebap province in Turkmenistan); this level usually covers 5,000 to 100,000 km² and includes the Aral Sea and its relict water areas; it is very common and accounts for 65% of the studies; the Fergana Valley, shared by Uzbekistan and Kyrgyzstan, has been particularly studied. (4) The local level is that of isolated landslides or GLOFs, which account for about 20% of publications. In terms of countries, Uzbekistan and Kyrgyzstan are the most studied, followed by Tajikistan and, to a lesser extent, Kazakhstan and Turkmenistan. Afghanistan is virtually absent from the review.
Studies on the physical environment, such as topography or fault network, are rare. Most of the studies focus on privileged sectors. Among these sectors, the Aral Sea and its residual lakes are often studied to estimate the surface area, volume and sometimes salinity of the water, but the associated field data are very rare, especially in the case of mineral surfaces. If the Amu Darya and its delta (Khorezm) are the subject of numerous publications, this is much less the case for the Syr Darya and the irrigated areas of Kyzylorda. This geographical specialisation is also found in the area of geological risks, which mainly affect the countries upstream of the ASB. The glaciers and landslides studied are mainly concentrated in a few areas. It should be noted that this point is accentuated by the geopolitical difficulties of the sector, which is characterised by a very complex layout of borders. For example, there are far fewer publications on the glaciers in the Tajik Pamir than in the Kyrgyz Tien Shan, even though the number and volume of ice in the Pamir is greater than in the Tien Shan. The UN Charter on Natural Hazards (https://disasterscharter.org) shows that there are few examples covered in the ASB, with the three largest countries (Kazakhstan, Uzbekistan, Turkmenistan) completely missing. Tajikistan has been the subject of three relatively recent investigations (landslide and mudflow in May 2009 and April 2014 and earthquake in December 2015), while Kyrgyzstan has invoked the Charter three times but only in 2024, including twice in the west of the country (landslide in June 2024 and flood in July 2024) and once in the Lake Issyk Kul region (mudflow in August 2024). Two floods were recorded in northern Afghanistan (April 2014 and May 2024). It is worth noting that the main nationality of the first author is China (about 30%), followed by Germany (15%), USA and Uzbekistan (8% each), Russia (7%), France (6%) and Japan (4%).
It should also be noted that only studies using a remote sensing approach were considered. From a quantitative point of view, we found 2,181 papers with the keyword "Aral Sea", while only 172 (i.e. 7.9%) also include the keyword "remote sensing". The potential of remote sensing is clearly underexploited.
5.2. Remote Sensing Data Used
The previous summary is limited to remote sensing contributions in the Aral Sea Basin to earth science themes, i.e. information on the geological subsurface, soils, deep and surface water and their interaction with the atmosphere, including geological hazards (landslides, floods, dust). Land cover, crop type mapping or urbanism are excluded from this review. The main data used are MODIS data products, which generally correspond to dynamic data such as evapotranspiration, precipitation, temperature or NDVI. In this case, the scale is regional, with a maximum spatial resolution of 500 metres. The focus of the studies is on monitoring changes that lead to increased desertification. Most studies of medium resolution multispectral data are based on the use of NDVI. This very simple ratio has been heavily criticised because it takes little account of inter-annual variations in climate and vegetation characteristics, which are sometimes difficult to detect, particularly in sub-desert regions. In situ observations are rare or very specific, making it difficult to generalise. For the 1980s and 1990s, NOAA-AVHRR records are used, but their resolution of 1,100 m is difficult to compare with the 250 or 500 m resolution of MODIS. The models capture all the major changes in the landscape, but the respective roles of water abstraction, interannual variations in meteorology and the drying of the Aral Sea are rarely more than sketched. Data with better spatial resolution (about 30 m), such as the Landsat series, in particular Landsat-TM, ETM+ and OLI, are used for studies at a more local scale. Recently, there has been a renewed interest in data with better resolution, such as Sentinel-2, which has been available for almost ten years and offers a better spatial resolution (10 m) and a higher repeatability (5 days instead of 16 days for Landsat). The two satellites Landsat 8 and Landsat 9 now reduce the latter parameter because their orbits are 8 days out of phase. On the other hand, Spot 1-5, Terra-Aster and ALOS 1-2 data are not widely used in the literature, while Spot 6 or Spot 7 are used for some detailed studies. The first paper with a significant contribution of GoogleEarth Engine applied to the Aral Sea Basin dates back to 2019 [136]. The aim was to reconstruct long-term and high-frequency time series of the inundation areas of the world's major lakes, including the North Aral Sea and Lake Yssyk Kul. The results are consistent with those obtained using altimetry. The observed increase for Lake Yssyk Kul may be related to accelerated glacier melt due to regional warming. Google Maps provides very interesting data. However, it is unfortunate that in the literature the sensors used are too often not specified (Worldview-3, Landsat 8, Pleiades, Spot 6-7, etc.) (e.g., [129]). Each sensor has its own characteristics in terms of spatial, spectral and temporal resolution, which should be specified and exploited. GoogleEarth is limited to data in the visible range, which is not the most relevant for most natural objects, even if it is the only one capable of providing very high spatial resolution. Another case is the so-called Landsat images, because in some studies it is difficult to know exactly which sensors are being studied: MSS, TM, ETM+, OLI...?
In addition to imaging sensors, many studies use digital elevation models. All types of models have been used, from DEMs based on aerial photography or the first Corona data, to the most accurate DEMs based on radar interferometry or very high resolution Pleiades Neo data. There is a lack of studies using radar images. This is reflected in the low number of remote sensing publications (31 out of 172, or 18%). Radar is rarely used as amplitude data, with the notable exception of a paper using ENVISAT-ASAR imagery to monitor the extent of flooding in the Aral Sea in 2010-2011 [137].
It should be stressed that satellite data can be used in raw form, based on the original imagery, but there are also many databases of data that have already been formatted. This is the case, for example, with the DAHITI altimetry data (University of Munich), which is a remarkable tool for regular monitoring of different sectors of the ASB. For the northern Aral Sea, for example, the highest level was recorded in April 1999 (43.63m), followed by a decrease in August 2002 (40.02m) and an increase until July 2006 (43.14m), but since then there has been a clear downward trend (41.23m in December 2024). Many papers rely on the use of websites, but some of these no longer exist.
This review has highlighted some of the limitations of remote sensing sensors. The old ones offer limited capabilities, such as the NOAA-AVHRR sensors with only two broad bands in the visible (580-680 nm) and NIR (725-1000 nm). As a result, the number of indices that can be calculated is limited and the band placement and width are not optimised for vegetation detection. Sometimes, there are some gaps in the dataset. For example, data from the NOAA ''afternoon'' satellites (NOAA-7, -9, -11 and -14) cover the period from July 1981 to September 2001, with a data gap in September-December 1994 due to satellite failure. An interesting methodological aspect regarding MODIS, which is generally considered to be the successor to the first generation of NOAA imagery, was raised by Jin et al. [20]. They highlighted the fact that MODIS-Aqua (launched in May 2002) performs better than MODIS-Terra (launched in December 1999) in retrieving aerosol optical depth (AOD) over land, because MODIS-Terra is older and more degraded than MODIS-Aqua. However, the MODIS instrument on board Aqua suffered the loss of 75% of its Band 6 detectors shortly after launch [138]. MODIS band 6 observes radiances in the spectral range 1.628-1.652 μm (i.e. mid-infrared or MIR), which is a key bandwidth for common snow retrieval algorithms and more generally for ratios dealing with moisture. Other common problems include the failure of the Landsat-7 Scan Line Corrector (SLC) since May 2003 and the failure of the ASTER SWIR detectors since April 2008.
5.3. The Question of the Origin of the Aral Sea Disaster
A number of studies have attempted to link the Aral Sea disaster to climate change. Given that the disaster was predicted in the 19th century and occurred mainly between 1960 and 2000, it seems difficult to deny that water abstraction from major rivers was a major cause of the drying up. On the other hand, it is clear that the drying up of an inland sea of almost 70,000 km² has had a major impact on the local climate, changing rainfall and temperature regimes and generating dust storms since the 1970s. In particular, it has caused changes in the start and end dates of the ice season. Due to the remoteness of the Aral Sea, remote sensing has proven to be the best method to map the evolution of this vast body of water. If the two main causes co-exist, other causes could be identified, such as the regional tectonic activity including orogenic movement and associated seismicity, the latter of which is poorly understood.
5.4. Paths of Research
The use of in-situ data is an integral part of any RS-based study due to its importance for calibration and validation of results. Almost 20% of the studies used in-situ data collected during field campaigns. The remaining studies did not use in-situ or secondary data for validation purposes. There is a need for more relevant field data. For example, while declines in the flow of the Amu Darya and Syr Darya are now well documented, changes in the flow of their tributaries, particularly in the headwaters, have received less attention [139]. It will also be necessary to consider a wider area around the ASB, including the Asian Water Tower. While relatively advanced for snow and glaciers, knowledge on permafrost is more limited [140].
Some studies have integrated geospatial data from other external sources, but the main problem is that statistics and data for the ASB are often outdated or of questionable quality. In particular, meteorological data are essential for assessing irrigation water use, especially for modelling evapotranspiration in relation to biomass and crop yields. Secondary data are a key feature for driver analysis, e.g. targeting spatial patterns of land degradation (e.g. soil salinisation) or cropping pattern analysis.
RS-based methods have received less attention in this review, as most of the methods and algorithms used in the studies were developed elsewhere. However, it should be mentioned that radar data should be better exploited, especially in the flat central part of the Aral Depression. Technically, the integration of SAR data into RS-based applications remains unexplored in the ASB. Radar, e.g. with Sentinel-1, can help to detect changes in surface and soil moisture, which could be positively combined with the observation of land cover changes. Archival images from the 1960s, either from US spy satellites (Corona programme) or from the former Soviet satellites (Resurs, Meteor, etc.), which are still poorly represented in the literature, are also poorly used, although they could be of great interest for better understanding the first phase of the Aral Sea's drying in the 1960s and early 1970s. In general, there is a lack of applications of very high resolution data (<2 m). For example, no studies were found using the very high resolution (1 m) OrbView-3 data, even though these data are available for a key period of the Aral Sea disaster (2003-2007).
As a preliminary conclusion, it is worth noting that an emblematic case in the region is the Qosh Tepa Canal (QTC), launched in 2018 by the Taliban regime in Afghanistan. This canal is expected to help irrigate up to 550,000 hectares of land in the north-western provinces. Traditionally, Central Asian countries have managed shared water resources through agreed quotas, but this canal was designed to divert significant amounts of water from the Amu Darya (15-20% of the total flow) without consultation with neighbouring countries. The canal was built in two phases, the first being 108 km long and the second being 177 km long. The first phase started in 2022 and was completed in autumn 2023 (Figure 3: A, B, C). The second phase is still under construction in February 2025. Figure 3 illustrates a key moment in the construction of the QTC. In early November 2023, space-based monitoring detected water leaking from a section of the right bank, 75 km from the Amu Darya (Balkh region). Sentinel-2 imagery shows that within the first month of the canal being filled with water, the walls of the hydraulic structure were apparently unable to withstand the pressure of the water flow, and a large volume of water escaping from the canal spread into the surrounding area. By November 2023 (D), the canal had overflowed an area of 450 ha, with the overflow area continuing to increase: 1250 ha in February 2024 (E) and 1700 ha in February 2025 (F). This event has caused a great deal of controversy between the different countries.
6. Conclusion
As early as 1991, Orlov and Sokolova [141] wrote that 'without these data [aerial and space photography data], the Aral Sea conservation projects are unlikely to be implemented'. 34 years later, there is still a paradox between the potential contribution of remote sensing data and the actual use of all datasets available on the ASB. In addition, some areas remain difficult to access for a variety of reasons. Only studies combining long-term field observations and satellite imagery will provide a better understanding of the phenomena in the region, although there seems to be no doubt about the fate of the Aral Sea. Whatever the number of future satellites in orbit, regional water policy will remain the most important element.
Acknowledgments
Thanks to Prof M. Buslov, Novosibirsk, for the geological maps of Central Asia. The papers from Problemy Osvoeniya Pustyn' - Akademiya Nauk Turkmenskoi SSR (Probl. Ovs. Pustyn) are available at http://www.cawater-info.net/library/magazines-tm.htm. The shapefile for the Aral Sea basin (Figure 1) is from https://mrb.grdc.bafg.de/ I would like to dedicate this work to the memory of my former teacher, René Létolle (1932-2024), who taught me about Lake Aral back in the 1980s.
Conflicts of Interest
The authors declare no conflicts of interest. The funders had no role in the design of the study; in the collection, analyses, or interpretation of data; in the writing of the manuscript; or in the decision to publish the results.
References
- Micklin, P.P. Desiccation of the Aral Sea: A Water Management Disaster in the Soviet Union (FTA). Science 1988, 241, 1170–1176. [CrossRef]
- Létolle, R.; Mainguet, M. Aral. Springer-Verlag: Paris, France, 1993; pp. 1–357.
- Létolle, R. La Mer d’Aral. L’Harmattan: Paris, France, 2008; pp. 1–313.
- Micklin, P.; Aladin, N.V.; Plotnikov, I.S. The Aral sea: The devastation and partial rehabilitation of a great lake. Springer-Verlag: Berlin Heidelberg, 2014; pp. 1–445.
- Crétaux, J.F.; Kostianoy, A.; Bergé-Nguyen, M.; Kouraev, A. Present-day water balance of the Aral Sea seen from satellite. In Remote Sensing of the Asian Seas; Barale, V.; Gade, M., Eds.; Springer International Publishing, 2019, pp. 523–539.
- Xenarios, S.; Schmidt-Vogt, D.; Qadir, M.; Janusz-Pawletta, B.; Abdullaev, I. The Aral Sea Basin. Water for sustainable development in Central Asia. Routledge Taylor and Francis Group, 2020; pp. 1–222.
- Narbayep, M.; Pavlova, V. The Aral Sea, Central Asian Countries and Climate Change in the 21st Century. United Nations ESCAP, IDD, Working Paper Series, Part 1: Aral Sea, 2022, pp. 1–58.
- Nagabhatla, N.; Brahmbhatt, R. Geospatial assessment of water-migration scenarios in the context of sustainable development goals (SDGs) 6, 11, and 16. Remote Sens. 2020, 12, 1376. [CrossRef]
- Wang, X.; Cui, B.; Chen, Y.; Feng, T.; Li, Z.; Fang, G. Dynamic changes in water resources and comprehensive assessment of water resource utilization efficiency in the Aral Sea basin, Central Asia. J. Environ. Manage. 2024, 353, 120198. [CrossRef]
- Reclus, E. L’Asie russe. Versant de l’Aral et de la Caspienne. In Nouvelle géographie universelle; Hachette: Paris, France, 1881; Volume 6, pp. 374–429.
- Encyclopédie Larousse, 1895. Aral.
- Crétaux, J.F.; Létolle, R.; Bergé-Nguyen, M. History of Aral sea level variability and current scientific debates. Global Planet. Change 2013, 110, 99–113. [CrossRef]
- Gaybullaev, B.; Chen, S.C.; Gaybullaev, D. Changes in water volume of the Aral Sea after 1960. Appl. Water Sci. 2012, 2, 285–291. [CrossRef]
- O’Hara, S.L. Irrigation and land degradation: implications for agriculture in Turkmenistan, central Asia. J. Arid Environ. 1997, 37, 165–179. [CrossRef]
- Saiko, T.A.; Zonn, I.S. Irrigation expansion and dynamics of desertification in the Circum-Aral region of Central Asia. Appl. Geogr. 2000, 20, 349–367. [CrossRef]
- Conrad, C.; Dech, S.W.; Hafeez, M.; Lamers, J.P.A.; Tischbein, B. Remote sensing and hydrological measurement based irrigation performance assessments in the upper Amu Darya Delta, Central Asia. Physics and Chemistry of the Earth 2013, 61–62, 52–62. [CrossRef]
- Tischbein, B.; Manschadi, A.M.; Conrad, C.; Hornidge, A.; Bhaduri, A.; Hassan, M.U.; Lamers, J.P.A.; Awan, U.K.; Vlek, P.L.G. Adapting to water scarcity: constraints and opportunities for improving irrigation management in Khorezm, Uzbekistan. Water Sci. Technol. Water Supply 2013, 13, 337–348. [CrossRef]
- Bekchanov, M.; Lamers, J.P.A. Economic costs of reduced irrigation water availability in Uzbekistan (Central Asia). Reg. Environ. Chang. 2016, 16, 2369–2387. [CrossRef]
- Bekchanov, M.; Ringler, C.; Bhaduri, A.; Jeuland, M. Optimizing irrigation efficiency improvements in the Aral Sea Basin. Water Resour. Econ. 2016, 13, 30–45. [CrossRef]
- Jin, Q.; Wei, J.; Yang, Z.L.; Lin, P. Irrigation-induced environmental changes around the Aral Sea: An integrated view from multiple satellite observations. Remote Sens. 2017, 9, 900. [CrossRef]
- Conrad, C.; Usman, M.; Morper-Busch, L.; Schönbrodt-Stitt, S. Remote sensing-based assessments of land use, soil and vegetation status, crop production and water use in irrigation systems of the Aral Sea Basin. A review. Water Security 2020, 11, 100078. [CrossRef]
- Li, Q.; Li, X.; Ran, Y.; Feng, M.; Nian, Y.; Tan, M.; Chen, X. Investigate the relationships between the Aral Sea shrinkage and the expansion of cropland and reservoir in its drainage basins between 2000 and 2020. Int. J. Digit. Earth 2021, 14, 661–677. [CrossRef]
- Propastin, P.; Kappas, M.; Muratova, N.R. A remote sensing based monitoring system for discrimination between climate and human-induced vegetation change in Central Asia. Manag. Environ. Qual. Int. J. 2008, 19, 579–596. [CrossRef]
- Bernauer, T.; Siegfried, T. Climate change and international water conflict in Central Asia. J. Peace Res. 2012, 49, 227–239. [CrossRef]
- Siegfried, T.; Bernauer, T.; Guiennet, R.; Sellars, S.; Robertson, A.W.; Mankin, J.; Bauer-Gottwein, P.; Yakovlev, A. Will climate change exacerbate water stress in Central Asia? Clim. Chang. 2012, 112, 881–899. [CrossRef]
- Sommer, R.; Glazirina, M.; Yuldashev, T.; Otarov, A.; Ibraeva, M.; Martynova, L.; Bekenov, M.; Kholov, B.; Ibragimov, N.; Kobilov, R.; et al. Impact of climate change on wheat productivity in Central Asia. Agric. Ecosyst. Environ. 2013, 178, 78–99. [CrossRef]
- Fallah, B.; Didovets, I.; Rostami, M.; Hamidi, M. Climate change impacts on Central Asia: Trends, extremes and future projections. Int. J. Climatol. 2024, 4, 3191–3213. [CrossRef]
- Sheffield, J.; Wood, E.F.; Pan, M.; Beck, H.; Coccia, G.; Serrat-Capdevila, A.; Verbist, K. Satellite remote sensing for water resources management: Potential for supporting sustainable development in data-poor regions. Water Resour. Res. 2018, 54, 9724–9758. [CrossRef]
- Micklin, P. Using satellite remote sensing to study and monitor the Aral Sea and adjacent zone. NATO Security through Science Series C: Environmental Security, 2008, DOI:10.1007/978-1-4020-8960-2_3.
- Dukhovny, V.A. Comprehensive remote sensing and ground-based studies of the dried Aral Sea bed. Scientific-Information Center of the Interstate Commission for Water Coordination of Central Asia (SIC ICWC) 2008, pp. 1–172 p.
- Ginzburg, A.I.; Kostianoy, A.G.; Sheremet, N.A.; Kravtsova, V.I. Satellite monitoring of the Aral Sea Region. In The Aral Sea Environment. Kostianoy, A.G.; Kosarev, A.N. (eds), The handbook of environmental chemistry, 2010, 7, Springer, Berlin Heidelberg, pp. 147–179. [CrossRef]
- Khasanov, S.; Juliev, M.; Uzbekov, U.; Aslanov, I.; Agzamova, I.; Normatova, N.; Islamov, S.; Goziev, G.; Khodjaeva, S.; Holov, N. Landslides in Central Asia: a review of papers published in 2000–2020 with a particular focus on the importance of GIS and remote sensing techniques. GeoScape 2021, 15, 134—145. [CrossRef]
- Howard, K.W.F.; Howard, K.K. The new ‘‘Silk Road Economic Belt’’ as a threat to the sustainable management of Central Asia’s transboundary water resources. Environ Earth Sci 2016, 75, 976.
- Dilinuer, T.; Yao, J.Q.; Chen, J.; Mao, W.Y.; Yang, L.M.; Yeernaer, H.; Chen, Y.H. Regional drying and wetting trends over Central Asia based on Köppen climate classification in 1961-2015. Adv. Clim. Chang. Res. 2021, 12, 363–372. [CrossRef]
- He, H.; Luo, G.; Cai, P.; Hamdi, R.; Termonia, P.; De Maeyer, P.; Kurban, A.; Li, J. Assessment of climate change in Central Asia from 1980 to 2100 using the Köppen-Geiger climate classification. Atmosphere 2021, 12, 123. [CrossRef]
- Berdimbetov, T. Spatio-temporal variations of climate variables and extreme indices over the Aral Sea Basin during 1960 – 2017. Trends Sci. 2023, 20, 5664.
- Berdimbetov, T.; Pushpawela, B.; Murzintcev, N.; Nietullaeva, S.; Gafforov, K.; Tureniyazova, A.; Madetov, D. Unraveling the intricate links between the dwindling Aral Sea and climate variability during 2002–2017. Climate 2024, 12, 105. [CrossRef]
- Bhattacharya, A.; Bolch, T.; Mukherjee, K.; King, O.; Menounos, B.; Kapitsa, V.; Neckel, N.; Yang, W.; Yao, T. High Mountain Asian glacier response to climate revealed by multi-temporal satellite observations since the 1960s. Nat. Commun. 2021, 12, 4133.
- Leuchs, K. Der Block von Ust-Urt. Geol. Rundsch. 1935, 26, 248–258. [CrossRef]
- Rubanov, I.V.; Bogdanova, N.M. Quantitative assessment of salt deflation on drying bottom of the Aral Sea. Probl. Ovs. Pustyn 1987, 3, 9–16.
- Létolle, R.; Mainguet, M. History of the Aral Sea (central Asia) since the most recent maximum glaciation. Bull. Geol. Soc. France 1997, 168, 387–398.
- Atlas of geological maps of Central Asia and adjacent areas. Eds. Tingdong, L.I.; Daukeev, S.Z.; Kim, B.C.; Tomurtogoo, O.; Petrov, O.V., Geological Publishing House, Beijing, China, 2008, maps at 1:2,500,000.
- Burr, G.S.; Kuzmin, Y.V.; Krivonogov, S.K.; Gusskov, S.A.; Cruz, R.J. A history of the modern Aral Sea (Central Asia) since the Late Pleistocene. Quaternary Sci. Rev. 2019, 206, 141–149. [CrossRef]
- Brunet, M.F.; McCann, T.; Sobel, E.R. Geological evolution of Central Asian Basins and the Western Tien Shan Range. Geol. Soc. Sp. 2017, 427, 1–17.
- Robert, A.M.M.; Letouzey, J.; Kavoosi, M.A.; Sherkati, S.; Müller, C.; Vergés, J.; Aghababaei, A. Structural evolution of the Kopeh Dagh fold-and-thrust belt (NE Iran) and interactions with the South Caspian Sea Basin and Amu Darya Basin. Mar. Petrol. Geol. 2014, 57, 68–87.
- Hosseinyar, G.; Moussavi-Harami, R.; Fard, I.A.; Mahboubi, A.; Rad, R.N. Seismic geomorphology and stratigraphic trap analyses of the Lower Cretaceous siliciclastic reservoir in the Kopeh Dagh-Amu Darya Basin. Petroleum Sci. 2019, 16, 776–793. [CrossRef]
- Boomer, I.; Wünnemann, B.; Mackay, A.W.; Austin, P.; Sorrel, P.; Reinhardt, C.; Keyser, D.; Guichard, F.; Fontugne, M. Advances in understanding the late Holocene history of the Aral Sea region. Quaternary Int. 2009, 194, 79–90. [CrossRef]
- Sala, R. Quantitative evaluation of the impact on Aral Sea levels by anthropogenic water withdrawal and Syr Darya course diversion during the Medieval period (1.0–0.8 ka BP). In Socio-Environmental Dynamics along the Historical Silk Road, L. E. Yang et al. (eds.), Springer, Berlin Heidelberg, 2019, pp. 95-121.
- Boroffka, N.; Oberhänsli, H.; Sorrel, P.; Demory, F.; Reinhardt, C.; Wünnemann, B.; Alimov, K.; Baratov, S.; Rakhimov, K.; Saparov, N.; Shirinov, T.; Krivonogov, S.K.; Röhl, U. Archaeology and climate: Settlement and lake-level changes at the Aral Sea. Geoarchaeology 2006, 21, 721–734. [CrossRef]
- Mainguet, M.; Létolle, R.; Dumay, F. The regional Aeolian action system of the Aral Basin. C. R. Geosci. 2002, 334, 475–480.
- Pohl, E.; Knoche, M.; Gloaguen, R.; Andermann, C.; Krause, P. Sensitivity analysis and implications for surface processes from a hydrological modelling approach in the Gunt catchment, high Pamir Mountains. Earth Surf. Dynam., 2015, 3, 333–362. [CrossRef]
- Ma, X.; Zhu, J.; Yan, W.; Zhao, C. Projections of desertification trends in Central Asia under global warming scenarios. Sci. Total Environ. 2021, 781, 146777. [CrossRef]
- Nezlin, N.P.; Kostianoy, A.G.; Li, B.L. Inter-annual variability and interaction of remote-sensed vegetation index and atmospheric precipitation in the Aral Sea region. J. Arid Environ. 2005, 62, 677–700. [CrossRef]
- De Beurs, K.M.; Henebry, G.M.; Owsley, B.C.; Sokolik, I. Using multiple remote sensing perspectives to identify and attribute land surface dynamics in Central Asia 2001-2013. Remote Sens. Environ. 2015, 170, 48–60. [CrossRef]
- Shen, H.; Abuduwaili, J.; Ma, L.; Samat, A. Remote sensing-based land surface change identification and prediction in the Aral Sea bed, Central Asia. Int. J. Environ. Sci. Technol. 2018, doi.org/10.1007/s13762-018-1801-0. [CrossRef]
- Deliry, S.I.; Avdan, Z.Y.; Do, N.T.; Avdan, U. Assessment of human-induced environmental disaster in the Aral Sea using Landsat satellite images. Environ. Earth Sci. 2020, 79, 471. [CrossRef]
- Tao, D.; Shi, H.; Gao, C.; Zhan, J.; Ke, X. Water storage monitoring in the Aral Sea and its endorheic basin from multisatellite data and a hydrological model. Remote Sens. 2020, 12, 2408. [CrossRef]
- Liu, Q.; Lee, Y.K.; Grassotti, C.; Liang, X.M.; Kidder, S.Q.; Kusselson, S. The challenge of surface type changes over the Aral Sea for satellite remote sensing of precipitation. IEEE J. Sel. Top. Appl. 2022, 15, 8650–8655. [CrossRef]
- Kravtsova, V.I. Analysis of changes in the Aral Sea coastal zone in 1975–1999. Water Resour. 2001, 28, 596–603. [CrossRef]
- Zhou, J.; Ke, L.; Ding, X.; Wang, R.; Zeng, F. Monitoring spatial–temporal variations in river width in the Aral Sea Basin with Sentinel-2 imagery. Remote Sens. 2024 16, 822. [CrossRef]
- Klein, I.; Dietz, A.J.; Gessner, U.; Galayeva, A.; Myrzakhmetov, A.; Kuenzer, C. Evaluation of seasonal water body extents in Central Asia over the past 27 years derived from medium-resolution remote sensing data. Int. J. App. Earth Obs. 2014, 26, 335–349. [CrossRef]
- Shi, W.; Wang, M.; Guo, W. Long-term hydrological changes of the Aral Sea observed by satellite. J. Geophys. Res. – Oceans 2014, 119, 3313–3326. [CrossRef]
- Crétaux, J.F.; Birkett, C. Lake studies from satellite radar altimetry. C. R. Geosci. 2006, 338, 1098–1112. [CrossRef]
- Kouraev, A.V.; Kostianoy, A.G.; Lebedev, S.A. Ice cover and sea level of the Aral Sea from satellite altimetry and radiometry (1992–2006). J. Mar. Syst. 2009, 76, 272–286. [CrossRef]
- Zmijewski, K.; Becker, R. Estimating the effects of anthropogenic modification on water balance in the Aral Sea watershed using GRACE: 2003–12. Earth Interact. 2013, 18, 1–16. [CrossRef]
- Singh, A.; Seitz, F.; Schwatke, C. Inter-annual water storage changes in the Aral Sea from multi-mission satellite altimetry, optical remote sensing, and GRACE. Remote Sens. Environ. 2012, 123, 187–195. [CrossRef]
- Crétaux, J.F.; Létolle, R.; Calmant, S. Investigations on Aral Sea regressions from mirabilite deposits and remote sensing. Aquat. Geochem. 2009, 15, 277–291. [CrossRef]
- Zhang, Y.; Wang, N.; Yang, X.; Mao, Z. The dynamic changes of Lake Issyk-Kul from 1958 to 2020 based on multi-source satellite data. Remote Sens. 2022, 14, 1575. [CrossRef]
- Crétaux, J.F.; Bergé-Nguyen, M.; Calmant, S.; Jamangulova, N.; Satylkanov, R.; Lyard, F.; Perosanz, F.; Verron, J.; Samine Montazem, A.; Le Guilcher, G.; Leroux, D.; Barrie, J.; Maisongrande, P.; Bonnefond, P. Absolute calibration or validation of the altimeters on the Sentinel-3A and the Jason-3 over Lake Issykkul (Kyrgyzstan). Remote Sens. 2018, 10, 1679. [CrossRef]
- Yang, X.; Wang, N.; Chen, A.; He, J.; Hua, T.; Qie, Y. Changes in area and water volume of the Aral Sea in the arid Central Asia over the period of 1960–2018 and their causes. Catena 2020, 191, 104566. [CrossRef]
- Singh, A.; Behrangi, A.; Fisher, J.B.; Reager, J.T. On the desiccation of the South Aral Sea observed from spaceborne missions. Remote Sens. 2018, 10, 793. [CrossRef]
- Liu, Z.; Huang, Y.; Liu, T.; Li, J.; Xing, W.; Akmalov, S.; Peng, J.; Pan, X.; Guo, C.; Duan, Y. Water balance analysis based on a quantitative evapotranspiration inversion in the Nukus irrigation area, Lower Amu River Basin. Remote Sens. 2020, 12, 2317. [CrossRef]
- Oberhänsli, H.; Weise, S.M.; Stanichny, S. Oxygen and hydrogen isotopic water characteristics of the Aral Sea, Central Asia. J. Marine Syst. 2009, 76, 310–321. [CrossRef]
- Thevs, N.; Ovezmuradov, K.; Zanjani, L.V.; Zerbe, S. Water consumption of agriculture and natural ecosystems at the Amu Darya in Lebap Province, Turkmenistan. Environ. Earth Sci. 2015, 73, 731–741.
- Shi, J.; Guo, Q.; Zhao, S.; Su, Y; Shi, Y. The effect of farmland on the surface water of the Aral Sea region using multi-source satellite data. PeerJ 2022, 10:e12920. [CrossRef]
- Gardelle, J.; Berthier,E.; Arnaud, Y.; Kääb, A. Region-wide glacier mass balances over the Pamir-Karakoram-Himalaya during 1999–2011. The Cryosphere 2013, 7, 1263–1286. [CrossRef]
- Rittger, K.; Bormann, K.J.; Bair, E.H.; Dozier, J.; Painter, T.H. Evaluation of VIIRS and MODIS Snow Cover Fraction in High-Mountain Asia Using Landsat 8 OLI. Front. Remote Sens. 2021, 2, 647154. [CrossRef]
- Kouraev, A.V.; Papa, F.; Mognard, N.M.; Buharizin, P.I.; Cazenave, A.; Crétaux, J.-F.; Dozortseva, J.; Remy, F. Synergy of active and passive satellite microwave data for the study of first-year sea ice in the Caspian and Aral Seas. IEEE Trans. Geosci. Remote Sens. 2004, 42, 2170–2176. [CrossRef]
- Vydra, C.; Dietz, A.J.; Roessler, S.; Conrad, C. The influence of snow cover variability on the runoff in Syr Darya headwater catchments between 2000 and 2022 based on the analysis of remote sensing time series. Water 2024, 16, 1902. [CrossRef]
- Mergili, M.; Müller, J.P.; Schneider, J.F. Spatio-temporal development of high-mountain lakes in the headwaters of the Amu Darya River (Central Asia). Global Planet. Change 2013, 107, 13–24. [CrossRef]
- Sadov, A.V.; Krapilskaya, N.M.; Revzon, A.L. Aerospace methods of examining aeration zone in sandy deserts. Int. Geol. Rev. 1980, 23, 297–301. [CrossRef]
- Revzon, A.L.; Burleshin, M.I.; Krapilskaya, N.M.; Sadov, A.V.; Svitneva, T.V.; Semina, N.S. Desert geology studied through air and space methods. Probl. Ovs. Pustyn 1982, 1, 20–28.
- Vitkovskaya, T.P.; Mansimov, M.; Shekhter, L.G. Dynamics of the Sarykamysh Lake development based on space photography. Probl. Ovs. Pustyn 1985, 6, 38–43.
- Borodin, L.F.; Bortnik, V.N.; Krapivin, V.F.; Kuznetsov; N.T., Kulikov; Y.N.; Minaeva, E.N. Some general questions of changes, appraisal elaboration of functioning and the remote sensing monitoring models for aqua- and geosystems of the Aral Sea Basin. Probl. Osv. Pustyn 1987, 1, 71–80.
- Kes, A.S. History of the Sarykamysh Lake in the light of the new data obtained by the distant technique. Probl. Ovs. Pustyn 1987, 1, 36–41.
- Sadov, A.V.; Krasnikov, V.V. Remote sensing in detection of local subaqueous discharge of ground water into the Aral Sea. Probl. Ovs. Pustyn 1987, 1, 28–36.
- Mackenzie, D.; Walker, R.; Abdrakhmatov, K.; Campbell, G.; Carr, A.; Gruetzner, C.; Mukambayev, A.; Rizza, M. A creeping intracontinental thrust fault: past and present slip-rates on the Northern edge of the Tien Shan, Kazakhstan. Geophys. J. Int. 2018, 215, 1148–1170. [CrossRef]
- Grützner, C.; Walker, R.T.; Abdrakhmatov, K.E.; Mukambaev, A.; Elliott, A.J.; Elliott, J.R. Active tectonics around Almaty and along the Zailisky Alatau rangefront. Tectonics 2017, 36, 2192–2226. [CrossRef]
- Liu, L.; Li, Y.; Zhou, J.; Han, L.; Xu, X. Gold-copper deposits in Wushitala, Southern Tianshan, Northwest China: Application of ASTER data for mineral Exploration. Geol. J. 2018, 53, 362–371. [CrossRef]
- Zheentaev, E. Application of remote sensing technologies for the environmental impact analysis in Kumtor gold mining company. Int. J. Geoinf., 2015, 12, 31–39.
- Jiang, Y.; Lin, W.; Wu, M.; Liu, K.; Yu, X.; Gao, J. Remote sensing monitoring of ecological-economic impacts in the Belt and Road Initiatives mining project: A case study in Sino Iron and Taldybulak Levoberezhny. Remote Sens. 2022, 14, 3308. [CrossRef]
- He B.; Xue, Y.; Lu, X.; Zhao, L.; Jin, C.; Wang, P.; Li, P.; Liu, W.; Yin, W.; Yuan, T. Monitoring oil and gas field CH4 leaks by Sentinel-5P and Sentinel-2. Fuel 2025, 383, 133889. [CrossRef]
- Sánchez-García, E.; Gorroño, J.; Irakulis-Loitxate, I.; Varon, D.J.; Guanter, L. Mapping methane plumes at very high spatial resolution with the WorldView-3 satellite. Atmos. Meas. Tech. 2022, 15, 1657–1674. [CrossRef]
- Sichugova, L.; Fazilova, D. The lineaments as one of the precursors of earthquakes: A case study of Tashkent geodynamical polygon in Uzbekistan. Geodesy and Geodyn. 2021, 12, 399–404. [CrossRef]
- Jing, F.; Jiang, M.; Singh, R.P. Detection of seismic microwave radiation anomalies in snow-covered mountainous terrain: Insights from two recent earthquakes in the Pamir–Tien Shan Region. IEEE J. Sel. Top. Appl. 2024, 17, 18156–18166. [CrossRef]
- Gorny, V.I.; Salman, A.G.; Tronin, A.A.; Shilin, B.V. Terrestrial outgoing infrared radiation as an indicator of seismic activity. Proc. Acad. Sci. USSR 1988, 301, 67-69.
- Oberhänsli, H.; Novotná, K.; Píšková, A.; Chabrillat, S.; Nourgaliev, D.K.; Kurbaniyazov, A.K.; Grygar, T.M. Variability in precipitation, temperature and river runoff inW Central Asia during the past ~2000 yrs. Global Planet. Change 2011, 76, 95–104.
- Schettler, G.; Oberhänsli, H.; Stulina, G.; Mavlonov, A.A.; Naumann, R. Hydrochemical water evolution in the Aral Sea Basin. Part I: Unconfined groundwater of the Amu Darya Delta – Interactions with surface waters. J. Hydrol. 2013a, 495, 267–284.
- Schettler, G.; Oberhänsli, H.; Stulina, G.; Djumanov, J.H. Hydrochemical water evolution in the Aral Sea Basin. Part II: Confined groundwater of the Amu Darya Delta – Evolution from the headwaters to the delta and SiO 2 geothermometry. J. Hydrol. 2013b, 495, 285–303.
- Bishimbayev, V.K.; Issayeva, A.U.; Nowak, I.; Serzhanov, G.; Tleukeyeva, A.Y. Prospects for rational use of mineral resources of the Dzhaksy-Klych deposit, the Aral region. News Nat. Acad. Sci. Rep. Kazakhstan, Series Geol. Techn. Sci. 2020, 443, 196–203. [CrossRef]
- Song, Y.; Zheng, H.; Chen, X.; Bao, A.; Lei, J.; Xu,W.; Luo, G.; Guan, Q. Desertification extraction based on a microwave backscattering contribution decomposition model at the dry bottom of the Aral Sea. Remote Sens. 2021, 13, 4850. [CrossRef]
- Akramkhanov, A.; Martius, C.; Park, S.J.; Hendrickx, J.M.H. Environmental factors of spatial distribution of soil salinity on flat irrigated terrain. Geoderma 2011, 163, 55–62. [CrossRef]
- Duan, Z.; Wang, X.; Sun, L. Monitoring and mapping of soil salinity on the exposed seabed of the Aral Sea, Central Asia. Water 2022, 14, 1438. [CrossRef]
- Grigoryev, A.A.; Lipatov, V.B. Distribution of dust pollution in the Circum-Aral region by space monitoring. Proc. Acad. Sci. USSR, geographical series 1983, 4, 73–77.
- Grigoryev, A.A.; Jogova, M.L. Strong dust blowouts in Aral region in 1985–1990. Proc. Russ. Acad. Sci. 1992, 324, 672–675.
- Prospero, J.M.; Ginoux, P.; Torres, O.; Nicholson, S.E.; Gill, T.E. Environmental characterization of global sources of atmospheric soil dust identified with the Nimbus 7 Total Ozone Mapping Spectrometer (TOMS) absorbing aerosol product. Rev. Geophys. 2002, 40, 1. [CrossRef]
- Löw, F.; Navratil, P.; Kotte, K.; Schöler, H.F.; Bubenzer, O. Remote-sensing-based analysis of landscape change in the desiccated seabed of the Aral Sea — A potential tool for assessing the hazard degree of dust and salt storms. Environ. Monit. Assess. 2013, 185, 8303–8319. [CrossRef]
- Hamidi, M.; Kavianpour, M.R.; Shao, Y. Numerical simulation of dust events in the Middle East. Aeolian Res. 2014, 13, 59–70. [CrossRef]
- Banks, J. R.; Heinold, B.; Schepanski, K. Impacts of the desiccation of the Aral Sea on the Central Asian dust life-cycle. J. Geoph. Res. Atm. 2022, 127, e2022JD036618. [CrossRef]
- Indoitu, R.; Kozhoridze, G.; Batyrbaeva, M.; Vitkovskaya, I.; Orlovsky, N.; Blumberg, D.; Orlovsky, L. Dust emission and environmental changes in the dried bottom of the Aral Sea. Aeolian Res. 2020, 17, 101–115. [CrossRef]
- Wang, W.; Samat, A.; Ge, Y.; Ma, L.; Tuheti, A.; Zou, S.; Abuduwaili, J. Quantitative soil wind erosion potential mapping for central Asia using the Google Earth engine platform. Remote Sens. 2020, 12, 3430. [CrossRef]
- Ubaidulloev, A.; Kaiheng, H.; Rustamov, M.; Kurbanova, M. Landslide inventory along a National Highway Corridor in the Hissar-Allay Mountains, Central Tajikistan. GeoHazards 2021, 2, 212–227. [CrossRef]
- Sidle, R.C.; Caiserman, A.; Jarihani, B.; Khojazoda, Z.; Kiesel, J.; Kulikov, M.; Qadamov, A. Sediment sources, erosion processes, and interactions with climate dynamics in the Vakhsh River Basin, Tajikistan. Water 2024, 16, 122. [CrossRef]
- Nardini, O.; Confuorto, P.; Intrieri, E.; Montalti, R.; Montanaro, T.; Garcia Robles, J.; Poggi, F.; Raspini, F. Integration of satellite SAR and optical acquisitions for the characterization of the Lake Sarez landslides in Tajikistan. Landslides 2024, 21, 1385–1401. [CrossRef]
- Behling, R.; Roessner, S.; Kaufmann, H.; Kleinschmit, B. Automated spatiotemporal landslide mapping over large areas using RapidEye time series data. Remote Sens. 2014, 6, 8026-8055. [CrossRef]
- Roessner, S.; Wetzel, H.U.; Kaufmann, H.; Sarnagoev, A. Potential of satellite remote sensing and GIS for landslide hazard assessment in Southern Kyrgyzstan (Central Asia). Nat. Hazards 2005, 35, 395–416. [CrossRef]
- Ozturk, U.; Pittore, M.; Behling, R.; Roessner, S.; Andreani, L.; Korup, O. How robust are landslide susceptibility estimates? Landslides 2021, 18, 681–695.
- Teshebaeva, K.; Roessner, S.; Echtler, H.; Motagh, M.; Wetzel, H.U.; Molodbekov, B. ALOS/PALSAR InSAR time-series analysis for detecting very slow-moving landslides in Southern Kyrgyzstan. Remote Sens. 2015, 7, 8973–8994. [CrossRef]
- Piroton, V.; Schlögel, R.; Barbier, C.; Havenith, H.B. Monitoring the recent activity of landslides in the Mailuu-Suu Valley (Kyrgyzstan) using radar and optical remote sensing techniques. Geosci. 2020, 10, 164. [CrossRef]
- Wang, W.; Motagh, M.; Xia, Z.; Plank, S.; Li, Z.; Orynbaikyzy, A.; Zhou, C.; Roessner, S. A framework for automated landslide dating utilizing SAR-derived parameters time-series, an Enhanced Transformer Model, and Dynamic Thresholding. Int. J. Appl. Earth Obs. 2024, 129, 103795. [CrossRef]
- Juliev, M.; Mergili, M.; Mondal, I.; Nurtaev, B.; Pulatov, A.; Hübl, J. Comparative analysis of statistical methods for landslide susceptibility mapping in the Bostanlik District, Uzbekistan. Sci. Total Environ. 2019, 653, 801–814. [CrossRef]
- Aslan, G.; de Michele, M.; Raucoules, D.; Renard, F.; Dehls, J.; Penna, I.; Hermann, R.; Cakir, Z. Dynamics of a giant slow landslide complex along the coast of the Aral Sea, Central Asia. Turk. J. Earth. Sci. 2023, 32, 819–832. [CrossRef]
- Tavus, B.; Kocaman, S.; Gokceoglu, C. Flood damage assessment with Sentinel-1 and Sentinel-2 data after Sardoba dam break with GLCM features and Random Forest method. Sci. Total Environ. 2022, 816, 151585. [CrossRef]
- Ouyang, Y.; Stanturf, J.A.; Williams, M.D.; Botmann, E.; Madsen, P. Quantification of Mountainous Hydrological Processes in the Aktash River Watershed of Uzbekistan, Central Asia, over the Past Two Decades. Hydrology 2023, 10, 161. [CrossRef]
- Kapitsa, V.; Shahgedanova, M.; Kasatkin, N.; Severskiy I.; Kasenov, M.; Yegorov, A.; Tatkova, M. Bathymetries of proglacial lakes: a new data set from the northern Tien Shan, Kazakhstan. Front. Earth Sci. 2023, 11, 1192719. [CrossRef]
- Petrov, M.A.; Sabitov, T.Y.; Tomashevskaya, I.G.; Glazirin, G.E.; Chernomorets, S.S.; Savernyuk, E.A.; Tutubalina, O.V.; Petrakov, D.A.; Sokolov, L.S.; Dokukin, M.D.; Mountrakis, G.; Ruiz-Villanueva, V.; Stoffel, M. Glacial lake inventory and lake outburst potential in Uzbekistan. Sci. Total Environ. 2017, 592, 228–242. [CrossRef]
- Mergili, M.; Schneider, J.F. Regional-scale analysis of lake outburst hazards in the southwestern Pamir, Tajikistan, based on remote sensing and GIS. Nat. Hazards Earth Syst. Sci. 2011, 11, 1447–1462. [CrossRef]
- Petrakov, D.A.; Chernomorets, S.S.; Viskhadzhieva, K.S.; Dokukin, M.D.; Savernyuk, E.A.; Petrov, M.A.; Erokhin, S.A.; Tutubalina, O.V.; Glazyrin, G.E.; Shpuntova, A.M.; Stoffel, M. Putting the poorly documented 1998 GLOF disaster in Shakhimardan River valley (Alay Range, Kyrgyzstan/Uzbekistan) into perspective. Sci. Total Environ. 2020, 724, 138287. [CrossRef]
- Erokhin, S.A.; Zaginaev, V.V.; MeleshkoI, A.A.; Ruiz-Villanueva, V.; Petrakov, D.A.; Chernomorets, S.S.; Viskhadzhieva, K.S.; Tutubalina. O.V.; Stoffel, M. Debris flows triggered from non-stationary glacier lake outbursts: the case of the Teztor Lake complex (Northern Tian Shan, Kyrgyzstan). Landslides 2018 15, 83–98. [CrossRef]
- Shangguan, D.; Ding, Y.; Liu, S.; Xie, Z.; Pieczonka, T.; Xu, J.; Moldobekov, B. Quick release of internal water storage in a glacier leads to underestimation of the hazard potential of glacial lake outburst floods from Lake Merzbacher in central Tian Shan Mountains. Geophys. Res. Lett. 2017, 44, 9786–9795. [CrossRef]
- Bolch, T.; Peters, J.; Yegorov, A.; Pradhan, B.; Buchroithner, M.; Blagoveshchensky, V. Identification of potentially dangerous glacial lakes in the northern Tien Shan. Nat. Hazards 2011, 59, 1691–1714. [CrossRef]
- Daiyrov, M.; Narama, C.; Kääb, A.; Tadono, T. Formation and outburst of the Toguz-Bulak glacial lake in the Northern Teskey Range, Tien Shan, Kyrgyzstan. Geosci. 2020, 10, 468. [CrossRef]
- Daiyrov, M.; Kattel, D.B.; Narama, C.; Wang, W. Evaluating the variability of glacial lakes in the Kyrgyz and Teskey ranges, Tien Shan. Front. Earth Sci. 2022, 10, 850146. [CrossRef]
- Zaginaev, V.; Petrakov, D.; Erokhin, S.; Meleshko, A.; Stoffel, M.; Ballesteros-Cánovas, J.A. Geomorphic control on regional glacier lake outburst flood and debris flow activity over northern Tien Shan. Global Planet. Change 2019, 176, 50–59. [CrossRef]
- Meyrat, G.; Munch, J.; Cicoira, A.; McArdell, B.; Müller, C.R.; Frey, H.; Bartelt, P. Simulating glacier lake outburst floods (GLOFs) with a two-phase/layer debris flow model considering fluid-solid flow transitions. Landslides 2024, 21, 479–497. [CrossRef]
- Luo, S.; Song, C.; Liu, K.; Ke, L.; Ma, R. An effective low-cost remote sensing approach to reconstruct the long-term and dense time series of area and storage variations for large lakes. Sensors 2019, 19, 4247. [CrossRef]
- O'Grady, D.; Leblanc, M.; Bass, A. The use of radar satellite data from multiple incidence angles improves surface water mapping. Remote Sens. Environ. 2014, 140, 652–664. [CrossRef]
- Gladkova, I.; Grossberg, M. D.; Shahriar, F.; Bonev, G.; Romanov, P. Quantitative restoration for MODIS band 6 on Aqua. IEEE Trans. Geosci. Remote Sens. 2012, 50, 2409–2416. [CrossRef]
- Hoelzle, M.; Barandun, M.; Bolch, T.; Fiddes, J.; Gafurov, A.; Muccione, V.; Saks, T.; Shahgedanova, M. The status and role of the alpine cryosphere in Central Asia. In The Aral Sea Basin, Water for Sustainable Development in Central Asia; Xenarios, S.; Schmidt-Vogt, D.; Qadir, M.; Janusz-Pawletta, B.; Abdullaev, I., Eds.; Routledge Taylor and Francis Group, 2020; pp. 100–121.
- Xu, N.; Zhang, J.; Daccache, A.; Liu, C.; Ahmadi, A.; Zhou, T.; Gou, P. Assessing size shifts amidst a warming climate in lakes recharged by the Asian Water Tower through satellite imagery. Sci. Total Environ. 2024, 912, 68770. [CrossRef]
- Orlov, V.I.; Sokolova, N.V. To problem of preservation of Aral Sea. Gidrotekhnicheskoe Stroitel'stvo 1991, 11, 34–37.
Figure 1.
The Aral Sea Basin (yellow line). Background: Terra MODIS (24 October 2023). KKC: Kara Kum Canal; QTC: Qosh Tepa Canal. Black solid lines: national borders; light blue solid lines: major rivers. Vegetation is green, water bodies are dark blue or black, soil and mineral surfaces are yellow to brown, snow and ice are cyan, clouds are white.
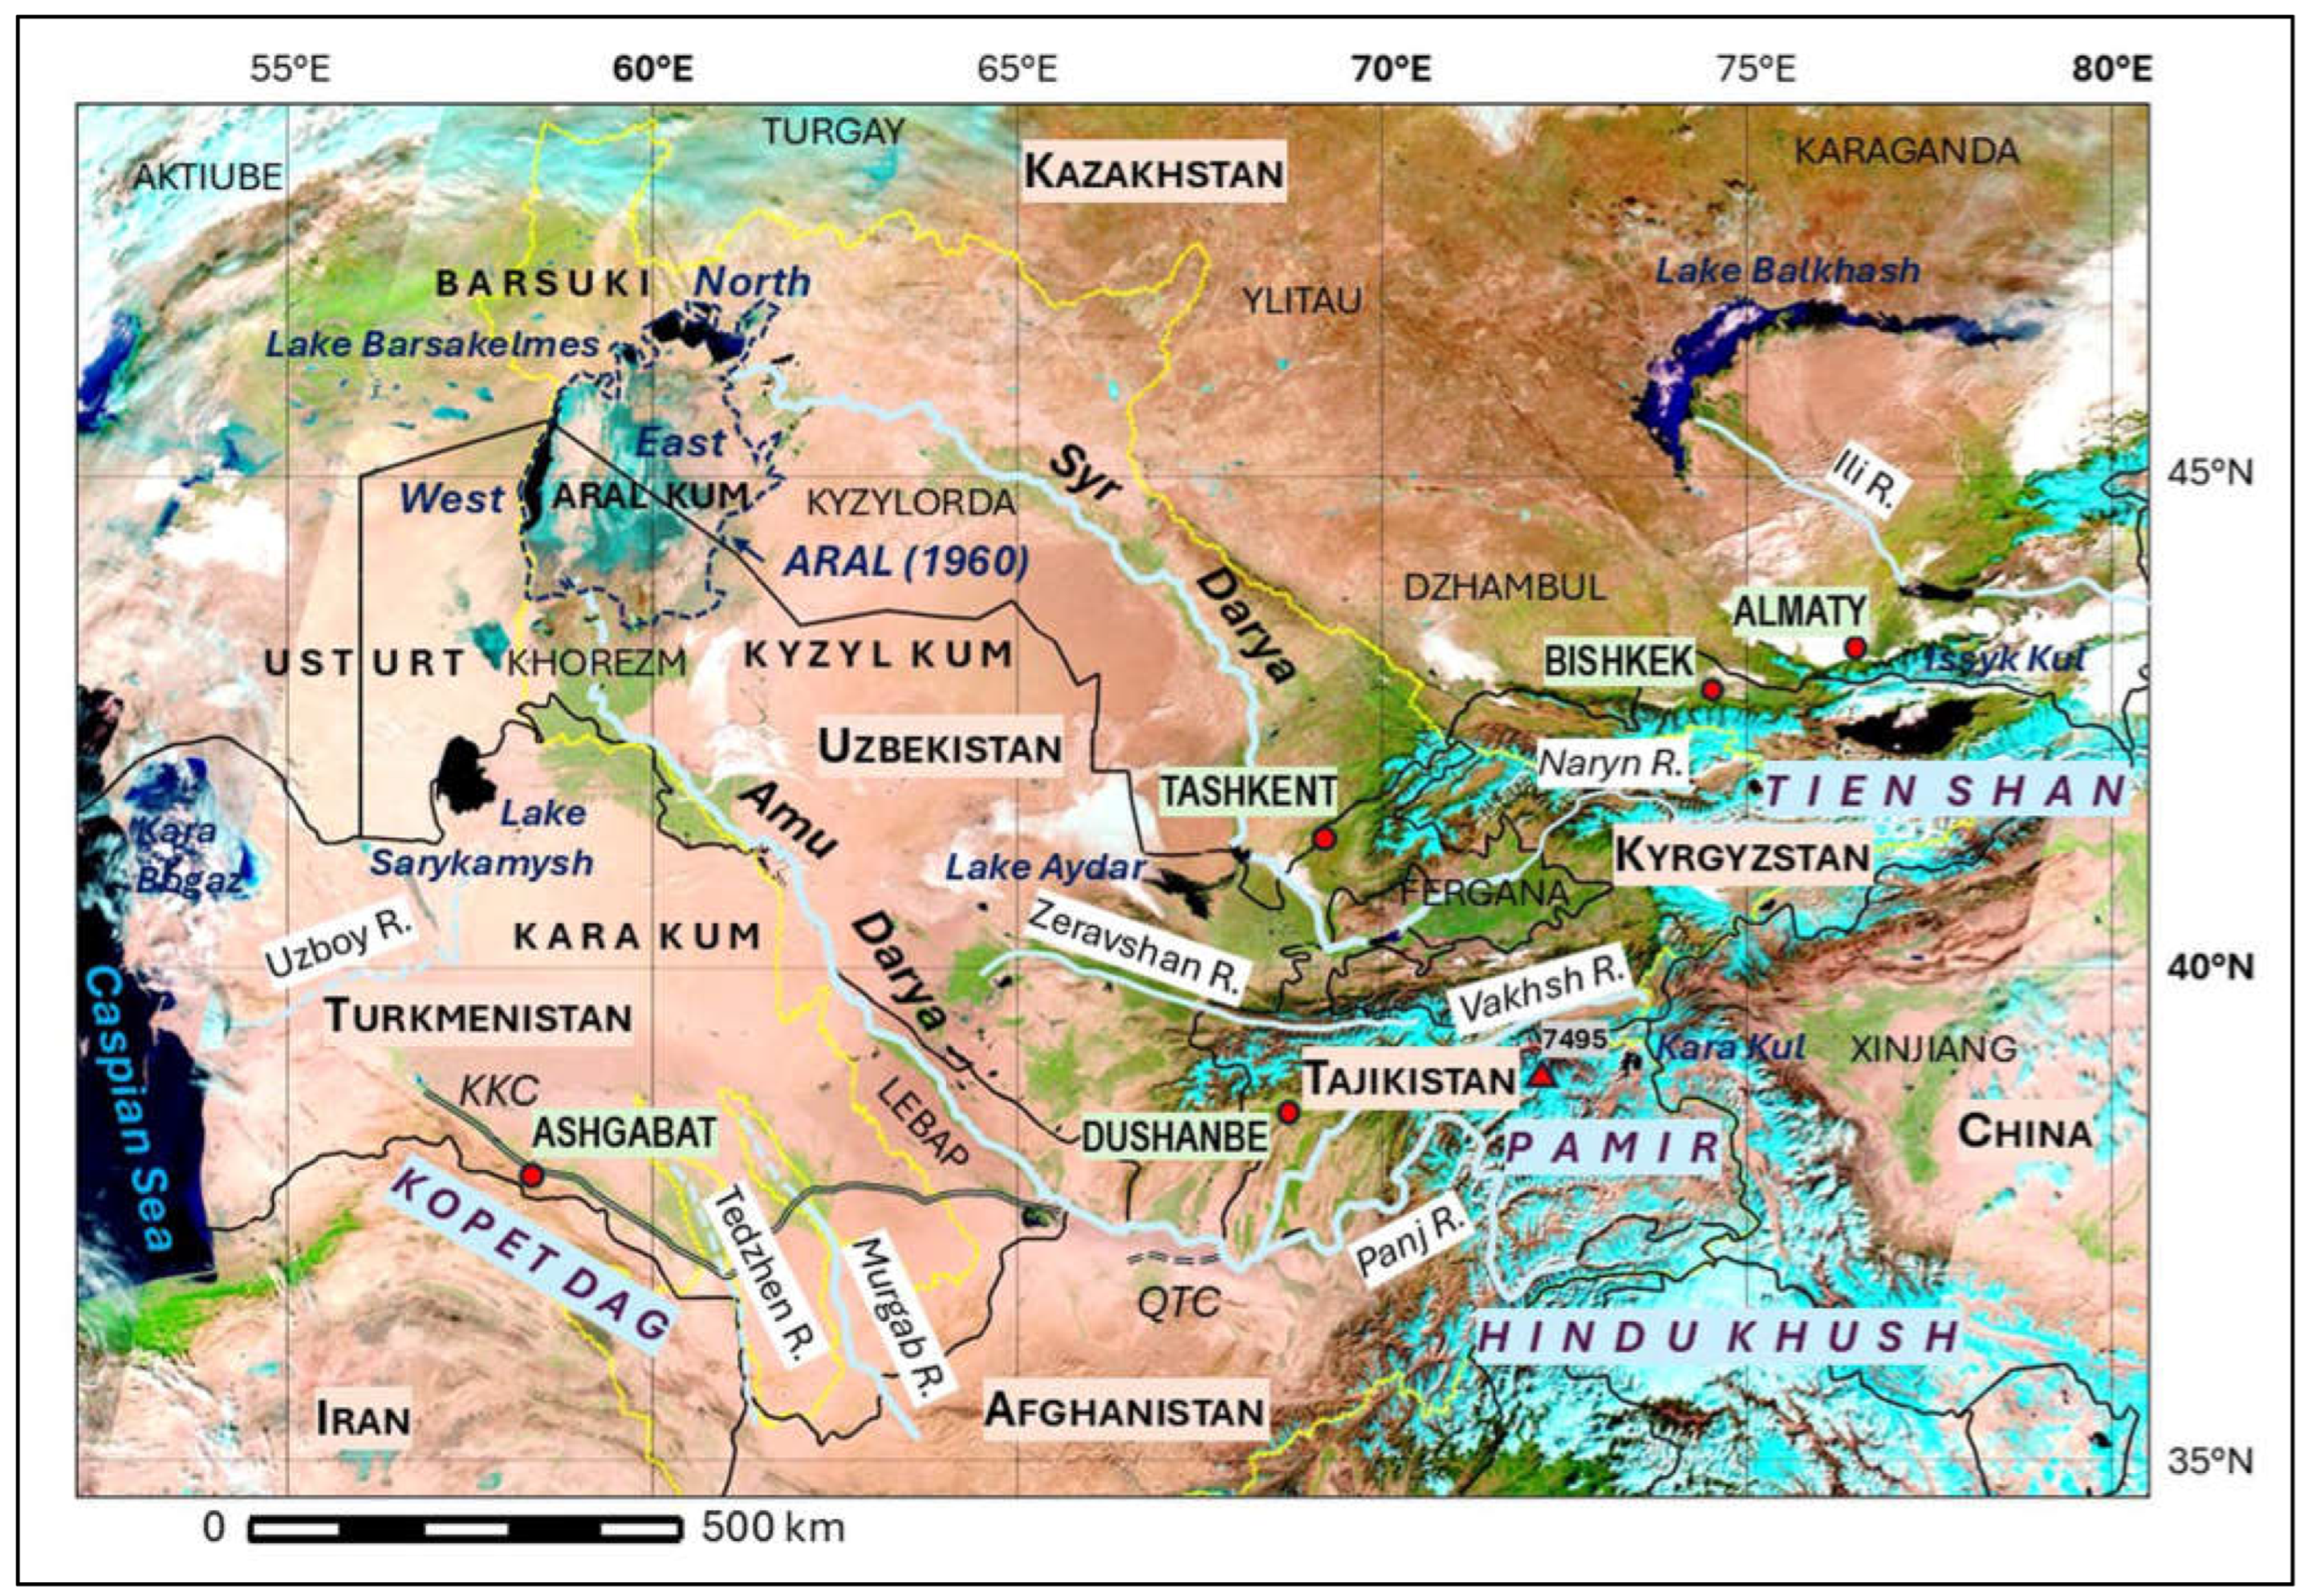
Figure 2.
The decline of the water surface in the Aral Sea. 1. [29], KH-5, Landsat-MSS, NOAA-AVHRR, 2. [2], 3. [55], Landsat TM, ETM+, OLI, 4. [20], Terra-Aqua MODIS, 5. [62], 6. [56], Landsat TM, ETM+, OLI, 7. [58], NOAA-AVHRR/VIIRS, Terra-Aqua MODIS], 8. [Deroin, unpublished data, KH-4, Terra-Aqua MODIS]. The different water bodies (shades of grey) correspond to 1962, 1980, 2005, and present. Abbreviations: B. Barsakelmes Is., EA. Eastern Aral sea, K. Kokaral Is., LB. Lake Barsakelmes, NA. Northern Aral Sea, V. Vozrozdeniya Is., WA. Western Aral Sea.
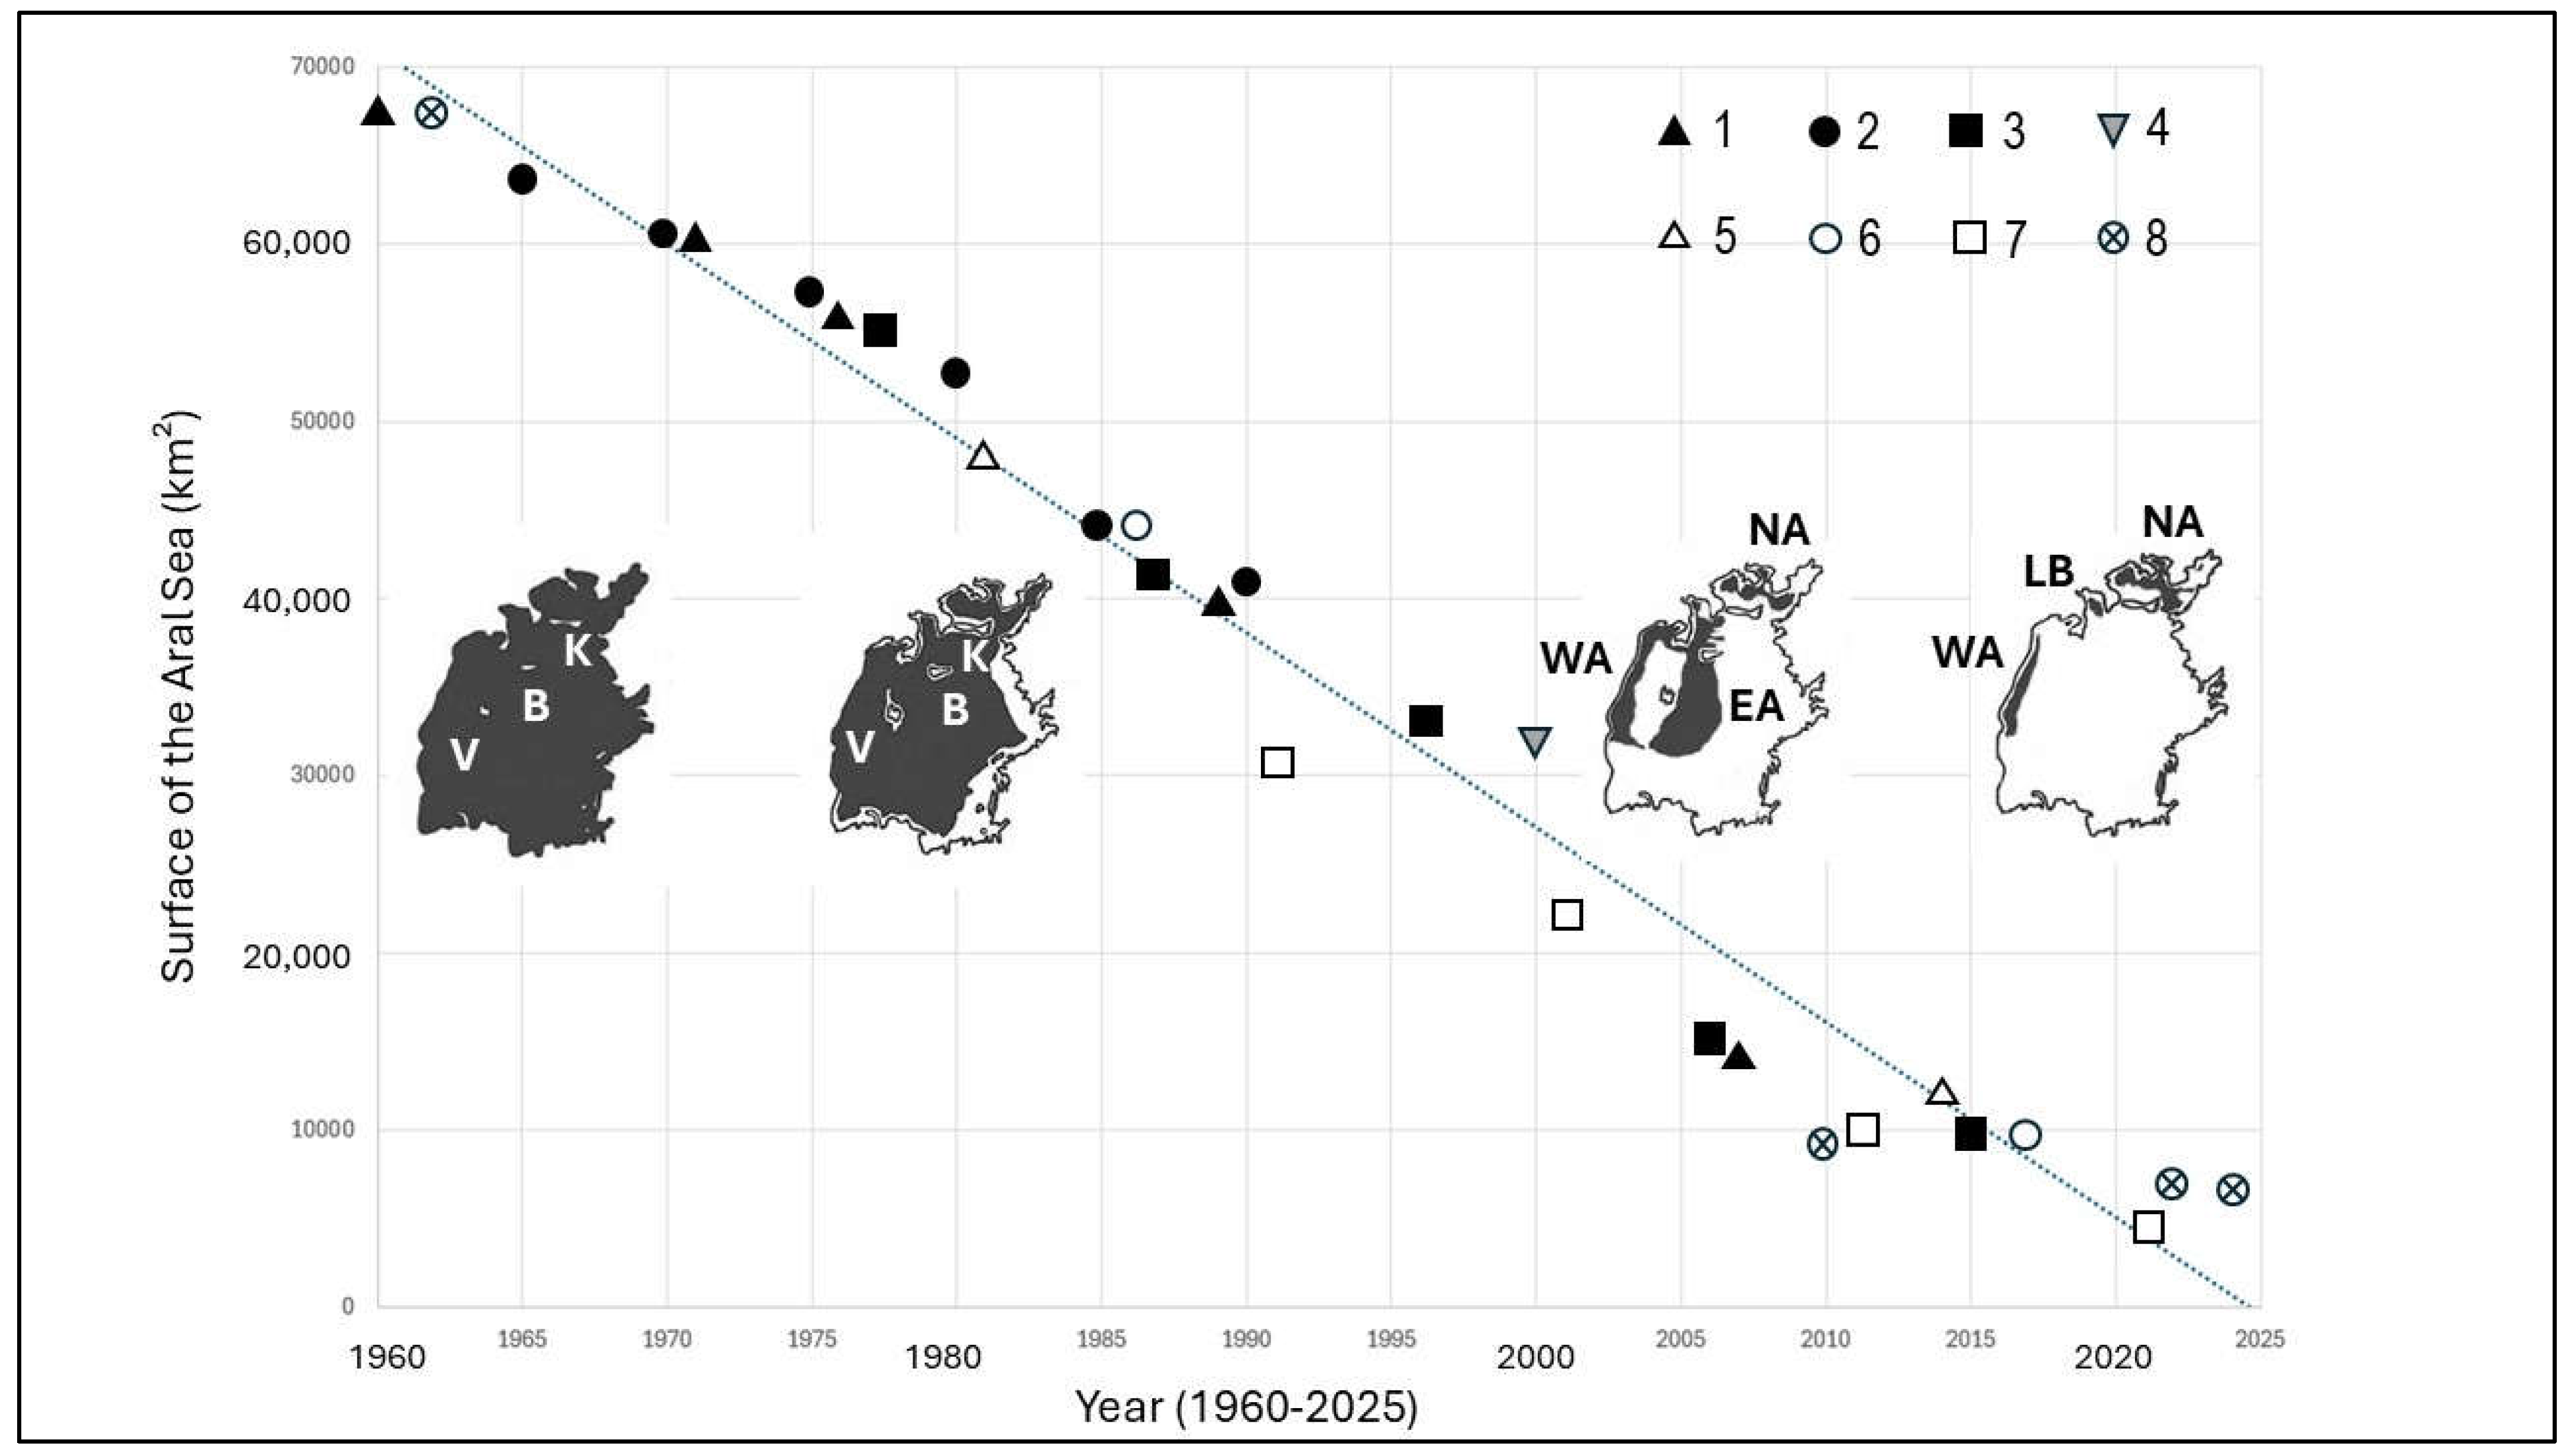
Figure 3.
The Qosh Tepa Canal (QTC) in the Balkh region of northern Afghanistan. A and B: Sentinel-2B; C, D, and E: Sentinel-2A; F: Sentinel-2C. True colour composites except for F (standard false colour). The inset in Figure A shows the location of the region: AF: Afghanistan; TJ: Tajikistan; TK: Turkmenistan; UZ: Uzbekistan. The background image is a MODIS false colour composite (24 October 2023).
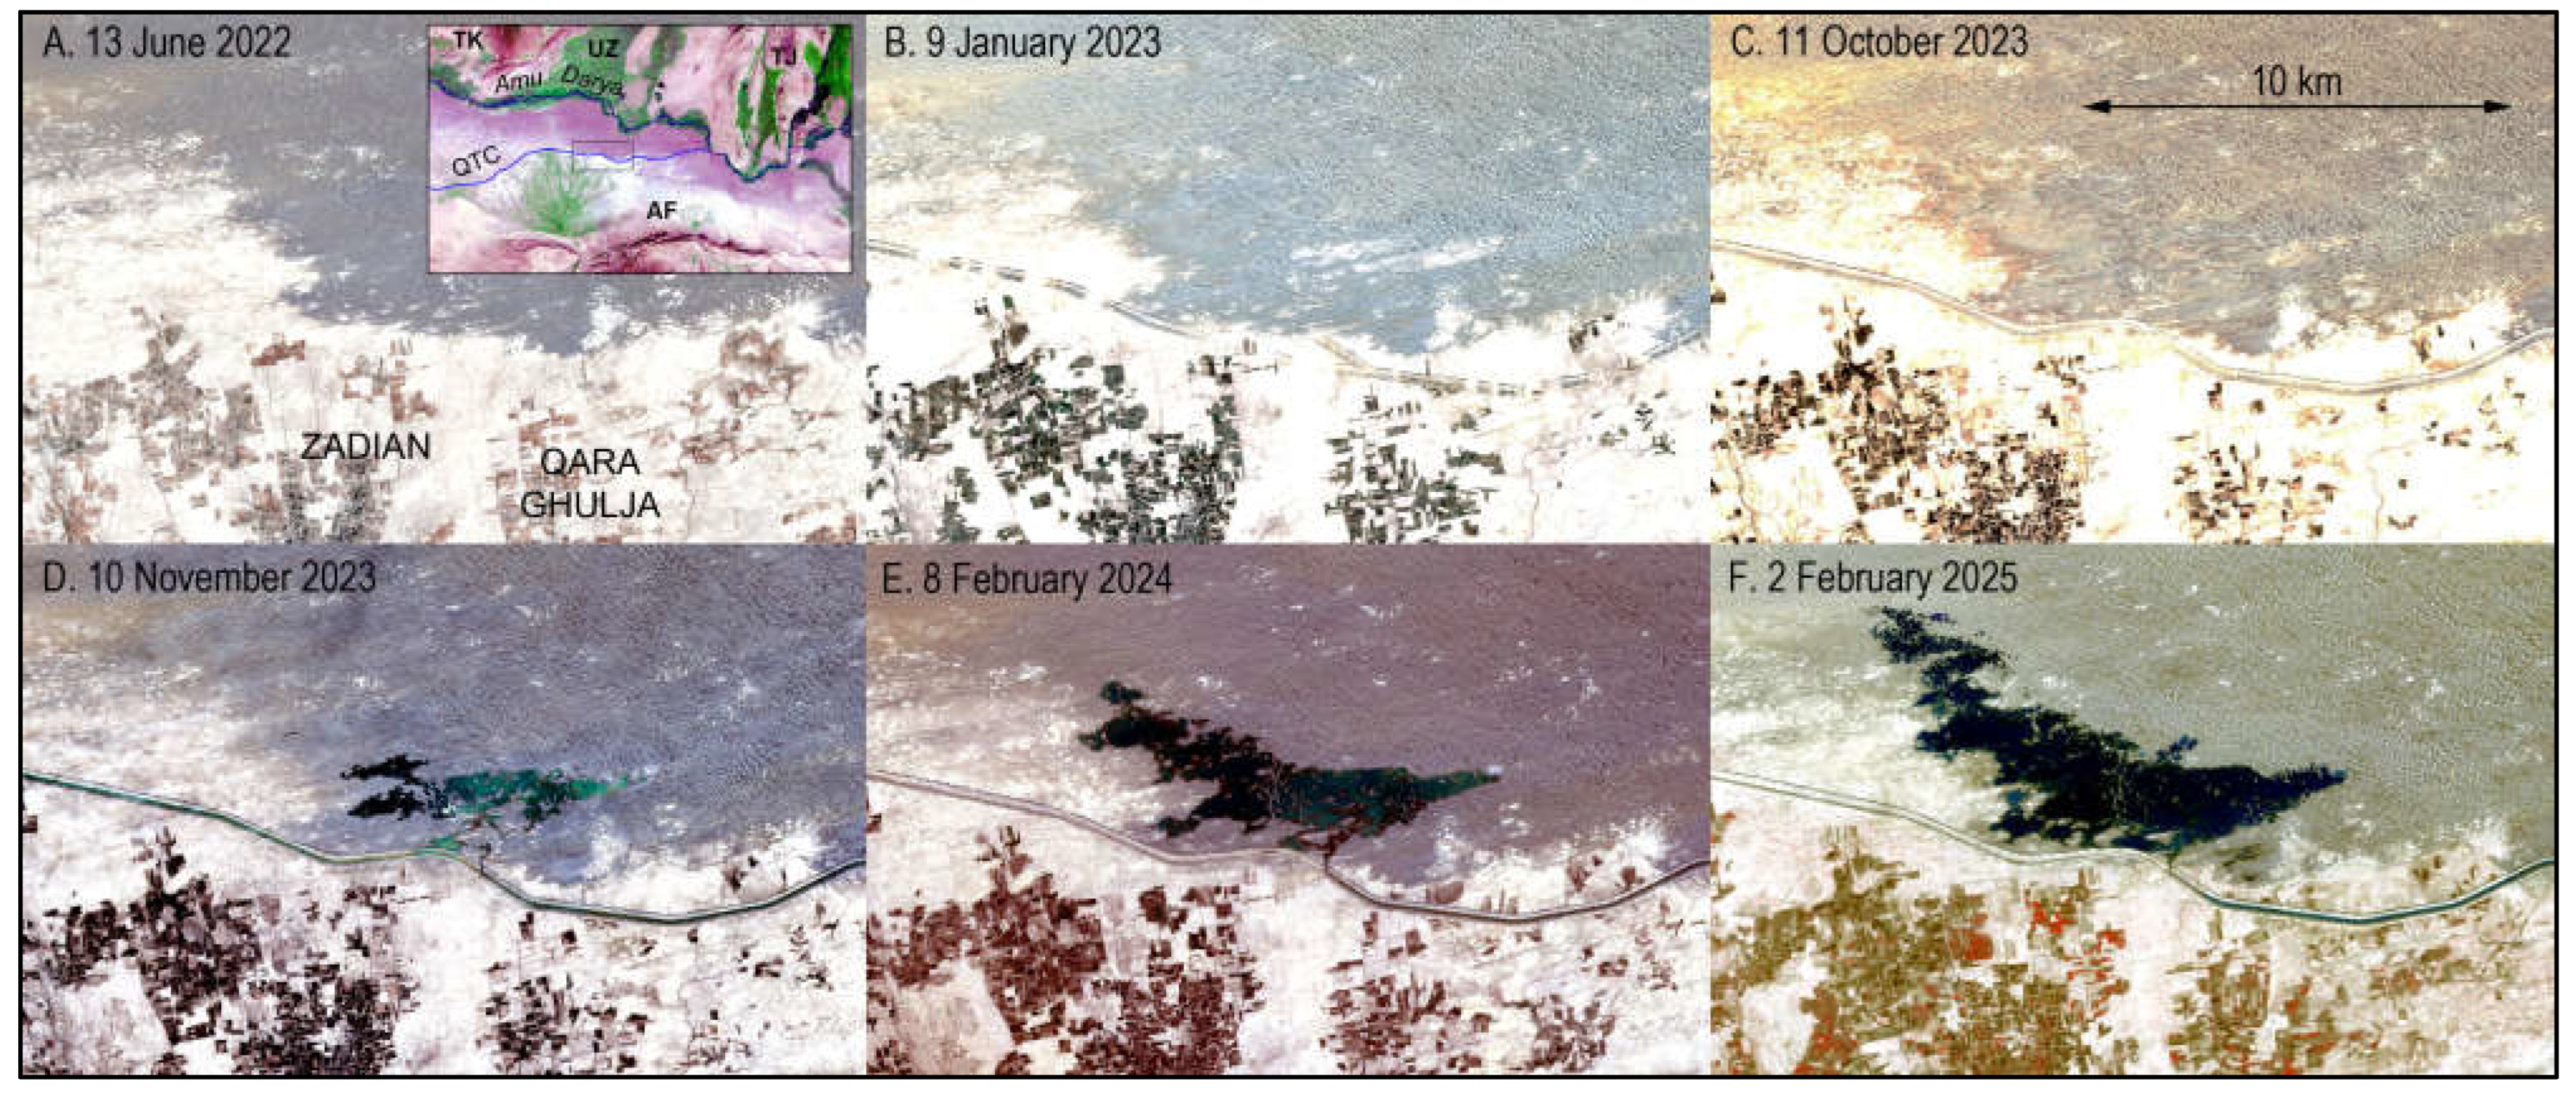
Disclaimer/Publisher’s Note: The statements, opinions and data contained in all publications are solely those of the individual author(s) and contributor(s) and not of MDPI and/or the editor(s). MDPI and/or the editor(s) disclaim responsibility for any injury to people or property resulting from any ideas, methods, instructions or products referred to in the content. |
© 2025 by the authors. Licensee MDPI, Basel, Switzerland. This article is an open access article distributed under the terms and conditions of the Creative Commons Attribution (CC BY) license (http://creativecommons.org/licenses/by/4.0/).
Copyright: This open access article is published under a Creative Commons CC BY 4.0 license, which permit the free download, distribution, and reuse, provided that the author and preprint are cited in any reuse.


