
Submitted:
14 March 2025
Posted:
17 March 2025
You are already at the latest version
Abstract
This study introduces Computational Historical Ecology, a framework that applies GIS mapping, text analysis, and AI tools to historical biodiversity data. The framework not only enhances the utility of archival sources but also highlights the potential of integrating computational techniques with historical and environmental humanities. The study works with the 1845 Bavarian Animal Observation Dataset: a historical survey documenting vertebrate species across 119 forestry districts in pre-industrial Bavaria, which offers invaluable insights into species distribution, habitat changes, and the ecological impact of human activities during the 19th century. By digitising, annotating, and analysing over 5,400 archival records, the research bridges historical ecology and computational methods to reconstruct past biodiversity patterns. Employing a data-centric methodology, the exemplary analyses reveal significant shifts in species presence, driven by land development, deforestation, and evolving agricultural practices. Notable examples include the decline of the Eurasian otter and the extinction of the Eurasian beaver in Bavaria. The interdisciplinary study demonstrates how historical records reflect both environmental transformations and the perspectives of the people who documented these changes. Findings underscore the importance of historical datasets as benchmarks for contemporary assessments and as contributions to ongoing debates in conservation science, restoration ecology, and environmental policy-making. The paper advocates for greater investment in digitisation and interdisciplinary collaboration, recognising the critical role of archival sources in shaping future biodiversity strategies.
Keywords:
historical ecology
; biodiversity
; species distribution
; zoology
; environmental humanities
; computational history
; Western capercaillie
; Eurasian beaver
; Eurasian otter
; wolf
1. Introduction
Understanding how biodiversity has shifted over time is essential for addressing the environmental challenges of the present and future. Historical records offer a valuable but often underutilised window into past ecosystems, allowing researchers to trace species distributions, population dynamics, and human-animal interactions long before modern ecological surveys began. The 1845 Bavarian Animal Observation Dataset (AOD1845) [1] represents one such resource—an extensive and unique survey conducted across the Kingdom of Bavaria in the mid of the 19th century that captured vertebrate presences and absences in remarkable detail.
This dataset, compiled from the reports of foresters across 119 districts, provides rare insights into the pre-industrial landscapes of Bavaria. These accounts, while qualitative in nature, reveal consequences of land use changes, deforestation, and habitat degradation. For example, the observation by senior forester Lorenz Reber regarding the decline of ducks following the drainage of ponds offers a poignant snapshot of environmental impact during that period:1
Since the desolation of several ponds, especially the draining of the Pfrentschweiher, the ducks are very few and rarely come to the few small ponds during the migration season. (E_00968, Vohenstrauss, Upper Palatinate)
The research presented here, stands at the intersection of historical ecology and computational analysis, offering a case study of applying computational tools, such as GIS mapping and text analysis to the AOD1845 dataset, in which we reconstruct species distributions and identify patterns that can inform current conservation efforts. In doing so, this research bridges gaps between the humanities and natural sciences, establishing a foundation for what we term Computational Historical Ecology as a means to enhance our understanding of past ecosystems and guide future conservation initiatives. The research also illustrates the required expertise in historical science in order to mobilize [2] and meaningfully valorize [3] historical sources of this kind.
2. Materials and Methods
2.1. The 1845 Survey
2.1.1. Historical Background
The original documents that sourced the AOD1845 dataset are housed in the Bavarian State Archives (Bayerisches Hauptstaatsarchiv) and belong to the record group of the Zoological State Collection (BayHStA, Zoologische Staatssammlung, 208-217) which mainly covers the responses of a detailed survey on selected vertebrate species, officially conducted by the Ministry of Finance in the Kingdom of Bavaria in Summer 1845. The survey was issued „by His Majesty the King’s highest command“ aiming at gaining „knowledge of the geographical distribution of animal and tree species in Bavaria – from a scientific point of view“ [1]. The four pages long questionnaire, sent out by the Ministry to its subordinated 119 forestry offices (Forstämter) [4,5], yielded an overall of more than 5,400 statements in short prose by professional foresters about animal occurrences and distribution throughout the entire country, covering an area of roughly 77,000 km². An overall of 520 pages in nine files were preserved by the State Collection in Munich and transferred to the Bavarian State Archive in 2013. Only in 2024, the material was fully catalogued, finally digitized and made publicly accessible online.
The survey was scientifically overseen by Johann Andreas Wagner (1797–1861), who was, at the time, the deputy head of the Bavarian State Zoological Collection.[6,7]. Wagner was a distinguished zoologist [8], full professor at Munich University, with a long publication record in zoology and later palaeontology [9], among them first, annual reports about the achievements of (worldwide) natural history research of mammals as well as of birds [10,11] and second, his description of the geographical distribution of mammals published in three parts between 1844 and 1846, in which Wagner depicts the mammal fauna of Africa, tropical America, Australia and the Magellanic province, aiming at contributing to the study of “laws according to which organic beings are distributed over the earth” ([12], 4).
Wagner presented a report on the outcome of the survey [13] to the Royal Academy and published it in their proceedings 1846 with the following opening words that give insight into his methodology:
Honoured by His Royal Highness the Crown Prince of Bavaria with the commission to attempt a representation [...] from the Bavarian fauna on a larger map, I could not conceal how much is still missing, even with such a limitation of the task, for its satisfactory solution at present. A description of the species would only be complete if the fauna of a sufficient number of localities in our country were known and recorded. [...] In order to fulfill the highest commission as far as possible, I have requested contributions from various sources for its execution, and in particular I have obtained notes from all the royal forestry offices of the kingdom. In particular, I have obtained notes on the occurrence of the most important animals in their districts ([13], 649).
The dataset description [1] lists the species included in the survey. Why Wagner chose these 44 species (16 mammals, 27 birds, 1 reptile) remains unexplained, though. According to his own words, these are “the most important” (Vorkommen der wichtigsten Thiere) but it is unclear how he decided what is important and what not. Some species were probably considered remarkable then as now, as the Brown bear or the wolf, and publicly discussed whenever they occur. Some species on the other hand, such as Roe or Red deer, Wild boar and some birds, are apparently associated with hunting and poaching. They can be seen in conjunction with the fundamental reform of hunting laws implemented in the revolutionary period in the middle of the 19th century: hunt as a privilege and a source of income and hence subject to fiscal and governmental purposes as well as subject of a power struggle. Maximilian, since March 20, 1848 King of Bavaria, was the first monarch in the German Confederation to ban feudal hunting on foreign land on June 4 of the same year. The survey initiated by Maximilian while he was still crown prince and conducted by Wagner may also have served as a preparation for the implementation of such stately issues. Hence, apart from scientific interests, the survey of 1845 can also be seen and understood in the context of political turbulence of that time.
2.1.2. The Responders
Addressees of the survey and their likely respondents were the heads of the 119 forestry districts. Since the early 19th century, these were normally experienced senior civil servants with a three year long specific higher level education at the forest academy in Aschaffenburg or the university of Munich, both institutions with international reputation [14]. Zoology was part of the foresters’ training [15], indicating that at least relevant basic knowledge was present in order to answer the questionnaire competently, although people in office in 1845 might have received their training back already early in the 19th century. Overall, however, this is a period of a general increase of public knowledge about wildlife species [16].
In the first section of the questionnaire, the foresters were instructed how to complete it by using the following 44 fields led by the name of the species in question and headed by "Place of residence and other remarks" (Wohnort und sonstige Bemerkungen). These brief instructions also represent Wagner’s expectations:
List of animal species of whose existence and place of residence information is desired. Note: If the distribution is limited to certain localities only, the nearest village or locality should be included in parenthesis. In the case of birds, only those which breed in the district itself or which spend the winter there, or which are currently the subject of hunting, should be listed. – It should also be stated whether the species is common or rare.
The survey achieved a 100% response rate. This can easily be explained by the duty the officers had to fulfil within the royal governmental system. However, regarding substance and length, the responses were quite diverse. Figure 1 shows that the length distribution of text used to complete the questionnaire ranges from a taciturn 74 in Berchtesgaden, Salforste to a verbose 657 tokens in Haag, Upper Bavaria. Figure 2 gives a visual impression of this range using the example of the neighbouring forestry offices of Berchtesgaden and Tegernsee, which are at the lower and upper end of this range respectively. One pragmatic reason for foresters to respond only quite briefly might be the fact, that, at least in Lower Bavaria, they were given only 14 days to reply (StA Landshut, Akt der Kammer der Finanzen Niederbayerns, A_357, 7). But one might also speculate about other reasons apart from the personality of the responder[17].
2.1.3. Place and Time
Before the unification of Germany in 1871, the Kingdom of Bavaria was an independent state with an area of 76,770 square kilometres [15], almost twice the size of today’s Netherlands. But it is not only the size of the country that makes AOD1845 a significant dataset. In addition, the region encompasses a variety of different ecosystems and landscapes. Wagner himself emphasizes the horizontal and vertical diversity of the country. Together with the so-called Salforste [18], whose area of responsibility also includes parts of the Austrian Alps, our study area covers two of the three biogeographical regions of Germany, continental central European and Alpine but not Atlantic [19] and 21 of the 24 (current) landscape types described by the Federal Agency for Nature Conservation of Germany [20]. The heights above sea level in the country range from a low 85 meters near Ludwigshafen (Upper Rhine Graben) to 2,962 meters on the peak of Germany’s highest mountain, the Zugspitze (Wetterstein Mountains), making up a total elevation of 2,877 meters.
Bavaria’s main contiguous area, located on the right bank of the Rhine, is largely devoid of natural borders. This lack of physical boundaries may present challenges in defining the region’s flora and fauna, as species can migrate in and out, reducing the likelihood of developing endemic species. However, this also suggests that Bavaria’s biogeographical survey can serve as a representative model for other regions within Central Europe.
The Kingdom of Bavaria in the mid-19th century is usually described as a state characterized by agriculture and forestry. The population density was 57.84 (Table 1; in comparison: 190.0 as of 2023 [21]), and although it rose to 90.8 shortly before the outbreak of the First World War, it was still well behind its western neighbours Württemberg and Rhineland and even further behind the more industrialized Kingdom of Saxony in both absolute numbers and growth rates [22,50].
However, this characterization as a primarily agricultural state also includes a selective industrialization of Bavaria, which gained momentum around our time period [24]. Significant industrial centres emerged in Augsburg, Nuremberg/Fürth, in Upper Franconia, Munich, or the Upper Palatinate steelworks “Maxhütte”. The first railroad on German soil ran between the Central Franconian cities of Nuremberg and Fürth from 1835. With the Ludwig South-North Railway between Lindau on Lake Constance, the southwestern and the Upper Franconian Hof on the northeastern border of the country and the Ludwig Canal between Kelheim and Bamberg, which was completed in 1846, crossing the European main watershed, enormous infrastructure projects were implemented. The contextualization of such industrialization and land development projects and the associated changes in land and land use are of great importance for historical ecological questions such as biodiversity.
The years around 1845 lie within the last decades of the Northern Hemispheric Little Ice Age [25]. Climate is also occasionally mentioned in the responses. While only two entries refer to selective warmth, 36 explicitly refer to a cold climate and harsh winters in relation to the animal population. Primarily the deer population is linked to the climatic conditions, for example, "The not infrequent harsh winters do not allow for a good deer population, which is why this game is rare here" (E_02268, Goldkronach, Upper Franconia). Furthermore, there are also reports of migratory birds, such as the wild goose, or predators such as the wolf and lynx, that migrate through the district during harsh winters, such as the one immediately preceding the survey in 1844/45.
2.1.4. Usages of the Survey
Apart from Wagner’s own report and the map he let produce [26], the survey has rarely been cited let alone analyzed to our knowledge. Only some of the contributors to the ethnographic “Bavaria. Landes- und Volkskunde des Königreichs Bayern” [27], which was published between 1860 and 1867 in eight volumes, refer occasionally and rather unsystematically to Wagner’s report from 1846 without going into details and without referring to the primary sources of the survey.
2.2. The Data Set
AOD1845 was created by "datafying" [28]—the process of transcribing, annotating, and classifying over 5,400 of these short prose descriptions. This dataset enables the analysis and mapping of selected vertebrate species across Bavaria, offering insights into biodiversity before industrialisation significantly transformed the landscape. Figure 3 illustrates one analytical outcome derived from the dataset: the distribution of rare species, reflected by the number of positive reports. For instance, the only recorded sighting of a Brown bear (Ursus arctos) in the period leading up to 1845 originates from the Tegernsee report in the region of the Bavarian/Austrian Alps:
The bear appears singly, probably dispersed from Illyria, but very rare in the Bavarian high mountains: the last one was from 1826-28 partly in the local, partly in the neighbouring Tyrolian mountains, where it was shot. (E_01278, Tegernsee, Salforste)
Similarly, the dataset documents the final witnesses of sightings of the Eurasian beaver (Castor fiber) in Bavaria prior to its extinction around 1867 [29]. Examples include reports such as: “Only very few families can be found along the river Amper” (E_04904, Freising, Upper Bavaria) and more conclusive signs of its disappearance: “They used to be common on the banks of the Danube, but have been completely lost in recent times” (E_00185, Neustadt, Lower Bavaria) or “The last one was shot 20 years ago at Kratzmühle an der Altmühl, Kipfenberg district court” (E_01554, Eichstätt, Swabia).
The survey’s textual descriptions provide valuable insights into landscape ecology, revealing the impact of human activities and offering the perspectives of 19th-century foresters. These records reflect how changes in land use and environmental conditions affected animal habitats. For example, foresters in the Rhine-Palatinate administrative district observed the decline of the Common snipe (Gallinago gallinago) due to habitat loss: “rare due to the loss of wet meadows” (E_03168, Pirmasens, Palatinate) and even more clearly: “[It is] seldom since the meadows have been drained everywhere” (E_03300, Winnweiler, Palatinate).
AOD1845 exemplifies how applied historical ecology can illuminate the ecological consequences of land development and reclamation. Traditionally, applied historical ecology is understood as “the use of traditional knowledge (TK) to help address problems of people and the environment today,” often in the context of indigenous practices [30,31]. This study extends that definition to include settings where traditional forestry knowledge intersects with emerging Western scientific practices.
For the case studies that follow, computational tools are employed to analyse the AOD1845 dataset, generating exemplary findings. Its creation and structure have been detailed in the documentation of the dataset, but for clarity, a summary of its key features is provided: AOD1845 comprises 5,467 entries, each representing the occurrence status (presence or absence) of one species within one of 119 forestry offices.2
Each entry is coded in binary format to indicate species presence or absence. Additionally, the dataset includes geographic coordinates (longitude and latitude) for the administrative seat of each forestry office, enabling spatial analysis and mapping. Links to digitised images of original sources and their transcriptions are embedded, organised by forestry office and species entry.
While the documentation provided with the original data set describes the data fields in greater detail, Figure 4 and the following give a simplified example of an original response and how it has been entered into the AOD1845 data set: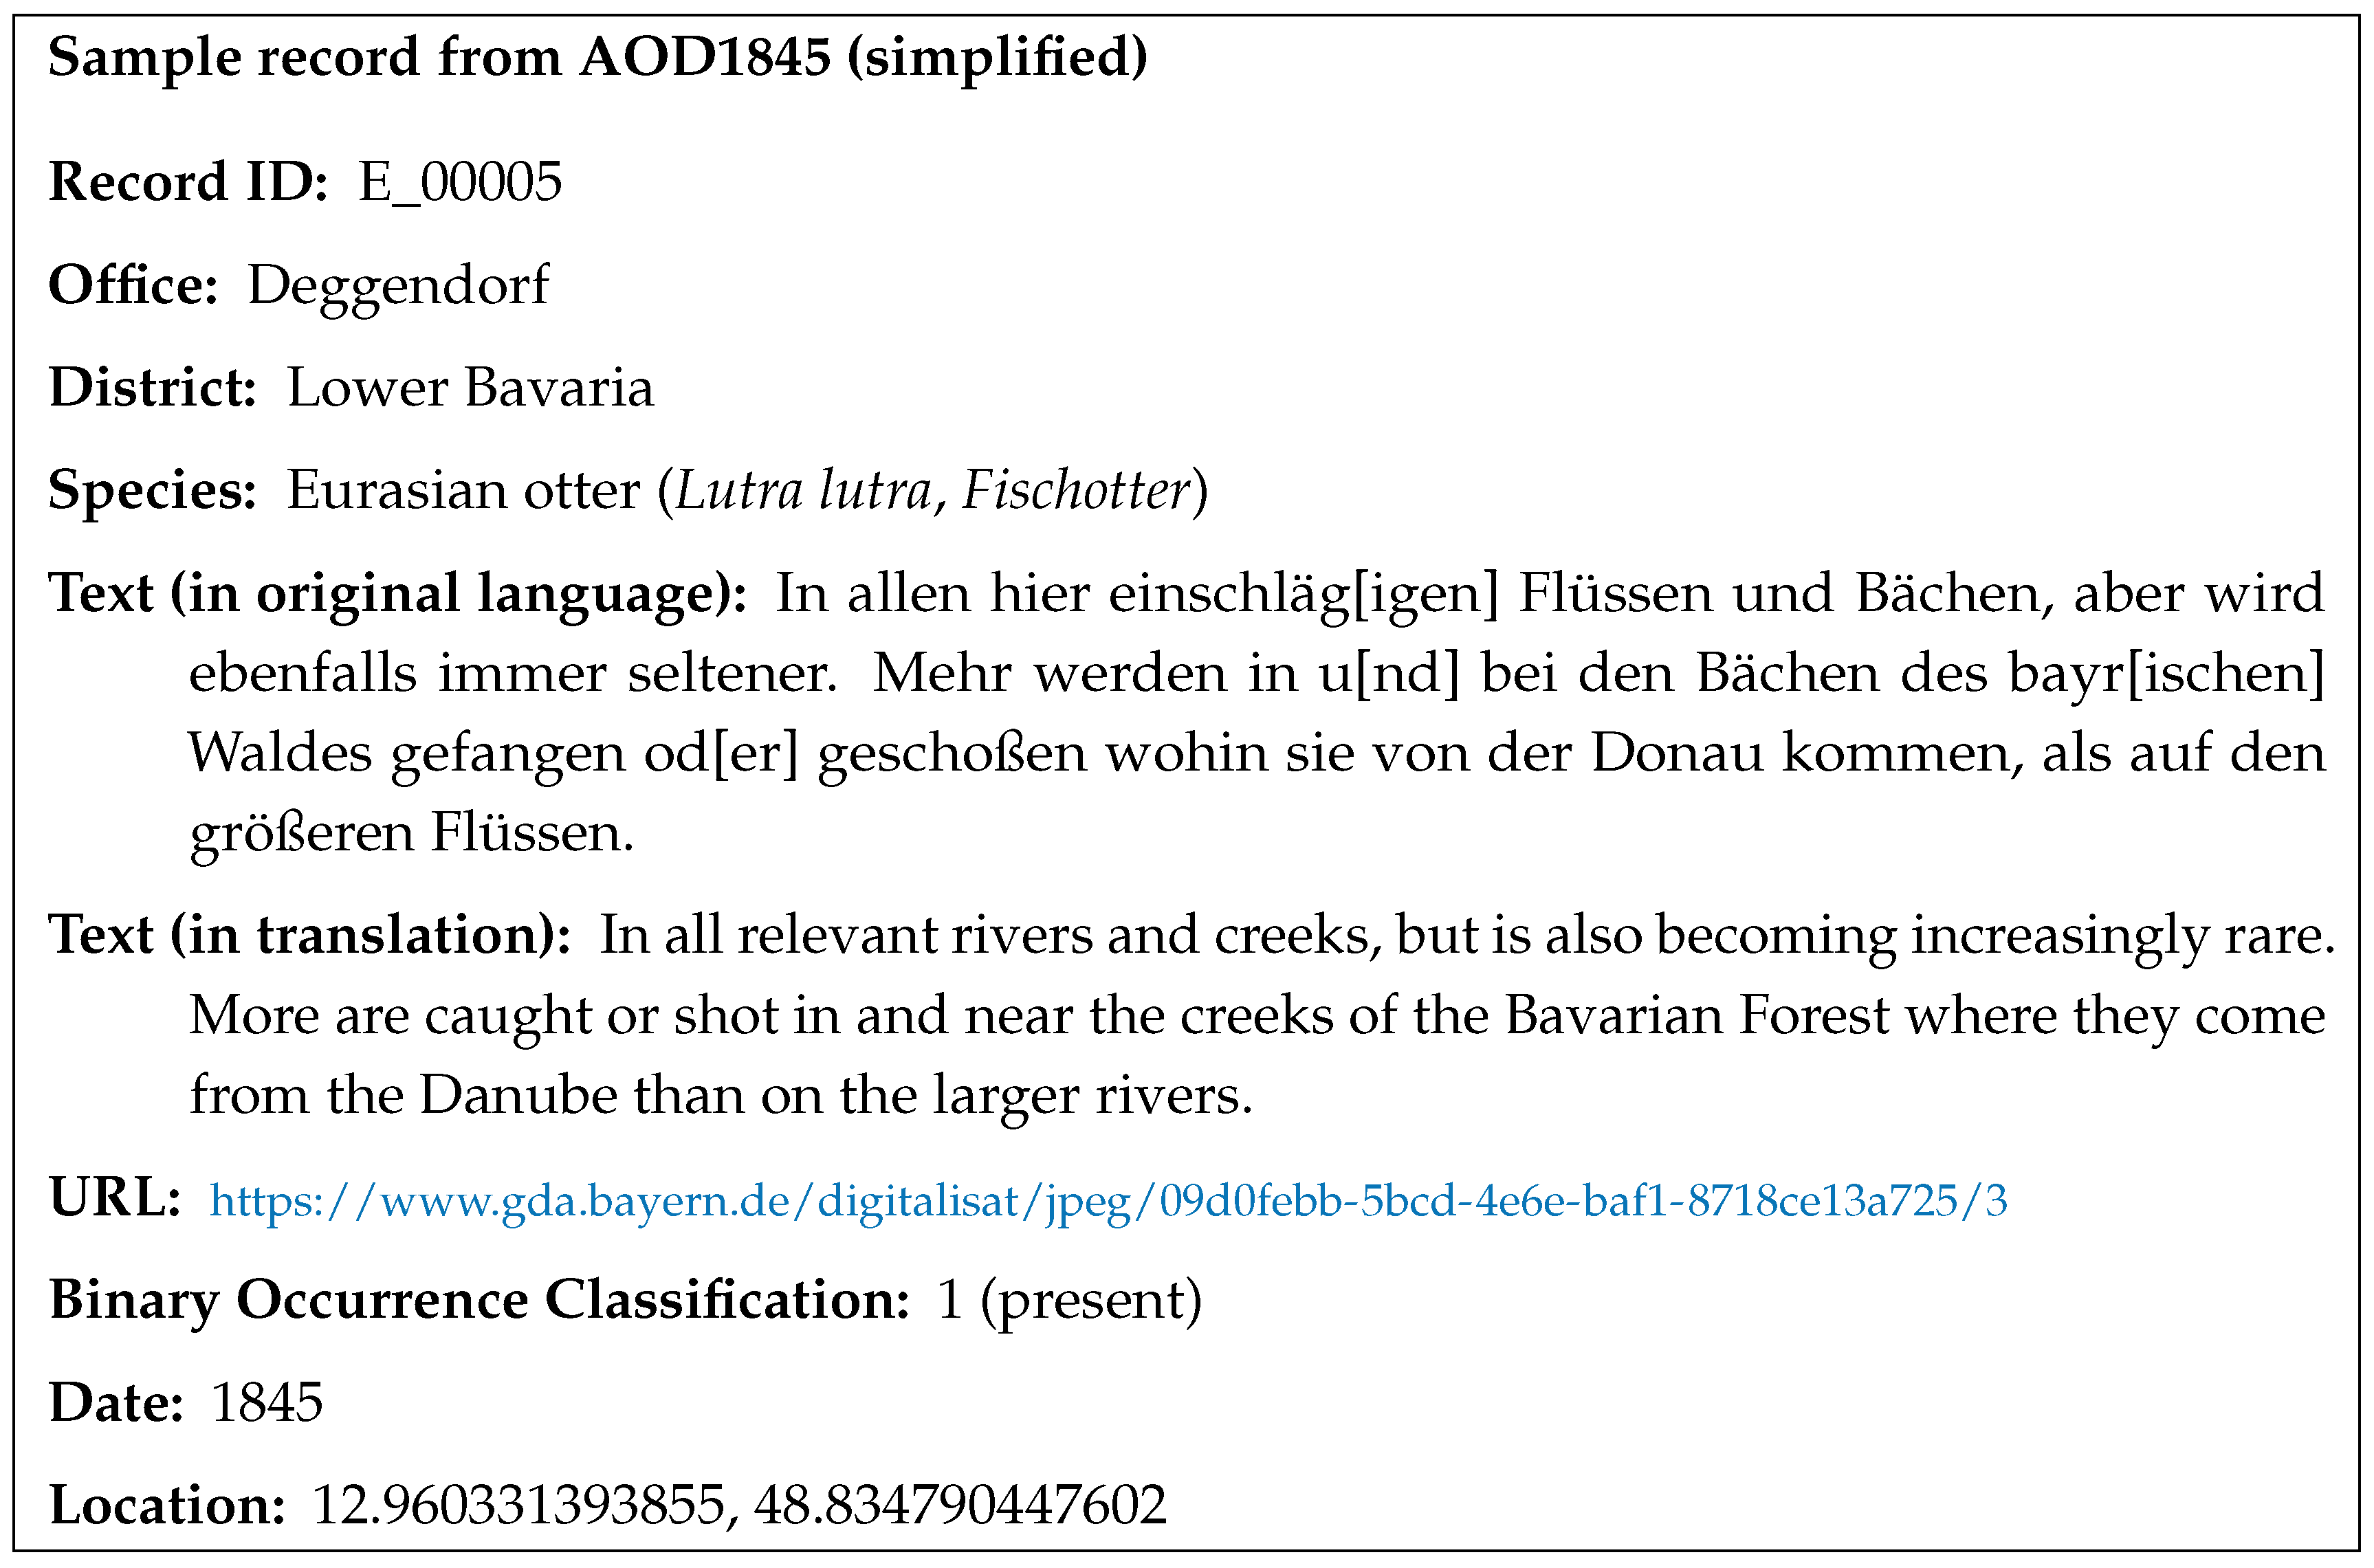
2.3. Enriching and Annotating the Data
The "raw" text field of the AOD1845 dataset contains valuable but yet unstructured information. In order to utilize it for a deeper analysis in the following, we annotated certain features of the text and classified particular statements within it. This encompasses the following five features:
- Habitat descriptors;
- Geographical names (toponyms);
- Phrases or expressions that indicate mankind’s ecological impact or human-nature interaction, -relation and -understanding;
- Categorizable statements about population size: ABSENT, EXTINCT, VERY RARE, RARE, COMMON TO RARE, COMMON, ABUNDANT, NOT QUANTIFIABLE;
- Categorizable projections about population development: INCREASING, STEADY, DECREASING.
To better illustrate this, Table 2 represents five of the textual entries and their annotations. It becomes clear that some of these are directly taken from the text because the statement is explicit (e.g., "lives under barns"), while others are indirect or implicit statements or require inference (e.g., "in all"). We manually annotated features 1-3 for the full data set. We restricted the annotation of feature 4 to Roe deer, Beaver, Capercaillie, and Otter and of feature 5 to Capercaillie as these data are used in case studies in Section 3 discussing specific animals in more detail.
To prepare for textual analysis, we normalized textual features 1-3 as well as text of the responses and removed stop words, employing spaCy and its de_core_news_lg model for German language (https://spacy.io/models/de/). Additionally, for further statistical testing, we counted tokens for each textual feature and built mean averages of the lengths per species and per reporting office.
Species data were enriched by the following nominal classification scheme:
- Class: mammal, aves, reptilia;
- Conservation status according to the German Red List: EXTINCT OR LOST, THREATENED WITH EXTINCTION, HIGHLY THREATENED, THREATENED, NEAR THREATENED, EXTREMELY RARE, NOT THREATENED;
- Whether the species is commonly subject of human hunt: yes or no;
- Whether the species seeks an aquatic ecosystem: yes or no.
The annotations are available online as an addition to the original AOD1845 data set[32].
In the statistical analyses that follow, we excluded the Brown bear and the ducks from the data; the bear because of its singular only appearance, the ducks because Wagner asked here for a whole family of birds and not for specific species making these entries incommensurable with the rest.
2.4. Textual Analysis
One characteristic attribute of the survey is the heterogeneity of the responses. When the questionnaire asked to report not only the status of occurrences but also “places of residence” (Wohnorte) of the species, in many yet not all cases, the foresters fulfilled this request, but they did so in individual ways – a fact which, among others, requires a particular carefulness in applying text analytical methods.
While the questionnaire requested information not only on the occurrence status of species but also on their “places of residence” (Wohnorte), many foresters complied with this request in varying ways. This variability is a distinctive feature of the survey and necessitates particular caution when applying text analytical methods to the dataset.
Consider the examples E_00047 and E_00147 from Table 2. We use textual data of this kind to find patterns of similarity among species. When we compare the two examples above, however, a significant difference in the usage of habitat descriptors, i.e., words that describe in what kind of locations the animals where observed or where they generally live, becomes obvious: While E_00047 contains several of such descriptors that make up more than a third of the whole text (8/21 = 38.1%), E_00147 contains just one token out of of 17 overall (5.9%). Due to unbalanced weighting of such habitat descriptors within the data corpus as a whole and overlay of too much non-habitat related information as in E_00147, a similarity analysis over the complete texts would not yield any meaningful results.
We hence used only habitat descriptors for analysis. We set up a text analysis pipeline with a term frequency–inverse document frequency (TF-IDF) document similarity analysis, grouping all entries either by forestry office or by species. This yields a complex vector representation for each of the 119 offices respectively 44 species which we reduced by Principal Component Analysis (PCA), clustered by k-means, and visualized with colour coding.
Pipeline: textual entry → extraction of habitat descriptors → group documents per office|species → TF-IDF document similarity analysis → PCA → k-means clustering (number of clusters determined by elbow method) → visualization
Quantitative data was also generated from the lengths of the responses in categories 1–3 described in Section 2.3. These textual features are later brought into relation with other metadata about species and offices. There, we employed one-way ANOVA [33] to triangulate between this quantitative textual information and the qualitative classification in categories 4 and 5 from the section above in a mixed-methods approach [34,35].
3. Results
3.1. Describing Animals Presence and Absence in 1845
The historical analysis reveals that despite some basic zoological knowledge on the responding side, the range and depth of answers seem to depend on the individual interest in regional fauna and the will of the respondent, especially with regard to species that were not the main focus of the forest industry and hunt. The annotation examples from above, alongside the insight they provide, illustrate further some of the challenges in critically evaluating this historical source.
Berchtesgaden seems to be an example of an officer fulfilling his duty with minimal effort (cf. Section 2.1.2). There, senior forester Jak. Reverdys answered the question about the occurrences briefly without giving further information, such as his reports about the Badger (Meles meles): “to be found more frequently” and the Stone marten (Martes foina): “likewise” (E_01371 and E_01372). At the same time, on the other end of the range, Max Schenk of Tegernsee responded about the Badger more comprehensively, including a list with named mountains and valleys where the animal was seen: “More frequent in some years, less frequent in others on the foothills /: Holzeberge, Brand, Kogel district Tegernsee, Enknel [and] Schinderberg, Breitenbachthal, Rohnberg [and] Leitnergraben, district Miesbach”. And about the Stone marten he wrote: “There used to be many animals of this species in the villages as well as on the farmsteads; - gradually they have diminished so much that they are now quite rare” (E_01279 and E_01280). In contrast to Berchtesgaden, Tegernsee is a prime example for providing detailed geographic information as well as describing temporal population dynamics, here indicating that a species is threatened to become lost.
The report from Wernberg, Upper Palatinate, seems to be a case of someone demonstrating not only his extensive knowledge but also involvement and interest in nature, environmental issues, and state-of-the-art science. Heinrich Drexel lists 46 further species by their scientific name beyond Wagner’s selection and he describes them, mostly birds, on an extra page, additionally distinguishing (the birds) between migratory and breeding. The Wernberg report also supplements and/or contradicts the sparse report from adjacent Vilseck, Upper Palatinate, at one point. Drexel writes about the Common crane (Grus grus): “Is not to be found here, but in the neighbouring forest district of Vilseck /: Rödelweichermoos :/ however rarely” while the report by Jos. Zölch from Vilseck itself contains a simple “-” (E_01136, Wernberg; E_00916, Vilseck, both Upper Palatinate).
Such a qualitative range can also be observed when we analyse the comprehensiveness of the responses with as a variable dependent on the species rather than the respondent. As a general observation, the average number of words used per species varies: excluding ducks (as this question was about a whole family and let some officers list and describe particular species within this family), it ranges from an overall of 313 for the Great bustard (Otis tarda) to more than four times used to describe the European otter (Lutra lutra, 1,471 words). Not surprisingly, there is a strong correlation between the overall length of the text per species and the number of offices where it is present (correlation index = 0.94). People write decisively more about the species being present in their area than about the absent ones.
We can also measure some other statistical correlations. The analysis of variation as summarized in Table 3 suggests that the amount of detailed geographic information and information about human-nature relationship depends significantly on the question whether the species in question can be regarded as an object of human hunt or not and to what taxonomic class it belongs. Further analysis reveals that indeed animals that are hunted are described in more detail regarding locations (1.93 vs. 0.92 average tokens) and human-nature relationship (0.18 vs. 0.08) while the descriptions about the latter are more comprehensive for mammals than for birds (0.23 vs. 0.05). We could not identify a significant correlation with the present-day threat status, however, hence a prediction of an endangered status of species also back then was not possible from this data.

Table 3.
Pivoted summary table of one-way ANOVA by F-distribution (N=42).a
| Group | Class | Threat Status | Occurrences | Hunt | Aquatic |
| Geographical names (mean) | 1.44 (0.248) | 1.18 (0.341) | 0.44 (0.946) | 7.29** (0.010) | 0.01 (0.921) |
| Habitat descriptors (mean) | 2.03 (0.145) | 0.36 (0.920) | 0.88 (0.633) | 0.05 (0.824) | 0.37 (0.545) |
| Human Influences (mean) | 15.50*** (0.000) | 0.76 (0.621) | 1.71 (0.236) | 4.18** (0.047) | 1.51 (0.226) |
| Full textual description (sum) | 1.03 (0.367) | 0.95 (0.483) | 21.09*** (0.000) | 1.84 (0.182) | 0.05 (0.823) |
a Significance thresholds: *** (p<0.01), ** (p<0.05), * (p<0.1). b According to German Red List (as of 2024). By number of offices the report presences of the species.
3.2. Species Distribution
Figure 3 maps the location of all forestry offices, size-coded by the number of species reported to be present within the district. This is a simple statistic that takes the binary classification of the occurrence statuses for each of the 119 offices and each of the 44 primary species and does not take into account statements about the population sizes (see Section 3.5 for a follow-up of this question). With all caution anyway, this first approach might indicate regions of higher biodiversity, at least with regard to the 44 species questioned. Especially the Alpine region (Salforste as well as the southern parts of Upper Bavaria and Swabia) stands out: Some endemic species such as marmots or chamois and the only sighting of a bear should be mentioned here. However, in the administrative district of Lower Bavaria, located in the South East, an important exception to this statement must be acknowledged. Lower Bavaria has a significantly higher-than-average proportion of private forests (cf., Table 1), which are likely not included in the survey. Consequently, it is plausible that some animal species may not have been recorded in this region due to the smaller area of publicly managed woodland.
3.3. Species Reporting
In the following, we establish correlations between the current threat level according to the categories given by the German Red List on the one hand [36] and the species’ distribution in the study area on the other. However, some critical observations must be made. Primarily, the number of offices in which an animal species was seen only provides limited information about the size of its population let alone its actual threat status. A high number of presence reports may only cautiously be regarded as an indicator for a common or abundant occurrence because it may well be the case that most of these reports state only a very rare presence of the species in question. Figure 5 shows how differently the Roe deer (Capreolus capreolus) and the Eurasian otter (Lutra lutra) are distributed on the frequency scale, suggesting that the otter was significantly more under threat in 1845 than the deer despite that both were reported as present in almost all offices. At the same time, an animal such as the marmot must appear as an outlier (only 5 occurrences, but not threatened), as it has specialized in an alpine habitat that does not exist in a large part of the study area. Hence, from only few presences one may not easily infer to a threatened status. A consistent annotation of the quantifiers (cf., Section 2.3) would be required here in order to obtain more reliable statements.
Nevertheless, applying a correlation analysis here and calculating deviations from the mean by z-score measure (threshold: 1.5), we can state that there are species widely reported in the 1845 survey, but threatened with extinction in 2024: the Common snipe (104 reports), Black grouse (82), Capercaillie (74), and Hamster (27). A similar deviation can be seen for the Otter (116 reports in 1845 as discussed above, nowadays threatened) and the Sand piper (118 reports in 1845, nowadays classified as extremely rare). Likewise, some species that are classified as not threatened in 2024 show a below-average occurrence in 1845, e.g., the Mute swan (5 reports) or the Wild boar (22).
3.4. Describing Habitats
Running the text processing pipeline described in Section 2.4, the first analysis groups all textual entries on the species. The clustering yields six quite well distinguishable clusters as shown in Figure 6 (silhouette score: 0.57). We can observe here that such a similarity is not necessarily genus-related. E.g., the Beech marten and the European pine marten, both members of the same genus Martes, do not share the same cluster, indicating that their habitats are different. At the same time, the Beech marten shares a cluster with the White stork. As the distance between Beech marten and White stork is shorter than between Beech marten and European pine marten, we may conclude that their habitats are more similar. Looking more deeply into the words typically used to describe their “places of residence”, we can observe that both are seeking human settlements.
Birds are generally scattered over all clusters as the taxonomic class itself is diverse but birds seeking aquatic ecosystems are clearly clustered, together with mammals that do the same such as the Eurasian beaver or the Eurasian otter. This and the other observations align with modern biological knowledge, but one should keep in mind that these results are not based on a systematic analysis but rather empirically on single observations brought together to display the manner how habitats were described by people in 1845. Note also the relative closeness of Roe deer, Wild boar, Red deer, and Fallow deer—typical animals of traditional hunt.
We applied the same pipeline grouping all textual entries with regard to the habitat descriptors used on the forestry offices. The clustering is even slightly better as with the species (silhouette score: 0.71). Instead of analysing the cluster by the offices’ names, however, we now enriched our data by the geographic coordinates of the offices’ seats and projected them on a map (Figure 7). A tendency is becoming visible: Cluster 2 (green) largely covers the Alpine region and partly the natural areas of the Bavarian and Upper Palatinate forested mountains in the east, but the other two clusters are hardly distinguishable based on basic geographic information.
3.5. Species Studies
3.5.1. The Eurasian Otter (Lutra lutra)
The Eurasian otter (Lutra lutra) was selected for an individual study because it stands out from the other species in many heuristic text-analytical criteria. It is one of the species that score highest in the amount of additional information given on all annotated features: geographical locations, habitats, and human impact. The otter was also present almost country-wide in 1845: Only Kirchheim, Zweybrücken (both Palatinate) and Markt Einersheim (Middle Franconia) report absence. Section 3.1, however, shows that only a minority of offices describe the otter’s presence as common or abundant; its frequency classification is positively skewed towards rare presence.
Today, the animal is classified as "threatened" on the German Red List. Its current population is described as rare, with a long-term forecast predicting a significant decline in numbers [38]. The Global Biodiversity Information Facility (GBIF) records only 59 sightings in Bavaria and (modern) Rhineland-Palatinate between the years 2000 and 2024 [37], as compared, for instance, to the beaver with 3,755 sightings in the same period and area [39]. Figure 8 blends areas of historic occurrences with recent sightings. It shows some concentration of otter presences in the Alpes, the south-eastern, and the north-eastern parts of the country in the 21st century that at least partly align with the descriptions from 1845. Larger areas of historic presence, however, such as the Vohenstrauss region in the Upper Palatinate, close to the Czech border in the North East, or parts of central Bavaria with then common presences of the otter remain empty. Even the regions for which the AOD1845 data could be classified as abundant have no recent sighting, including Neustadt an der Saale, Lower Franconia. Here, in the Rhön Mountains of the country’s North, the forester gave a detailed report about the geographies of the otter’s presence in 1845: "On the [river] Saale /: between Kissingen and Neustadt :/ on the [river] Brend /: between Neustadt and Bischofsheim :/ on the [river] Streu :/ from Heustreu up to Fladungen :/ quite common; also in the Elzbache" (E_04503). For none of these, a recent sighting is recorded in GBIF.
It is noticeable that 95 of the 116 overall positive reports in AOD1845 about the otter provide more detailed information about its habitat: either in general terms or, as seen in the Neustadt example, by specifically naming water bodies. The latter allows us to map the otter’s occurrence in more detail through the use of geographical information. Figure 9 illustrates this for the forestry office of Vohenstrauss, Upper Palatinate, with the data provided in E_00930 (see Table 2). Among the habitats of the otter, a pond named Pfrentschweiher, east of the village Pfrentsch, is listed, which also plays a central role in the decrease of the population of the aquatic ducks (cf. Lorenz Reber’s report as quoted in Section 1). The historic Pfrendschweiher can be reconstructed from the country-wide mapping in around 1836 (the so-called Uraufnahme), cf., ([40], 31-45). The comparison of this with modern satellite images shows how the land use of the Pfrentschweiher area changed from aquatic to farmland. It seems likely that the forester in 1845 recognised that this change had a direct impact on the presence of species that are dependent on a particular ecosystem.
3.5.2. The Wolf (Canis lupus)
Another example to illustrate more detailed geographical descriptions is the wolf (Canis lupus). It belongs to the rarest species of Wagner’s selection as only eleven districts reported its occasional occurrence, ten of those being part of the western Rhine Palatinate (Figure 10a). The office of Selb in the Upper Franconian Fichtel Mountains reports the only sighting within a century with reference to harsh weather: “With the exception of the winter of 1844/45, when two of these were felt for a long time, it has not been noticed for more than 100 years” (E_02482, Selb, Upper Franconia). Another nine offices report the wolf to be extinct and give time ranges for its extinction between approx. 1650 (E_02261, Goldkronach, Upper Franconia) and 1825 (E_04330, Heidingsfeld, Lower Franconia).
The only report which refers to regular sightings is that of Homburg (Palatinate): “When the snow is deep and lasts for a long time, a few wolves appear almost every winter from the neighbouring Prussian high forest, even sometimes in summer when they are being pursued on the other side. Their stay is usually very short, however, because they are immediately pursued here too” (E_02878, Homburg, Palatinate). Alongside its reference to a longer distance migration, this statement also contains an interesting assessment about differences between Prussia at the western border and the Bavarian Palatinate itself in dealing with the animal that might be of interest for further research.
Six of the Palatinate reports describe migration of the wolf into the area as alternate game (Wechselwild as opposed to resident game: Standwild), often connected to extraordinary coldness. Especially the recent winter of 1844/45 is mentioned, similar to the report from Selb. As all these reports also indicate from where the wolf migrates into the area, it allows us to create a map of the rough migration directions, combining geographical data of assumed origin and destination (Figure 10b).
3.5.3. The Eurasian Beaver (Castor fiber)
Particularly the beaver has long been subject of human-animals-studies and historical ecology. There are various points of contact with humans that make the beaver an interesting subject of study. These include not only its frequent appearance near or in human settlements. The beaver was killed for its fur and the so-called Castoreum, classified as a fish instead of a mammal to be used as fasting food [43,44], or driven away as “unwanted visitor” [45] because of the damage it caused to trees. In recent decades yet, it is also its ecological value that has been recognized [46] and successful attempts have been made since then to reintroduce it in many places in Europe including our study area in a controlled manner [45,47].
Relatively little is known about the historical occurrence of the beaver [48]. Among historical studies, Sander Govaerts’ examination of the medieval Netherlands is particularly noteworthy. Here the author reconstructs the beaver’s occurrence on the basis of administrative records. For Bavaria, Volker Zahner substantiates and maps historical occurrences mainly by means of corresponding place names [29]. Zahner’s chronological description dates the extinction of the beaver in Bavaria approximately to the year 1867 [15,29], so that Wagner’s survey are probably the last evidence of the beaver’s occurrence in Bavaria before its reintroduction in the later 20th century; GBIF records 184 sightings in Bavaria in 2024 [49].
In 1845, the beaver was still present in 16 forestry districts, but (only) rarely or very rarely in all of them. The report from Munich, which, like others, indicates the decline of the population, can be seen as typical: “The same appears only as a great rarity on the banks of the Isar towards Freysing, but without really staying there” (E_05036, Munich, Upper Bavaria). Some reports describe its recent regional extinction, e.g., “Were otherwise frequent on the banks of the Danube, but have disappeared completely in recent times” (E_05124, Neustadt a.D., Upper Bavaria) or “The last one was shot 20 years ago near Kratzmühle an der Altmühl[...]” (E_01554, Eichstätt, Swabia).
In the following, we classify the reports on the beaver according to the frequency of occurrence derived from the texts as RARE or VERY RARE, indications of earlier but no longer occurrence as EXTINCT, and indications that the beaver never occurred in this area, such as “There are no reports that any were ever here” (E_02483, Selb, Upper Franconia) as NEVER. Additionally, where more precise descriptions of the location are given as in the above report from Munich (“an den Isarufern gegen Freysing”), these allow us to record and map them as geographical data within a geographic information system (GIS). Figure 10c shows the result of this analysis, which is also projected onto Zahner’s map.
3.5.4. The Western Capercaillie (Tetrao urogallus)
The Western capercaillie (Tetrao urogallus) is highly sensitive to changes in the ecosystem and human disturbances. Similar to the beaver, as both an object of (aristocratic) hunting and a species affected by the forestry practices that began to dominate around 1800, the capercaillie is regarded as a loser in the face of ecosystem change. Nevertheless, Wagner’s survey not only shows signs of a dwindling capercaillie population. In 1845, it still appears to occur in many places, sometimes frequently or very frequently, and in one place there is even talk of an increasing population: “These species have been reproducing for 3 years and only a few cocks are shot during the mating season” (E_02236, Geroldsgrün, Upper Franconia). Other reports indicate human action as the reasons for a local decline in the population: “Now [it] only occurs singly, but used to be more common. The cause of its disappearance is probably primarily to be sought in the current frequent visits to the forests by wood collectors” (E_02104, Bayreuth, Upper Franconia); “Breeds in the Annweiler Bürgerwald, but is not infrequently eaten by wood and dead wood gatherers during the breeding season” (E_02633, Annweiler, Palatinate); “is widespread throughout the district in fairly large numbers, but reproduction suffers due to the many hunting grounds” (E_04261, Goßmannsdorf, Lower Franconia). Table 4 and Figure 10d give an overview of the occurrences status of the capercaillie inferred from the textual data. In addition to the classification, we could also infer indication for the population development in ten reports. Only one, however, the above mentioned Upper Franconian Geroldsgrün projects a positive trend.
The AOD1845 data is integrated with current research on the historical capercaillie population in the Palatinate [41]. Especially a written account by Andreas Johannes Jäckel from 1891 offers additional insights into the species’ distribution, enabling a more comprehensive mapping by combining these two sources [42]. Consistent with the 1845 survey, Jäckel notes that capercaillie were found across much of Bavaria, particularly in areas with large, contiguous, and undisturbed woodlands, as well as in hilly and mountainous regions. He specifically highlights the Upper Bavarian and Swabian mountains, along with the Bavarian Forest.
However, regarding the Rhine Palatinate, which Jäckel describes as “formerly famous for capercaillie courtship,” he reports a sharp population decline “since the mid-1850s”. Figure 10d illustrates the distribution of capercaillie based on Jäckel’s report for the latter half of the 19th century, alongside comparable data from the AOD1845 dataset for the Palatinate.
4. Discussion
The findings of this study position the AOD1845 dataset within the evolving discourse of environmental humanities and historical ecology. Environmental humanities focus on the human dimensions of environmental change, such as biodiversity loss [51], while historical ecology reconstructs past ecosystems to assess how historical events have shaped present-day biodiversity and ecosystem functions [52]. This research demonstrates how archival resources can be mobilised to address ecological questions, contributing to the development of Computational Historical Ecology, a novel interdisciplinary framework that leverages historical records, ecological inquiry, and digital tools to reconstruct past biodiversity patterns and assess long-term trends.
A core contribution of this study lies in the demonstration that carefully annotated and enriched archival data can reveal significant insights into past biodiversity baselines. Through the application of text analysis, GIS mapping, and species classification, shifts in species distributions and population dynamics over time become apparent. This informs conservation efforts by identifying species and regions that require attention. The case studies on the Eurasian otter, beaver, and capercaillie exemplify the value of these historical records, highlighting species that once thrived but are now rare or locally extinct.
This research underscores the value of integrating computational methods with historical ecology to analyse unstructured and complex data. By extracting habitat descriptors, identifying human-nature interactions, and mapping species occurrences, large-scale analyses of archival datasets become possible. This approach fills temporal gaps in biodiversity monitoring and complements contemporary fieldwork.
However, this study also identifies limitations inherent to historical data. Unlike contemporary datasets, archival records often lack uniformity and precision. Classifying animal occurrences or approximating population sizes based on narrative texts is challenging, as foresters’ accounts frequently rely on estimates rather than exact counts. Terms such as "frequent" are subjective and may reflect different baselines or regional interpretations. As a result, the annotations made in this study provide indicative, rather than definitive, assessments of historical populations. Nonetheless, they represent a critical approximation, pending the discovery of further corroborating sources.
A significant observation from this research is the tendency for species of economic or hunting interest to be better documented than those less relevant to forestry or agriculture. This highlights the socio-economic biases inherent in historical records and underscores the need for contextual analysis when interpreting archival data.
Beyond academic inquiry, the findings offer practical implications for policymakers and conservationists. Establishing historical baselines can inform rewilding, habitat restoration, and species reintroduction initiatives. Aligning computational tools with historical ecology enhances our understanding of past ecosystems and provides crucial insights for addressing current biodiversity challenges.
Despite the progress made, a key question remains: how can archival data be systematically mobilised and transformed into computable formats? Many archival sources remain undigitised or difficult to process using automated tools. Addressing this challenge requires further research into methodologies for toponym recognition, species identification, and large-scale data extraction from historical texts.
5. Conclusions
This study highlights the untapped potential of historical datasets, such as AOD1845, for informing contemporary ecological research and conservation strategies [53,54,55]. By revisiting and computationally enhancing archival records, we unlock new insights into species distributions, habitat changes, and the long-term impacts of human activity on biodiversity. The integration of historical ecology with computational methods addresses temporal gaps in biodiversity data, offering critical insights that are otherwise absent from modern monitoring frameworks [56].
A key outcome of this research is the validation of archival biodiversity data as a credible resource for establishing historical baselines. This retrospective perspective facilitates comparisons between past and present ecological states, aiding in the identification of species experiencing range contractions or population declines. The historical distributions of species such as the Eurasian otter and capercaillie reveal ecological patterns that contrast sharply with their contemporary conservation statuses, offering critical insights for guiding restoration and reintroduction efforts.
The methodological framework of Computational Historical Ecology developed in this study demonstrates the transformative potential of digitisation, artificial intelligence, and computational analysis in historical ecology. While much of the dataset creation involved manual transcription and annotation, this work serves as a foundation for future automation. As the field evolves, developing scalable techniques for extracting biodiversity data from archival sources will be essential, fostering collaborations between ecologists, historians, and data scientists.
Despite its contributions, the study recognises the inherent limitations of historical records. Qualitative descriptions, species ambiguities, and inconsistencies in population estimates require careful interpretation. Additional corroboration from archaeological or archival sources may further refine these findings. Nonetheless, the annotations derived from AOD1845 offer a solid foundation for ongoing research, reinforcing the value of integrating historical datasets into biodiversity assessments.
Looking forward, Computational Historical Ecology presents a promising pathway for expanding environmental research. By systematically mobilising archival data, we can construct richer narratives of ecological change, informing policy and conservation planning at regional and global scales. This interdisciplinary approach bridges the gap between past and present ecosystems, supporting efforts to mitigate biodiversity loss and reinforcing the critical role of historical knowledge in shaping sustainable futures.
Ultimately, the study advocates for increased investment in digitisation and computational analysis of historical records. Cross-disciplinary collaborations that bridge the humanities and ecological sciences are essential for unlocking the full potential of archival data, fostering deeper insights into the complex relationship between humans and the natural world over time.
Funding
This research received no external funding.
Data Availability Statement
This study uses material from the Bayerisches Hauptstaatsarchiv (BayHStA), Zoologische Staatssammlung, 208–217. The annotations are available online as an addition to the original AOD1845 data set[32].
Acknowledgments
This study would not have been possible without the foundational work of the AOD1845 dataset creators. I extend my sincere gratitude to the Computational Humanities team at the University of Passau for their valuable insights and continuous support. I am especially thankful to Gerhard Albert, Robert Forkel, Wolfgang Goederle, Sander Govaerts, Joachim Reddemann, and Helmuth Trischler for their thoughtful feedback and guidance. Special thanks go to Markus Schmalzl for providing the initial impetus for this project. Translations into English were supported by DeepL and OpenAI ChatGPT 4o. I acknowledge the support of the Open Access Publication Fund of the University Library Passau.
Conflicts of Interest
The author declares no conflicts of interest.
Abbreviations
The following abbreviations are used in this manuscript:
| ANOVA | Analysis of Variance |
| AOD1845 | Animal Observation (1845) Dataset |
| BayHStA | Bayerisches Hauptstaatsarchiv |
| GBIF | Global Biodiversity Information Facility |
| GIS | Geographic Information System |
| PCA | Principal Component Analysis |
| TF-IDF | Term Frequency - Inverse Document Frequency |
References
- Rehbein, M.; Escobari Vargas, A.B.; Fischer, S.; Güntsch, A.; Haas, B.; Matheisen, G.; Perschl, T.; Wieshuber, A.; Engel, T. Historical Animal Observation Records by Bavarian Forestry Offices (1845). 2024. [Google Scholar] [CrossRef]
- Nelson, G.; Ellis, S. The history and impact of digitization and digital data mobilization on biodiversity research. Philosophical transactions of the Royal Society of London. Series B, Biological sciences 2018, 374. [Google Scholar] [CrossRef]
- Perez Vico, E.; Sörlin, S.; Hanell, L.; Salö, L. Valorizing the Humanities. In Making Universities Matter; Mattsson, P., Perez Vico, E., Salö, L., Eds.; Innovation, Technology, and Knowledge Management, Springer Nature Switzerland and Imprint Springer: Cham, 2024; pp. 211–232. [Google Scholar]
- Hölzl, R. Umkämpfte Wälder: Die Geschichte einer ökologischen Reform in Deutschland 1760 - 1860: Zugl.: Göttingen, Univ., Diss., 2008; Campus historische Studien, Campus-Verl.: Frankfurt am Main, 2010; Volume Bd. 51. [Google Scholar]
- Franz, T. Geschichte der deutschen Forstverwaltung; Springer: Wiesbaden, 2020. [Google Scholar]
- Hoppe, B. Andreas Wagner. In Neue Deutsche Biographie; Kraus, H.C., Ed.; 2020; Volume 27, pp. 226–227. [Google Scholar]
- Alaoui Soulimani, A. Naturkunde unter dem Einfluss christlicher Religion: Johann Andreas Wagner (1797 - 1861): Ein Leben für die Naturkunde in einer Zeit der Wandlungen in Methode, Theorie und Weltanschauung: Dissertation LMU München 2000; Shaker: Aachen, 2001. [Google Scholar]
- von Martius, C.F.P. Denkrede auf Joh. Andreas Wagner; Verlag der k. Akademie: München, 1862. [Google Scholar]
- OÖ Landes-Kultur GmbH. Prof. Dr. Johann Andreas Wagner, 2024.
- Wagner, A. Bericht über die Leistungen in der Naturgeschichte der Säugethiere während des Jahres 1845. Archiv für Naturgeschichte 1846, 12, 113–163. [Google Scholar]
- Wagner, A. Bericht über die Leistungen in der Naturgeschichte der Vögel währe nd des Jahres 1845. – Archiv für Naturgeschichte. Archiv für Naturgeschichte 1846, 12, 164–184. [Google Scholar]
- Wagner, A. Die geographische Verbreitung der Säugethiere. Abhandlungen der mathematisch-physikalischen Klasse der königlich bayerischen Akademie der Wissenschaften 1844, 1, 1–146. [Google Scholar]
- Wagner, A. Beyträge zur Kenntniß der bayerischen Fauna. Gelehrte Anzeigen, herausgegeben von Mitgliedern der königlich bayerischen Akademie der Wissenschaften 1846, 22, 649–656,657–664,665–672,673–680,697–700. [Google Scholar]
- Hamberger, J.; Bauer, O. Wald, Mensch, Heimat: Eine Forstgeschichte Bayerns, 2nd ed.; Laubsänger-Verlag: Freising, 2019. [Google Scholar]
- Die Forstverwaltung Bayerns; Hennings und Hopf: Erfurt, 1845.
- Wolff, P.; Medin, D.L.; Pankratz, C. Evolution and devolution of folkbiological knowledge. Cognition 1999, 73, 177–204. [Google Scholar] [CrossRef] [PubMed]
- Rehbein, M. Taciturn Franconia? – Some Statistical Exploration of AOD1845, 2024.
- Wegmaier, A. Salinenkonvention 1829 und 1957. Historisches Lexikon Bayerns 2006. [Google Scholar]
- Bundesamt für Naturschutz. Schutzgebiete in Deutschland, 2024.
- Bundesamt für Naturschutz. Biogeografische Regionen und naturräumliche Haupteinheiten Deutschlands, 2021.
- Statistisches Bundesamt. Bevölkerungsdichte in Deutschland nach Bundesländern zum 31. Dezemb er 2023, 2024.
- Hohorst, G.; Kocka, J.; Ritter, G.A. Sozialgeschichtliches Arbeitsbuch: Materialien z. Statistik d. Kaiser reichs 1870 - 1914; Beck’sche Elementarbücher, Beck: München, 1975. [Google Scholar]
- Meyer-Stoll, C. Die Maß- und Gewichtsreformen in Deutschland im 19. Jahrhundert unter besonderer Berücksichtigung der Rolle Carl August Steinheils und der Bayerischen Akademie der Wissenschaften; Vol. N.F., H. 136, Abhandlungen / Bayerische Akademie der Wissenschaften, Philosophisch-Historische Klasse; Beck: München, 2010. [Google Scholar]
- Braun, H. Industrialisierung, 2007.
- Pfister, C.; Wanner, H. Klima und Gesellschaft in Europa: die letzten tausend Jahre, 1. auflage ed.; Haupt Verlag: Bern, 2021. [Google Scholar]
- Wagner, A.; Weber, J.C.; v. Massenbach, F. Uebersichtskarte der Verbreitungsverhältnisse der merkwürdigsten wildlebenden Thiere in Bayern: Ein Versuch nach Angabe Königlicher Forstämter und eigener Erfahrung, 1850.
- Fahrer. Die Thierwelt. In Bavaria. Landes- und Volkskunde des Königreichs BAyern; Cotta’sche Buchhandlung: München, 1860; Volume 1.1 Ober- und Niederbayern, pp. 185–226. [Google Scholar]
- Donig, S.; Rehbein, M. Für eine gemeinsame digitale Zukunft. Eine kritische Verortung der Digital History. Geschichte in Wissenschaft und Unterricht 2022, 72, 527–545. [Google Scholar]
- Zahner, V. Der Biber in Bayern: Eine Studie aus forstlicher Sicht; 1997.
- Balée, W.; Dudley, M. Applied Historical Ecology. In Methods in historical ecology; Odonne, G., Molino, J.F., Eds.; New frontiers in historical ecology, Routledge: Abingdon, Oxon and New York, NY, 2021; pp. 162–170. [Google Scholar]
- Menzies, A.K.; Bowles, E.; McGregor, D.; Ford, A.T.; Popp, J.N. Sharing Indigenous values, practices and priorities as guidance for transforming human–environment relationships. People and Nature 2024, 6, 2109–2125. [Google Scholar] [CrossRef]
- Rehbein, M. Annotations for the AOD1845 Data Sets, 2024. [CrossRef]
- Fisher, R.A. Statistical Methods for Research Workers. In Breakthroughs in Statistics; Kotz, S., Johnson, N.L., Eds.; Springer New York: New York, NY, 1992; pp. 66–70, Series Title: Springer Series in Statistics. [Google Scholar]
- Creswell, J.W.; Plano Clark, V.L. Designing and conducting mixed methods research, third edition, international student edition ed.; Sage: Los Angeles London New Delhi Singapore Washington DC Melbourne, 2018. [Google Scholar]
- Deremetz, A. Mixed Methods in den Digital Humanities: Topic-informierte Diskursanalyse am Beispiel der Volkszählungs- und Zensusdebatte; Digitalitätsforschung / Digitality Research, Springer Berlin Heidelberg: Berlin, Heidelberg, 2023. [Google Scholar] [CrossRef]
- Rote-Liste-Kategorien, 2009.
- GBIF.Org User. Occurrence Download, 2024. [CrossRef]
- Rote-Liste-Zentrum. Lutra lutra (Linné, 1758).
- GBIF.Org User. Occurrence Download, 2024. [CrossRef]
- Löffler, B. Das Land der Bayern: Geschichte und Geschichten von 1800 bis heute, 1st ed.; C.H. Beck: München, 2024. [Google Scholar]
- Albert, G. Ein Nachruf auf das Auerhuhn in der Pfalz: mit einem Überblick über die Situation der heutigen Auerhuhnbestände in Deutschland, 2024. Place: Lambrecht.
- Jäckel, A.J. Systematische Übersicht der Vögel Bayerns: mit Rücksicht auf das örtliche und quantitative Vorkommen der Vögel, ihre Lebensweise, ihren Zug und ihre Abänderungen; Oldenbourg: München, 1891. [Google Scholar]
- Blaschitz, G. Der Biber im Topf und der Pfau am Spieß. Anhang: der Birkhahn in der Pfanne. In Ir sult sprechen willekomen; Tuczay, C., Ed.; Lang: Bern and Berlin and Frankfurt a. M. and New York and Paris and Wien, 1998; pp. 416–436. [Google Scholar]
- Hoffmann, R.C. The Catch: An Environmental History of Medieval European Fi sheries, 1st ed.; Cambridge University Press, 2023. [Google Scholar] [CrossRef]
- Meßlinger, U. Artenvielfalt im Biberrevier: Wildnis in Bayern, 2015.
- Rosell, F.; Bozsér, O.; Collen, P.; Parker, H. Ecological impact of beavers Castor fiber and Castor canadensis and their ability to modify ecosystems. Mammal Review 2005, 35, 248–276. [Google Scholar] [CrossRef]
- Halley, D.J.; Saveljev, A.P.; Rosell, F. Population and distribution of beavers Castor fiber and Castor canadensis in Eurasia. Mammal Review 2021, 51, 1–24. [Google Scholar] [CrossRef]
- Govaerts, S. Historical presence of the Eurasian beaver (Castor fiber) in the IJssel River (the Netherlands) in 1450-1500. Lutra 2022, 65, 229–245. [Google Scholar]
- GBIF.Org User. Occurrence Download, 2024. [CrossRef]
- GBIF.Org User. Occurrence Download, 2024. [CrossRef]
- Sörlin, S. Environmental Humanities: Why Should Biologists Interested in the Environment Take the Humanities Seriously? BioScience 2012, 62, 788–789. [Google Scholar] [CrossRef]
- Decocq, G. A General Introduction to Historical Ecology. In Historical Ecology; Decocq, G., Ed.; Wiley, 2022; pp. 1–9. [Google Scholar]
- Safford, H.D.; Hayward, G.D.; Heller, N.E.; Wiens, J.A. Historical Ecology, Climate Change, and Resource Management: Can the Past Still Inform the Future? In Historical Environmental Variation in Conservation and Natural Resource Management; Wiens, J.A., Hayward, G.D., Safford, H.D., Giffen, C.M., Eds.; Wiley, 2012; pp. 46–62. [Google Scholar] [CrossRef]
- Higgs, E.; Falk, D.A.; Guerrini, A.; Hall, M.; Harris, J.; Hobbs, R.J.; Jackson, S.T.; Rhemtulla, J.M.; Throop, W. The changing role of history in restoration ecology. Frontiers in Ecology and the Environment 2014, 12, 499–506. [Google Scholar] [CrossRef]
- Braje, T.J.; Rick, T.C. From forest fires to fisheries management: anthropology, conservation biology, and historical ecology. Evolutionary anthropology 2013, 22, 303–311. [Google Scholar] [CrossRef] [PubMed]
- Gonzalez, A.; Chase, J.M.; O’Connor, M.I. A framework for the detection and attribution of biodiversity change. Philosophical Transactions of the Royal Society B: Biological Sciences 2023, 378, 20220182. [Google Scholar] [CrossRef]
| 1 | References to the AOD1845 data set are given by entry IDs. Translations from the original German sources by the author. |
| 2 | Due to additional species reported by some foresters, the total number of entries exceeds . Three reports from BayHStA sources were excluded: a second report from Landau (Isar) and two reports from senior foresters of Thurn and Taxis and the Löwenstein/Kreutzwertheim private estates. The dataset also excludes data on fish. |
Figure 1.
Distribution of lengths of responses (in tokens).
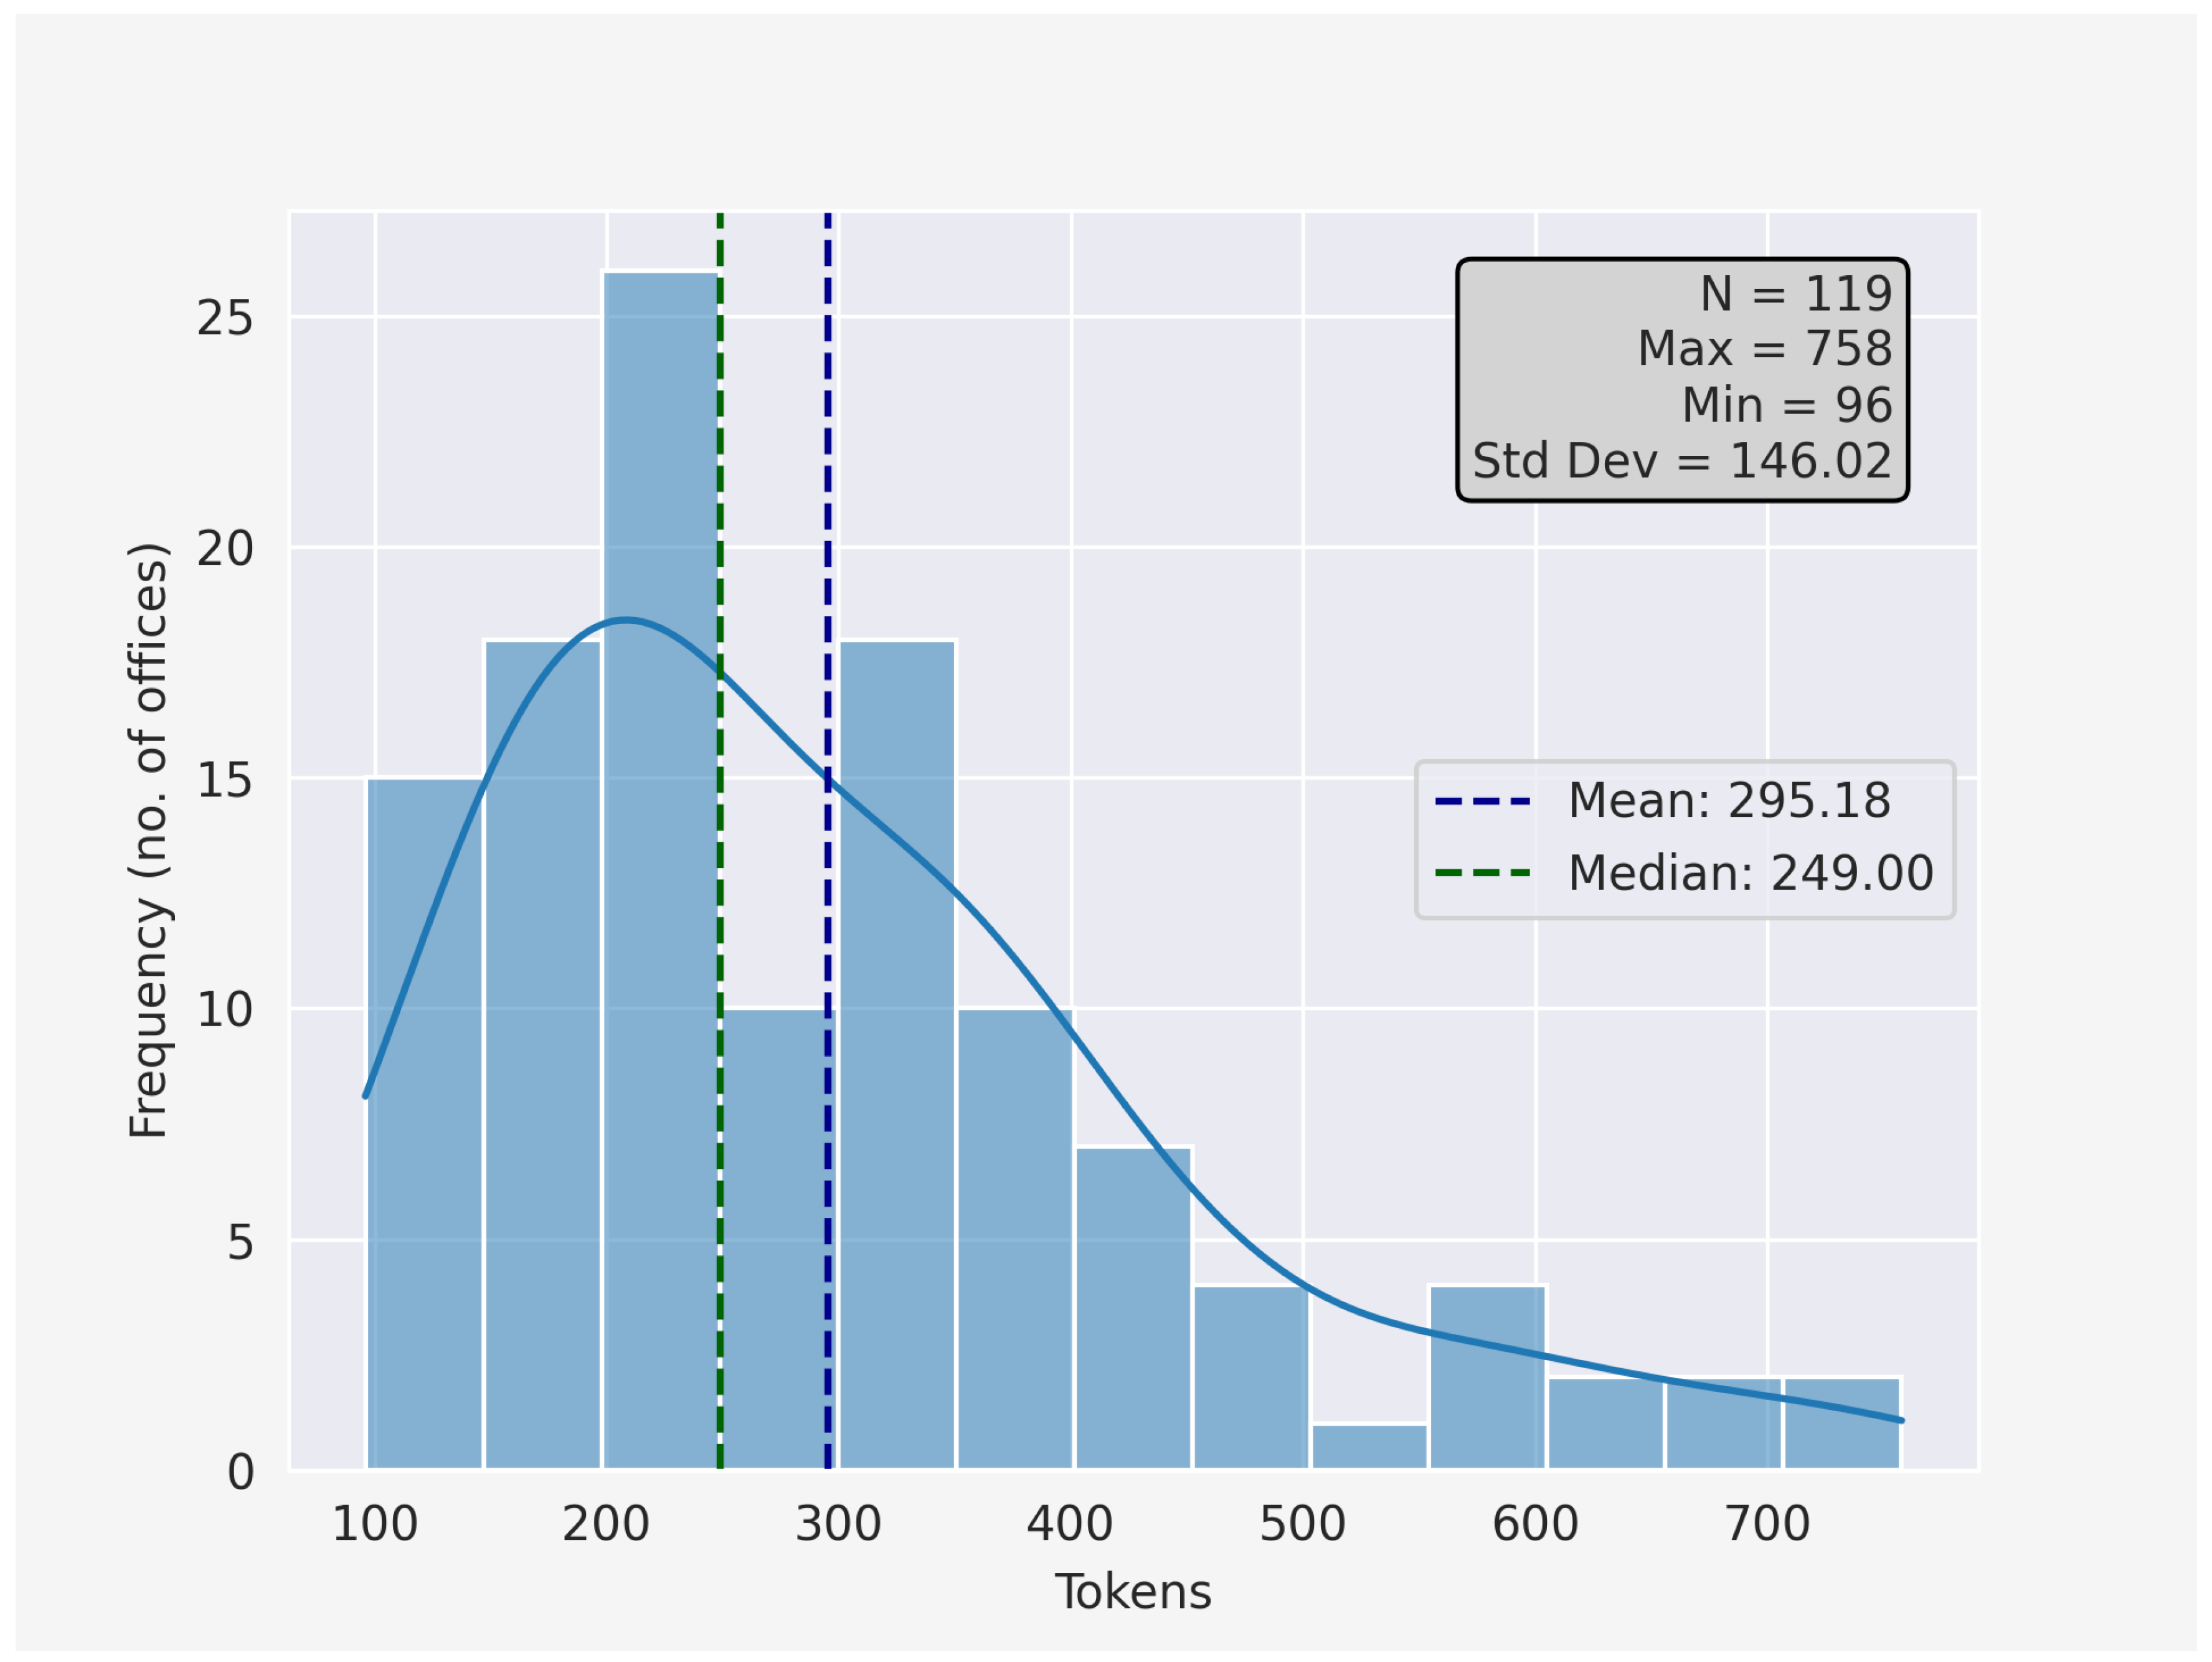
Figure 2.
Sample pages from the responses. Left: Page 1 from the Tegernsee (Salforste) report (BayHStA, Zoologische Staatssammlung, 217, p. 15). Right: Page 1 from the Berchtesgaden (Salforste) report (BayHStA, Zoologische Staatssammlung, 217, p. 23).
Figure 2.
Sample pages from the responses. Left: Page 1 from the Tegernsee (Salforste) report (BayHStA, Zoologische Staatssammlung, 217, p. 15). Right: Page 1 from the Berchtesgaden (Salforste) report (BayHStA, Zoologische Staatssammlung, 217, p. 23).
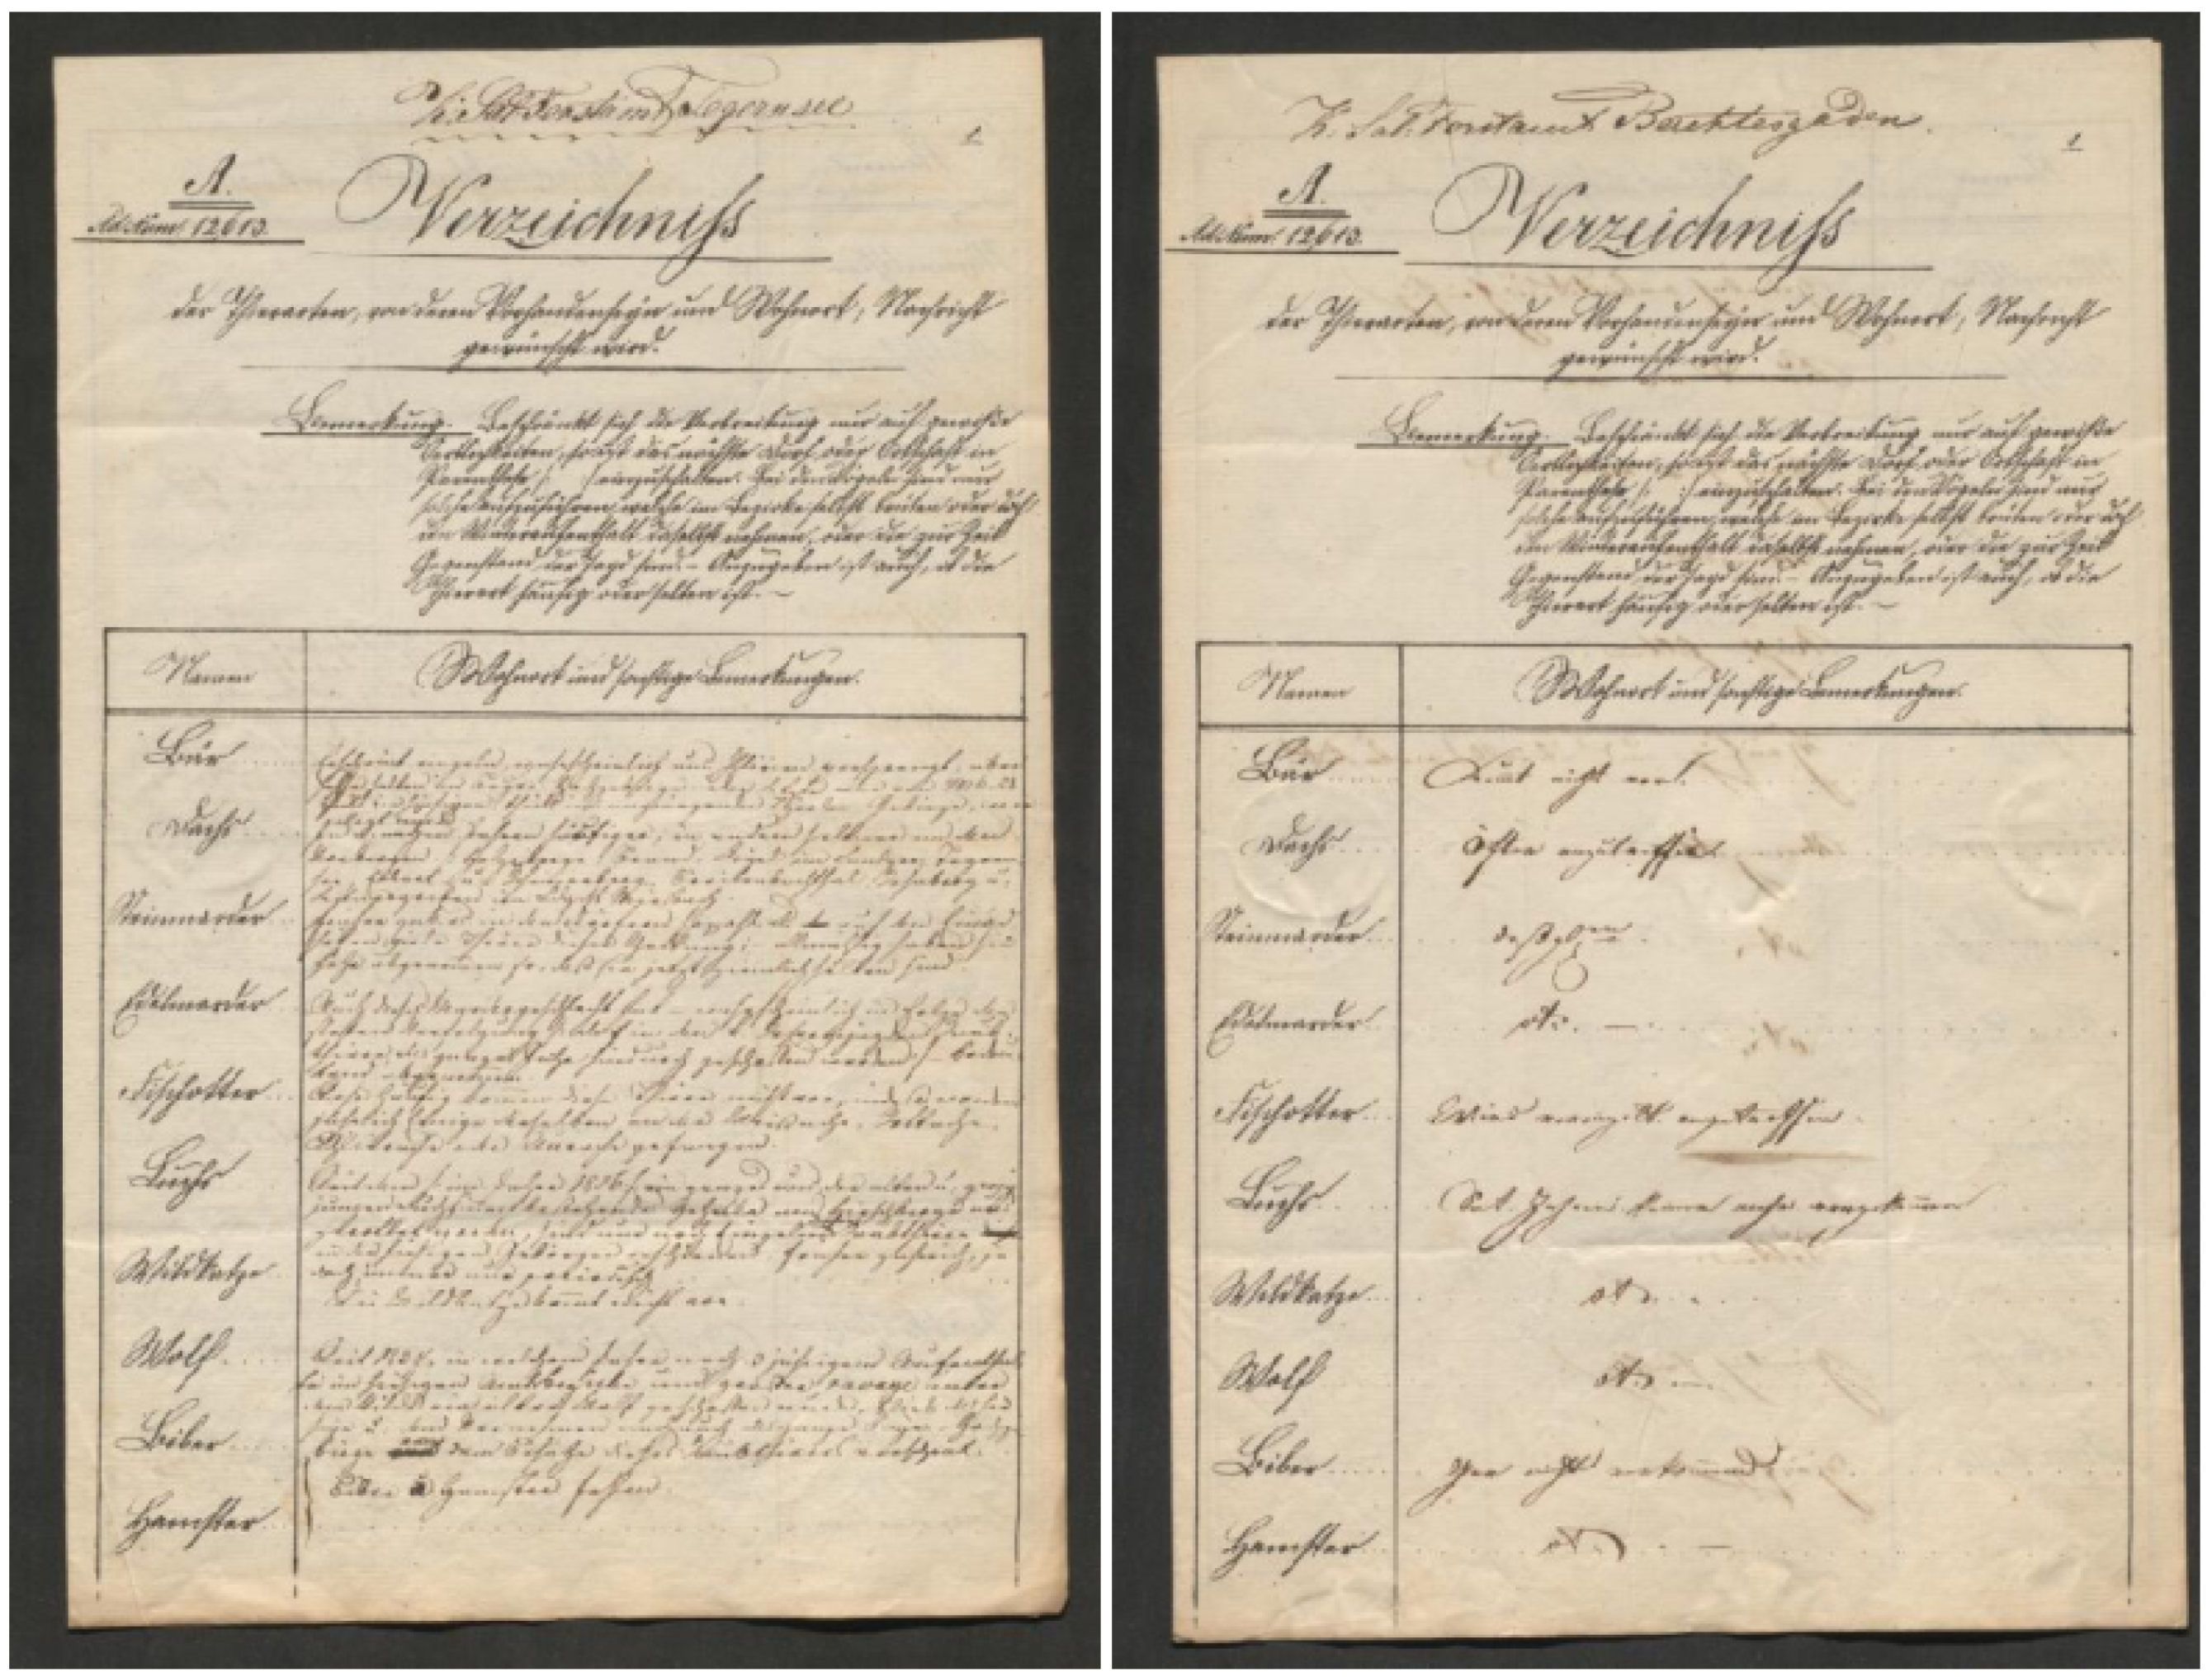
Figure 3.
Distribution of the ten rarest species according to the reports. The size of the dots represents the overall amount of species with a positive occurrence status per office. A transparent dot means that none of the ten species is present within the range of the respective forestry office. Sources: own analysis of AOD1845, OpenStreetMap, historical district borders: HGIS Germany (https://hgl.harvard.edu/catalog/harvard-ghgis1848districts).
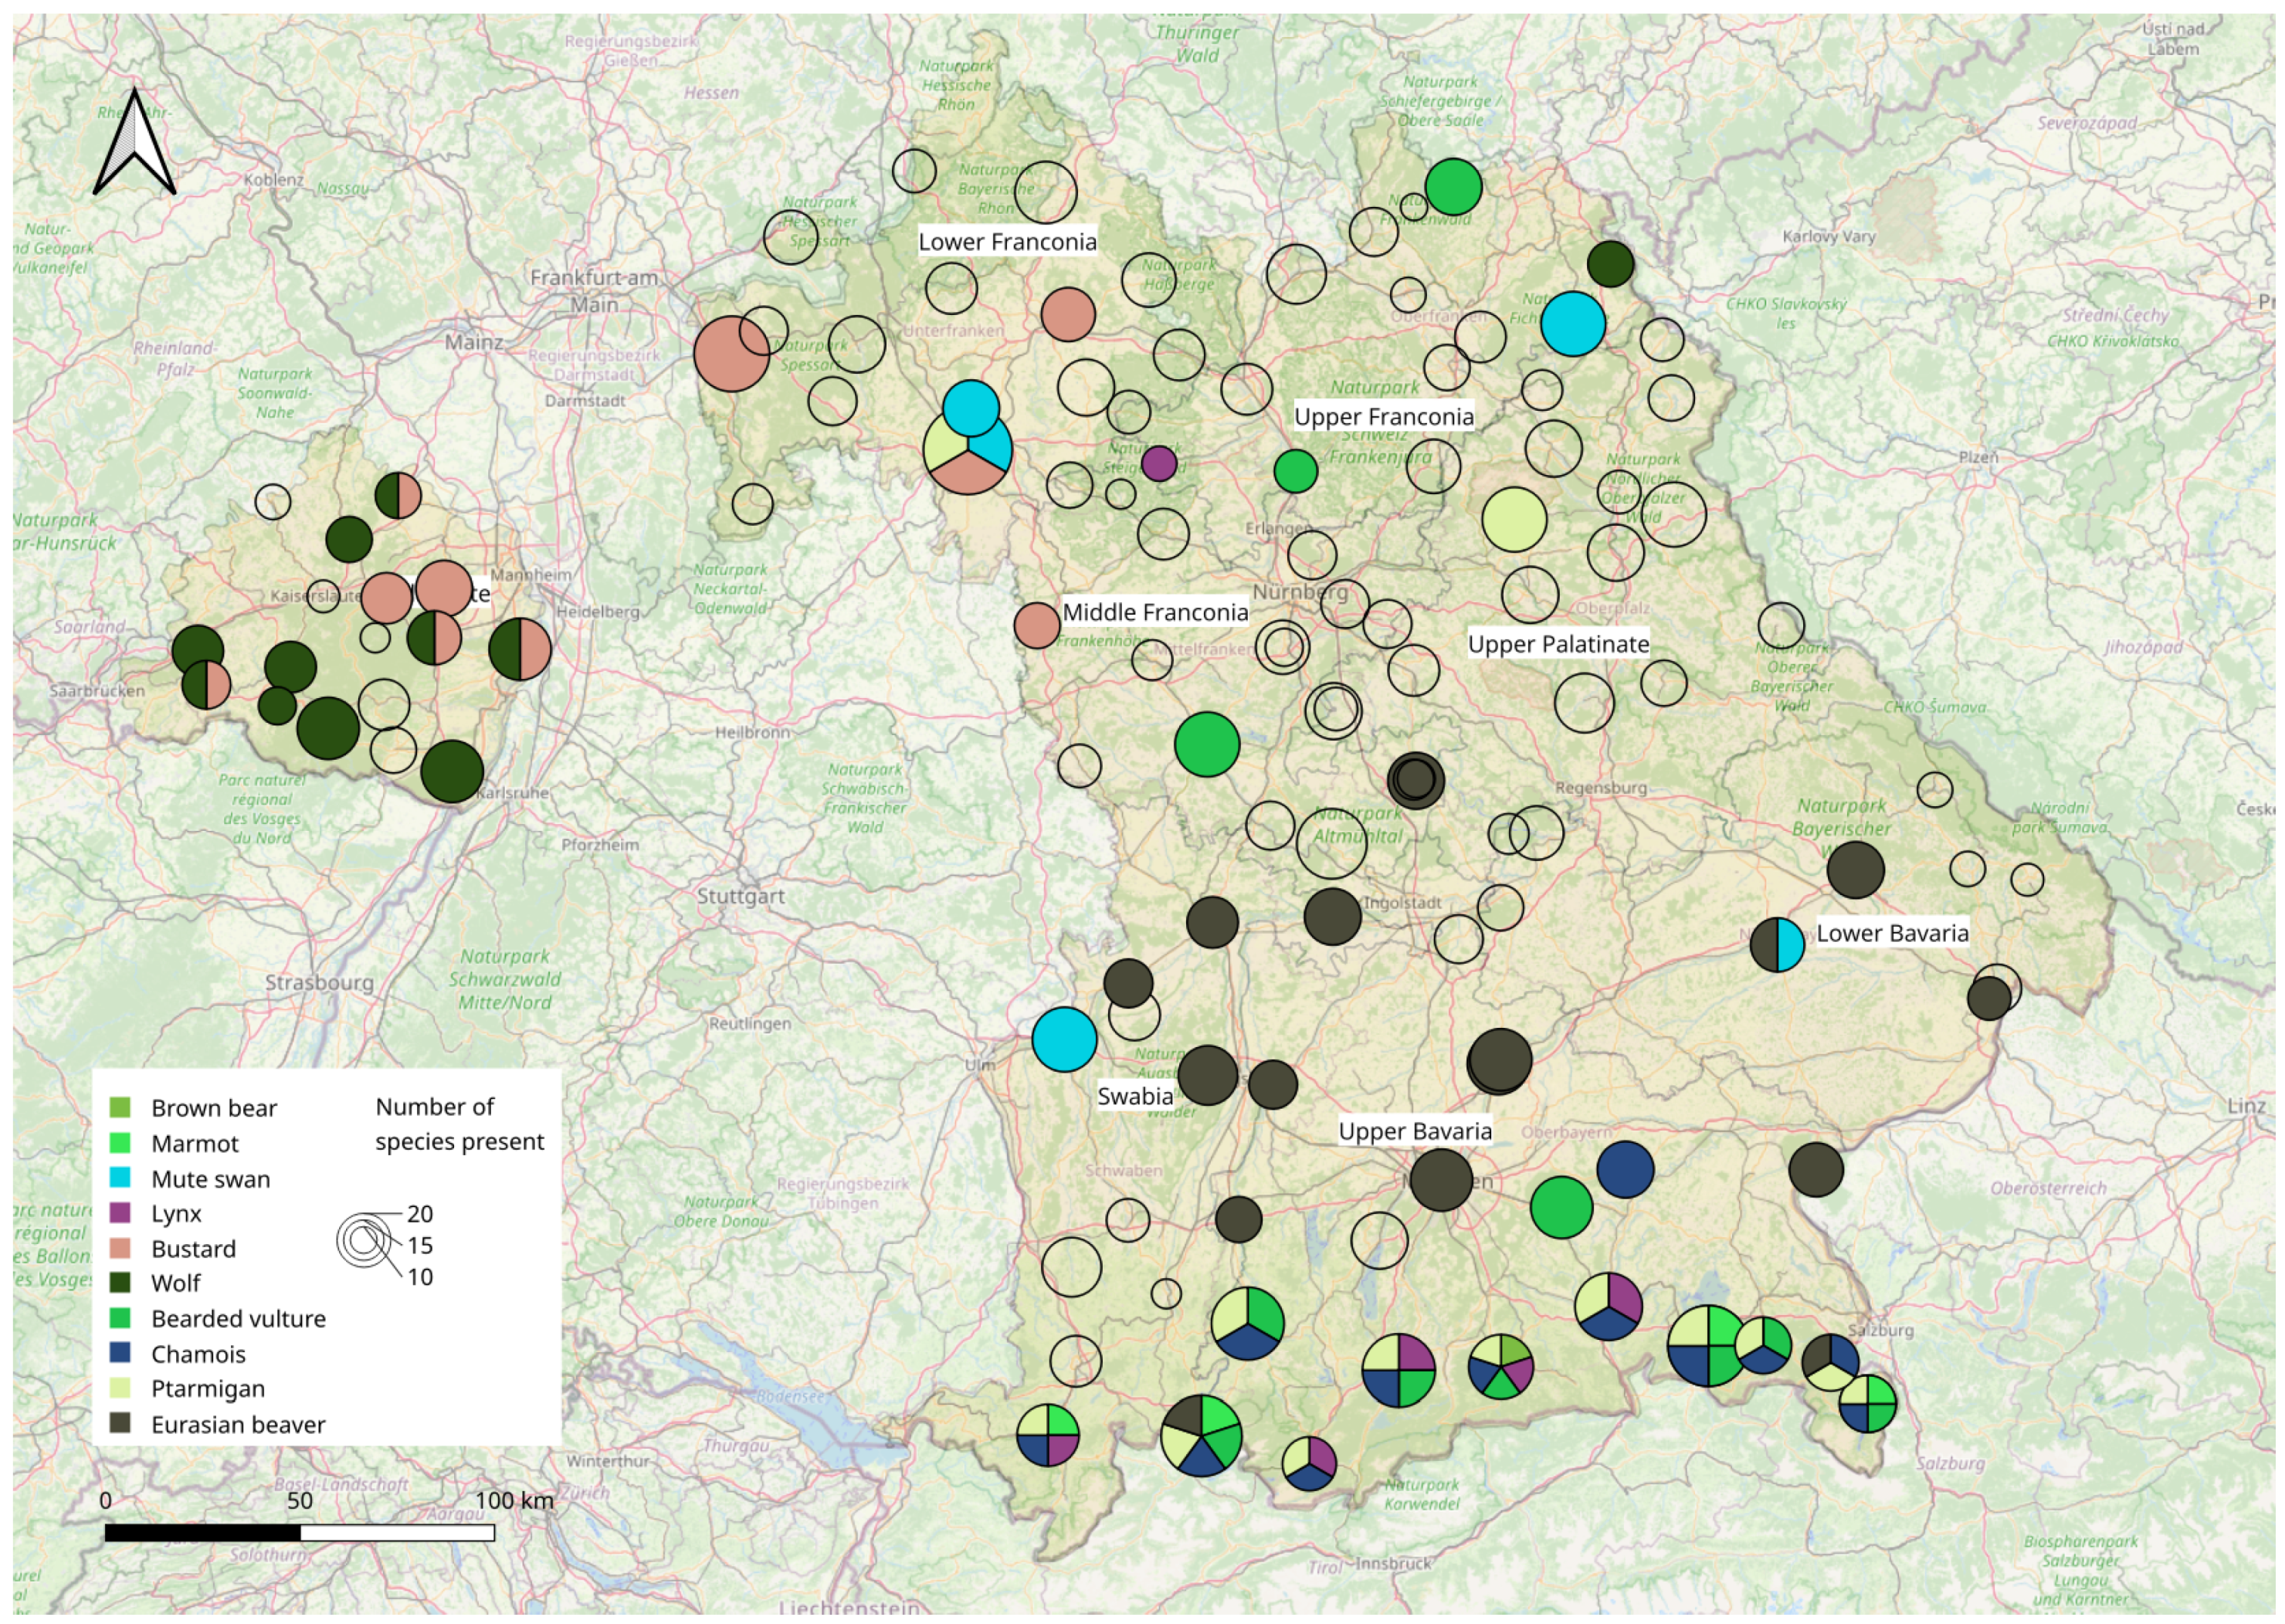
Figure 4.
Sample digitized image from the Deggendorf response. The Deggendorf forester is one of the few who did not use the provided template (BayHStA, Zoologische Staatssammlung, 210, p. 3).
Figure 4.
Sample digitized image from the Deggendorf response. The Deggendorf forester is one of the few who did not use the provided template (BayHStA, Zoologische Staatssammlung, 210, p. 3).
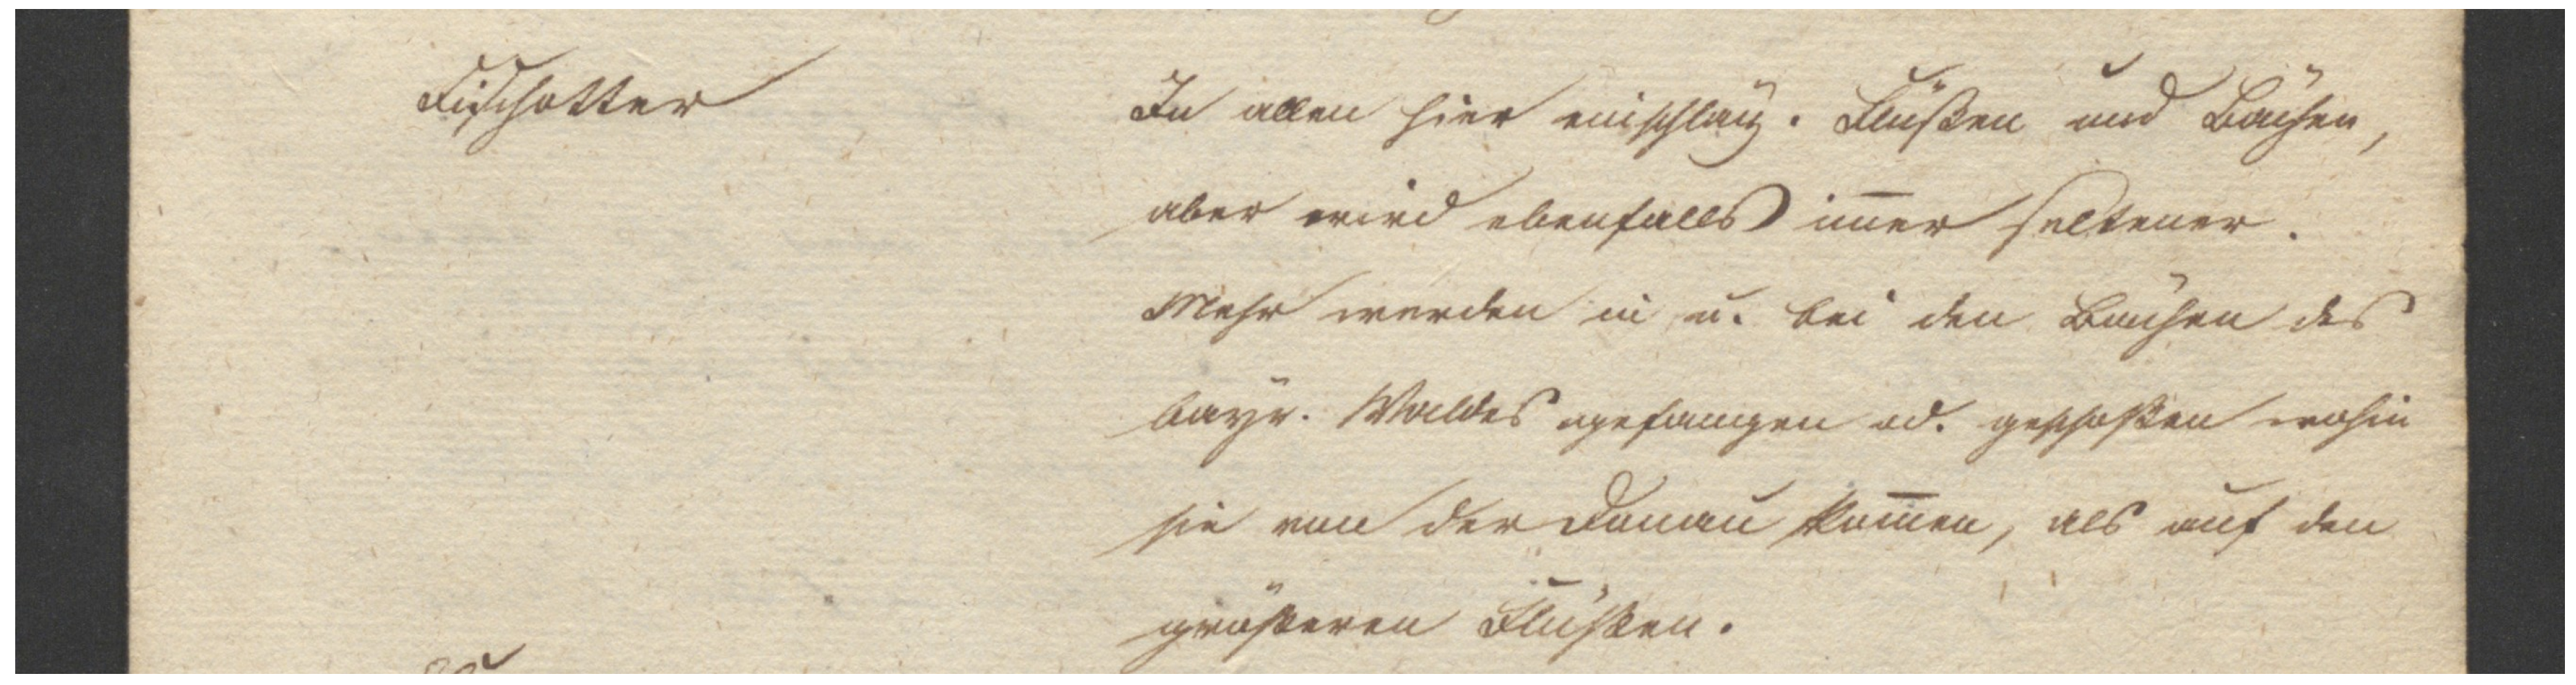
Figure 5.
Classification of quantified occurrences for Roe deer and Eurasian otter. See Section 2.3 for the classification scheme.
Figure 5.
Classification of quantified occurrences for Roe deer and Eurasian otter. See Section 2.3 for the classification scheme.
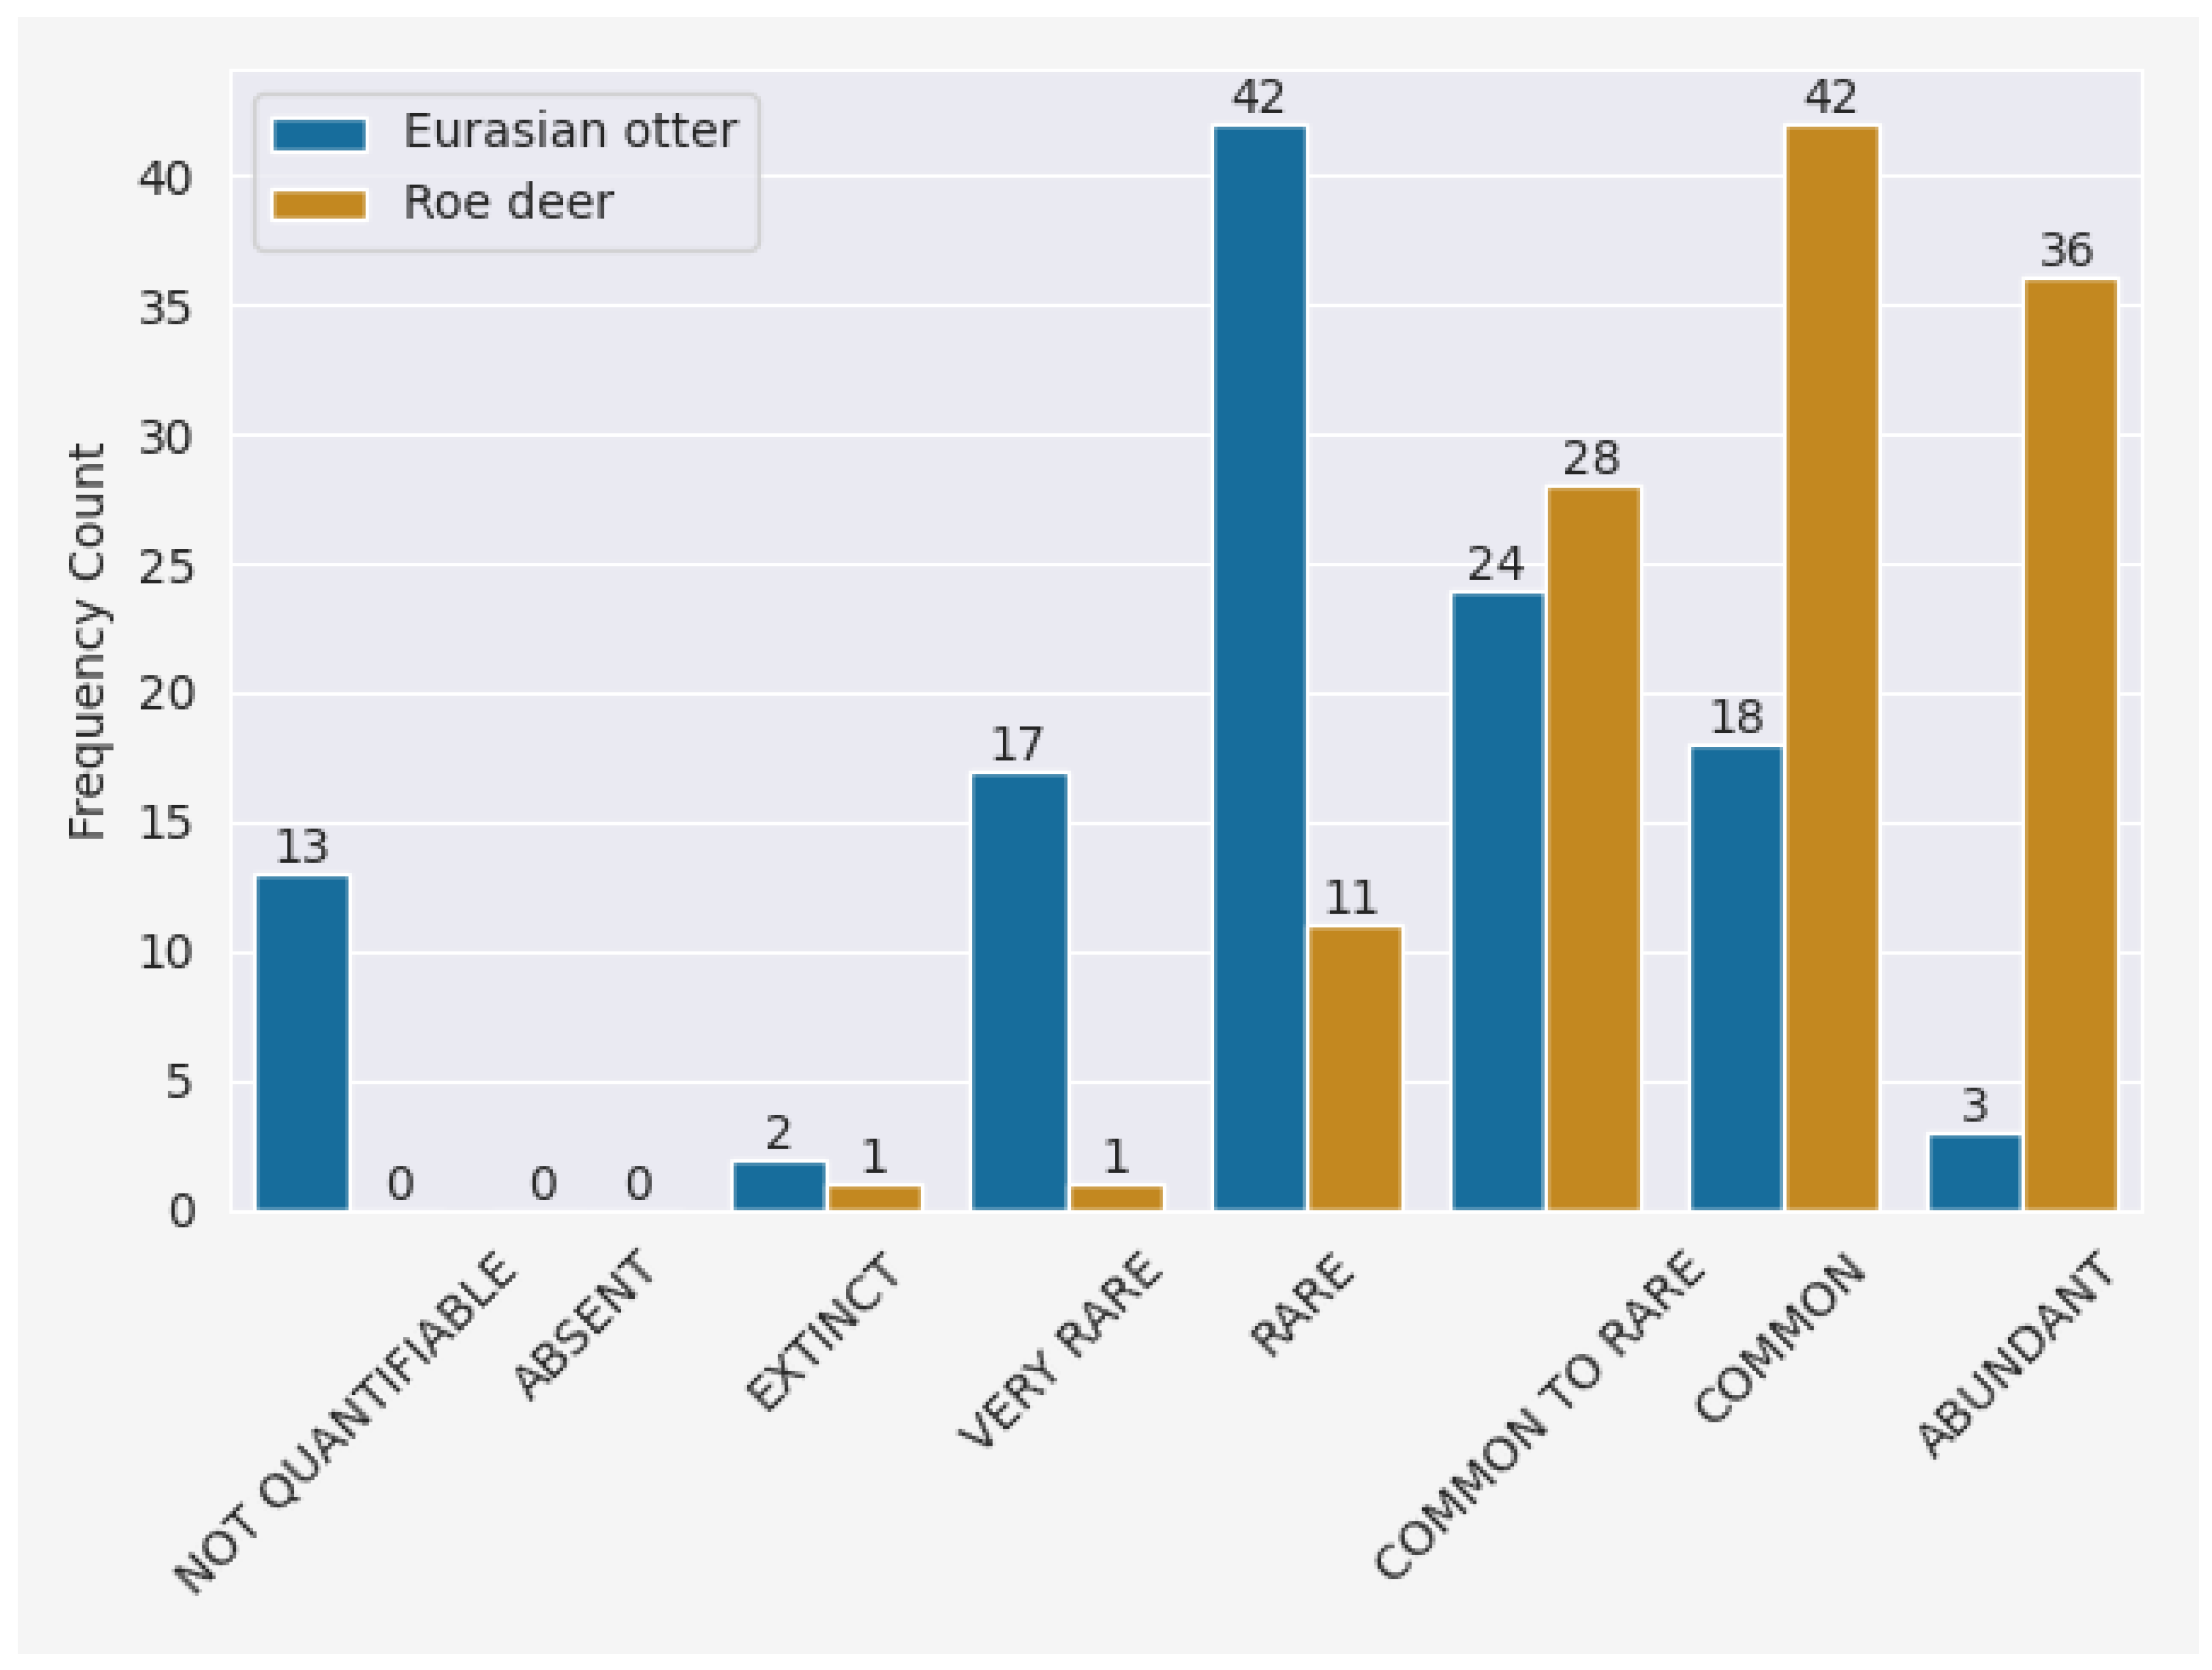
Figure 6.
Cluster analysis (habitat descriptors / species). Each of the 44 dots represents one species – the closer the dots in the diagram to each other, the more similar the habitat descriptors of the species represented by these dots. Source: own analysis based on AOD1845 data.
Figure 6.
Cluster analysis (habitat descriptors / species). Each of the 44 dots represents one species – the closer the dots in the diagram to each other, the more similar the habitat descriptors of the species represented by these dots. Source: own analysis based on AOD1845 data.
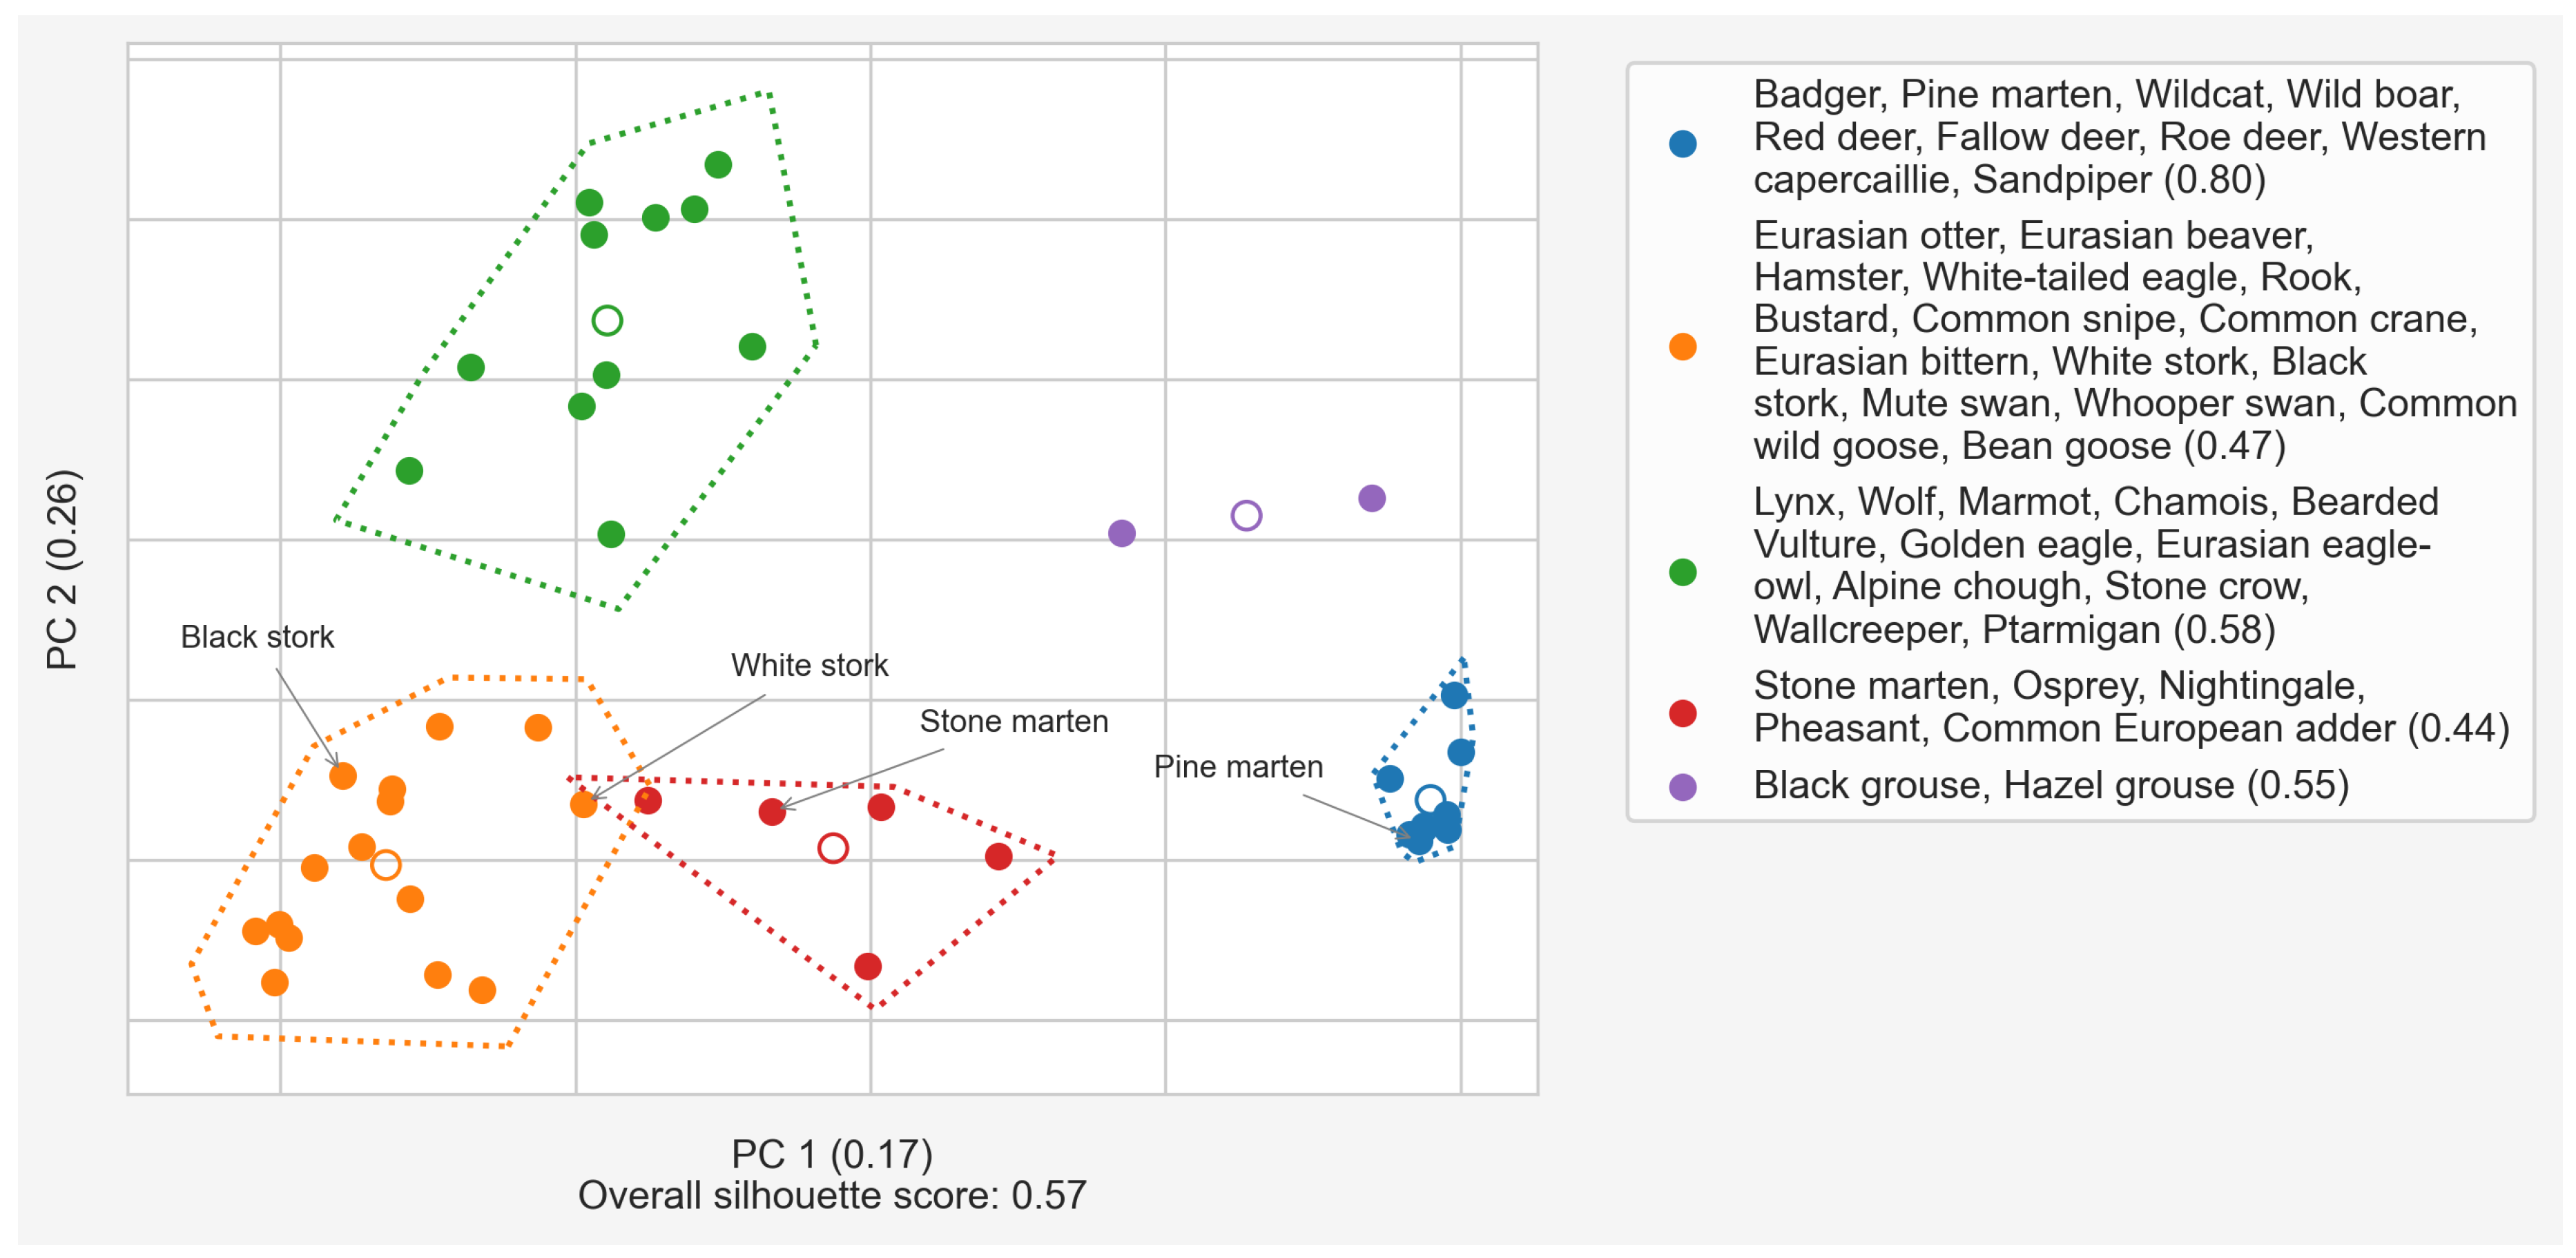
Figure 7.
Deep map, combining results of cluster analysis (habitat descriptors / offices) with location of office seats. Each dot represents one of the 119 forestry offices. Those offices that did not provide sufficient information on habitats are not classified. Source: own analysis of AOD1845 data, HGIS Germany (https://hgl.harvard.edu/catalog/harvard-ghgis1848districts).
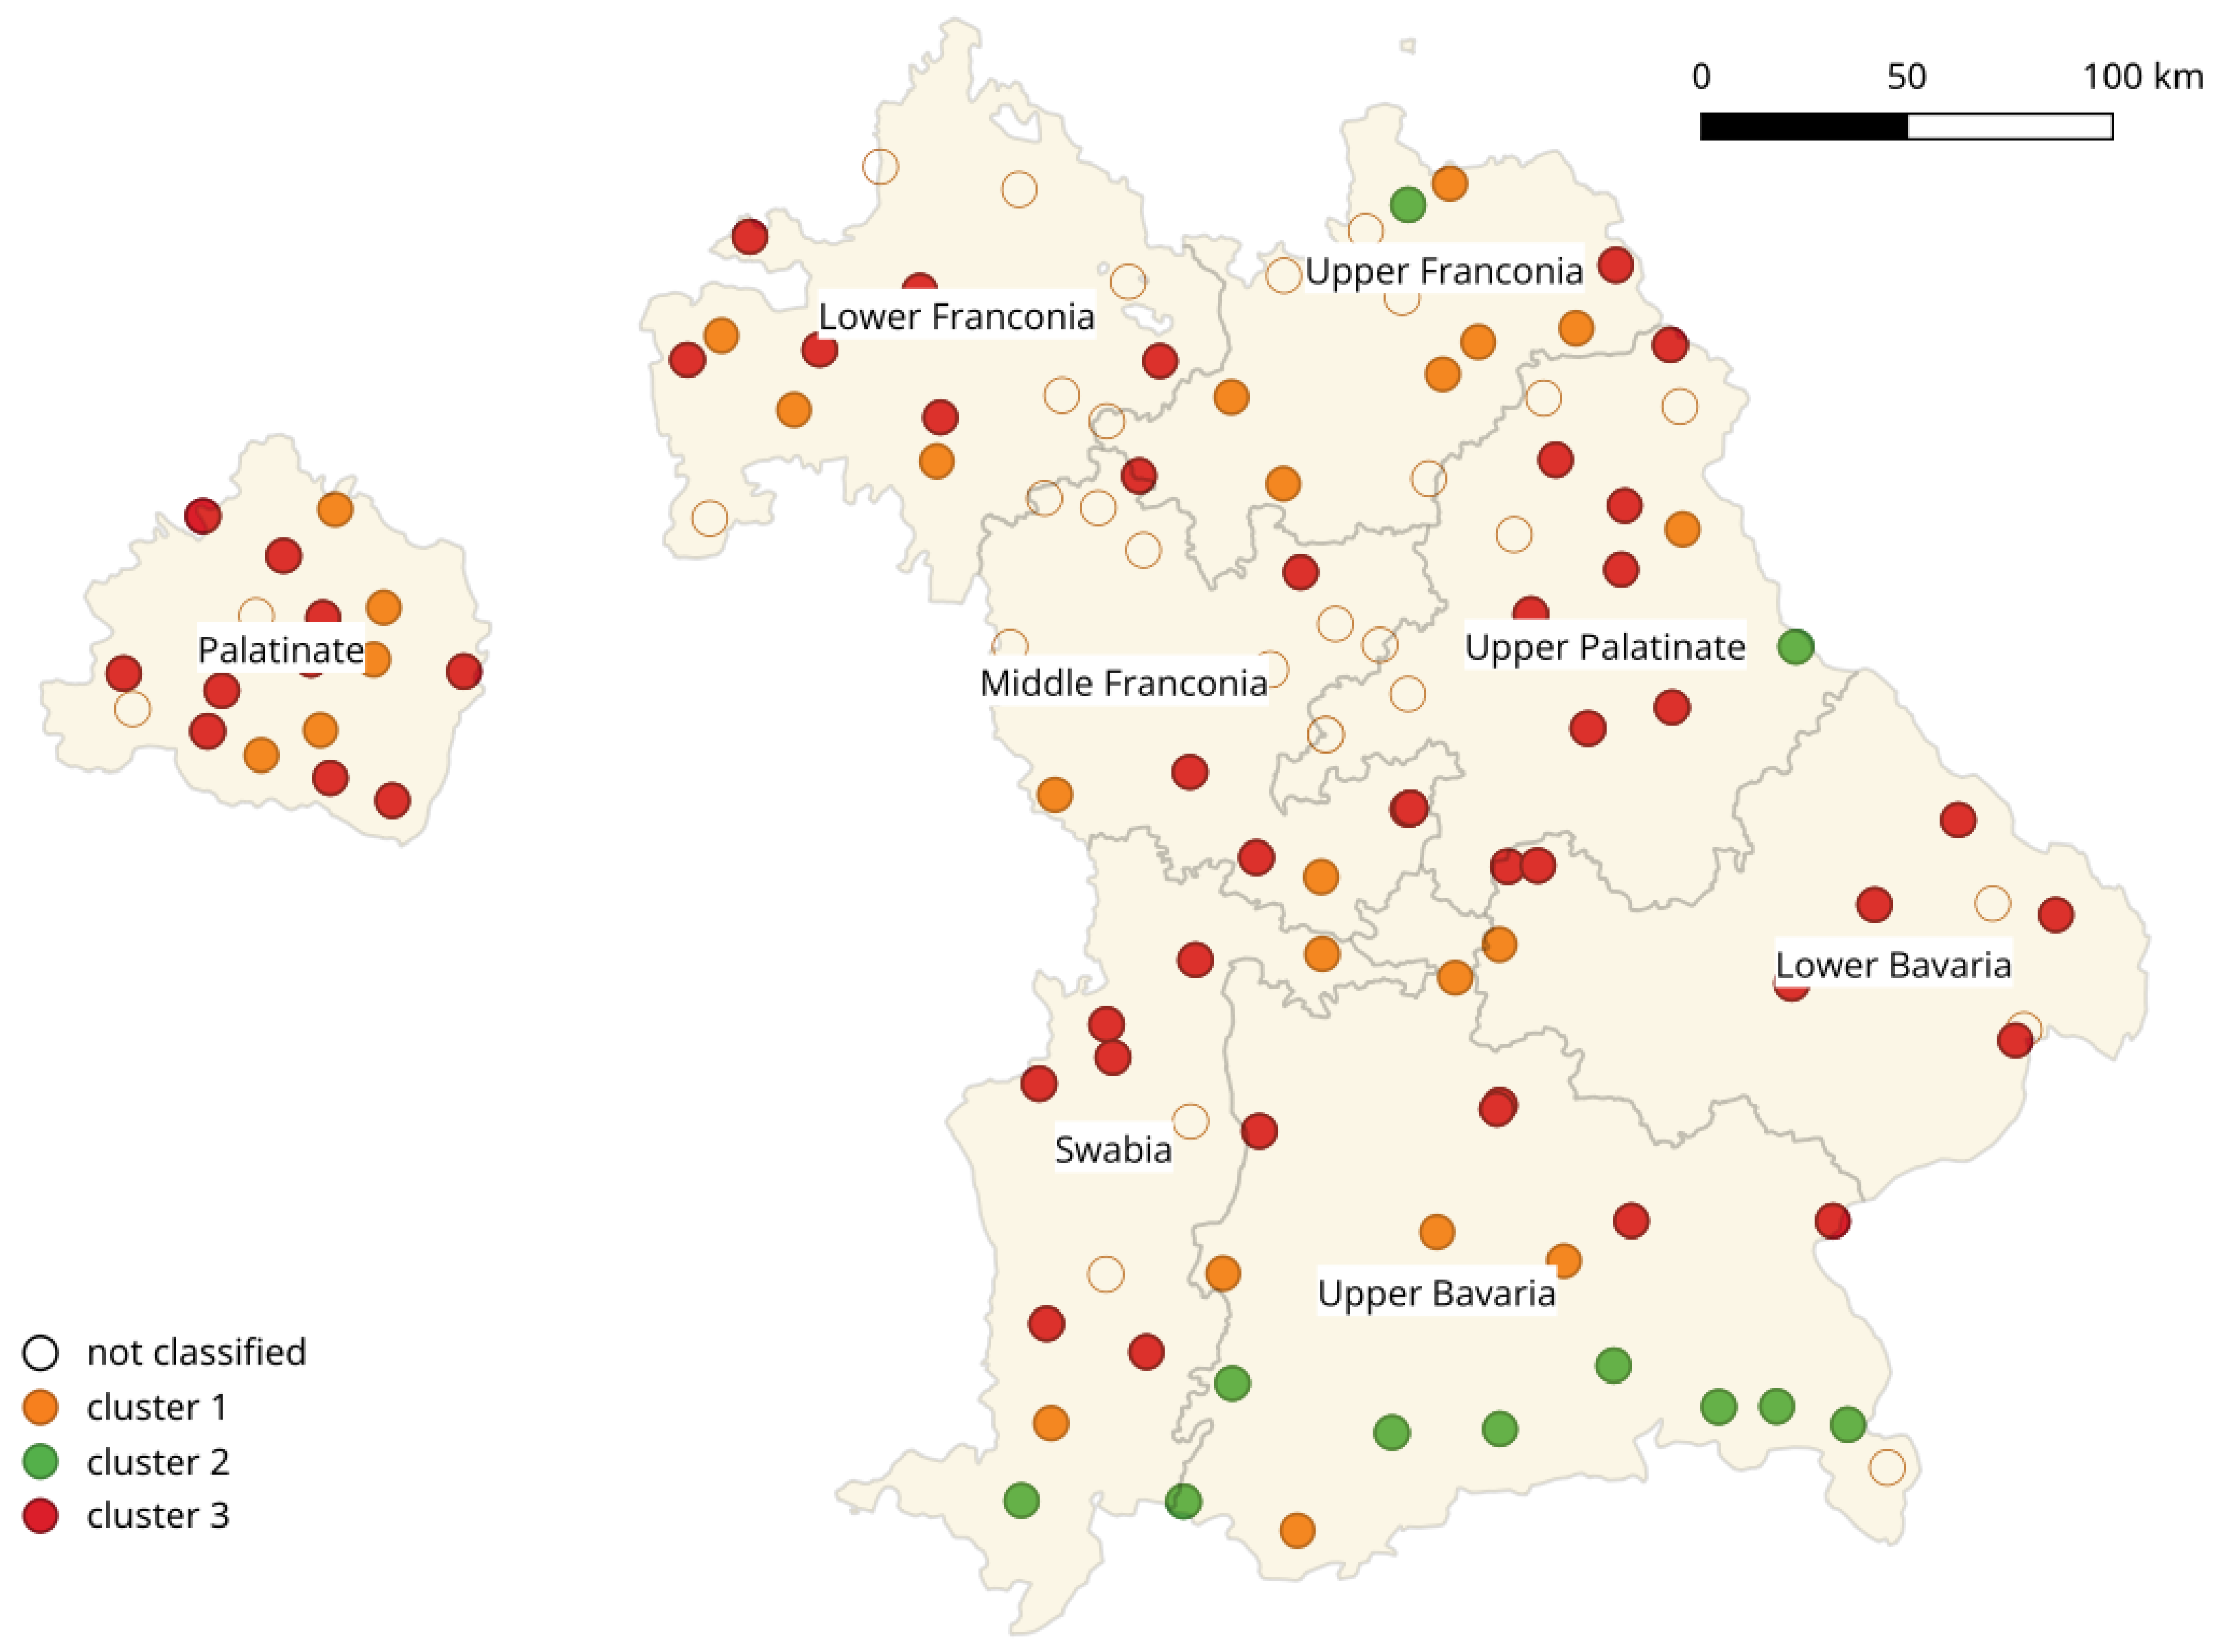
Figure 8.
Distribution of the Eurasian otter with estimated frequency classes from the AOD1845 dataset, blendend with all recent sightings of the species as recorded in GBIF 2000–2024. The markers used for the 1845 forestry offices’ seats are enlarged in comparison to Figure 3 to cover more area and provide better visual impression. Note also that the modern data is based on the political boundaries of today. Especially for the Palatinate, it is based on the Rhineland-Palatinate which differs from the Bavarian Palatinate in 1845 (a). Sources: own analysis of AOD1845 data, GBIF [37], OpenStreeMap, HGIS Germany (https://hgl.harvard.edu/catalog/harvard-ghgis1848districts).
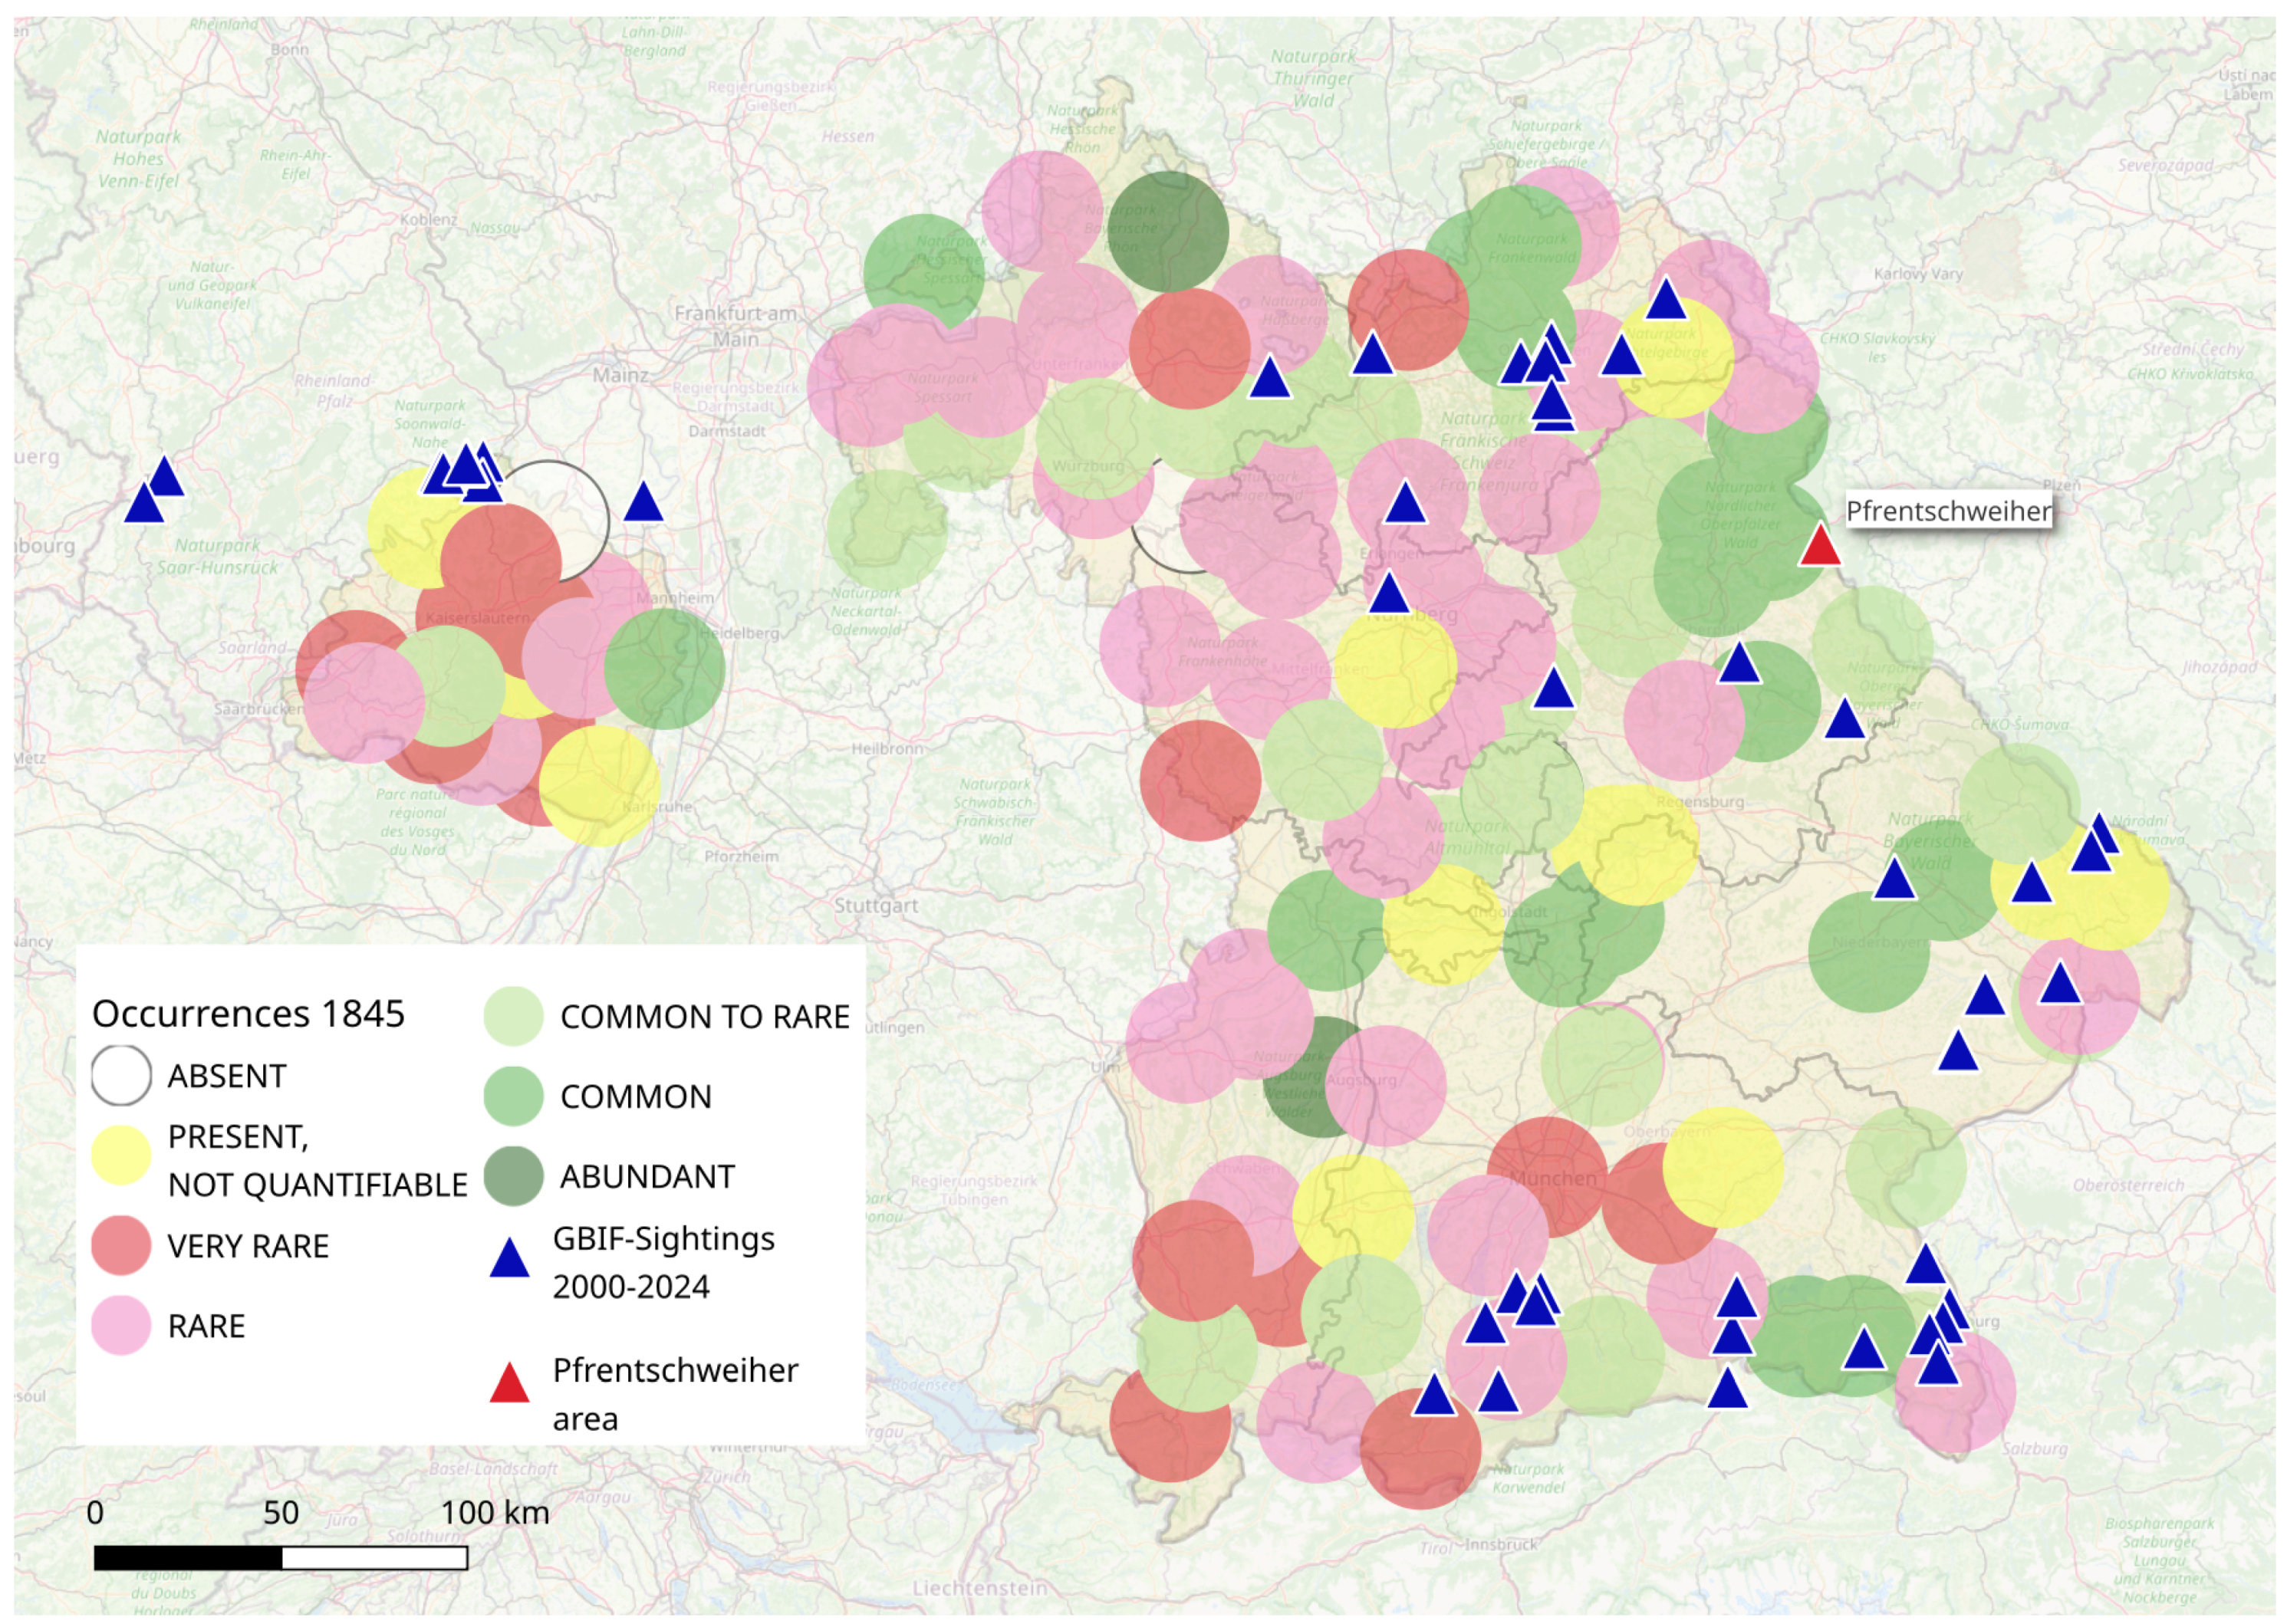
Figure 9.
Distribution area of the Eurasian otter (Lutra lutra) in the Vohenstrauss region (Upper Palatinate). Source: own analysis of AOD1845 data, Landesamt für Digitalisierung, Breitband und Vermessung / Bayerischen Vermessungsverwaltung. OpenStreetMap, Google. Coordinates of Pfrentschweiher (modern dwelling): 49.615315, 12.524139 EPSG:4326 WGS 84.
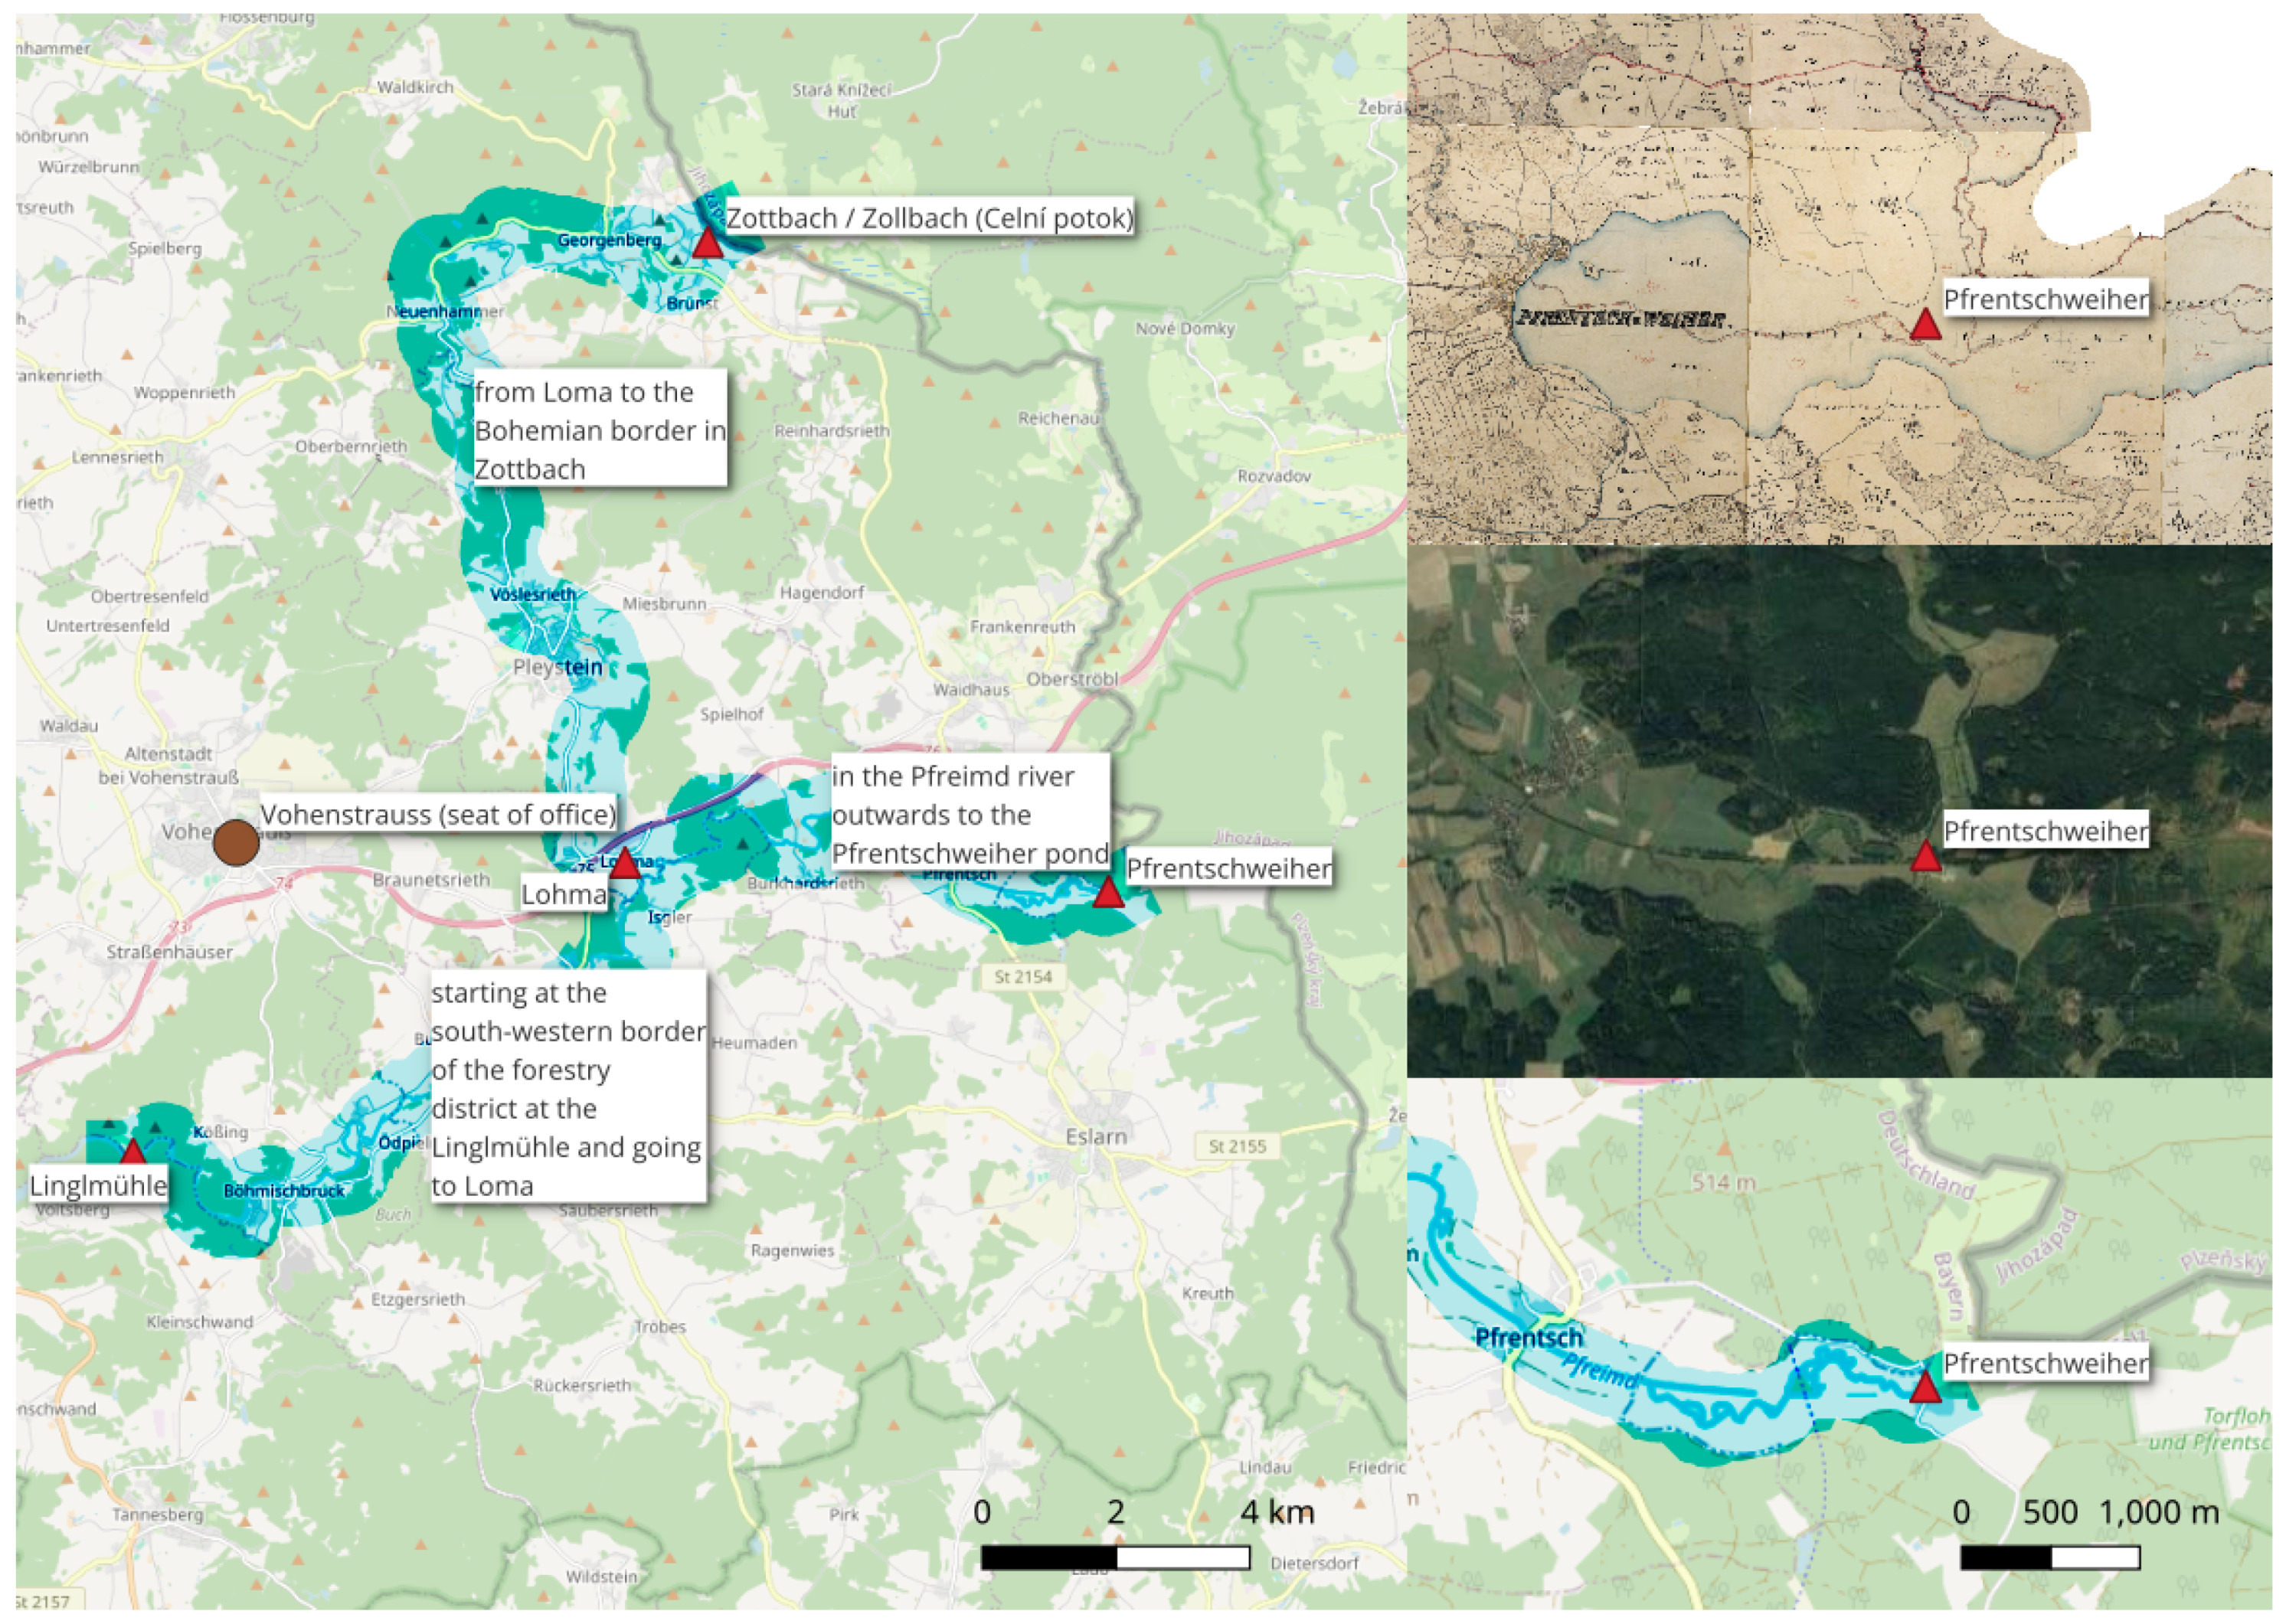
Figure 10.
Case studies on selected species: (a) Classified occurrences of the wolf. (b) Approximated directions of wolf migration according to the Palatinate reports. (c) Classified occurrences of the beaver. Sources: own analysis of AOD1845 data and [13,29]. Zahner provides no map for the Palatinate. (d) Classified occurrences of the Western capercaillie from AOD1845, blended with data from [41] and [42]. Left-bank Rhine Palatinate.
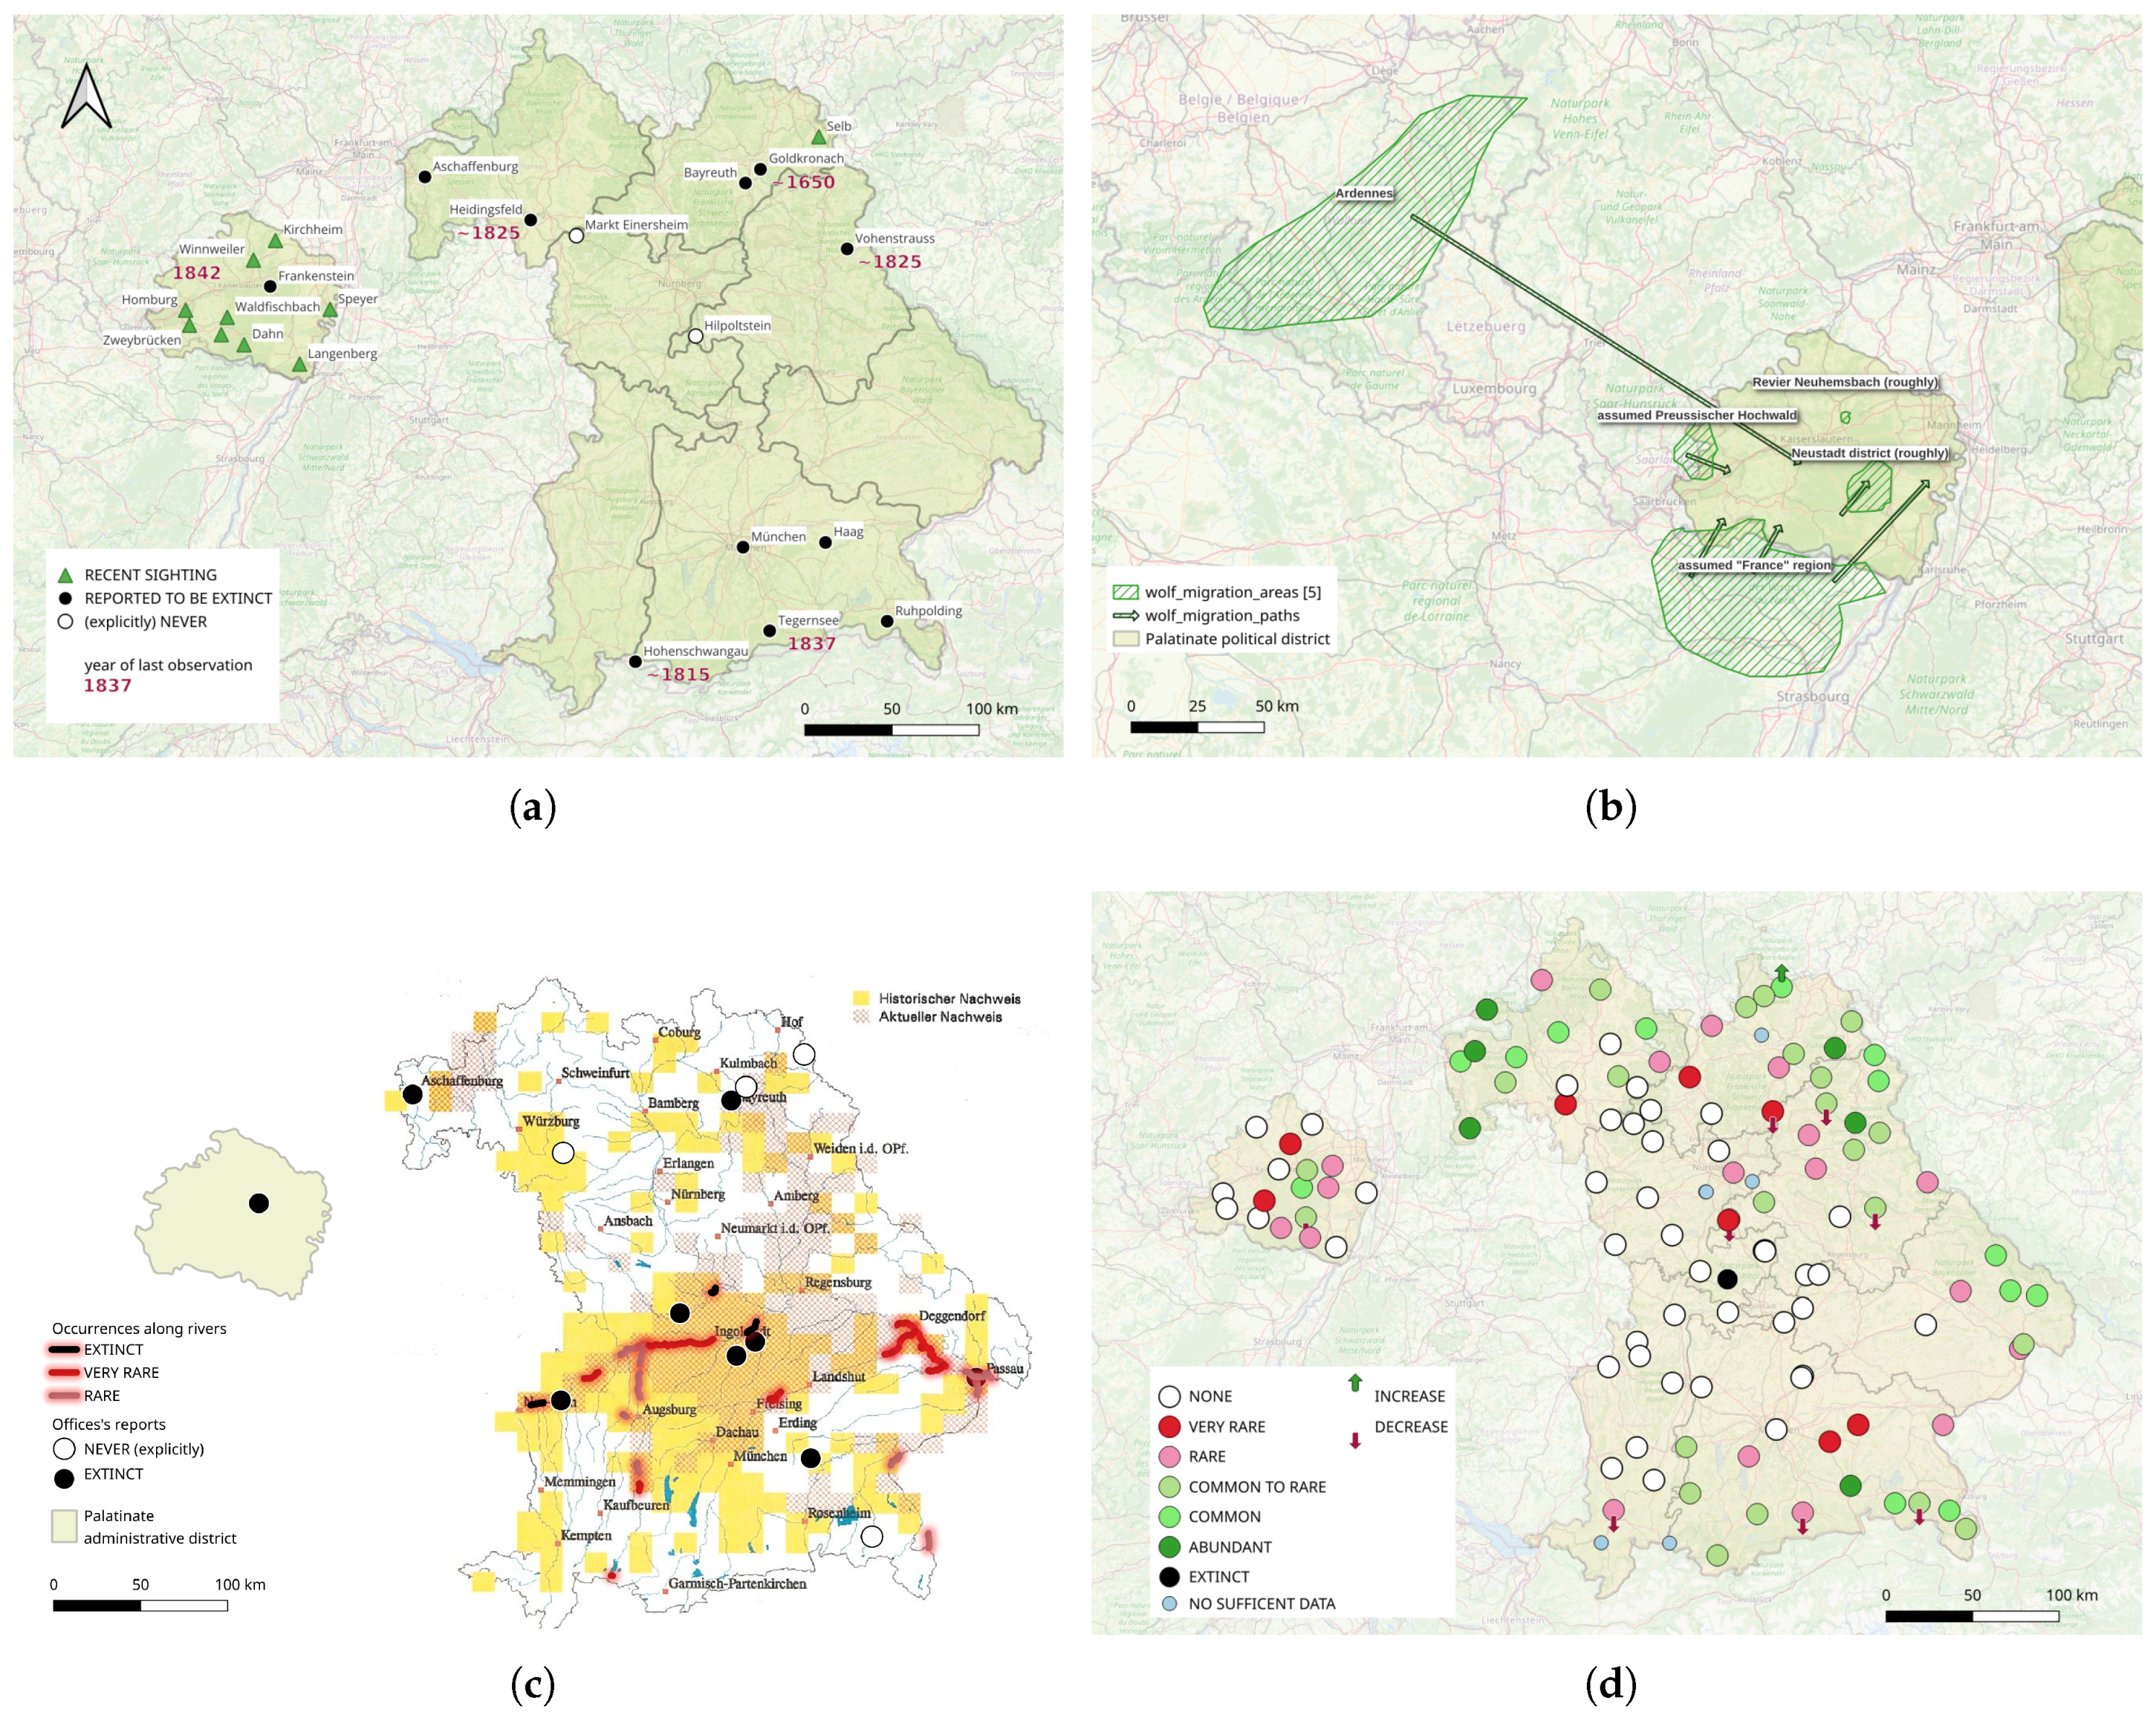
Table 1.
Area, woodland share, and population of the Bavarian governmental districts in 1845 as well as some key figures from the dataset. Note that the Salforste are not governmental districts and area or population data is not available.
Table 1.
Area, woodland share, and population of the Bavarian governmental districts in 1845 as well as some key figures from the dataset. Note that the Salforste are not governmental districts and area or population data is not available.
| Total | Woodland | Population | Species | ||||||
|---|---|---|---|---|---|---|---|---|---|
| District | area | area | share | private | capita | density | count | average | extra |
| Upper Bavaria | 17,143.4 | 5,990.4 | 34.9% | 46.0% | 694,344 | 40.5 | 38 | 21.5 | 16 |
| Lower Bavaria | 10,700.4 | 3,746.6 | 35.0% | 72.9% | 535,499 | 50.0 | 37 | 17.0 | 26 |
| Upper Palatinate | 9,610.5 | 3,000.7 | 31.2% | 40.0% | 463,187 | 48.2 | 33 | 18.8 | 68 |
| Upper Franconia | 7,010.5 | 1,691.7 | 24.1% | 29.5% | 496,783 | 70.9 | 35 | 17.9 | 14 |
| Middle Franconia | 7,581.3 | 2,540.0 | 33.5% | 44.0% | 518,478 | 68.4 | 34 | 17.1 | 9 |
| Lower Franconia | 9,333.0 | 3,048.6 | 32.7% | 8.6% | 587,887 | 63.0 | 37 | 20.8 | 12 |
| Swabia | 9,575.8 | 2,420.0 | 25.3% | 36.8% | 548,956 | 57.3 | 40 | 20.6 | 38 |
| Palatinate | 5,815.4 | 2,122.7 | 36.5% | 5.8% | 595,193 | 102.3 | 34 | 17.9 | 4 |
| Salforste | n/a | n/a | n/a | n/a | n/a | n/a | 35 | 23.7 | 13 |
In km². One Bavarian mile was 7,419.5 meters in 1845 ([23], 253). Of total area (SD=4.6). Percentage of woodland area in private property (SD=21.5). Number of species (out of 44) present within the governmental district. e Mean average number of species (out of 44) present within the forestry offices of the governmental district. Number of additional species reported to be present. Source: [15], 18–19 and own analysis of AOD1845.
Table 2.
Sample textual entries and their annotations and classifications.
| ID | Text | Habitat Descriptors | Toponyms | Human-Nature | Quantifiers | Population Development |
|---|---|---|---|---|---|---|
| Inferred Classification | Inferred Classification | |||||
| E_00005 | [The otter:] In all relevant rivers and creeks, but is also becoming increasingly rare. More are caught or shot in and near the creeks of the Bavarian Forest where they come from the Danube than on the larger rivers. | ’rivers’; ’creeks’ | ’Bavarian Forest’; ’Danube’ | ’caught’; ’shot’ | ’in all’ | ’becoming increasingly rare’ |
| COMMON TO RARE | DECREASING | |||||
| E_00047 | [The Beach marten is] very common in barns and buildings in all localities, also in dense young forests. Lives under walls and in hollow trees. | ’barns’; ’buildings’; ’dense young forests’; ’walls’; ’hollow trees’ | — | — | ’very common’ | — |
| ABUNDANT | — | |||||
| E_00147 | [The Roe deer is] still everywhere in the forests, but is quite diminished by unfavourable weather conditions, especially during the winter of 1844/45. | ’forests’ | — | — | ’still everywhere’ | ’quite diminished’ |
| COMMON | DECREASING | |||||
| E_00930 | On the south-western border of the forest district, starting at the Linglmühle mill as far as Loma, into the Pfreimd river outwards to the Pfrentschweiher pond, and from Loma to the Bohemian border in Zottbach, the otter seeks its food and residence. | ’river’; ’pond’ | ’Linglmühle’; ’Loma’; ’Pfreimd’; ’Pfrentsch- weiher’; ’Zottbach’ | — | — | — |
| COMMON | — | |||||
| E_00968 | Since the desolation of several ponds, especially the draining of the Pfrentschweiher, the ducks are very few, and rarely come to the few small ponds during the mating season. | ’ponds’; ’small ponds’ | ’Pfrentsch-weiher’ | ’draining’ | ’very few’; ’rarely’ | — |
| RARE | — |
Table 4.
Classification of the frequency of occurrences of selected species: Eurasian beaver, Western capercaillie, Eurasian otter, Roe deer.
Table 4.
Classification of the frequency of occurrences of selected species: Eurasian beaver, Western capercaillie, Eurasian otter, Roe deer.
| Number of reporting offices | Eurasian beaver | Western capercaillie | Eurasian otter | Roe deer |
|---|---|---|---|---|
| ABSENT | 94 | 44 | 2 | 1 |
| EXTINCT | 9 | 1 | 0 | 0 |
| VERY RARE | 12 | 8 | 17 | 1 |
| RARE | 3 | 18 | 42 | 11 |
| COMMON TO RARE | 1 | 23 | 24 | 28 |
| COMMON | 0 | 13 | 18 | 42 |
| ABUNDANT | 0 | 6 | 3 | 36 |
| NOT QUANTIFIABLE | 0 | 6 | 13 | 0 |
| TOTAL | 119 | 119 | 119 | 119 |
An occurrence of this is reported, but the report does not contain (enough) information to quantify its presence.
Disclaimer/Publisher’s Note: The statements, opinions and data contained in all publications are solely those of the individual author(s) and contributor(s) and not of MDPI and/or the editor(s). MDPI and/or the editor(s) disclaim responsibility for any injury to people or property resulting from any ideas, methods, instructions or products referred to in the content. |
© 2025 by the authors. Licensee MDPI, Basel, Switzerland. This article is an open access article distributed under the terms and conditions of the Creative Commons Attribution (CC BY) license (http://creativecommons.org/licenses/by/4.0/).
Copyright: This open access article is published under a Creative Commons CC BY 4.0 license, which permit the free download, distribution, and reuse, provided that the author and preprint are cited in any reuse.


