
Submitted:
19 March 2025
Posted:
19 March 2025
You are already at the latest version
Abstract
The substantial presence of nitrogen oxides (NO and NO2) in outdoor environments detrimentally impacts natural ecosystems and exerts significant influence on urban climates. Conventional NOx treatment methods frequently suffer from challenges such as harsh reaction conditions and high energy consumption. Consequently, the development of advanced photocatalytic systems to efficiently degrade NOx while minimizing the formation of toxic byproducts represents a critical challenge in environmental catalysis. In this study, a novel ternary composite material (5% Mo-CN/InP-NBOC) was constructed via hydrothermal synthesis and surface modification strategies, achieving 42% NO oxidation efficiency under visible light irradiation with a mere 0.9% NO2 generation rate. This performance demonstrates efficient photocatalytic NO oxidation while effectively suppressing NO2 production. Systematic characterization techniques, including XRD, TEM, and XPS, confirmed the successful integration of InP quantum dots (5–10 nm) and amorphous Mo-CN onto NBOC nanosheets, forming an intimate heterojunction structure. PL and ESR analyses revealed that Mo-CN enhances charge carrier separation and governs the NO oxidation process through the activation of dual free radical pathways (•O2⁻ and •OH). This work establishes a "quantum dot-primary catalyst-cocatalyst" ternary collaborative design paradigm, providing experimental evidence and theoretical models to address the challenges of synergistic optimization among activity, selectivity, and stability in photocatalytic NOx treatment.
Keywords:
Photocatalysis
; Bi2O2CO3
; Amorphous g-C3N4
; InP quantum dots
; interface
; Catalytic oxidation of NO
1. Introduction
Nitrogen oxides (NOx) represent one of the primary sources of atmospheric pollution, with their toxic derivatives (such as NO2 and nitrate particles) posing significant threats to human health and ecological systems [1,2,3,4,5]. Photocatalytic technology has emerged as an effective approach for NOx mitigation due to its environmentally friendly and highly efficient characteristics [6,7,8,9]. However, conventional photocatalytic materials (e.g., TiO2) remain constrained by wide bandgaps and low visible light utilization efficiency, coupled with the persistent issue of high NO2 byproduct generation rates [10,11,12,13,14,15,16]. Recent advancements in the development of narrow-bandgap semiconductors (e.g., bismuth-based materials) coupled with quantum dot-based composite photocatalytic systems have opened new avenues to overcome these limitations [17,18]. Bi2O2CO3 (BOC), as a layered bismuth-based semiconductor, has attracted considerable attention owing to its unique optical properties and chemical stability, though its practical application is restricted by a limited visible light response range [19,20,21,22,23]. Conversely, indium phosphide (InP) quantum dots exhibit excellent light absorption capacity but suffer from insufficient catalytic stability due to their propensity for surface oxidation [24,25,26]. Current research focuses on addressing the central challenge of enhancing photogenerated charge carrier separation efficiency while suppressing byproduct formation through material composite engineering and modification strategies.
For the efficient photocatalytic removal of NOx, significant advancements in material design and mechanistic understanding have been achieved by researchers worldwide. In the field of bismuth-based materials, nitrogen-doped Bi2O2CO3 (NBOC) demonstrates reduced bandgap and extended light-responsive range through nitrogen incorporation [27,28,29]. Meanwhile, InP quantum dots, characterized by their narrow bandgap (~1.35 eV), have been extensively employed in photocatalytic systems. Their integration with wide-bandgap semiconductors (e.g., InP/TiO2 hybrids) significantly enhances visible light absorption [30,31,32,33]. Nevertheless, the inherent drawback of rapid charge carrier recombination persists in single-component systems. Recent studies highlight graphitic carbon nitride (g-C3N4) as a stable cocatalyst with tunable electronic structures. Particularly, Mo-doped g-C3N4 (Mo-CN) exhibits enhanced interfacial charge transfer efficiency through metal-nonmetal synergistic interactions [34,35]. However, critical issues such as active site coverage and limited capability in byproduct suppression within composite systems remain to be thoroughly investigated.
Simultaneously, the four primary technical challenges confronting contemporary photocatalytic NO oxidation systems have emerged as critical bottlenecks hindering their technological advancement: (1) Insufficient optimization of visible light absorption range and charge carrier separation efficiency in composite materials; (2) Inadequate interfacial contact between quantum dots and host materials, potentially impeding electron transfer; (3) Lack of effective modulation mechanisms for NO2 byproduct generation pathways, compromising practical application safety; (4) Persistent technical bottlenecks regarding the stability and reproducible fabrication of multi-component composites [36].
This study employed a hydrothermal synthesis method to construct InP-NBOC nanosheets, followed by loading Mo-CN at varying mass ratios (1–10%). The material's structure and surface chemical states were systematically characterized using transmission electron microscopy (TEM), X-ray diffraction (XRD), and X-ray photoelectron spectroscopy (XPS). Under visible light irradiation (λ > 430 nm), the composite materials were evaluated for their NO oxidation efficiency and NO2 generation rates, revealing an optimal Mo-CN loading ratio of 5% (achieving 42% NO oxidation efficiency and 0.9% NO2 generation rate). Complementary analyses involving ultraviolet-visible absorption spectroscopy (UV-vis), photoluminescence spectroscopy (PL), and electron paramagnetic resonance (ESR) elucidated the charge carrier transfer pathways and reactive oxygen species (ROS) generation mechanisms. Experimental results demonstrate that synergistic contributions from •O2− and •OH dominate the NO oxidation process, while Mo-CN’s electron migration capability effectively suppresses secondary NO2 conversion. This work pioneers the ternary integration of InP quantum dots, NBOC, and Mo-CN, offering both theoretical and technical insights for the multifunctional design of photocatalytic materials.
2. Results and discussion
2.1 Photocatalytic performance analysis
We conducted photocatalytic oxidation NO tests on the prepared composite materials. Figure 1(a) shows the photocatalytic oxidation NO activity of each sample under visible light conditions. The InP-NBOC sample exhibited an NO oxidation rate of approximately 30%, attributed to the enhanced visible light absorption facilitated by InP quantum dots on NBOC. After introducing Mo-CN into InP-NBOC, the catalytic activity of the composite improved significantly. The 1% Mo-CN/InP-NBOC and 3% Mo-CN/InP-NBOC samples achieved NO oxidation rates of around 40%. With increasing Mo-CN mass ratios, the 5% Mo-CN/InP-NBOC sample demonstrated optimal photocatalytic activity, reaching an NO oxidation rate of 42%. However, further increasing the Mo-CN mass ratio led to a slight decline in the photocatalytic NO oxidation rate, with the NO oxidation rate dropping to 39%. This reduction may result from excessive Mo-CN coverage of active sites on InP-NBOC, thereby diminishing catalytic performance. Nonetheless, all Mo-CN/InP-NBOC composites with varying mass ratios exhibited enhanced photocatalytic NO oxidation activity compared to pure InP-NBOC. Combined with previous research in earlier chapters, the synergistic interaction between Mo-CN and InP-NBOC proves beneficial for catalytic enhancement.
On the other hand, Mo-CN substantially suppressed NO2 generation in InP-NBOC. Figure 1(b) displays the photocatalytic NO2 generation profiles of the composites under visible light. The NO2 generation rate of InP-NBOC reached 5.8% at 30 min, indicating poor intrinsic NO2 suppression capability. However, introducing Mo-CN revealed a clear trend: the 1% Mo-CN/InP-NBOC, 3% Mo-CN/InP-NBOC, and 5% Mo-CN/InP-NBOC samples exhibited NO2 generation rates of 7%, 3%, and 0.9% at 30 min, respectively. Remarkably, the 10% Mo-CN/InP-NBOC sample showed a near-zero NO2 generation rate. These results demonstrate that increasing the Mo-CN mass ratio significantly enhances the composite’s ability to inhibit NO2 production. The photocatalytic NO oxidation tests confirm that Mo-CN not only improves the NO oxidation activity of InP-NBOC but also effectively suppresses the formation of the toxic byproduct NO2.
In addition to testing the NO oxidation of samples with different ratios, we also compared the photocatalytic activity of Mo-CN/InP-NBOC with other samples. Figure 2(a) shows the NO oxidation of various reference samples under visible light. The photocatalytic NO oxidation rates of the NBOC, InP-NBOC, Mo-CN-NBOC, and 5% Mo-CN/InP-NBOC samples are 13%, 28%, 35%, and 42%, respectively. This indicates that 5% Mo-CN/InP-NBOC exhibits superior NO oxidation activity compared to other reference samples. Figure 2(b) shows the NO₂ generation of various reference samples under visible light. The photocatalytic NO₂ generation rates of the NBOC, InP-NBOC, and Mo-CN-NBOC samples at 30 min are 5.8%, 4%, and 3.5%, respectively. Notably, the NO₂ generation rate of the 5% Mo-CN/InP-NBOC sample is only 0.9%, demonstrating that the 5% Mo-CN/InP-NBOC sample achieves optimal performance in both photocatalytic NO oxidation and NO₂ suppression. However, unfortunately, the introduction of Mo-CN did not stabilize the catalytic activity of the Mo-CN/InP-NBOC system, which may be due to changes in InP.
2.2 Phase analysis
The phase composition of the composite samples was analyzed via XRD. Figure 3 presents the XRD patterns of the samples. The diffraction peaks of InP-NBOC and the 5% Mo-CN/InP-NBOC composite align well with the standard reference card for bismuth oxycarbonate (PDF: 41-1488). Compared to InP-NBOC, the XRD peaks of the 5% Mo-CN/InP-NBOC sample show no significant shifts or broadening, indicating that the introduction of Mo-CN neither induces structural distortion in the InP-NBOC crystalline framework nor alters its crystallinity. The peak profiles exhibit no substantial modifications between the two samples, and the relative intensities of the diffraction peaks remain largely consistent, suggesting no preferential growth along specific crystal planes. Additionally, no new diffraction peaks emerge in the 5% Mo-CN/InP-NBOC pattern, as Mo-CN exists in an amorphous state with disrupted crystallinity, rendering its characteristic peaks undetectable in XRD. These observations collectively confirm that Mo-CN is uniformly loaded on the surface of InP-NBOC without significantly affecting its crystalline structure.
2.3. Optical property analysis
Figure 4(a) shows the UV-visible absorption spectra of the samples. InP-NBOC exhibits light absorption in the wavelength range of 350-550 nm, primarily due to the strong light absorption capability of the prepared InP quantum dots in this range, which enhances the absorption of NBOC material at these wavelengths. The introduction of Mo-CN induces noticeable absorption tailing in InP-NBOC, enabling the Mo-CN/InP-NBOC composite to absorb visible light within the 400-800 nm wavelength range. This indicates that Mo-CN strongly interacts with the composite, effectively broadening the light absorption range of InP-NBOC and further enhancing its NO oxidation activity under visible light.
Figure 4(b) displays the PL spectra of the samples. The InP-NBOC sample shows distinct fluorescence emission peaks in the 340-500 nm wavelength range. Upon introducing Mo-CN, the fluorescence emission intensity of InP-NBOC gradually decreases with increasing mass ratios of added Mo-CN. This demonstrates that Mo-CN reduces electron-hole recombination in the composite, promoting charge carrier migration and enabling more carriers to participate in surface reactions. Based on these characterizations, we conclude that the incorporation of Mo-CN improves the optical properties of InP-NBOC, likely facilitating the photocatalytic NO oxidation process.
2.4 Morphology analysis
Figure 5(a) shows the TEM image of the 5% Mo-CN/InP-NBOC sample, revealing that 5% Mo-CN/BOC consists of numerous lamellar nanosheets stacked in various orientations and angles. This intergrown morphology facilitates comprehensive utilization of light energy during irradiation. The nanosheets range in size from 100 to 200 nm. Lattice fringes observable in the central region of Figure 5(a) likely correspond to NBOC within the composite. On these thin nanosheets, uniformly distributed dark spots with sub-nanometer diameters are visible, which are hypothesized to be InP quantum dots uniformly dispersed on the nanosheets. This conjecture is further verified by HRTEM analysis.
Figure 5(b) presents the HRTEM image of 5% Mo-CN/InP-NBOC, confirming the presence of InP quantum dots in the composite. Nanosheets exhibiting lattice fringes are measured to belong to the (013) crystal plane of NBOC, with a lattice spacing of d = 0.291 nm. InP quantum dots with diameters of 5 – 10 nm are uniformly distributed on the NBOC nanosheets, confirming their successful incorporation and homogeneous dispersion on the NBOC surface.
Figure 5(c) provides clearer evidence of material distribution on the nanosheets. The lattice fringes in the upper-right region, measured as d = 0.291 nm, correspond to the (013) plane of NBOC. InP quantum dots are observed on the NBOC surface, indicating strong interfacial contact between NBOC and InP quantum dots, which facilitates material interactions. Additionally, distinct morphological and contrast features differentiate NBOC from other components. The nanosheets lacking lattice fringes (upper region) exhibit characteristic amorphous features, assigned to the introduced Mo-CN. Notably, InP quantum dots are distributed on the Mo-CN surface, indicating dual interactions between InP, NBOC, and Mo-CN, thereby enhancing interfacial synergy.
Figure 5(d) provides clearer observation of material integration. In the image, NBOC nanosheets are interstacked, with their lattice fringes calibrated to reveal a lattice spacing of d = 0.251 nm, corresponding to the (112) crystal plane of NBOC. The edges of these NBOC nanosheets overlap and interface with Mo-CN, where InP quantum dots are distributed at their overlapping junctions. This demonstrates that in the 5% Mo-CN/InP-NBOC composite, NBOC, InP quantum dots, and Mo-CN mutually contact and form intimate interconnections. Both InP quantum dots and Mo-CN are successfully integrated into the NBOC nanosheets, a conclusion further supported by the EDS mapping in Figure 5(e).
The EDS mapping highlights the test sample’s central region, where Bi and O elements exhibit dense distribution patterns closely overlapping with the sample’s physical outline, confirming NBOC as the primary component. Concurrently, C and N elements are distributed in regions adjacent to NBOC, while Mo is uniformly dispersed across the entire map, consistent with the uniform surface distribution of Mo in Mo-CN. Distinct P and In signals are also observed, displaying even distributions that corroborate the homogeneous dispersion of InP quantum dots within the nanosheets, aligning with prior analyses.
Collectively, these data confirm the successful incorporation of InP quantum dots and Mo-CN into NBOC without inducing significant morphological alterations. The uniform distribution of these components, including intimate contact between NBOC, Mo-CN, and InP quantum dots, facilitates synergistic material interactions.
2.5 Surface chemical state analysis
Surface chemical states and elemental valence transitions of the samples were investigated through XPS testing. Figure 6(a) presents the Bi 4f high-resolution spectra of the samples. For InP-NBOC, two fitted peaks are located at 164.6 eV and 159.3 eV, with a peak separation of 5.3 eV, corresponding to the characteristic Bi³⁺ states Bi 4f5/2and Bi 4f7/2 [37,38,39]. In the Mo-CN/InP-NBOC sample, both peaks shift toward higher binding energies by 0.1 eV, indicating an increased electron density of Bi in the composite. This phenomenon arises from electronic redistribution caused by interactions between Mo-CN and InP-NBOC during material hybridization. Figure 6(b) displays the O 1s high-resolution spectra of the samples. For InP-NBOC, the O 1s peak is resolved into two components at 531.3 eV and 530.3 eV, attributed to C-O bonds and Bi-O bonds in BOC, respectively [37]. For Mo-CN/InP-NBOC, both peaks shift to lower binding energies at 531.1 eV and 530.1 eV, signifying interfacial interactions between Mo-CN and InP-NBOC. These interactions induce an electron-gaining tendency in oxygen atoms of InP-NBOC, altering their electronic configuration.
Figure 6(c) shows the P 2p high-resolution spectra of the samples. For InP-NBOC, the P element exhibits a peak at a binding energy of 133.3 eV, predominantly attributed to oxidized phosphorus species [40,41]. This indicates the tendency of InP-NBOC surfaces to form phosphorus oxides, leading to instability in catalytic performance. Upon introducing Mo-CN, the P 2p peak in Mo-CN/InP-NBOC shifts by 0.1 eV toward higher binding energy, suggesting an electron-deficient state for phosphorus. Figure 6(d) displays the In 3d high-resolution spectra. In InP-NBOC, the In 3d peak is observed at 452.9 eV, corresponding to the spin-orbit split component of the In 3d3/2 orbital [40,42]. In Mo-CN/InP-NBOC, this peak shifts by 0.1 eV to lower binding energy, indicating an electron-rich state for In after Mo-CN incorporation. These observations confirm the presence of InP quantum dots in the composite, with Mo-CN modulating the electronic configuration of InP-NBOC.
Figure 6(e) presents the C 1s high-resolution spectra used for charge calibration. In InP-NBOC, the peak at 286.0 eV is assigned to surface-adsorbed contaminant carbon [43], while the peak at 289.1 eV corresponds to C-O bonds in the carbonate groups of BOC [37]. For Mo-CN/InP-NBOC, the peak at 285.8 eV arises from surface-adsorbed carbon [43]. Due to material hybridization, another C 1s peak shifts by 0.1 eV to higher binding energy (289.2 eV), originating from overlapping contributions of the carbonate groups in BOC and the sp2 hybridized carbon (N-C=N) in the heptazine rings of CN [37,44]. Figure 6(f) illustrates the N 1s spectra. In InP-NBOC, a peak at 400.3 eV is attributed to surface nitrogen species introduced by residual CTAB during synthesis [37]. For Mo-CN/InP-NBOC, the peak at 398.5 eV corresponds to sp2 hybridized nitrogen (C=N-C) [44,45].
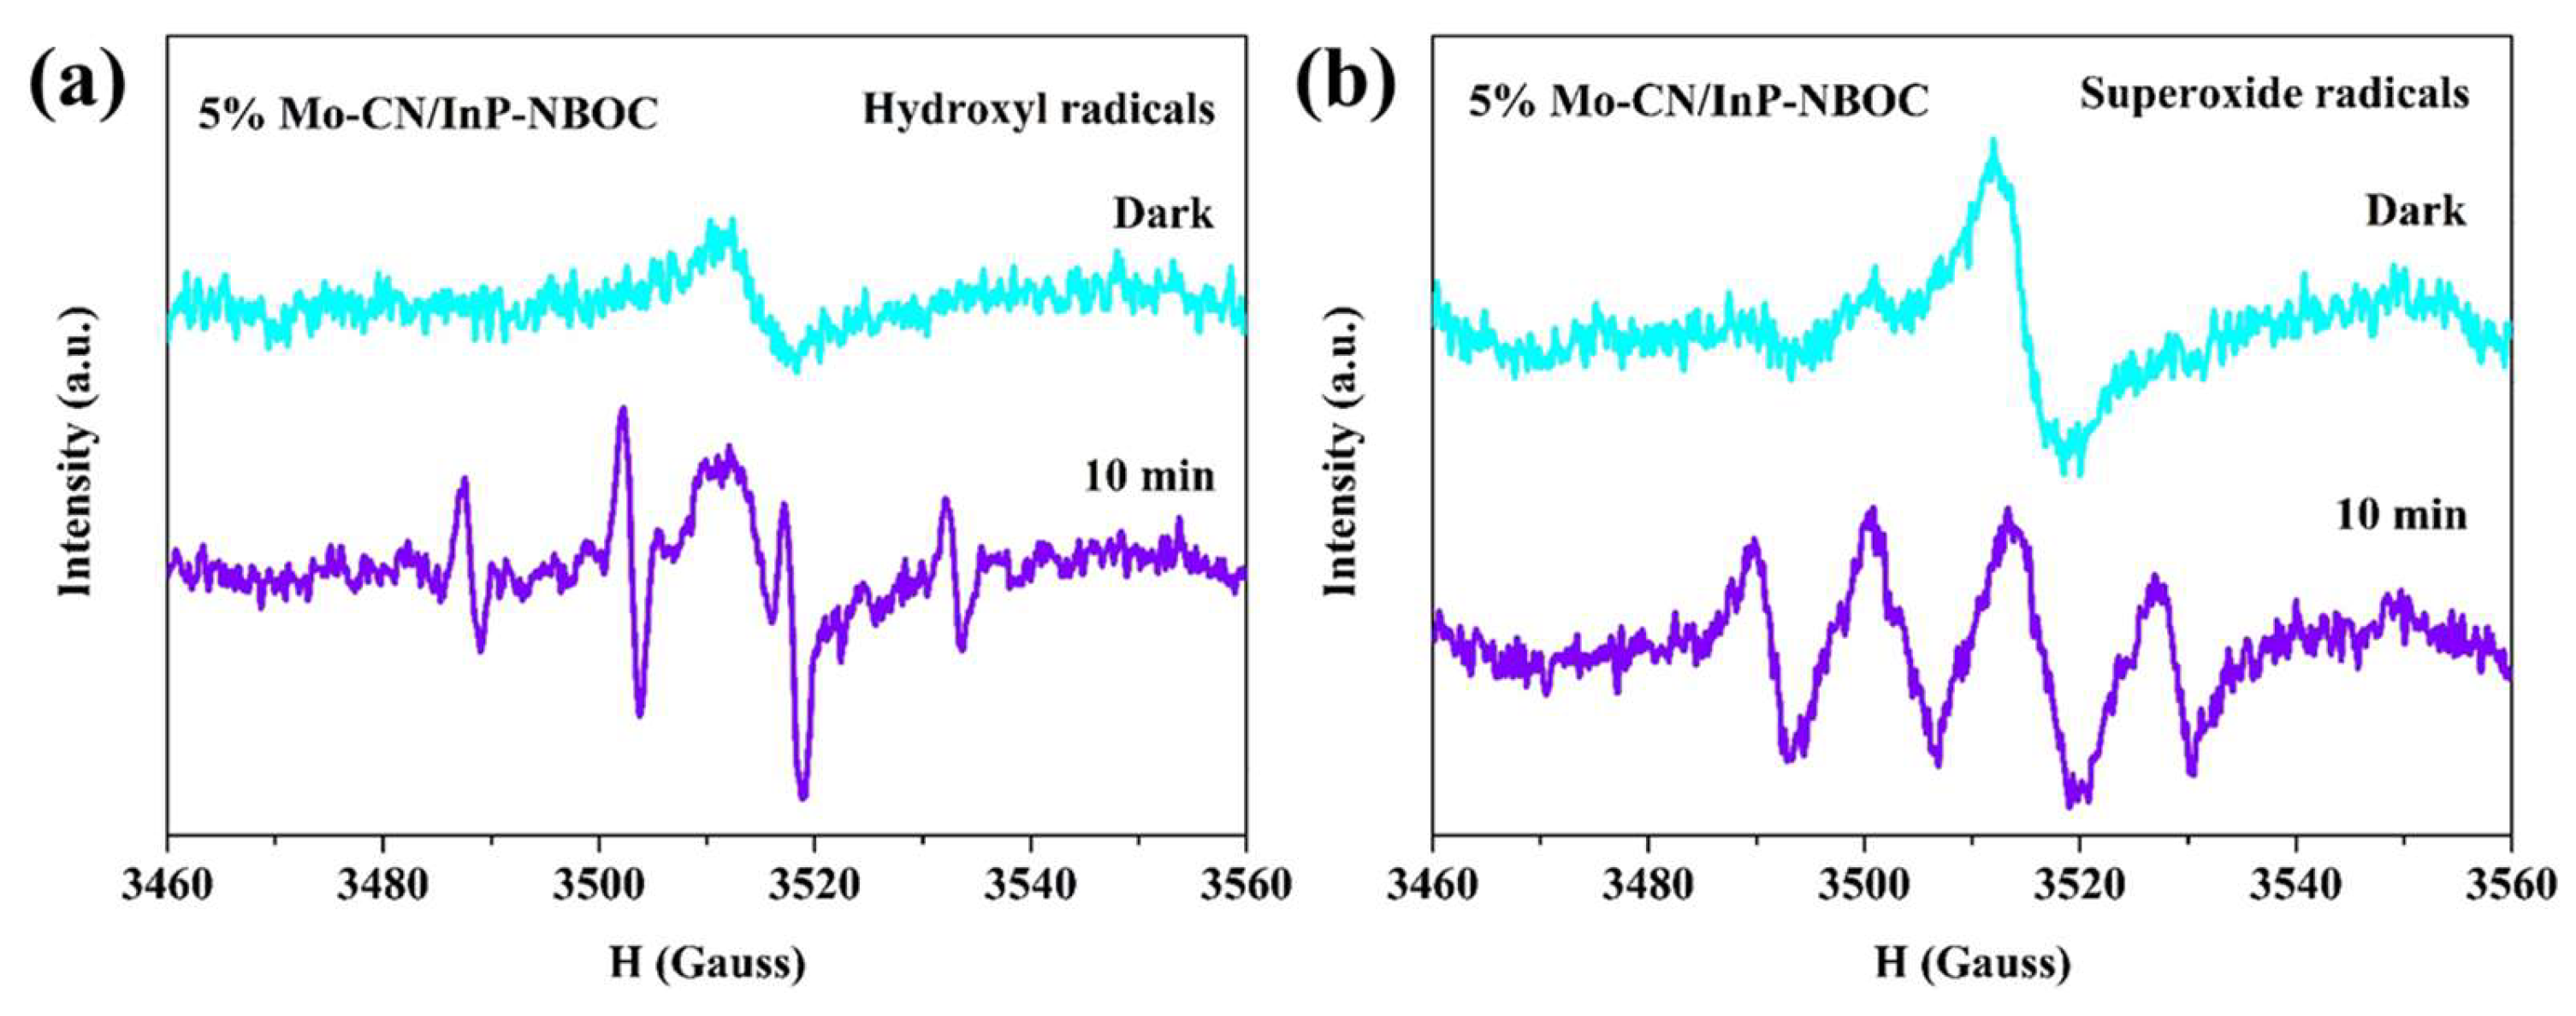
The 5% Mo-CN/InP-NBOC exhibits exceptional photocatalytic NO oxidation activity and NO2 suppression capability, prompting further investigation into its reactive species. Under visible light irradiation, DMPO was employed as a trapping agent for hydroxyl radicals (•OH) and superoxide radicals (•O2-). As shown in Figure 7, under dark conditions, two consecutive tests of 5% Mo-CN/InP-NBOC reveal a symmetric characteristic peak. This arises from the strong paramagnetism of Mo-CN in the composite, where carbon atoms in Mo-CN contain unpaired electrons [46,47], consistent with prior findings. After 10 minutes of illumination, distinct radical signals emerge in Figure 7(a). Despite potential interference from Mo-CN’s signal on the peak profile, the intensity ratio approximates 1:2:2:1, indicative of •OH generation. In Figure 7(b), the peak intensity ratio of 1:1:1:1 signifies •O₂⁻ formation. Thus, both •OH and •O₂⁻ are generated by 5% Mo-CN/InP-NBOC during photocatalytic NO oxidation, synergistically promoting NO conversion while effectively suppressing NO2 formation. Based on the above analysis, potential reaction pathways for photocatalytic NO oxidation are proposed (Equations 1-6).
3. Experiment
3.1 Materials
Chemicals and experimental equipment are listed in the Supplementary Material (Tables S1 and S2).
3.1.1 Synthesis of Mo-CN
0.56 g of ammonium molybdate was weighed and thoroughly mixed with 40 mL of ultrapure water under stirring. Subsequently, 10 g of melamine was added to the suspension, which was magnetically stirred at room temperature for 6 h. The mixture was then heated in a water bath at 90°C until completely dried. The dried solid was calcined in a tubular furnace. The cooled product was collected and labeled as Mo-CN.
3.1.2 Synthesis of InP-NBOC
400 mg of N-Bi₂O₂CO₃ (NBOC) was weighed into a beaker and uniformly dispersed in 40 mL of ultrapure water. Based on the concentration of the InP quantum dots, 8 mg of InP quantum dot solution was precisely transferred into the beaker using a micropipette. The mass ratio of InP quantum dots to NBOC was maintained at 2%, and unless otherwise specified, all references to "InP-NBOC" in this study denote the 2% InP-NBOC composite. The mixture was ultrasonicated for 30 min, followed by continuous stirring on a magnetic plate for 5 h. The suspension was then centrifuged to collect the precipitate, which was sequentially washed twice with ultrapure water and ethanol via centrifugation. The final product was dried at 60 °C.
3.1.3 Synthesis of Mo-CN/InP-NBOC Composite
400 mg of InP-NBOC was weighed into a beaker and uniformly dispersed in 40 mL of ultrapure water. Mo-CN was then added to the catalyst suspension according to the specified mass ratios between Mo-CN and InP-NBOC. The resultant suspension was ultrasonicated for 10 min and continuously stirred on a magnetic plate for 5 h. The mixture was centrifuged, and the precipitate was sequentially washed twice with ultrapure water and ethanol via centrifugation. The washed product was dried at 60°C, and the final composite was labeled as Mo-CN/InP-NBOC.
3.2 Catalytic Performance Experiment
The NO gas used in the photocatalytic test was pre-diluted and equilibrated with N₂ to a concentration of 100 ppm. During the test, air was continuously introduced into the reactor to further dilute the NO concentration to the ppb level. The air and NO flow rates were set to 2.0 L min⁻¹ and 10.9 mL min⁻¹, respectively. After parameter configuration, the initial NO concentration in the sealed reactor was 600 ppb, and the light intensity was maintained at 35 mW/cm². Prior to the photocatalytic experiment, two identical petri dishes (12 cm in diameter) were loaded with 100 mg of photocatalyst each and placed in the reactor, which was sealed to isolate external air interference. The concentrations of NO, NO₂, and NOx were monitored in real time using a nitrogen oxide analyzer (Thermo Scientific 42i-TL). The NO removal efficiency (η, %) and NO₂ generation rate (ω, %) were calculated using the following equations:
where C represents the real-time NO concentration during the reaction, C0 denotes the initial NO concentration before illumination, NOx is the total concentration of nitrogen oxides (NO₂ and NO), and NOx0 is the initial NO₂ concentration.
3.3 Material characterization
In this study, Cu was used as the target material for XRD analysis, with the instrument operated at 40 kV and 40 mA. UV-vis tests were performed using a Shimadzu spectrophotometer to analyze the optical properties of the materials, with BaSO4 as the standard reference sample. PL measurements were conducted using a Hitachi F-7000 FL spectrophotometer. TEM analysis was employed to obtain material morphology and lattice information, facilitating the characterization of nanomaterials or quantum dot materials. TEM testing was carried out using a TF20 and JEOL 2100F microscope at 200 kV. XPS analysis was performed on a Thermao Scientific ESCALAB 250 Xi instrument. To eliminate interference from surface contaminants, all XPS spectra were calibrated by referencing the C 1s peak. ESR testing, based on the paramagnetic property arising from molecular permanent magnetic moments, was utilized to detect material defects and active species generation. ESR measurements were conducted on a JESFA200 spectrometer.
3.4 Electrochemical Testing
Electrochemical testing enables the observation of material impedance and optoelectronic properties, thereby elucidating the effects of modification methods on the impedance and optoelectronic characteristics of catalytic materials. A CHI660E electrochemical workstation coupled with a light-switching device was employed for the measurements. A 0.5 mol/L Na₂SO₄ solution served as the electrolyte, with a Pt electrode as the counter electrode and a saturated calomel electrode (SCE) as the reference electrode. Fluorine-doped tin oxide (FTO) conductive glass (1 cm × 2 cm) was used as the working electrode. Prior to fabrication, the resistance of each FTO substrate was verified using a multimeter to ensure functionality.
For the catalytic material slurry, 3 drops of N,N-dimethylformamide (DMF) were added to a mortar as a binder between the sample and FTO, followed by approximately 30 mg of the prepared sample, and continuously ground to form a homogeneous slurry. The slurry preparation was conducted swiftly to prevent binder evaporation during grinding. The slurry was evenly spread onto the FTO substrate using a spatula, and the process was repeated to prepare multiple electrodes.
The fabricated working electrodes were dried at room temperature for 24 hours and subsequently subjected to annealing treatment to enhance sample adhesion to the FTO substrate, preventing detachment during electrochemical testing. The testing area of the working electrode was fixed at 1 cm × 1 cm. A xenon lamp (PLS-SXE300/UV, Beijing Perfect Light Technology Co., Ltd.) served as the light source for electrochemical measurements. To avoid light-induced alterations to the material’s properties, electrochemical impedance spectroscopy (EIS) was first measured under dark conditions, followed by measurements under visible light illumination.
4. Summary
In the work of this chapter, we synthesized a high-performance Mo-CN/InP-NBOC composite. This material addresses the limitations observed in prior studies: first, the introduction of low-toxicity InP quantum dots enhances the composite's visible light absorption, enabling more efficient utilization of light energy; second, the incorporated Mo-CN significantly strengthens the material’s ability to suppress NO2 generation. Experimental results demonstrate that as the mass ratio of Mo-CN to InP-NBOC increases, the composite’s NO2 production gradually decreases. Notably, the 5% Mo-CN/InP-NBOC sample achieves a 42% NO oxidation rate under visible light irradiation, with an extremely low NO2 generation rate of 0.9%, effectively enabling highly efficient photocatalytic NO oxidation while minimizing toxic byproduct formation.
Supplementary Materials
The following supporting information can be downloaded at the website of this paper posted on Preprints.org.
Author Contributions
Conceptualization, Zeai Huang; methodology, Yi He and Xiao Tang; formal analysis, Yi He and Xiao Tang; resources, Jundao Wu; writing—original draft preparation, Yi He and Fan Zhang; writing—review and editing, Zeai Huang and Wei Hu; supervision, Zeai Huang, Rustem Zairov and Zhichen Pan; project administration, Rustem Zairov and Zeai Huang; funding acquisition, Rustem Zairov and Zeai Huang. All authors have read, reviewed and involved in revision and agreed to the published version of the manuscript.
Funding
This work has been supported by Kazan Federal University Strategic Academic Leadership Program (PRIORITY-2030) and Key Research and Development Program of Sichuan Province (2023ZDZX0005). R.Z. grateful to Ministry of Science and Technology of China Talented Young Scientist Program(P24U51004).
Data Availability Statement
The data presented in this study are available upon request from the corresponding author.
Conflicts of Interest
The authors declare no conflicts of interest.
References
- Zhang, J.; Wei, Y.; Fang, Z. Frontiers in Immunology 2019, 10.
- Li, X.; Lin, J.; Li, L.; Huang, Y.; Pan, X.; Collins, S.E.; Ren, Y.; Su, Y.; Kang, L.; Liu, X.; Zhou, Y.; Wang, H.; Wang, A.; Qiao, B.; Wang, X.; Zhang, T. Angewandte Chemie International Edition 2020, 59, 19983–19989.
- Chen, P.; Ma, W.; He, W.; Liao, J.; Xia, Q.; Jiang, A.; Ma, Y.; Ai, W.; Wang, Y.; Zhang, W. Journal of Catalysis 2024, 434, 115538.
- Tang, Y.; Cui, W.; Wang, S.; Dong, F. Journal of Hazardous Materials 2024, 465, 133323.
- Li, H.; Zhu, H.; Shi, Y.; Shang, H.; Zhang, L.; Wang, J.; Science, E. 2022, 56, 1771–1779.
- Maggos, T.; Bartzis, J.G.; Leva, P.; Kotzias, D. Applied Physics A 2007, 89, 81–84.
- Chu, B.; Liu, Y.; Li, H.; Jia, Y.; Liu, J.; Cao, Q.; Chen, T.; Zhang, P.; Ma, Q.; Zeng, X.C.; Francisco, J.S.; He, H. Angewandte Chemie International Edition 2023, 62, e202304017.
- Song, X.; Jin, X.; Yang, J.; Ruan, M.; Wang, Y.; Tao, J.; Hu, D.; Cheng, G.; Dai, W. Separation and Purification Technology 2025, 357, 130277.
- Lux, K.C.; Hot, J.; Collière, V.; Kahn, M.L.; Bertron, A.; Ringot, E.; Fau, P.; Fajerwerg, K. Journal of Environmental Chemical Engineering 2025, 13, 115110.
- Ansari, S.A.; Khan, M.M.; Ansari, M.O.; Cho, M.H. New Journal of Chemistry 2016, 40, 3000–3009.
- Natarajan, T.S.; Mozhiarasi, V.; Tayade, R.J. Photochem 2021, 1, 371–410.
- Quan, H.; Gao, Y.; Wang, W. Inorganic Chemistry Frontiers 2020, 7, 817–838.
- Wang, T.; Shen, D.; Xu, T.; Jiang, R. Science of The Total Environment 2017, 586, 347–354.
- Shi, J.; Huang, W.; Zhu, H.; Xiong, J.; Bei, H.; Wei, X.; Wang, S. Letters 2020, 279, 128472.
- Zhang, Q.; Chen, D.; Song, Q.; Zhou, C.; Li, D.; Tian, D.; Jiang, D. Surfaces and Interfaces 2021, 23, 100979.
- Chang, W.; Sun, C.; Pang, X.; Sheng, H.; Li, Y.; Ji, H.; Song, W.; Chen, C.; Ma, W.; Zhao, J. Angewandte Chemie International Edition 2015, 54, 2052–2056.
- Lalrindiki, F.; Singh, N.M. Journal of Industrial and Engineering Chemistry 2024. https://doi.org/10.1016/j.jiec.2024.11.023.
- Tang, W.; Chen, J.; Yin, Z.; Sheng, W.; Lin, F.; Xu, H.; Cao, S. Chinese Journal of Catalysis 2021, 42, 347–355.
- An, Y.; Cao, W.; Zhou, Y.; Chen, L.; Qi, Z. Applied Organometallic Chemistry 2017, 31, e3777.
- Lin, S.; Wang, M.; Liu, L.; Liang, Y.; Cui, W.; Zhang, Z.; Yun, N.; Materials 2016, 9, 882.
- Li, J.-H.; Ren, J.; Liu, Y.; Mu, H.-Y.; Liu, R.-H.; Zhao, J.; Chen, L.-J.; Li, F.-T. Inorganic Chemistry Frontiers 2020, 7, 2969–2978.
- Lai, M.T.L.; Yang, T.C.K.; Lai, C.W.; Chen, C.-Y.; Johan, M.R.; Lee, K.M.; Juan, J.C. Journal of Environmental Chemical Engineering 2023, 11, 111517.
- Dutta, V.; Sharma, S.; Raizada, P.; Kumar, R.; Thakur, V.K.; Nguyen, V.-H.; Asiri, A.M.; Khan, A.A.P.; Singh, P. Journal of Environmental Chemical Engineering 2020, 8, 104505.
- Chen, P.-R.; Hoang, M.-S.; Lai, K.-Y.; Chen, H.-S.; Nanomaterials 2022, 12, 573.
- Sun, Z.; Hou, Q.; Kong, J.; Wang, K.; Zhang, R.; Liu, F.; Ning, J.; Tang, J.; Du, Z. Inorganic Chemistry 2024, 63, 6396–6407.
- Yoo, D.; Bak, E.; Ju, H.M.; Shin, Y.M.; Choi, M.-J. Micromachines 2022, 13, 1775.
- Huang, H.; Li, X.; Wang, J.; Dong, F.; Chu, P.K.; Zhang, T.; Zhang, Y.; Catalysis, A.C. 2015, 5, 4094103.
- Hu, J.; Chen, D.; Li, N.; Xu, Q.; Li, H.; He, J.; Lu, J. ACS Sustainable Chemistry & Engineering 2018, 6, 2676–2683.
- Liu, Y.; Yu, S.; Zhao, Z.; Dong, F.; Dong, X.A.; Zhou, Y. The Journal of Physical Chemistry C 2017, 121, 12168–12177.
- Tessier, M.D.; Dupont, D.; De Nolf, K. J. De Roo and Z. Hens, Chemistry of Materials 2015, 27, 4893–4898.
- Hatami, F.; Masselink, W.T.; Schrottke, L.; Tomm, J.W.; Talalaev, V.; Kristukat, C.; Goñi, A.R. Physical Review B 2003, 67, 085306.
- Diederich, J.; Rojas, J.V.; Paszuk, A.; Pour, M.A.Z.; Höhn, C.; Alvarado, I.A.R.; Schwarzburg, K.; Ostheimer, D.; Eichberger, R.; Schmidt, W.G.; Hannappel, T.; van de Krol, R.; Friedrich, D. Advanced Functional Materials 2024, 34, 2409455.
- Li, P.; Sui, X.; Xu, J.; Jing, H.; Wu, C.; Peng, H.; Lu, J.; Yin, H. Chemical Engineering Journal 2014, 247, 25–32.
- Gonçalves, D.A.F.; Alvim, R.P.R.; Bicalho, H.A.; Peres, A.M.; Binatti, I.; Batista, P.F.R.; Teixeira, L.S.; Resende, R.R.; Lorençon, E. New Journal of Chemistry 2018, 42, 5720–5727.
- Li, P.; Wang, F.; Wei, S.; Li, X.; Zhou, Y. Physical Chemistry Chemical Physics 2017, 19, 4405–4410.
- Li, N.; Wang, C.; Zhang, K.; Lv, H.; Yuan, M.; Bahnemann, D.W. Chinese Journal of Catalysis 2022, 43, 2363–2387.
- Zhou, Y.; Zhao, Z.; Wang, F.; Cao, K.; Doronkin, D.E.; Dong, F.; Grunwaldt, J.-D. Journal of Hazardous Materials 2016, 307, 163–172.
- Alimard, P.; Gong, C.; Itskou, I.; Kafizas, A. Chemosphere 2024, 368, 143728.
- Dai, Y.; Liu, G.; Sun, X.; Ma, J.; Xian, T.; Yang, H. Applied Surface Science 2025, 681, 161611.
- Virieux, H.; Le Troedec, M.; Cros-Gagneux, A.; Ojo, W.-S.; Delpech, F.; Nayral, C.; Martinez, H.; Chaudret, B. Journal of the American Chemical Society 2012, 134, 19701–19708.
- Guzelian, A.A.; Katari, J.E.B.; Kadavanich, A.V.; Banin, U.; Hamad, K.; Juban, E.; Alivisatos, A.P.; Wolters, R.H.; Arnold, C.C.; Heath, J.R. The Journal of Physical Chemistry 1996, 100, 7212–7219.
- Grigioni, I.; Sagar, L.K.; Li, Y.C.; Lee, G.; Yan, Y.; Bertens, K.; Miao, R.K.; Wang, X.; Abed, J.; Won, D.H.; de Arquer, F.P.G.; Ip, A.H.; Sinton, D.; Sargent, E.H. ACS Energy Letters 2021, 6, 79–84.
- Zhao, Z.; Zhou, Y.; Wang, F.; Zhang, K.; Yu, S.; Cao, K. ACS Applied Materials & Interfaces 2015, 7, 730–737.
- Zhang, W.; Sun, Y.; Dong, F.; Zhang, W.; Duan, S.; Zhang, Q. Dalton Transactions 2014, 43, 12026–12036.
- Zhang, Q.; Wang, H.; Hu, S.; Lu, G.; Bai, J.; Kang, X.; Liu, D.; Gui, J. RSC Advances 2015, 5, 42736–42743.
- Kang, Y.; Yang, Y.; Yin, L.-C.; Kang, X.; Liu, G.; Cheng, H.-M. Advanced Materials 2015, 27, 4572–4577.
- Zhang, Y.; Gao, J.; Chen, Z. Journal of Colloid and Interface Science 2019, 535, 331–340.
Figure 1.
(a) NO oxidation diagram and (b)NO2 generation diagram of composite materials under visible light.
Figure 1.
(a) NO oxidation diagram and (b)NO2 generation diagram of composite materials under visible light.
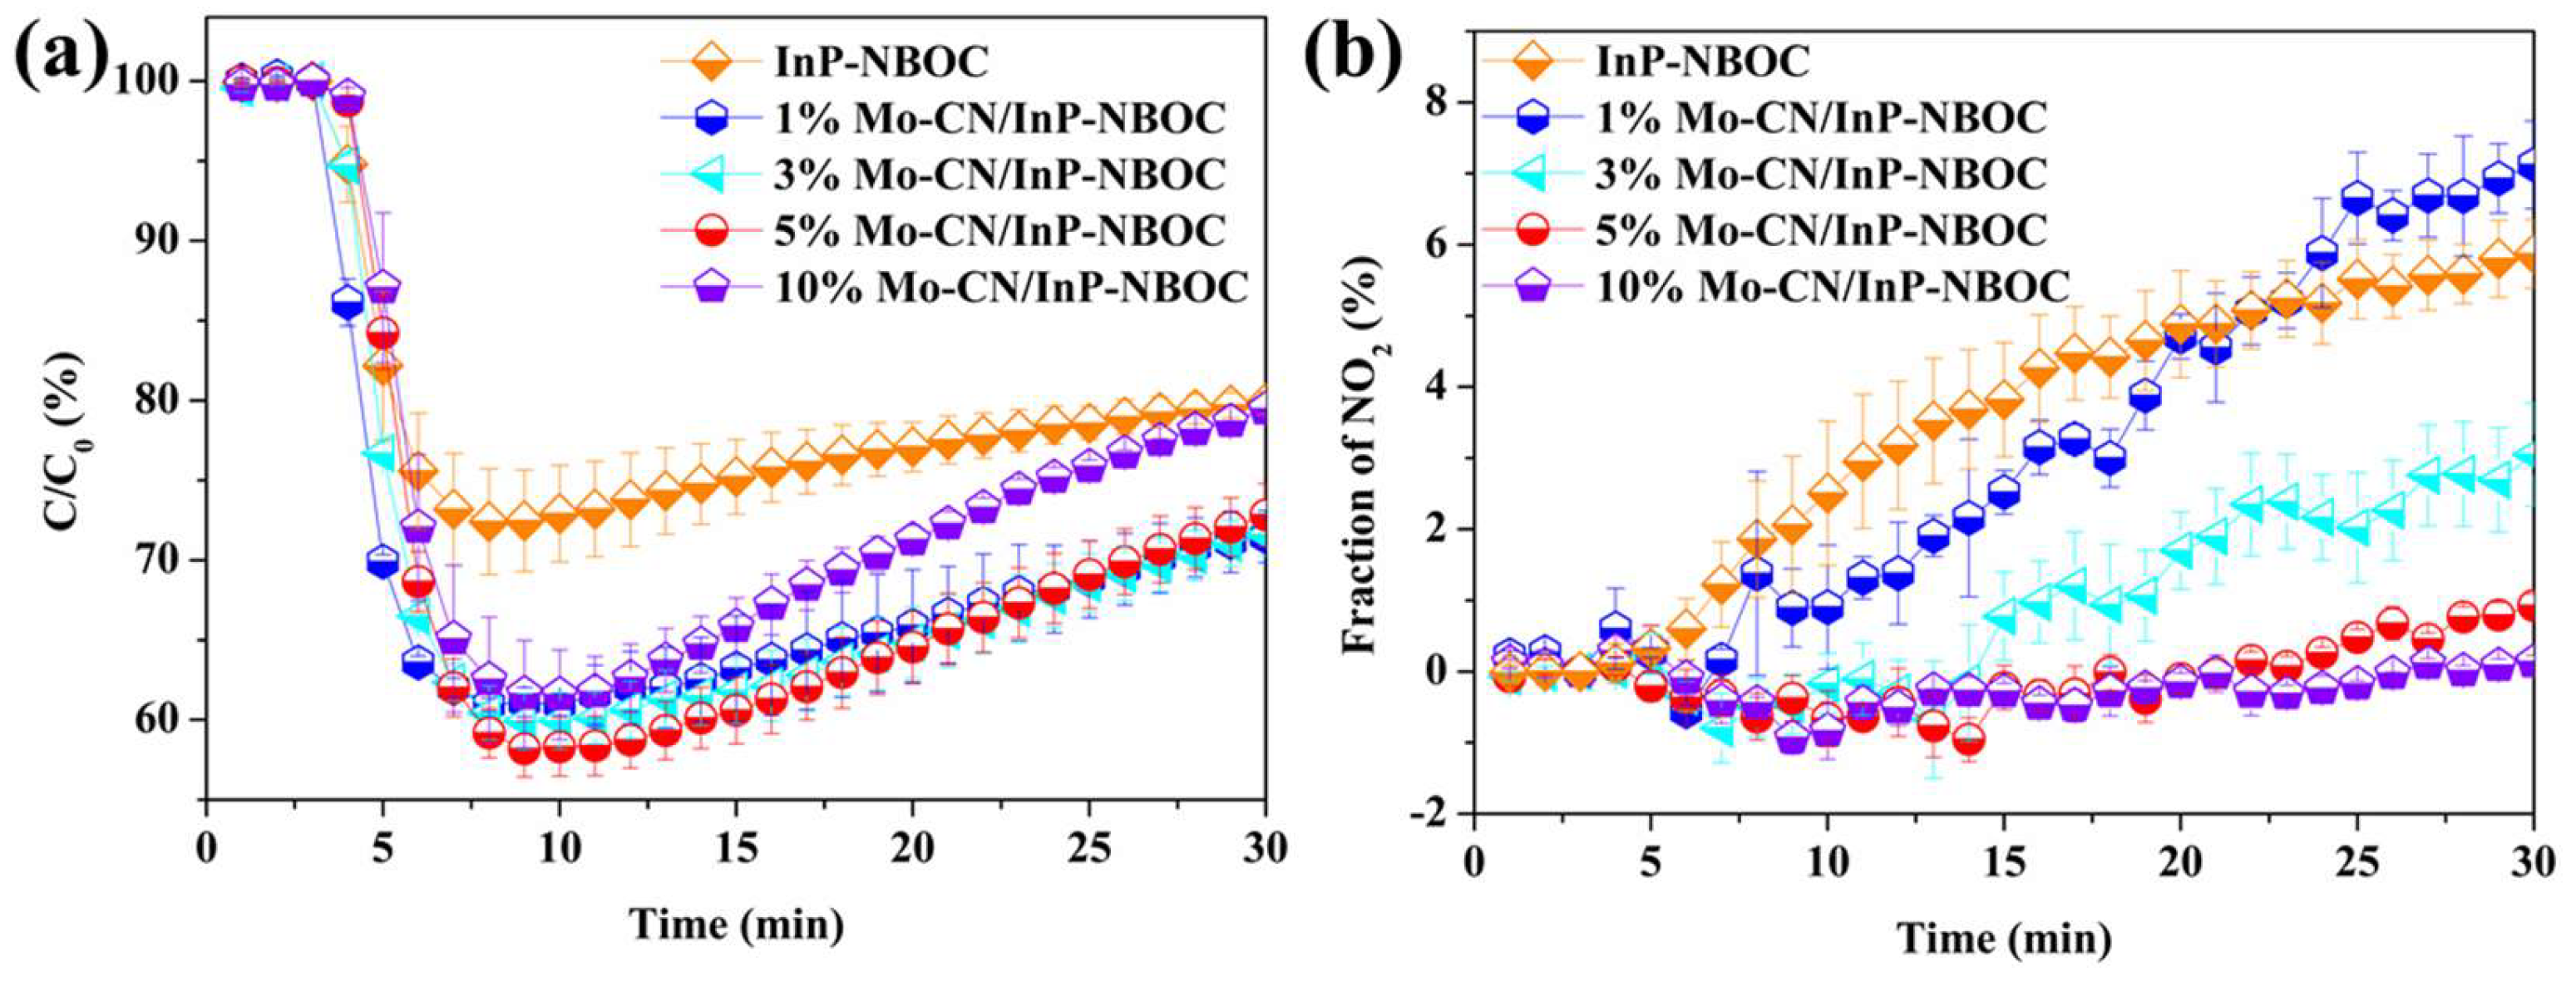
Figure 2.
NO oxidation diagram of each reference sample (a) under visible light; (b)NO2 generation diagram.
Figure 2.
NO oxidation diagram of each reference sample (a) under visible light; (b)NO2 generation diagram.
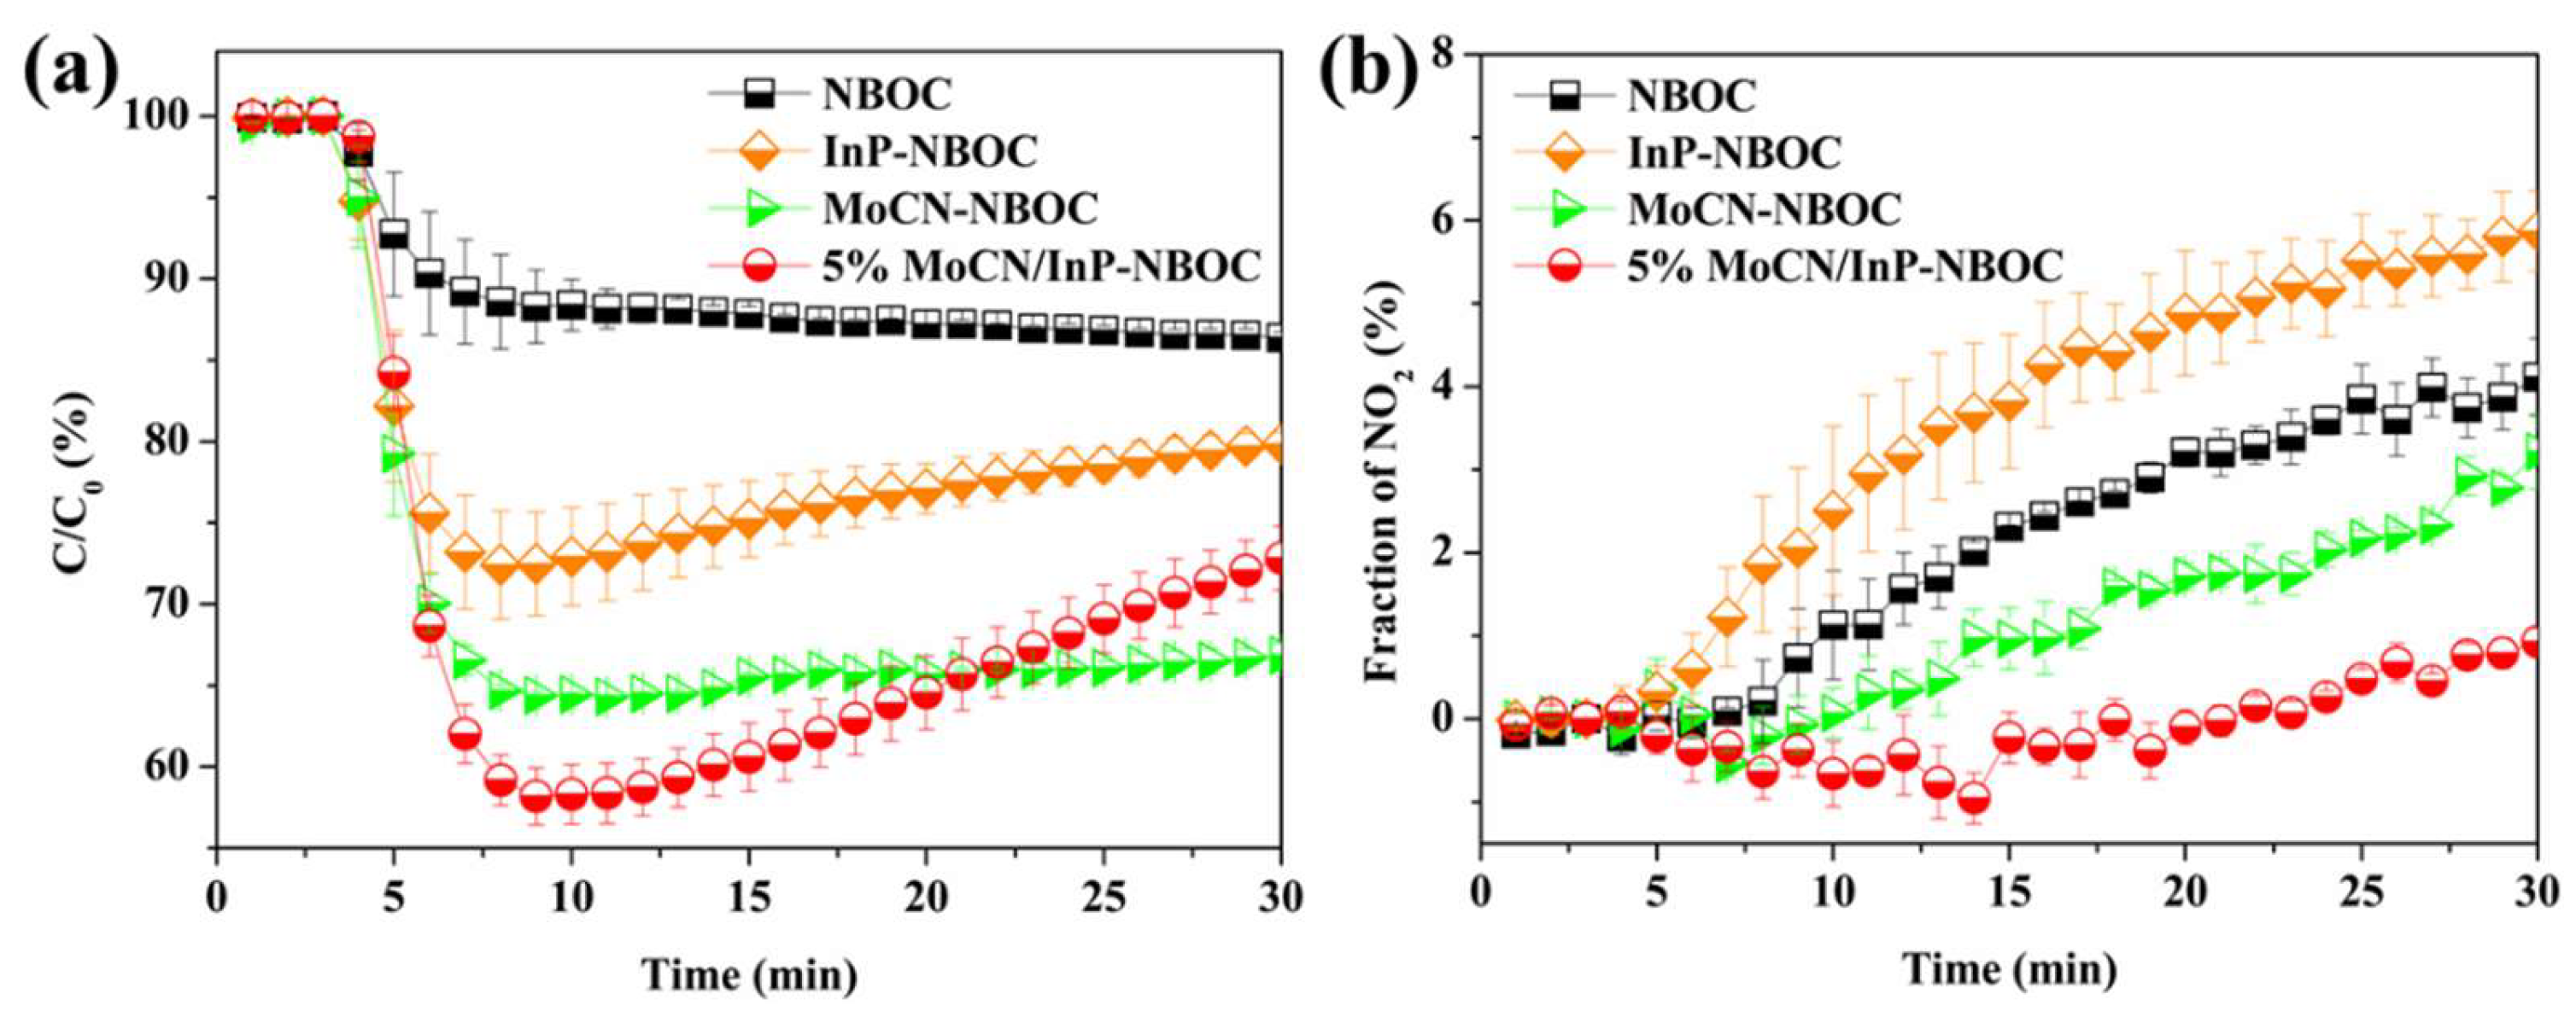
Figure 3.
XRD patterns of each sample.
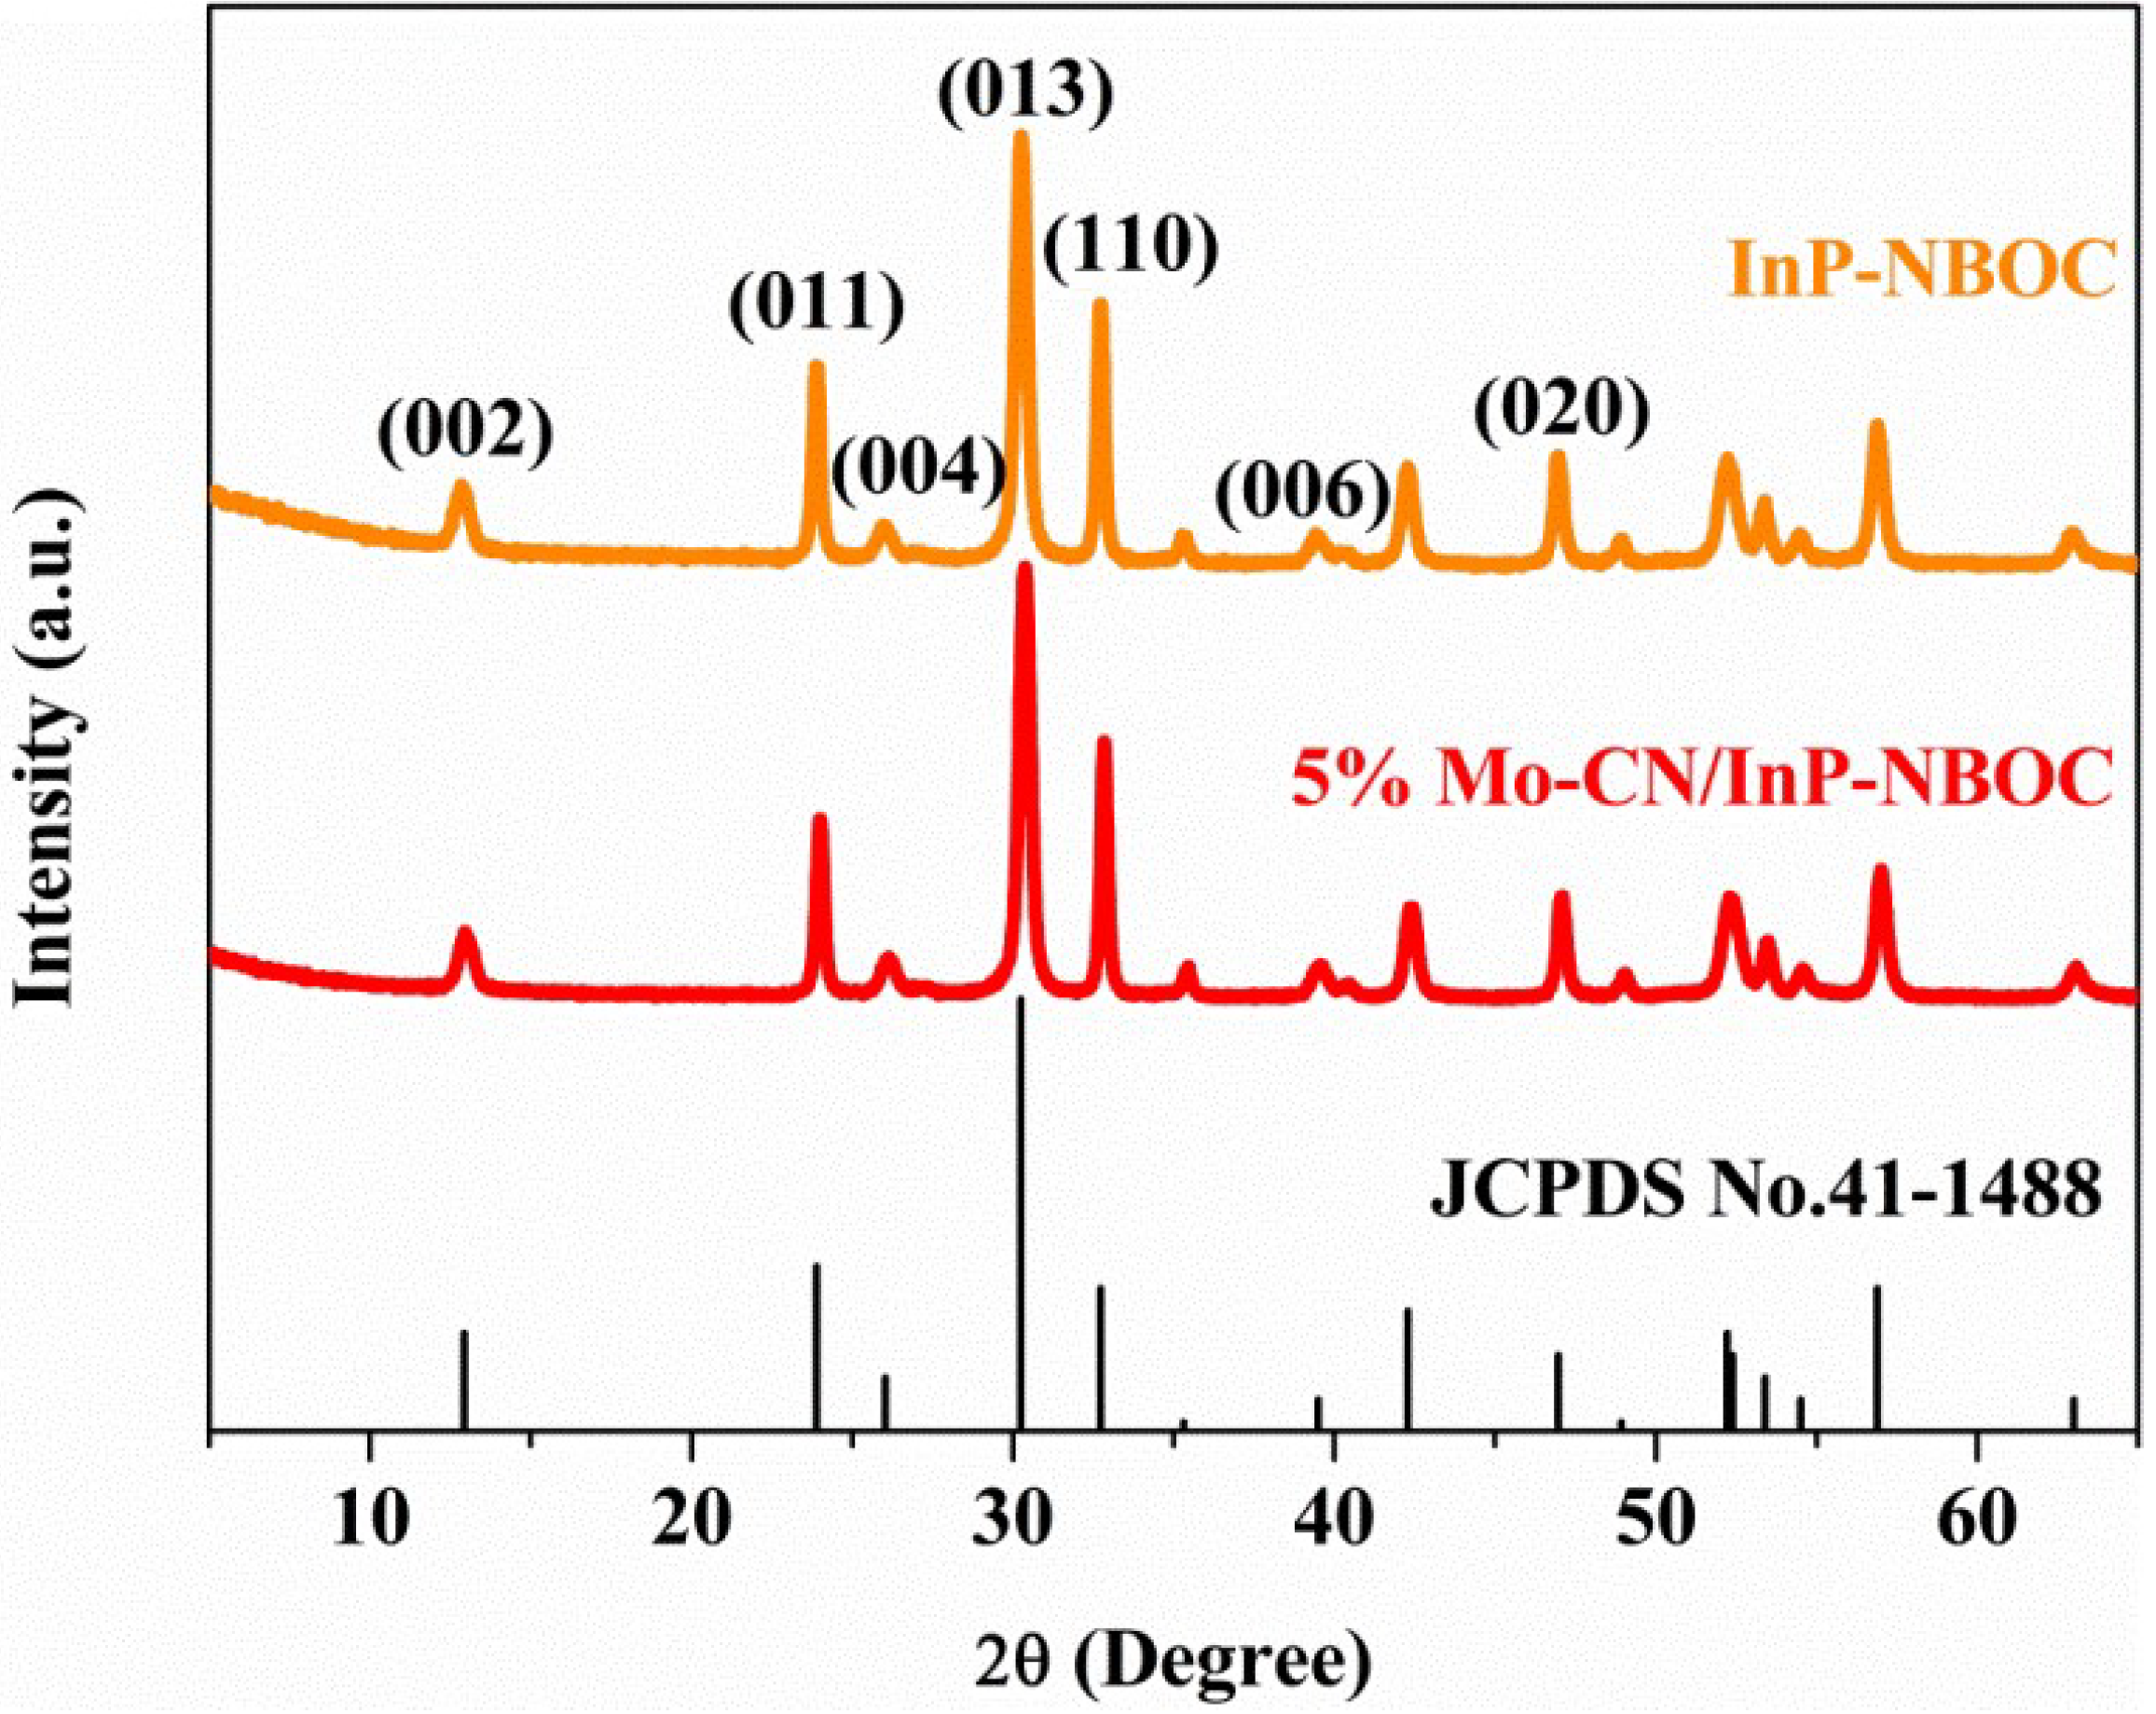
Figure 4.
(a) UV-Vis absorption spectrum of each sample; (b) PL spectrum.
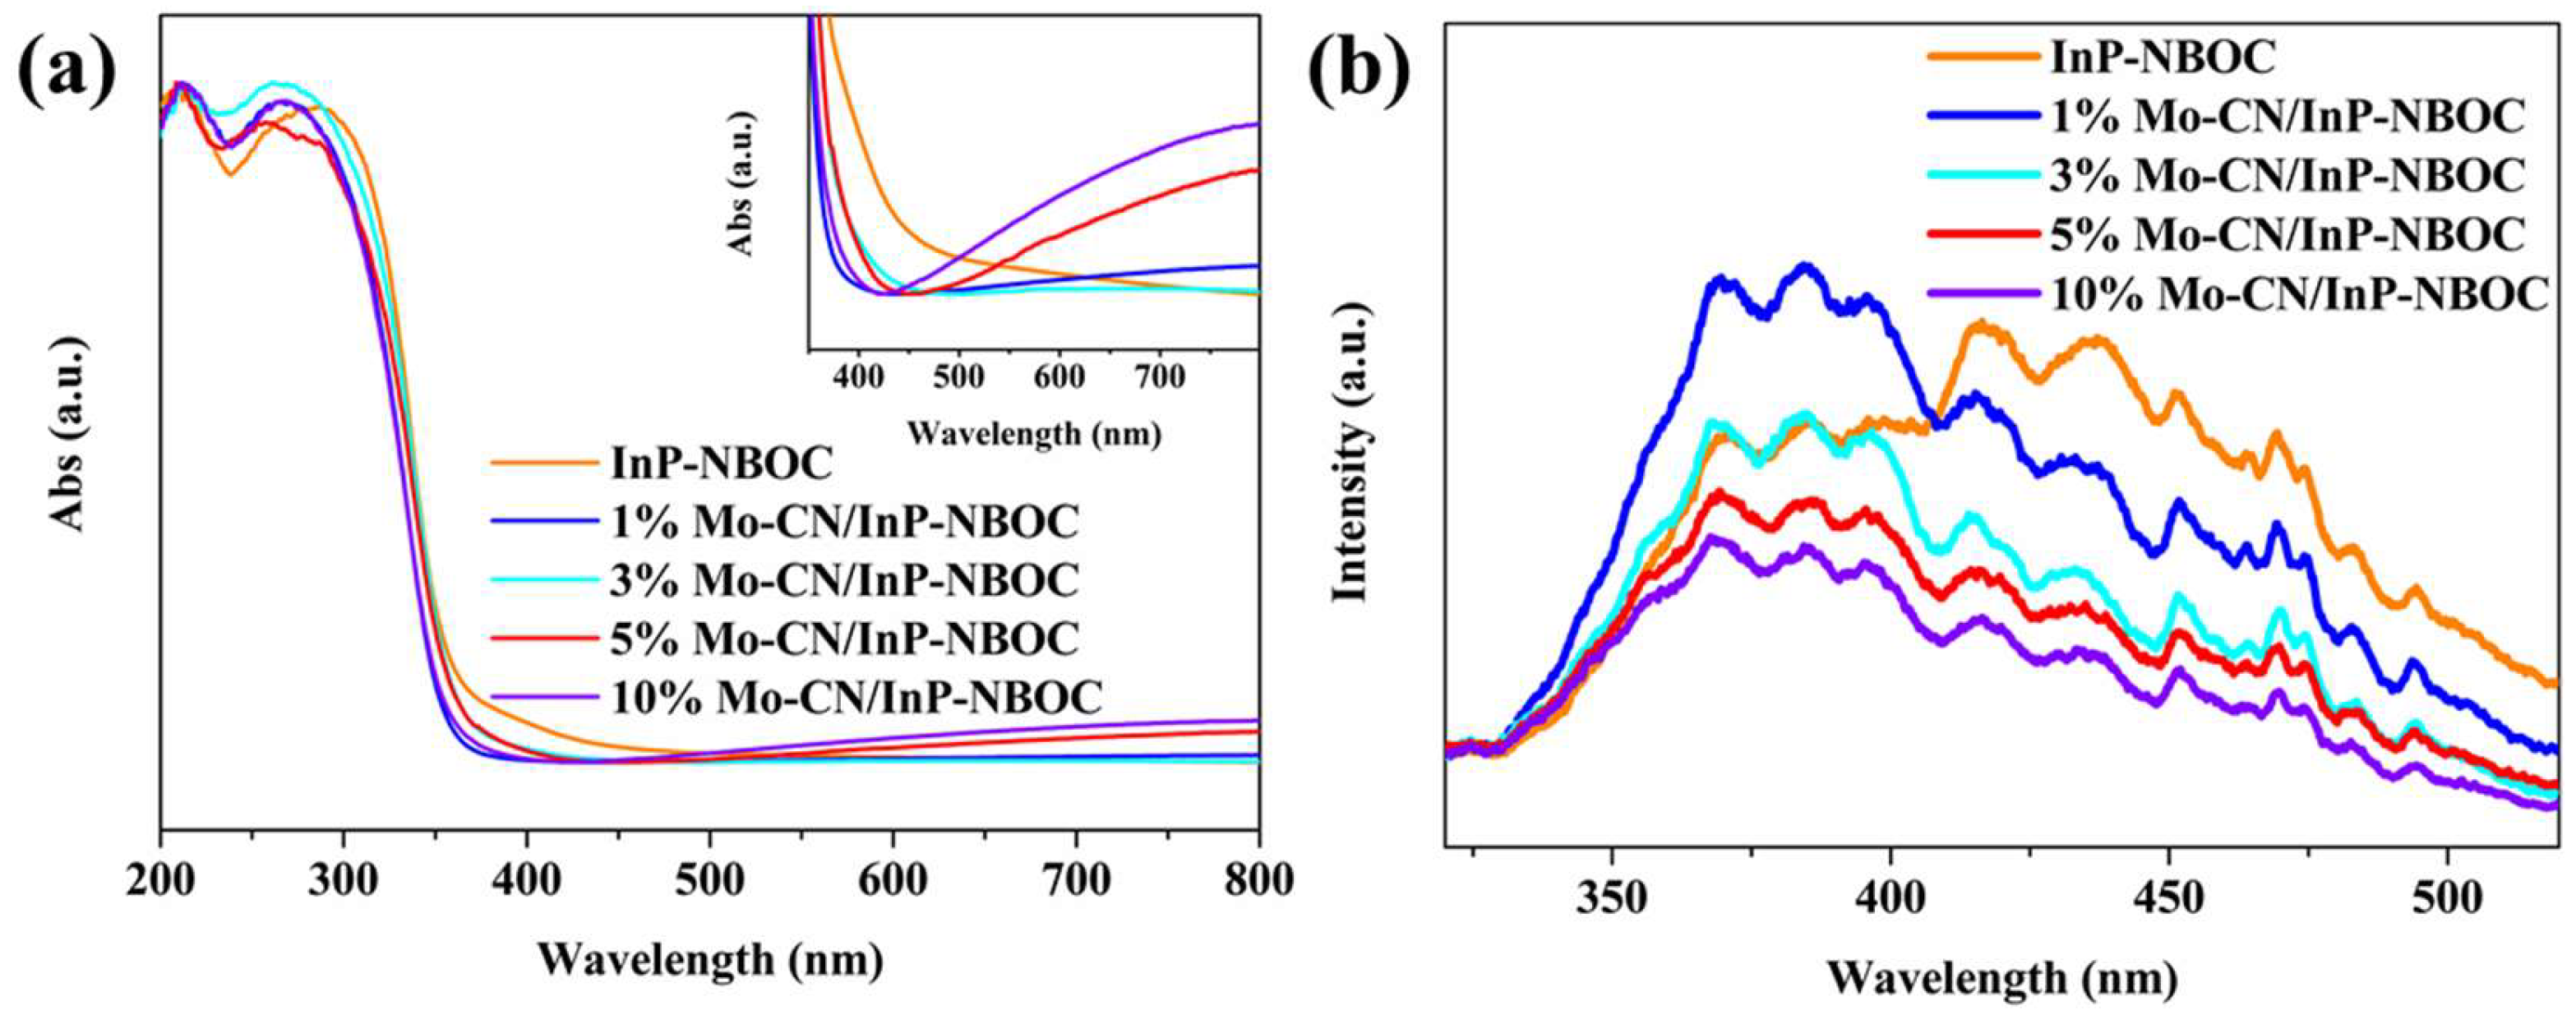
Figure 5.
5% Mo-CN/InP-NBOC's (a) TEM, (b, c, d) HRTEM and (e)X-ray energy scattering.
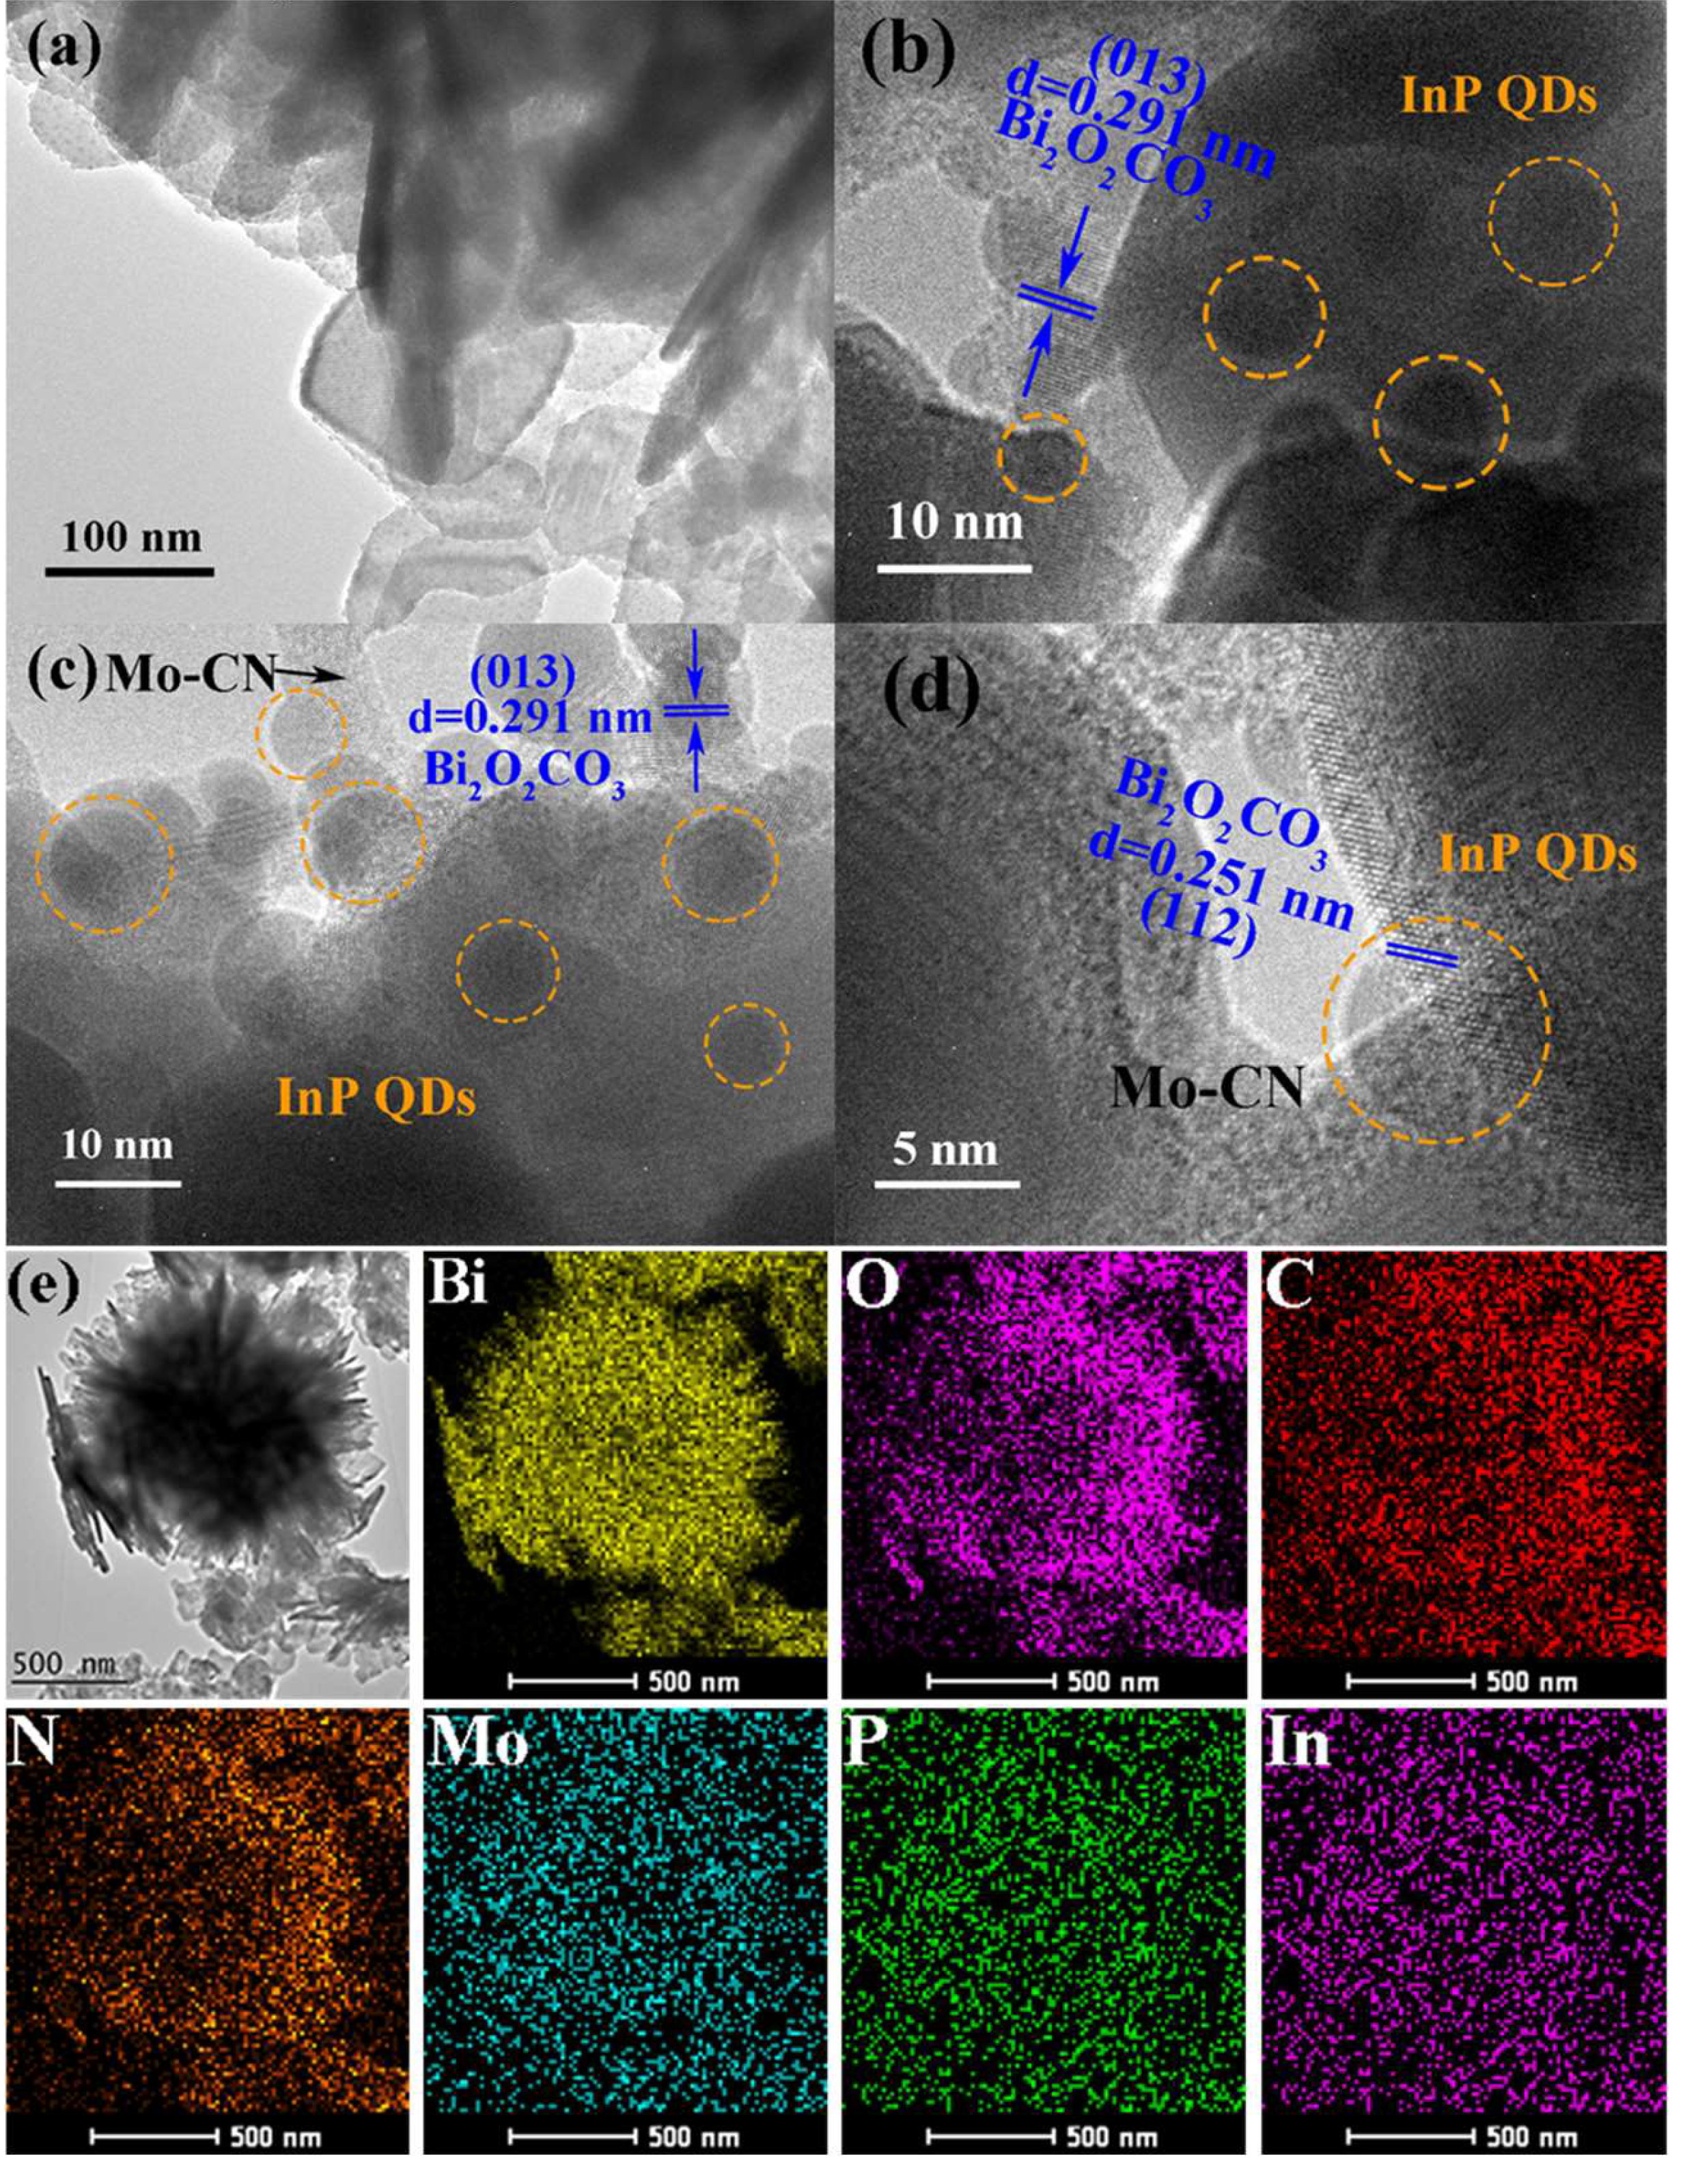
Figure 6.
X-ray photoelectron spectra of (a) Bi 4f, (b) O 1s, (c) P 2p, (d) In 3d, (e) C 1s and (f) N 1s of each sample.
Figure 6.
X-ray photoelectron spectra of (a) Bi 4f, (b) O 1s, (c) P 2p, (d) In 3d, (e) C 1s and (f) N 1s of each sample.
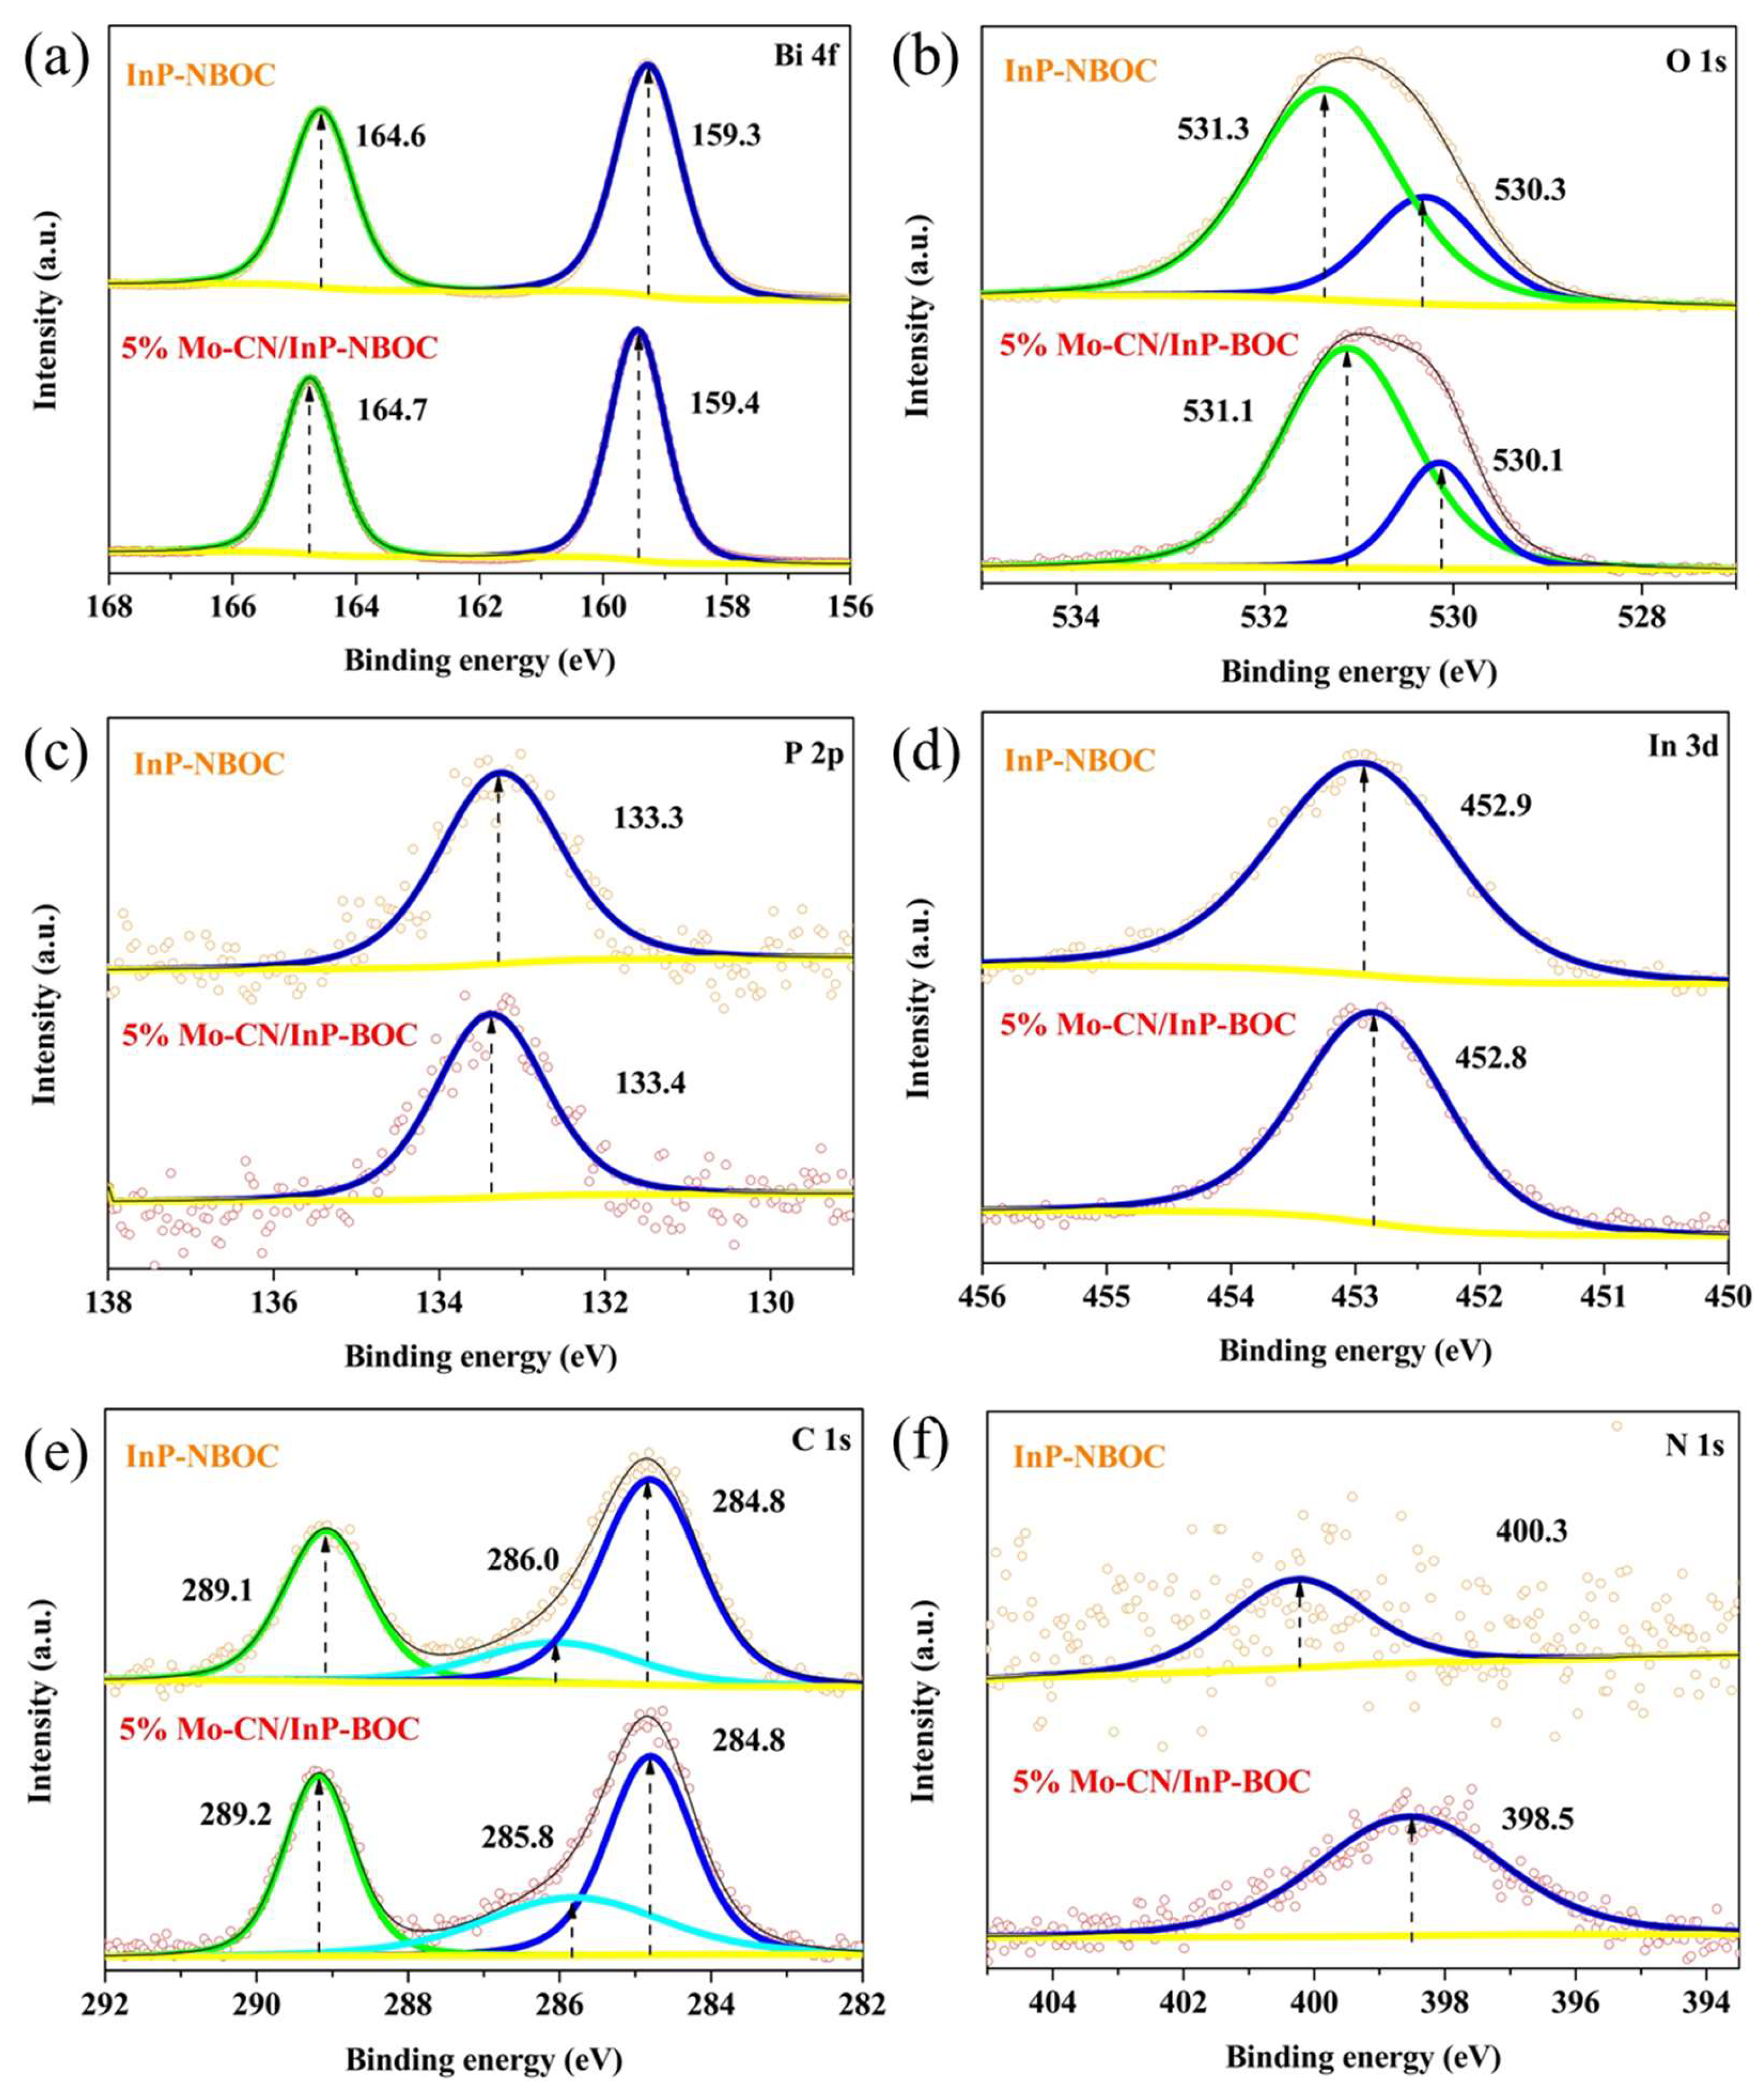
Figure 7.
Figure 7. Electron paramagnetic resonance spectra of 5% Mo-CN/InP-NBOC (a) capturing OH and (b) capturing •O2- under visible light irradiation (λ > 430 nm).
Figure 7.
Figure 7. Electron paramagnetic resonance spectra of 5% Mo-CN/InP-NBOC (a) capturing OH and (b) capturing •O2- under visible light irradiation (λ > 430 nm).
Disclaimer/Publisher’s Note: The statements, opinions and data contained in all publications are solely those of the individual author(s) and contributor(s) and not of MDPI and/or the editor(s). MDPI and/or the editor(s) disclaim responsibility for any injury to people or property resulting from any ideas, methods, instructions or products referred to in the content. |
© 2025 by the authors. Licensee MDPI, Basel, Switzerland. This article is an open access article distributed under the terms and conditions of the Creative Commons Attribution (CC BY) license (http://creativecommons.org/licenses/by/4.0/).
Copyright: This open access article is published under a Creative Commons CC BY 4.0 license, which permit the free download, distribution, and reuse, provided that the author and preprint are cited in any reuse.


